User login
Food Insecurity Among Veterans: Resources to Screen and Intervene
Nearly 1 in 8 households—and 1 in 6 households with children—experienced food insecurity in 2017, defined as limited or uncertain availability of nutritionally adequate and safe foods.1 Food insecurity is often even more pronounced among households with individuals with acute or chronic medical conditions.2-6 Moreover, food insecurity is independently associated with a range of adverse health outcomes, including poorer control of diabetes mellitus, hypertension, depression and other major psychiatric disorders, HIV, and chronic lung and kidney disease, as well as poorer overall health status.7-14 Food insecurity also has been associated with increased health care costs and acute care utilization as well as increased probability of delayed or missed care.15-19
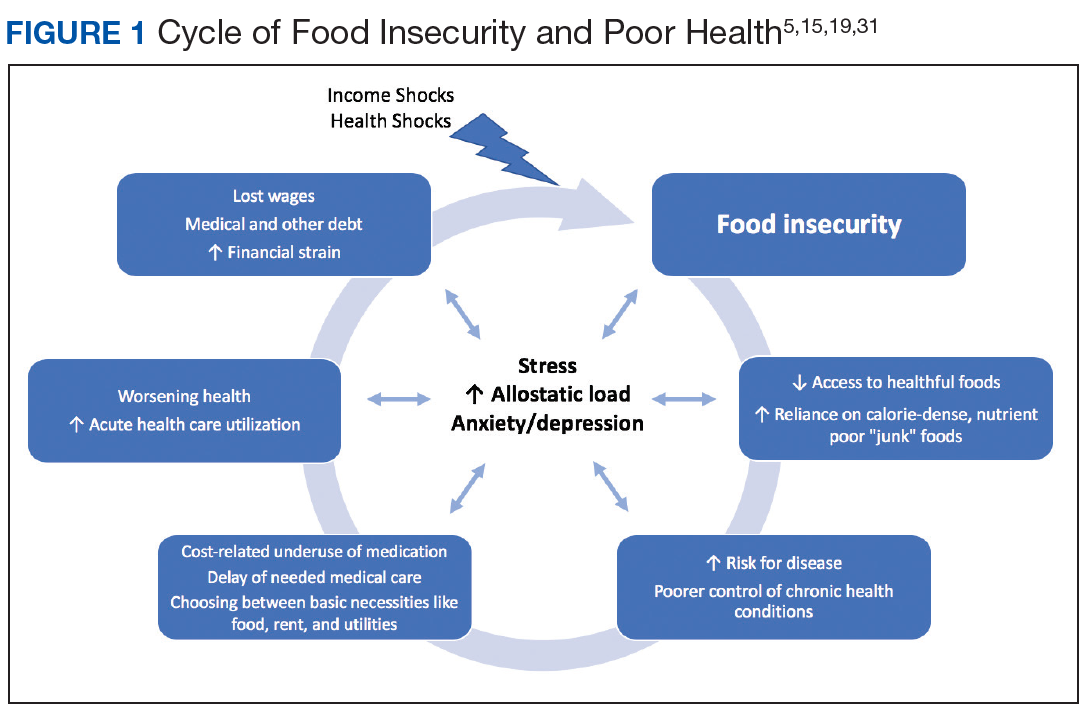
The relationship between food insecurity and poor health outcomes is a complex and often cyclic phenomenon (Figure 1). Poor nutritional status is fueled by limited access to healthful foods as well as increased reliance on calorie-dense and nutrient-poor “junk” foods, which are less expensive and often more readily available in low-income neighborhoods.5,20-24 These compensatory dietary patterns place individuals at higher risk for developing cardiometabolic conditions and for poor control of these conditions.5,8,9,12,25,26 Additionally, the physiological and psychological stressors of food insecurity may precipitate depression and anxiety or worsen existing mental health conditions, resulting in feelings of overwhelm and decreased self-management capacity.5,8,27-31 Food insecurity has further been associated with poor sleep, declines in cognitive function, and increased falls, particularly among the frail and elderly.32-34
Individuals experiencing food insecurity often report having to make trade-offs between food and other necessities, such as paying rent or utilities. Additional strategies to stretch limited resources include cost-related underuse of medication and delays in needed medical care.4,17,31,35 In a nationally representative survey among adults with at least 1 chronic medical condition, 1 in 3 reported having to choose between food and medicine; 11% were unable to afford either.3 Furthermore, the inability to reliably adhere to medication regimens that need to be taken with food can result in potentially life-threatening hypoglycemia (as can lack of food regardless of medication use).5,26,36 In addition to the more obvious risks of glucose-lowering medications, such as insulin and long-acting sulfonylureas in patients experiencing food insecurity, many drugs commonly used among nondiabetic adults such as ACE-inhibitors, β blockers, quinolones, and salicylates can also precipitate hypoglycemia, and food insecurity has been associated with experiences of hypoglycemia even among individuals without diabetes mellitus.32,37 In one study the risk for hospital admissions for hypoglycemia among low-income populations increased by 27% at the end of the month when food budgets were more likely to be exhausted.38 Worsening health status and increased emergency department visits and hospitalizations may then result in lost wages and mounting medical bills, contributing to further financial strain and worsening food insecurity.
Prevalence and Importance of Food Insecurity Among US Veterans
Nearly 1.5 million veterans in the US are living below the federal poverty level (FPL).39 An additional 2.4 million veterans are living paycheck to paycheck at < 200% of the FPL.40 Veterans living in poverty are at even higher risk than nonveterans for food insecurity, homelessness, and other material hardship.41
Estimates of food insecurity among veterans vary widely, ranging from 6% to 24%—nearly twice that of the general US population.8,42-45 Higher rates of food insecurity have been reported among certain high-risk subgroups, including veterans who served in Iraq and Afghanistan (27%), female veterans (28%), homeless and formerly homeless veterans (49%), and veterans with serious mental illness (35%).6,32,43,46 Additional risk factors for food insecurity specific to veteran populations include younger age, having recently left active-duty military service, and lower final military paygrade.42,45-47 As in the general population, veteran food insecurity is associated with a range of adverse health outcomes, including poorer overall health status as well as increased probability of delayed or missed care.6,8,32,42-44,46
Even among veterans enrolled in federal food assistance programs, many still struggle to afford nutritionally adequate foods. As one example, in a study of mostly male homeless and formerly homeless veterans, O’Toole and colleagues found that nearly half of those reporting food insecurity were already receiving federal food assistance benefits, and 22% relied on emergency food resources.32 Of households served by Feeding America food pantries and meal programs, 20% have a member who has served in the US military.48
Federal Programs To Address Food Insecurity
There are several important federal food assistance programs designed to help alleviate food insecurity. The Supplemental Nutrition Assistance Program (SNAP, formerly the Food Stamp program) is the largest federal food assistance program and provides low-income Americans with cash benefits to purchase food. SNAP has been shown to substantially reduce food insecurity.7,49 The program also is associated with significant decreases in cost-related medication nonadherence as well as reductions in health care costs and both acute care and nursing home utilization.16,50-54 Although nearly 1.4 million veterans live in SNAP-enrolled households, 59% of eligible veterans are not enrolled.43,55 Closing this SNAP eligibility-enrollment gap, has been a focus of recent efforts to improve long-term food security among veterans. There also are several federal food assistance programs for households with children, including the Special Supplemental Nutrition Program for Women, Infants, and Children (WIC) and school meals programs. Among federal nutrition programs for seniors, the Older American’s Act contains designated funding to support nutrition services for older adults, including congregate meal programs in community settings like senior centers, places of worship, and housing communities, and home-delivered meals through programs like Meals on Wheels.56
VHA Response to Food Insecurity
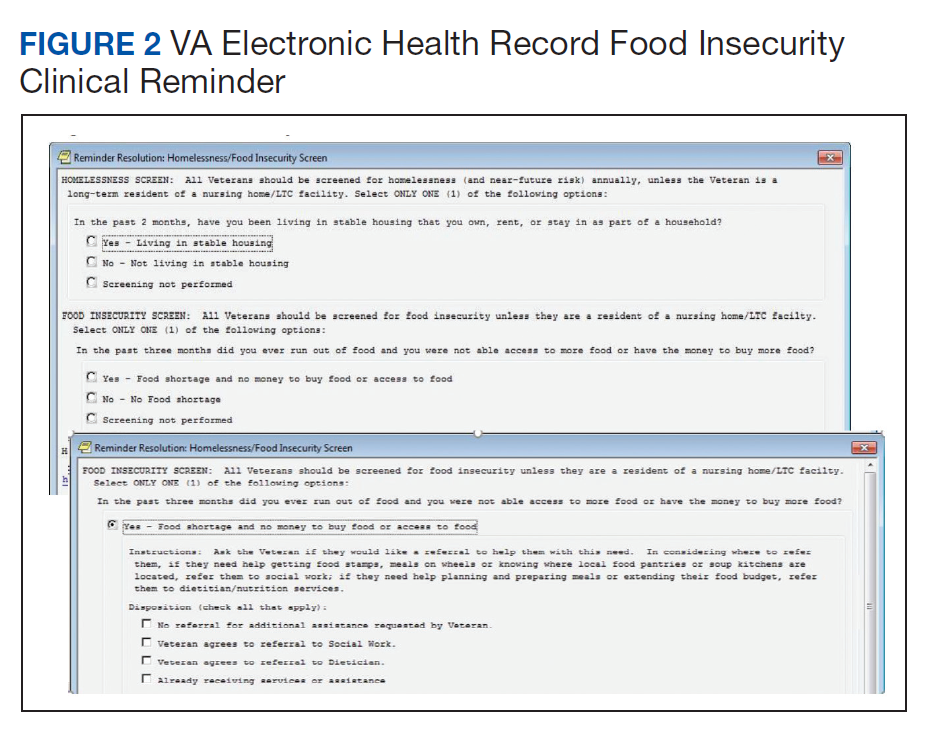
The Veterans Health Administration (VHA) is the country’s largest integrated, federally funded health care system.57 In November 2015, congressional briefings on veteran food insecurity organized by the national non-profit organization MAZON: A Jewish Response to Hunger and hosted with bipartisan support were provided to the US House and Senate. As a result of these briefings, VHA chartered the national Ensuring Veteran Food Security Workgroup with a mandate to partner with governmental and nonprofit agencies to “focus on the issue of food insecurity, the identification of veterans at risk, the needed training of VHA staff and the coordination of resources and initiatives to support the veterans for whom we care.” Building off a pilot in US Department of Veterans Affairs (VA) Homeless Patient Aligned Care Teams (H-PACTs),32 VHA subsequently integrated a single-item food insecurity screening tool into the VA electronic health record (EHR) clinical reminder system (Figure 2). The clinical reminder, which was rolled out across VA medical centers nationally in October 2017, provides an alert to screen all noninstitutionalized veterans for food insecurity. To date, nearly 5 million veterans have been screened. When a veteran endorses food insecurity based on the initial screening question, a prompt appears to offer the veteran a referral to a social worker and/or dietitian. Positive screening results also should be communicated to the patient’s primary care provider. Depending on site-specific clinical flow, the reminders are typically completed in the outpatient setting either by nurses or medical assistants during intake or by providers as part of the clinical visit. However, any member of the health care team can complete the clinical reminder at any time. As of September 2019, approximately 74,000 veterans have been identified as food insecure.58
Addressing Food Insecurity
VHA has been a recognized leader in addressing homelessness and other social determinants of health through its integrated care and PACT delivery models.59-61 The food insecurity clinical reminder was designed to facilitate a tailored, interdisciplinary approach to identify and address food insecurity. Interdisciplinary care team members—including medical assistants, clinicians, social workers, registered dietitians, nurse care managers, occupational or physical therapists, and pharmacists—are uniquely positioned to identify veterans impacted by food insecurity, assess for associated clinical and/or social risk factors, and offer appropriate medical and nutrition interventions and resource referrals.
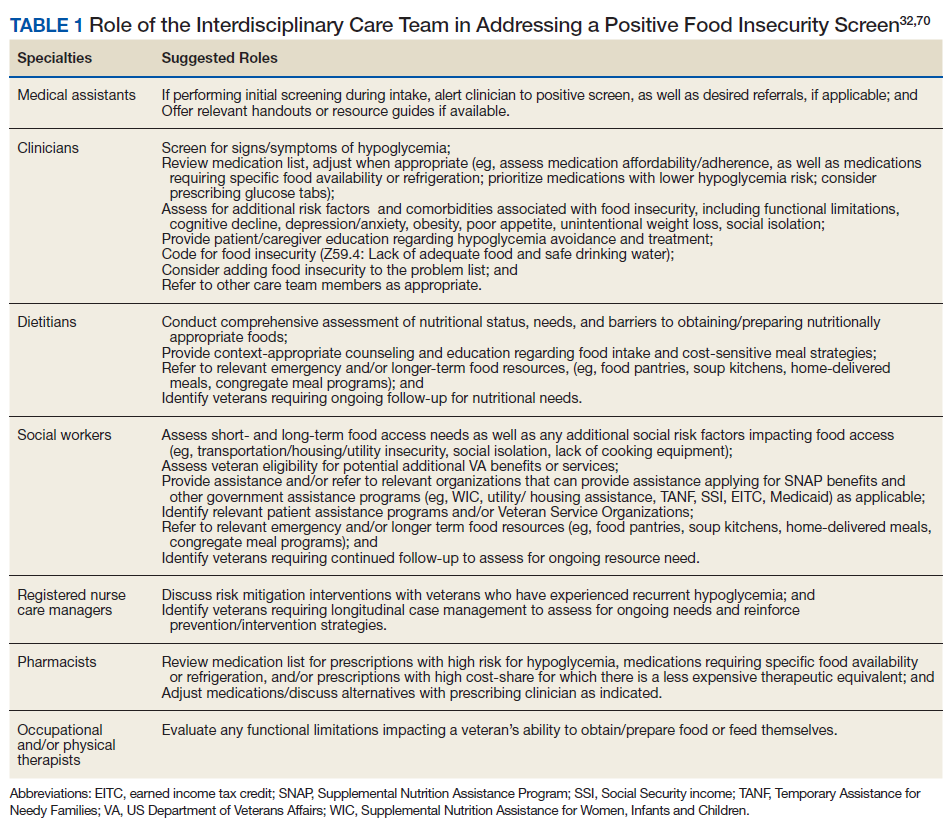
This interdisciplinary team-based model is essential given the range of potential drivers underlying veteran experiences of food insecurity and subsequent health outcomes. It is critically important for clinicians to review the medication list with veterans screening positive for food insecurity to assess for risk of hypoglycemia and/or cost-related nonadherence, make any necessary adjustments to therapeutic regimens, and assess for additional risk factors associated with food insecurity. Examples of tailored nutrition counseling that clinical dietitians may provide include meal preparation strategies for veterans who only have access to a microwave or hotplate, or recommendations for how veterans on medically restricted diets can best navigate food selection at soup kitchens or food pantries. Resource referrals provided by social workers or other care team members may include both emergency food resources to address immediate shortages (eg, food pantries, soup kitchens, or vouchers for free lunch) as well as resources focused on improving longer term food security (eg, federal food assistance programs or home delivered meal programs). Importantly, although providing a list of food resources may be helpful for some patients, such lists are often insufficient.62,63 Many patients require active assistance with program enrollment either onsite the day of their clinic visit or through connection with a partnering community-based organization that can, in turn, identify appropriate resources and facilitate program enrollment.63,64 Planned follow-up is also crucial to determine whether referrals are successful and to assess for ongoing need. Proposed roles for interdisciplinary care team members in addressing a positive food insecurity screen are outlined in Table 1.
VHA-Community Partnerships
In addition to services offered within VA, public and private sector partnerships can greatly enhance the range of resources available to food insecure veterans. Several VA facilities have developed formal community partnerships, such as the Veterans Pantry Pilot (VPP) program, a national partnership between Feeding America food banks and VA medical centers to establish onsite or mobile food pantries. There are currently 17 active Feeding America VPP sites, with a number of additional sites under development. Several of the VPP sites also include other “wraparound services,” such as SNAP application assistance.65,66
State Veterans Affairs offices67 and Veterans Service Organizations (VSOs)68 also can serve as valuable partners for connecting veterans with needed resources. VSOs offer a range of services, including assistancewith benefit claims, employment and housing assistance, emergency food assistance, and transportation to medical appointments. Some VSOs also have established local affiliations with Meals on Wheels focused on veteran outreach and providing hot meals for low-income, homebound, and disabled veterans.
Additional Resources
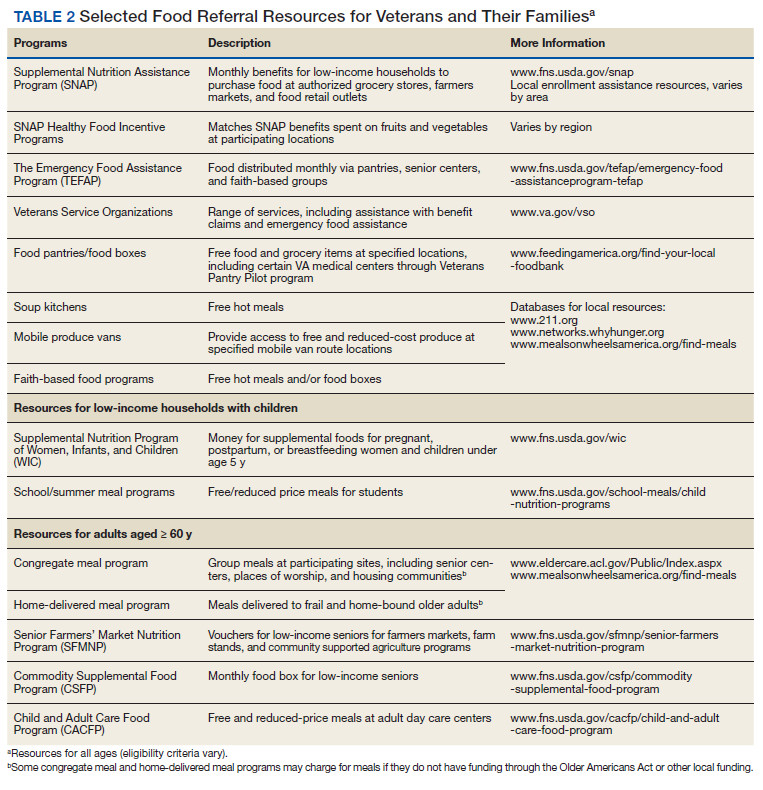
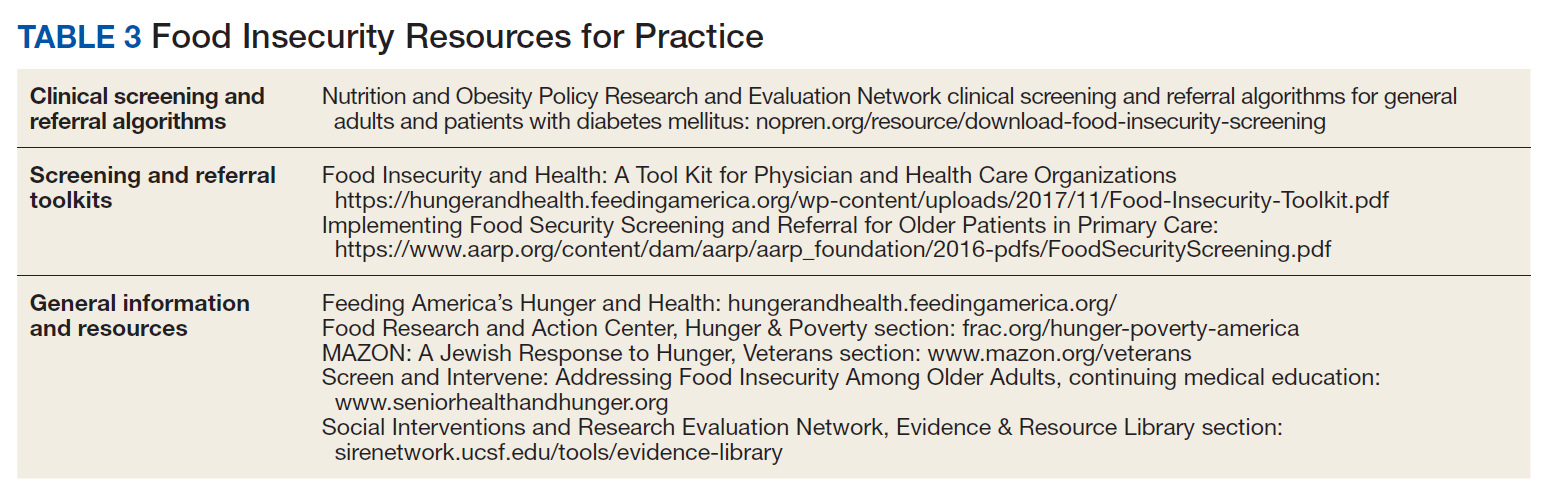
Although resources vary by regional setting, several key governmental and community-based food assistance programs are summarized in Table 2. Local community partners and online/phone-based directories, such as United Way’s 2-1-1 can help identify additional local resources. For older adults and individuals with disabilities, local Aging and Disability Resources Centers can provide information and assistance connecting to needed resources.69 Finally, there are a number of online resources available for clinicians interested in learning more about the impact of food insecurity on health and tools to use in the clinical setting (Table 3).
Conclusion
The VA has recognized food insecurity as a critical concern for the well-being of our nation’s veterans. Use of the EHR clinical reminder represents a crucial first step toward increasing provider awareness about veteran food insecurity and improving clinical efforts to address food insecurity once identified. Through the reminder, health care teams can connect veterans to needed resources and create both the individual and population-level data necessary to inform VHA and community efforts to address veteran food insecurity. Clinical reminder data are currently being used for local quality improvement efforts and have established the need nationally for formalized partnerships between VHA Social Work Services and Nutrition and Food Services to connect veterans with food and provide them with strategies to best use available food resources.
Moving forward, the Ensuring Veteran Food Security Workgroup continues to work with agencies and organizations across the country to improve food insecure veterans’ access to needed services. In addition to existing VA partnerships with Feeding America for the VPP, memorandums of understanding are currently underway to formalize partnerships with both the Food Research and Action Center (FRAC) and MAZON. Additional research is needed both to formally validate the current food insecurity clinical reminder screening question and to identify best practices and potential models for how to most effectively use VHA-community partnerships to address the unique needs of the veteran population.
Ensuring the food security of our nation’s veterans is essential to VA’s commitment to providing integrated, veteran-centered, whole person care. Toward that goal, VA health care teams are urged to use the clinical reminder and help connect food insecure veterans with relevant resources both within and outside of the VA health care system.
1. Coleman-Jensen A, Rabbitt MP, Gregory CA, Singh A. Household food security in the United States in 2017. http://www.ers.usda.gov/publications/pub-details/?pubid=90022. Published September 2018. Accessed December 9, 2019.
2. Berkowitz SA, Meigs JB, DeWalt D, et al. Material need insecurities, control of diabetes mellitus, and use of health care resources: results of the Measuring Economic Insecurity in Diabetes study. JAMA Intern Med. 2015;175(2):257-265.
3. Berkowitz SA, Seligman HK, Choudhry NK. Treat or eat: food insecurity, cost-related medication underuse, and unmet needs. Am J Med. 2014;127(4):303-310.e3.
4. Lyles CR, Seligman HK, Parker MM, et al. Financial strain and medication adherence among diabetes patients in an integrated health care delivery system: The Diabetes Study of Northern California (DISTANCE). Health Serv Res. 2016;51(2):610-624.
5. Seligman HK, Schillinger D. Hunger and socioeconomic disparities in chronic disease. N Engl J Med. 2010;363(1):6-9.
6. Narain K, Bean-Mayberry B, Washington DL, Canelo IA, Darling JE, Yano EM. Access to care and health outcomes among women veterans using veterans administration health care: association with food insufficiency. Womens Health Issues. 2018;28(3):267-272.
7. Gundersen C, Ziliak JP. Food insecurity and health outcomes. Health Aff. 2015;34(11):1830-1839.
8. Wang EA, McGinnis KA, Goulet J, et al; Veterans Aging Cohort Study Project Team. Food insecurity and health: data from the Veterans Aging Cohort Study. Public Health Rep. 2015;130(3):261-268.
9. Berkowitz SA, Berkowitz TSZ, Meigs JB, Wexler DJ. Trends in food insecurity for adults with cardiometabolic disease in the United States: 2005-2012. PloS One. 2017;12(6):e0179172.
10. Seligman HK, Laraia BA, Kushel MB. Food insecurity is associated with chronic disease among low-income NHANES participants. J Nutr. 2010;140(2):304-310.
11. Berkowitz SA, Baggett TP, Wexler DJ, Huskey KW, Wee CC. Food insecurity and metabolic control among U.S. adults with diabetes. Diabetes Care. 2013;36(10):3093-3099.
12. Seligman HK, Jacobs EA, López A, Tschann J, Fernandez A. Food insecurity and glycemic control among low-income patients with type 2 diabetes. Diabetes Care. 2012;35(2):233-238.
13. Banerjee T, Crews DC, Wesson DE, et al; CDC CKD Surveillance Team. Food insecurity, CKD, and subsequent ESRD in US adults. Am J Kidney Dis. 2017;70(1):38-47.
14. Bruening M, Dinour LM, Chavez JBR. Food insecurity and emotional health in the USA: a systematic narrative review of longitudinal research. Public Health Nutr. 2017;20(17):3200-3208.
15. Berkowitz SA, Basu S, Meigs JB, Seligman HK. Food insecurity and health care expenditures in the United States, 2011-2013. Health Serv Res. 2018;53(3):1600-1620.
16. Berkowitz SA, Seligman HK, Basu S. Impact of food insecurity and SNAP participation on healthcare utilization and expenditures. http://www.ukcpr.org/research/discussion-papers. Published 2017. Accessed December 9, 2019.
17. Kushel MB, Gupta R, Gee L, Haas JS. Housing instability and food insecurity as barriers to health care among low-income Americans. J Gen Intern Med. 2006;21(1):71-77.
18. Garcia SP, Haddix A, Barnett K. Incremental health care costs associated with food insecurity and chronic conditions among older adults. Chronic Dis. 2018;15:180058.
19. Berkowitz SA, Seligman HK, Meigs JB, Basu S. Food insecurity, healthcare utilization, and high cost: a longitudinal cohort study. Am J Manag Care. 2018;24(9):399-404.
20. Larson NI, Story MT, Nelson MC. Neighborhood environments: disparities in access to healthy foods in the U.S. Am J Prev Med. 2009;36(1):74-81.
21. Darmon N, Drewnowski A. Contribution of food prices and diet cost to socioeconomic disparities in diet quality and health: a systematic review and analysis. Nutr Rev. 2015;73(10):643-660.
22. Darmon N, Drewnowski A. Does social class predict diet quality? Am J Clin Nutr. 2008;87(5):1107-1117.
23. Drewnowski A. The cost of US foods as related to their nutritive value. Am J Clin Nutr. 2010;92(5):1181-1188.
24. Lucan SC, Maroko AR, Seitchik JL, Yoon DH, Sperry LE, Schechter CB. Unexpected neighborhood sources of food and drink: implications for research and community health. Am J Prev Med. 2018;55(2):e29-e38.
25. Castillo DC, Ramsey NL, Yu SS, Ricks M, Courville AB, Sumner AE. Inconsistent access to food and cardiometabolic disease: the effect of food insecurity. Curr Cardiovasc Risk Rep. 2012;6(3):245-250.
26. Seligman HK, Davis TC, Schillinger D, Wolf MS. Food insecurity is associated with hypoglycemia and poor diabetes self-management in a low-income sample with diabetes. J Health Care Poor Underserved. 2010;21(4):1227-1233.
27. Siefert K, Heflin CM, Corcoran ME, Williams DR. Food insufficiency and physical and mental health in a longitudinal survey of welfare recipients. J Health Soc Behav. 2004;45(2):171-186.
28. Mangurian C, Sreshta N, Seligman H. Food insecurity among adults with severe mental illness. Psychiatr Serv. 2013;64(9):931-932.
29. Melchior M, Caspi A, Howard LM, et al. Mental health context of food insecurity: a representative cohort of families with young children. Pediatrics. 2009;124(4):e564-e572.
30. Brostow DP, Gunzburger E, Abbate LM, Brenner LA, Thomas KS. Mental illness, not obesity status, is associated with food insecurity among the elderly in the health and retirement study. J Nutr Gerontol Geriatr. 2019;38(2):149-172.
31. Higashi RT, Craddock Lee SJ, Pezzia C, Quirk L, Leonard T, Pruitt SL. Family and social context contributes to the interplay of economic insecurity, food insecurity, and health. Ann Anthropol Pract. 2017;41(2):67-77.
32. O’Toole TP, Roberts CB, Johnson EE. Screening for food insecurity in six Veterans Administration clinics for the homeless, June-December 2015. Prev Chronic Dis. 2017;14:160375.
33. Feil DG, Pogach LM. Cognitive impairment is a major risk factor for serious hypoglycaemia; public health intervention is warranted. Evid Based Med. 2014;19(2):77.
34. Frith E, Loprinzi PD. Food insecurity and cognitive function in older adults: Brief report. Clin Nutr. 2018;37(5):1765-1768.
35. Herman D, Afulani P, Coleman-Jensen A, Harrison GG. Food insecurity and cost-related medication underuse among nonelderly adults in a nationally representative sample. Am J Public Health. 2015;105(10):e48-e59.
36. Tseng C-L, Soroka O, Maney M, Aron DC, Pogach LM. Assessing potential glycemic overtreatment in persons at hypoglycemic risk. JAMA Intern Med. 2014;174(2):259-268.
37. Vue MH, Setter SM. Drug-induced glucose alterations part 1: drug-induced hypoglycemia. Diabetes Spectr. 2011;24(3):171-177.
38. Seligman HK, Bolger AF, Guzman D, López A, Bibbins-Domingo K. Exhaustion of food budgets at month’s end and hospital admissions for hypoglycemia. Health Aff (Millwood). 2014;33(1):116-123.
39. US Department of Veterans Affairs, National Center for Veterans Analysis and Statistics. Veteran poverty trends. https://www.va.gov/vetdata/docs/specialreports/veteran_poverty_trends.pdf. Published May 2015. Accessed December 9, 2019.
40. Robbins KG, Ravi A. Veterans living paycheck to paycheck are under threat during budget debates. https://www.americanprogress.org/issues/poverty/news/2017/09/19/439023/veterans-living-paycheck-paycheck-threat-budget-debates. Published September 19, 2017. Accessed December 9, 2019.
41. Wilmoth JM, London AS, Heflin CM. Economic well-being among older-adult households: variation by veteran and disability status. J Gerontol Soc Work. 2015;58(4):399-419.
42. Brostow DP, Gunzburger E, Thomas KS. Food insecurity among veterans: findings from the health and retirement study. J Nutr Health Aging. 2017;21(10):1358-1364.
43. Pooler J, Mian P, Srinivasan M, Miller Z. Veterans and food insecurity. https://www.impaqint.com/sites/default/files/issue-briefs/VeteransFoodInsecurity_IssueBrief_V1.3.pdf. Published November 2018. Accessed December 9, 2019.
44. Schure MB, Katon JG, Wong E, Liu C-F. Food and housing insecurity and health status among U.S. adults with and without prior military service. SSM Popul Health. 2016;29(2):244-248.
45. Miller DP, Larson MJ, Byrne T, DeVoe E. Food insecurity in veteran households: findings from nationally representative data. Public Health Nutr. 2016;19(10):1731-1740.
46. Widome R, Jensen A, Bangerter A, Fu SS. Food insecurity among veterans of the US wars in Iraq and Afghanistan. Public Health Nutr. 2015;18(5):844-849.
47. London AS, Heflin CM. Supplemental Nutrition Assistance Program (SNAP) use among active-duty military personnel, veterans, and reservists. Popul Res Policy Rev. 2015;34(6):805-826.
48. Weinfield NS, Mills G, Borger C, et al. Hunger in America 2014. Natl rep prepared for Feeding America. https://www.feedingamerica.org/research/hunger-in-america. Published 2014. Accessed December 9, 2019.
49. Mabli J, Ohls J, Dragoset L, Castner L, Santos B. Measuring the Effect of Supplemental Nutrition Assistance Program (SNAP) Participation on Food Security. Washington, DC: US Department of Agriculture, Food and Nutrition Service; 2013.
50. Srinivasan M, Pooler JA. Cost-related medication nonadherence for older adults participating in SNAP, 2013–2015. Am J Public Health. 2017;108(2):224-230.
51. Heflin C, Hodges L, Mueser P. Supplemental Nutrition Assistance Progam benefits and emergency room visits for hypoglycaemia. Public Health Nutr. 2017;20(7):1314-1321.
52. Samuel LJ, Szanton SL, Cahill R, et al. Does the Supplemental Nutrition Assistance Program affect hospital utilization among older adults? The case of Maryland. Popul Health Manag. 2018;21(2):88-95.
53. Szanton SL, Samuel LJ, Cahill R, et al. Food assistance is associated with decreased nursing home admissions for Maryland’s dually eligible older adults. BMC Geriatr. 2017;17(1):162.
54. Carlson S, Keith-Jennings B. SNAP is linked with improved nutritional outcomes and lower health care costs. https://www.cbpp.org/research/food-assistance/snap-is-linked-with-improved-nutritional-outcomes-and-lower-health-care. Published January 17, 2018. Accessed December 10, 2019.
55. Keith-Jennings B, Cai L. SNAP helps almost 1.4 million low-income veterans, including thousands in every state. https://www.cbpp.org/research/food-assistance/snap-helps-almost-14-million-low-income-veterans-including-thousands-in. Updated November 8, 2018. Accessed December 10, 2019.
56. US Department of Health and Human Services. Older Americans Act nutrition programs. https://acl.gov/sites/default/files/news%202017-03/OAA-Nutrition_Programs_Fact_Sheet.pdf. Accessed December 10, 2019.
57. US Department of Veterans Affairs. About VHA. https://www.va.gov/health/aboutvha.asp. Accessed December 10, 2019.
58. US Department of Veterans Affairs. VA Corporate Data Warehouse.
59. Yano EM, Bair MJ, Carrasquillo O, Krein SL, Rubenstein LV. Patient aligned care teams (PACT): VA’s journey to implement patient-centered medical homes. J Gen Intern Med. 2014;29(suppl 2):S547-s549.
60. O’Toole TP, Pape L. Innovative efforts to address homelessness among veterans. N C Med J. 2015;76(5):311-314.
61. O’Toole TP, Johnson EE, Aiello R, Kane V, Pape L. Tailoring care to vulnerable populations by incorporating social determinants of health: the Veterans Health Administration’s “Homeless Patient Aligned Care Team” Program. Prev Chronic Dis. 2016;13:150567.
62. Marpadga S, Fernandez A, Leung J, Tang A, Seligman H, Murphy EJ. Challenges and successes with food resource referrals for food-insecure patients with diabetes. Perm J. 2019;23.
63. Stenmark SH, Steiner JF, Marpadga S, Debor M, Underhill K, Seligman H. Lessons learned from implementation of the food insecurity screening and referral program at Kaiser Permanente Colorado. Perm J. 2018;22.
64. Martel ML, Klein LR, Hager KA, Cutts DB. Emergency department experience with novel electronic medical record order for referral to food resources. West J Emerg Med. 2018;19(2):232-237.
65. Going C, Cohen AJ, Bares M, Christensen M. Interdisciplinary approaches to addressing the food insecure veteran. Veterans Health Administration Employee Education System webinar; October 30, 2018.
66. Feeding America Announces New Partnership With U.S. Department Of Veterans Affairs. https://www.prnewswire.com/news-releases/feeding-america-announces-new-partnership-with-us-department-of-veterans-affairs-300481891.html. Published June 29, 2017. Accessed December 10, 2019.
67. US Department of Veterans Affairs. State Veterans Affairs offices. https://www.va.gov/statedva.htm. Updated March 20, 2019. Accessed December 10, 2019.
68. US Department of Veterans Affairs. Directory of veterans service organizations. https://www.va.gov/vso. Updated December 24, 2013. Accessed December 10, 2019.
69. ACL Administration for Community Living. Aging and disability resource centers. https://acl.gov/programs/aging-and-disability-networks/aging-and-disability-resource-centers. Updated December 13, 2017. Accessed December 10, 2019.
70. Nutrition and Obesity Policy Research and Evaluation Network (NOPREN). Clinical screening algorithms. https://nopren.org/resource/download-food-insecurity-screening-and-referral-algorithms-for-adults-patients-living-with-diabetes-and-pediatric-patients. Accessed December 10, 2019.
Nearly 1 in 8 households—and 1 in 6 households with children—experienced food insecurity in 2017, defined as limited or uncertain availability of nutritionally adequate and safe foods.1 Food insecurity is often even more pronounced among households with individuals with acute or chronic medical conditions.2-6 Moreover, food insecurity is independently associated with a range of adverse health outcomes, including poorer control of diabetes mellitus, hypertension, depression and other major psychiatric disorders, HIV, and chronic lung and kidney disease, as well as poorer overall health status.7-14 Food insecurity also has been associated with increased health care costs and acute care utilization as well as increased probability of delayed or missed care.15-19
The relationship between food insecurity and poor health outcomes is a complex and often cyclic phenomenon (Figure 1). Poor nutritional status is fueled by limited access to healthful foods as well as increased reliance on calorie-dense and nutrient-poor “junk” foods, which are less expensive and often more readily available in low-income neighborhoods.5,20-24 These compensatory dietary patterns place individuals at higher risk for developing cardiometabolic conditions and for poor control of these conditions.5,8,9,12,25,26 Additionally, the physiological and psychological stressors of food insecurity may precipitate depression and anxiety or worsen existing mental health conditions, resulting in feelings of overwhelm and decreased self-management capacity.5,8,27-31 Food insecurity has further been associated with poor sleep, declines in cognitive function, and increased falls, particularly among the frail and elderly.32-34
Individuals experiencing food insecurity often report having to make trade-offs between food and other necessities, such as paying rent or utilities. Additional strategies to stretch limited resources include cost-related underuse of medication and delays in needed medical care.4,17,31,35 In a nationally representative survey among adults with at least 1 chronic medical condition, 1 in 3 reported having to choose between food and medicine; 11% were unable to afford either.3 Furthermore, the inability to reliably adhere to medication regimens that need to be taken with food can result in potentially life-threatening hypoglycemia (as can lack of food regardless of medication use).5,26,36 In addition to the more obvious risks of glucose-lowering medications, such as insulin and long-acting sulfonylureas in patients experiencing food insecurity, many drugs commonly used among nondiabetic adults such as ACE-inhibitors, β blockers, quinolones, and salicylates can also precipitate hypoglycemia, and food insecurity has been associated with experiences of hypoglycemia even among individuals without diabetes mellitus.32,37 In one study the risk for hospital admissions for hypoglycemia among low-income populations increased by 27% at the end of the month when food budgets were more likely to be exhausted.38 Worsening health status and increased emergency department visits and hospitalizations may then result in lost wages and mounting medical bills, contributing to further financial strain and worsening food insecurity.
Prevalence and Importance of Food Insecurity Among US Veterans
Nearly 1.5 million veterans in the US are living below the federal poverty level (FPL).39 An additional 2.4 million veterans are living paycheck to paycheck at < 200% of the FPL.40 Veterans living in poverty are at even higher risk than nonveterans for food insecurity, homelessness, and other material hardship.41
Estimates of food insecurity among veterans vary widely, ranging from 6% to 24%—nearly twice that of the general US population.8,42-45 Higher rates of food insecurity have been reported among certain high-risk subgroups, including veterans who served in Iraq and Afghanistan (27%), female veterans (28%), homeless and formerly homeless veterans (49%), and veterans with serious mental illness (35%).6,32,43,46 Additional risk factors for food insecurity specific to veteran populations include younger age, having recently left active-duty military service, and lower final military paygrade.42,45-47 As in the general population, veteran food insecurity is associated with a range of adverse health outcomes, including poorer overall health status as well as increased probability of delayed or missed care.6,8,32,42-44,46
Even among veterans enrolled in federal food assistance programs, many still struggle to afford nutritionally adequate foods. As one example, in a study of mostly male homeless and formerly homeless veterans, O’Toole and colleagues found that nearly half of those reporting food insecurity were already receiving federal food assistance benefits, and 22% relied on emergency food resources.32 Of households served by Feeding America food pantries and meal programs, 20% have a member who has served in the US military.48
Federal Programs To Address Food Insecurity
There are several important federal food assistance programs designed to help alleviate food insecurity. The Supplemental Nutrition Assistance Program (SNAP, formerly the Food Stamp program) is the largest federal food assistance program and provides low-income Americans with cash benefits to purchase food. SNAP has been shown to substantially reduce food insecurity.7,49 The program also is associated with significant decreases in cost-related medication nonadherence as well as reductions in health care costs and both acute care and nursing home utilization.16,50-54 Although nearly 1.4 million veterans live in SNAP-enrolled households, 59% of eligible veterans are not enrolled.43,55 Closing this SNAP eligibility-enrollment gap, has been a focus of recent efforts to improve long-term food security among veterans. There also are several federal food assistance programs for households with children, including the Special Supplemental Nutrition Program for Women, Infants, and Children (WIC) and school meals programs. Among federal nutrition programs for seniors, the Older American’s Act contains designated funding to support nutrition services for older adults, including congregate meal programs in community settings like senior centers, places of worship, and housing communities, and home-delivered meals through programs like Meals on Wheels.56
VHA Response to Food Insecurity
The Veterans Health Administration (VHA) is the country’s largest integrated, federally funded health care system.57 In November 2015, congressional briefings on veteran food insecurity organized by the national non-profit organization MAZON: A Jewish Response to Hunger and hosted with bipartisan support were provided to the US House and Senate. As a result of these briefings, VHA chartered the national Ensuring Veteran Food Security Workgroup with a mandate to partner with governmental and nonprofit agencies to “focus on the issue of food insecurity, the identification of veterans at risk, the needed training of VHA staff and the coordination of resources and initiatives to support the veterans for whom we care.” Building off a pilot in US Department of Veterans Affairs (VA) Homeless Patient Aligned Care Teams (H-PACTs),32 VHA subsequently integrated a single-item food insecurity screening tool into the VA electronic health record (EHR) clinical reminder system (Figure 2). The clinical reminder, which was rolled out across VA medical centers nationally in October 2017, provides an alert to screen all noninstitutionalized veterans for food insecurity. To date, nearly 5 million veterans have been screened. When a veteran endorses food insecurity based on the initial screening question, a prompt appears to offer the veteran a referral to a social worker and/or dietitian. Positive screening results also should be communicated to the patient’s primary care provider. Depending on site-specific clinical flow, the reminders are typically completed in the outpatient setting either by nurses or medical assistants during intake or by providers as part of the clinical visit. However, any member of the health care team can complete the clinical reminder at any time. As of September 2019, approximately 74,000 veterans have been identified as food insecure.58
Addressing Food Insecurity
VHA has been a recognized leader in addressing homelessness and other social determinants of health through its integrated care and PACT delivery models.59-61 The food insecurity clinical reminder was designed to facilitate a tailored, interdisciplinary approach to identify and address food insecurity. Interdisciplinary care team members—including medical assistants, clinicians, social workers, registered dietitians, nurse care managers, occupational or physical therapists, and pharmacists—are uniquely positioned to identify veterans impacted by food insecurity, assess for associated clinical and/or social risk factors, and offer appropriate medical and nutrition interventions and resource referrals.
This interdisciplinary team-based model is essential given the range of potential drivers underlying veteran experiences of food insecurity and subsequent health outcomes. It is critically important for clinicians to review the medication list with veterans screening positive for food insecurity to assess for risk of hypoglycemia and/or cost-related nonadherence, make any necessary adjustments to therapeutic regimens, and assess for additional risk factors associated with food insecurity. Examples of tailored nutrition counseling that clinical dietitians may provide include meal preparation strategies for veterans who only have access to a microwave or hotplate, or recommendations for how veterans on medically restricted diets can best navigate food selection at soup kitchens or food pantries. Resource referrals provided by social workers or other care team members may include both emergency food resources to address immediate shortages (eg, food pantries, soup kitchens, or vouchers for free lunch) as well as resources focused on improving longer term food security (eg, federal food assistance programs or home delivered meal programs). Importantly, although providing a list of food resources may be helpful for some patients, such lists are often insufficient.62,63 Many patients require active assistance with program enrollment either onsite the day of their clinic visit or through connection with a partnering community-based organization that can, in turn, identify appropriate resources and facilitate program enrollment.63,64 Planned follow-up is also crucial to determine whether referrals are successful and to assess for ongoing need. Proposed roles for interdisciplinary care team members in addressing a positive food insecurity screen are outlined in Table 1.
VHA-Community Partnerships
In addition to services offered within VA, public and private sector partnerships can greatly enhance the range of resources available to food insecure veterans. Several VA facilities have developed formal community partnerships, such as the Veterans Pantry Pilot (VPP) program, a national partnership between Feeding America food banks and VA medical centers to establish onsite or mobile food pantries. There are currently 17 active Feeding America VPP sites, with a number of additional sites under development. Several of the VPP sites also include other “wraparound services,” such as SNAP application assistance.65,66
State Veterans Affairs offices67 and Veterans Service Organizations (VSOs)68 also can serve as valuable partners for connecting veterans with needed resources. VSOs offer a range of services, including assistancewith benefit claims, employment and housing assistance, emergency food assistance, and transportation to medical appointments. Some VSOs also have established local affiliations with Meals on Wheels focused on veteran outreach and providing hot meals for low-income, homebound, and disabled veterans.
Additional Resources
Although resources vary by regional setting, several key governmental and community-based food assistance programs are summarized in Table 2. Local community partners and online/phone-based directories, such as United Way’s 2-1-1 can help identify additional local resources. For older adults and individuals with disabilities, local Aging and Disability Resources Centers can provide information and assistance connecting to needed resources.69 Finally, there are a number of online resources available for clinicians interested in learning more about the impact of food insecurity on health and tools to use in the clinical setting (Table 3).
Conclusion
The VA has recognized food insecurity as a critical concern for the well-being of our nation’s veterans. Use of the EHR clinical reminder represents a crucial first step toward increasing provider awareness about veteran food insecurity and improving clinical efforts to address food insecurity once identified. Through the reminder, health care teams can connect veterans to needed resources and create both the individual and population-level data necessary to inform VHA and community efforts to address veteran food insecurity. Clinical reminder data are currently being used for local quality improvement efforts and have established the need nationally for formalized partnerships between VHA Social Work Services and Nutrition and Food Services to connect veterans with food and provide them with strategies to best use available food resources.
Moving forward, the Ensuring Veteran Food Security Workgroup continues to work with agencies and organizations across the country to improve food insecure veterans’ access to needed services. In addition to existing VA partnerships with Feeding America for the VPP, memorandums of understanding are currently underway to formalize partnerships with both the Food Research and Action Center (FRAC) and MAZON. Additional research is needed both to formally validate the current food insecurity clinical reminder screening question and to identify best practices and potential models for how to most effectively use VHA-community partnerships to address the unique needs of the veteran population.
Ensuring the food security of our nation’s veterans is essential to VA’s commitment to providing integrated, veteran-centered, whole person care. Toward that goal, VA health care teams are urged to use the clinical reminder and help connect food insecure veterans with relevant resources both within and outside of the VA health care system.
1. Coleman-Jensen A, Rabbitt MP, Gregory CA, Singh A. Household food security in the United States in 2017. http://www.ers.usda.gov/publications/pub-details/?pubid=90022. Published September 2018. Accessed December 9, 2019.
2. Berkowitz SA, Meigs JB, DeWalt D, et al. Material need insecurities, control of diabetes mellitus, and use of health care resources: results of the Measuring Economic Insecurity in Diabetes study. JAMA Intern Med. 2015;175(2):257-265.
3. Berkowitz SA, Seligman HK, Choudhry NK. Treat or eat: food insecurity, cost-related medication underuse, and unmet needs. Am J Med. 2014;127(4):303-310.e3.
4. Lyles CR, Seligman HK, Parker MM, et al. Financial strain and medication adherence among diabetes patients in an integrated health care delivery system: The Diabetes Study of Northern California (DISTANCE). Health Serv Res. 2016;51(2):610-624.
5. Seligman HK, Schillinger D. Hunger and socioeconomic disparities in chronic disease. N Engl J Med. 2010;363(1):6-9.
6. Narain K, Bean-Mayberry B, Washington DL, Canelo IA, Darling JE, Yano EM. Access to care and health outcomes among women veterans using veterans administration health care: association with food insufficiency. Womens Health Issues. 2018;28(3):267-272.
7. Gundersen C, Ziliak JP. Food insecurity and health outcomes. Health Aff. 2015;34(11):1830-1839.
8. Wang EA, McGinnis KA, Goulet J, et al; Veterans Aging Cohort Study Project Team. Food insecurity and health: data from the Veterans Aging Cohort Study. Public Health Rep. 2015;130(3):261-268.
9. Berkowitz SA, Berkowitz TSZ, Meigs JB, Wexler DJ. Trends in food insecurity for adults with cardiometabolic disease in the United States: 2005-2012. PloS One. 2017;12(6):e0179172.
10. Seligman HK, Laraia BA, Kushel MB. Food insecurity is associated with chronic disease among low-income NHANES participants. J Nutr. 2010;140(2):304-310.
11. Berkowitz SA, Baggett TP, Wexler DJ, Huskey KW, Wee CC. Food insecurity and metabolic control among U.S. adults with diabetes. Diabetes Care. 2013;36(10):3093-3099.
12. Seligman HK, Jacobs EA, López A, Tschann J, Fernandez A. Food insecurity and glycemic control among low-income patients with type 2 diabetes. Diabetes Care. 2012;35(2):233-238.
13. Banerjee T, Crews DC, Wesson DE, et al; CDC CKD Surveillance Team. Food insecurity, CKD, and subsequent ESRD in US adults. Am J Kidney Dis. 2017;70(1):38-47.
14. Bruening M, Dinour LM, Chavez JBR. Food insecurity and emotional health in the USA: a systematic narrative review of longitudinal research. Public Health Nutr. 2017;20(17):3200-3208.
15. Berkowitz SA, Basu S, Meigs JB, Seligman HK. Food insecurity and health care expenditures in the United States, 2011-2013. Health Serv Res. 2018;53(3):1600-1620.
16. Berkowitz SA, Seligman HK, Basu S. Impact of food insecurity and SNAP participation on healthcare utilization and expenditures. http://www.ukcpr.org/research/discussion-papers. Published 2017. Accessed December 9, 2019.
17. Kushel MB, Gupta R, Gee L, Haas JS. Housing instability and food insecurity as barriers to health care among low-income Americans. J Gen Intern Med. 2006;21(1):71-77.
18. Garcia SP, Haddix A, Barnett K. Incremental health care costs associated with food insecurity and chronic conditions among older adults. Chronic Dis. 2018;15:180058.
19. Berkowitz SA, Seligman HK, Meigs JB, Basu S. Food insecurity, healthcare utilization, and high cost: a longitudinal cohort study. Am J Manag Care. 2018;24(9):399-404.
20. Larson NI, Story MT, Nelson MC. Neighborhood environments: disparities in access to healthy foods in the U.S. Am J Prev Med. 2009;36(1):74-81.
21. Darmon N, Drewnowski A. Contribution of food prices and diet cost to socioeconomic disparities in diet quality and health: a systematic review and analysis. Nutr Rev. 2015;73(10):643-660.
22. Darmon N, Drewnowski A. Does social class predict diet quality? Am J Clin Nutr. 2008;87(5):1107-1117.
23. Drewnowski A. The cost of US foods as related to their nutritive value. Am J Clin Nutr. 2010;92(5):1181-1188.
24. Lucan SC, Maroko AR, Seitchik JL, Yoon DH, Sperry LE, Schechter CB. Unexpected neighborhood sources of food and drink: implications for research and community health. Am J Prev Med. 2018;55(2):e29-e38.
25. Castillo DC, Ramsey NL, Yu SS, Ricks M, Courville AB, Sumner AE. Inconsistent access to food and cardiometabolic disease: the effect of food insecurity. Curr Cardiovasc Risk Rep. 2012;6(3):245-250.
26. Seligman HK, Davis TC, Schillinger D, Wolf MS. Food insecurity is associated with hypoglycemia and poor diabetes self-management in a low-income sample with diabetes. J Health Care Poor Underserved. 2010;21(4):1227-1233.
27. Siefert K, Heflin CM, Corcoran ME, Williams DR. Food insufficiency and physical and mental health in a longitudinal survey of welfare recipients. J Health Soc Behav. 2004;45(2):171-186.
28. Mangurian C, Sreshta N, Seligman H. Food insecurity among adults with severe mental illness. Psychiatr Serv. 2013;64(9):931-932.
29. Melchior M, Caspi A, Howard LM, et al. Mental health context of food insecurity: a representative cohort of families with young children. Pediatrics. 2009;124(4):e564-e572.
30. Brostow DP, Gunzburger E, Abbate LM, Brenner LA, Thomas KS. Mental illness, not obesity status, is associated with food insecurity among the elderly in the health and retirement study. J Nutr Gerontol Geriatr. 2019;38(2):149-172.
31. Higashi RT, Craddock Lee SJ, Pezzia C, Quirk L, Leonard T, Pruitt SL. Family and social context contributes to the interplay of economic insecurity, food insecurity, and health. Ann Anthropol Pract. 2017;41(2):67-77.
32. O’Toole TP, Roberts CB, Johnson EE. Screening for food insecurity in six Veterans Administration clinics for the homeless, June-December 2015. Prev Chronic Dis. 2017;14:160375.
33. Feil DG, Pogach LM. Cognitive impairment is a major risk factor for serious hypoglycaemia; public health intervention is warranted. Evid Based Med. 2014;19(2):77.
34. Frith E, Loprinzi PD. Food insecurity and cognitive function in older adults: Brief report. Clin Nutr. 2018;37(5):1765-1768.
35. Herman D, Afulani P, Coleman-Jensen A, Harrison GG. Food insecurity and cost-related medication underuse among nonelderly adults in a nationally representative sample. Am J Public Health. 2015;105(10):e48-e59.
36. Tseng C-L, Soroka O, Maney M, Aron DC, Pogach LM. Assessing potential glycemic overtreatment in persons at hypoglycemic risk. JAMA Intern Med. 2014;174(2):259-268.
37. Vue MH, Setter SM. Drug-induced glucose alterations part 1: drug-induced hypoglycemia. Diabetes Spectr. 2011;24(3):171-177.
38. Seligman HK, Bolger AF, Guzman D, López A, Bibbins-Domingo K. Exhaustion of food budgets at month’s end and hospital admissions for hypoglycemia. Health Aff (Millwood). 2014;33(1):116-123.
39. US Department of Veterans Affairs, National Center for Veterans Analysis and Statistics. Veteran poverty trends. https://www.va.gov/vetdata/docs/specialreports/veteran_poverty_trends.pdf. Published May 2015. Accessed December 9, 2019.
40. Robbins KG, Ravi A. Veterans living paycheck to paycheck are under threat during budget debates. https://www.americanprogress.org/issues/poverty/news/2017/09/19/439023/veterans-living-paycheck-paycheck-threat-budget-debates. Published September 19, 2017. Accessed December 9, 2019.
41. Wilmoth JM, London AS, Heflin CM. Economic well-being among older-adult households: variation by veteran and disability status. J Gerontol Soc Work. 2015;58(4):399-419.
42. Brostow DP, Gunzburger E, Thomas KS. Food insecurity among veterans: findings from the health and retirement study. J Nutr Health Aging. 2017;21(10):1358-1364.
43. Pooler J, Mian P, Srinivasan M, Miller Z. Veterans and food insecurity. https://www.impaqint.com/sites/default/files/issue-briefs/VeteransFoodInsecurity_IssueBrief_V1.3.pdf. Published November 2018. Accessed December 9, 2019.
44. Schure MB, Katon JG, Wong E, Liu C-F. Food and housing insecurity and health status among U.S. adults with and without prior military service. SSM Popul Health. 2016;29(2):244-248.
45. Miller DP, Larson MJ, Byrne T, DeVoe E. Food insecurity in veteran households: findings from nationally representative data. Public Health Nutr. 2016;19(10):1731-1740.
46. Widome R, Jensen A, Bangerter A, Fu SS. Food insecurity among veterans of the US wars in Iraq and Afghanistan. Public Health Nutr. 2015;18(5):844-849.
47. London AS, Heflin CM. Supplemental Nutrition Assistance Program (SNAP) use among active-duty military personnel, veterans, and reservists. Popul Res Policy Rev. 2015;34(6):805-826.
48. Weinfield NS, Mills G, Borger C, et al. Hunger in America 2014. Natl rep prepared for Feeding America. https://www.feedingamerica.org/research/hunger-in-america. Published 2014. Accessed December 9, 2019.
49. Mabli J, Ohls J, Dragoset L, Castner L, Santos B. Measuring the Effect of Supplemental Nutrition Assistance Program (SNAP) Participation on Food Security. Washington, DC: US Department of Agriculture, Food and Nutrition Service; 2013.
50. Srinivasan M, Pooler JA. Cost-related medication nonadherence for older adults participating in SNAP, 2013–2015. Am J Public Health. 2017;108(2):224-230.
51. Heflin C, Hodges L, Mueser P. Supplemental Nutrition Assistance Progam benefits and emergency room visits for hypoglycaemia. Public Health Nutr. 2017;20(7):1314-1321.
52. Samuel LJ, Szanton SL, Cahill R, et al. Does the Supplemental Nutrition Assistance Program affect hospital utilization among older adults? The case of Maryland. Popul Health Manag. 2018;21(2):88-95.
53. Szanton SL, Samuel LJ, Cahill R, et al. Food assistance is associated with decreased nursing home admissions for Maryland’s dually eligible older adults. BMC Geriatr. 2017;17(1):162.
54. Carlson S, Keith-Jennings B. SNAP is linked with improved nutritional outcomes and lower health care costs. https://www.cbpp.org/research/food-assistance/snap-is-linked-with-improved-nutritional-outcomes-and-lower-health-care. Published January 17, 2018. Accessed December 10, 2019.
55. Keith-Jennings B, Cai L. SNAP helps almost 1.4 million low-income veterans, including thousands in every state. https://www.cbpp.org/research/food-assistance/snap-helps-almost-14-million-low-income-veterans-including-thousands-in. Updated November 8, 2018. Accessed December 10, 2019.
56. US Department of Health and Human Services. Older Americans Act nutrition programs. https://acl.gov/sites/default/files/news%202017-03/OAA-Nutrition_Programs_Fact_Sheet.pdf. Accessed December 10, 2019.
57. US Department of Veterans Affairs. About VHA. https://www.va.gov/health/aboutvha.asp. Accessed December 10, 2019.
58. US Department of Veterans Affairs. VA Corporate Data Warehouse.
59. Yano EM, Bair MJ, Carrasquillo O, Krein SL, Rubenstein LV. Patient aligned care teams (PACT): VA’s journey to implement patient-centered medical homes. J Gen Intern Med. 2014;29(suppl 2):S547-s549.
60. O’Toole TP, Pape L. Innovative efforts to address homelessness among veterans. N C Med J. 2015;76(5):311-314.
61. O’Toole TP, Johnson EE, Aiello R, Kane V, Pape L. Tailoring care to vulnerable populations by incorporating social determinants of health: the Veterans Health Administration’s “Homeless Patient Aligned Care Team” Program. Prev Chronic Dis. 2016;13:150567.
62. Marpadga S, Fernandez A, Leung J, Tang A, Seligman H, Murphy EJ. Challenges and successes with food resource referrals for food-insecure patients with diabetes. Perm J. 2019;23.
63. Stenmark SH, Steiner JF, Marpadga S, Debor M, Underhill K, Seligman H. Lessons learned from implementation of the food insecurity screening and referral program at Kaiser Permanente Colorado. Perm J. 2018;22.
64. Martel ML, Klein LR, Hager KA, Cutts DB. Emergency department experience with novel electronic medical record order for referral to food resources. West J Emerg Med. 2018;19(2):232-237.
65. Going C, Cohen AJ, Bares M, Christensen M. Interdisciplinary approaches to addressing the food insecure veteran. Veterans Health Administration Employee Education System webinar; October 30, 2018.
66. Feeding America Announces New Partnership With U.S. Department Of Veterans Affairs. https://www.prnewswire.com/news-releases/feeding-america-announces-new-partnership-with-us-department-of-veterans-affairs-300481891.html. Published June 29, 2017. Accessed December 10, 2019.
67. US Department of Veterans Affairs. State Veterans Affairs offices. https://www.va.gov/statedva.htm. Updated March 20, 2019. Accessed December 10, 2019.
68. US Department of Veterans Affairs. Directory of veterans service organizations. https://www.va.gov/vso. Updated December 24, 2013. Accessed December 10, 2019.
69. ACL Administration for Community Living. Aging and disability resource centers. https://acl.gov/programs/aging-and-disability-networks/aging-and-disability-resource-centers. Updated December 13, 2017. Accessed December 10, 2019.
70. Nutrition and Obesity Policy Research and Evaluation Network (NOPREN). Clinical screening algorithms. https://nopren.org/resource/download-food-insecurity-screening-and-referral-algorithms-for-adults-patients-living-with-diabetes-and-pediatric-patients. Accessed December 10, 2019.
Ultrabrief Cognitive Screening Outcomes
Hospitalization is a critical time for older patients with cognitive impairment. Past research has found that hospitalized older adults with cognitive dysfunction have more rapid cognitive decline, increased morbidity and mortality, and higher costs of healthcare utilization.[1, 2, 3] Those with preexisting cognitive dysfunction, such as dementia, are most susceptible to the negative impacts of hospitalization.[4, 5, 6, 7, 8] Identification of cognitive deficits upon admission is important for risk stratification of patients and prevention of negative hospital health events.
Frontline healthcare providers are underequipped to detect acute cognitive dysfunction.[9, 10] Current practice and research for the detection of cognitive dysfunction in the acute care setting utilizes instruments that require training[11] and are relatively lengthy (>5 minutes).[12] Although these cognitive screening tests are accurate and reliable, the time requirement is not feasible in a fast‐paced clinical setting. A possible alternative is the use of ultra‐brief cognitive screening instruments (<1 minute) that have the potential to identify those individuals requiring additional evaluation and follow‐up. These brief instruments are composed of screening tools that emphasize core features of acute cognitive dysfunction such as level of arousal or attention.[13, 14, 15, 16] Arousal, the ability to respond to or interact with the environment,[15] is an important component of cognition because it is generally preserved in chronic cognitive disorders (eg, dementia). Thus, an alteration in arousal may be a harbinger of more acute impairment[17] in need of evaluation, and in these lowered states of arousal it may be difficult to test for attention.[18] Attention is a broadly defined cognitive domain indicating focus.[19] Older adults, regardless of preexisting cognitive dysfunction, warrant additional cognitive testing if levels of arousal or attention are altered[20, 21] due to the significant relationship to delirium, which is associated with adverse events in this population. Recent research has demonstrated that these brief cognitive screening instruments provide information about the risk for delirium and are a strong test for clinical characteristics of delirium.[16, 21]
The purpose of this analysis was to demonstrate the clinical outcomes of poor performance on ultrabrief assessments arousal and attention by frontline staff using a quality improvement database. Specific objectives include determining (1) the association of poor performance on brief cognitive assessments and hospital outcomes and (2) the inter‐relationship between alterations in the levels of arousal and attention on in‐hospital and discharge outcomes.
METHODS
Setting and Study Design
This is a secondary analysis of data collected from a quality improvement program for delirium risk modification.[22] This program collected data from October 2010 until September 2012 at a Veterans Affairs (VA) tertiary referral center for the New England region. Patients aged 60 years or older and admitted to medical wards were screened upon admission or transfer to VA Boston Healthcare System and provided appropriate interventions to modify delirium risk. Excluded were individuals admitted as observational status, or those readmitted within 30 days of initial screening, and those screened more than 72 hours after admission. Age and sex were abstracted from the medical record. Outcome data were collected from the medical record for the purpose of operating and sustaining the program. In a previous article, the length of stay (LOS) outcome was reported in a subset of this population.[23] The analysis presented here includes the full cohort, presents the interaction with month of the year backward (MOYB), and provides additional outcomes not included in the other article. The VA institutional review board (IRB) reviewed and approved the secondary data analysis of the quality improvement project.
Measures
Brief Cognitive Screening
The baseline assessments of levels of arousal and attention were collected within 72 hours of admission to identify delirium risk. Trained study staff, not involved in the clinical care of patients, administered these assessments as part of the quality improvement project. It is estimated that these assessments took less than 1 minute to complete per individual, but actual administration time was not measured. Assessments were documented within the electronic health record as part of a delirium risk stratification system.
Arousal
The arousal level assessment was the modified Richmond Agitation and Sedation Scale (mRASS). The mRASS is a brief, reliable, observational tool used to determine arousal level.[15, 17] It is a text modification of the RASS[17] for less acutely ill patients, capturing hyperactive and hypoactive altered levels of arousal. The mRASS asks an open‐ended question followed by observation for 10 seconds and completion of a 5 to+4 rating scale. Alert and calm (score=0) is considered normal, with positive numbers related to an increased level of arousal and attention, whereas negative numbers denote decreased levels. For the analyses, an mRASS of 0 is utilized as the reference. Categories were collapsed into 2 and 2 due to few patients on the extremes of the mRASS.
Attention
The MOYB is a brief measure of attention that is included in several instruments for delirium.[19, 24, 25] For this study, the patient was asked to recite the 12 months backward beginning with December. A correct score was given if the individual was able to recite all 12 months to January without any error. An incorrect score was given if any mistake was made. Scoring for the MOYB is not standardized by age, preexisting medical diagnosis, or any other rational.[26] Others have used July or June as a cutoff for a correct score on the MOYB,[21, 25] but a more conservative score of correct to January was used in this study, which has been previously used.[26, 27, 28, 29, 30] A score of not completed was given when the patient was unable to participate or declined to complete the assessment. For the analysis, a correct score on the MOYB is the referent group.
Outcomes
In‐hospital outcomes included (1) restraint use and (2) in‐hospital mortality. Physical restraint use was identified by focused medical record review and identification of required restraint documentation, which, by center policy requires daily review and documentation. Any restraint use during the hospitalization was included.
Discharge outcomes included (1) LOS, (2) discharge other than a location to home, and (3) variable direct costs. LOS was calculated from date of admission until date of discharge. Discharge disposition was identified in the electronic medical record discharge documentation and categorized into discharge to the prehospital residence (home) or not. Hospital variable direct costs were collected from the VA decision support system,[31] a centrally maintained administrative database. The VA decision support system is challenged with accounting for costs of a single‐day admission and patients who are hospitalized from VA long‐term care. To address the missing data from these cases, multiple imputations (n=20) of the missing data were performed.[32] Sensitivity analyses were performed to determine the impact of the imputation and the cost analysis strategy (see Supporting Information, Appendix 1, in the online version of this article).
Statistical Analyses
For this analysis, outcomes are reported at each level of performance on the mRASS (1 to1) and MOYB (correct, incorrect, not completed). For each analysis, the performance with a mean and standard deviation (SD) are reported for continuous outcomes and a percentage for dichotomous outcomes. For dichotomous outcomes, including restraint use, in‐hospital mortality, and discharge disposition, a risk ratio (RR) with 95% confidence interval (CI) is presented. The median is presented for the cost data because variable direct cost is highly skewed. For LOS and cost outcomes, unadjusted incident rate ratio (IRR) from a Poisson regression relative to the referent is presented to compare the categories. A Poisson regression was selected because LOS (a count of days) and variable direct costs (a count of dollars) are highly skewed. The output of Poisson regression produces an IRR and 95% CI relative to the referent group. The Poisson regression could not be adjusted because the quality improvement nature of these data limited the number of covariates collected. Sensitivity analyses did not identify significant interactions of age and sex (results not shown).
MOYB was also compared by level of arousal (mRASS=0 vs all others). Due to the relatively few patients with positive mRASS, it was compressed into a category of abnormal mRASS relative to alert and calm. Similar to the previous analyses, Poisson regression was performed to calculate the IRR (95% CI) relative to correct MOYB for the continuous variables. An RR was calculated for the dichotomous variables. All statistical analyses were performed using Stata version 11.0 (StataCorp, College Station, TX).
RESULTS
Population Description
Over the 2‐year project timeline, a total of 3232 unique individual records were analyzed (Table 1). Patients admitted and screened within the prior 30 days (n=501) and patients screened more than 3 days after admission (n=664) were not included in the analysis. Older adults were on average 74.7 years old (SD=9.8), and 98.2% were male, consistent with the veteran population. Altered level of arousal, as defined by an abnormal mRASS score, was found in 15.3% of the population. Average LOS was 5.2 days (SD=5.6), restraint use occurred in 5.5% during the hospital stay, patients were likely to be discharged home (71.7%), and a small portion died during hospitalization (1.3%). Mean variable direct costs were $11,084 with expected variability (SD=$15,682, median $6,614). Patients who died during the hospital stay had significantly longer LOS (mean 16.8 [SD=12.5] vs 5.1 [SD=5.4] days, P<0.001) and higher variable direct costs ($43,879 [SD=$37,334] vs $12,544 [SD=$16,802], P<0.001), justifying their removal from these analyses.
| Characteristic | Result, N=3,232, Mean (SD) or % (n) |
|---|---|
| |
| Age, y | 74.7 (9.8) |
| Male | 98.2 (3,174) |
| mRASS | |
| 2 | 2.0% (64) |
| 1 | 8.5% (273) |
| 0 | 84.7% (2,737) |
| 1 | 4.0% (131) |
| 2 | 0.8% (27) |
| MOYB | |
| Correct | 48.8% (1,578) |
| Incorrect | 45.1% (1,457) |
| Not completed | 6.1% (197) |
| Restraint use | 5.5% (177) |
| In‐hospital mortality | 1.3% (41) |
| Length of stay, da | 5.1 (5.4) |
| Discharge other than homea | 71.7% (2,292) |
| Variable direct hospital cost, $a | 11,084 (15,682) |
| Median cost, $ | 6,614 |
Impact of Altered Level of Arousal on Outcomes
There is an association between a deviation from a normal level of arousal (mRASS not equal to 0) and worsening outcomes (Table 2). Relative to a normal level of arousal (4.9SD 5.2 days), decreased level of arousal (negative mRASS), and increased arousal (positive mRASS) resulted in longer LOS (6.0SD 5.6 days, 5.7SD 6.8 days, respectively). Similarly, increased or decreased arousal was associated with heightened risk of restraints and less frequent discharge to home. In‐hospital mortality and hospital variable direct costs were significantly higher in those with decreased levels of arousal (IRR: 2.8, 95% CI: 1.36.0; IRR: 1.10, 95% CI: 0.951.26, respectively). The pattern does not hold for increased arousal with respect to in‐hospital mortality and variable direct hospital cost outcomes. The unadjusted analysis found that, relative to normal arousal, there is a significant change in outcomes with decreased levels of arousal. Increased arousal is associated with worsened IRR in LOS, restraint use, and discharge home, but not in‐hospital mortality and variable direct cost.
| mRASS Alert and Calm, n=2,737 | mRASS Negative, n=337 | mRASS Positive, n=158 | ||||
|---|---|---|---|---|---|---|
| Value | IRR/RR (95%CI) | Value | IRR/RR (95% CI) | Value | IRR/RR (95% CI) | |
| ||||||
| Restraint use % (n) | 4.2% (114) | Referent | 10.4% (35) | 2.49 (1.743.57) | 17.7% (28) | 4.25 (2.916.23) |
| In‐hospital mortality % (n) | 1.0% (26) | Referent | 2.7% (9) | 2.81 (1.335.95) | 1.3% (2) | 1.33 (0.325.56) |
| Length of stay, d (SD)a | 4.9 (5.2) | Referent | 6.0 (5.6) | 1.24 (1.181.30) | 5.7 (6.8) | 1.17 (1.091.25) |
| Discharge other than home, % (n)a | 24.9% (675) | Referent | 46.7% (153) | 1.87 (1.642.14) | 48.1% (75) | 1.93 (1.612.30) |
| Variable direct cost, $ (SD)a, b | 10,581 (14,928) | Referent | 11,604 (13,852) | 1.10 (0.951.26) | 10,640 (10,771) | 1.01 (0.851.19) |
| Median cost, $ | 6,318 | 7,738 | 7,858 | |||
Impact of Altered Attention on Outcomes
Patients who completed the MOYB incorrectly had increased restraint use (RR: 2.11, 95% CI 1.443.11) and LOS (IRR: 1.06, 95% CI: 1.021.10), but no difference in in‐hospital mortality, discharge home (RR: 0.78, 95% CI: 0.750.82), and variable direct costs, relative to those who completed the MOYB correctly (Table 3). Importantly, patients who did not complete the MOYB assessment had a 2‐fold increase in restraint use (RR: 2.05, 95% CI: 0.944.50), in‐hospital mortality was nearly 6‐fold higher (RR: 6.36, 95% CI: 2.1618.69), longer LOS (IRR: 1.12, 95% CI: 1.031.21), and returned home less frequently (RR: 1.77, 95% CI: 1.262.48).
| mRASS Normal | mRASS Abnormal | |||||||||||
|---|---|---|---|---|---|---|---|---|---|---|---|---|
| MOYB Correct (n=1,431) | MOYB Incorrect (n=1,181) | MOYB Incomplete (n=125) | MOYB Correct (n=147) | MOYB Incorrect (n=276) | MOYB Incomplete (n=72) | |||||||
| Value | IRR/RR (95% CI) | Value | IRR/RR (95% CI) | Value | IRR/RR (95% CI) | Value | IRR/RR (95% CI) | Value | IRR/RR (95% CI) | Value | IRR/RR (95% CI) | |
| ||||||||||||
| Restraint use, % (n) | 2.7% (39) | Referent | 5.8% (68) | 2.11 (1.44‐3.11) | 5.6% (7) | 2.05 (0.94‐4.50) | 2.7% (4) | 1.00 (0.36‐2.75) | 13.8% (38) | 5.05 (3.29‐7.75) | 29.2% (21) | 10.70 (6.66‐17.20) |
| In‐hospital mortality, % (n) | 0.6% (9) | Referent | 1.0% (12) | 1.62 (0.68‐ 3.82) | 4.0% (5) | 6.36 (2.16‐18.69) | 1.4% (2) | 2.16 (0.47‐9.92) | 2.2% (6) | 3.46 (1.24‐9.63) | 4.2% (3) | 6.63 (1.83‐23.95) |
| Length of stay, d (SD)a | 4.7 (5.4) | Referent | 5.0 (5.1) | 1.06 (1.02‐1.10) | 5.3 (5.0) | 1.12 (1.03‐1.21) | 5.4 (6.0) | 1.13 (1.05‐1.22) | 5.9 (4.4) | 1.23 (1.17‐1.30) | 7.5 (10.0) | 1.55 (1.44‐1.73) |
| Discharge other than home, % (n)a | 17.9% (255) | Referent | 32.7% (382) | 1.82 (1.56‐ 2.14) | 31.7% (38) | 1.77 (1.26‐2.48) | 29.7% (43) | 1.65 (1.20‐2.28) | 53.3% (144) | 2.97 (2.42‐3.64) | 59.4% (41) | 3.31 (2.38‐4.61) |
| Variable direct cost, $ (SD)a, b | 10,609 (16,154) | Referent | 10,482 (13,495) | 0.99 (0.89‐1.10) | 11,213 (12,994) | 1.06 (0.85‐1.32) | 12,010 (15,636) | 1.13 (0.90‐1.42) | 10,776 (10,680) | 1.02 (0.88‐1.17) | 11,815 (14,604) | 1.11 (0.82‐1.51) |
| Median cost, $ | 6,338 | 6,248 | 6,630 | 7,023 | 8,093 | 8,180 | ||||||
Inter‐relationship of Altered Level of Arousal and Attention on Outcomes
The inter‐relationship of altered level of arousal and attention is presented in Table 3. Of patients with a normal mRASS, 52% had correct MOYB. The percentage of correct MOYB declined with the level of arousal, such that 38% had normal MOYB and a mRASS of 1 and 9% had normal MOYB with mRASS of 2. In general, in‐hospital outcomes (restraints and mortality) are associated with MOYB performance, and discharge outcomes (LOS, discharge location, and variable direct costs) are associated with mRASS. Those patients who did not complete the MOYB demonstrated worse outcomes, regardless of mRASS performance, including a 6‐fold increase in mortality and significant increases in LOS and discharge location.
DISCUSSION
Impaired performance on a one‐time assessment of arousal or attention during hospitalization demonstrated a relationship with in‐hospital and discharge outcomes. Relative to normal levels of arousal and attention, alterations in attention, level of arousal, or both were associated with progressively negative consequences. Combined with the prognostic value, the administration of ultra‐brief cognitive screening measures may have value in the identification of patients who would benefit from additional screening, supporting prior work in this area.[23] The brevity of the assessments enhances clinical utility and implementation potential.
Cognitive function during hospitalization has been associated with many negative outcomes including delirium, falls, pressure ulcers, and functional decline.[3, 33, 34, 35, 36, 37] The findings of this analysis are consistent with previous studies and provide important clinical implications. First, prior work in cognitive screening has focused on more time‐consuming instruments.[12] By focusing on brief instruments, particularly those under 1 minute that do not require paper or props, a user‐friendly tool that is associated with health outcomes is provided.
In addition, this analysis demonstrates that each assessment, when used individually, has some prognostic significance associated with the identification of delirium or other types of cognitive impairment. When used alone, abnormal scores on the mRASS or MOYB may be indicative of individuals requiring further cognitive assessment, supporting previous research.[16, 23] Individuals with abnormal scores on both the mRASS and MOYB identify a high‐risk group in need of further clinical assessment for delirium (Figure 1). Neither of these assessments are meant to be used as the only means to diagnosis delirium, but together they identify key clinical characteristics of delirium (arousal and attention).[16, 18, 21] Considering the significant negative consequences associated with delirium, it is not surprising that tools identifying core features of delirium, such as those presented here, would also be associated with in‐hospital and discharge outcomes.
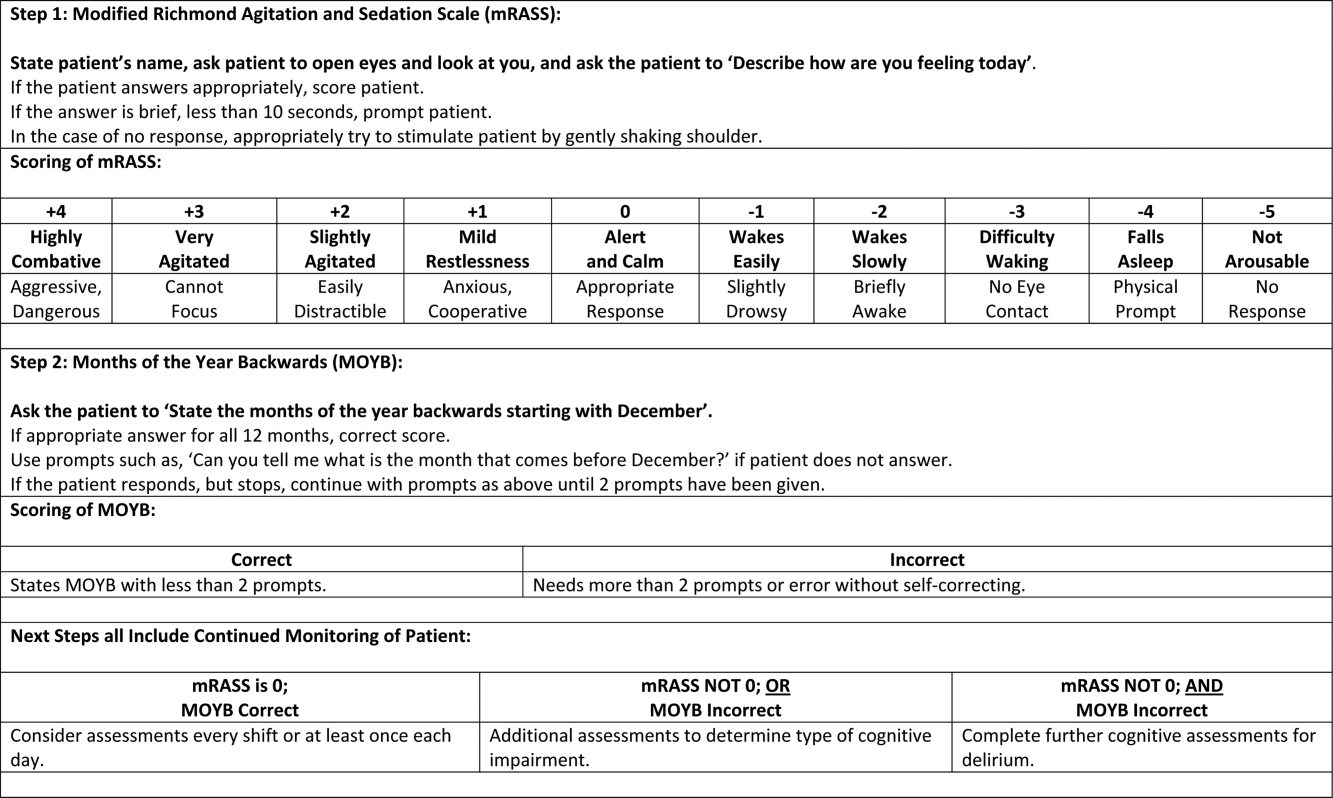
The quality improvement design of this project allowed the recording of outcomes in those who were unable or refused to complete the screening. This may be a potentially high‐risk group who would otherwise go unnoticed. A recent editorial from the American and European Delirium Societies highlights that individuals who are unable or refuse to complete testing due to impaired arousal are neglected in the most recent American Psychiatric Association Diagnostic and Statistical Manual of Mental Disorders, Fifth Edition definition of delirium.[18] Further work to identify and intervene on behalf of individuals who are unable to complete testing will aid in understanding arousal and its relationship to delirium and other disorders.
This analysis provides additional insight in the selection of measures of arousal and attention. Level of arousal is a complex concept that involves components of awareness and alertness, including external stimuli and self‐awareness.[38, 39, 40] As an ultra‐brief measure of arousal level, the mRASS incorporates both external stimuli (asking an open‐ended question) and self‐awareness (describing current state) to determine basic cognitive function. Attention can be defined as the selection of stimuli for further cognitive processing.[40] Attention is an umbrella term referring to many cognitive processes, ranging from sustained attention and working memory to executive function such as set shifting and multitasking. Ultra‐brief measures of attention, such as MOYB, are basic tasks of sustained attention with components of working memory.[19] An alteration in attention may be indicative of a more significant global change in cognition[41] beyond basic cognitive function assessed by administration of the mRASS, such as delirium.[42] The relationship between level of arousal and attention is complex, and arguments have been made that one has to have a certain level of arousal to attend to a stimuli, whereas others have found that one has to have a certain level of attention.[18, 39, 40] Administration of both the mRASS and MOYB is a useful bedside tool for clinicians to examine both basic cognitive function and more complex tasks of attention.
The quality improvement nature of this work has limitations and strengths that deserve mention. The significant strength of this work is the robust sample size. Also, trained staff not involved in the direct clinical care of patients administered the cognitive screens, suggesting that nonclinically trained personnel could be utilized for risk assessment. The major limitation is the restricted amount of covariate data that were collected. Data for this project were collected to operationalize and demonstrate the impact and business case of a delirium risk modification program,[17] limiting the ability to perform adjustment for other covariates such as comorbidity and reason for admission. Also, due to the nature of this project, a diagnosis of delirium was not determined. A limitation of excluding in‐hospital deaths from the cost analysis was that some individuals at high risk died early, thus costing less overall. Generalizability is limited by an over‐representation of males within a single setting. Further use and understanding of mRASS and MOYB in other population is warranted and welcomed. Use of MOYB is also a limitation considering that scores are not standardized across patients or settings.[26] Data regarding administration time of either of these tools were not collected; therefore, determining that these are ultra‐brief assessments (<1 minute) is based on estimates. As such, these measures should not be the sole source of information for clinical evaluation and diagnosis.
CONCLUSION
This work found that impaired performance on brief cognitive assessments of arousal and attention in hospitalized patients were associated with restraint use, in‐hospital mortality, longer LOS, less discharge home, and hospital costs. Routine screening of older patients with brief, user‐friendly cognitive assessments upon admission can identify those who would benefit from additional assessment and intervention to alleviate individual and economic burdens.
Acknowledgements
The authors are indebted to the veterans who participated in their delirium and fall reduction programs. The authors are thankful for the guidance of the VA Boston Healthcare System Delirium Task Force and Patient Safety Officers for continued collaboration to improve outcomes for the veterans they serve.
Disclosures: Dr. Yevchak and Ms. Doherty contributed equally to this article and agreed to share first authorship. This material is based upon work supported by the Department of Veterans Affairs Office of Patient Safety Delirium Patient Safety Center of Inquiry and a Geriatrics and Extended Care T21 Alternative to Non‐institutional Long Term Care award. Archambault, Doherty, Fonda, Kelly, and Rudolph are employees of the US government. Dr. Rudolph also received support from a VA Career Development Award. The views expressed in this article are those of the authors and do not necessarily reflect the position or policy of the Department of Veterans Affairs or the United States Government. The authors report no conflicts of interest.
- , , , , , . Delirium superimposed on dementia predicts 12‐month survival in elderly patients discharged from a postacute rehabilitation facility. J Gerontol A Biol Sci Med Sci. 2007;62(11):1306–1309.
- , , , . Delirium superimposed on dementia is associated with prolonged length of stay and poor outcomes in hospitalized older adults. J Hosp Med. 2013;8(9):500–505.
- , , , et al. Impact and recognition of cognitive impairment among hospitalized elders. J Hosp Med. 2010;5(2):69–75.
- , , , et al. Association between endothelial dysfunction and acute brain dysfunction during critical illness. Anesthesiology. 2013;118(3):631–639.
- , , , et al. Delirium accelerates cognitive decline in Alzheimer disease. Neurology. 2009;72(18):1570–1575.
- , , , et al. Adverse outcomes after hospitalization and delirium in persons with Alzheimer disease. Ann Intern Med. 2012;156(12):848–856.
- , , , et al. Delirium: an independent predictor of functional decline after cardiac surgery. J Am Geriatr Soc. 2010;58(4):643–649.
- , . The importance of delirium: economic and societal costs. J Am Geriatr Soc. 2011;59:S241–S243.
- , , , , , . Managing delirium in the acute care setting: a pilot focus group study. Int J Older People Nurs. 2012;7(2):152–162.
- , , , et al. Barriers and facilitators to implementing delirium rounds in a clinical trial across three diverse hospital settings. Clin Nurs Res. 2014;23(2):201–215.
- , , , , , . Validation of the confusion assessment method in the palliative care setting. Palliat Med. 2009;23(1):40–45.
- , , , . Does this patient have delirium? Value of bedside instruments. JAMA. 2010;304(7):779–786.
- , , , et al. Three core domains of delirium validated using exploratory and confirmatory factor analyses. Psychosomatics. 2013;54(3):227–238.
- , , . A neurologist's approach to delirium: diagnosis and management of toxic metabolic encephalopathies. Eur J Intern Med. 2014;25(2):112–116.
- , , ; the VADWG. Serial administration of a modified Richmond Agitation and Sedation Scale for delirium screening. J Hosp Med. 2012;7(5):450–453.
- . The diagnostic performance of the Richmond Agitation Sedation Scale for detecting delirium in older emergency department patients. Acad Emerg Med. 2015;22(7):878–882.
- , , , et al. The Richmond Agitation Sedation Scale: validity and reliability in adult intensive care unit patients. Am J Respir Crit Care Med. 2002;166(10):1338–1344.
- European Delirium Association, American Delirium Society. The DSM‐5 criteria, level of arousal and delirium diagnosis: inclusiveness is safer. BMC Med. 2014;12:141.
- , , , , , . Pay attention! The critical importance of assessing attention in older adults with dementia. J Gerontol Nurs. 2012;38(11):23–27.
- , , . Delirium: a disorder of consciousness? Med Hypotheses. 2013;80(4):399–404.
- , , , et al. Attention! A good bedside test for delirium? J Neurol Neurosurg Psychiatry. 2014;85(10):1122–1131.
- , , . A delirium risk modification program is associated with hospital outcomes. J Am Med Dir Assoc. 2014;15(12):11.
- , , , et al. Impaired arousal in older adults is associated with prolonged hospital stay and discharge to skilled nursing facility. J Am Med Dir Assoc. 2015;16(7):586–589.
- , , , et al. Validation of the 4AT, a new instrument for rapid delirium screening: a study in 234 hospitalised older people. Age Ageing. 2014;43(4):496–502.
- , , , , , . Reliability of a structured assessment for nonclinicians to detect delirium among new admissions to postacute care. J Am Med Dir Assoc. 2006;7(7):412–415.
- , , , . Reciting the months of the year backwards: what is a ‘normal’ score? Age Ageing. 2015;44(3):537–538.
- , , . A Delirium risk modification program is associated with hospital outcomes. J Am Med Dir Assoc. 2014;15(12):957.e957–957.e911.
- , , , et al. 3D‐CAM: derivation and validation of a 3‐minute diagnostic interview for CAM‐defined delirium: a cross‐sectional diagnostic test study. Ann Intern Med. 2014;161(8):554–561.
- , , , , , . Reliability of a structured assessment for non‐clinicians to detect delirium among new admissions to post‐acute care. J Am Med Dir Assoc. 2006;7:412–415.
- , , , et al. Derivation and validation of a preoperative prediction rule for delirium after cardiac surgery. Circulation. 2009;119(2):229–236.
- , . Use of the Decision Support System for VA cost‐effectiveness research. Med Care. 1999;37(4 suppl Va):AS63–AS70.
- , , , , . Cost analysis in the Department of Veterans Affairs: consensus and future directions. Med Care. 1999;37(4 Suppl Va):AS3‐AS8.
- , , . Delirium: a symptom of how hospital care is failing older persons and a window to improve quality of hospital care. Am J Med. 1999;106(5):565–573.
- , , , et al. A multicomponent intervention to prevent delirium in hospitalized older patients. N Engl J Med. 1999;340(9):669–676.
- , , , . Iatrogenic causes of falls in hospitalised elderly patients: a case‐control study. Postgrad Med J. 2002;78(922):487–489.
- , , , , . A controlled quality improvement trial to reduce the use of physical restraints in older hospitalized adults. J Am Geriatr Soc. 2014;62(3):541–545.
- , , , . Evaluation of the mobile acute care of the elderly (mace) service. JAMA Intern Med. 2013;173(11):990–996.
- , . Conscience and consciousness: a definition. J Med Life. 2014;7(1):104–108.
- , , , et al. Consciousness in humans and non‐human animals: recent advances and future directions. Front Psychol. 2013;4:625.
- . Interdependence of attention and consciousness. In: Rahul B, Bikas KC, eds. Progress in Brain Research. Vol. 168. New York, NY: Elsevier; 2007:65–75.
- , , . Relationship between cognitive and non‐cognitive symptoms of delirium. Asian J Psychiatr. 2013;6(2):106–112.
- , , , , , . Clarifying confusion: the confusion assessment method. A new method for detection of delirium. Ann Intern Med. 1990;113(12):941–948.
Hospitalization is a critical time for older patients with cognitive impairment. Past research has found that hospitalized older adults with cognitive dysfunction have more rapid cognitive decline, increased morbidity and mortality, and higher costs of healthcare utilization.[1, 2, 3] Those with preexisting cognitive dysfunction, such as dementia, are most susceptible to the negative impacts of hospitalization.[4, 5, 6, 7, 8] Identification of cognitive deficits upon admission is important for risk stratification of patients and prevention of negative hospital health events.
Frontline healthcare providers are underequipped to detect acute cognitive dysfunction.[9, 10] Current practice and research for the detection of cognitive dysfunction in the acute care setting utilizes instruments that require training[11] and are relatively lengthy (>5 minutes).[12] Although these cognitive screening tests are accurate and reliable, the time requirement is not feasible in a fast‐paced clinical setting. A possible alternative is the use of ultra‐brief cognitive screening instruments (<1 minute) that have the potential to identify those individuals requiring additional evaluation and follow‐up. These brief instruments are composed of screening tools that emphasize core features of acute cognitive dysfunction such as level of arousal or attention.[13, 14, 15, 16] Arousal, the ability to respond to or interact with the environment,[15] is an important component of cognition because it is generally preserved in chronic cognitive disorders (eg, dementia). Thus, an alteration in arousal may be a harbinger of more acute impairment[17] in need of evaluation, and in these lowered states of arousal it may be difficult to test for attention.[18] Attention is a broadly defined cognitive domain indicating focus.[19] Older adults, regardless of preexisting cognitive dysfunction, warrant additional cognitive testing if levels of arousal or attention are altered[20, 21] due to the significant relationship to delirium, which is associated with adverse events in this population. Recent research has demonstrated that these brief cognitive screening instruments provide information about the risk for delirium and are a strong test for clinical characteristics of delirium.[16, 21]
The purpose of this analysis was to demonstrate the clinical outcomes of poor performance on ultrabrief assessments arousal and attention by frontline staff using a quality improvement database. Specific objectives include determining (1) the association of poor performance on brief cognitive assessments and hospital outcomes and (2) the inter‐relationship between alterations in the levels of arousal and attention on in‐hospital and discharge outcomes.
METHODS
Setting and Study Design
This is a secondary analysis of data collected from a quality improvement program for delirium risk modification.[22] This program collected data from October 2010 until September 2012 at a Veterans Affairs (VA) tertiary referral center for the New England region. Patients aged 60 years or older and admitted to medical wards were screened upon admission or transfer to VA Boston Healthcare System and provided appropriate interventions to modify delirium risk. Excluded were individuals admitted as observational status, or those readmitted within 30 days of initial screening, and those screened more than 72 hours after admission. Age and sex were abstracted from the medical record. Outcome data were collected from the medical record for the purpose of operating and sustaining the program. In a previous article, the length of stay (LOS) outcome was reported in a subset of this population.[23] The analysis presented here includes the full cohort, presents the interaction with month of the year backward (MOYB), and provides additional outcomes not included in the other article. The VA institutional review board (IRB) reviewed and approved the secondary data analysis of the quality improvement project.
Measures
Brief Cognitive Screening
The baseline assessments of levels of arousal and attention were collected within 72 hours of admission to identify delirium risk. Trained study staff, not involved in the clinical care of patients, administered these assessments as part of the quality improvement project. It is estimated that these assessments took less than 1 minute to complete per individual, but actual administration time was not measured. Assessments were documented within the electronic health record as part of a delirium risk stratification system.
Arousal
The arousal level assessment was the modified Richmond Agitation and Sedation Scale (mRASS). The mRASS is a brief, reliable, observational tool used to determine arousal level.[15, 17] It is a text modification of the RASS[17] for less acutely ill patients, capturing hyperactive and hypoactive altered levels of arousal. The mRASS asks an open‐ended question followed by observation for 10 seconds and completion of a 5 to+4 rating scale. Alert and calm (score=0) is considered normal, with positive numbers related to an increased level of arousal and attention, whereas negative numbers denote decreased levels. For the analyses, an mRASS of 0 is utilized as the reference. Categories were collapsed into 2 and 2 due to few patients on the extremes of the mRASS.
Attention
The MOYB is a brief measure of attention that is included in several instruments for delirium.[19, 24, 25] For this study, the patient was asked to recite the 12 months backward beginning with December. A correct score was given if the individual was able to recite all 12 months to January without any error. An incorrect score was given if any mistake was made. Scoring for the MOYB is not standardized by age, preexisting medical diagnosis, or any other rational.[26] Others have used July or June as a cutoff for a correct score on the MOYB,[21, 25] but a more conservative score of correct to January was used in this study, which has been previously used.[26, 27, 28, 29, 30] A score of not completed was given when the patient was unable to participate or declined to complete the assessment. For the analysis, a correct score on the MOYB is the referent group.
Outcomes
In‐hospital outcomes included (1) restraint use and (2) in‐hospital mortality. Physical restraint use was identified by focused medical record review and identification of required restraint documentation, which, by center policy requires daily review and documentation. Any restraint use during the hospitalization was included.
Discharge outcomes included (1) LOS, (2) discharge other than a location to home, and (3) variable direct costs. LOS was calculated from date of admission until date of discharge. Discharge disposition was identified in the electronic medical record discharge documentation and categorized into discharge to the prehospital residence (home) or not. Hospital variable direct costs were collected from the VA decision support system,[31] a centrally maintained administrative database. The VA decision support system is challenged with accounting for costs of a single‐day admission and patients who are hospitalized from VA long‐term care. To address the missing data from these cases, multiple imputations (n=20) of the missing data were performed.[32] Sensitivity analyses were performed to determine the impact of the imputation and the cost analysis strategy (see Supporting Information, Appendix 1, in the online version of this article).
Statistical Analyses
For this analysis, outcomes are reported at each level of performance on the mRASS (1 to1) and MOYB (correct, incorrect, not completed). For each analysis, the performance with a mean and standard deviation (SD) are reported for continuous outcomes and a percentage for dichotomous outcomes. For dichotomous outcomes, including restraint use, in‐hospital mortality, and discharge disposition, a risk ratio (RR) with 95% confidence interval (CI) is presented. The median is presented for the cost data because variable direct cost is highly skewed. For LOS and cost outcomes, unadjusted incident rate ratio (IRR) from a Poisson regression relative to the referent is presented to compare the categories. A Poisson regression was selected because LOS (a count of days) and variable direct costs (a count of dollars) are highly skewed. The output of Poisson regression produces an IRR and 95% CI relative to the referent group. The Poisson regression could not be adjusted because the quality improvement nature of these data limited the number of covariates collected. Sensitivity analyses did not identify significant interactions of age and sex (results not shown).
MOYB was also compared by level of arousal (mRASS=0 vs all others). Due to the relatively few patients with positive mRASS, it was compressed into a category of abnormal mRASS relative to alert and calm. Similar to the previous analyses, Poisson regression was performed to calculate the IRR (95% CI) relative to correct MOYB for the continuous variables. An RR was calculated for the dichotomous variables. All statistical analyses were performed using Stata version 11.0 (StataCorp, College Station, TX).
RESULTS
Population Description
Over the 2‐year project timeline, a total of 3232 unique individual records were analyzed (Table 1). Patients admitted and screened within the prior 30 days (n=501) and patients screened more than 3 days after admission (n=664) were not included in the analysis. Older adults were on average 74.7 years old (SD=9.8), and 98.2% were male, consistent with the veteran population. Altered level of arousal, as defined by an abnormal mRASS score, was found in 15.3% of the population. Average LOS was 5.2 days (SD=5.6), restraint use occurred in 5.5% during the hospital stay, patients were likely to be discharged home (71.7%), and a small portion died during hospitalization (1.3%). Mean variable direct costs were $11,084 with expected variability (SD=$15,682, median $6,614). Patients who died during the hospital stay had significantly longer LOS (mean 16.8 [SD=12.5] vs 5.1 [SD=5.4] days, P<0.001) and higher variable direct costs ($43,879 [SD=$37,334] vs $12,544 [SD=$16,802], P<0.001), justifying their removal from these analyses.
| Characteristic | Result, N=3,232, Mean (SD) or % (n) |
|---|---|
| |
| Age, y | 74.7 (9.8) |
| Male | 98.2 (3,174) |
| mRASS | |
| 2 | 2.0% (64) |
| 1 | 8.5% (273) |
| 0 | 84.7% (2,737) |
| 1 | 4.0% (131) |
| 2 | 0.8% (27) |
| MOYB | |
| Correct | 48.8% (1,578) |
| Incorrect | 45.1% (1,457) |
| Not completed | 6.1% (197) |
| Restraint use | 5.5% (177) |
| In‐hospital mortality | 1.3% (41) |
| Length of stay, da | 5.1 (5.4) |
| Discharge other than homea | 71.7% (2,292) |
| Variable direct hospital cost, $a | 11,084 (15,682) |
| Median cost, $ | 6,614 |
Impact of Altered Level of Arousal on Outcomes
There is an association between a deviation from a normal level of arousal (mRASS not equal to 0) and worsening outcomes (Table 2). Relative to a normal level of arousal (4.9SD 5.2 days), decreased level of arousal (negative mRASS), and increased arousal (positive mRASS) resulted in longer LOS (6.0SD 5.6 days, 5.7SD 6.8 days, respectively). Similarly, increased or decreased arousal was associated with heightened risk of restraints and less frequent discharge to home. In‐hospital mortality and hospital variable direct costs were significantly higher in those with decreased levels of arousal (IRR: 2.8, 95% CI: 1.36.0; IRR: 1.10, 95% CI: 0.951.26, respectively). The pattern does not hold for increased arousal with respect to in‐hospital mortality and variable direct hospital cost outcomes. The unadjusted analysis found that, relative to normal arousal, there is a significant change in outcomes with decreased levels of arousal. Increased arousal is associated with worsened IRR in LOS, restraint use, and discharge home, but not in‐hospital mortality and variable direct cost.
| mRASS Alert and Calm, n=2,737 | mRASS Negative, n=337 | mRASS Positive, n=158 | ||||
|---|---|---|---|---|---|---|
| Value | IRR/RR (95%CI) | Value | IRR/RR (95% CI) | Value | IRR/RR (95% CI) | |
| ||||||
| Restraint use % (n) | 4.2% (114) | Referent | 10.4% (35) | 2.49 (1.743.57) | 17.7% (28) | 4.25 (2.916.23) |
| In‐hospital mortality % (n) | 1.0% (26) | Referent | 2.7% (9) | 2.81 (1.335.95) | 1.3% (2) | 1.33 (0.325.56) |
| Length of stay, d (SD)a | 4.9 (5.2) | Referent | 6.0 (5.6) | 1.24 (1.181.30) | 5.7 (6.8) | 1.17 (1.091.25) |
| Discharge other than home, % (n)a | 24.9% (675) | Referent | 46.7% (153) | 1.87 (1.642.14) | 48.1% (75) | 1.93 (1.612.30) |
| Variable direct cost, $ (SD)a, b | 10,581 (14,928) | Referent | 11,604 (13,852) | 1.10 (0.951.26) | 10,640 (10,771) | 1.01 (0.851.19) |
| Median cost, $ | 6,318 | 7,738 | 7,858 | |||
Impact of Altered Attention on Outcomes
Patients who completed the MOYB incorrectly had increased restraint use (RR: 2.11, 95% CI 1.443.11) and LOS (IRR: 1.06, 95% CI: 1.021.10), but no difference in in‐hospital mortality, discharge home (RR: 0.78, 95% CI: 0.750.82), and variable direct costs, relative to those who completed the MOYB correctly (Table 3). Importantly, patients who did not complete the MOYB assessment had a 2‐fold increase in restraint use (RR: 2.05, 95% CI: 0.944.50), in‐hospital mortality was nearly 6‐fold higher (RR: 6.36, 95% CI: 2.1618.69), longer LOS (IRR: 1.12, 95% CI: 1.031.21), and returned home less frequently (RR: 1.77, 95% CI: 1.262.48).
| mRASS Normal | mRASS Abnormal | |||||||||||
|---|---|---|---|---|---|---|---|---|---|---|---|---|
| MOYB Correct (n=1,431) | MOYB Incorrect (n=1,181) | MOYB Incomplete (n=125) | MOYB Correct (n=147) | MOYB Incorrect (n=276) | MOYB Incomplete (n=72) | |||||||
| Value | IRR/RR (95% CI) | Value | IRR/RR (95% CI) | Value | IRR/RR (95% CI) | Value | IRR/RR (95% CI) | Value | IRR/RR (95% CI) | Value | IRR/RR (95% CI) | |
| ||||||||||||
| Restraint use, % (n) | 2.7% (39) | Referent | 5.8% (68) | 2.11 (1.44‐3.11) | 5.6% (7) | 2.05 (0.94‐4.50) | 2.7% (4) | 1.00 (0.36‐2.75) | 13.8% (38) | 5.05 (3.29‐7.75) | 29.2% (21) | 10.70 (6.66‐17.20) |
| In‐hospital mortality, % (n) | 0.6% (9) | Referent | 1.0% (12) | 1.62 (0.68‐ 3.82) | 4.0% (5) | 6.36 (2.16‐18.69) | 1.4% (2) | 2.16 (0.47‐9.92) | 2.2% (6) | 3.46 (1.24‐9.63) | 4.2% (3) | 6.63 (1.83‐23.95) |
| Length of stay, d (SD)a | 4.7 (5.4) | Referent | 5.0 (5.1) | 1.06 (1.02‐1.10) | 5.3 (5.0) | 1.12 (1.03‐1.21) | 5.4 (6.0) | 1.13 (1.05‐1.22) | 5.9 (4.4) | 1.23 (1.17‐1.30) | 7.5 (10.0) | 1.55 (1.44‐1.73) |
| Discharge other than home, % (n)a | 17.9% (255) | Referent | 32.7% (382) | 1.82 (1.56‐ 2.14) | 31.7% (38) | 1.77 (1.26‐2.48) | 29.7% (43) | 1.65 (1.20‐2.28) | 53.3% (144) | 2.97 (2.42‐3.64) | 59.4% (41) | 3.31 (2.38‐4.61) |
| Variable direct cost, $ (SD)a, b | 10,609 (16,154) | Referent | 10,482 (13,495) | 0.99 (0.89‐1.10) | 11,213 (12,994) | 1.06 (0.85‐1.32) | 12,010 (15,636) | 1.13 (0.90‐1.42) | 10,776 (10,680) | 1.02 (0.88‐1.17) | 11,815 (14,604) | 1.11 (0.82‐1.51) |
| Median cost, $ | 6,338 | 6,248 | 6,630 | 7,023 | 8,093 | 8,180 | ||||||
Inter‐relationship of Altered Level of Arousal and Attention on Outcomes
The inter‐relationship of altered level of arousal and attention is presented in Table 3. Of patients with a normal mRASS, 52% had correct MOYB. The percentage of correct MOYB declined with the level of arousal, such that 38% had normal MOYB and a mRASS of 1 and 9% had normal MOYB with mRASS of 2. In general, in‐hospital outcomes (restraints and mortality) are associated with MOYB performance, and discharge outcomes (LOS, discharge location, and variable direct costs) are associated with mRASS. Those patients who did not complete the MOYB demonstrated worse outcomes, regardless of mRASS performance, including a 6‐fold increase in mortality and significant increases in LOS and discharge location.
DISCUSSION
Impaired performance on a one‐time assessment of arousal or attention during hospitalization demonstrated a relationship with in‐hospital and discharge outcomes. Relative to normal levels of arousal and attention, alterations in attention, level of arousal, or both were associated with progressively negative consequences. Combined with the prognostic value, the administration of ultra‐brief cognitive screening measures may have value in the identification of patients who would benefit from additional screening, supporting prior work in this area.[23] The brevity of the assessments enhances clinical utility and implementation potential.
Cognitive function during hospitalization has been associated with many negative outcomes including delirium, falls, pressure ulcers, and functional decline.[3, 33, 34, 35, 36, 37] The findings of this analysis are consistent with previous studies and provide important clinical implications. First, prior work in cognitive screening has focused on more time‐consuming instruments.[12] By focusing on brief instruments, particularly those under 1 minute that do not require paper or props, a user‐friendly tool that is associated with health outcomes is provided.
In addition, this analysis demonstrates that each assessment, when used individually, has some prognostic significance associated with the identification of delirium or other types of cognitive impairment. When used alone, abnormal scores on the mRASS or MOYB may be indicative of individuals requiring further cognitive assessment, supporting previous research.[16, 23] Individuals with abnormal scores on both the mRASS and MOYB identify a high‐risk group in need of further clinical assessment for delirium (Figure 1). Neither of these assessments are meant to be used as the only means to diagnosis delirium, but together they identify key clinical characteristics of delirium (arousal and attention).[16, 18, 21] Considering the significant negative consequences associated with delirium, it is not surprising that tools identifying core features of delirium, such as those presented here, would also be associated with in‐hospital and discharge outcomes.
The quality improvement design of this project allowed the recording of outcomes in those who were unable or refused to complete the screening. This may be a potentially high‐risk group who would otherwise go unnoticed. A recent editorial from the American and European Delirium Societies highlights that individuals who are unable or refuse to complete testing due to impaired arousal are neglected in the most recent American Psychiatric Association Diagnostic and Statistical Manual of Mental Disorders, Fifth Edition definition of delirium.[18] Further work to identify and intervene on behalf of individuals who are unable to complete testing will aid in understanding arousal and its relationship to delirium and other disorders.
This analysis provides additional insight in the selection of measures of arousal and attention. Level of arousal is a complex concept that involves components of awareness and alertness, including external stimuli and self‐awareness.[38, 39, 40] As an ultra‐brief measure of arousal level, the mRASS incorporates both external stimuli (asking an open‐ended question) and self‐awareness (describing current state) to determine basic cognitive function. Attention can be defined as the selection of stimuli for further cognitive processing.[40] Attention is an umbrella term referring to many cognitive processes, ranging from sustained attention and working memory to executive function such as set shifting and multitasking. Ultra‐brief measures of attention, such as MOYB, are basic tasks of sustained attention with components of working memory.[19] An alteration in attention may be indicative of a more significant global change in cognition[41] beyond basic cognitive function assessed by administration of the mRASS, such as delirium.[42] The relationship between level of arousal and attention is complex, and arguments have been made that one has to have a certain level of arousal to attend to a stimuli, whereas others have found that one has to have a certain level of attention.[18, 39, 40] Administration of both the mRASS and MOYB is a useful bedside tool for clinicians to examine both basic cognitive function and more complex tasks of attention.
The quality improvement nature of this work has limitations and strengths that deserve mention. The significant strength of this work is the robust sample size. Also, trained staff not involved in the direct clinical care of patients administered the cognitive screens, suggesting that nonclinically trained personnel could be utilized for risk assessment. The major limitation is the restricted amount of covariate data that were collected. Data for this project were collected to operationalize and demonstrate the impact and business case of a delirium risk modification program,[17] limiting the ability to perform adjustment for other covariates such as comorbidity and reason for admission. Also, due to the nature of this project, a diagnosis of delirium was not determined. A limitation of excluding in‐hospital deaths from the cost analysis was that some individuals at high risk died early, thus costing less overall. Generalizability is limited by an over‐representation of males within a single setting. Further use and understanding of mRASS and MOYB in other population is warranted and welcomed. Use of MOYB is also a limitation considering that scores are not standardized across patients or settings.[26] Data regarding administration time of either of these tools were not collected; therefore, determining that these are ultra‐brief assessments (<1 minute) is based on estimates. As such, these measures should not be the sole source of information for clinical evaluation and diagnosis.
CONCLUSION
This work found that impaired performance on brief cognitive assessments of arousal and attention in hospitalized patients were associated with restraint use, in‐hospital mortality, longer LOS, less discharge home, and hospital costs. Routine screening of older patients with brief, user‐friendly cognitive assessments upon admission can identify those who would benefit from additional assessment and intervention to alleviate individual and economic burdens.
Acknowledgements
The authors are indebted to the veterans who participated in their delirium and fall reduction programs. The authors are thankful for the guidance of the VA Boston Healthcare System Delirium Task Force and Patient Safety Officers for continued collaboration to improve outcomes for the veterans they serve.
Disclosures: Dr. Yevchak and Ms. Doherty contributed equally to this article and agreed to share first authorship. This material is based upon work supported by the Department of Veterans Affairs Office of Patient Safety Delirium Patient Safety Center of Inquiry and a Geriatrics and Extended Care T21 Alternative to Non‐institutional Long Term Care award. Archambault, Doherty, Fonda, Kelly, and Rudolph are employees of the US government. Dr. Rudolph also received support from a VA Career Development Award. The views expressed in this article are those of the authors and do not necessarily reflect the position or policy of the Department of Veterans Affairs or the United States Government. The authors report no conflicts of interest.
- , , , , , . Delirium superimposed on dementia predicts 12‐month survival in elderly patients discharged from a postacute rehabilitation facility. J Gerontol A Biol Sci Med Sci. 2007;62(11):1306–1309.
- , , , . Delirium superimposed on dementia is associated with prolonged length of stay and poor outcomes in hospitalized older adults. J Hosp Med. 2013;8(9):500–505.
- , , , et al. Impact and recognition of cognitive impairment among hospitalized elders. J Hosp Med. 2010;5(2):69–75.
- , , , et al. Association between endothelial dysfunction and acute brain dysfunction during critical illness. Anesthesiology. 2013;118(3):631–639.
- , , , et al. Delirium accelerates cognitive decline in Alzheimer disease. Neurology. 2009;72(18):1570–1575.
- , , , et al. Adverse outcomes after hospitalization and delirium in persons with Alzheimer disease. Ann Intern Med. 2012;156(12):848–856.
- , , , et al. Delirium: an independent predictor of functional decline after cardiac surgery. J Am Geriatr Soc. 2010;58(4):643–649.
- , . The importance of delirium: economic and societal costs. J Am Geriatr Soc. 2011;59:S241–S243.
- , , , , , . Managing delirium in the acute care setting: a pilot focus group study. Int J Older People Nurs. 2012;7(2):152–162.
- , , , et al. Barriers and facilitators to implementing delirium rounds in a clinical trial across three diverse hospital settings. Clin Nurs Res. 2014;23(2):201–215.
- , , , , , . Validation of the confusion assessment method in the palliative care setting. Palliat Med. 2009;23(1):40–45.
- , , , . Does this patient have delirium? Value of bedside instruments. JAMA. 2010;304(7):779–786.
- , , , et al. Three core domains of delirium validated using exploratory and confirmatory factor analyses. Psychosomatics. 2013;54(3):227–238.
- , , . A neurologist's approach to delirium: diagnosis and management of toxic metabolic encephalopathies. Eur J Intern Med. 2014;25(2):112–116.
- , , ; the VADWG. Serial administration of a modified Richmond Agitation and Sedation Scale for delirium screening. J Hosp Med. 2012;7(5):450–453.
- . The diagnostic performance of the Richmond Agitation Sedation Scale for detecting delirium in older emergency department patients. Acad Emerg Med. 2015;22(7):878–882.
- , , , et al. The Richmond Agitation Sedation Scale: validity and reliability in adult intensive care unit patients. Am J Respir Crit Care Med. 2002;166(10):1338–1344.
- European Delirium Association, American Delirium Society. The DSM‐5 criteria, level of arousal and delirium diagnosis: inclusiveness is safer. BMC Med. 2014;12:141.
- , , , , , . Pay attention! The critical importance of assessing attention in older adults with dementia. J Gerontol Nurs. 2012;38(11):23–27.
- , , . Delirium: a disorder of consciousness? Med Hypotheses. 2013;80(4):399–404.
- , , , et al. Attention! A good bedside test for delirium? J Neurol Neurosurg Psychiatry. 2014;85(10):1122–1131.
- , , . A delirium risk modification program is associated with hospital outcomes. J Am Med Dir Assoc. 2014;15(12):11.
- , , , et al. Impaired arousal in older adults is associated with prolonged hospital stay and discharge to skilled nursing facility. J Am Med Dir Assoc. 2015;16(7):586–589.
- , , , et al. Validation of the 4AT, a new instrument for rapid delirium screening: a study in 234 hospitalised older people. Age Ageing. 2014;43(4):496–502.
- , , , , , . Reliability of a structured assessment for nonclinicians to detect delirium among new admissions to postacute care. J Am Med Dir Assoc. 2006;7(7):412–415.
- , , , . Reciting the months of the year backwards: what is a ‘normal’ score? Age Ageing. 2015;44(3):537–538.
- , , . A Delirium risk modification program is associated with hospital outcomes. J Am Med Dir Assoc. 2014;15(12):957.e957–957.e911.
- , , , et al. 3D‐CAM: derivation and validation of a 3‐minute diagnostic interview for CAM‐defined delirium: a cross‐sectional diagnostic test study. Ann Intern Med. 2014;161(8):554–561.
- , , , , , . Reliability of a structured assessment for non‐clinicians to detect delirium among new admissions to post‐acute care. J Am Med Dir Assoc. 2006;7:412–415.
- , , , et al. Derivation and validation of a preoperative prediction rule for delirium after cardiac surgery. Circulation. 2009;119(2):229–236.
- , . Use of the Decision Support System for VA cost‐effectiveness research. Med Care. 1999;37(4 suppl Va):AS63–AS70.
- , , , , . Cost analysis in the Department of Veterans Affairs: consensus and future directions. Med Care. 1999;37(4 Suppl Va):AS3‐AS8.
- , , . Delirium: a symptom of how hospital care is failing older persons and a window to improve quality of hospital care. Am J Med. 1999;106(5):565–573.
- , , , et al. A multicomponent intervention to prevent delirium in hospitalized older patients. N Engl J Med. 1999;340(9):669–676.
- , , , . Iatrogenic causes of falls in hospitalised elderly patients: a case‐control study. Postgrad Med J. 2002;78(922):487–489.
- , , , , . A controlled quality improvement trial to reduce the use of physical restraints in older hospitalized adults. J Am Geriatr Soc. 2014;62(3):541–545.
- , , , . Evaluation of the mobile acute care of the elderly (mace) service. JAMA Intern Med. 2013;173(11):990–996.
- , . Conscience and consciousness: a definition. J Med Life. 2014;7(1):104–108.
- , , , et al. Consciousness in humans and non‐human animals: recent advances and future directions. Front Psychol. 2013;4:625.
- . Interdependence of attention and consciousness. In: Rahul B, Bikas KC, eds. Progress in Brain Research. Vol. 168. New York, NY: Elsevier; 2007:65–75.
- , , . Relationship between cognitive and non‐cognitive symptoms of delirium. Asian J Psychiatr. 2013;6(2):106–112.
- , , , , , . Clarifying confusion: the confusion assessment method. A new method for detection of delirium. Ann Intern Med. 1990;113(12):941–948.
© 2015 Society of Hospital Medicine

Modified RASS for Identifying Delirium
Vital signs constitute a fundamental component of the physical examination and serve key diagnostic and monitoring purposes. The brain is as vital to life as the cardiovascular, respiratory, and immune/thermoregulatory systems, yet currently no vital sign exists that would allow rapid, reliable, and easily reproducible assessment of cognition.1 As a result, acute mental status changes frequently go undetected and untreated.24 Delirium is defined as an acute change in attention with fluctuations in cognition, thought, and/or consciousness throughout the course of the day.5 Because delirium in older patients is common and is associated with increased morbidity, mortality, functional decline, and costs,69 development and validation of a rapid, objective screening assessment could be used by nursing staff to identify patients at high risk for delirium.
Current recommendations for inpatient delirium monitoring usually involve daily cognitive screening with a standardized screening instrument.6 Because this process is often time‐consuming (8‐12 minutes), most patients do not undergo routine screening. To facilitate clinical implementation, we focused on developing a brief (<30‐second) inpatient screening measure of a feature of mental status that could be administered serially. The purpose of this study was to (1) develop a brief screening tool for a core feature of mental status and (2) validate this screening tool for delirium in an older inpatient population.
METHODS
Consensus Panel
In June 2009, the Veterans Administration sponsored an interdisciplinary conference that solicited input on identifying the most targetable components of delirium and discussing potential clinical instruments. Following this, a consensus panel of 8 representatives from medicine, geriatrics, nursing, psychiatry, and psychology used a modified Delphi method to target characteristic features of delirium and identify instruments that could best capture mental status change. While inattention was agreed upon as the core cognitive feature of delirium, the group came to consensus that capturing the acute onset and fluctuating nature of delirium was better suited as a vital sign. To meet these criteria, the group modified the Richmond Agitation Sedation Scale (RASS).10
The RASS is an observational instrument that has been validated in the intesive care unit setting for objectively determining level of sedation. It has been shown to be highly reliable and associated with delirium.11 The RASS is a quick, objective scale of consciousness with a scoring system that captures both hyperactive and hypoactive levels of consciousness. A disadvantage of using the RASS includes its limited attention assessment. The Consensus panel modified the RASS to improve its assessment of attention, using a brief open‐ended question that was asked before scoring (Figure 1).

Participants
For this prospective validation study, we recruited 95 medical patients 65 years of age who had been admitted to a VA hospital. The study was approved by the institutional review board, and participants provided written informed consent. Patients were excluded if they refused (n = 64), anticipated leaving the hospital within 1 day (n = 42), or had vision or cognition impairments that would prevent their ability to complete informed consent forms and cognitive screening tools (n = 19). Five participants were discharged between enrollment and expert assessment.
Mental Status Assessments
After enrollment, 3 study staff members visited each participant independently. First, the trained research assistant obtained informed consent and demographic, cognitive, and functional assessments. The mini‐mental state examination was then administered to provide a baseline measure of cognitive function at the time of admission.12 A nurse‐interviewer later administered the modified RASS (mRASS) separately. Finally, a delirium expert performed an independent comprehensive mental status interview including assessments of attention, executive function, memory, and mood. Delirium was diagnosed by the delirium expert according to DSM‐IV criteria.5 Each investigator was blinded to the others' ratings. After the initial assessments, each participant was visited daily throughout the hospitalization by an mRASS assessor and, independently, by the delirium expert.
To determine inter‐rater reliability, 60 participants were evaluated with the mRASS by the trained research assistant and the nurse‐interviewer simultaneously. The mRASS was scored independently and the assessors were blinded to each others' ratings.
Statistics
The paired mRASS‐delirium assessments were analyzed in 3 ways: (1) as single‐day independent assessments; (2) longitudinally as a change from baseline including prevalent delirium; and (3) longitudinally as a change from baseline, excluding prevalent delirium cases. We examined 1‐point and 2‐point changes on the mRASS from baseline, which allowed determination of the most appropriate cut‐point for clinical use. Sensitivity, specificity, and likelihood ratios were calculated. The C‐statistic was calculated using absolute mRASS score for the single‐time assessments, and as a difference between minimum and maximum mRASS for the longitudinal analyses.
RESULTS
Characteristics of the study population are presented in Table 1. Because this was a VA population, the vast majority (94%) of participants were men, with a mean age of 81 years (range, 66‐96 years), and 89% were white. This population had a high Charlson Comorbidity Index (mean SD, 4.0 2.4), which was reflected in functional assessments, with 37% reporting difficulty with activities of daily living and 58% reporting difficulty with instrumental activities of daily living. Despite the age and comorbidity, delirium prevalence was 11% (n = 10) and incidence was 14% (n = 13). Interrater reliability of the mRASS yielded 98% agreement with a weighted kappa of 0.48 (P < 0.001).
| Characteristics | Values |
|---|---|
| |
| Age, years, mean (SD) | 81.0 (7.3) |
| Gender, male, no. (%) | 89 (94) |
| Race, white, no. (%) | 85 (89) |
| Charlson Comorbidity Index, mean (SD) | 4.0 (2.4) |
| BMI, kg/m2, mean (SD) | 27.2 (6.3) |
| Mini‐mental state examination, mean (SD) | 24.4 (4.1) |
| AUDIT, mean (SD) | 2.4 (2.9) |
| Tobacco use, pack‐years, no. (%) | 54 (56) |
| Current | 8 (8) |
| Never | 16 (17) |
| Prior | 68 (72) |
| Functional impairment, no. (%) | |
| Difficulty with 1 ADL | 35 (37) |
| Difficulty with 1 IADL | 55 (58) |
| Length of hospital stay | |
| Mean (SD), days | 6.3 (5.4) |
| Median, days | 5 |
| mRASS per patient, mean (SD) | 3.8 (3.3) |
When the mRASS was analyzed as a single‐day independent assessment, any abnormal score (ie, a score 0) had a sensitivity of 64% and a specificity of 93% for delirium relative to the expert evaluation (Table 2). With an abnormal mRASS as 2 or 2, the sensitivity fell to 34%, while the specificity increased to 99.6%.
| Criteria | mRASS | Sensitivity* (95% CI) | Specificity* (95% CI) | LR+ | LR |
|---|---|---|---|---|---|
| |||||
| Single‐day independent assessments | |||||
| Any abnormal | 63.9% (51.976.0) | 93.2% (90.396.4) | 9.4 | 0.4 | |
| RASS 2 or 2 | 34.4% (22.546.3) | 99.6% (98.8100) | 86 | 0.7 | |
| Longitudinal assessments | |||||
| Any delirium | Any change | 73.9% (56.091.9) | 91.7% (85.398.1) | 8.9 | 0.3 |
| Change in 2 points | 21.7% | 100% | 0.8 | ||
| Incident delirium | Any change | 84.6% (65.0100.0) | 91.7% (85.398.1) | 10.2 | 0.2 |
| Change in 2 points | 23.1% | 100% | 0.8 | ||
When the mRASS was used longitudinally to detect change in delirium during the hospital stay among all participants, it had a sensitivity of 74% and specificity of 92% for any change. Increasing the stringency of the criteria by looking at a change of 2 mRASS points decreased the sensitivity (22%) and increased the specificity (100%).
To capture the potential of the mRASS administered on a longitudinal basis as a diagnostic aid, the prevalent cases of delirium were excluded. In this analysis, any change in the mRASS had a sensitivity of 85% and a specificity of 92% for incident delirium. With more stringent criteria of a change of 2 points, the sensitivity was 23% and the specificity was 100%.
DISCUSSION
In this study, we developed a modified RASS (mRASS) for serial mental status assessment. Whereas a single measurement of the mRASS had modest sensitivity and good specificity for delirium, longitudinal measurement increased the sensitivity with no loss in specificity. Importantly, the <30 seconds required for the mRASS could be incorporated into daily workflow and provides an objective measure of consciousness. As such, we believe the mRASS can potentially serve as a longitudinal measure of consciousnessmuch like a vital sign for mental status.
Altered consciousness is a clinical and diagnostic feature of delirium,5, 13 and fluctuation in mental status is a diagnostic feature of delirium. As such, a screening instrument able to quantify the level of consciousness longitudinally and allow comparison to prior and subsequent determinations has face validity as a delirium screening instrument.
The mRASS has other features that make it appropriate for serial measurement in a manner similar to a vital sign. First, it objectively described consciousness on a scale, which is an improvement relative to many of the subjective descriptions clinically used. Consistent with other studies of the RASS,10, 11 the mRASS has good interrater reliability, allowing a common language to be used to describe level of consciousness across health care settings that can become the basis for a systematic and standardized monitor of cognitive change, improving continuity of care and communication between providers. It can be further used to objectively establish a patient's baseline and monitor change longitudinally.
The current study is limited by the lack of diversity and small size of the study population, which limits external validity (generalizability). Additional studies evaluating the utility of the mRASS by a variety of health care team members in a larger, more ethnically/racially diverse and heterogeneous population should be completed before we can determine if it can perform as a mental status vital sign, and if it is associated with better patient outcomes. Additionally, this study selected patients who were physically and cognitively capable of enrolling and excluded patients with severe cognitive and sensory impairment who were unable to provide consent to participate. Thus, some of the sickest, frailest, and most cognitively impaired patients were excluded. Unfortunately, this study therefore excluded a population significantly more vulnerable to the development of delirium.
Because a change in mental status (such as delirium) is common, morbid, and costly, a brief tool that can reliably and effectively assess mental status is needed. The mRASS used in this study provided an objective measurement of consciousness, a key component of mental status, and was demonstrated to reliably screen for presence or absence of delirium when administered longitudinally. Further study in diverse populations with administration by a variety of health care team members is needed to determine whether the mRASS can accurately serve as a mental status vital sign. If adopted widely, the mRASS could be used alongside the traditional vital signs to establish patient baselines, monitor change, improve provider communication, and potentially improve patient outcomes.
Acknowledgements
The authors are indebted to all of the veterans who willingly participated in this project. The VA Delirium Working Group Consensus Panel Consisted of Kenneth Boockvar, Joseph Flaherty, Sharon Gordon, Barbara Kamholz, James Rudolph, Marianne Shaughnessy, Kenneth Shay, and Joan Stein.
The authors maintained independence in the development, execution, and reporting of this study.
This article was presented in abstract form at the American Geriatrics Society Annual Meeting, May 12, 2011.
Funding: Jennifer G. Chester was funded by an Einstein Research Fellowship. James L. Rudolph is supported by a VA Rehabilitation Research Career Development Award. Additional support was provided by the American Federation for Aging Research, the Boston MSTAR, and National Institutes of Health grants AG 026781‐05 and AG 038027. James L. Rudolph and Mary Beth Harrington and the VA Delirium Working Group Consensus Panel are VA employees. The authors have no additional disclosures to report.
- ,.Vital signs in older patients: age‐related changes.J Am Med Dir Assoc.2011;12:337–343.
- ,,.Acute confusional states (delirium) in the hospitalized elderly.Annu Rev Gerontol Geriatr.1986;6:1–26.
- ,,,,.Underdiagnosis and poor documentation of acute confusional states in elderly hip fracture patients.J Am Geriatr Soc.1991;39:760–765.
- ,,,,.Nurses' recognition of delirium and its symptoms: comparison of nurse and researcher ratings.Arch Intern Med.2001;161:2467–2473.
- Diagnostic and Statistical Manual of Mental Disorders.4th ed.Washington, DC:American Psychiatric Association;1994.
- .Delirium in older persons.N Engl J Med.2006;354:1157–1165.
- ,,,,.One‐year health care costs associated with delirium in the elderly population.Arch Intern Med.2008;168:27–32.
- ,,,,.Delirium predicts 12‐month mortality.Arch Intern Med.2002;162:457–463.
- ,,, et al.Delirium: an independent predictor of functional decline after cardiac surgery.J Am Geriatr Soc.2010;58:643–649.
- ,,, et al.The Richmond Agitation‐Sedation Scale: validity and reliability in adult intensive care unit patients.Am J Respir Crit Care Med.2002;166:1338–1344.
- ,,, et al.Monitoring sedation status over time in ICU patients: reliability and validity of the Richmond Agitation‐Sedation Scale (RASS).JAMA.2003;289:2983–2991.
- ,,.“Mini‐mental state”. A practical method for grading the cognitive state of patients for the clinician.J Psychiatr Res.1975;12:189–198.
- ,,,,,.Clarifying confusion: the confusion assessment method. A new method for detection of delirium.Ann Intern Med.1990;113:941–948.
Vital signs constitute a fundamental component of the physical examination and serve key diagnostic and monitoring purposes. The brain is as vital to life as the cardiovascular, respiratory, and immune/thermoregulatory systems, yet currently no vital sign exists that would allow rapid, reliable, and easily reproducible assessment of cognition.1 As a result, acute mental status changes frequently go undetected and untreated.24 Delirium is defined as an acute change in attention with fluctuations in cognition, thought, and/or consciousness throughout the course of the day.5 Because delirium in older patients is common and is associated with increased morbidity, mortality, functional decline, and costs,69 development and validation of a rapid, objective screening assessment could be used by nursing staff to identify patients at high risk for delirium.
Current recommendations for inpatient delirium monitoring usually involve daily cognitive screening with a standardized screening instrument.6 Because this process is often time‐consuming (8‐12 minutes), most patients do not undergo routine screening. To facilitate clinical implementation, we focused on developing a brief (<30‐second) inpatient screening measure of a feature of mental status that could be administered serially. The purpose of this study was to (1) develop a brief screening tool for a core feature of mental status and (2) validate this screening tool for delirium in an older inpatient population.
METHODS
Consensus Panel
In June 2009, the Veterans Administration sponsored an interdisciplinary conference that solicited input on identifying the most targetable components of delirium and discussing potential clinical instruments. Following this, a consensus panel of 8 representatives from medicine, geriatrics, nursing, psychiatry, and psychology used a modified Delphi method to target characteristic features of delirium and identify instruments that could best capture mental status change. While inattention was agreed upon as the core cognitive feature of delirium, the group came to consensus that capturing the acute onset and fluctuating nature of delirium was better suited as a vital sign. To meet these criteria, the group modified the Richmond Agitation Sedation Scale (RASS).10
The RASS is an observational instrument that has been validated in the intesive care unit setting for objectively determining level of sedation. It has been shown to be highly reliable and associated with delirium.11 The RASS is a quick, objective scale of consciousness with a scoring system that captures both hyperactive and hypoactive levels of consciousness. A disadvantage of using the RASS includes its limited attention assessment. The Consensus panel modified the RASS to improve its assessment of attention, using a brief open‐ended question that was asked before scoring (Figure 1).
Participants
For this prospective validation study, we recruited 95 medical patients 65 years of age who had been admitted to a VA hospital. The study was approved by the institutional review board, and participants provided written informed consent. Patients were excluded if they refused (n = 64), anticipated leaving the hospital within 1 day (n = 42), or had vision or cognition impairments that would prevent their ability to complete informed consent forms and cognitive screening tools (n = 19). Five participants were discharged between enrollment and expert assessment.
Mental Status Assessments
After enrollment, 3 study staff members visited each participant independently. First, the trained research assistant obtained informed consent and demographic, cognitive, and functional assessments. The mini‐mental state examination was then administered to provide a baseline measure of cognitive function at the time of admission.12 A nurse‐interviewer later administered the modified RASS (mRASS) separately. Finally, a delirium expert performed an independent comprehensive mental status interview including assessments of attention, executive function, memory, and mood. Delirium was diagnosed by the delirium expert according to DSM‐IV criteria.5 Each investigator was blinded to the others' ratings. After the initial assessments, each participant was visited daily throughout the hospitalization by an mRASS assessor and, independently, by the delirium expert.
To determine inter‐rater reliability, 60 participants were evaluated with the mRASS by the trained research assistant and the nurse‐interviewer simultaneously. The mRASS was scored independently and the assessors were blinded to each others' ratings.
Statistics
The paired mRASS‐delirium assessments were analyzed in 3 ways: (1) as single‐day independent assessments; (2) longitudinally as a change from baseline including prevalent delirium; and (3) longitudinally as a change from baseline, excluding prevalent delirium cases. We examined 1‐point and 2‐point changes on the mRASS from baseline, which allowed determination of the most appropriate cut‐point for clinical use. Sensitivity, specificity, and likelihood ratios were calculated. The C‐statistic was calculated using absolute mRASS score for the single‐time assessments, and as a difference between minimum and maximum mRASS for the longitudinal analyses.
RESULTS
Characteristics of the study population are presented in Table 1. Because this was a VA population, the vast majority (94%) of participants were men, with a mean age of 81 years (range, 66‐96 years), and 89% were white. This population had a high Charlson Comorbidity Index (mean SD, 4.0 2.4), which was reflected in functional assessments, with 37% reporting difficulty with activities of daily living and 58% reporting difficulty with instrumental activities of daily living. Despite the age and comorbidity, delirium prevalence was 11% (n = 10) and incidence was 14% (n = 13). Interrater reliability of the mRASS yielded 98% agreement with a weighted kappa of 0.48 (P < 0.001).
| Characteristics | Values |
|---|---|
| |
| Age, years, mean (SD) | 81.0 (7.3) |
| Gender, male, no. (%) | 89 (94) |
| Race, white, no. (%) | 85 (89) |
| Charlson Comorbidity Index, mean (SD) | 4.0 (2.4) |
| BMI, kg/m2, mean (SD) | 27.2 (6.3) |
| Mini‐mental state examination, mean (SD) | 24.4 (4.1) |
| AUDIT, mean (SD) | 2.4 (2.9) |
| Tobacco use, pack‐years, no. (%) | 54 (56) |
| Current | 8 (8) |
| Never | 16 (17) |
| Prior | 68 (72) |
| Functional impairment, no. (%) | |
| Difficulty with 1 ADL | 35 (37) |
| Difficulty with 1 IADL | 55 (58) |
| Length of hospital stay | |
| Mean (SD), days | 6.3 (5.4) |
| Median, days | 5 |
| mRASS per patient, mean (SD) | 3.8 (3.3) |
When the mRASS was analyzed as a single‐day independent assessment, any abnormal score (ie, a score 0) had a sensitivity of 64% and a specificity of 93% for delirium relative to the expert evaluation (Table 2). With an abnormal mRASS as 2 or 2, the sensitivity fell to 34%, while the specificity increased to 99.6%.
| Criteria | mRASS | Sensitivity* (95% CI) | Specificity* (95% CI) | LR+ | LR |
|---|---|---|---|---|---|
| |||||
| Single‐day independent assessments | |||||
| Any abnormal | 63.9% (51.976.0) | 93.2% (90.396.4) | 9.4 | 0.4 | |
| RASS 2 or 2 | 34.4% (22.546.3) | 99.6% (98.8100) | 86 | 0.7 | |
| Longitudinal assessments | |||||
| Any delirium | Any change | 73.9% (56.091.9) | 91.7% (85.398.1) | 8.9 | 0.3 |
| Change in 2 points | 21.7% | 100% | 0.8 | ||
| Incident delirium | Any change | 84.6% (65.0100.0) | 91.7% (85.398.1) | 10.2 | 0.2 |
| Change in 2 points | 23.1% | 100% | 0.8 | ||
When the mRASS was used longitudinally to detect change in delirium during the hospital stay among all participants, it had a sensitivity of 74% and specificity of 92% for any change. Increasing the stringency of the criteria by looking at a change of 2 mRASS points decreased the sensitivity (22%) and increased the specificity (100%).
To capture the potential of the mRASS administered on a longitudinal basis as a diagnostic aid, the prevalent cases of delirium were excluded. In this analysis, any change in the mRASS had a sensitivity of 85% and a specificity of 92% for incident delirium. With more stringent criteria of a change of 2 points, the sensitivity was 23% and the specificity was 100%.
DISCUSSION
In this study, we developed a modified RASS (mRASS) for serial mental status assessment. Whereas a single measurement of the mRASS had modest sensitivity and good specificity for delirium, longitudinal measurement increased the sensitivity with no loss in specificity. Importantly, the <30 seconds required for the mRASS could be incorporated into daily workflow and provides an objective measure of consciousness. As such, we believe the mRASS can potentially serve as a longitudinal measure of consciousnessmuch like a vital sign for mental status.
Altered consciousness is a clinical and diagnostic feature of delirium,5, 13 and fluctuation in mental status is a diagnostic feature of delirium. As such, a screening instrument able to quantify the level of consciousness longitudinally and allow comparison to prior and subsequent determinations has face validity as a delirium screening instrument.
The mRASS has other features that make it appropriate for serial measurement in a manner similar to a vital sign. First, it objectively described consciousness on a scale, which is an improvement relative to many of the subjective descriptions clinically used. Consistent with other studies of the RASS,10, 11 the mRASS has good interrater reliability, allowing a common language to be used to describe level of consciousness across health care settings that can become the basis for a systematic and standardized monitor of cognitive change, improving continuity of care and communication between providers. It can be further used to objectively establish a patient's baseline and monitor change longitudinally.
The current study is limited by the lack of diversity and small size of the study population, which limits external validity (generalizability). Additional studies evaluating the utility of the mRASS by a variety of health care team members in a larger, more ethnically/racially diverse and heterogeneous population should be completed before we can determine if it can perform as a mental status vital sign, and if it is associated with better patient outcomes. Additionally, this study selected patients who were physically and cognitively capable of enrolling and excluded patients with severe cognitive and sensory impairment who were unable to provide consent to participate. Thus, some of the sickest, frailest, and most cognitively impaired patients were excluded. Unfortunately, this study therefore excluded a population significantly more vulnerable to the development of delirium.
Because a change in mental status (such as delirium) is common, morbid, and costly, a brief tool that can reliably and effectively assess mental status is needed. The mRASS used in this study provided an objective measurement of consciousness, a key component of mental status, and was demonstrated to reliably screen for presence or absence of delirium when administered longitudinally. Further study in diverse populations with administration by a variety of health care team members is needed to determine whether the mRASS can accurately serve as a mental status vital sign. If adopted widely, the mRASS could be used alongside the traditional vital signs to establish patient baselines, monitor change, improve provider communication, and potentially improve patient outcomes.
Acknowledgements
The authors are indebted to all of the veterans who willingly participated in this project. The VA Delirium Working Group Consensus Panel Consisted of Kenneth Boockvar, Joseph Flaherty, Sharon Gordon, Barbara Kamholz, James Rudolph, Marianne Shaughnessy, Kenneth Shay, and Joan Stein.
The authors maintained independence in the development, execution, and reporting of this study.
This article was presented in abstract form at the American Geriatrics Society Annual Meeting, May 12, 2011.
Funding: Jennifer G. Chester was funded by an Einstein Research Fellowship. James L. Rudolph is supported by a VA Rehabilitation Research Career Development Award. Additional support was provided by the American Federation for Aging Research, the Boston MSTAR, and National Institutes of Health grants AG 026781‐05 and AG 038027. James L. Rudolph and Mary Beth Harrington and the VA Delirium Working Group Consensus Panel are VA employees. The authors have no additional disclosures to report.
- ,.Vital signs in older patients: age‐related changes.J Am Med Dir Assoc.2011;12:337–343.
- ,,.Acute confusional states (delirium) in the hospitalized elderly.Annu Rev Gerontol Geriatr.1986;6:1–26.
- ,,,,.Underdiagnosis and poor documentation of acute confusional states in elderly hip fracture patients.J Am Geriatr Soc.1991;39:760–765.
- ,,,,.Nurses' recognition of delirium and its symptoms: comparison of nurse and researcher ratings.Arch Intern Med.2001;161:2467–2473.
- Diagnostic and Statistical Manual of Mental Disorders.4th ed.Washington, DC:American Psychiatric Association;1994.
- .Delirium in older persons.N Engl J Med.2006;354:1157–1165.
- ,,,,.One‐year health care costs associated with delirium in the elderly population.Arch Intern Med.2008;168:27–32.
- ,,,,.Delirium predicts 12‐month mortality.Arch Intern Med.2002;162:457–463.
- ,,, et al.Delirium: an independent predictor of functional decline after cardiac surgery.J Am Geriatr Soc.2010;58:643–649.
- ,,, et al.The Richmond Agitation‐Sedation Scale: validity and reliability in adult intensive care unit patients.Am J Respir Crit Care Med.2002;166:1338–1344.
- ,,, et al.Monitoring sedation status over time in ICU patients: reliability and validity of the Richmond Agitation‐Sedation Scale (RASS).JAMA.2003;289:2983–2991.
- ,,.“Mini‐mental state”. A practical method for grading the cognitive state of patients for the clinician.J Psychiatr Res.1975;12:189–198.
- ,,,,,.Clarifying confusion: the confusion assessment method. A new method for detection of delirium.Ann Intern Med.1990;113:941–948.