User login
GOC Discussions Among LTC Residents
Hospitalizations of long‐term care (LTC) residents are known to be frequent, costly, often preventable,[1, 2, 3] and potentially associated with negative health outcomes.[4] Often, an advance directive (AD) is made at LTC admission and updated annually when residents are in relatively stable health. An AD is a document that helps to inform a substitute decision maker (SDM) about the consent process for life‐sustaining treatments and is a resource that supports advance care planning (ACP). ACP is a process that allows individuals to consider, express, and plan for future healthcare in the event that they lack capacity to make their own decisions. When an LTC resident's health deteriorates and hospitalization is required, there is an opportunity to update prognosis, discuss risks and benefits of previously held treatment preferences, as well as reassess goals of care (GOC).
Engaging in ACP discussions during relatively stable health can help ensure patient preferences are followed.[5, 6] These discussions, however, are often insufficient, as they involve decision making for hypothetical situations that may not cover all potential scenarios, and may not reflect a patient's reality at the time of health status decline. Discussions held in the moment more authentically reflect the decisions of patients and/or SDM based on the specific needs and clinical realities particular to the patient at that time.[7] GOC discussions, defined in this context as ACP discussions occurring during hospitalization, have the potential to better align patient wishes with care received,[6] improve quality of life and satisfaction,[8, 9, 10] and reduce unwanted extra care.[11, 12] Although in‐the‐moment GOC discussions are recommended for all hospitalized patients who are seriously ill with a high risk of dying,[13] research suggests that this occurs infrequently for elderly patients. A recent multicenter survey of seriously ill hospitalized elderly patients found that only 25% of patients and 32% of family members reported that they had been asked about prior ACP or AD.[14] Another study of hospitalized LTC residents found that resuscitation status and family discussion was documented in only 55% and 42% of admissions, respectively.[15]
Further investigation is required to determine how often LTC patients have GOC discussions, what prompts these discussions, and what are the outcomes. Previous studies have focused on barriers to performing GOC discussions, rather than the factors that are associated with them.[16] By understanding why these discussions currently happen, we can potentially improve how often they occur and the quality of their outcomes.
The objectives of this study were to determine the rate of documented GOC discussions among hospitalized LTC residents, identify factors that were associated with documentation, and examine the association between documentation and outcomes of care.
METHODS
Study Population
We conducted a retrospective chart review of a random convenience sample of hospitalized patients admitted via the emergency department (ED) to the general internal medicine (GIM) service from January 1, 2012 through December 31, 2012, at 2 academic teaching hospitals in Toronto, Canada. Patients were identified through a search of each hospitals' electronic patient record (EPR). Patients were eligible for inclusion if they were (1) a LTC resident and (2) at least 65 years of age. For patients with multiple admissions to the GIM service during the specified 12‐month period, we only included data from the first hospitalization (index hospitalization). The hospital's research ethics board approved this study.
Our primary variable of interest was documentation in the hospital medical record of a discussion between physicians and the patient/family/SDM regarding GOC. A GOC discussion was considered to have taken place if there was documentation of (1) understanding/expectation of treatment options or (2) patient's preferences for life‐sustaining measures. Examples illustrating each criterion are provided in the Supporting Information, Appendix 1, in the online version of this article.
Factors Associated With GOC Documentation
From the EPR, we obtained visit‐level data including age, gender, Canadian Emergency Department Triage and Acuity Scale, vital signs at ED admission including temperature, respiratory rate, oxygen saturation, Glasgow Coma Scale (GCS) and shock index (defined as heart rate divided by systolic blood pressure), admission and discharge dates/times, discharge diagnosis, transfer to intensive care unit (ICU), and hospital use (number of ED visits and hospitalizations to the 2 study hospitals in the 1‐year period prior to index hospitalization).
Trained study personnel (J.W.) used a structured abstraction form to collect data from the hospital medical record that were not available through the EPR, including years living in LTC, contents of LTC AD forms, presence of SDM (identified as immediate family or surrogate with whom the care team communicated), dementia diagnosis (defined as documentation of dementia in the patient's past medical history and/or history of present illness), and measures of functional status. When available, we extracted the AD from LTC; they consisted of 4 levels (level 1: comfort careno transfer to hospital, no cardiopulmonary resuscitation [CPR]; level 2: supportive careadministration of antibiotics and/or other procedures that can be provided within LTC, no transfer to the hospital, no CPR; level 3: transfer to the hospitalno CPR; level 4: aggressive interventiontransfer to hospital for aggressive treatment, CPR).
GOC Documentation in the Discharge Summary
For the subset of patients who survived hospitalization and were discharged back to LTC, we examined whether the ADs ordered during hospitalization were communicated back to LTC via the discharge summary. We additionally assessed if the ADs determined during hospitalization differed from preferences documented prior to hospitalization. Physician orders for ADs were categorized as level 1: comfort measures only, level 3: no CPR, or level 4: full code. LTC level 2 was considered equivalent to physician‐ordered level 3 at admission; a patient with an LTC level 2 with no CPR (level 3) documented during hospitalized would be considered to have no change in the AD. An increase or decrease in the AD was determined by comparing LTC levels 1, 3, and 4 to physician‐ordered level 1, 3, and 4.
Outcomes of GOC Documentation
From the EPR, we obtained visit‐level outcome data including length of stay (LOS), resource intensity weight (RIW) (calculated based on patient case‐mix, severity, age, and procedures performed), visit disposition, number of ED visits and hospitalizations to the 2 study hospitals in the year following index hospitalization, in‐hospital death, and 1‐year mortality. We determined 1‐year mortality by following up with the LTC homes to determine whether the resident had died within the year following index hospitalization; only patients from LTC homes that responded to our request for data were included in 1‐year mortality analyses. We collected physician orders for the AD from chart review.
Statistical Analysis
Patients with and without documented GOC discussions were compared. Descriptive statistics including frequencies and percentages were used to characterize study variables. Differences between the study groups were assessed using Pearson 2/Fisher exact test. Multivariate logistic regression, which included variables that were significant in the bivariate analysis, was used to identify independent predictors of GOC discussion. Adjusted odds ratios (AOR) and 95% confidence intervals (CI) were presented for the logistic model. Patients with missing predictor data were excluded.
We also examined whether there was a correlation between GOC discussion and outcomes of care using Pearson 2/Fisher exact test. Outcomes included orders for the AD, LOS in days (stratified into quartiles), RIW (stratified into quartiles), visit disposition, hospital use in the year following index hospitalization, and 1‐year mortality following discharge back to LTC.
Lastly, to better understand the independent predictors of in‐hospital and 1‐year mortality, we used Pearson 2/Fisher exact test followed by logistic regression that included significant variables from the bivariate analyses.
All analyses were 2‐sided, and a P value of <0.05 was considered statistically significant. We used SPSS version 22.0 (SPSS Inc., Chicago, IL).
RESULTS
We identified a total of 7084 hospitalizations to GIM between January 1, 2012 and December 31, 2012, of which 665 (9.4%) met inclusion criteria of residence in LTC and age 65 years. Of these 665 hospitalizations, 512 were unique patients. We randomly selected a convenience sample of 200 index hospitalizations of the 512 eligible hospitalizations (39%) to perform the chart review.
Predictors of GOC Documentation
Of the 200 randomly sampled charts that were reviewed, 75 (37.5%) had a documented GOC discussion.
Characteristics of the study patients and results of bivariate analysis of the association between patient characteristics and GOC discussion are summarized in Table 1. No significant differences in demographic and baseline characteristics were seen between patients with and without discussion. However, a number of visit characteristics were found to be significantly associated with discussion. Forty percent of patients in the GOC discussion group had GCS scores 11 compared to 15.2% in the no‐discussion group. Higher respiratory rate, lower oxygen saturation, and ICU transfer were also significantly associated with discussions.
| Goals of Care Discussion Documented in Medical Chart | |||||
|---|---|---|---|---|---|
| No, N = 125 | Yes, N = 75 | P Value | |||
| |||||
| Baseline characteristics | |||||
| Gender, n (%) | 0.88 | ||||
| Male | 48 | (38.4) | 30 | (40.0) | |
| Female | 77 | (61.6) | 45 | (60.0) | |
| Age, y, n (%) | 0.85 | ||||
| 6579 | 36 | (28.8) | 19 | (25.3) | |
| 8084 | 30 | (24.0) | 19 | (25.3) | |
| 8589 | 30 | (24.0) | 16 | (21.3) | |
| 90101 | 29 | (23.2) | 21 | (28.0) | |
| Years living in long‐term care, n (%)* | 0.65 | ||||
| [0, 1) | 28 | (22.4) | 12 | (16.0) | |
| [1, 3) | 31 | (24.8) | 22 | (29.3) | |
| [3, 6) | 33 | (26.4) | 22 | (29.3) | |
| [6, 22) | 25 | (20.0) | 13 | (17.3) | |
| Unknown | 8 | (6.4) | 6 | (8.0) | |
| AD from long‐term care, n (%) | 0.14 | ||||
| Comfort measures only | 2 | (1.6) | 1 | (1.3) | |
| Supportive care with no transfer to hospital | 0 | (0.0) | 3 | (4.0) | |
| Supportive care with transfer to hospital | 70 | (56.0) | 44 | (58.7) | |
| Aggressive care | 53 | (42.4) | 27 | (36.0) | |
| Years since most recent AD signed, n (%)* | 0.12 | ||||
| [0, 1) | 79 | (63.2) | 48 | (64.0) | |
| [1, 2) | 21 | (16.8) | 6 | (8.0) | |
| [2, 6) | 9 | (7.2) | 10 | (13.3) | |
| Unknown | 16 | (12.8) | 11 | (14.7) | |
| Substitute decision maker, n (%) | 0.06 | ||||
| Child | 81 | (64.8) | 44 | (58.7) | |
| Spouse | 9 | (7.2) | 15 | (20.0) | |
| Other | 26 | (20.8) | 13 | (17.3) | |
| Public guardian trustee | 6 | (4.8) | 2 | (2.7) | |
| Unknown | 3 | (2.4) | 1 | (1.3) | |
| Dementia, n (%) | 1.00 | ||||
| No | 47 | (37.6) | 28 | (37.3) | |
| Yes | 78 | (62.4) | 47 | (62.7) | |
| Mobility, n (%) | 0.26 | ||||
| Walk without assistance | 5 | (4.0) | 3 | (4.0) | |
| Walker | 16 | (12.8) | 3 | (4.0) | |
| Wheelchair | 43 | (34.4) | 29 | (38.7) | |
| Bedridden | 7 | (5.6) | 4 | (5.3) | |
| Unknown | 54 | (43.2) | 36 | (48.0) | |
| Continence, n (%) | 0.05 | ||||
| Mostly continent | 16 | (12.8) | 3 | (4.0) | |
| Incontinent | 49 | (39.2) | 34 | (45.3) | |
| Catheter/stoma | 7 | (5.6) | 1 | (1.3) | |
| Unknown | 53 | (42.4) | 37 | (49.3) | |
| Feeding, n (%) | 0.17 | ||||
| Mostly feeds self | 38 | (30.4) | 13 | (17.3) | |
| Needs to be fed | 17 | (13.6) | 14 | (18.7) | |
| Gastrostomy tube | 8 | (6.4) | 5 | (6.7) | |
| Unknown | 62 | (49.6) | 43 | (57.3) | |
| Diet, n (%) | 0.68 | ||||
| Normal | 43 | (34.4) | 16 | (21.3) | |
| Dysphagic | 32 | (25.6) | 15 | (20.0) | |
| Gastrostomy tube | 8 | (6.4) | 5 | (6.7) | |
| Unknown | 42 | (33.6) | 39 | (52.0) | |
| Previous ED visits in last year, n (%) | 0.43 | ||||
| 0 | 70 | (56.0) | 41 | (54.7) | |
| 1 | 35 | (28.0) | 17 | (22.7) | |
| 2+ | 20 | (16.0) | 17 | (22.7) | |
| Previous hospitalizations in last year, n (%) | 0.19 | ||||
| 0 | 98 | (78.4) | 54 | (72.0) | |
| 1 | 23 | (18.4) | 14 | (18.7) | |
| 2+ | 4 | (3.2) | 7 | (9.3) | |
| Visit characteristics | |||||
| Glasgow Coma Scale, n (%) | <0.001 | ||||
| <7 | 4 | (3.2) | 4 | (5.3) | |
| 711 | 15 | (12.0) | 26 | (34.7) | |
| 1213 | 7 | (5.6) | 8 | (10.7) | |
| 1415 | 85 | (68.0) | 32 | (42.7) | |
| Unknown | 14 | (11.2) | 5 | (6.7) | |
| Shock index, n (%) | 0.13 | ||||
| 1 | 105 | (84.0) | 54 | (72.0) | |
| >1 | 19 | (15.2) | 18 | (24.0) | |
| Unknown | 1 | (0.8) | 3 | (4.0) | |
| Respiratory rate, n (%) | 0.02 | ||||
| <20 | 59 | (47.2) | 21 | (28.0) | |
| 20 | 66 | (52.8) | 52 | (69.3) | |
| Unknown | 0 | (0.0) | 2 | (2.7) | |
| Oxygen saturation, n (%) | 0.03 | ||||
| <88 | 2 | (1.6) | 6 | (8.0) | |
| 88 | 122 | (97.6) | 65 | (86.7) | |
| Unknown | 1 | (0.8) | 4 | (5.3) | |
| Temperature, n (%) | 0.09 | ||||
| <38.0 | 100 | (80.0) | 51 | (68.0) | |
| 38.0 | 25 | (20.0) | 23 | (30.7) | |
| Unknown | 0 | (0.0) | 1 | (1.3) | |
| Canadian Triage and Acuity Scale, n (%) | 0.13 | ||||
| Resuscitation | 1 | (0.8) | 3 | (4.0) | |
| Emergent | 70 | (56.0) | 49 | (65.3) | |
| Urgent | 52 | (41.6) | 22 | (29.3) | |
| Less urgent and nonurgent | 2 | (1.6) | 1 | (1.3) | |
| Discharge diagnosis, n (%) | 0.29 | ||||
| Aspiration pneumonia | 12 | (9.6) | 12 | (16.0) | |
| Chronic obstructive pulmonary disease | 15 | (12.0) | 3 | (4.0) | |
| Dehydration/disorders fluid/electrolytes | 9 | (7.2) | 5 | (6.7) | |
| Gastrointestinal hemorrhage | 4 | (3.2) | 3 | (4.0) | |
| Heart failure | 11 | (8.8) | 2 | (2.7) | |
| Infection (other or not identified) | 9 | (7.2) | 9 | (12.0) | |
| Influenza/pneumonia | 14 | (11.2) | 11 | (14.7) | |
| Lower urinary tract infection | 11 | (8.8) | 6 | (8.0) | |
| Other | 40 | (32.0) | 24 | (32.0) | |
| Hospitalization included ICU stay, n (%) | 0.01 | ||||
| No | 124 | (99.2) | 69 | (92.0) | |
| Yes | 1 | (0.8) | 6 | (8.0) | |
When these 4 significant clinical and visit characteristics were tested together in a logistic regression analysis, 2 remained statistically significant (Table 2). Patients with lower GCS scores (GCS 1213 and 711) were more likely to have discussions (AOR: 4.4 [95% CI: 1.4‐13.9] and AOR: 5.9 [95% CI: 2.6‐13.2], respectively) and patients with higher respiratory rates were also more likely to have discussions (AOR: 2.3 [95% CI: 1.1‐4.8]).
| Characteristic | Adjusted Odds Ratio | 95% Confidence Interval | P Value |
|---|---|---|---|
| |||
| Glasgow Coma Scale | <0.001 | ||
| <7 | 1.77 | 0.33‐9.58 | 0.51 |
| 711 | 5.90 | 2.64‐13.22 | <0.001 |
| 1213 | 4.43 | 1.41‐13.91 | 0.01 |
| 1415 | Reference | ||
| Respiration | |||
| <20 | Reference | ||
| 20 | 2.32 | 1.12‐4.78 | 0.02 |
| Oxygen saturation | |||
| <88 | 3.35 | 0.55‐20.56 | 0.19 |
| 88 | Reference | 0.05‐1.83 | |
| Hospitalization included ICU stay | |||
| No | Reference | ||
| Yes | 7.87 | 0.83‐74.73 | 0.07 |
GOC Documentation in the Discharge Summary
For the subset of patients who survived index hospitalization and were discharged back to LTC (176 patients or 88%), we also investigated whether the ADs were documented in the discharge summary back to LTC (data not shown). Of the 42 patients (23.9%) who had a change in the AD (18 patients had an AD increase in care intensity due to hospitalization; 24 had a decrease), only 11 (26%) had this AD change documented in the discharge summary.
Outcomes of GOC Documentation
A number of outcomes differed significantly between patients with and without GOC discussions in unadjusted comparisons (Table 3). Patients with discussions had higher rates of orders for no CPR (80% vs 55%) and orders for comfort measures only (7% vs 0%). They also had higher rates of in‐hospital death (29% vs 1%), 1‐year mortality (63% vs 28%), and longer LOS. However, RIW and subsequent hospital use were not found to be significant.
| Variable | Goals of Care Discussion Documented in Medical Chart | ||||
|---|---|---|---|---|---|
| No, N = 125 | Yes, N = 75 | P Value | |||
| |||||
| Physician orders, n (%) | <0.001 | ||||
| Comfort measures only | 0 | (0.0) | 5 | (6.7) | |
| No cardiopulmonary resuscitation | 69 | (55.2) | 60 | (80.0) | |
| Full code | 56 | (44.8) | 10 | (13.3) | |
| Visit disposition, n (%) | <0.001 | ||||
| Long‐term care home | 124 | (99.2) | 52 | (69.3) | |
| Died | 1 | (0.8) | 22 | (29.3) | |
| Transfer to palliative care facility | 0 | (0.0) | 1 | (1.3) | |
| Resource intensity weight, n (%) | 0.43 | ||||
| 0.250.75 | 35 | (28.0) | 19 | (25.3) | |
| 0.761.14 | 29 | (23.2) | 16 | (21.3) | |
| 1.151.60 | 34 | (27.2) | 16 | (21.3) | |
| 1.6125.5 | 27 | (21.6) | 24 | (32.0) | |
| Length of stay, d, n (%) | 0.01 | ||||
| 0.672.97 | 30 | (24.0) | 20 | (26.7) | |
| 2.984.60 | 40 | (32.0) | 10 | (13.3) | |
| 4.618.65 | 30 | (24.0) | 20 | (26.7) | |
| 8.66+ | 25 | (20.0) | 25 | (33.3) | |
| Subsequent emergency department visits in next year, n (% of applicable) | 0.38 | ||||
| 0 | 66 | (53.2) | 32 | (61.5) | |
| 1 | 30 | (24.2) | 13 | (25.0) | |
| 2+ | 28 | (22.6) | 7 | (13.5) | |
| Not applicable (died during index hospitalization or transfer to palliative care) | 1 | 23 | |||
| Subsequent hospitalizations in next year, n (% of applicable) | 0.87 | ||||
| 0 | 87 | (70.2) | 38 | (73.1) | |
| 1 | 24 | (19.4) | 10 | (19.2) | |
| 2+ | 13 | (10.5) | 4 | (7.7) | |
| Not applicable (died during index hospitalization or transfer to palliative care) | 1 | 23 | |||
| 1‐year mortality, n (% of applicable) | <0.001 | ||||
| Alive | 82 | (71.9) | 15 | (37.5) | |
| Dead | 32 | (28.1) | 25 | (62.5) | |
| Not applicable (died during index hospitalization or transfer to palliative care) | 1 | 23 | |||
| Not applicable (unsuccessful follow‐up with long‐term care home) | 10 | 12 | |||
Predictors of In‐hospital Death and 1‐Year Mortality
Given the significant positive associations between discussions and in‐hospital death and 1‐year mortality, we performed separate logistic regression analyses to test whether discussions independently predicted in‐hospital death and 1‐year mortality (Table 4). After adjusting for variables significant in their respective bivariate analyses, patients with discussions continued to have higher odds of in‐hospital death (AOR: 52.0 [95% CI: 6.2‐440.4]) and 1‐year mortality (AOR: 4.1 [95% CI: 1.7‐9.6]). Of note, the presence of dementia had significantly lower adjusted odds of in‐hospital death compared to the reference group of no dementia (AOR: 0.3 [95% CI: 0.1‐0.8]).
| Characteristic | Adjusted Odds Ratio | 95% Confidence Interval | P Value |
|---|---|---|---|
| |||
| In‐hospital death odds ratios | |||
| Advance directives from long‐term care | 0.91 | ||
| Comfort measures only | Reference | ||
| Supportive care no transfer | 3.43E +18 | 0‐. | 1.00 |
| Transfer to hospital | 3.10E +8 | 0‐. | 1.00 |
| Aggressive care | 4.85E +8 | 0‐. | 1.00 |
| Dementia | |||
| No | Reference | ||
| Yes | .25 | 0.08‐0.79 | 0.02 |
| Previous hospitalizations in last year | 0.05 | ||
| 0 | Reference | ||
| 1 | 0.43 | 0.08‐2.38 | 0.34 |
| 2+ | 6.30 | 1.10‐36.06 | 0.04 |
| Respiration | |||
| <20 | Reference | ||
| 20 | 3.64 | 0.82‐16.24 | 0.09 |
| Documented goals of care discussion | |||
| No | Reference | ||
| Yes | 52.04 | 6.15‐440.40 | <0.001 |
| 1‐year mortality odds ratios | |||
| Oxygen saturation, n (%) | |||
| <88 | 12.15 | 1.18‐124.97 | 0.04 |
| 88 | Reference | ||
| Previous ED visits in last year | 0.06 | ||
| 0 | Reference | ||
| 1 | 3.07 | 1.15‐8.17 | 0.03 |
| 2+ | 3.21 | 0.87‐11.81 | 0.08 |
| Previous hospitalizations in last year | 0.55 | ||
| 0 | Reference | ||
| 1 | 1.66 | 0.57‐4.86 | 0.36 |
| 2+ | 2.52 | 0.30‐20.89 | 0.39 |
| Documented goals of care discussion | |||
| No | Reference | ||
| Yes | 4.07 | 1.73‐9.56 | 0.001 |
DISCUSSION
Our retrospective study of LTC residents admitted to the GIM service showed that these admissions comprised 9.4% of all admissions and that GOC discussions occurred infrequently (37.5%). Our study revealed no differences in baseline patient characteristics associated with discussions, whereas patient acuity at hospital presentation independently contributed to the likelihood of discussions. We found strong associations between documentation and certain outcomes of care, including orders for AD, LOS, in‐hospital death, and 1‐year mortality. No significant associations were found between documentation and subsequent hospital use. Lastly, we found that consistent communication back to the LTC home when there was a change in AD was very poor; only 26% of discharge summaries included this documentation.
Our finding of infrequent GOC discussions during hospitalization aligns with prior studies. A study that identified code status discussions in transcripts of audio‐recorded admission encounters found that code status was discussed in only 24% of seriously ill patient admissions.[17] Furthermore, in a study specific to LTC residents, only 42% of admissions longer than 48 hours had a documented GOC discussion.[15]
We found visit‐level, but not baseline, characteristics were associated with discussions. These findings are supported by a recent study that found that whether GOC discussions took place largely depended on the acute condition presented on admission.[15] Although these results suggest that clinicians are appropriately prioritizing sicker patients who might have the most pressing need for GOC discussions, they also highlight the gap in care for less‐sick patients and the need to broaden clinical practice and consider underlying conditions and functional status. Of note, although the GCS score was found to be significantly associated with discussions, patients in the lowest GCS range did not have significantly different odds of discussions compared to the reference level (highest GCS range). A recent study by You et al. may offer some insight into this finding. They found that patients lacking capacity to make GOC decisions was ranked fifth, whereas lack of SDM availability was eighth among 21 barriers to GOC discussions, as perceived by hospital‐based clinicians.[16]
A major finding of this study was that both in‐hospital and 1‐year mortality were strongly associated with having a GOC discussion, suggesting that patients at higher risk of dying are more likely to have discussions. This is reflected by illness severity measured at initial assessment and by persistence of the association between discussions and mortality after discharge back to LTC. To the best of our knowledge, no previous studies have reported these findings. There are likely some unmeasured clinical factors such as clinical deterioration during hospitalization that contributed to this strong association. Interestingly, in our logistic regression analysis for independent predictors of in‐hospital death, we found that having dementia was associated with lower odds of in‐hospital death. One interpretation of this finding is that perhaps only patients with mild dementia were hospitalized, and those with more advanced dementia had an AD established in LTC that allowed them to remain in their LTC home. This possibility is supported by a systematic review of factors associated with LTC home hospitalization, which found that dementia was shown to be associated with less hospitalization.[18]
For patients who survived hospitalization, we did not find an association between GOC discussions and hospital use in the year following index hospitalization. In both groups, nearly 30% of patients had 1 or more subsequent hospitalizations. This is relevant especially in light of the finding that among patients where GOC discussions resulted in an AD change, only 26% of discharge summaries back to LTC included this documentation. We can only speculate that had these discussions been properly documented, subsequent hospitalizations would have decreased in the GOC group. Previous research has found that omissions of critical information in discharge summaries were common. In a study of hip fracture and stroke patients discharged from a large Midwestern academic medical center in the United States, code status was included in the discharge summary only 7% of the time.[19] The discharge summary is the primary means of sharing patient information between the hospital and LTC home. If GOC discussions are not included in the discharge summary, it is very unlikely that this information will be subsequently updated in the LTC medical record and impact the care the patient receives. A key recommendation for hospital‐based providers is ensuring that GOC discussions are clearly, consistently, and completely documented in the discharge summary so that the care provided is based on the patients' wishes.
Our study has several limitations. Our analysis was based on chart review, and although our analyses take into account a number of patient characteristics, we did not capture other characteristics that might influence GOC discussions such as culture/religion, language barriers, SDM availability, or whether patients clinically deteriorated during the index admission. Additionally, provider‐level predictors, including seniority, previous GOC training, and time available to conduct these discussions, were not captured. We also did not capture the timing or number of occasions that GOC discussions took place during hospitalization. Due to the retrospective nature of our study, we were able to only look at documented GOC discussions. GOC discussions may have happened but were never documented. However, the standard of care is to document these discussions as part of the medical record, and if they are not documented, it can be considered not to have happened and indicates a lower quality of practice. A recent survey of Canadian hospital‐based healthcare providers identified standardized GOC documentation as an effective practice to improve GOC communication.[20] Finally, because our study was conducted in 2 academic hospitals, our results may be less generalizable to other community hospitals. However, our hospitals' catchment areas capture a diverse population, both culturally and in terms of their socioeconomic status.
CONCLUSION
GOC discussions occurred infrequently, appeared to be triggered by illness severity, and were poorly communicated back to LTC. Important outcomes of care, including in‐hospital death and 1‐year mortality, were associated with discussions. This study serves to identify gaps in who might benefit from GOC discussions and illustrates opportunities for improvement including implementing standardized documentation practices.
Disclosures
Hannah J. Wong, PhD, and Robert C. Wu, MD, had full access to all of the data in the study and take responsibility for the integrity of the data and the accuracy of the data analysis. Robert C. Wu, MD, Hannah J. Wong, PhD, and Michelle Grinman, MD, were responsible for the conception and design of the study. Robert C. Wu, MD, Hannah J. Wong, PhD, and Jamie Wang were responsible for the acquisition of the data. All of the authors were responsible for the analysis and interpretation of the data, drafting of the manuscript, critical revision of the manuscript for important intellectual content, and final approval of the manuscript. Hannah J. Wong, PhD obtained the funding. Hannah J. Wong, PhD, and Robert C. Wu, MD, supervised the study. The authors report no conflicts of interest.
- , , , , . Trends in emergency department visits for ambulatory care sensitive conditions by elderly nursing home residents, 2001 to 2010. JAMA Intern Med. 2014;174(1):156–158.
- , , , . Hospital transfers of nursing home residents with advanced dementia. J Am Geriatr Soc. 2012;60(5):905–909.
- , , , , . Potentially avoidable hospitalizations for elderly long‐stay residents in nursing homes. Med Care. 2013;51(8):673–681.
- , . Reducing unnecessary hospitalizations of nursing home residents. N Engl J Med. 2011;365(13):1165–1167.
- , , . Advance directives and outcomes of surrogate decision making before death. N Engl J Med. 2010;362(13):1211–1218.
- , , , , , . The consistency between treatments provided to nursing facility residents and orders on the physician orders for life‐sustaining treatment form. J Am Geriatr Soc. 2011;59(11):2091–2099.
- , , . What should be the goal of advance care planning? JAMA Intern Med. 2014;174(7):1093–1094.
- , , , et al. Associations between end‐of‐life discussions, patient mental health, medical care near death, and caregiver bereavement adjustment. JAMA. 2008;300(14):1665–1673.
- , , , et al. Systematic implementation of an advance directive program in nursing homes: a randomized controlled trial. JAMA. 2000;283(11):1437–1444.
- , . Communication about serious illness care goals: a review and synthesis of best practices. JAMA Intern Med. 2014;174(12):1994–2003.
- , , . Predictors of nursing home residents' time to hospitalization. Health Serv Res. 2011;46(1 pt 1):82–104.
- , , , . Regional variation in the association between advance directives and end‐of‐life Medicare expenditures. JAMA. 2011;306(13):1447–1453.
- , , . Just ask: discussing goals of care with patients in hospital with serious illness. CMAJ. 2014;186(6):425–432.
- , , , et al. Failure to engage hospitalized elderly patients and their families in advance care planning. JAMA Intern Med. 2013;173(9):778–787.
- , , , . Hospitalisation of high‐care residents of aged care facilities: are goals of care discussed? Intern Med J. 2013;43(2):144–149.
- , , , et al. Barriers to goals of care discussions with seriously ill hospitalized patients and their families: a multicenter survey of clinicians. JAMA Intern Med. 2015;175(4):549–556.
- , , , , . Code status discussions between attending hospitalist physicians and medical patients at hospital admission. J Gen Intern Med. 2011;26(4):359–366.
- , , , . Predictors of nursing home hospitalization: a review of the literature. Med Care Res Rev. 2008;65(1):3–39.
- , , , , . Provider characteristics, clinical‐work processes and their relationship to discharge summary quality for sub‐acute care patients. J Gen Intern Med. 2012;27(1):78–84.
- , , , . Strategies for effective goals of care discussions and decision‐making: perspectives from a multi‐centre survey of Canadian hospital‐based healthcare providers. BMC Palliat Care. 2015;14:38.
Hospitalizations of long‐term care (LTC) residents are known to be frequent, costly, often preventable,[1, 2, 3] and potentially associated with negative health outcomes.[4] Often, an advance directive (AD) is made at LTC admission and updated annually when residents are in relatively stable health. An AD is a document that helps to inform a substitute decision maker (SDM) about the consent process for life‐sustaining treatments and is a resource that supports advance care planning (ACP). ACP is a process that allows individuals to consider, express, and plan for future healthcare in the event that they lack capacity to make their own decisions. When an LTC resident's health deteriorates and hospitalization is required, there is an opportunity to update prognosis, discuss risks and benefits of previously held treatment preferences, as well as reassess goals of care (GOC).
Engaging in ACP discussions during relatively stable health can help ensure patient preferences are followed.[5, 6] These discussions, however, are often insufficient, as they involve decision making for hypothetical situations that may not cover all potential scenarios, and may not reflect a patient's reality at the time of health status decline. Discussions held in the moment more authentically reflect the decisions of patients and/or SDM based on the specific needs and clinical realities particular to the patient at that time.[7] GOC discussions, defined in this context as ACP discussions occurring during hospitalization, have the potential to better align patient wishes with care received,[6] improve quality of life and satisfaction,[8, 9, 10] and reduce unwanted extra care.[11, 12] Although in‐the‐moment GOC discussions are recommended for all hospitalized patients who are seriously ill with a high risk of dying,[13] research suggests that this occurs infrequently for elderly patients. A recent multicenter survey of seriously ill hospitalized elderly patients found that only 25% of patients and 32% of family members reported that they had been asked about prior ACP or AD.[14] Another study of hospitalized LTC residents found that resuscitation status and family discussion was documented in only 55% and 42% of admissions, respectively.[15]
Further investigation is required to determine how often LTC patients have GOC discussions, what prompts these discussions, and what are the outcomes. Previous studies have focused on barriers to performing GOC discussions, rather than the factors that are associated with them.[16] By understanding why these discussions currently happen, we can potentially improve how often they occur and the quality of their outcomes.
The objectives of this study were to determine the rate of documented GOC discussions among hospitalized LTC residents, identify factors that were associated with documentation, and examine the association between documentation and outcomes of care.
METHODS
Study Population
We conducted a retrospective chart review of a random convenience sample of hospitalized patients admitted via the emergency department (ED) to the general internal medicine (GIM) service from January 1, 2012 through December 31, 2012, at 2 academic teaching hospitals in Toronto, Canada. Patients were identified through a search of each hospitals' electronic patient record (EPR). Patients were eligible for inclusion if they were (1) a LTC resident and (2) at least 65 years of age. For patients with multiple admissions to the GIM service during the specified 12‐month period, we only included data from the first hospitalization (index hospitalization). The hospital's research ethics board approved this study.
Our primary variable of interest was documentation in the hospital medical record of a discussion between physicians and the patient/family/SDM regarding GOC. A GOC discussion was considered to have taken place if there was documentation of (1) understanding/expectation of treatment options or (2) patient's preferences for life‐sustaining measures. Examples illustrating each criterion are provided in the Supporting Information, Appendix 1, in the online version of this article.
Factors Associated With GOC Documentation
From the EPR, we obtained visit‐level data including age, gender, Canadian Emergency Department Triage and Acuity Scale, vital signs at ED admission including temperature, respiratory rate, oxygen saturation, Glasgow Coma Scale (GCS) and shock index (defined as heart rate divided by systolic blood pressure), admission and discharge dates/times, discharge diagnosis, transfer to intensive care unit (ICU), and hospital use (number of ED visits and hospitalizations to the 2 study hospitals in the 1‐year period prior to index hospitalization).
Trained study personnel (J.W.) used a structured abstraction form to collect data from the hospital medical record that were not available through the EPR, including years living in LTC, contents of LTC AD forms, presence of SDM (identified as immediate family or surrogate with whom the care team communicated), dementia diagnosis (defined as documentation of dementia in the patient's past medical history and/or history of present illness), and measures of functional status. When available, we extracted the AD from LTC; they consisted of 4 levels (level 1: comfort careno transfer to hospital, no cardiopulmonary resuscitation [CPR]; level 2: supportive careadministration of antibiotics and/or other procedures that can be provided within LTC, no transfer to the hospital, no CPR; level 3: transfer to the hospitalno CPR; level 4: aggressive interventiontransfer to hospital for aggressive treatment, CPR).
GOC Documentation in the Discharge Summary
For the subset of patients who survived hospitalization and were discharged back to LTC, we examined whether the ADs ordered during hospitalization were communicated back to LTC via the discharge summary. We additionally assessed if the ADs determined during hospitalization differed from preferences documented prior to hospitalization. Physician orders for ADs were categorized as level 1: comfort measures only, level 3: no CPR, or level 4: full code. LTC level 2 was considered equivalent to physician‐ordered level 3 at admission; a patient with an LTC level 2 with no CPR (level 3) documented during hospitalized would be considered to have no change in the AD. An increase or decrease in the AD was determined by comparing LTC levels 1, 3, and 4 to physician‐ordered level 1, 3, and 4.
Outcomes of GOC Documentation
From the EPR, we obtained visit‐level outcome data including length of stay (LOS), resource intensity weight (RIW) (calculated based on patient case‐mix, severity, age, and procedures performed), visit disposition, number of ED visits and hospitalizations to the 2 study hospitals in the year following index hospitalization, in‐hospital death, and 1‐year mortality. We determined 1‐year mortality by following up with the LTC homes to determine whether the resident had died within the year following index hospitalization; only patients from LTC homes that responded to our request for data were included in 1‐year mortality analyses. We collected physician orders for the AD from chart review.
Statistical Analysis
Patients with and without documented GOC discussions were compared. Descriptive statistics including frequencies and percentages were used to characterize study variables. Differences between the study groups were assessed using Pearson 2/Fisher exact test. Multivariate logistic regression, which included variables that were significant in the bivariate analysis, was used to identify independent predictors of GOC discussion. Adjusted odds ratios (AOR) and 95% confidence intervals (CI) were presented for the logistic model. Patients with missing predictor data were excluded.
We also examined whether there was a correlation between GOC discussion and outcomes of care using Pearson 2/Fisher exact test. Outcomes included orders for the AD, LOS in days (stratified into quartiles), RIW (stratified into quartiles), visit disposition, hospital use in the year following index hospitalization, and 1‐year mortality following discharge back to LTC.
Lastly, to better understand the independent predictors of in‐hospital and 1‐year mortality, we used Pearson 2/Fisher exact test followed by logistic regression that included significant variables from the bivariate analyses.
All analyses were 2‐sided, and a P value of <0.05 was considered statistically significant. We used SPSS version 22.0 (SPSS Inc., Chicago, IL).
RESULTS
We identified a total of 7084 hospitalizations to GIM between January 1, 2012 and December 31, 2012, of which 665 (9.4%) met inclusion criteria of residence in LTC and age 65 years. Of these 665 hospitalizations, 512 were unique patients. We randomly selected a convenience sample of 200 index hospitalizations of the 512 eligible hospitalizations (39%) to perform the chart review.
Predictors of GOC Documentation
Of the 200 randomly sampled charts that were reviewed, 75 (37.5%) had a documented GOC discussion.
Characteristics of the study patients and results of bivariate analysis of the association between patient characteristics and GOC discussion are summarized in Table 1. No significant differences in demographic and baseline characteristics were seen between patients with and without discussion. However, a number of visit characteristics were found to be significantly associated with discussion. Forty percent of patients in the GOC discussion group had GCS scores 11 compared to 15.2% in the no‐discussion group. Higher respiratory rate, lower oxygen saturation, and ICU transfer were also significantly associated with discussions.
| Goals of Care Discussion Documented in Medical Chart | |||||
|---|---|---|---|---|---|
| No, N = 125 | Yes, N = 75 | P Value | |||
| |||||
| Baseline characteristics | |||||
| Gender, n (%) | 0.88 | ||||
| Male | 48 | (38.4) | 30 | (40.0) | |
| Female | 77 | (61.6) | 45 | (60.0) | |
| Age, y, n (%) | 0.85 | ||||
| 6579 | 36 | (28.8) | 19 | (25.3) | |
| 8084 | 30 | (24.0) | 19 | (25.3) | |
| 8589 | 30 | (24.0) | 16 | (21.3) | |
| 90101 | 29 | (23.2) | 21 | (28.0) | |
| Years living in long‐term care, n (%)* | 0.65 | ||||
| [0, 1) | 28 | (22.4) | 12 | (16.0) | |
| [1, 3) | 31 | (24.8) | 22 | (29.3) | |
| [3, 6) | 33 | (26.4) | 22 | (29.3) | |
| [6, 22) | 25 | (20.0) | 13 | (17.3) | |
| Unknown | 8 | (6.4) | 6 | (8.0) | |
| AD from long‐term care, n (%) | 0.14 | ||||
| Comfort measures only | 2 | (1.6) | 1 | (1.3) | |
| Supportive care with no transfer to hospital | 0 | (0.0) | 3 | (4.0) | |
| Supportive care with transfer to hospital | 70 | (56.0) | 44 | (58.7) | |
| Aggressive care | 53 | (42.4) | 27 | (36.0) | |
| Years since most recent AD signed, n (%)* | 0.12 | ||||
| [0, 1) | 79 | (63.2) | 48 | (64.0) | |
| [1, 2) | 21 | (16.8) | 6 | (8.0) | |
| [2, 6) | 9 | (7.2) | 10 | (13.3) | |
| Unknown | 16 | (12.8) | 11 | (14.7) | |
| Substitute decision maker, n (%) | 0.06 | ||||
| Child | 81 | (64.8) | 44 | (58.7) | |
| Spouse | 9 | (7.2) | 15 | (20.0) | |
| Other | 26 | (20.8) | 13 | (17.3) | |
| Public guardian trustee | 6 | (4.8) | 2 | (2.7) | |
| Unknown | 3 | (2.4) | 1 | (1.3) | |
| Dementia, n (%) | 1.00 | ||||
| No | 47 | (37.6) | 28 | (37.3) | |
| Yes | 78 | (62.4) | 47 | (62.7) | |
| Mobility, n (%) | 0.26 | ||||
| Walk without assistance | 5 | (4.0) | 3 | (4.0) | |
| Walker | 16 | (12.8) | 3 | (4.0) | |
| Wheelchair | 43 | (34.4) | 29 | (38.7) | |
| Bedridden | 7 | (5.6) | 4 | (5.3) | |
| Unknown | 54 | (43.2) | 36 | (48.0) | |
| Continence, n (%) | 0.05 | ||||
| Mostly continent | 16 | (12.8) | 3 | (4.0) | |
| Incontinent | 49 | (39.2) | 34 | (45.3) | |
| Catheter/stoma | 7 | (5.6) | 1 | (1.3) | |
| Unknown | 53 | (42.4) | 37 | (49.3) | |
| Feeding, n (%) | 0.17 | ||||
| Mostly feeds self | 38 | (30.4) | 13 | (17.3) | |
| Needs to be fed | 17 | (13.6) | 14 | (18.7) | |
| Gastrostomy tube | 8 | (6.4) | 5 | (6.7) | |
| Unknown | 62 | (49.6) | 43 | (57.3) | |
| Diet, n (%) | 0.68 | ||||
| Normal | 43 | (34.4) | 16 | (21.3) | |
| Dysphagic | 32 | (25.6) | 15 | (20.0) | |
| Gastrostomy tube | 8 | (6.4) | 5 | (6.7) | |
| Unknown | 42 | (33.6) | 39 | (52.0) | |
| Previous ED visits in last year, n (%) | 0.43 | ||||
| 0 | 70 | (56.0) | 41 | (54.7) | |
| 1 | 35 | (28.0) | 17 | (22.7) | |
| 2+ | 20 | (16.0) | 17 | (22.7) | |
| Previous hospitalizations in last year, n (%) | 0.19 | ||||
| 0 | 98 | (78.4) | 54 | (72.0) | |
| 1 | 23 | (18.4) | 14 | (18.7) | |
| 2+ | 4 | (3.2) | 7 | (9.3) | |
| Visit characteristics | |||||
| Glasgow Coma Scale, n (%) | <0.001 | ||||
| <7 | 4 | (3.2) | 4 | (5.3) | |
| 711 | 15 | (12.0) | 26 | (34.7) | |
| 1213 | 7 | (5.6) | 8 | (10.7) | |
| 1415 | 85 | (68.0) | 32 | (42.7) | |
| Unknown | 14 | (11.2) | 5 | (6.7) | |
| Shock index, n (%) | 0.13 | ||||
| 1 | 105 | (84.0) | 54 | (72.0) | |
| >1 | 19 | (15.2) | 18 | (24.0) | |
| Unknown | 1 | (0.8) | 3 | (4.0) | |
| Respiratory rate, n (%) | 0.02 | ||||
| <20 | 59 | (47.2) | 21 | (28.0) | |
| 20 | 66 | (52.8) | 52 | (69.3) | |
| Unknown | 0 | (0.0) | 2 | (2.7) | |
| Oxygen saturation, n (%) | 0.03 | ||||
| <88 | 2 | (1.6) | 6 | (8.0) | |
| 88 | 122 | (97.6) | 65 | (86.7) | |
| Unknown | 1 | (0.8) | 4 | (5.3) | |
| Temperature, n (%) | 0.09 | ||||
| <38.0 | 100 | (80.0) | 51 | (68.0) | |
| 38.0 | 25 | (20.0) | 23 | (30.7) | |
| Unknown | 0 | (0.0) | 1 | (1.3) | |
| Canadian Triage and Acuity Scale, n (%) | 0.13 | ||||
| Resuscitation | 1 | (0.8) | 3 | (4.0) | |
| Emergent | 70 | (56.0) | 49 | (65.3) | |
| Urgent | 52 | (41.6) | 22 | (29.3) | |
| Less urgent and nonurgent | 2 | (1.6) | 1 | (1.3) | |
| Discharge diagnosis, n (%) | 0.29 | ||||
| Aspiration pneumonia | 12 | (9.6) | 12 | (16.0) | |
| Chronic obstructive pulmonary disease | 15 | (12.0) | 3 | (4.0) | |
| Dehydration/disorders fluid/electrolytes | 9 | (7.2) | 5 | (6.7) | |
| Gastrointestinal hemorrhage | 4 | (3.2) | 3 | (4.0) | |
| Heart failure | 11 | (8.8) | 2 | (2.7) | |
| Infection (other or not identified) | 9 | (7.2) | 9 | (12.0) | |
| Influenza/pneumonia | 14 | (11.2) | 11 | (14.7) | |
| Lower urinary tract infection | 11 | (8.8) | 6 | (8.0) | |
| Other | 40 | (32.0) | 24 | (32.0) | |
| Hospitalization included ICU stay, n (%) | 0.01 | ||||
| No | 124 | (99.2) | 69 | (92.0) | |
| Yes | 1 | (0.8) | 6 | (8.0) | |
When these 4 significant clinical and visit characteristics were tested together in a logistic regression analysis, 2 remained statistically significant (Table 2). Patients with lower GCS scores (GCS 1213 and 711) were more likely to have discussions (AOR: 4.4 [95% CI: 1.4‐13.9] and AOR: 5.9 [95% CI: 2.6‐13.2], respectively) and patients with higher respiratory rates were also more likely to have discussions (AOR: 2.3 [95% CI: 1.1‐4.8]).
| Characteristic | Adjusted Odds Ratio | 95% Confidence Interval | P Value |
|---|---|---|---|
| |||
| Glasgow Coma Scale | <0.001 | ||
| <7 | 1.77 | 0.33‐9.58 | 0.51 |
| 711 | 5.90 | 2.64‐13.22 | <0.001 |
| 1213 | 4.43 | 1.41‐13.91 | 0.01 |
| 1415 | Reference | ||
| Respiration | |||
| <20 | Reference | ||
| 20 | 2.32 | 1.12‐4.78 | 0.02 |
| Oxygen saturation | |||
| <88 | 3.35 | 0.55‐20.56 | 0.19 |
| 88 | Reference | 0.05‐1.83 | |
| Hospitalization included ICU stay | |||
| No | Reference | ||
| Yes | 7.87 | 0.83‐74.73 | 0.07 |
GOC Documentation in the Discharge Summary
For the subset of patients who survived index hospitalization and were discharged back to LTC (176 patients or 88%), we also investigated whether the ADs were documented in the discharge summary back to LTC (data not shown). Of the 42 patients (23.9%) who had a change in the AD (18 patients had an AD increase in care intensity due to hospitalization; 24 had a decrease), only 11 (26%) had this AD change documented in the discharge summary.
Outcomes of GOC Documentation
A number of outcomes differed significantly between patients with and without GOC discussions in unadjusted comparisons (Table 3). Patients with discussions had higher rates of orders for no CPR (80% vs 55%) and orders for comfort measures only (7% vs 0%). They also had higher rates of in‐hospital death (29% vs 1%), 1‐year mortality (63% vs 28%), and longer LOS. However, RIW and subsequent hospital use were not found to be significant.
| Variable | Goals of Care Discussion Documented in Medical Chart | ||||
|---|---|---|---|---|---|
| No, N = 125 | Yes, N = 75 | P Value | |||
| |||||
| Physician orders, n (%) | <0.001 | ||||
| Comfort measures only | 0 | (0.0) | 5 | (6.7) | |
| No cardiopulmonary resuscitation | 69 | (55.2) | 60 | (80.0) | |
| Full code | 56 | (44.8) | 10 | (13.3) | |
| Visit disposition, n (%) | <0.001 | ||||
| Long‐term care home | 124 | (99.2) | 52 | (69.3) | |
| Died | 1 | (0.8) | 22 | (29.3) | |
| Transfer to palliative care facility | 0 | (0.0) | 1 | (1.3) | |
| Resource intensity weight, n (%) | 0.43 | ||||
| 0.250.75 | 35 | (28.0) | 19 | (25.3) | |
| 0.761.14 | 29 | (23.2) | 16 | (21.3) | |
| 1.151.60 | 34 | (27.2) | 16 | (21.3) | |
| 1.6125.5 | 27 | (21.6) | 24 | (32.0) | |
| Length of stay, d, n (%) | 0.01 | ||||
| 0.672.97 | 30 | (24.0) | 20 | (26.7) | |
| 2.984.60 | 40 | (32.0) | 10 | (13.3) | |
| 4.618.65 | 30 | (24.0) | 20 | (26.7) | |
| 8.66+ | 25 | (20.0) | 25 | (33.3) | |
| Subsequent emergency department visits in next year, n (% of applicable) | 0.38 | ||||
| 0 | 66 | (53.2) | 32 | (61.5) | |
| 1 | 30 | (24.2) | 13 | (25.0) | |
| 2+ | 28 | (22.6) | 7 | (13.5) | |
| Not applicable (died during index hospitalization or transfer to palliative care) | 1 | 23 | |||
| Subsequent hospitalizations in next year, n (% of applicable) | 0.87 | ||||
| 0 | 87 | (70.2) | 38 | (73.1) | |
| 1 | 24 | (19.4) | 10 | (19.2) | |
| 2+ | 13 | (10.5) | 4 | (7.7) | |
| Not applicable (died during index hospitalization or transfer to palliative care) | 1 | 23 | |||
| 1‐year mortality, n (% of applicable) | <0.001 | ||||
| Alive | 82 | (71.9) | 15 | (37.5) | |
| Dead | 32 | (28.1) | 25 | (62.5) | |
| Not applicable (died during index hospitalization or transfer to palliative care) | 1 | 23 | |||
| Not applicable (unsuccessful follow‐up with long‐term care home) | 10 | 12 | |||
Predictors of In‐hospital Death and 1‐Year Mortality
Given the significant positive associations between discussions and in‐hospital death and 1‐year mortality, we performed separate logistic regression analyses to test whether discussions independently predicted in‐hospital death and 1‐year mortality (Table 4). After adjusting for variables significant in their respective bivariate analyses, patients with discussions continued to have higher odds of in‐hospital death (AOR: 52.0 [95% CI: 6.2‐440.4]) and 1‐year mortality (AOR: 4.1 [95% CI: 1.7‐9.6]). Of note, the presence of dementia had significantly lower adjusted odds of in‐hospital death compared to the reference group of no dementia (AOR: 0.3 [95% CI: 0.1‐0.8]).
| Characteristic | Adjusted Odds Ratio | 95% Confidence Interval | P Value |
|---|---|---|---|
| |||
| In‐hospital death odds ratios | |||
| Advance directives from long‐term care | 0.91 | ||
| Comfort measures only | Reference | ||
| Supportive care no transfer | 3.43E +18 | 0‐. | 1.00 |
| Transfer to hospital | 3.10E +8 | 0‐. | 1.00 |
| Aggressive care | 4.85E +8 | 0‐. | 1.00 |
| Dementia | |||
| No | Reference | ||
| Yes | .25 | 0.08‐0.79 | 0.02 |
| Previous hospitalizations in last year | 0.05 | ||
| 0 | Reference | ||
| 1 | 0.43 | 0.08‐2.38 | 0.34 |
| 2+ | 6.30 | 1.10‐36.06 | 0.04 |
| Respiration | |||
| <20 | Reference | ||
| 20 | 3.64 | 0.82‐16.24 | 0.09 |
| Documented goals of care discussion | |||
| No | Reference | ||
| Yes | 52.04 | 6.15‐440.40 | <0.001 |
| 1‐year mortality odds ratios | |||
| Oxygen saturation, n (%) | |||
| <88 | 12.15 | 1.18‐124.97 | 0.04 |
| 88 | Reference | ||
| Previous ED visits in last year | 0.06 | ||
| 0 | Reference | ||
| 1 | 3.07 | 1.15‐8.17 | 0.03 |
| 2+ | 3.21 | 0.87‐11.81 | 0.08 |
| Previous hospitalizations in last year | 0.55 | ||
| 0 | Reference | ||
| 1 | 1.66 | 0.57‐4.86 | 0.36 |
| 2+ | 2.52 | 0.30‐20.89 | 0.39 |
| Documented goals of care discussion | |||
| No | Reference | ||
| Yes | 4.07 | 1.73‐9.56 | 0.001 |
DISCUSSION
Our retrospective study of LTC residents admitted to the GIM service showed that these admissions comprised 9.4% of all admissions and that GOC discussions occurred infrequently (37.5%). Our study revealed no differences in baseline patient characteristics associated with discussions, whereas patient acuity at hospital presentation independently contributed to the likelihood of discussions. We found strong associations between documentation and certain outcomes of care, including orders for AD, LOS, in‐hospital death, and 1‐year mortality. No significant associations were found between documentation and subsequent hospital use. Lastly, we found that consistent communication back to the LTC home when there was a change in AD was very poor; only 26% of discharge summaries included this documentation.
Our finding of infrequent GOC discussions during hospitalization aligns with prior studies. A study that identified code status discussions in transcripts of audio‐recorded admission encounters found that code status was discussed in only 24% of seriously ill patient admissions.[17] Furthermore, in a study specific to LTC residents, only 42% of admissions longer than 48 hours had a documented GOC discussion.[15]
We found visit‐level, but not baseline, characteristics were associated with discussions. These findings are supported by a recent study that found that whether GOC discussions took place largely depended on the acute condition presented on admission.[15] Although these results suggest that clinicians are appropriately prioritizing sicker patients who might have the most pressing need for GOC discussions, they also highlight the gap in care for less‐sick patients and the need to broaden clinical practice and consider underlying conditions and functional status. Of note, although the GCS score was found to be significantly associated with discussions, patients in the lowest GCS range did not have significantly different odds of discussions compared to the reference level (highest GCS range). A recent study by You et al. may offer some insight into this finding. They found that patients lacking capacity to make GOC decisions was ranked fifth, whereas lack of SDM availability was eighth among 21 barriers to GOC discussions, as perceived by hospital‐based clinicians.[16]
A major finding of this study was that both in‐hospital and 1‐year mortality were strongly associated with having a GOC discussion, suggesting that patients at higher risk of dying are more likely to have discussions. This is reflected by illness severity measured at initial assessment and by persistence of the association between discussions and mortality after discharge back to LTC. To the best of our knowledge, no previous studies have reported these findings. There are likely some unmeasured clinical factors such as clinical deterioration during hospitalization that contributed to this strong association. Interestingly, in our logistic regression analysis for independent predictors of in‐hospital death, we found that having dementia was associated with lower odds of in‐hospital death. One interpretation of this finding is that perhaps only patients with mild dementia were hospitalized, and those with more advanced dementia had an AD established in LTC that allowed them to remain in their LTC home. This possibility is supported by a systematic review of factors associated with LTC home hospitalization, which found that dementia was shown to be associated with less hospitalization.[18]
For patients who survived hospitalization, we did not find an association between GOC discussions and hospital use in the year following index hospitalization. In both groups, nearly 30% of patients had 1 or more subsequent hospitalizations. This is relevant especially in light of the finding that among patients where GOC discussions resulted in an AD change, only 26% of discharge summaries back to LTC included this documentation. We can only speculate that had these discussions been properly documented, subsequent hospitalizations would have decreased in the GOC group. Previous research has found that omissions of critical information in discharge summaries were common. In a study of hip fracture and stroke patients discharged from a large Midwestern academic medical center in the United States, code status was included in the discharge summary only 7% of the time.[19] The discharge summary is the primary means of sharing patient information between the hospital and LTC home. If GOC discussions are not included in the discharge summary, it is very unlikely that this information will be subsequently updated in the LTC medical record and impact the care the patient receives. A key recommendation for hospital‐based providers is ensuring that GOC discussions are clearly, consistently, and completely documented in the discharge summary so that the care provided is based on the patients' wishes.
Our study has several limitations. Our analysis was based on chart review, and although our analyses take into account a number of patient characteristics, we did not capture other characteristics that might influence GOC discussions such as culture/religion, language barriers, SDM availability, or whether patients clinically deteriorated during the index admission. Additionally, provider‐level predictors, including seniority, previous GOC training, and time available to conduct these discussions, were not captured. We also did not capture the timing or number of occasions that GOC discussions took place during hospitalization. Due to the retrospective nature of our study, we were able to only look at documented GOC discussions. GOC discussions may have happened but were never documented. However, the standard of care is to document these discussions as part of the medical record, and if they are not documented, it can be considered not to have happened and indicates a lower quality of practice. A recent survey of Canadian hospital‐based healthcare providers identified standardized GOC documentation as an effective practice to improve GOC communication.[20] Finally, because our study was conducted in 2 academic hospitals, our results may be less generalizable to other community hospitals. However, our hospitals' catchment areas capture a diverse population, both culturally and in terms of their socioeconomic status.
CONCLUSION
GOC discussions occurred infrequently, appeared to be triggered by illness severity, and were poorly communicated back to LTC. Important outcomes of care, including in‐hospital death and 1‐year mortality, were associated with discussions. This study serves to identify gaps in who might benefit from GOC discussions and illustrates opportunities for improvement including implementing standardized documentation practices.
Disclosures
Hannah J. Wong, PhD, and Robert C. Wu, MD, had full access to all of the data in the study and take responsibility for the integrity of the data and the accuracy of the data analysis. Robert C. Wu, MD, Hannah J. Wong, PhD, and Michelle Grinman, MD, were responsible for the conception and design of the study. Robert C. Wu, MD, Hannah J. Wong, PhD, and Jamie Wang were responsible for the acquisition of the data. All of the authors were responsible for the analysis and interpretation of the data, drafting of the manuscript, critical revision of the manuscript for important intellectual content, and final approval of the manuscript. Hannah J. Wong, PhD obtained the funding. Hannah J. Wong, PhD, and Robert C. Wu, MD, supervised the study. The authors report no conflicts of interest.
- , , , , . Trends in emergency department visits for ambulatory care sensitive conditions by elderly nursing home residents, 2001 to 2010. JAMA Intern Med. 2014;174(1):156–158.
- , , , . Hospital transfers of nursing home residents with advanced dementia. J Am Geriatr Soc. 2012;60(5):905–909.
- , , , , . Potentially avoidable hospitalizations for elderly long‐stay residents in nursing homes. Med Care. 2013;51(8):673–681.
- , . Reducing unnecessary hospitalizations of nursing home residents. N Engl J Med. 2011;365(13):1165–1167.
- , , . Advance directives and outcomes of surrogate decision making before death. N Engl J Med. 2010;362(13):1211–1218.
- , , , , , . The consistency between treatments provided to nursing facility residents and orders on the physician orders for life‐sustaining treatment form. J Am Geriatr Soc. 2011;59(11):2091–2099.
- , , . What should be the goal of advance care planning? JAMA Intern Med. 2014;174(7):1093–1094.
- , , , et al. Associations between end‐of‐life discussions, patient mental health, medical care near death, and caregiver bereavement adjustment. JAMA. 2008;300(14):1665–1673.
- , , , et al. Systematic implementation of an advance directive program in nursing homes: a randomized controlled trial. JAMA. 2000;283(11):1437–1444.
- , . Communication about serious illness care goals: a review and synthesis of best practices. JAMA Intern Med. 2014;174(12):1994–2003.
- , , . Predictors of nursing home residents' time to hospitalization. Health Serv Res. 2011;46(1 pt 1):82–104.
- , , , . Regional variation in the association between advance directives and end‐of‐life Medicare expenditures. JAMA. 2011;306(13):1447–1453.
- , , . Just ask: discussing goals of care with patients in hospital with serious illness. CMAJ. 2014;186(6):425–432.
- , , , et al. Failure to engage hospitalized elderly patients and their families in advance care planning. JAMA Intern Med. 2013;173(9):778–787.
- , , , . Hospitalisation of high‐care residents of aged care facilities: are goals of care discussed? Intern Med J. 2013;43(2):144–149.
- , , , et al. Barriers to goals of care discussions with seriously ill hospitalized patients and their families: a multicenter survey of clinicians. JAMA Intern Med. 2015;175(4):549–556.
- , , , , . Code status discussions between attending hospitalist physicians and medical patients at hospital admission. J Gen Intern Med. 2011;26(4):359–366.
- , , , . Predictors of nursing home hospitalization: a review of the literature. Med Care Res Rev. 2008;65(1):3–39.
- , , , , . Provider characteristics, clinical‐work processes and their relationship to discharge summary quality for sub‐acute care patients. J Gen Intern Med. 2012;27(1):78–84.
- , , , . Strategies for effective goals of care discussions and decision‐making: perspectives from a multi‐centre survey of Canadian hospital‐based healthcare providers. BMC Palliat Care. 2015;14:38.
Continuous Admission Model Reduces LOS
Smooth and timely hospital patient flow can have multiple positive effects including reduced wait times for services, decreased congestion in the Emergency Department (ED), and increased patient and staff satisfaction.14 One way to improve patient flow is to remove variation along the care pathway.57
For teaching hospitals that provide team‐based care, 1 significant source of variation involves the emergent admission process.8, 9 Typically, for services that admit the majority of their patients from the ED, 1 team is assigned to all admitting duties on a particular day; the on‐call team. While teams rotate between designations of on‐call, post‐call, and pre‐call over the course of the week, only the team designated on‐call accepts new admissions. This bolus call structure creates the need for extensive cross‐coverage, large variations in team admissions, and disparate team workloads.1012 Moreover, the effects of these variations may persist and extend along the care pathway, ultimately impacting timely patient discharge. Therefore, interventions aimed at improving the admission process may be candidates for improved patient flow.
The objective of this study is to evaluate the effect of changing the admission process from a bolus admission system to a trickle system that evenly distributes newly admitted patients to each of the physician‐led care teams. We hypothesize that by removing variation within the team admission process, team workload will be smoothed and ultimately result in patients being discharged by the team in a more uniform pattern. We evaluate this hypothesis by measuring length of stay and daily discharge rate.
METHODS
Setting
This retrospective study was conducted on the General Internal Medicine clinical teaching unit (GIM CTU) at a large academic tertiary care center in Toronto, Canada. GIM provides acute, nonsurgical care to a patient population composed primarily of elderly patients with complex chronic illnesses. GIM receives 98% of its inpatient admissions from the ED. On a daily basis, the ED sees approximately 100 patients, of which nearly 20% are admitted to hospital. GIM constitutes the single largest admitting service in the ED, admitting nearly half of all emergent admissions. Surgical and specialized medical services (eg, Cardiology, Oncology, Nephrology) admit the remaining half.
On March 2, 2009, the GIM CTU underwent a structural change from a bolus admission system to a trickle system of admissions to each care team. Figure 1 depicts a typical pre‐change admission pattern where each of the 4 care teams would admit a bolus of patients on a given day (left panel), and a typical post‐change admission pattern where the variation in daily admissions is smoothed out as a result of the trickle admission system (right panel). No change was made to care team members; each team consisted of an attending physician, 1 senior resident, 2 to 3 junior residents, 1 social worker, 1 physiotherapist, 1 occupational therapist, and 1 pharmacist. The Appendix provides a detailed description of the structural change.
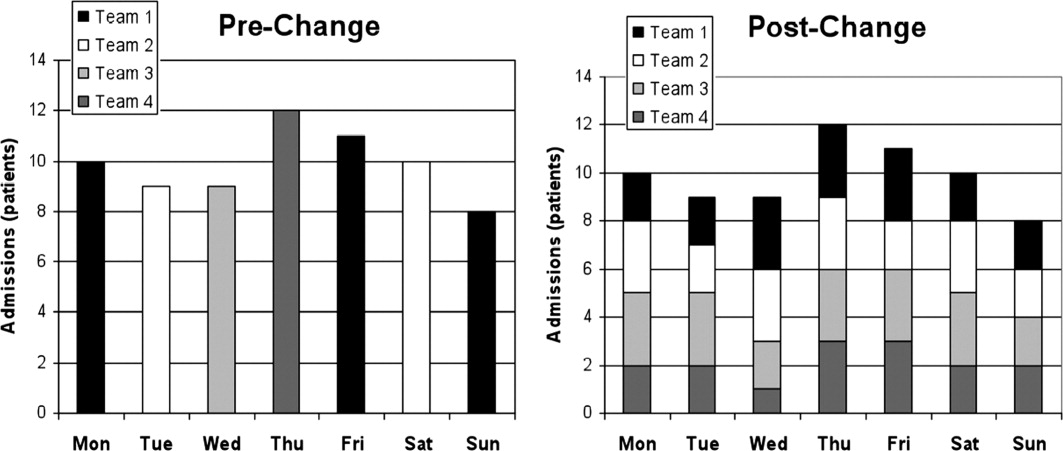
Data Collection
Records were obtained from the hospital's Electronic Patient Record, which contains information on socio‐demographics, diagnosis, length of stay (LOS), patient disposition, attending physician, and date of admission and discharge.
Data were collected for 2 time periods, the pre‐change period (March to August 2008) and the post‐change period (March to August 2009). The new system was implemented on March 2, 2009. The same months of 2 consecutive years were used to account for any seasonal variation in patient volumes and diagnoses. During the pre‐change and post‐change periods, the hospital maintained the same admitting and discharge policies and protocols. Similarly, the authors are unaware of any provincial‐wide government policies that would have impacted only 1 of either the pre‐change or post‐change periods.
Outcomes
Two main outcomes were studied, daily discharge rate (DDR)13 and LOS. DDR was expressed as the number of discharges on a particular day divided by the total patient census on that day. DDR was calculated by team, stratified by their call schedule status (on‐call, post‐call, postpost‐call, pre‐call, or none of these), and then aggregated. A day was defined as a 24‐hour period beginning at 8 AM. This was chosen because it better reflects the period when decisions are made and work is completed. Daily team‐specific patient census was measured at 8 AM. LOS was measured in days, calculated for each patient using the admission and discharge dates.
The DDR calculation included only those patients who were admitted and discharged within the study periods. For analysis of LOS, we also included patients admitted prior to, but discharged during, the study periods.
We included all patients admitted to GIM. Patient discharge dispositions were categorized into 5 groups: discharge home, interfacility transfers (discharged to long‐term care, rehabilitation, chronic care, etc), intrafacility transfers (to other inpatient services within the hospital), death, and left against medical advice. To focus on discharges that may be influenced by the team, for analysis of both DDR and LOS, only patients discharged home and interfacility and intrafacility transfers were included (deaths and patients who left against medical advice were not included).
Statistical Analysis
To assess whether the trickle system smoothed discharge rates, we fitted a logistic regression model and compared the variability in the log‐odds of discharge across the 4 main types of call days (on‐call, post‐call, postpost‐call, pre‐call) in the pre‐change and post‐change periods. The number of discharges on a given day was modeled as a binomial outcome with sample size equal to the census for that day and a log‐odds of discharge that depended on type of call day and a random error component. In this model, the effect of type of call day was allowed to be different in the pre‐change and post‐change periods. To account for the fact that data were collected on 180 consecutive days in each time period, we modeled the error component for each team in each time period as an autoregressive time series. We summarized the smoothness of discharge rates across type of call day in each period by calculating the variance of the corresponding regression parameters (the log‐odds ratios). By comparing the variances in the 2 periods, we were able to compute the probability that there was a reduction in variability, or equivalently, a smoothing of DDR. This model was fitted with Bayesian methods, implemented using Markov chain Monte Carlo (MCMC) techniques in the software WinBUGS.14 Uninformative priors were used for all parameters; model convergence was checked with the Gelman‐Brooks Rubin statistics. Further details are available from the authors on request. Summary estimates of discharge rates on the 4 main types of call day were calculated for the pre‐change and post‐change periods and plotted with 95% credible intervals.
Descriptive statistics were calculated for age, case mix group (CMG), total admission and discharges, and LOS. We chose to report median LOS, rather than the mean, because this modulates the influence of outliers in the samples.
KaplanMeier curves were also plotted for LOS. We tested for equality of the KaplanMeier curves using a weighted log‐rank test (G‐rho), which gave more weight to smaller LOS values (giving weight equal to the proportion of patients not yet discharged). This weighting was performed because an improvement in operational efficiency was more likely to have an effect on patients who could be discharged more quickly (<7 days) than patients whose discharge was delayed by factors outside the hospital's control.
All other statistical analyses were performed using R (version 2.10.1; R Foundation for Statistical Computing, Vienna, Austria).
This study was approved by The University Health Network Research Ethics Board.
RESULTS
During the 2 study periods, a total of 2734 patients were discharged, 1446 in the pre‐change period (1535 admitted), and 1288 in the post‐change period (1363 admitted). Table 1 presents mean age and primary CMG diagnosis.
| Pre‐Intervention Period (March 3August 29, 2008) 1446 Total Discharges (Mean Age [SD], 66 [18.6]) | Post‐Intervention Period (March 2August 28, 2009) 1288 Total Discharges (Mean Age [SD], 67 [18.8]) | |||
|---|---|---|---|---|
| CMG Rank | CMG Description | N (%) | CMG Description | N (%) |
| ||||
| Pneumonia | 117 (7.4) | Heart failure | 102 (7.4) | |
| 2 | Heart failure | 84 (5.3) | Pneumonia | 65 (4.7) |
| 3 | G.I. hemorrhage | 68 (4.3) | Esoph/gastro/misc digestive disorder | 61 (4.4) |
| 4 | Esoph/gastro/misc digestive disorder | 62 (3.9) | Lower urinary tract infection | 56 (4.1) |
| 5 | Red blood cell disorders | 59 (3.7) | G.I. hemorrhage | 52 (3.8) |
| 6 | Nutrit/misc metabolic disorder | 56 (3.5) | Nutrit/misc metabolic disorder | 47 (3.4) |
| 7 | Reticuloendothelial disorder | 56 (3.5) | Cerebrovascular disorder | 41 (3.0) |
| 8 | Lower urinary tract infection | 50 (3.2) | Red blood cell disorders | 40 (2.9) |
| 9 | Respiratory infect and inflamm | 42 (2.7) | Ungroupable input data | 36 (2.6) |
| 10 | Cerebrovascular disorder | 40 (2.5) | Chronic obstructive pulmonary disease | 33 (2.4) |
Figure 2 shows the estimated average team‐specific DDR's according to call schedule status, along with 95% credible intervals. With the exception of the postpost‐call day, each black point (2009, post‐change period) is closer to the overall average DDR of 9.9% than each corresponding gray point (2008, pre‐change period). In our Bayesian model, there was a 96.9% probability that the variability across call schedule status was reduced in the post‐change period, substantial evidence of smoother discharge rates across different types of call days.
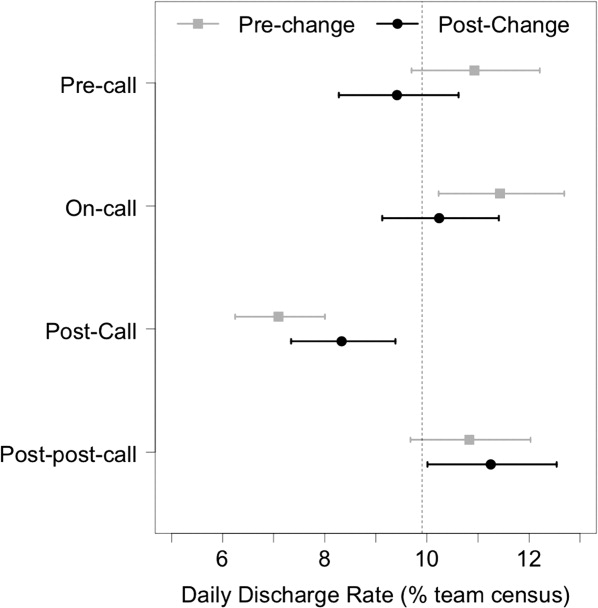
Summary statistics for the LOS for both groups can be seen in Table 2. The median LOS in the post‐change period was statistically significantly shorter than in the pre‐change period (4.8 days vs 5.1 days, P < 0.001).
| Pre‐Change | Post‐Change | ||
|---|---|---|---|
| |||
| N | 1446 | 1288 | t Test comparing means |
| Mean LOS (SD) | 8.7 (15) | 8.8 (16) | P = 0.89 |
| Wilcoxon rank‐sum test | |||
| Median LOS | 5.06 | 4.79 | P = 0.0065 |
Figure 3 shows the estimated KaplanMeier curves of time to discharge (LOS) in both time periods. Differences between the 2 study periods in the proportion of patients that had been discharged at each time point (the vertical distance between the curves) can be observed, particularly in the shorter LOS times.
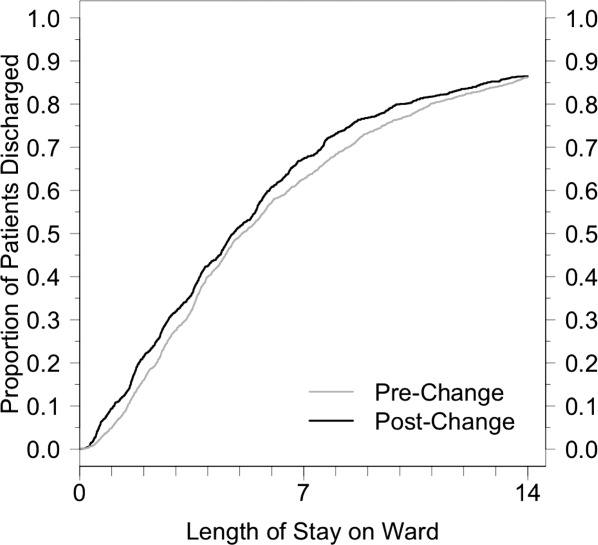
DISCUSSION
Previous studies have suggested that systems become more efficient when every day runs the same way.15 Achieving this for the number of daily discharges from the ward should have a positive effect on the flow of patients through the GIM service.16 Wong et al. showed how the on call schedule of medical personnel had a strong effect on the variation in daily discharges.17 A more recent study by the same authors demonstrated, through a computer simulation model, that smoothing patient discharges over the course of the week decreases the number of ED beds occupied by admitted patients.18 After introducing a structural change to our admission system that made the daily admissions of patients to each care team uniform, we showed a significant reduction in the variation of discharge rates from day to day, and the expected improvement in patient flow as shown by a decrease in the median LOS.
This intervention changed only 1 component of a complex patient care process, of which the resident on‐call schedule is only a small part. Nevertheless, this small change, designed to optimize the doctors' contribution to patient flow, was sufficient in effecting a significant reduction in the variation of the DDR. Inpatients follow a usual course in the hospital, requiring an average LOS of 4 to 5 days. In the bolus system of admissions, we observed what was essentially a cohort effect where the same bolus of patients was discharged on roughly the same day, an average of 4 to 5 days after admission. If the daily variation in discharges were only dependent on the daily variation in admissions, by making the influx of inpatients constant, we should have eliminated this cohort effect. Although the variation in discharges was reduced, it was not completely eliminated, suggesting that elements of the old system are retained. It is possible that the senior resident's management of the patients on the team has a stronger influence than that of other members of the team, and the flow of patients may still be affected by their call schedule.
We observed a significant reduction (0.3 days) in median LOS. By making each day look the same for admissions to each care team, and by making each day look more uniform for discharges from each care team, we were able to improve our unit's operational efficiency. Other benefits of the new system included: less cross‐coverage, since after‐hours there was always a member of each team to look after their own patients; the elimination of the post‐call day for the entire team; and the relatively decreased average daily workload.
The bulk of the reduction in median LOS was attributed to short‐stay patients. The flow of very sick patients who require prolonged inpatient treatment, or those waiting for post‐acute care beds (rehabilitation, long‐term care, convalescence, etc) may be less sensitive to improvements in internal efficiencies.
Although the improvement in LOS was modest, it was certainly no worse than in the older system, and the change was accompanied by the many other benefits already mentioned. In fact, ours is not the only hospital in the city that has made this change. Early results of a qualitative study exploring the perceptions of attending staff, residents, and students of the new systemparticularly its effects on the educational experienceare encouraging, showing overall positive opinions about the change. Further studies aimed at analyzing the barriers to efficient patient discharges may help identify important factors, such as those already mentioned, that this change in structure did not address. Policymakers could address other components of the discharge process, particularly the chronic shortage of post‐acute care beds. Finally, an economic analysis could provide insights about the potential savings that such structural changes could represent.
This study has several limitations. It took place in a single teaching hospital in Canada and, therefore, may not be generalizable to community hospitals or to settings that do not provide single‐payer free public healthcare. Nevertheless, most hospital units are subject to the effects of medical personnel scheduling, and the variation in patient flow processes that this produces. The current resident association collective agreement in Ontario still allows trainees to be scheduled for continuous 24‐hour duty periods. An exact replication of our structure would not be possible in settings with more stringent duty‐hour restrictions. Nevertheless, the goal of the structural change was to make the influx of patients to each care team constant, and this is achievable regardless of the length of the trainee call period. Although there is no reason to suspect a systematic difference in the mix of patients from 2008 to 2009, it would have been preferable to use a propensity score to compare clinical characteristics of the 2 patient groups. We used a relatively new metric, DDR, which was created in our institution and already has been used in several studies. However, it has not yet been validated in other centers.
One of the limitations of a before‐and‐after analysis is our inability to adjust for other changes that may have occurred during the study periods. These known and unknown factors may have had effects on the findings.
CONCLUSIONS
A new admission structure was introduced to the GIM CTU in March 2009, with the intention of changing the admissions to each care team from a bolus to a trickle system. This study was a real‐world demonstration of a concept that had, until this point, only been observed in robust simulation models. When the daily influx of patients to a care team becomes constant, the number of discharges from that team experience less daily variation, and the overall efficiency of the team improves, as measured by a reduction in the median LOS. Standardizing the care processes on the GIM inpatient ward improves overall efficiency and capacity.
- ,.Systematic review of emergency department crowding: causes, effects, and solutions.Ann Emerg Med.2008;52(2):126–136.
- ,,, et al.Fewer intensive care unit refusals and a higher capacity utilization by using a cyclic surgical case schedule.J Crit Care.2008;23(2):222–226.
- .Reengineering hospital discharge: a protocol to improve patient safety, reduce costs, and boost patient satisfaction.Am J Med Qual.2009;24(4):344–346.
- ,.Emergency department overcrowding: the impact of resource scarcity on physician job satisfaction.J Healthc Manag.2005;50(5):327–342.
- ,,.Managing variation in demand: lessons from the UK National Health Service.J Healthc Manag.2006;51(5):309–322.
- ,,,,,.The timing of neonatal discharge: an example of unwarranted variation?Pediatrics.2001;107(1):73–77.
- ,,,,.Restricted weekend service inappropriately delays discharge after acute myocardial infarction.Heart.2002;87(3):216–219.
- ,,, et al.Effect of short call admission on length of stay and quality of care for acute decompensated heart failure.Circulation.2008;117(20):2637–2644.
- ,,,,.House staff team workload and organization effects on patient outcomes in an academic general internal medicine inpatient service.Arch Intern Med.2007;167(1):47–52.
- ,,, et al.Implementation of a physician assistant/hospitalist service in an academic medical center: impact on efficiency and patient outcomes.J Hosp Med.2008;3(5):361–368.
- ,,,,.Evaluation of a redesign initiative in an internal‐medicine residency.N Engl J Med.2010;362(14):1304–1311.
- ,,, et al.Association of workload of on‐call medical interns with on‐call sleep duration, shift duration, and participation in educational activities.JAMA.2008;300(10):1146–1153.
- ,,,,.Real‐time operational feedback: daily discharge rate as a novel hospital efficiency metric.Qual Saf Health Care.2010;19(6):e32.
- ,,,.WinBUGS—a Bayesian modelling framework: concepts, structure, and extensibility.Statistics and Computing.2000;10(4):325–337.
- Institute for Healthcare Improvement. Optimizing patient flow: moving patients smoothly through acute care settings;2003. Available at: http://www.ihi.org.
- Canadian Institute for Health Information. Waiting for health care in Canada: what we know and what we don't know;2006. Available at: http://www.cihi.ca.
- ,,, et al.How much do operational processes affect hospital inpatient discharge rates?J Public Health (Oxf).2009;31(4):546–553.
- ,,,,.Smoothing inpatient discharges decreases emergency department congestion: a system dynamics simulation model.Emerg Med J.2010;27(8):593–598.
Smooth and timely hospital patient flow can have multiple positive effects including reduced wait times for services, decreased congestion in the Emergency Department (ED), and increased patient and staff satisfaction.14 One way to improve patient flow is to remove variation along the care pathway.57
For teaching hospitals that provide team‐based care, 1 significant source of variation involves the emergent admission process.8, 9 Typically, for services that admit the majority of their patients from the ED, 1 team is assigned to all admitting duties on a particular day; the on‐call team. While teams rotate between designations of on‐call, post‐call, and pre‐call over the course of the week, only the team designated on‐call accepts new admissions. This bolus call structure creates the need for extensive cross‐coverage, large variations in team admissions, and disparate team workloads.1012 Moreover, the effects of these variations may persist and extend along the care pathway, ultimately impacting timely patient discharge. Therefore, interventions aimed at improving the admission process may be candidates for improved patient flow.
The objective of this study is to evaluate the effect of changing the admission process from a bolus admission system to a trickle system that evenly distributes newly admitted patients to each of the physician‐led care teams. We hypothesize that by removing variation within the team admission process, team workload will be smoothed and ultimately result in patients being discharged by the team in a more uniform pattern. We evaluate this hypothesis by measuring length of stay and daily discharge rate.
METHODS
Setting
This retrospective study was conducted on the General Internal Medicine clinical teaching unit (GIM CTU) at a large academic tertiary care center in Toronto, Canada. GIM provides acute, nonsurgical care to a patient population composed primarily of elderly patients with complex chronic illnesses. GIM receives 98% of its inpatient admissions from the ED. On a daily basis, the ED sees approximately 100 patients, of which nearly 20% are admitted to hospital. GIM constitutes the single largest admitting service in the ED, admitting nearly half of all emergent admissions. Surgical and specialized medical services (eg, Cardiology, Oncology, Nephrology) admit the remaining half.
On March 2, 2009, the GIM CTU underwent a structural change from a bolus admission system to a trickle system of admissions to each care team. Figure 1 depicts a typical pre‐change admission pattern where each of the 4 care teams would admit a bolus of patients on a given day (left panel), and a typical post‐change admission pattern where the variation in daily admissions is smoothed out as a result of the trickle admission system (right panel). No change was made to care team members; each team consisted of an attending physician, 1 senior resident, 2 to 3 junior residents, 1 social worker, 1 physiotherapist, 1 occupational therapist, and 1 pharmacist. The Appendix provides a detailed description of the structural change.
Data Collection
Records were obtained from the hospital's Electronic Patient Record, which contains information on socio‐demographics, diagnosis, length of stay (LOS), patient disposition, attending physician, and date of admission and discharge.
Data were collected for 2 time periods, the pre‐change period (March to August 2008) and the post‐change period (March to August 2009). The new system was implemented on March 2, 2009. The same months of 2 consecutive years were used to account for any seasonal variation in patient volumes and diagnoses. During the pre‐change and post‐change periods, the hospital maintained the same admitting and discharge policies and protocols. Similarly, the authors are unaware of any provincial‐wide government policies that would have impacted only 1 of either the pre‐change or post‐change periods.
Outcomes
Two main outcomes were studied, daily discharge rate (DDR)13 and LOS. DDR was expressed as the number of discharges on a particular day divided by the total patient census on that day. DDR was calculated by team, stratified by their call schedule status (on‐call, post‐call, postpost‐call, pre‐call, or none of these), and then aggregated. A day was defined as a 24‐hour period beginning at 8 AM. This was chosen because it better reflects the period when decisions are made and work is completed. Daily team‐specific patient census was measured at 8 AM. LOS was measured in days, calculated for each patient using the admission and discharge dates.
The DDR calculation included only those patients who were admitted and discharged within the study periods. For analysis of LOS, we also included patients admitted prior to, but discharged during, the study periods.
We included all patients admitted to GIM. Patient discharge dispositions were categorized into 5 groups: discharge home, interfacility transfers (discharged to long‐term care, rehabilitation, chronic care, etc), intrafacility transfers (to other inpatient services within the hospital), death, and left against medical advice. To focus on discharges that may be influenced by the team, for analysis of both DDR and LOS, only patients discharged home and interfacility and intrafacility transfers were included (deaths and patients who left against medical advice were not included).
Statistical Analysis
To assess whether the trickle system smoothed discharge rates, we fitted a logistic regression model and compared the variability in the log‐odds of discharge across the 4 main types of call days (on‐call, post‐call, postpost‐call, pre‐call) in the pre‐change and post‐change periods. The number of discharges on a given day was modeled as a binomial outcome with sample size equal to the census for that day and a log‐odds of discharge that depended on type of call day and a random error component. In this model, the effect of type of call day was allowed to be different in the pre‐change and post‐change periods. To account for the fact that data were collected on 180 consecutive days in each time period, we modeled the error component for each team in each time period as an autoregressive time series. We summarized the smoothness of discharge rates across type of call day in each period by calculating the variance of the corresponding regression parameters (the log‐odds ratios). By comparing the variances in the 2 periods, we were able to compute the probability that there was a reduction in variability, or equivalently, a smoothing of DDR. This model was fitted with Bayesian methods, implemented using Markov chain Monte Carlo (MCMC) techniques in the software WinBUGS.14 Uninformative priors were used for all parameters; model convergence was checked with the Gelman‐Brooks Rubin statistics. Further details are available from the authors on request. Summary estimates of discharge rates on the 4 main types of call day were calculated for the pre‐change and post‐change periods and plotted with 95% credible intervals.
Descriptive statistics were calculated for age, case mix group (CMG), total admission and discharges, and LOS. We chose to report median LOS, rather than the mean, because this modulates the influence of outliers in the samples.
KaplanMeier curves were also plotted for LOS. We tested for equality of the KaplanMeier curves using a weighted log‐rank test (G‐rho), which gave more weight to smaller LOS values (giving weight equal to the proportion of patients not yet discharged). This weighting was performed because an improvement in operational efficiency was more likely to have an effect on patients who could be discharged more quickly (<7 days) than patients whose discharge was delayed by factors outside the hospital's control.
All other statistical analyses were performed using R (version 2.10.1; R Foundation for Statistical Computing, Vienna, Austria).
This study was approved by The University Health Network Research Ethics Board.
RESULTS
During the 2 study periods, a total of 2734 patients were discharged, 1446 in the pre‐change period (1535 admitted), and 1288 in the post‐change period (1363 admitted). Table 1 presents mean age and primary CMG diagnosis.
| Pre‐Intervention Period (March 3August 29, 2008) 1446 Total Discharges (Mean Age [SD], 66 [18.6]) | Post‐Intervention Period (March 2August 28, 2009) 1288 Total Discharges (Mean Age [SD], 67 [18.8]) | |||
|---|---|---|---|---|
| CMG Rank | CMG Description | N (%) | CMG Description | N (%) |
| ||||
| Pneumonia | 117 (7.4) | Heart failure | 102 (7.4) | |
| 2 | Heart failure | 84 (5.3) | Pneumonia | 65 (4.7) |
| 3 | G.I. hemorrhage | 68 (4.3) | Esoph/gastro/misc digestive disorder | 61 (4.4) |
| 4 | Esoph/gastro/misc digestive disorder | 62 (3.9) | Lower urinary tract infection | 56 (4.1) |
| 5 | Red blood cell disorders | 59 (3.7) | G.I. hemorrhage | 52 (3.8) |
| 6 | Nutrit/misc metabolic disorder | 56 (3.5) | Nutrit/misc metabolic disorder | 47 (3.4) |
| 7 | Reticuloendothelial disorder | 56 (3.5) | Cerebrovascular disorder | 41 (3.0) |
| 8 | Lower urinary tract infection | 50 (3.2) | Red blood cell disorders | 40 (2.9) |
| 9 | Respiratory infect and inflamm | 42 (2.7) | Ungroupable input data | 36 (2.6) |
| 10 | Cerebrovascular disorder | 40 (2.5) | Chronic obstructive pulmonary disease | 33 (2.4) |
Figure 2 shows the estimated average team‐specific DDR's according to call schedule status, along with 95% credible intervals. With the exception of the postpost‐call day, each black point (2009, post‐change period) is closer to the overall average DDR of 9.9% than each corresponding gray point (2008, pre‐change period). In our Bayesian model, there was a 96.9% probability that the variability across call schedule status was reduced in the post‐change period, substantial evidence of smoother discharge rates across different types of call days.
Summary statistics for the LOS for both groups can be seen in Table 2. The median LOS in the post‐change period was statistically significantly shorter than in the pre‐change period (4.8 days vs 5.1 days, P < 0.001).
| Pre‐Change | Post‐Change | ||
|---|---|---|---|
| |||
| N | 1446 | 1288 | t Test comparing means |
| Mean LOS (SD) | 8.7 (15) | 8.8 (16) | P = 0.89 |
| Wilcoxon rank‐sum test | |||
| Median LOS | 5.06 | 4.79 | P = 0.0065 |
Figure 3 shows the estimated KaplanMeier curves of time to discharge (LOS) in both time periods. Differences between the 2 study periods in the proportion of patients that had been discharged at each time point (the vertical distance between the curves) can be observed, particularly in the shorter LOS times.
DISCUSSION
Previous studies have suggested that systems become more efficient when every day runs the same way.15 Achieving this for the number of daily discharges from the ward should have a positive effect on the flow of patients through the GIM service.16 Wong et al. showed how the on call schedule of medical personnel had a strong effect on the variation in daily discharges.17 A more recent study by the same authors demonstrated, through a computer simulation model, that smoothing patient discharges over the course of the week decreases the number of ED beds occupied by admitted patients.18 After introducing a structural change to our admission system that made the daily admissions of patients to each care team uniform, we showed a significant reduction in the variation of discharge rates from day to day, and the expected improvement in patient flow as shown by a decrease in the median LOS.
This intervention changed only 1 component of a complex patient care process, of which the resident on‐call schedule is only a small part. Nevertheless, this small change, designed to optimize the doctors' contribution to patient flow, was sufficient in effecting a significant reduction in the variation of the DDR. Inpatients follow a usual course in the hospital, requiring an average LOS of 4 to 5 days. In the bolus system of admissions, we observed what was essentially a cohort effect where the same bolus of patients was discharged on roughly the same day, an average of 4 to 5 days after admission. If the daily variation in discharges were only dependent on the daily variation in admissions, by making the influx of inpatients constant, we should have eliminated this cohort effect. Although the variation in discharges was reduced, it was not completely eliminated, suggesting that elements of the old system are retained. It is possible that the senior resident's management of the patients on the team has a stronger influence than that of other members of the team, and the flow of patients may still be affected by their call schedule.
We observed a significant reduction (0.3 days) in median LOS. By making each day look the same for admissions to each care team, and by making each day look more uniform for discharges from each care team, we were able to improve our unit's operational efficiency. Other benefits of the new system included: less cross‐coverage, since after‐hours there was always a member of each team to look after their own patients; the elimination of the post‐call day for the entire team; and the relatively decreased average daily workload.
The bulk of the reduction in median LOS was attributed to short‐stay patients. The flow of very sick patients who require prolonged inpatient treatment, or those waiting for post‐acute care beds (rehabilitation, long‐term care, convalescence, etc) may be less sensitive to improvements in internal efficiencies.
Although the improvement in LOS was modest, it was certainly no worse than in the older system, and the change was accompanied by the many other benefits already mentioned. In fact, ours is not the only hospital in the city that has made this change. Early results of a qualitative study exploring the perceptions of attending staff, residents, and students of the new systemparticularly its effects on the educational experienceare encouraging, showing overall positive opinions about the change. Further studies aimed at analyzing the barriers to efficient patient discharges may help identify important factors, such as those already mentioned, that this change in structure did not address. Policymakers could address other components of the discharge process, particularly the chronic shortage of post‐acute care beds. Finally, an economic analysis could provide insights about the potential savings that such structural changes could represent.
This study has several limitations. It took place in a single teaching hospital in Canada and, therefore, may not be generalizable to community hospitals or to settings that do not provide single‐payer free public healthcare. Nevertheless, most hospital units are subject to the effects of medical personnel scheduling, and the variation in patient flow processes that this produces. The current resident association collective agreement in Ontario still allows trainees to be scheduled for continuous 24‐hour duty periods. An exact replication of our structure would not be possible in settings with more stringent duty‐hour restrictions. Nevertheless, the goal of the structural change was to make the influx of patients to each care team constant, and this is achievable regardless of the length of the trainee call period. Although there is no reason to suspect a systematic difference in the mix of patients from 2008 to 2009, it would have been preferable to use a propensity score to compare clinical characteristics of the 2 patient groups. We used a relatively new metric, DDR, which was created in our institution and already has been used in several studies. However, it has not yet been validated in other centers.
One of the limitations of a before‐and‐after analysis is our inability to adjust for other changes that may have occurred during the study periods. These known and unknown factors may have had effects on the findings.
CONCLUSIONS
A new admission structure was introduced to the GIM CTU in March 2009, with the intention of changing the admissions to each care team from a bolus to a trickle system. This study was a real‐world demonstration of a concept that had, until this point, only been observed in robust simulation models. When the daily influx of patients to a care team becomes constant, the number of discharges from that team experience less daily variation, and the overall efficiency of the team improves, as measured by a reduction in the median LOS. Standardizing the care processes on the GIM inpatient ward improves overall efficiency and capacity.
- ,.Systematic review of emergency department crowding: causes, effects, and solutions.Ann Emerg Med.2008;52(2):126–136.
- ,,, et al.Fewer intensive care unit refusals and a higher capacity utilization by using a cyclic surgical case schedule.J Crit Care.2008;23(2):222–226.
- .Reengineering hospital discharge: a protocol to improve patient safety, reduce costs, and boost patient satisfaction.Am J Med Qual.2009;24(4):344–346.
- ,.Emergency department overcrowding: the impact of resource scarcity on physician job satisfaction.J Healthc Manag.2005;50(5):327–342.
- ,,.Managing variation in demand: lessons from the UK National Health Service.J Healthc Manag.2006;51(5):309–322.
- ,,,,,.The timing of neonatal discharge: an example of unwarranted variation?Pediatrics.2001;107(1):73–77.
- ,,,,.Restricted weekend service inappropriately delays discharge after acute myocardial infarction.Heart.2002;87(3):216–219.
- ,,, et al.Effect of short call admission on length of stay and quality of care for acute decompensated heart failure.Circulation.2008;117(20):2637–2644.
- ,,,,.House staff team workload and organization effects on patient outcomes in an academic general internal medicine inpatient service.Arch Intern Med.2007;167(1):47–52.
- ,,, et al.Implementation of a physician assistant/hospitalist service in an academic medical center: impact on efficiency and patient outcomes.J Hosp Med.2008;3(5):361–368.
- ,,,,.Evaluation of a redesign initiative in an internal‐medicine residency.N Engl J Med.2010;362(14):1304–1311.
- ,,, et al.Association of workload of on‐call medical interns with on‐call sleep duration, shift duration, and participation in educational activities.JAMA.2008;300(10):1146–1153.
- ,,,,.Real‐time operational feedback: daily discharge rate as a novel hospital efficiency metric.Qual Saf Health Care.2010;19(6):e32.
- ,,,.WinBUGS—a Bayesian modelling framework: concepts, structure, and extensibility.Statistics and Computing.2000;10(4):325–337.
- Institute for Healthcare Improvement. Optimizing patient flow: moving patients smoothly through acute care settings;2003. Available at: http://www.ihi.org.
- Canadian Institute for Health Information. Waiting for health care in Canada: what we know and what we don't know;2006. Available at: http://www.cihi.ca.
- ,,, et al.How much do operational processes affect hospital inpatient discharge rates?J Public Health (Oxf).2009;31(4):546–553.
- ,,,,.Smoothing inpatient discharges decreases emergency department congestion: a system dynamics simulation model.Emerg Med J.2010;27(8):593–598.
