User login
Continuous Admission Model Reduces LOS
Smooth and timely hospital patient flow can have multiple positive effects including reduced wait times for services, decreased congestion in the Emergency Department (ED), and increased patient and staff satisfaction.14 One way to improve patient flow is to remove variation along the care pathway.57
For teaching hospitals that provide team‐based care, 1 significant source of variation involves the emergent admission process.8, 9 Typically, for services that admit the majority of their patients from the ED, 1 team is assigned to all admitting duties on a particular day; the on‐call team. While teams rotate between designations of on‐call, post‐call, and pre‐call over the course of the week, only the team designated on‐call accepts new admissions. This bolus call structure creates the need for extensive cross‐coverage, large variations in team admissions, and disparate team workloads.1012 Moreover, the effects of these variations may persist and extend along the care pathway, ultimately impacting timely patient discharge. Therefore, interventions aimed at improving the admission process may be candidates for improved patient flow.
The objective of this study is to evaluate the effect of changing the admission process from a bolus admission system to a trickle system that evenly distributes newly admitted patients to each of the physician‐led care teams. We hypothesize that by removing variation within the team admission process, team workload will be smoothed and ultimately result in patients being discharged by the team in a more uniform pattern. We evaluate this hypothesis by measuring length of stay and daily discharge rate.
METHODS
Setting
This retrospective study was conducted on the General Internal Medicine clinical teaching unit (GIM CTU) at a large academic tertiary care center in Toronto, Canada. GIM provides acute, nonsurgical care to a patient population composed primarily of elderly patients with complex chronic illnesses. GIM receives 98% of its inpatient admissions from the ED. On a daily basis, the ED sees approximately 100 patients, of which nearly 20% are admitted to hospital. GIM constitutes the single largest admitting service in the ED, admitting nearly half of all emergent admissions. Surgical and specialized medical services (eg, Cardiology, Oncology, Nephrology) admit the remaining half.
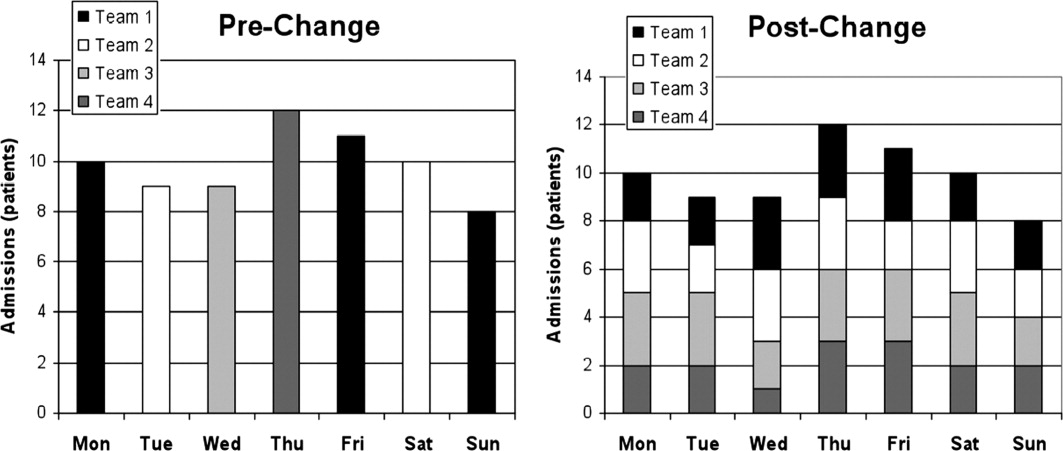
On March 2, 2009, the GIM CTU underwent a structural change from a bolus admission system to a trickle system of admissions to each care team. Figure 1 depicts a typical pre‐change admission pattern where each of the 4 care teams would admit a bolus of patients on a given day (left panel), and a typical post‐change admission pattern where the variation in daily admissions is smoothed out as a result of the trickle admission system (right panel). No change was made to care team members; each team consisted of an attending physician, 1 senior resident, 2 to 3 junior residents, 1 social worker, 1 physiotherapist, 1 occupational therapist, and 1 pharmacist. The Appendix provides a detailed description of the structural change.
Data Collection
Records were obtained from the hospital's Electronic Patient Record, which contains information on socio‐demographics, diagnosis, length of stay (LOS), patient disposition, attending physician, and date of admission and discharge.
Data were collected for 2 time periods, the pre‐change period (March to August 2008) and the post‐change period (March to August 2009). The new system was implemented on March 2, 2009. The same months of 2 consecutive years were used to account for any seasonal variation in patient volumes and diagnoses. During the pre‐change and post‐change periods, the hospital maintained the same admitting and discharge policies and protocols. Similarly, the authors are unaware of any provincial‐wide government policies that would have impacted only 1 of either the pre‐change or post‐change periods.
Outcomes
Two main outcomes were studied, daily discharge rate (DDR)13 and LOS. DDR was expressed as the number of discharges on a particular day divided by the total patient census on that day. DDR was calculated by team, stratified by their call schedule status (on‐call, post‐call, postpost‐call, pre‐call, or none of these), and then aggregated. A day was defined as a 24‐hour period beginning at 8 AM. This was chosen because it better reflects the period when decisions are made and work is completed. Daily team‐specific patient census was measured at 8 AM. LOS was measured in days, calculated for each patient using the admission and discharge dates.
The DDR calculation included only those patients who were admitted and discharged within the study periods. For analysis of LOS, we also included patients admitted prior to, but discharged during, the study periods.
We included all patients admitted to GIM. Patient discharge dispositions were categorized into 5 groups: discharge home, interfacility transfers (discharged to long‐term care, rehabilitation, chronic care, etc), intrafacility transfers (to other inpatient services within the hospital), death, and left against medical advice. To focus on discharges that may be influenced by the team, for analysis of both DDR and LOS, only patients discharged home and interfacility and intrafacility transfers were included (deaths and patients who left against medical advice were not included).
Statistical Analysis
To assess whether the trickle system smoothed discharge rates, we fitted a logistic regression model and compared the variability in the log‐odds of discharge across the 4 main types of call days (on‐call, post‐call, postpost‐call, pre‐call) in the pre‐change and post‐change periods. The number of discharges on a given day was modeled as a binomial outcome with sample size equal to the census for that day and a log‐odds of discharge that depended on type of call day and a random error component. In this model, the effect of type of call day was allowed to be different in the pre‐change and post‐change periods. To account for the fact that data were collected on 180 consecutive days in each time period, we modeled the error component for each team in each time period as an autoregressive time series. We summarized the smoothness of discharge rates across type of call day in each period by calculating the variance of the corresponding regression parameters (the log‐odds ratios). By comparing the variances in the 2 periods, we were able to compute the probability that there was a reduction in variability, or equivalently, a smoothing of DDR. This model was fitted with Bayesian methods, implemented using Markov chain Monte Carlo (MCMC) techniques in the software WinBUGS.14 Uninformative priors were used for all parameters; model convergence was checked with the Gelman‐Brooks Rubin statistics. Further details are available from the authors on request. Summary estimates of discharge rates on the 4 main types of call day were calculated for the pre‐change and post‐change periods and plotted with 95% credible intervals.
Descriptive statistics were calculated for age, case mix group (CMG), total admission and discharges, and LOS. We chose to report median LOS, rather than the mean, because this modulates the influence of outliers in the samples.
KaplanMeier curves were also plotted for LOS. We tested for equality of the KaplanMeier curves using a weighted log‐rank test (G‐rho), which gave more weight to smaller LOS values (giving weight equal to the proportion of patients not yet discharged). This weighting was performed because an improvement in operational efficiency was more likely to have an effect on patients who could be discharged more quickly (<7 days) than patients whose discharge was delayed by factors outside the hospital's control.
All other statistical analyses were performed using R (version 2.10.1; R Foundation for Statistical Computing, Vienna, Austria).
This study was approved by The University Health Network Research Ethics Board.
RESULTS
During the 2 study periods, a total of 2734 patients were discharged, 1446 in the pre‐change period (1535 admitted), and 1288 in the post‐change period (1363 admitted). Table 1 presents mean age and primary CMG diagnosis.
| Pre‐Intervention Period (March 3August 29, 2008) 1446 Total Discharges (Mean Age [SD], 66 [18.6]) | Post‐Intervention Period (March 2August 28, 2009) 1288 Total Discharges (Mean Age [SD], 67 [18.8]) | |||
|---|---|---|---|---|
| CMG Rank | CMG Description | N (%) | CMG Description | N (%) |
| ||||
| Pneumonia | 117 (7.4) | Heart failure | 102 (7.4) | |
| 2 | Heart failure | 84 (5.3) | Pneumonia | 65 (4.7) |
| 3 | G.I. hemorrhage | 68 (4.3) | Esoph/gastro/misc digestive disorder | 61 (4.4) |
| 4 | Esoph/gastro/misc digestive disorder | 62 (3.9) | Lower urinary tract infection | 56 (4.1) |
| 5 | Red blood cell disorders | 59 (3.7) | G.I. hemorrhage | 52 (3.8) |
| 6 | Nutrit/misc metabolic disorder | 56 (3.5) | Nutrit/misc metabolic disorder | 47 (3.4) |
| 7 | Reticuloendothelial disorder | 56 (3.5) | Cerebrovascular disorder | 41 (3.0) |
| 8 | Lower urinary tract infection | 50 (3.2) | Red blood cell disorders | 40 (2.9) |
| 9 | Respiratory infect and inflamm | 42 (2.7) | Ungroupable input data | 36 (2.6) |
| 10 | Cerebrovascular disorder | 40 (2.5) | Chronic obstructive pulmonary disease | 33 (2.4) |
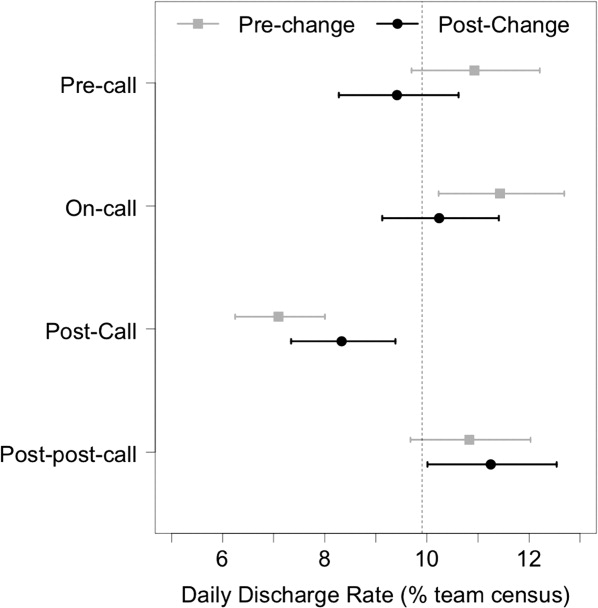
Figure 2 shows the estimated average team‐specific DDR's according to call schedule status, along with 95% credible intervals. With the exception of the postpost‐call day, each black point (2009, post‐change period) is closer to the overall average DDR of 9.9% than each corresponding gray point (2008, pre‐change period). In our Bayesian model, there was a 96.9% probability that the variability across call schedule status was reduced in the post‐change period, substantial evidence of smoother discharge rates across different types of call days.
Summary statistics for the LOS for both groups can be seen in Table 2. The median LOS in the post‐change period was statistically significantly shorter than in the pre‐change period (4.8 days vs 5.1 days, P < 0.001).
| Pre‐Change | Post‐Change | ||
|---|---|---|---|
| |||
| N | 1446 | 1288 | t Test comparing means |
| Mean LOS (SD) | 8.7 (15) | 8.8 (16) | P = 0.89 |
| Wilcoxon rank‐sum test | |||
| Median LOS | 5.06 | 4.79 | P = 0.0065 |
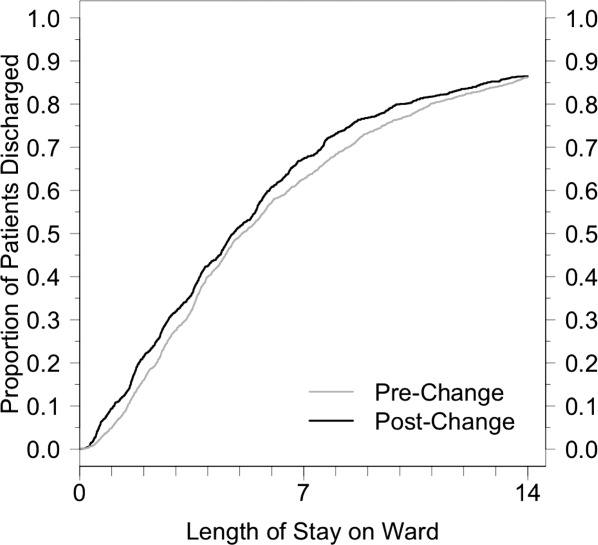
Figure 3 shows the estimated KaplanMeier curves of time to discharge (LOS) in both time periods. Differences between the 2 study periods in the proportion of patients that had been discharged at each time point (the vertical distance between the curves) can be observed, particularly in the shorter LOS times.
DISCUSSION
Previous studies have suggested that systems become more efficient when every day runs the same way.15 Achieving this for the number of daily discharges from the ward should have a positive effect on the flow of patients through the GIM service.16 Wong et al. showed how the on call schedule of medical personnel had a strong effect on the variation in daily discharges.17 A more recent study by the same authors demonstrated, through a computer simulation model, that smoothing patient discharges over the course of the week decreases the number of ED beds occupied by admitted patients.18 After introducing a structural change to our admission system that made the daily admissions of patients to each care team uniform, we showed a significant reduction in the variation of discharge rates from day to day, and the expected improvement in patient flow as shown by a decrease in the median LOS.
This intervention changed only 1 component of a complex patient care process, of which the resident on‐call schedule is only a small part. Nevertheless, this small change, designed to optimize the doctors' contribution to patient flow, was sufficient in effecting a significant reduction in the variation of the DDR. Inpatients follow a usual course in the hospital, requiring an average LOS of 4 to 5 days. In the bolus system of admissions, we observed what was essentially a cohort effect where the same bolus of patients was discharged on roughly the same day, an average of 4 to 5 days after admission. If the daily variation in discharges were only dependent on the daily variation in admissions, by making the influx of inpatients constant, we should have eliminated this cohort effect. Although the variation in discharges was reduced, it was not completely eliminated, suggesting that elements of the old system are retained. It is possible that the senior resident's management of the patients on the team has a stronger influence than that of other members of the team, and the flow of patients may still be affected by their call schedule.
We observed a significant reduction (0.3 days) in median LOS. By making each day look the same for admissions to each care team, and by making each day look more uniform for discharges from each care team, we were able to improve our unit's operational efficiency. Other benefits of the new system included: less cross‐coverage, since after‐hours there was always a member of each team to look after their own patients; the elimination of the post‐call day for the entire team; and the relatively decreased average daily workload.
The bulk of the reduction in median LOS was attributed to short‐stay patients. The flow of very sick patients who require prolonged inpatient treatment, or those waiting for post‐acute care beds (rehabilitation, long‐term care, convalescence, etc) may be less sensitive to improvements in internal efficiencies.
Although the improvement in LOS was modest, it was certainly no worse than in the older system, and the change was accompanied by the many other benefits already mentioned. In fact, ours is not the only hospital in the city that has made this change. Early results of a qualitative study exploring the perceptions of attending staff, residents, and students of the new systemparticularly its effects on the educational experienceare encouraging, showing overall positive opinions about the change. Further studies aimed at analyzing the barriers to efficient patient discharges may help identify important factors, such as those already mentioned, that this change in structure did not address. Policymakers could address other components of the discharge process, particularly the chronic shortage of post‐acute care beds. Finally, an economic analysis could provide insights about the potential savings that such structural changes could represent.
This study has several limitations. It took place in a single teaching hospital in Canada and, therefore, may not be generalizable to community hospitals or to settings that do not provide single‐payer free public healthcare. Nevertheless, most hospital units are subject to the effects of medical personnel scheduling, and the variation in patient flow processes that this produces. The current resident association collective agreement in Ontario still allows trainees to be scheduled for continuous 24‐hour duty periods. An exact replication of our structure would not be possible in settings with more stringent duty‐hour restrictions. Nevertheless, the goal of the structural change was to make the influx of patients to each care team constant, and this is achievable regardless of the length of the trainee call period. Although there is no reason to suspect a systematic difference in the mix of patients from 2008 to 2009, it would have been preferable to use a propensity score to compare clinical characteristics of the 2 patient groups. We used a relatively new metric, DDR, which was created in our institution and already has been used in several studies. However, it has not yet been validated in other centers.
One of the limitations of a before‐and‐after analysis is our inability to adjust for other changes that may have occurred during the study periods. These known and unknown factors may have had effects on the findings.
CONCLUSIONS
A new admission structure was introduced to the GIM CTU in March 2009, with the intention of changing the admissions to each care team from a bolus to a trickle system. This study was a real‐world demonstration of a concept that had, until this point, only been observed in robust simulation models. When the daily influx of patients to a care team becomes constant, the number of discharges from that team experience less daily variation, and the overall efficiency of the team improves, as measured by a reduction in the median LOS. Standardizing the care processes on the GIM inpatient ward improves overall efficiency and capacity.
- ,.Systematic review of emergency department crowding: causes, effects, and solutions.Ann Emerg Med.2008;52(2):126–136.
- ,,, et al.Fewer intensive care unit refusals and a higher capacity utilization by using a cyclic surgical case schedule.J Crit Care.2008;23(2):222–226.
- .Reengineering hospital discharge: a protocol to improve patient safety, reduce costs, and boost patient satisfaction.Am J Med Qual.2009;24(4):344–346.
- ,.Emergency department overcrowding: the impact of resource scarcity on physician job satisfaction.J Healthc Manag.2005;50(5):327–342.
- ,,.Managing variation in demand: lessons from the UK National Health Service.J Healthc Manag.2006;51(5):309–322.
- ,,,,,.The timing of neonatal discharge: an example of unwarranted variation?Pediatrics.2001;107(1):73–77.
- ,,,,.Restricted weekend service inappropriately delays discharge after acute myocardial infarction.Heart.2002;87(3):216–219.
- ,,, et al.Effect of short call admission on length of stay and quality of care for acute decompensated heart failure.Circulation.2008;117(20):2637–2644.
- ,,,,.House staff team workload and organization effects on patient outcomes in an academic general internal medicine inpatient service.Arch Intern Med.2007;167(1):47–52.
- ,,, et al.Implementation of a physician assistant/hospitalist service in an academic medical center: impact on efficiency and patient outcomes.J Hosp Med.2008;3(5):361–368.
- ,,,,.Evaluation of a redesign initiative in an internal‐medicine residency.N Engl J Med.2010;362(14):1304–1311.
- ,,, et al.Association of workload of on‐call medical interns with on‐call sleep duration, shift duration, and participation in educational activities.JAMA.2008;300(10):1146–1153.
- ,,,,.Real‐time operational feedback: daily discharge rate as a novel hospital efficiency metric.Qual Saf Health Care.2010;19(6):e32.
- ,,,.WinBUGS—a Bayesian modelling framework: concepts, structure, and extensibility.Statistics and Computing.2000;10(4):325–337.
- Institute for Healthcare Improvement. Optimizing patient flow: moving patients smoothly through acute care settings;2003. Available at: http://www.ihi.org.
- Canadian Institute for Health Information. Waiting for health care in Canada: what we know and what we don't know;2006. Available at: http://www.cihi.ca.
- ,,, et al.How much do operational processes affect hospital inpatient discharge rates?J Public Health (Oxf).2009;31(4):546–553.
- ,,,,.Smoothing inpatient discharges decreases emergency department congestion: a system dynamics simulation model.Emerg Med J.2010;27(8):593–598.
Smooth and timely hospital patient flow can have multiple positive effects including reduced wait times for services, decreased congestion in the Emergency Department (ED), and increased patient and staff satisfaction.14 One way to improve patient flow is to remove variation along the care pathway.57
For teaching hospitals that provide team‐based care, 1 significant source of variation involves the emergent admission process.8, 9 Typically, for services that admit the majority of their patients from the ED, 1 team is assigned to all admitting duties on a particular day; the on‐call team. While teams rotate between designations of on‐call, post‐call, and pre‐call over the course of the week, only the team designated on‐call accepts new admissions. This bolus call structure creates the need for extensive cross‐coverage, large variations in team admissions, and disparate team workloads.1012 Moreover, the effects of these variations may persist and extend along the care pathway, ultimately impacting timely patient discharge. Therefore, interventions aimed at improving the admission process may be candidates for improved patient flow.
The objective of this study is to evaluate the effect of changing the admission process from a bolus admission system to a trickle system that evenly distributes newly admitted patients to each of the physician‐led care teams. We hypothesize that by removing variation within the team admission process, team workload will be smoothed and ultimately result in patients being discharged by the team in a more uniform pattern. We evaluate this hypothesis by measuring length of stay and daily discharge rate.
METHODS
Setting
This retrospective study was conducted on the General Internal Medicine clinical teaching unit (GIM CTU) at a large academic tertiary care center in Toronto, Canada. GIM provides acute, nonsurgical care to a patient population composed primarily of elderly patients with complex chronic illnesses. GIM receives 98% of its inpatient admissions from the ED. On a daily basis, the ED sees approximately 100 patients, of which nearly 20% are admitted to hospital. GIM constitutes the single largest admitting service in the ED, admitting nearly half of all emergent admissions. Surgical and specialized medical services (eg, Cardiology, Oncology, Nephrology) admit the remaining half.
On March 2, 2009, the GIM CTU underwent a structural change from a bolus admission system to a trickle system of admissions to each care team. Figure 1 depicts a typical pre‐change admission pattern where each of the 4 care teams would admit a bolus of patients on a given day (left panel), and a typical post‐change admission pattern where the variation in daily admissions is smoothed out as a result of the trickle admission system (right panel). No change was made to care team members; each team consisted of an attending physician, 1 senior resident, 2 to 3 junior residents, 1 social worker, 1 physiotherapist, 1 occupational therapist, and 1 pharmacist. The Appendix provides a detailed description of the structural change.
Data Collection
Records were obtained from the hospital's Electronic Patient Record, which contains information on socio‐demographics, diagnosis, length of stay (LOS), patient disposition, attending physician, and date of admission and discharge.
Data were collected for 2 time periods, the pre‐change period (March to August 2008) and the post‐change period (March to August 2009). The new system was implemented on March 2, 2009. The same months of 2 consecutive years were used to account for any seasonal variation in patient volumes and diagnoses. During the pre‐change and post‐change periods, the hospital maintained the same admitting and discharge policies and protocols. Similarly, the authors are unaware of any provincial‐wide government policies that would have impacted only 1 of either the pre‐change or post‐change periods.
Outcomes
Two main outcomes were studied, daily discharge rate (DDR)13 and LOS. DDR was expressed as the number of discharges on a particular day divided by the total patient census on that day. DDR was calculated by team, stratified by their call schedule status (on‐call, post‐call, postpost‐call, pre‐call, or none of these), and then aggregated. A day was defined as a 24‐hour period beginning at 8 AM. This was chosen because it better reflects the period when decisions are made and work is completed. Daily team‐specific patient census was measured at 8 AM. LOS was measured in days, calculated for each patient using the admission and discharge dates.
The DDR calculation included only those patients who were admitted and discharged within the study periods. For analysis of LOS, we also included patients admitted prior to, but discharged during, the study periods.
We included all patients admitted to GIM. Patient discharge dispositions were categorized into 5 groups: discharge home, interfacility transfers (discharged to long‐term care, rehabilitation, chronic care, etc), intrafacility transfers (to other inpatient services within the hospital), death, and left against medical advice. To focus on discharges that may be influenced by the team, for analysis of both DDR and LOS, only patients discharged home and interfacility and intrafacility transfers were included (deaths and patients who left against medical advice were not included).
Statistical Analysis
To assess whether the trickle system smoothed discharge rates, we fitted a logistic regression model and compared the variability in the log‐odds of discharge across the 4 main types of call days (on‐call, post‐call, postpost‐call, pre‐call) in the pre‐change and post‐change periods. The number of discharges on a given day was modeled as a binomial outcome with sample size equal to the census for that day and a log‐odds of discharge that depended on type of call day and a random error component. In this model, the effect of type of call day was allowed to be different in the pre‐change and post‐change periods. To account for the fact that data were collected on 180 consecutive days in each time period, we modeled the error component for each team in each time period as an autoregressive time series. We summarized the smoothness of discharge rates across type of call day in each period by calculating the variance of the corresponding regression parameters (the log‐odds ratios). By comparing the variances in the 2 periods, we were able to compute the probability that there was a reduction in variability, or equivalently, a smoothing of DDR. This model was fitted with Bayesian methods, implemented using Markov chain Monte Carlo (MCMC) techniques in the software WinBUGS.14 Uninformative priors were used for all parameters; model convergence was checked with the Gelman‐Brooks Rubin statistics. Further details are available from the authors on request. Summary estimates of discharge rates on the 4 main types of call day were calculated for the pre‐change and post‐change periods and plotted with 95% credible intervals.
Descriptive statistics were calculated for age, case mix group (CMG), total admission and discharges, and LOS. We chose to report median LOS, rather than the mean, because this modulates the influence of outliers in the samples.
KaplanMeier curves were also plotted for LOS. We tested for equality of the KaplanMeier curves using a weighted log‐rank test (G‐rho), which gave more weight to smaller LOS values (giving weight equal to the proportion of patients not yet discharged). This weighting was performed because an improvement in operational efficiency was more likely to have an effect on patients who could be discharged more quickly (<7 days) than patients whose discharge was delayed by factors outside the hospital's control.
All other statistical analyses were performed using R (version 2.10.1; R Foundation for Statistical Computing, Vienna, Austria).
This study was approved by The University Health Network Research Ethics Board.
RESULTS
During the 2 study periods, a total of 2734 patients were discharged, 1446 in the pre‐change period (1535 admitted), and 1288 in the post‐change period (1363 admitted). Table 1 presents mean age and primary CMG diagnosis.
| Pre‐Intervention Period (March 3August 29, 2008) 1446 Total Discharges (Mean Age [SD], 66 [18.6]) | Post‐Intervention Period (March 2August 28, 2009) 1288 Total Discharges (Mean Age [SD], 67 [18.8]) | |||
|---|---|---|---|---|
| CMG Rank | CMG Description | N (%) | CMG Description | N (%) |
| ||||
| Pneumonia | 117 (7.4) | Heart failure | 102 (7.4) | |
| 2 | Heart failure | 84 (5.3) | Pneumonia | 65 (4.7) |
| 3 | G.I. hemorrhage | 68 (4.3) | Esoph/gastro/misc digestive disorder | 61 (4.4) |
| 4 | Esoph/gastro/misc digestive disorder | 62 (3.9) | Lower urinary tract infection | 56 (4.1) |
| 5 | Red blood cell disorders | 59 (3.7) | G.I. hemorrhage | 52 (3.8) |
| 6 | Nutrit/misc metabolic disorder | 56 (3.5) | Nutrit/misc metabolic disorder | 47 (3.4) |
| 7 | Reticuloendothelial disorder | 56 (3.5) | Cerebrovascular disorder | 41 (3.0) |
| 8 | Lower urinary tract infection | 50 (3.2) | Red blood cell disorders | 40 (2.9) |
| 9 | Respiratory infect and inflamm | 42 (2.7) | Ungroupable input data | 36 (2.6) |
| 10 | Cerebrovascular disorder | 40 (2.5) | Chronic obstructive pulmonary disease | 33 (2.4) |
Figure 2 shows the estimated average team‐specific DDR's according to call schedule status, along with 95% credible intervals. With the exception of the postpost‐call day, each black point (2009, post‐change period) is closer to the overall average DDR of 9.9% than each corresponding gray point (2008, pre‐change period). In our Bayesian model, there was a 96.9% probability that the variability across call schedule status was reduced in the post‐change period, substantial evidence of smoother discharge rates across different types of call days.
Summary statistics for the LOS for both groups can be seen in Table 2. The median LOS in the post‐change period was statistically significantly shorter than in the pre‐change period (4.8 days vs 5.1 days, P < 0.001).
| Pre‐Change | Post‐Change | ||
|---|---|---|---|
| |||
| N | 1446 | 1288 | t Test comparing means |
| Mean LOS (SD) | 8.7 (15) | 8.8 (16) | P = 0.89 |
| Wilcoxon rank‐sum test | |||
| Median LOS | 5.06 | 4.79 | P = 0.0065 |
Figure 3 shows the estimated KaplanMeier curves of time to discharge (LOS) in both time periods. Differences between the 2 study periods in the proportion of patients that had been discharged at each time point (the vertical distance between the curves) can be observed, particularly in the shorter LOS times.
DISCUSSION
Previous studies have suggested that systems become more efficient when every day runs the same way.15 Achieving this for the number of daily discharges from the ward should have a positive effect on the flow of patients through the GIM service.16 Wong et al. showed how the on call schedule of medical personnel had a strong effect on the variation in daily discharges.17 A more recent study by the same authors demonstrated, through a computer simulation model, that smoothing patient discharges over the course of the week decreases the number of ED beds occupied by admitted patients.18 After introducing a structural change to our admission system that made the daily admissions of patients to each care team uniform, we showed a significant reduction in the variation of discharge rates from day to day, and the expected improvement in patient flow as shown by a decrease in the median LOS.
This intervention changed only 1 component of a complex patient care process, of which the resident on‐call schedule is only a small part. Nevertheless, this small change, designed to optimize the doctors' contribution to patient flow, was sufficient in effecting a significant reduction in the variation of the DDR. Inpatients follow a usual course in the hospital, requiring an average LOS of 4 to 5 days. In the bolus system of admissions, we observed what was essentially a cohort effect where the same bolus of patients was discharged on roughly the same day, an average of 4 to 5 days after admission. If the daily variation in discharges were only dependent on the daily variation in admissions, by making the influx of inpatients constant, we should have eliminated this cohort effect. Although the variation in discharges was reduced, it was not completely eliminated, suggesting that elements of the old system are retained. It is possible that the senior resident's management of the patients on the team has a stronger influence than that of other members of the team, and the flow of patients may still be affected by their call schedule.
We observed a significant reduction (0.3 days) in median LOS. By making each day look the same for admissions to each care team, and by making each day look more uniform for discharges from each care team, we were able to improve our unit's operational efficiency. Other benefits of the new system included: less cross‐coverage, since after‐hours there was always a member of each team to look after their own patients; the elimination of the post‐call day for the entire team; and the relatively decreased average daily workload.
The bulk of the reduction in median LOS was attributed to short‐stay patients. The flow of very sick patients who require prolonged inpatient treatment, or those waiting for post‐acute care beds (rehabilitation, long‐term care, convalescence, etc) may be less sensitive to improvements in internal efficiencies.
Although the improvement in LOS was modest, it was certainly no worse than in the older system, and the change was accompanied by the many other benefits already mentioned. In fact, ours is not the only hospital in the city that has made this change. Early results of a qualitative study exploring the perceptions of attending staff, residents, and students of the new systemparticularly its effects on the educational experienceare encouraging, showing overall positive opinions about the change. Further studies aimed at analyzing the barriers to efficient patient discharges may help identify important factors, such as those already mentioned, that this change in structure did not address. Policymakers could address other components of the discharge process, particularly the chronic shortage of post‐acute care beds. Finally, an economic analysis could provide insights about the potential savings that such structural changes could represent.
This study has several limitations. It took place in a single teaching hospital in Canada and, therefore, may not be generalizable to community hospitals or to settings that do not provide single‐payer free public healthcare. Nevertheless, most hospital units are subject to the effects of medical personnel scheduling, and the variation in patient flow processes that this produces. The current resident association collective agreement in Ontario still allows trainees to be scheduled for continuous 24‐hour duty periods. An exact replication of our structure would not be possible in settings with more stringent duty‐hour restrictions. Nevertheless, the goal of the structural change was to make the influx of patients to each care team constant, and this is achievable regardless of the length of the trainee call period. Although there is no reason to suspect a systematic difference in the mix of patients from 2008 to 2009, it would have been preferable to use a propensity score to compare clinical characteristics of the 2 patient groups. We used a relatively new metric, DDR, which was created in our institution and already has been used in several studies. However, it has not yet been validated in other centers.
One of the limitations of a before‐and‐after analysis is our inability to adjust for other changes that may have occurred during the study periods. These known and unknown factors may have had effects on the findings.
CONCLUSIONS
A new admission structure was introduced to the GIM CTU in March 2009, with the intention of changing the admissions to each care team from a bolus to a trickle system. This study was a real‐world demonstration of a concept that had, until this point, only been observed in robust simulation models. When the daily influx of patients to a care team becomes constant, the number of discharges from that team experience less daily variation, and the overall efficiency of the team improves, as measured by a reduction in the median LOS. Standardizing the care processes on the GIM inpatient ward improves overall efficiency and capacity.
- ,.Systematic review of emergency department crowding: causes, effects, and solutions.Ann Emerg Med.2008;52(2):126–136.
- ,,, et al.Fewer intensive care unit refusals and a higher capacity utilization by using a cyclic surgical case schedule.J Crit Care.2008;23(2):222–226.
- .Reengineering hospital discharge: a protocol to improve patient safety, reduce costs, and boost patient satisfaction.Am J Med Qual.2009;24(4):344–346.
- ,.Emergency department overcrowding: the impact of resource scarcity on physician job satisfaction.J Healthc Manag.2005;50(5):327–342.
- ,,.Managing variation in demand: lessons from the UK National Health Service.J Healthc Manag.2006;51(5):309–322.
- ,,,,,.The timing of neonatal discharge: an example of unwarranted variation?Pediatrics.2001;107(1):73–77.
- ,,,,.Restricted weekend service inappropriately delays discharge after acute myocardial infarction.Heart.2002;87(3):216–219.
- ,,, et al.Effect of short call admission on length of stay and quality of care for acute decompensated heart failure.Circulation.2008;117(20):2637–2644.
- ,,,,.House staff team workload and organization effects on patient outcomes in an academic general internal medicine inpatient service.Arch Intern Med.2007;167(1):47–52.
- ,,, et al.Implementation of a physician assistant/hospitalist service in an academic medical center: impact on efficiency and patient outcomes.J Hosp Med.2008;3(5):361–368.
- ,,,,.Evaluation of a redesign initiative in an internal‐medicine residency.N Engl J Med.2010;362(14):1304–1311.
- ,,, et al.Association of workload of on‐call medical interns with on‐call sleep duration, shift duration, and participation in educational activities.JAMA.2008;300(10):1146–1153.
- ,,,,.Real‐time operational feedback: daily discharge rate as a novel hospital efficiency metric.Qual Saf Health Care.2010;19(6):e32.
- ,,,.WinBUGS—a Bayesian modelling framework: concepts, structure, and extensibility.Statistics and Computing.2000;10(4):325–337.
- Institute for Healthcare Improvement. Optimizing patient flow: moving patients smoothly through acute care settings;2003. Available at: http://www.ihi.org.
- Canadian Institute for Health Information. Waiting for health care in Canada: what we know and what we don't know;2006. Available at: http://www.cihi.ca.
- ,,, et al.How much do operational processes affect hospital inpatient discharge rates?J Public Health (Oxf).2009;31(4):546–553.
- ,,,,.Smoothing inpatient discharges decreases emergency department congestion: a system dynamics simulation model.Emerg Med J.2010;27(8):593–598.
