User login
Relationship between Hospital 30-Day Mortality Rates for Heart Failure and Patterns of Early Inpatient Comfort Care
In an effort to improve the quality of care delivered to heart failure (HF) patients, the Centers for Medicare & Medicaid Services (CMS) publish hospitals’ 30-day risk-standardized mortality rates (RSMRs) for HF.1 These mortality rates are also used by CMS to determine the financial penalties and bonuses that hospitals receive as part of the national Hospital Value-based Purchasing program.2 Whether or not these efforts effectively direct patients towards high-quality providers or motivate hospitals to provide better care, few would disagree with the overarching goal of decreasing the number of patients who die from HF.
However, for some patients with chronic disease at the end of life, goals of care may change. The quality of days lived may become more important than the quantity of days lived. As a consequence, high-quality care for some patients at the end of life is associated with withdrawing life-sustaining or life-extending therapies. Over time, this therapeutic perspective has become more common, with use of hospice care doubling from 23% to 47% between 2000 and 2012 among Medicare beneficiaries who died.3 For a national cohort of older patients admitted with HF—not just those patients who died in that same year—hospitals’ rates of referral to hospice are considerably lower, averaging 2.9% in 2010 in a national study.4 Nevertheless, it is possible that hospitals that more faithfully follow their dying patients’ wishes and withdraw life-prolonging interventions and provide comfort-focused care at the end of life might be unfairly penalized if such efforts resulted in higher mortality rates than other hospitals.
Therefore, we used Medicare data linked to a national HF registry with information about end-of-life care, to address 3 questions: (1) How much do hospitals vary in their rates of early comfort care and how has this changed over time; (2) What hospital and patient factors are associated with higher early comfort care rates; and (3) Is there a correlation between 30-day risk-adjusted mortality rates for HF with hospital rates of early comfort care?
METHODS
Data Sources
We used data from the American Heart Association’s Get With The Guidelines-Heart Failure (GWTG-HF) registry. GWTG-HF is a voluntary, inpatient, quality improvement registry5-7 that uses web-based tools and standard questionnaires to collect data on patients with HF admitted to participating hospitals nationwide. The data include information from admission (eg, sociodemographic characteristics, symptoms, medical history, and initial laboratory and test results), the inpatient stay (eg, therapies), and discharge (eg, discharge destination, whether and when comfort care was initiated). We linked the GWTG-HF registry data to Medicare claims data in order to obtain information about Medicare eligibility and patient comorbidities. Additionally, we used data from the American Hospital Association (2008) for hospital characteristics. Quintiles Real-World & Late Phase Research (Cambridge, MA) serves as the data coordinating center for GWTG-HF and the Duke Clinical Research Institute (Durham, NC) serves as the statistical analytic center. GWTG-HF participating sites have a waiver of informed consent because the data are de-identified and primarily used for quality improvement. All analyses performed on this data have been approved by the Duke Medical Center Institutional Review Board.
Study Population
Study Outcomes
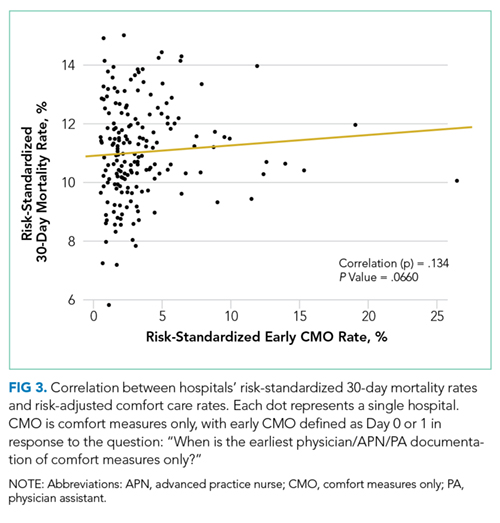
Our outcome of interest was the correlation between a hospital’s rate of initiating early CMO for admitted HF patients and a hospital’s 30-day RSMR for HF. The GWTG-HF questionnaire8 asks “When is the earliest physician/advanced practice nurse/physician assistant documentation of comfort measures only?” and permits 4 responses: day 0 or 1, day 2 or after, timing unclear, or not documented/unable to determine. We defined early CMO as CMO on day 0 or 1, and late/no CMO as any other response. We chose to examine early comfort care because many hospitalized patients transition to comfort care before they die if the death is in any way predictable. Thus, if comfort care is measured at any time during the hospitalization, hospitals that have high mortality rates are likely to have high comfort care rates. Therefore, we chose to use the more precise measure of early comfort care. We created hospital-level, risk-standardized early comfort care rates using the same risk-adjustment model used for RSMRs but with the outcome of early comfort care instead of mortality.9,10
RSMRs were calculated using a validated GWTG-HF 30-day risk-standardized mortality model9 with additional variables identified from other GWTG-HF analyses.10 The 30 days are measured as the 30 days after the index admission date.
Statistical Analyses
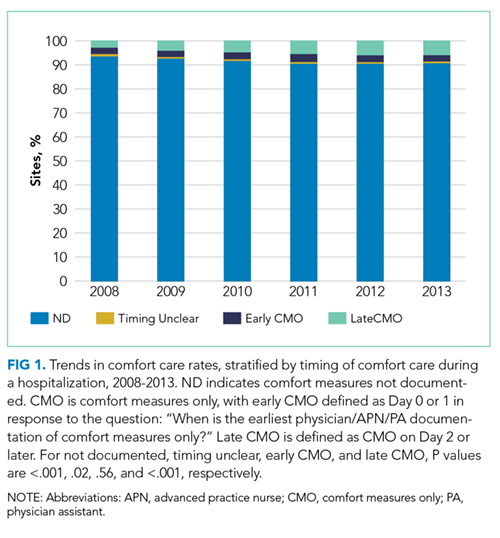
We described trends in early comfort care rates over time, from February 17, 2008, to February 17, 2014, using the Cochran-Armitage test for trend. We then grouped hospitals into quintiles based on their unadjusted early comfort care rates. We described patient and hospital characteristics for each quintile, using χ2 tests to test for differences across quintiles for categorical variables and Wilcoxon rank sum tests to assess for differences across quintiles for continuous variables. We then examined the Spearman’s rank correlation between hospitals’ RSMR and risk-adjusted comfort care rates. Finally, we compared hospital-level RSMRs before and after adjusting for early comfort care.
We performed risk-adjustment for these last 2 analyses as follows. For each patient, covariates were obtained from the GWTG-HF registry. Clinical data captured for the index admission were utilized in the risk-adjustment model (for both RSMRs and risk-adjusted comfort care rates). Included covariates were as follows: age (per 10 years); race (black vs non-black); systolic blood pressure at admission ≤170 (per 10 mm Hg); respiratory rate (per 5 respirations/min); heart rate ≤105 (per 10 beats/min); weight ≤100 (per 5 kg); weight >100 (per 5 kg); blood urea nitrogen (per 10 mg/dl); brain natriuretic peptide ≤2000 (per 500 pg/ml); hemoglobin 10-14 (per 1 g/dl); troponin abnormal (vs normal); creatinine ≤1 (per 1 mg/dl); sodium 130-140 (per 5 mEq/l); and chronic obstructive pulmonary disease or asthma.
Hierarchical logistic regression modeling was used to calculate the hospital-specific RSMR. A predicted/expected ratio similar to an observed/expected (O/E) ratio was calculated using the following modifications: (1) instead of the observed (crude) number of deaths, the numerator is the number of deaths predicted by the hierarchical model among a hospital’s patients given the patients’ risk factors and the hospital-specific effect; (2) the denominator is the expected number of deaths among the hospital’s patients given the patients’ risk factors and the average of all hospital-specific effects overall; and (3) the ratio of the numerator and denominator are then multiplied by the observed overall mortality rate (same as O/E). This calculation is the method used by CMS to derive RSMRs.11 Multiple imputation was used to handle missing data in the models; 25 imputed datasets using the fully conditional specification method were created. Patients with missing prior comorbidities were assumed to not have those conditions. Hospital characteristics were not imputed; therefore, for analyses that required construction of risk-adjusted comfort care rates or RSMRs, we excluded 18,867 patients cared for at 82 hospitals missing hospital characteristics. We ran 2 sets of models for risk-adjusted comfort care rates and RSMRs: the first adjusted only for patient characteristics, and the second adjusted for both patient and hospital characteristics. Results from the 2 models were similar, so we present only results from the latter. Variance inflation factors were all <2, indicating the collinearity between covariates was not an issue.
All statistical analyses were performed by using SAS version 9.4 (SAS Institute, Cary, NC). We tested for statistical significance by using 2-tailed tests and considered P values <.05 to be statistically significant.
RESULTS
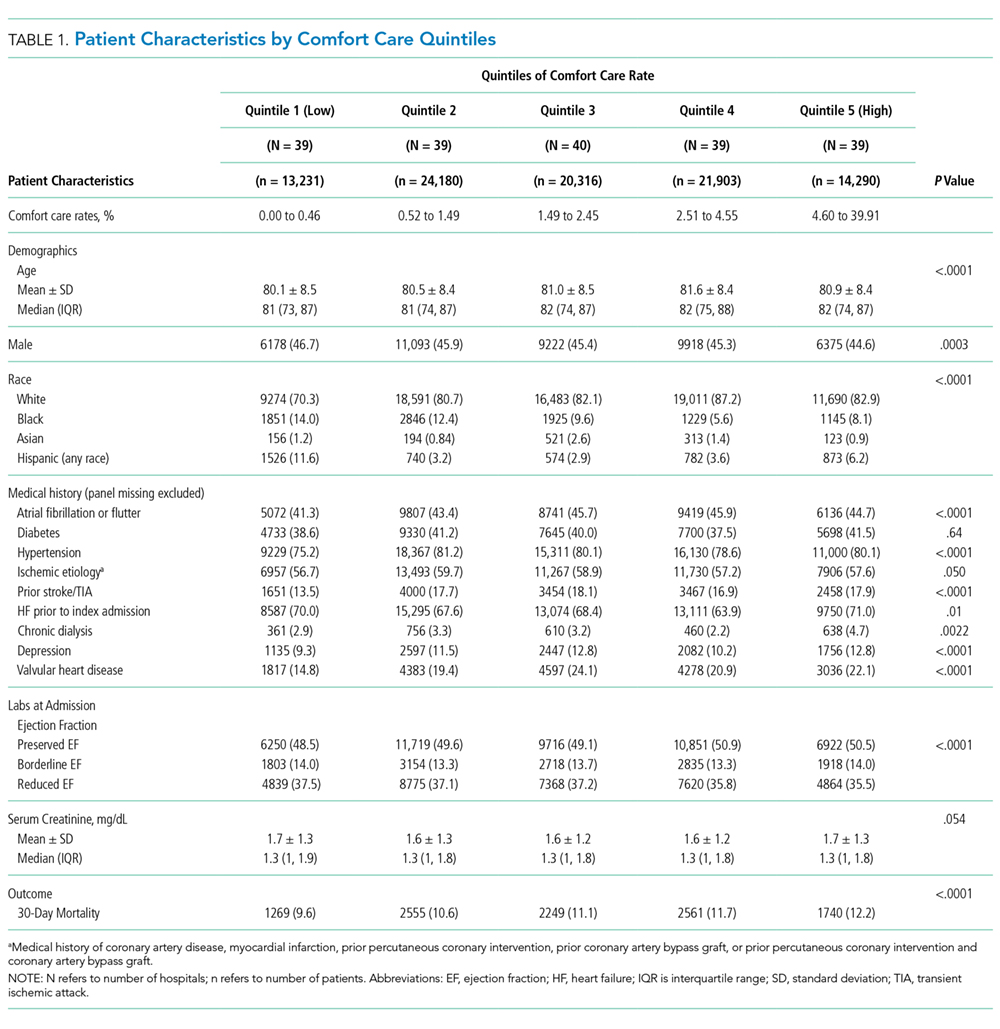
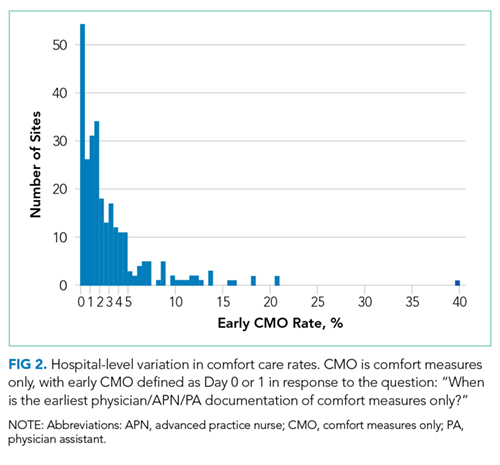
Of the 272 hospitals included in our final study cohort, the observed median overall rate of early comfort care in this study was 1.9% (25th to 75th percentile: 0.9% to 4.0%); hospitals varied widely in unadjusted early comfort care rates (0.00% to 0.46% in the lowest quintile, and 4.60% to 39.91% in the highest quintile; Table 1).
DISCUSSION
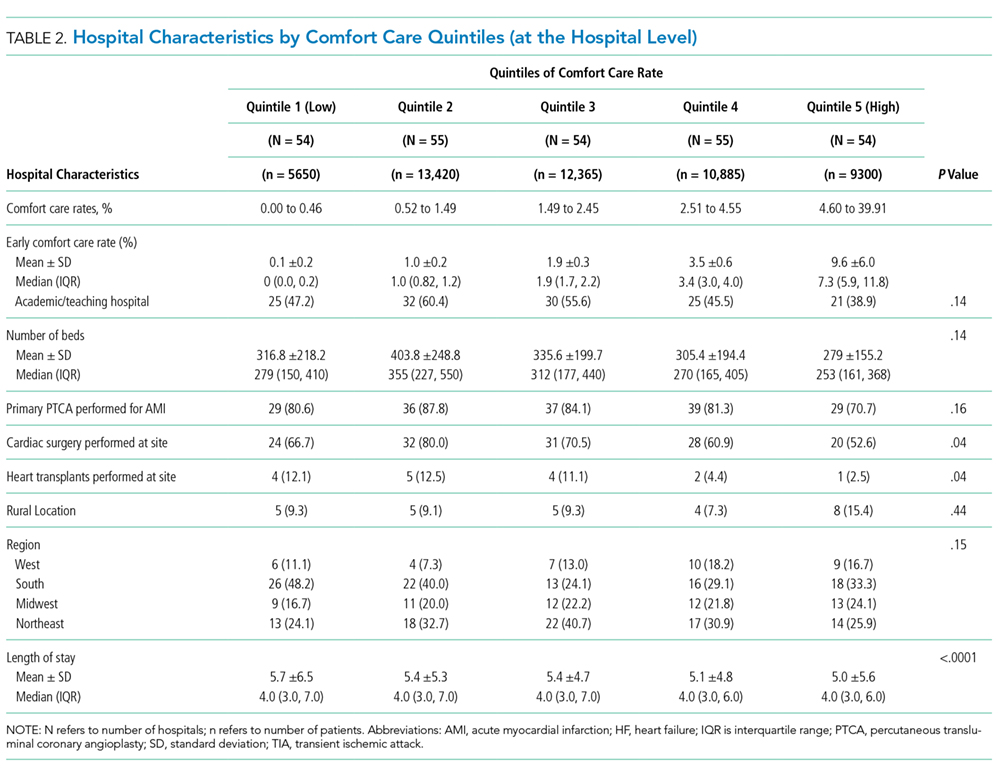
Among a national sample of US hospitals, we found wide variation in how frequently health care providers deliver comfort care within the first 2 days of admission for HF. A minority of hospitals reported no early comfort care on any patients throughout the 6-year study period, but hospitals in the highest quintile initiated early comfort care rates for at least 1 in 20 HF patients. Hospitals that were more likely to initiate early comfort care had a higher proportion of female and white patients and were less likely to have the capacity to deliver aggressive surgical interventions such as heart transplants. Hospital-level 30-day RSMRs were not correlated with rates of early comfort care.
While the appropriate rate of early comfort care for patients hospitalized with HF is unknown, given that the average hospital RSMR is approximately 12% for fee-for-service Medicare patients hospitalized with HF,12 it is surprising that some hospitals initiated early comfort care on none or very few of their HF patients. It is quite possible that many of these hospitals initiated comfort care for some of their patients after 48 hours of hospitalization. We were unable to estimate the average period of time patients received comfort care prior to dying, the degree to which this varies across hospitals or why it might vary, and whether the length of time between comfort care initiation and death is related to satisfaction with end-of-life care. Future research on these topics would help inform providers seeking to deliver better end-of-life care. In this study, we also were unable to estimate how often early comfort care was not initiated because patients had a good prognosis. However, prior studies have suggested low rates of comfort care or hospice referral even among patients at very high estimated mortality risk.4 It is also possible that providers and families had concerns about the ability to accurately prognosticate, although several models have been shown to perform acceptably for patients hospitalized with HF.13
We found that comfort care rates did not increase over time, even though use of hospice care doubled among Medicare beneficiaries between 2000 and 2012. By way of context, cancer—the second leading cause of death in the US—was responsible for 38% of hospice admissions in 2013, whereas heart disease (including but not limited to HF)—the leading cause of death— was responsible for 13% of hospice admissions.14 The 2013 American College of Cardiology Foundation and the American Heart Association guidelines for HF recommend consideration of hospice or palliative care for inpatient and transitional care.15 In future work, it would be important to better understand the drivers behind decisions around comfort care for patients hospitalized with HF.
With regards to the policy implications of our study, we found that on average, adjusting 30-day mortality rates for early comfort care was not associated with a change in hospital mortality rankings. For those hospitals with high comfort care rates, adjusting for comfort care did lower mortality rates, but the change was so small as to be clinically insignificant. CMS’ RSMR for HF excludes patients enrolled in hospice during the 12 months prior to index admission, including the first day of the index admission, acknowledging that death may not be an untoward outcome for such patients.16 Fee-for-service Medicare beneficiaries excluded for hospice enrollment comprised 1.29% of HF admissions from July 2012 to June 201516 and are likely a subset of early comfort care patients in our sample, both because of the inclusiveness of chart review (vs claims-based identification) and because we defined early comfort care as comfort care initiated on day 0 or 1 of hospitalization. Nevertheless, with our data we cannot assess to what degree our findings were due solely to hospice patients excluded from CMS’ current estimates.
Prior research has described the underuse of palliative care among patients with HF17 and the association of palliative care with better patient and family experiences at the end of life.18-20 We add to this literature by describing the epidemiology—prevalence, changes over time, and associated factors—of early comfort care for HF in a national sample of hospitals. This serves as a baseline for future work on end-of-life care among patients hospitalized for HF. Our findings also contribute to ongoing discussion about how best to risk-adjust mortality metrics used to assess hospital quality in pay-for-performance programs. Recent research on stroke and pneumonia based on California data suggests that not accounting for do-not-resuscitate (DNR) status biases hospital mortality rates.21,22 Earlier research examined the impact of adjusting hospital mortality rates for DNR for a broader range of conditions.23,24 We expand this line of inquiry by examining the hospital-level association of early comfort care with mortality rates for HF, utilizing a national, contemporary cohort of inpatient stays. In addition, while studies have found that DNR rates within the first 24 hours of admission are relatively high (median 15.8% for pneumonia; 13.3% for stroke),21,22 comfort care is distinct from DNR.
Our findings should be interpreted in the context of several potential limitations. First, we did not have any information about patient or family wishes regarding end-of-life care, or the exact timing of early comfort care (eg, day 0 or day 1). The initiation of comfort care usually follows conversations about end-of-life care involving a patient, his or her family, and the medical team. Thus, we do not know if low early comfort care rates represent the lack of such a conversation (and thus poor-quality care) or the desire by most patients not to initiate early comfort care (and thus high-quality care). This would be an important area for future research. Second, we included only patients admitted to hospitals that participate in GWTG-HF, a voluntary quality improvement initiative. This may limit the generalizability of our findings, but it is unclear how our sample might bias our findings. Hospitals engaged in quality improvement may be more likely to initiate early comfort care aligned with patients’ wishes; on the other hand, hospitals with advanced surgical capabilities are over-represented in our sample and these hospitals are less likely to initiate early comfort care. Third, we examined associations and cannot make conclusions about causality. Residual measured and unmeasured confounding may influence these findings.
In summary, we found that early comfort care rates for fee-for-service Medicare beneficiaries admitted for HF varies widely among hospitals, but median rates of early comfort care have not changed over time. On average, there was no correlation between hospital-level, 30-day, RSMRs and rates of early comfort care. This suggests that current efforts to lower mortality rates have not had unintended consequences for hospitals that institute early comfort care more commonly than their peers.
Acknowledgments
Dr. Chen and Ms. Cox take responsibility for the integrity of the data and the accuracy of the data analysis. Drs. Chen, Levine, and Hayward are responsible for the study concept and design. Drs. Chen and Fonarow acquired the data. Dr. Chen drafted the manuscript. Drs. Chen, Levin, Hayward, Cox, Fonarow, DeVore, Hernandez, Heidenreich, and Yancy revised the manuscript for important intellectual content. Drs. Chen, Hayward, Cox, and Schulte performed the statistical analysis. Drs. Chen and Fonarow obtained funding for the study. Drs. Hayward and Fonarow supervised the study. The authors thank Bailey Green, MPH, for the research assistance she provided. She was compensated for her work.
Disclosure
Dr. Fonarow reports research support from the National Institutes of Health, and consulting for Amgen, Janssen, Novartis, Medtronic, and St Jude Medical. Dr. DeVore reports research support from the American Heart Association, Amgen, and Novartis, and consulting for Amgen. The other authors have no relevant conflicts of interest. Dr. Chen was supported by a Career Development Grant Award (K08HS020671) from the Agency for Healthcare Research and Quality when the manuscript was being prepared. She currently receives support from the Department of Health and Human Services Office of the Assistant Secretary for Planning and Evaluation for her work there. She also receives support from the Blue Cross Blue Shield of Michigan Foundation’s Investigator Initiated Research Program, the Agency for Healthcare Research and Quality (R01 HS024698), and the National Institute on Aging (P01 AG019783). These funding sources had no role in the preparation, review, or approval of the manuscript. The GWTG-HF program is provided by the American Heart Association. GWTG-HF has been funded in the past through support from Amgen, Medtronic, GlaxoSmithKline, Ortho-McNeil, and the American Heart Association Pharmaceutical Roundtable. These sponsors had no role in the study design, data analysis or manuscript preparation and revision.
1. Centers for Medicare & Medicaid Services. Hospital Compare. https://www.medicare.gov/hospitalcompare/. Accessed on November 27, 2016.
2. Centers for Medicare & Medicaid Services. Hospital Value-based Purchasing. https://www.medicare.gov/hospitalcompare/data/hospital-vbp.html. Accessed August 30, 2017.
3. Medicare Payment Advisory Comission. Report to the Congress: Medicare payment policy. 2014. http://www.medpac.gov/docs/default-source/reports/mar14_entirereport.pdf. Accessed August 31, 2017.
4. Whellan DJ, Cox M, Hernandez AF, et al. Utilization of hospice and predicted mortality risk among older patients hospitalized with heart failure: findings from GWTG-HF. J Card Fail. 2012;18(6):471-477. PubMed
5. Hong Y, LaBresh KA. Overview of the American Heart Association “Get with the Guidelines” programs: coronary heart disease, stroke, and heart failure. Crit Pathw Cardiol. 2006;5(4):179-186. PubMed
6. LaBresh KA, Gliklich R, Liljestrand J, Peto R, Ellrodt AG. Using “get with the guidelines” to improve cardiovascular secondary prevention. Jt Comm J Qual Saf. 2003;29(10):539-550. PubMed
7. Hernandez AF, Fonarow GC, Liang L, et al. Sex and racial differences in the use of implantable cardioverter-defibrillators among patients hospitalized with heart failure. JAMA. 2007;298(13):1525-1532. PubMed
8. Get With The Guidelines-Heart Failure. HF Patient Management Tool, October 2016.
9. Eapen ZJ, Liang L, Fonarow GC, et al. Validated, electronic health record deployable prediction models for assessing patient risk of 30-day rehospitalization and mortality in older heart failure patients. JACC Heart Fail. 2013;1(3):245-251. PubMed
10. Peterson PN, Rumsfeld JS, Liang L, et al. A validated risk score for in-hospital mortality in patients with heart failure from the American Heart Association get with the guidelines program. Circ Cardiovasc Qual Outcomes. 2010;3(1):25-32. PubMed
11. Frequently Asked Questions (FAQs): Implementation and Maintenance of CMS Mortality Measures for AMI & HF. 2007. https://www.cms.gov/Medicare/Quality-Initiatives-Patient-Assessment-Instruments/HospitalQualityInits/downloads/HospitalMortalityAboutAMI_HF.pdf. Accessed August 30, 2017.
12. Suter LG, Li SX, Grady JN, et al. National patterns of risk-standardized mortality and readmission after hospitalization for acute myocardial infarction, heart failure, and pneumonia: update on publicly reported outcomes measures based on the 2013 release. J Gen Intern Med. 2014;29(10):1333-1340. PubMed
13. Lagu T, Pekow PS, Shieh MS, et al. Validation and comparison of seven mortality prediction models for hospitalized patients with acute decompensated heart failure. Circ Heart Fail. Aug 2016;9(8):e002912. PubMed
14. National Hospice and Palliative Care Organization. NHPCO’s facts and figures: hospice care in america. 2015. https://www.nhpco.org/sites/default/files/public/Statistics_Research/2015_Facts_Figures.pdf. Accessed August 30, 2017.
15. Yancy CW, Jessup M, Bozkurt B, et al. 2013 ACCF/AHA guideline for the management of heart failure: executive summary: a report of the American College of Cardiology Foundation/American Heart Association Task Force on practice guidelines. Circulation. 2013;128(16):1810-1852. PubMed
16. Centers for Medicare & Medicaid Services. 2016 Condition-Specific Measures Updates and Specifications Report Hospital-Level 30-Day Risk-Standardized Mortality Measures. https://www.qualitynet.org/dcs/ContentServer?c=Page&pagename=QnetPublic%2FPage%2FQnetTier3&cid=1228774398696. Accessed August 30, 2017.
17. Bakitas M, Macmartin M, Trzepkowski K, et al. Palliative care consultations for heart failure patients: how many, when, and why? J Card Fail. 2013;19(3):193-201. PubMed
18. Wachterman MW, Pilver C, Smith D, Ersek M, Lipsitz SR, Keating NL. Quality of End-of-Life Care Provided to Patients With Different Serious Illnesses. JAMA Intern Med. 2016;176(8):1095-1102. PubMed
19. Wright AA, Zhang B, Ray A, et al. Associations between end-of-life discussions, patient mental health, medical care near death, and caregiver bereavement adjustment. JAMA. 2008;300(14):1665-1673. PubMed
20. Rogers JG, Patel CB, Mentz RJ, et al. Palliative care in heart failure: results of a randomized, controlled clinical trial. J Card Fail. 2016;22(11):940. PubMed
21. Kelly AG, Zahuranec DB, Holloway RG, Morgenstern LB, Burke JF. Variation in do-not-resuscitate orders for patients with ischemic stroke: implications for national hospital comparisons. Stroke. 2014;45(3):822-827. PubMed
22. Walkey AJ, Weinberg J, Wiener RS, Cooke CR, Lindenauer PK. Association of Do-Not-Resuscitate Orders and Hospital Mortality Rate Among Patients With Pneumonia. JAMA Intern Med. 2016;176(1):97-104. PubMed
23. Bardach N, Zhao S, Pantilat S, Johnston SC. Adjustment for do-not-resuscitate orders reverses the apparent in-hospital mortality advantage for minorities. Am J Med. 2005;118(4):400-408. PubMed
24. Tabak YP, Johannes RS, Silber JH, Kurtz SG. Should Do-Not-Resuscitate status be included as a mortality risk adjustor? The impact of DNR variations on performance reporting. Med Care. 2005;43(7):658-666. PubMed
In an effort to improve the quality of care delivered to heart failure (HF) patients, the Centers for Medicare & Medicaid Services (CMS) publish hospitals’ 30-day risk-standardized mortality rates (RSMRs) for HF.1 These mortality rates are also used by CMS to determine the financial penalties and bonuses that hospitals receive as part of the national Hospital Value-based Purchasing program.2 Whether or not these efforts effectively direct patients towards high-quality providers or motivate hospitals to provide better care, few would disagree with the overarching goal of decreasing the number of patients who die from HF.
However, for some patients with chronic disease at the end of life, goals of care may change. The quality of days lived may become more important than the quantity of days lived. As a consequence, high-quality care for some patients at the end of life is associated with withdrawing life-sustaining or life-extending therapies. Over time, this therapeutic perspective has become more common, with use of hospice care doubling from 23% to 47% between 2000 and 2012 among Medicare beneficiaries who died.3 For a national cohort of older patients admitted with HF—not just those patients who died in that same year—hospitals’ rates of referral to hospice are considerably lower, averaging 2.9% in 2010 in a national study.4 Nevertheless, it is possible that hospitals that more faithfully follow their dying patients’ wishes and withdraw life-prolonging interventions and provide comfort-focused care at the end of life might be unfairly penalized if such efforts resulted in higher mortality rates than other hospitals.
Therefore, we used Medicare data linked to a national HF registry with information about end-of-life care, to address 3 questions: (1) How much do hospitals vary in their rates of early comfort care and how has this changed over time; (2) What hospital and patient factors are associated with higher early comfort care rates; and (3) Is there a correlation between 30-day risk-adjusted mortality rates for HF with hospital rates of early comfort care?
METHODS
Data Sources
We used data from the American Heart Association’s Get With The Guidelines-Heart Failure (GWTG-HF) registry. GWTG-HF is a voluntary, inpatient, quality improvement registry5-7 that uses web-based tools and standard questionnaires to collect data on patients with HF admitted to participating hospitals nationwide. The data include information from admission (eg, sociodemographic characteristics, symptoms, medical history, and initial laboratory and test results), the inpatient stay (eg, therapies), and discharge (eg, discharge destination, whether and when comfort care was initiated). We linked the GWTG-HF registry data to Medicare claims data in order to obtain information about Medicare eligibility and patient comorbidities. Additionally, we used data from the American Hospital Association (2008) for hospital characteristics. Quintiles Real-World & Late Phase Research (Cambridge, MA) serves as the data coordinating center for GWTG-HF and the Duke Clinical Research Institute (Durham, NC) serves as the statistical analytic center. GWTG-HF participating sites have a waiver of informed consent because the data are de-identified and primarily used for quality improvement. All analyses performed on this data have been approved by the Duke Medical Center Institutional Review Board.
Study Population
Study Outcomes
Our outcome of interest was the correlation between a hospital’s rate of initiating early CMO for admitted HF patients and a hospital’s 30-day RSMR for HF. The GWTG-HF questionnaire8 asks “When is the earliest physician/advanced practice nurse/physician assistant documentation of comfort measures only?” and permits 4 responses: day 0 or 1, day 2 or after, timing unclear, or not documented/unable to determine. We defined early CMO as CMO on day 0 or 1, and late/no CMO as any other response. We chose to examine early comfort care because many hospitalized patients transition to comfort care before they die if the death is in any way predictable. Thus, if comfort care is measured at any time during the hospitalization, hospitals that have high mortality rates are likely to have high comfort care rates. Therefore, we chose to use the more precise measure of early comfort care. We created hospital-level, risk-standardized early comfort care rates using the same risk-adjustment model used for RSMRs but with the outcome of early comfort care instead of mortality.9,10
RSMRs were calculated using a validated GWTG-HF 30-day risk-standardized mortality model9 with additional variables identified from other GWTG-HF analyses.10 The 30 days are measured as the 30 days after the index admission date.
Statistical Analyses
We described trends in early comfort care rates over time, from February 17, 2008, to February 17, 2014, using the Cochran-Armitage test for trend. We then grouped hospitals into quintiles based on their unadjusted early comfort care rates. We described patient and hospital characteristics for each quintile, using χ2 tests to test for differences across quintiles for categorical variables and Wilcoxon rank sum tests to assess for differences across quintiles for continuous variables. We then examined the Spearman’s rank correlation between hospitals’ RSMR and risk-adjusted comfort care rates. Finally, we compared hospital-level RSMRs before and after adjusting for early comfort care.
We performed risk-adjustment for these last 2 analyses as follows. For each patient, covariates were obtained from the GWTG-HF registry. Clinical data captured for the index admission were utilized in the risk-adjustment model (for both RSMRs and risk-adjusted comfort care rates). Included covariates were as follows: age (per 10 years); race (black vs non-black); systolic blood pressure at admission ≤170 (per 10 mm Hg); respiratory rate (per 5 respirations/min); heart rate ≤105 (per 10 beats/min); weight ≤100 (per 5 kg); weight >100 (per 5 kg); blood urea nitrogen (per 10 mg/dl); brain natriuretic peptide ≤2000 (per 500 pg/ml); hemoglobin 10-14 (per 1 g/dl); troponin abnormal (vs normal); creatinine ≤1 (per 1 mg/dl); sodium 130-140 (per 5 mEq/l); and chronic obstructive pulmonary disease or asthma.
Hierarchical logistic regression modeling was used to calculate the hospital-specific RSMR. A predicted/expected ratio similar to an observed/expected (O/E) ratio was calculated using the following modifications: (1) instead of the observed (crude) number of deaths, the numerator is the number of deaths predicted by the hierarchical model among a hospital’s patients given the patients’ risk factors and the hospital-specific effect; (2) the denominator is the expected number of deaths among the hospital’s patients given the patients’ risk factors and the average of all hospital-specific effects overall; and (3) the ratio of the numerator and denominator are then multiplied by the observed overall mortality rate (same as O/E). This calculation is the method used by CMS to derive RSMRs.11 Multiple imputation was used to handle missing data in the models; 25 imputed datasets using the fully conditional specification method were created. Patients with missing prior comorbidities were assumed to not have those conditions. Hospital characteristics were not imputed; therefore, for analyses that required construction of risk-adjusted comfort care rates or RSMRs, we excluded 18,867 patients cared for at 82 hospitals missing hospital characteristics. We ran 2 sets of models for risk-adjusted comfort care rates and RSMRs: the first adjusted only for patient characteristics, and the second adjusted for both patient and hospital characteristics. Results from the 2 models were similar, so we present only results from the latter. Variance inflation factors were all <2, indicating the collinearity between covariates was not an issue.
All statistical analyses were performed by using SAS version 9.4 (SAS Institute, Cary, NC). We tested for statistical significance by using 2-tailed tests and considered P values <.05 to be statistically significant.
RESULTS
Of the 272 hospitals included in our final study cohort, the observed median overall rate of early comfort care in this study was 1.9% (25th to 75th percentile: 0.9% to 4.0%); hospitals varied widely in unadjusted early comfort care rates (0.00% to 0.46% in the lowest quintile, and 4.60% to 39.91% in the highest quintile; Table 1).
DISCUSSION
Among a national sample of US hospitals, we found wide variation in how frequently health care providers deliver comfort care within the first 2 days of admission for HF. A minority of hospitals reported no early comfort care on any patients throughout the 6-year study period, but hospitals in the highest quintile initiated early comfort care rates for at least 1 in 20 HF patients. Hospitals that were more likely to initiate early comfort care had a higher proportion of female and white patients and were less likely to have the capacity to deliver aggressive surgical interventions such as heart transplants. Hospital-level 30-day RSMRs were not correlated with rates of early comfort care.
While the appropriate rate of early comfort care for patients hospitalized with HF is unknown, given that the average hospital RSMR is approximately 12% for fee-for-service Medicare patients hospitalized with HF,12 it is surprising that some hospitals initiated early comfort care on none or very few of their HF patients. It is quite possible that many of these hospitals initiated comfort care for some of their patients after 48 hours of hospitalization. We were unable to estimate the average period of time patients received comfort care prior to dying, the degree to which this varies across hospitals or why it might vary, and whether the length of time between comfort care initiation and death is related to satisfaction with end-of-life care. Future research on these topics would help inform providers seeking to deliver better end-of-life care. In this study, we also were unable to estimate how often early comfort care was not initiated because patients had a good prognosis. However, prior studies have suggested low rates of comfort care or hospice referral even among patients at very high estimated mortality risk.4 It is also possible that providers and families had concerns about the ability to accurately prognosticate, although several models have been shown to perform acceptably for patients hospitalized with HF.13
We found that comfort care rates did not increase over time, even though use of hospice care doubled among Medicare beneficiaries between 2000 and 2012. By way of context, cancer—the second leading cause of death in the US—was responsible for 38% of hospice admissions in 2013, whereas heart disease (including but not limited to HF)—the leading cause of death— was responsible for 13% of hospice admissions.14 The 2013 American College of Cardiology Foundation and the American Heart Association guidelines for HF recommend consideration of hospice or palliative care for inpatient and transitional care.15 In future work, it would be important to better understand the drivers behind decisions around comfort care for patients hospitalized with HF.
With regards to the policy implications of our study, we found that on average, adjusting 30-day mortality rates for early comfort care was not associated with a change in hospital mortality rankings. For those hospitals with high comfort care rates, adjusting for comfort care did lower mortality rates, but the change was so small as to be clinically insignificant. CMS’ RSMR for HF excludes patients enrolled in hospice during the 12 months prior to index admission, including the first day of the index admission, acknowledging that death may not be an untoward outcome for such patients.16 Fee-for-service Medicare beneficiaries excluded for hospice enrollment comprised 1.29% of HF admissions from July 2012 to June 201516 and are likely a subset of early comfort care patients in our sample, both because of the inclusiveness of chart review (vs claims-based identification) and because we defined early comfort care as comfort care initiated on day 0 or 1 of hospitalization. Nevertheless, with our data we cannot assess to what degree our findings were due solely to hospice patients excluded from CMS’ current estimates.
Prior research has described the underuse of palliative care among patients with HF17 and the association of palliative care with better patient and family experiences at the end of life.18-20 We add to this literature by describing the epidemiology—prevalence, changes over time, and associated factors—of early comfort care for HF in a national sample of hospitals. This serves as a baseline for future work on end-of-life care among patients hospitalized for HF. Our findings also contribute to ongoing discussion about how best to risk-adjust mortality metrics used to assess hospital quality in pay-for-performance programs. Recent research on stroke and pneumonia based on California data suggests that not accounting for do-not-resuscitate (DNR) status biases hospital mortality rates.21,22 Earlier research examined the impact of adjusting hospital mortality rates for DNR for a broader range of conditions.23,24 We expand this line of inquiry by examining the hospital-level association of early comfort care with mortality rates for HF, utilizing a national, contemporary cohort of inpatient stays. In addition, while studies have found that DNR rates within the first 24 hours of admission are relatively high (median 15.8% for pneumonia; 13.3% for stroke),21,22 comfort care is distinct from DNR.
Our findings should be interpreted in the context of several potential limitations. First, we did not have any information about patient or family wishes regarding end-of-life care, or the exact timing of early comfort care (eg, day 0 or day 1). The initiation of comfort care usually follows conversations about end-of-life care involving a patient, his or her family, and the medical team. Thus, we do not know if low early comfort care rates represent the lack of such a conversation (and thus poor-quality care) or the desire by most patients not to initiate early comfort care (and thus high-quality care). This would be an important area for future research. Second, we included only patients admitted to hospitals that participate in GWTG-HF, a voluntary quality improvement initiative. This may limit the generalizability of our findings, but it is unclear how our sample might bias our findings. Hospitals engaged in quality improvement may be more likely to initiate early comfort care aligned with patients’ wishes; on the other hand, hospitals with advanced surgical capabilities are over-represented in our sample and these hospitals are less likely to initiate early comfort care. Third, we examined associations and cannot make conclusions about causality. Residual measured and unmeasured confounding may influence these findings.
In summary, we found that early comfort care rates for fee-for-service Medicare beneficiaries admitted for HF varies widely among hospitals, but median rates of early comfort care have not changed over time. On average, there was no correlation between hospital-level, 30-day, RSMRs and rates of early comfort care. This suggests that current efforts to lower mortality rates have not had unintended consequences for hospitals that institute early comfort care more commonly than their peers.
Acknowledgments
Dr. Chen and Ms. Cox take responsibility for the integrity of the data and the accuracy of the data analysis. Drs. Chen, Levine, and Hayward are responsible for the study concept and design. Drs. Chen and Fonarow acquired the data. Dr. Chen drafted the manuscript. Drs. Chen, Levin, Hayward, Cox, Fonarow, DeVore, Hernandez, Heidenreich, and Yancy revised the manuscript for important intellectual content. Drs. Chen, Hayward, Cox, and Schulte performed the statistical analysis. Drs. Chen and Fonarow obtained funding for the study. Drs. Hayward and Fonarow supervised the study. The authors thank Bailey Green, MPH, for the research assistance she provided. She was compensated for her work.
Disclosure
Dr. Fonarow reports research support from the National Institutes of Health, and consulting for Amgen, Janssen, Novartis, Medtronic, and St Jude Medical. Dr. DeVore reports research support from the American Heart Association, Amgen, and Novartis, and consulting for Amgen. The other authors have no relevant conflicts of interest. Dr. Chen was supported by a Career Development Grant Award (K08HS020671) from the Agency for Healthcare Research and Quality when the manuscript was being prepared. She currently receives support from the Department of Health and Human Services Office of the Assistant Secretary for Planning and Evaluation for her work there. She also receives support from the Blue Cross Blue Shield of Michigan Foundation’s Investigator Initiated Research Program, the Agency for Healthcare Research and Quality (R01 HS024698), and the National Institute on Aging (P01 AG019783). These funding sources had no role in the preparation, review, or approval of the manuscript. The GWTG-HF program is provided by the American Heart Association. GWTG-HF has been funded in the past through support from Amgen, Medtronic, GlaxoSmithKline, Ortho-McNeil, and the American Heart Association Pharmaceutical Roundtable. These sponsors had no role in the study design, data analysis or manuscript preparation and revision.
1. Centers for Medicare & Medicaid Services. Hospital Compare. https://www.medicare.gov/hospitalcompare/. Accessed on November 27, 2016.
2. Centers for Medicare & Medicaid Services. Hospital Value-based Purchasing. https://www.medicare.gov/hospitalcompare/data/hospital-vbp.html. Accessed August 30, 2017.
3. Medicare Payment Advisory Comission. Report to the Congress: Medicare payment policy. 2014. http://www.medpac.gov/docs/default-source/reports/mar14_entirereport.pdf. Accessed August 31, 2017.
4. Whellan DJ, Cox M, Hernandez AF, et al. Utilization of hospice and predicted mortality risk among older patients hospitalized with heart failure: findings from GWTG-HF. J Card Fail. 2012;18(6):471-477. PubMed
5. Hong Y, LaBresh KA. Overview of the American Heart Association “Get with the Guidelines” programs: coronary heart disease, stroke, and heart failure. Crit Pathw Cardiol. 2006;5(4):179-186. PubMed
6. LaBresh KA, Gliklich R, Liljestrand J, Peto R, Ellrodt AG. Using “get with the guidelines” to improve cardiovascular secondary prevention. Jt Comm J Qual Saf. 2003;29(10):539-550. PubMed
7. Hernandez AF, Fonarow GC, Liang L, et al. Sex and racial differences in the use of implantable cardioverter-defibrillators among patients hospitalized with heart failure. JAMA. 2007;298(13):1525-1532. PubMed
8. Get With The Guidelines-Heart Failure. HF Patient Management Tool, October 2016.
9. Eapen ZJ, Liang L, Fonarow GC, et al. Validated, electronic health record deployable prediction models for assessing patient risk of 30-day rehospitalization and mortality in older heart failure patients. JACC Heart Fail. 2013;1(3):245-251. PubMed
10. Peterson PN, Rumsfeld JS, Liang L, et al. A validated risk score for in-hospital mortality in patients with heart failure from the American Heart Association get with the guidelines program. Circ Cardiovasc Qual Outcomes. 2010;3(1):25-32. PubMed
11. Frequently Asked Questions (FAQs): Implementation and Maintenance of CMS Mortality Measures for AMI & HF. 2007. https://www.cms.gov/Medicare/Quality-Initiatives-Patient-Assessment-Instruments/HospitalQualityInits/downloads/HospitalMortalityAboutAMI_HF.pdf. Accessed August 30, 2017.
12. Suter LG, Li SX, Grady JN, et al. National patterns of risk-standardized mortality and readmission after hospitalization for acute myocardial infarction, heart failure, and pneumonia: update on publicly reported outcomes measures based on the 2013 release. J Gen Intern Med. 2014;29(10):1333-1340. PubMed
13. Lagu T, Pekow PS, Shieh MS, et al. Validation and comparison of seven mortality prediction models for hospitalized patients with acute decompensated heart failure. Circ Heart Fail. Aug 2016;9(8):e002912. PubMed
14. National Hospice and Palliative Care Organization. NHPCO’s facts and figures: hospice care in america. 2015. https://www.nhpco.org/sites/default/files/public/Statistics_Research/2015_Facts_Figures.pdf. Accessed August 30, 2017.
15. Yancy CW, Jessup M, Bozkurt B, et al. 2013 ACCF/AHA guideline for the management of heart failure: executive summary: a report of the American College of Cardiology Foundation/American Heart Association Task Force on practice guidelines. Circulation. 2013;128(16):1810-1852. PubMed
16. Centers for Medicare & Medicaid Services. 2016 Condition-Specific Measures Updates and Specifications Report Hospital-Level 30-Day Risk-Standardized Mortality Measures. https://www.qualitynet.org/dcs/ContentServer?c=Page&pagename=QnetPublic%2FPage%2FQnetTier3&cid=1228774398696. Accessed August 30, 2017.
17. Bakitas M, Macmartin M, Trzepkowski K, et al. Palliative care consultations for heart failure patients: how many, when, and why? J Card Fail. 2013;19(3):193-201. PubMed
18. Wachterman MW, Pilver C, Smith D, Ersek M, Lipsitz SR, Keating NL. Quality of End-of-Life Care Provided to Patients With Different Serious Illnesses. JAMA Intern Med. 2016;176(8):1095-1102. PubMed
19. Wright AA, Zhang B, Ray A, et al. Associations between end-of-life discussions, patient mental health, medical care near death, and caregiver bereavement adjustment. JAMA. 2008;300(14):1665-1673. PubMed
20. Rogers JG, Patel CB, Mentz RJ, et al. Palliative care in heart failure: results of a randomized, controlled clinical trial. J Card Fail. 2016;22(11):940. PubMed
21. Kelly AG, Zahuranec DB, Holloway RG, Morgenstern LB, Burke JF. Variation in do-not-resuscitate orders for patients with ischemic stroke: implications for national hospital comparisons. Stroke. 2014;45(3):822-827. PubMed
22. Walkey AJ, Weinberg J, Wiener RS, Cooke CR, Lindenauer PK. Association of Do-Not-Resuscitate Orders and Hospital Mortality Rate Among Patients With Pneumonia. JAMA Intern Med. 2016;176(1):97-104. PubMed
23. Bardach N, Zhao S, Pantilat S, Johnston SC. Adjustment for do-not-resuscitate orders reverses the apparent in-hospital mortality advantage for minorities. Am J Med. 2005;118(4):400-408. PubMed
24. Tabak YP, Johannes RS, Silber JH, Kurtz SG. Should Do-Not-Resuscitate status be included as a mortality risk adjustor? The impact of DNR variations on performance reporting. Med Care. 2005;43(7):658-666. PubMed
© 2018 Society of Hospital Medicine
Improving Patient Satisfaction
INTRODUCTION
Patient experience and satisfaction is intrinsically valued, as strong physician‐patient communication, empathy, and patient comfort require little justification. However, studies have also shown that patient satisfaction is associated with better health outcomes and greater compliance.[1, 2, 3] A systematic review of studies linking patient satisfaction to outcomes found that patient experience is positively associated with patient safety, clinical effectiveness, health outcomes, adherence, and lower resource utilization.[4] Of 378 associations studied between patient experience and health outcomes, there were 312 positive associations.[4] However, not all studies have shown a positive association between patient satisfaction and outcomes.
Nevertheless, hospitals now have to strive to improve patient satisfaction, as Centers for Medicare & Medicaid Services (CMS) has introduced Hospital Value‐Based Purchasing. CMS started to withhold Medicare Severity Diagnosis‐Related Groups payments, starting at 1.0% in 2013, 1.25% in 2014, and increasing to 2.0% in 2017. This money is redistributed based on performance on core quality measures, including patient satisfaction measured through the Hospital Consumer Assessment of Healthcare Providers and Systems (HCAHPS) survey.[5]
Various studies have evaluated interventions to improve patient satisfaction, but to our knowledge, no study published in a peer‐reviewed research journal has shown a significant improvement in HCAHPS scores.[6, 7, 8, 9, 10, 11, 12] Levinson et al. argue that physician communication skills should be taught during residency, and that individualized feedback is an effective way to allow physicians to track their progress over time and compared to their peers.[13] We thus aimed to evaluate an intervention to improve patient satisfaction designed by the Patient Affairs Department for Ronald Reagan University of California, Los Angeles (UCLA) Medical Center (RRUCLAMC) and the UCLA Department of Medicine.
METHODOLOGY
Design Overview
The intervention for the IM residents consisted of education on improving physician‐patient communication provided at a conference, frequent individualized patient feedback, and an incentive program in addition to existing patient satisfaction training. The results of the intervention were measured by comparing the postintervention HCAHPS scores in the Department of Medicine versus the rest of the hospital and the national averages.
Setting and Participants
The study setting was RRUCLAMC, a large university‐affiliated academic center. The internal medicine (IM) residents and patients in the Department of Medicine were in the intervention cohort. The residents in all other departments that were involved with direct adult patient care and their patients were the control cohort. Our intervention targeted resident physicians because they were most involved in the majority of direct patient care at RRUCLAMC. Residents are in house 24 hours a day, are the first line of contact for nurses and patients, and provide the most continuity, as attendings often rotate every 1 to 2 weeks, but residents are on service for at least 2 to 4 weeks for each rotation. IM residents are on all inpatient general medicine, critical care, and cardiology services at RRUCLAMC. RRUMCLA does not have a nonteaching service for adult IM patients.
Interventions
Since 2006, there has been a program at RRUCLAMC called Assessing Residents' CICARE (ARC). CICARE is an acronym that represents UCLA's patient communication model and training elements (Connect with patients, Introduce yourself and role, Communicate, Ask and anticipate, Respond, Exit courteously). The ARC program consists of trained undergraduate student volunteers surveying hospitalized patients with an optional and anonymous survey regarding specific resident physician's communication skills (see Supporting Information, Appendix A, in the online version of this article). Patients were randomly selected for the ARC and HCAHPS survey, but they were selected separately for each survey. There may have been some overlap between patients selected for ARC and HCAHPS surveys. Residents received feedback from 7 to 10 patients a year on average.
The volunteers show the patients a picture of individual resident physicians assigned to their care to confirm the resident's identity. The volunteer then asks 18 multiple‐choice questions about their physician‐patient communication skills. The patients are also asked to provide general comments regarding the resident physician.[14] The patients were interviewed in private hospital rooms by ARC volunteers. No information linking the patient to the survey is recorded. Survey data are entered into a database, and individual residents are assigned a code that links them to their patient feedback. These survey results and comments are sent to the program directors of the residency programs weekly. However, a review of the practice revealed that results were only reviewed semiannually by the residents with their program director.
Starting December 2011, the results of the ARC survey were directly e‐mailed to the interns and residents in the Department of Medicine in real time while they were on general medicine wards and the cardiology inpatient service at RRUCLAMC. Residents in other departments at RRUCLAMC continued to review the patient feedback with program directors at most biannually. This continued until June 2012 and had to be stopped during July 2012 because many of the CICARE volunteers were away on summer break.
Starting January 2012, IM residents who stood out in the ARC survey received a Commendation of Excellence. Each month, 3 residents were selected for this award based on their patient comments and if they had over 90% overall satisfaction on the survey questions. These residents received department‐wide recognition via e‐mail and a movie package (2 movie tickets, popcorn, and a drink) as a reward.
In January 2012, a 1‐hour lunchtime conference was held for IM residents to discuss best practices in physician‐patient communication, upcoming changes with Hospital Value‐Based Purchasing, and strengths and weaknesses of the Department of Medicine in patient communication. About 50% of the IM residents included in the study arm were not able to attend the education session and so no universal training was provided.
Outcomes
We analyzed the before and after intervention impact on the HCAHPS results. HCAHPS is a standardized national survey measuring patient perspectives after they are discharged from hospitals across the nation. The survey addresses communication with doctors and nurses, responsiveness of hospital staff, pain management, communication about medicines, discharge information, cleanliness of the hospital environment, and quietness of the hospital environment. The survey also includes demographic questions.[15]
Our analysis focused on the following specific questions: Would you recommend this hospital to your friends and family? During this hospital stay, how often did doctors: (1) treat you with courtesy and respect, (2) listen carefully to you, and (3) explain things in a way you could understand? Responders who did not answer all of the above questions were excluded.
Our outcomes focused on the change from January to June 2011 to January to June 2012, during which time the intervention was ongoing. We did not include data past July 2012 in the primary outcome, because the intervention did not continue due to volunteers being away for summer break. In addition, July also marks the time when the third‐year IM residents graduate and the new interns start. Thus, one‐third of the residents in the IM department had never been exposed to the intervention after June of 2012.
Statistical Analysis
We used a difference‐in‐differences regression analysis (DDRA) for these outcomes and controlled for other covariates in the patient populations to predict adjusted probabilities for each of the outcomes studied. The key predictors in the models were indicator variables for year (2011, 2012) and service (IM, all others) and an interaction between year and service. We controlled for perceived patient health, admission through emergency room (ER), age, race, patient education level, intensive care unit (ICU) stay, length of stay, and gender.[16] We calculated adjusted probabilities for each level of the interaction between service and year, holding all controls at their means. The 95% confidence intervals for these predictions were generated using the delta method.
We compared the changes in HCAHPS results for the RRUCLAMC Department of Medicine patients with all other RRUCLAMC department patients and to the national averages. We only had access to national average point estimates and not individual responses from the national sample and so were unable to do statistical analysis involving the national cohort. The prespecified significant P value was 0.05. Stata 13 (StataCorp, College Station, TX) was used for statistical analysis. The study received institutional review board exempt status.
RESULTS
Sample Size and Excluded Cases
There were initially 3637 HCAHPS patient cases. We dropped all HCAHPS cases that were missing values for outcome or demographic/explanatory variables. We dropped 226 cases due to 1 or more missing outcome variables, and we dropped 322 cases due to 1 or more missing demographic/explanatory variables. This resulted in 548 total dropped cases and a final sample size of 3089 (see Supporting Information, Appendix B, in the online version of this article). Of the 548 dropped cases, 228 cases were in the IM cohort and 320 cases from the rest of the hospital. There were 993 patients in the UCLA IM cohort and 2096 patients in the control cohort from all other UCLA adult departments. Patients excluded due to missing data were similar to the patients included in the final analysis except for 2 differences. Patients excluded were older (63 years vs 58 years, P<0.01) and more likely to have been admitted from the ER (57.4% vs 39.6%, P<0.01) than the patients we had included.
Patient Characteristics
The patient population demographics from all patients discharged from RRUCLAMC who completed HCAHPS surveys January to June 2011 and 2012 are displayed in Table 1. In both 2011 and 2012, the patients in the IM cohort were significantly older, more likely to be male, had lower perceived health, and more likely to be admitted through the emergency room than the HCAHPS patients in all other UCLA adult departments. In 2011, the IM cohort had a lower percentage of patients than the non‐IM cohort that required an ICU stay (8.0% vs 20.5%, P<0.01), but there was no statistically significant difference in 2012 (20.6% vs 20.8%, P=0.9). Other than differences in ICU stay, the demographic characteristics from 2011 to 2012 did not change in the intervention and control cohorts. The response rate for UCLA on HCAHPS during the study period was 29%, consistent with national results.[17, 18]
| 2011 | 2012 | |||||
|---|---|---|---|---|---|---|
| UCLA Internal Medicine | All Other UCLA Adult Departments | P | UCLA Internal Medicine | All Other UCLA Adult Departments | P | |
| ||||||
| Total no. | 465 | 865 | 528 | 1,231 | ||
| Age, y | 62.8 | 55.3 | <0.01 | 65.1 | 54.9 | <0.01 |
| Length of stay, d | 5.7 | 5.7 | 0.94 | 5.8 | 4.9 | 0.19 |
| Gender, male | 56.6 | 44.1 | <0.01 | 55.3 | 41.4 | <0.01 |
| Education (4 years of college or greater) | 47.3 | 49.3 | 0.5 | 47.3 | 51.3 | 0.13 |
| Patient‐perceived overall health (responding very good or excellent) | 30.5 | 55.0 | <0.01 | 27.5 | 58.2 | <0.01 |
| Admission through emergency room, yes | 75.5 | 23.8 | <0.01 | 72.4 | 23.1 | <0.01 |
| Intensive care unit, yes | 8.0 | 20.5 | <0.01 | 20.6 | 20.8 | 0.9 |
| Ethnicity (non‐Hispanic white) | 63.2 | 61.4 | 0.6 | 62.5 | 60.9 | 0.5 |
Difference‐in‐Differences Regression Analysis
The adjusted results of the DDRA for the physician‐related HCAHPS questions are presented in Table 2. The adjusted results for the percentage of patients responding positively to all 3 physician‐related HCAHPS questions in the DDRA increased by 8.1% in the IM cohort (from 65.7% to 73.8%) and by 1.5% in the control cohort (from 64.4% to 65.9%) (P=0.04). The adjusted results for the percentage of patients responding always to How often did doctors treat you with courtesy and respect? in the DDRA increased by 5.1% (from 83.8% to 88.9%) in the IM cohort and by 1.0% (from 83.3% to 84.3%) in the control cohort (P=0.09). The adjusted results for the percentage of patients responding always to Does your doctor listen carefully to you? in the DDRA increased by 6.0% in the IM department (75.6% to 81.6%) and by 1.2% (75.2% to 76.4%) in the control (P=0.1). The adjusted results for the percentage of patients responding always to Does your doctor explain things in a way you could understand? in the DDRA increased by 7.8% in the IM department (from 72.1% to 79.9%) and by 1.0% in the control cohort (from 72.2% to 73.2%) (P=0.03). There was no more than 3.1% absolute increase in any of the 4 questions in the national average. There was also a significant improvement in percentage of patients who would definitely recommend this hospital to their friends and family. The adjusted results in the DDRA for the percentage of patients responding that they would definitely recommend this hospital increased by 7.1% in the IM cohort (from 82.7% to 89.8%) and 1.5% in the control group (from 84.1% to 85.6%) (P=0.02).
| UCLA IM | All Other UCLA Adult Departments | National Average | |
|---|---|---|---|
| |||
| % Patients responding that their doctors always treated them with courtesy and respect | |||
| January to June 2011, preintervention (95% CI) | 83.8 (80.587.1) | 83.3 (80.785.9) | 82.4 |
| January to June 2012, postintervention | 88.9 (86.391.4) | 84.3 (82.186.5) | 85.5 |
| Change from 2011 to 2012, January to June | 5.1 | 1.0 | 3.1 |
| Change in UCLA IM minus change in all other UCLA adult departments, difference in differences | 4.1 | ||
| P value of difference in differences between IM and the rest of the hospital | 0.09 | ||
| % Patients responding that their doctors always listened carefully | |||
| January to June 2011, preintervention (95% CI) | 75.6 (71.779.5) | 75.2 (72.278.1) | 76.4 |
| January to June 2012, postintervention (95% CI) | 81.6 (78.484.8) | 76.4 (73.978.9) | 73.7 |
| Change from 2011 to 2012, January to June | 6.0 | 1.2 | 2.7 |
| Change in UCLA IM minus change in all other UCLA adult departments, difference in differences | 4.6 | ||
| P value of difference in differences between IM and the rest of the hospital | 0.1 | ||
| % Patients responding that their doctors always explained things in a way they could understand | |||
| January to June 2011, preintervention (95% CI) | 72.1 (6876.1) | 72.2 (69.275.4) | 70.1 |
| January to June 2012, postintervention | 79.9 (76.683.1) | 73.2 (70.675.8) | 72.2 |
| Change from 2011 to 2012, January to June | 7.8 | 1.0 | 2.1 |
| Change in UCLA IM minus change in all other UCLA adult departments, difference in differences | 6.8 | ||
| P value of difference in differences between IM and the rest of the hospital | 0.03 | ||
| % Patients responding "always" for all 3 physician‐related HCAHPS questions | |||
| January to June 2011, preintervention (95% CI) | 65.7 (61.370.1) | 64.4 (61.267.7) | 80.1 |
| January to June 2012, postintervention | 73.8 (70.177.5) | 65.9 (63.168.6) | 87.8 |
| Change from 2011 to 2012, January to June | 8.1 | 1.5 | 7.7 |
| Change in UCLA IM minus change in all other UCLA adult departments, difference in differences | 6.6 | ||
| P value of difference in differences between IM and the rest of the hospital | 0.04 | ||
| % Patients who would definitely recommend this hospital to their friends and family | |||
| January to June 2011, preintervention (95% CI) | 82.7 (79.386.1) | 84.1 (81.586.6) | 68.8 |
| January to June 2012, postintervention | 89.8 (87.392.3) | 85.6 (83.587.7) | 71.2 |
| Change from 2011 to 2012, January to June | 7.1 | 1.5 | 2.4 |
| Change in UCLA IM minus change in all other UCLA adult departments, difference in differences | 5.6 | ||
| P value of difference in differences between IM and the rest of the hospital | 0.02 | ||
DISCUSSION
Our intervention, which included real‐time feedback to physicians on results of the patient survey, monthly recognition of physicians who stood out on this survey, and an educational conference, was associated with a clear improvement in patient satisfaction with physician‐patient communication and overall recommendation of the hospital. These results are significant because they demonstrate a cost‐effective intervention that can be applied to academic hospitals across the country with the use of nonmedically trained volunteers, such as the undergraduate volunteers involved in our program. The limited costs associated with the intervention were the time in managing the volunteers and movie package award ($20). To our knowledge, it is the first study published in a peer‐reviewed research journal that has demonstrated an intervention associated with significant improvements in HCAHPS scores, the standard by which CMS reimbursement will be affected.
The improvements associated with this intervention could be very valuable to hospitals and patient care. The positive correlation of higher patient satisfaction with improved outcomes suggests this intervention may have additional benefits.[4] Last, these improvements in patient satisfaction in the HCAHPS scores could minimize losses to hospital revenue, as hospitals with low patient‐satisfaction scores will be penalized.
There was a statistically significant improvement in adjusted scores for the question Did your physicians explain things understandably? with patients responding always to all 3 physician‐related HCAHPS questions and Would you recommend this hospital to friends and family. The results for the 2 other physician‐related questions (Did your doctor explain things understandably? and Did your doctor listen carefully?) did show a trend toward significance, with p values of <0.1, and a larger study may have been better powered to detect a statistically significant difference. The improvement in response to the adjusted scores for the question Did your physicians explain things understandably? was the primary driver in the improvement in the adjusted percentage of patients who responded always to all 3 physician‐related HCAHPS questions. This was likely because the IM cohort had the lowest score on this question, and so the feedback to the residents may have helped to address this area of weakness. The UCLA IM HCAHPS scores prior to 2012 have always been lower than other programs at UCLA. As a result, we do not believe the change was due to a regression to the mean.
We believe that the intervention had a positive effect on patient satisfaction for several reasons. The regular e‐mails with the results of the survey may have served as a reminder to residents that patient satisfaction was being monitored and linked to them. The immediate and individualized feedback also may have facilitated adjustments of clinical practice in real time. The residents were able to compare their own scores and comments to the anonymous results of their peers. The monthly department‐wide recognition for residents who excelled in patient communication may have created an incentive and competition among the residents. It is possible that there may be an element of the Hawthorne effect that explained the improvement in HCAHPS scores. However, all of the residents in the departments studied were already being measured through the ARC survey. The primary change was more frequent reporting of ARC survey results, and so we believe that perception of measurement alone was less likely driving the results. The findings from this study are similar to those from provider‐specific report cards, which have shown that outcomes can be improved by forcing greater accountability and competition among physicians.[19]
Brown et al. demonstrated that 2, 4‐hour physician communication workshops in their study had no impact on patient satisfaction, and so we believe that our 1‐hour workshop with only 50% attendance had minimal impact on the improved patient satisfaction scores in our study.[20] Our intervention also coincided with the implementation of the Accreditation Council for Graduate Medical Education (ACGME) work‐hour restrictions implemented in July 2011. These restrictions limited residents to 80 hours per week, intern duty periods were restricted to 16 hours and residents to 28 hours, and interns and residents required 8 to 10 hours free of duty between scheduled duty periods.[21] One of the biggest impacts of ACGME work‐hour restrictions was that interns were doing more day and night shifts rather than 28‐hour calls. However, these work‐hour restrictions were the same for all specialties and so were unlikely to explain the improved patient satisfaction associated with our intervention.
Our study has limitations. The study was a nonrandomized pre‐post study. We attempted to control for the differences in the cohorts with a multivariable regression analysis, but there may be unmeasured differences that we were unable to control for. Due to deidentification of the data, we could only control for patient health based on patient perceived health. In addition, the percentage of patients requiring ICU care in the IM cohort was higher in 2012 than in 2011. We did not identify differences in outcomes from analyses stratified by ICU or non‐ICU patients. In addition, patients who were excluded because of missing outcomes were more likely to be older and admitted through the ER. Further investigation would be needed to see if the findings of this study could be extended to other clinical situations.
In conclusion, our study found an intervention program that was associated with a significant improvement in patient satisfaction in the intervention cohort, even after adjusting for differences in the patient population, whereas there was no change in the control group. This intervention can serve as a model for academic hospitals to improve patient satisfaction, avoid revenue loss in the era of Hospital Value‐Based Purchasing, and to train the next generation of physicians on providing patient‐centered care.
Disclosure
This work was supported by the Beryl Institute and UCLA QI Initiative.
- , , , , . Relationship between patient satisfaction with inpatient care and hospital readmission within 30 Days. Am J Manag Care. 2011;17:41–48.
- , , , . Patients' Perception of Hospital Care in the United States. N Engl J Med. 2008;359:1921–1931.
- , , , et al. Patient satisfaction and its relationship with clinical quality and inpatient mortality in acute myocardial infarction. Circ Cardiovasc Qual Outcomes. 2010;3:188–195.
- , , . A systematic review of evidence on the links between patient experience and clinical safety and effectiveness. BMJ Open. 2013;3(1).
- Centers for Medicare 70:729–732.
- , , , . Emergency department patient satisfaction: customer service training improves patient satisfaction and ratings of physician and nurse skill. J Healthc Manag. 1998;43:427–440; discussion 441–442.
- , , . Emergency department information: does it effect patients' perception and satisfaction about the care given in an emergency department? Eur J Emerg Med 1999;6:245–248.
- . Can communication skills workshops for emergency department doctors improve patient satisfaction? J Accid Emerg Med. 2000;17:251–253.
- , , , . Effects of a physician communication intervention on patient care outcomes. J Gen Intern Med. 1996;11:147–155.
- , , , , . Health‐related quality‐of‐life assessments and patient‐physician communication: a randomized controlled trial. JAMA. 2002;288:3027–3034.
- , , , . Modification of residents' behavior by preceptor feedback of patient satisfaction. J Gen Intern Med. 1986;1:394–398.
- , , . Developing physician communication skills for patient‐centered care. Health Aff (Millwood) 2010;29:1310–1318.
- ARC Medical Program @ UCLA. Available at: http://Arcmedicalprogram.Wordpress.com. Accessed July 1, 2013.
- Hospital Consumer Assessment of Healthcare Providers 12:151–162.
- Summary of HCAHPS survey results January 2010 to December 2010 discharges. Available at: http://Www.Hcahpsonline.Org/Files/Hcahps survey results table %28report_Hei_October_2011_States%29.Pdf. Accessed October 18, 2013.
- , , , et al. A randomized experiment investigating the suitability of speech‐enabled IVR and web modes for publicly reported surveys of patients' experience of hospital care. Med Care Res Rev. 2013;70:165–184.
- . Provider‐specific report cards: a tool for health sector accountability in developing countries. Health Policy Plan. 2006;21:101–109.
- , , , . Effect of clinician communication skills training on patient satisfaction: a randomized, controlled trial. Ann Intern Med. 1999;131:822–829.
- Frequently asked questions: ACGME common duty hour requirements. Available at: http://www.Acgme.Org/Acgmeweb/Portals/0/Pdfs/Dh‐Faqs2011.Pdf. Accessed January 3, 2015.
INTRODUCTION
Patient experience and satisfaction is intrinsically valued, as strong physician‐patient communication, empathy, and patient comfort require little justification. However, studies have also shown that patient satisfaction is associated with better health outcomes and greater compliance.[1, 2, 3] A systematic review of studies linking patient satisfaction to outcomes found that patient experience is positively associated with patient safety, clinical effectiveness, health outcomes, adherence, and lower resource utilization.[4] Of 378 associations studied between patient experience and health outcomes, there were 312 positive associations.[4] However, not all studies have shown a positive association between patient satisfaction and outcomes.
Nevertheless, hospitals now have to strive to improve patient satisfaction, as Centers for Medicare & Medicaid Services (CMS) has introduced Hospital Value‐Based Purchasing. CMS started to withhold Medicare Severity Diagnosis‐Related Groups payments, starting at 1.0% in 2013, 1.25% in 2014, and increasing to 2.0% in 2017. This money is redistributed based on performance on core quality measures, including patient satisfaction measured through the Hospital Consumer Assessment of Healthcare Providers and Systems (HCAHPS) survey.[5]
Various studies have evaluated interventions to improve patient satisfaction, but to our knowledge, no study published in a peer‐reviewed research journal has shown a significant improvement in HCAHPS scores.[6, 7, 8, 9, 10, 11, 12] Levinson et al. argue that physician communication skills should be taught during residency, and that individualized feedback is an effective way to allow physicians to track their progress over time and compared to their peers.[13] We thus aimed to evaluate an intervention to improve patient satisfaction designed by the Patient Affairs Department for Ronald Reagan University of California, Los Angeles (UCLA) Medical Center (RRUCLAMC) and the UCLA Department of Medicine.
METHODOLOGY
Design Overview
The intervention for the IM residents consisted of education on improving physician‐patient communication provided at a conference, frequent individualized patient feedback, and an incentive program in addition to existing patient satisfaction training. The results of the intervention were measured by comparing the postintervention HCAHPS scores in the Department of Medicine versus the rest of the hospital and the national averages.
Setting and Participants
The study setting was RRUCLAMC, a large university‐affiliated academic center. The internal medicine (IM) residents and patients in the Department of Medicine were in the intervention cohort. The residents in all other departments that were involved with direct adult patient care and their patients were the control cohort. Our intervention targeted resident physicians because they were most involved in the majority of direct patient care at RRUCLAMC. Residents are in house 24 hours a day, are the first line of contact for nurses and patients, and provide the most continuity, as attendings often rotate every 1 to 2 weeks, but residents are on service for at least 2 to 4 weeks for each rotation. IM residents are on all inpatient general medicine, critical care, and cardiology services at RRUCLAMC. RRUMCLA does not have a nonteaching service for adult IM patients.
Interventions
Since 2006, there has been a program at RRUCLAMC called Assessing Residents' CICARE (ARC). CICARE is an acronym that represents UCLA's patient communication model and training elements (Connect with patients, Introduce yourself and role, Communicate, Ask and anticipate, Respond, Exit courteously). The ARC program consists of trained undergraduate student volunteers surveying hospitalized patients with an optional and anonymous survey regarding specific resident physician's communication skills (see Supporting Information, Appendix A, in the online version of this article). Patients were randomly selected for the ARC and HCAHPS survey, but they were selected separately for each survey. There may have been some overlap between patients selected for ARC and HCAHPS surveys. Residents received feedback from 7 to 10 patients a year on average.
The volunteers show the patients a picture of individual resident physicians assigned to their care to confirm the resident's identity. The volunteer then asks 18 multiple‐choice questions about their physician‐patient communication skills. The patients are also asked to provide general comments regarding the resident physician.[14] The patients were interviewed in private hospital rooms by ARC volunteers. No information linking the patient to the survey is recorded. Survey data are entered into a database, and individual residents are assigned a code that links them to their patient feedback. These survey results and comments are sent to the program directors of the residency programs weekly. However, a review of the practice revealed that results were only reviewed semiannually by the residents with their program director.
Starting December 2011, the results of the ARC survey were directly e‐mailed to the interns and residents in the Department of Medicine in real time while they were on general medicine wards and the cardiology inpatient service at RRUCLAMC. Residents in other departments at RRUCLAMC continued to review the patient feedback with program directors at most biannually. This continued until June 2012 and had to be stopped during July 2012 because many of the CICARE volunteers were away on summer break.
Starting January 2012, IM residents who stood out in the ARC survey received a Commendation of Excellence. Each month, 3 residents were selected for this award based on their patient comments and if they had over 90% overall satisfaction on the survey questions. These residents received department‐wide recognition via e‐mail and a movie package (2 movie tickets, popcorn, and a drink) as a reward.
In January 2012, a 1‐hour lunchtime conference was held for IM residents to discuss best practices in physician‐patient communication, upcoming changes with Hospital Value‐Based Purchasing, and strengths and weaknesses of the Department of Medicine in patient communication. About 50% of the IM residents included in the study arm were not able to attend the education session and so no universal training was provided.
Outcomes
We analyzed the before and after intervention impact on the HCAHPS results. HCAHPS is a standardized national survey measuring patient perspectives after they are discharged from hospitals across the nation. The survey addresses communication with doctors and nurses, responsiveness of hospital staff, pain management, communication about medicines, discharge information, cleanliness of the hospital environment, and quietness of the hospital environment. The survey also includes demographic questions.[15]
Our analysis focused on the following specific questions: Would you recommend this hospital to your friends and family? During this hospital stay, how often did doctors: (1) treat you with courtesy and respect, (2) listen carefully to you, and (3) explain things in a way you could understand? Responders who did not answer all of the above questions were excluded.
Our outcomes focused on the change from January to June 2011 to January to June 2012, during which time the intervention was ongoing. We did not include data past July 2012 in the primary outcome, because the intervention did not continue due to volunteers being away for summer break. In addition, July also marks the time when the third‐year IM residents graduate and the new interns start. Thus, one‐third of the residents in the IM department had never been exposed to the intervention after June of 2012.
Statistical Analysis
We used a difference‐in‐differences regression analysis (DDRA) for these outcomes and controlled for other covariates in the patient populations to predict adjusted probabilities for each of the outcomes studied. The key predictors in the models were indicator variables for year (2011, 2012) and service (IM, all others) and an interaction between year and service. We controlled for perceived patient health, admission through emergency room (ER), age, race, patient education level, intensive care unit (ICU) stay, length of stay, and gender.[16] We calculated adjusted probabilities for each level of the interaction between service and year, holding all controls at their means. The 95% confidence intervals for these predictions were generated using the delta method.
We compared the changes in HCAHPS results for the RRUCLAMC Department of Medicine patients with all other RRUCLAMC department patients and to the national averages. We only had access to national average point estimates and not individual responses from the national sample and so were unable to do statistical analysis involving the national cohort. The prespecified significant P value was 0.05. Stata 13 (StataCorp, College Station, TX) was used for statistical analysis. The study received institutional review board exempt status.
RESULTS
Sample Size and Excluded Cases
There were initially 3637 HCAHPS patient cases. We dropped all HCAHPS cases that were missing values for outcome or demographic/explanatory variables. We dropped 226 cases due to 1 or more missing outcome variables, and we dropped 322 cases due to 1 or more missing demographic/explanatory variables. This resulted in 548 total dropped cases and a final sample size of 3089 (see Supporting Information, Appendix B, in the online version of this article). Of the 548 dropped cases, 228 cases were in the IM cohort and 320 cases from the rest of the hospital. There were 993 patients in the UCLA IM cohort and 2096 patients in the control cohort from all other UCLA adult departments. Patients excluded due to missing data were similar to the patients included in the final analysis except for 2 differences. Patients excluded were older (63 years vs 58 years, P<0.01) and more likely to have been admitted from the ER (57.4% vs 39.6%, P<0.01) than the patients we had included.
Patient Characteristics
The patient population demographics from all patients discharged from RRUCLAMC who completed HCAHPS surveys January to June 2011 and 2012 are displayed in Table 1. In both 2011 and 2012, the patients in the IM cohort were significantly older, more likely to be male, had lower perceived health, and more likely to be admitted through the emergency room than the HCAHPS patients in all other UCLA adult departments. In 2011, the IM cohort had a lower percentage of patients than the non‐IM cohort that required an ICU stay (8.0% vs 20.5%, P<0.01), but there was no statistically significant difference in 2012 (20.6% vs 20.8%, P=0.9). Other than differences in ICU stay, the demographic characteristics from 2011 to 2012 did not change in the intervention and control cohorts. The response rate for UCLA on HCAHPS during the study period was 29%, consistent with national results.[17, 18]
| 2011 | 2012 | |||||
|---|---|---|---|---|---|---|
| UCLA Internal Medicine | All Other UCLA Adult Departments | P | UCLA Internal Medicine | All Other UCLA Adult Departments | P | |
| ||||||
| Total no. | 465 | 865 | 528 | 1,231 | ||
| Age, y | 62.8 | 55.3 | <0.01 | 65.1 | 54.9 | <0.01 |
| Length of stay, d | 5.7 | 5.7 | 0.94 | 5.8 | 4.9 | 0.19 |
| Gender, male | 56.6 | 44.1 | <0.01 | 55.3 | 41.4 | <0.01 |
| Education (4 years of college or greater) | 47.3 | 49.3 | 0.5 | 47.3 | 51.3 | 0.13 |
| Patient‐perceived overall health (responding very good or excellent) | 30.5 | 55.0 | <0.01 | 27.5 | 58.2 | <0.01 |
| Admission through emergency room, yes | 75.5 | 23.8 | <0.01 | 72.4 | 23.1 | <0.01 |
| Intensive care unit, yes | 8.0 | 20.5 | <0.01 | 20.6 | 20.8 | 0.9 |
| Ethnicity (non‐Hispanic white) | 63.2 | 61.4 | 0.6 | 62.5 | 60.9 | 0.5 |
Difference‐in‐Differences Regression Analysis
The adjusted results of the DDRA for the physician‐related HCAHPS questions are presented in Table 2. The adjusted results for the percentage of patients responding positively to all 3 physician‐related HCAHPS questions in the DDRA increased by 8.1% in the IM cohort (from 65.7% to 73.8%) and by 1.5% in the control cohort (from 64.4% to 65.9%) (P=0.04). The adjusted results for the percentage of patients responding always to How often did doctors treat you with courtesy and respect? in the DDRA increased by 5.1% (from 83.8% to 88.9%) in the IM cohort and by 1.0% (from 83.3% to 84.3%) in the control cohort (P=0.09). The adjusted results for the percentage of patients responding always to Does your doctor listen carefully to you? in the DDRA increased by 6.0% in the IM department (75.6% to 81.6%) and by 1.2% (75.2% to 76.4%) in the control (P=0.1). The adjusted results for the percentage of patients responding always to Does your doctor explain things in a way you could understand? in the DDRA increased by 7.8% in the IM department (from 72.1% to 79.9%) and by 1.0% in the control cohort (from 72.2% to 73.2%) (P=0.03). There was no more than 3.1% absolute increase in any of the 4 questions in the national average. There was also a significant improvement in percentage of patients who would definitely recommend this hospital to their friends and family. The adjusted results in the DDRA for the percentage of patients responding that they would definitely recommend this hospital increased by 7.1% in the IM cohort (from 82.7% to 89.8%) and 1.5% in the control group (from 84.1% to 85.6%) (P=0.02).
| UCLA IM | All Other UCLA Adult Departments | National Average | |
|---|---|---|---|
| |||
| % Patients responding that their doctors always treated them with courtesy and respect | |||
| January to June 2011, preintervention (95% CI) | 83.8 (80.587.1) | 83.3 (80.785.9) | 82.4 |
| January to June 2012, postintervention | 88.9 (86.391.4) | 84.3 (82.186.5) | 85.5 |
| Change from 2011 to 2012, January to June | 5.1 | 1.0 | 3.1 |
| Change in UCLA IM minus change in all other UCLA adult departments, difference in differences | 4.1 | ||
| P value of difference in differences between IM and the rest of the hospital | 0.09 | ||
| % Patients responding that their doctors always listened carefully | |||
| January to June 2011, preintervention (95% CI) | 75.6 (71.779.5) | 75.2 (72.278.1) | 76.4 |
| January to June 2012, postintervention (95% CI) | 81.6 (78.484.8) | 76.4 (73.978.9) | 73.7 |
| Change from 2011 to 2012, January to June | 6.0 | 1.2 | 2.7 |
| Change in UCLA IM minus change in all other UCLA adult departments, difference in differences | 4.6 | ||
| P value of difference in differences between IM and the rest of the hospital | 0.1 | ||
| % Patients responding that their doctors always explained things in a way they could understand | |||
| January to June 2011, preintervention (95% CI) | 72.1 (6876.1) | 72.2 (69.275.4) | 70.1 |
| January to June 2012, postintervention | 79.9 (76.683.1) | 73.2 (70.675.8) | 72.2 |
| Change from 2011 to 2012, January to June | 7.8 | 1.0 | 2.1 |
| Change in UCLA IM minus change in all other UCLA adult departments, difference in differences | 6.8 | ||
| P value of difference in differences between IM and the rest of the hospital | 0.03 | ||
| % Patients responding "always" for all 3 physician‐related HCAHPS questions | |||
| January to June 2011, preintervention (95% CI) | 65.7 (61.370.1) | 64.4 (61.267.7) | 80.1 |
| January to June 2012, postintervention | 73.8 (70.177.5) | 65.9 (63.168.6) | 87.8 |
| Change from 2011 to 2012, January to June | 8.1 | 1.5 | 7.7 |
| Change in UCLA IM minus change in all other UCLA adult departments, difference in differences | 6.6 | ||
| P value of difference in differences between IM and the rest of the hospital | 0.04 | ||
| % Patients who would definitely recommend this hospital to their friends and family | |||
| January to June 2011, preintervention (95% CI) | 82.7 (79.386.1) | 84.1 (81.586.6) | 68.8 |
| January to June 2012, postintervention | 89.8 (87.392.3) | 85.6 (83.587.7) | 71.2 |
| Change from 2011 to 2012, January to June | 7.1 | 1.5 | 2.4 |
| Change in UCLA IM minus change in all other UCLA adult departments, difference in differences | 5.6 | ||
| P value of difference in differences between IM and the rest of the hospital | 0.02 | ||
DISCUSSION
Our intervention, which included real‐time feedback to physicians on results of the patient survey, monthly recognition of physicians who stood out on this survey, and an educational conference, was associated with a clear improvement in patient satisfaction with physician‐patient communication and overall recommendation of the hospital. These results are significant because they demonstrate a cost‐effective intervention that can be applied to academic hospitals across the country with the use of nonmedically trained volunteers, such as the undergraduate volunteers involved in our program. The limited costs associated with the intervention were the time in managing the volunteers and movie package award ($20). To our knowledge, it is the first study published in a peer‐reviewed research journal that has demonstrated an intervention associated with significant improvements in HCAHPS scores, the standard by which CMS reimbursement will be affected.
The improvements associated with this intervention could be very valuable to hospitals and patient care. The positive correlation of higher patient satisfaction with improved outcomes suggests this intervention may have additional benefits.[4] Last, these improvements in patient satisfaction in the HCAHPS scores could minimize losses to hospital revenue, as hospitals with low patient‐satisfaction scores will be penalized.
There was a statistically significant improvement in adjusted scores for the question Did your physicians explain things understandably? with patients responding always to all 3 physician‐related HCAHPS questions and Would you recommend this hospital to friends and family. The results for the 2 other physician‐related questions (Did your doctor explain things understandably? and Did your doctor listen carefully?) did show a trend toward significance, with p values of <0.1, and a larger study may have been better powered to detect a statistically significant difference. The improvement in response to the adjusted scores for the question Did your physicians explain things understandably? was the primary driver in the improvement in the adjusted percentage of patients who responded always to all 3 physician‐related HCAHPS questions. This was likely because the IM cohort had the lowest score on this question, and so the feedback to the residents may have helped to address this area of weakness. The UCLA IM HCAHPS scores prior to 2012 have always been lower than other programs at UCLA. As a result, we do not believe the change was due to a regression to the mean.
We believe that the intervention had a positive effect on patient satisfaction for several reasons. The regular e‐mails with the results of the survey may have served as a reminder to residents that patient satisfaction was being monitored and linked to them. The immediate and individualized feedback also may have facilitated adjustments of clinical practice in real time. The residents were able to compare their own scores and comments to the anonymous results of their peers. The monthly department‐wide recognition for residents who excelled in patient communication may have created an incentive and competition among the residents. It is possible that there may be an element of the Hawthorne effect that explained the improvement in HCAHPS scores. However, all of the residents in the departments studied were already being measured through the ARC survey. The primary change was more frequent reporting of ARC survey results, and so we believe that perception of measurement alone was less likely driving the results. The findings from this study are similar to those from provider‐specific report cards, which have shown that outcomes can be improved by forcing greater accountability and competition among physicians.[19]
Brown et al. demonstrated that 2, 4‐hour physician communication workshops in their study had no impact on patient satisfaction, and so we believe that our 1‐hour workshop with only 50% attendance had minimal impact on the improved patient satisfaction scores in our study.[20] Our intervention also coincided with the implementation of the Accreditation Council for Graduate Medical Education (ACGME) work‐hour restrictions implemented in July 2011. These restrictions limited residents to 80 hours per week, intern duty periods were restricted to 16 hours and residents to 28 hours, and interns and residents required 8 to 10 hours free of duty between scheduled duty periods.[21] One of the biggest impacts of ACGME work‐hour restrictions was that interns were doing more day and night shifts rather than 28‐hour calls. However, these work‐hour restrictions were the same for all specialties and so were unlikely to explain the improved patient satisfaction associated with our intervention.
Our study has limitations. The study was a nonrandomized pre‐post study. We attempted to control for the differences in the cohorts with a multivariable regression analysis, but there may be unmeasured differences that we were unable to control for. Due to deidentification of the data, we could only control for patient health based on patient perceived health. In addition, the percentage of patients requiring ICU care in the IM cohort was higher in 2012 than in 2011. We did not identify differences in outcomes from analyses stratified by ICU or non‐ICU patients. In addition, patients who were excluded because of missing outcomes were more likely to be older and admitted through the ER. Further investigation would be needed to see if the findings of this study could be extended to other clinical situations.
In conclusion, our study found an intervention program that was associated with a significant improvement in patient satisfaction in the intervention cohort, even after adjusting for differences in the patient population, whereas there was no change in the control group. This intervention can serve as a model for academic hospitals to improve patient satisfaction, avoid revenue loss in the era of Hospital Value‐Based Purchasing, and to train the next generation of physicians on providing patient‐centered care.
Disclosure
This work was supported by the Beryl Institute and UCLA QI Initiative.
- , , , , . Relationship between patient satisfaction with inpatient care and hospital readmission within 30 Days. Am J Manag Care. 2011;17:41–48.
- , , , . Patients' Perception of Hospital Care in the United States. N Engl J Med. 2008;359:1921–1931.
- , , , et al. Patient satisfaction and its relationship with clinical quality and inpatient mortality in acute myocardial infarction. Circ Cardiovasc Qual Outcomes. 2010;3:188–195.
- , , . A systematic review of evidence on the links between patient experience and clinical safety and effectiveness. BMJ Open. 2013;3(1).
- Centers for Medicare 70:729–732.
- , , , . Emergency department patient satisfaction: customer service training improves patient satisfaction and ratings of physician and nurse skill. J Healthc Manag. 1998;43:427–440; discussion 441–442.
- , , . Emergency department information: does it effect patients' perception and satisfaction about the care given in an emergency department? Eur J Emerg Med 1999;6:245–248.
- . Can communication skills workshops for emergency department doctors improve patient satisfaction? J Accid Emerg Med. 2000;17:251–253.
- , , , . Effects of a physician communication intervention on patient care outcomes. J Gen Intern Med. 1996;11:147–155.
- , , , , . Health‐related quality‐of‐life assessments and patient‐physician communication: a randomized controlled trial. JAMA. 2002;288:3027–3034.
- , , , . Modification of residents' behavior by preceptor feedback of patient satisfaction. J Gen Intern Med. 1986;1:394–398.
- , , . Developing physician communication skills for patient‐centered care. Health Aff (Millwood) 2010;29:1310–1318.
- ARC Medical Program @ UCLA. Available at: http://Arcmedicalprogram.Wordpress.com. Accessed July 1, 2013.
- Hospital Consumer Assessment of Healthcare Providers 12:151–162.
- Summary of HCAHPS survey results January 2010 to December 2010 discharges. Available at: http://Www.Hcahpsonline.Org/Files/Hcahps survey results table %28report_Hei_October_2011_States%29.Pdf. Accessed October 18, 2013.
- , , , et al. A randomized experiment investigating the suitability of speech‐enabled IVR and web modes for publicly reported surveys of patients' experience of hospital care. Med Care Res Rev. 2013;70:165–184.
- . Provider‐specific report cards: a tool for health sector accountability in developing countries. Health Policy Plan. 2006;21:101–109.
- , , , . Effect of clinician communication skills training on patient satisfaction: a randomized, controlled trial. Ann Intern Med. 1999;131:822–829.
- Frequently asked questions: ACGME common duty hour requirements. Available at: http://www.Acgme.Org/Acgmeweb/Portals/0/Pdfs/Dh‐Faqs2011.Pdf. Accessed January 3, 2015.
© 2015 Society of Hospital Medicine