User login
The h-Index for Associate and Full Professors of Dermatology in the United States: An Epidemiologic Study of Scholastic Production
Academic promotion requires evidence of scholastic production. The number of publications by a scientist is the most frequently reported metric of scholastic production, but it does not account for the impact of publications. The h-index is a bibliometric measure that combines both volume and impact of scientific contributions. The physicist Jorge E. Hirsch introduced this metric in 2005.1 He defined it as the number of publications (h) by an author that have been cited at least h times. For example, a scientist with 30 publications including 12 that have been cited at least 12 times each has an h-index of 12. h-Index is a superior predictor of future scientific achievement in physics compared with total citation count, total publication count, and citations per publication. Hirsch2 proposed h-index thresholds of 12 and 18 for advancement to associate professor and full professor in physics, respectively.2
h-Index values are not comparable across academic disciplines because they are influenced by the number of journals and authors within the field. Scientists in disciplines with numerous scholars and publications will have higher h-indices. For example, the mean h-index for full professors of cardiothoracic anesthesiology is 12, but the mean h-index for full professors of urology is 22.3,4 Hence, h-index thresholds for professional advancement cannot be generalized but must be calculated on a granular, specialty-specific basis.
In a prior study on h-index among academic dermatologists in the United States, John et al5 reported that fellowship-trained dermatologists had a significantly higher mean h-index than those without fellowship training (13.2 vs 11.7; P<.001). They further found the mean h-index increased with academic rank.5
In our study, we measured mean and median h-indices among associate and full professors of dermatology in academic training programs in the United States with the goal of describing h-index distributions in these 2 academic ranks. We further sought to measure regional differences in h-index between northeastern, southern, central, and western states as defined by the National Resident Matching Program.
Methods
Institutional review board approval was deferred because the study did not require patient information or participation. Using the Association of American Medical Colleges Electronic Residency Application Service website (https://www.aamc.org/services/eras/) we identified dermatology residency training programs accredited by the Accreditation Council for Graduate Medical Education and participating in the Electronic Residency Application Service for the National Resident Matching Program in the United States. We visited the official website of each residency program and identified all associate and full professors of dermatology for further study. We included all faculty members listed as professor, clinical professor, associate professor, or clinical associate professor, and excluded assistant professor, volunteer faculty, research professor, and research associate professor. All faculty held an MD degree or an equivalent degree, such as MBBS or MDCM.
We used the Thomson Reuters (now Clarivate Analytics) Web of Science to calculate h-index and publication counts. The initial search was basic using the professor’s last name and first initial. We then augmented this list by searching for all variations of each professor’s name, with or without middle initial. Each publication in the search results was confirmed as belonging to the author of interest by verifying coauthors, institution information, and subject material. For authors with common names, we additionally consulted their online university profiles for specific names used in their “Selected Publications” lists. In a minority of cases, we also limited Research Domain to “dermatology.” Referring to the verified publication list for each dermatology professor, we used the Web of Science Citation Report function to determine number of publications and h-index for the individual. We tabulated results for associate and full professors and subgrouped those results into 4 geographic regions—northeastern, southern, central, and western states—according to the map used by the National Resident Matching Program. Descriptive statistics were performed with Microsoft Excel.
Results
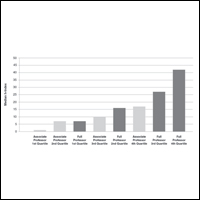
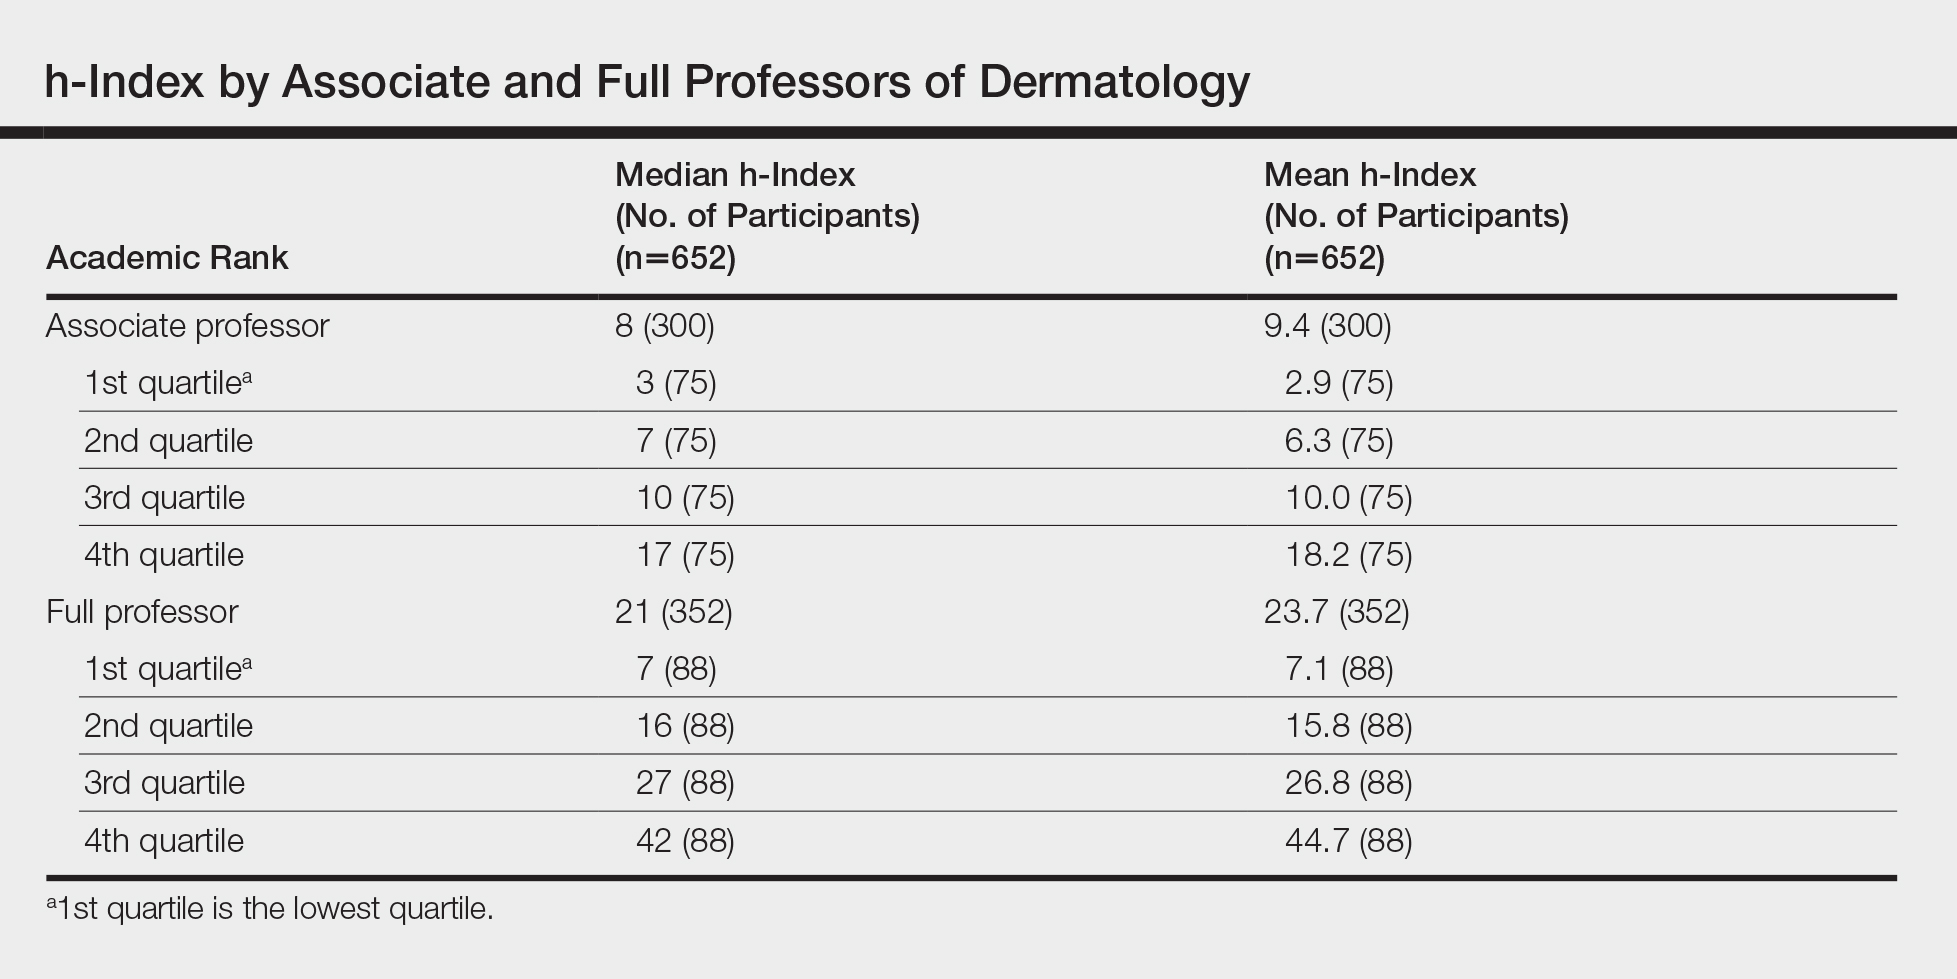
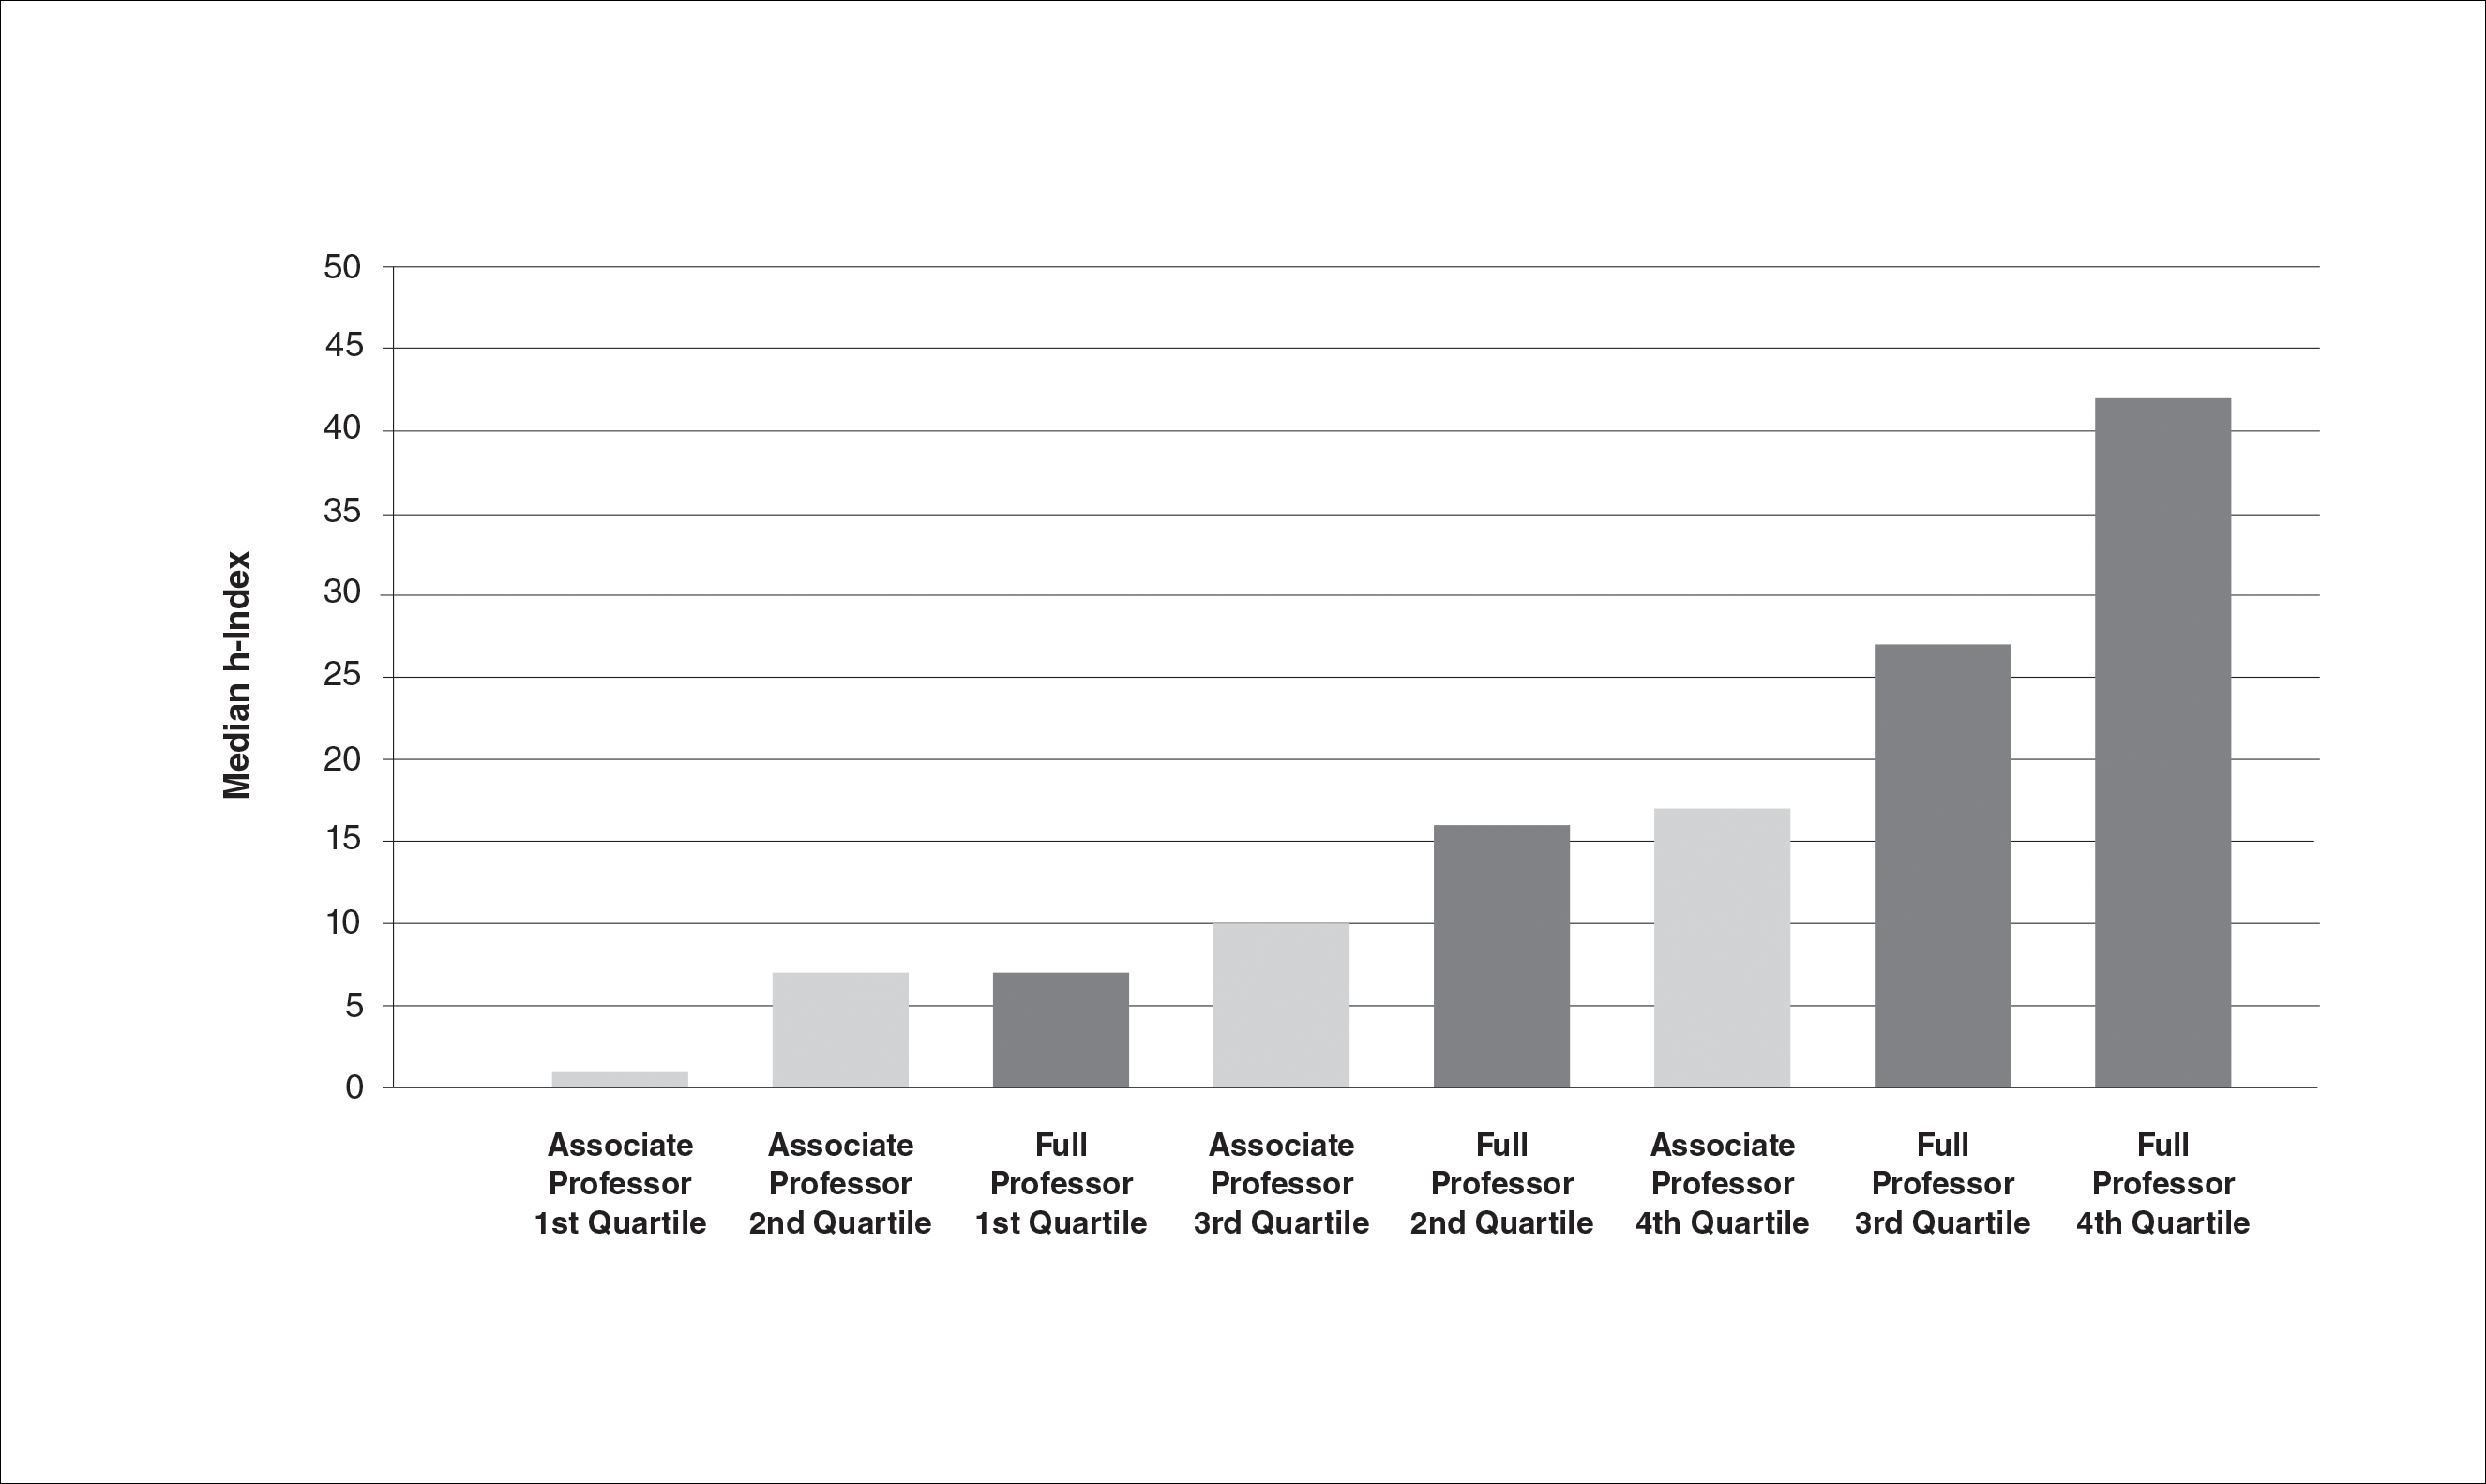
We identified 300 associate professors and 352 full professors from 81 academic institutions. The number of associate professors per institution ranged from 1 to 25; the number of full professors per institution ranged from 1 to 16. The median and mean h-indices for associate and full professors, including interquartile values, are shown in the Table. There was a broad range of h-index scores among both academic ranks; median and mean h-indices varied more than 5-fold between the bottom and upper quartiles in both associate and full professor cohorts. Median interquartile h-index values for upper-quartile associate professors overlapped with those of lower-quartile full professors (Figure 1). h-Index for associate and full professors was similar across the 4 regions defined by the National Resident Matching Program. Median h-index was highest for full professors in western states and lowest for associate professors in southern states (Figure 2).

Comment
Professional advancement in academic medicine requires scholastic production. The h-index, defined as the number of publications (h) that have been cited at least h times, is a bibliometric measure that accounts for both volume and impact of an individual’s scientific productivity. The h-index would be a useful tool for determining professional advancement in academic dermatology departments. In this project, we calculated h-index values for 300 associate professors and 352 full professors of dermatology in the United States. We found the median h-index for associate professors was 8 and the median h-index for full professors was 21. There was more than a 5-fold variation in median and mean h-indices between lower and upper quartiles within both the associate and full professor cohorts. The highest median and mean h-indices were found among full professors of dermatology in western states. These results provide the opportunity for academic dermatologists and institutions to compare their research contributions with peers across the United States.
Our results support those of John et al5 who also found academic rank in dermatology was correlated with h-index. Scopus, Web of Science, and Google Scholar can be used to calculate h-index, but they may return different scores for the same individual.6 John et al5 used the Scopus database to calculate h-index. We used Web of Science because Scopus only includes citations since 1996 and Web of Science was used in the original h-index studies by Hirsch.1,2 Institutions that adopt h-index criteria for advancement and resource distribution decisions should be aware that database selection can affect h-index scores.
Caveats With the h-Index
Flaws in the h-index include inflationary effects of self-citation, time bias, and excessive coauthorship. Individuals can increase their h-index by routinely citing their own publications. However, Engqvist and Frommen7 found tripling self-citations increased the h-index by only 1.
Citations tend to increase with time, and authors who have been active for longer periods will have a higher h-index. It is more difficult for junior faculty to distinguish themselves with the h-index, as it takes time for even the most impactful publications to gain citations. Major scientific papers can take years from conception to publication, and an outstanding paper that is 1 year old would have fewer citations than an equally impactful paper that is 10 years old. To adjust for the effect of time bias, Hirsch2 proposed the m-index, in which the h-index is divided by the years between the author’s first and last publication. He proposed that an m-index of 1 would indicate a successful scientist, 2 an outstanding scientist, and 3 a unique individual.2
The literature is increasingly dominated by teams of coauthors, and the number of coauthors within each team has increased over the last 5 decades.8 h-Indices will increase if this trend continues, making it difficult to compare h-indices between different eras. Prosperi et al9 found national differences in kinship-based coauthorship, suggesting nepotism may influence decisions in assigning authorship status. h-Index valuations do not require evidence of meaningful contribution to the work but simply rely on contributors’ self-governance in assigning authorship status.
The h-index also has a bias against highly cited papers. A scientist with a small number of highly influential papers may have a smaller h-index than a scientist with more papers of modest impact. Finally, an author who has changed names (eg, due to marriage) may have an artificially low h-index, as a standard database search would miss publications under a maiden name.
Limitations
This study is limited by possible operator error when compiling each author’s publication list through Web of Science. Our search and refinement methodology took into account that authors may publish with slight variations in name, in various subject areas and fields, and with different institutions and coauthors. Each publication populated through Web of Science was carefully verified by the principal investigator; however, overestimation or underestimation of the number of publications and citations was possible, as the publication lists were not verified by the studied associate and full professors themselves. Our results are consistent with the h-index bar charts published by John et al5 using an alternate citation index, Scopus, which tends to corroborate our findings. This study also is limited by possible time bias because we did not correct the h-index for years of active publication (m-index).
Conclusion
In summary, we found the median h-index for associate professors was 8 and the median h-index for full professors was 21. We found a broad range of h-index values within each academic rank. h-Index for upper-quartile associate professors overlapped with those of lower-quartile full professors. Our results suggest professional advancement occurs over a broad range of scholastic production. Adopting requirements for minimum h-index thresholds for application for promotion might reduce disparities between rank and scientific contributions. We encourage use of the h-index for tracking academic progression and as a parameter to consider in academic promotion.
- Hirsch JE. An index to quantify an individual’s scientific research output. Proc Natl Acad Sci U S A. 2005;102:16569-16572.
- Hirsch JE. Does the H index have predictive power? Proc Natl Acad Sci U S A. 2007;104:19193-19198.
- Pagel PS, Hudetz JA. Scholarly productivity of United States academic cardiothoracic anesthesiologists: influence of fellowship accreditation and transesophageal echocardiographic credentials on h-index and other citation bibliometrics. J Cardiothorac Vasc Anesthesia. 2011;25:761-765.
- Benway BM, Kalidas P, Cabello JM, et al. Does citation analysis reveal association between h-index and academic rank in urology? Urology. 2009;74:30-33.
- John AM, Gupta AB, John ES, et al. The impact of fellowship training on scholarly productivity in academic dermatology. Cutis. 2016;97:353-358.
- Kulkarni AV, Aziz B, Shams I, et al. Comparisons of citations in Web of Science, Scopus, and Google Scholar for articles published in general medical journals. JAMA. 2009;302:1092-1096.
- Engqvist L, Frommen JG. The h-index and self-citations. Trends Ecol Evol. 2008;23:250-252.
- Wuchty S, Jones BF, Uzzi B. The increasing dominance of teams in production of knowledge. Science. 2007;316:1036-1039.
- Prosperi M, Buchan I, Fanti I, et al. Kin of coauthorship in five decades of health science literature. Proc Natl Acad Sci U S A. 2016;113:8957-8962.
Academic promotion requires evidence of scholastic production. The number of publications by a scientist is the most frequently reported metric of scholastic production, but it does not account for the impact of publications. The h-index is a bibliometric measure that combines both volume and impact of scientific contributions. The physicist Jorge E. Hirsch introduced this metric in 2005.1 He defined it as the number of publications (h) by an author that have been cited at least h times. For example, a scientist with 30 publications including 12 that have been cited at least 12 times each has an h-index of 12. h-Index is a superior predictor of future scientific achievement in physics compared with total citation count, total publication count, and citations per publication. Hirsch2 proposed h-index thresholds of 12 and 18 for advancement to associate professor and full professor in physics, respectively.2
h-Index values are not comparable across academic disciplines because they are influenced by the number of journals and authors within the field. Scientists in disciplines with numerous scholars and publications will have higher h-indices. For example, the mean h-index for full professors of cardiothoracic anesthesiology is 12, but the mean h-index for full professors of urology is 22.3,4 Hence, h-index thresholds for professional advancement cannot be generalized but must be calculated on a granular, specialty-specific basis.
In a prior study on h-index among academic dermatologists in the United States, John et al5 reported that fellowship-trained dermatologists had a significantly higher mean h-index than those without fellowship training (13.2 vs 11.7; P<.001). They further found the mean h-index increased with academic rank.5
In our study, we measured mean and median h-indices among associate and full professors of dermatology in academic training programs in the United States with the goal of describing h-index distributions in these 2 academic ranks. We further sought to measure regional differences in h-index between northeastern, southern, central, and western states as defined by the National Resident Matching Program.
Methods
Institutional review board approval was deferred because the study did not require patient information or participation. Using the Association of American Medical Colleges Electronic Residency Application Service website (https://www.aamc.org/services/eras/) we identified dermatology residency training programs accredited by the Accreditation Council for Graduate Medical Education and participating in the Electronic Residency Application Service for the National Resident Matching Program in the United States. We visited the official website of each residency program and identified all associate and full professors of dermatology for further study. We included all faculty members listed as professor, clinical professor, associate professor, or clinical associate professor, and excluded assistant professor, volunteer faculty, research professor, and research associate professor. All faculty held an MD degree or an equivalent degree, such as MBBS or MDCM.
We used the Thomson Reuters (now Clarivate Analytics) Web of Science to calculate h-index and publication counts. The initial search was basic using the professor’s last name and first initial. We then augmented this list by searching for all variations of each professor’s name, with or without middle initial. Each publication in the search results was confirmed as belonging to the author of interest by verifying coauthors, institution information, and subject material. For authors with common names, we additionally consulted their online university profiles for specific names used in their “Selected Publications” lists. In a minority of cases, we also limited Research Domain to “dermatology.” Referring to the verified publication list for each dermatology professor, we used the Web of Science Citation Report function to determine number of publications and h-index for the individual. We tabulated results for associate and full professors and subgrouped those results into 4 geographic regions—northeastern, southern, central, and western states—according to the map used by the National Resident Matching Program. Descriptive statistics were performed with Microsoft Excel.
Results
We identified 300 associate professors and 352 full professors from 81 academic institutions. The number of associate professors per institution ranged from 1 to 25; the number of full professors per institution ranged from 1 to 16. The median and mean h-indices for associate and full professors, including interquartile values, are shown in the Table. There was a broad range of h-index scores among both academic ranks; median and mean h-indices varied more than 5-fold between the bottom and upper quartiles in both associate and full professor cohorts. Median interquartile h-index values for upper-quartile associate professors overlapped with those of lower-quartile full professors (Figure 1). h-Index for associate and full professors was similar across the 4 regions defined by the National Resident Matching Program. Median h-index was highest for full professors in western states and lowest for associate professors in southern states (Figure 2).
Comment
Professional advancement in academic medicine requires scholastic production. The h-index, defined as the number of publications (h) that have been cited at least h times, is a bibliometric measure that accounts for both volume and impact of an individual’s scientific productivity. The h-index would be a useful tool for determining professional advancement in academic dermatology departments. In this project, we calculated h-index values for 300 associate professors and 352 full professors of dermatology in the United States. We found the median h-index for associate professors was 8 and the median h-index for full professors was 21. There was more than a 5-fold variation in median and mean h-indices between lower and upper quartiles within both the associate and full professor cohorts. The highest median and mean h-indices were found among full professors of dermatology in western states. These results provide the opportunity for academic dermatologists and institutions to compare their research contributions with peers across the United States.
Our results support those of John et al5 who also found academic rank in dermatology was correlated with h-index. Scopus, Web of Science, and Google Scholar can be used to calculate h-index, but they may return different scores for the same individual.6 John et al5 used the Scopus database to calculate h-index. We used Web of Science because Scopus only includes citations since 1996 and Web of Science was used in the original h-index studies by Hirsch.1,2 Institutions that adopt h-index criteria for advancement and resource distribution decisions should be aware that database selection can affect h-index scores.
Caveats With the h-Index
Flaws in the h-index include inflationary effects of self-citation, time bias, and excessive coauthorship. Individuals can increase their h-index by routinely citing their own publications. However, Engqvist and Frommen7 found tripling self-citations increased the h-index by only 1.
Citations tend to increase with time, and authors who have been active for longer periods will have a higher h-index. It is more difficult for junior faculty to distinguish themselves with the h-index, as it takes time for even the most impactful publications to gain citations. Major scientific papers can take years from conception to publication, and an outstanding paper that is 1 year old would have fewer citations than an equally impactful paper that is 10 years old. To adjust for the effect of time bias, Hirsch2 proposed the m-index, in which the h-index is divided by the years between the author’s first and last publication. He proposed that an m-index of 1 would indicate a successful scientist, 2 an outstanding scientist, and 3 a unique individual.2
The literature is increasingly dominated by teams of coauthors, and the number of coauthors within each team has increased over the last 5 decades.8 h-Indices will increase if this trend continues, making it difficult to compare h-indices between different eras. Prosperi et al9 found national differences in kinship-based coauthorship, suggesting nepotism may influence decisions in assigning authorship status. h-Index valuations do not require evidence of meaningful contribution to the work but simply rely on contributors’ self-governance in assigning authorship status.
The h-index also has a bias against highly cited papers. A scientist with a small number of highly influential papers may have a smaller h-index than a scientist with more papers of modest impact. Finally, an author who has changed names (eg, due to marriage) may have an artificially low h-index, as a standard database search would miss publications under a maiden name.
Limitations
This study is limited by possible operator error when compiling each author’s publication list through Web of Science. Our search and refinement methodology took into account that authors may publish with slight variations in name, in various subject areas and fields, and with different institutions and coauthors. Each publication populated through Web of Science was carefully verified by the principal investigator; however, overestimation or underestimation of the number of publications and citations was possible, as the publication lists were not verified by the studied associate and full professors themselves. Our results are consistent with the h-index bar charts published by John et al5 using an alternate citation index, Scopus, which tends to corroborate our findings. This study also is limited by possible time bias because we did not correct the h-index for years of active publication (m-index).
Conclusion
In summary, we found the median h-index for associate professors was 8 and the median h-index for full professors was 21. We found a broad range of h-index values within each academic rank. h-Index for upper-quartile associate professors overlapped with those of lower-quartile full professors. Our results suggest professional advancement occurs over a broad range of scholastic production. Adopting requirements for minimum h-index thresholds for application for promotion might reduce disparities between rank and scientific contributions. We encourage use of the h-index for tracking academic progression and as a parameter to consider in academic promotion.
- Hirsch JE. An index to quantify an individual’s scientific research output. Proc Natl Acad Sci U S A. 2005;102:16569-16572.
- Hirsch JE. Does the H index have predictive power? Proc Natl Acad Sci U S A. 2007;104:19193-19198.
- Pagel PS, Hudetz JA. Scholarly productivity of United States academic cardiothoracic anesthesiologists: influence of fellowship accreditation and transesophageal echocardiographic credentials on h-index and other citation bibliometrics. J Cardiothorac Vasc Anesthesia. 2011;25:761-765.
- Benway BM, Kalidas P, Cabello JM, et al. Does citation analysis reveal association between h-index and academic rank in urology? Urology. 2009;74:30-33.
- John AM, Gupta AB, John ES, et al. The impact of fellowship training on scholarly productivity in academic dermatology. Cutis. 2016;97:353-358.
- Kulkarni AV, Aziz B, Shams I, et al. Comparisons of citations in Web of Science, Scopus, and Google Scholar for articles published in general medical journals. JAMA. 2009;302:1092-1096.
- Engqvist L, Frommen JG. The h-index and self-citations. Trends Ecol Evol. 2008;23:250-252.
- Wuchty S, Jones BF, Uzzi B. The increasing dominance of teams in production of knowledge. Science. 2007;316:1036-1039.
- Prosperi M, Buchan I, Fanti I, et al. Kin of coauthorship in five decades of health science literature. Proc Natl Acad Sci U S A. 2016;113:8957-8962.
Practice Points
- Promotion in academic dermatology requires evidence of scholastic production. The h-index is a bibliometric measure that combines both volume and impact of scientific contributions.
- Our study’s findings provide data-driven parameters to consider in academic promotion.
- Institutions that adopt h-index criteria for advancement and resource distribution decisions should be aware that database selection can affect h-index scores.