User login
Inappropriate Prescribing of PPIs
Proton pump inhibitors (PPIs) are the third most commonly prescribed class of medication in the United States, with $13.6 billion in yearly sales.1 Despite their effectiveness in treating acid reflux2 and their mortality benefit in the treatment of patients with gastrointestinal bleeding,3 recent literature has identified a number of risks associated with PPIs, including an increased incidence of Clostridium difficile infection,4 decreased effectiveness of clopidogrel in patients with acute coronary syndrome,5 increased risk of community‐ and hospital‐acquired pneumonia, and an increased risk of hip fracture.69 Additionally, in March of 2011, the US Food and Drug Administration (FDA) issued a warning regarding the potential for PPIs to cause low magnesium levels which can, in turn, cause muscle spasms, an irregular heartbeat, and convulsions.10
Inappropriate PPI prescription practice has been demonstrated in the primary care setting,11 as well as in small studies conducted in the hospital setting.1216 We hypothesized that many hospitalized patients receive these medications without having an accepted indication, and examined 2 populations of hospitalized patients, including administrative data from 6.5 million discharges from US university hospitals, to look for appropriate diagnoses justifying their use.
METHODS
We performed a retrospective review of administrative data collected between January 1, 2008 and December 31, 2009 from 2 patient populations: (a) those discharged from Denver Health (DH), a university‐affiliated public safety net hospital in Denver, CO; and (b) patients discharged from 112 academic health centers and 256 of their affiliated hospitals that participate in the University HealthSystem Consortium (UHC). The Colorado Multiple Institution Review Board reviewed and approved the conduct of this study.
Inclusion criteria for both populations were age >18 or <90 years, and hospitalization on a Medicine service. Prisoners and women known to be pregnant were excluded. In both cohorts, if patients had more than 1 admission during the 2‐year study period, only data from the first admission were used.
We recorded demographics, admitting diagnosis, and discharge diagnoses together with information pertaining to the name, route, and duration of administration of all PPIs (ie, omeprazole, lansoprazole, esomeprazole, pantoprazole, rabeprazole). We created a broadly inclusive set of valid indications for PPIs by incorporating diagnoses that could be identified by International Classification of Diseases, Ninth Revision.
(ICD‐9) codes from a number of previously published sources including the National Institute of Clinical Excellence (NICE) guidelines issued by the National Health Service (NHS) of the United Kingdom in 200012, 1721 (Table 1).
| Indication | ICD‐9 Code |
|---|---|
| |
| Helicobacter pylori | 041.86 |
| Abnormality of secretion of gastrin | 251.5 |
| Esophageal varices with bleeding | 456.0 |
| Esophageal varices without mention of bleeding | 456.1 |
| Esophageal varices in diseases classified elsewhere | 456.2 |
| Esophagitis | 530.10530.19 |
| Perforation of esophagus | 530.4 |
| Gastroesophageal laceration‐hemorrhage syndrome | 530.7 |
| Esophageal reflux | 530.81 |
| Barrett's esophagus | 530.85 |
| Gastric ulcer | 531.0031.91 |
| Duodenal ulcer | 532.00532.91 |
| Peptic ulcer, site unspecified | 533.00533.91 |
| Gastritis and duodenitis | 535.00535.71 |
| Gastroparesis | 536.3 |
| Dyspepsia and other specified disorders of function of stomach | 536.8 |
| Hemorrhage of gastrointestinal tract, unspecified | 578.9 |
To assess the accuracy of the administrative data from DH, we also reviewed the Emergency Department histories, admission histories, progress notes, electronic pharmacy records, endoscopy reports, and discharge summaries of 123 patients randomly selected (ie, a 5% sample) from the group of patients identified by administrative data to have received a PPI without a valid indication, looking for any accepted indication that might have been missed in the administrative data.
All analyses were performed using SAS Enterprise Guide 4.1 (SAS Institute, Cary, NC). A Student t test was used to compare continuous variables and a chi‐square test was used to compare categorical variables. Bonferroni corrections were used for multiple comparisons, such that P values less than 0.01 were considered to be significant for categorical variables.
RESULTS
Inclusion criteria were met by 9875 patients in the Denver Health database and 6,592,100 patients in the UHC database. The demographics and primary discharge diagnoses for these patients are summarized in Table 2.
| DH (N = 9875) | UHC (N = 6,592,100) | ||||
|---|---|---|---|---|---|
| Received a PPI | No PPI | Received a PPI | No PPI | ||
| |||||
| No. (%) | 3962 (40) | 5913 (60) | 918,474 (14) | 5,673,626 (86) | |
| Age (mean SD) | 53 15 | 51 16 | 59 17 | 55 18 | |
| Gender (% male) | 2197 (55) | 3438 (58) | 464,552 (51) | 2,882,577 (51) | |
| Race (% white) | 1610 (41) | 2425 (41) | 619,571 (67) | 3,670,450 (65) | |
| Top 5 primary discharge diagnoses | |||||
| Chest pain | 229 (6) | 462 (8) | Coronary atherosclerosis | 35,470 (4) | 186,321 (3) |
| Alcohol withdrawal | 147 (4) | 174 (3) | Acute myocardial infarction | 26,507 (3) | 132,159 (2) |
| Pneumonia, organism unspecified | 142 (4) | 262 (4) | Heart failure | 21,143 (2) | 103,751 (2) |
| Acute pancreatitis | 132 (3) | 106 (2) | Septicemia | 20,345 (2) | 64,915 (1) |
| Obstructive chronic bronchitis with (acute) exacerbation | 89 (2) | 154 (3) | Chest pain | 16,936 (2) | 107,497 (2) |
Only 39% and 27% of the patients in the DH and UHC databases, respectively, had a valid indication for PPIs on the basis of discharge diagnoses (Table 3). In the DH data, if admission ICD‐9 codes were also inspected for valid PPI indications, 1579 (40%) of patients receiving PPIs had a valid indication (admission ICD‐9 codes were not available for patients in the UHC database). Thirty‐one percent of Denver Health patients spent time in the intensive care unit (ICU) during their hospital stay and 65% of those patients received a PPI without a valid indication, as compared to 59% of patients who remained on the General Medicine ward (Table 3).
| DH (N = 9875) | UHC (N = 6,592,100) | |
|---|---|---|
| ||
| Patients receiving PPIs (% of total) | 3962 (40) | 918,474 (14) |
| Any ICU stay, N (% of all patients) | 1238 (31) | |
| General Medicine ward only, N (% of all patients) | 2724 (69) | |
| Patients with indication for PPI (% of all patients receiving PPIs)* | 1540 (39) | 247,142 (27) |
| Any ICU stay, N (% of all ICU patients) | 434 (35) | |
| General Medicine ward only, N (% of all ward patients) | 1106 (41) | |
| Patients without indication for PPI (% of those receiving PPIs)* | 2422 (61) | 671,332 (73) |
| Any ICU stay, N (% of all ICU patients) | 804 (65) | |
| General Medicine ward only, N (% of all ward patients) | 1618 (59) | |
Higher rates of concurrent C. difficile infections were observed in patients receiving PPIs in both databases; a higher rate of concurrent diagnosis of pneumonia was seen in patients receiving PPIs in the UHC population, with a nonsignificant trend towards the same finding in DH patients (Table 4).
| Denver Health | UHC | |||||
|---|---|---|---|---|---|---|
| Concurrent diagnosis | (+) PPI 3962 | () PPI 5913 | P | (+) PPI 918,474 | () PPI 5,673,626 | P |
| ||||||
| C. difficile | 46 (1.16) | 26 (0.44) | <0.0001 | 12,113 (1.32) | 175 (0.0031) | <0.0001 |
| Pneumonia | 400 (10.1) | 517 (8.7) | 0.0232 | 75,274 (8.2) | 300,557 (5.3) | <0.0001 |
Chart review in the DH population found valid indications for PPIs in 19% of patients who were thought not have a valid indication on the basis of the administrative data (Table 5). For 56% of those in whom no valid indication was confirmed, physicians identified prophylaxis as the justification.
| Characteristic | N (%) |
|---|---|
| |
| Valid indication found on chart review only | 23 (19) |
| No valid indication after chart review | 100 (81) |
| Written indication: prophylaxis | 56 (56) |
| No written documentation of indication present in the chart | 33 (33) |
| Written indication: continue home medication | 9 (9) |
| Intubated with or without written indication of prophylaxis | 16 (16) |
DISCUSSION
The important finding of this study was that the majority of patients in 2 large groups of Medicine patients hospitalized in university‐affiliated hospitals received PPIs without having a valid indication. To our knowledge, the more than 900,000 UHC patients who received a PPI during their hospitalization represent the largest inpatient population evaluated for appropriateness of PPI prescriptions.
Our finding that 41% of the patients admitted to the DH Medicine service received a PPI during their hospital stay is similar to what has been observed by others.9, 14, 22 The rate of PPI prescription was lower in the UHC population (14%) for unclear reasons. By our definition, 61% lacked an adequate diagnosis to justify the prescription of the PPI. After performing a chart review on a randomly selected 5% of these records, we found that the DH administrative database had failed to identify 19% of patients who had a valid indication for receiving a PPI. Adjusting the administrative data accordingly still resulted in 50% of DH patients not having a valid indication for receiving a PPI. This is consistent with the 54% recorded by Batuwitage and colleagues11 in the outpatient setting by direct chart review, as well as a range of 60%‐75% for hospitalized patients in other studies.12, 13, 15, 23, 24
Stomach acidity is believed to provide an important host defense against lower gastrointestinal tract infections including Salmonella, Campylobacter, and Clostridium difficile.25 A recent study by Howell et al26 showed a doseresponse effect between PPI use and C. difficile infection, supporting a causal connection between loss of stomach acidity and development of Clostridium difficile‐associated diarrhea (CDAD). We found that C. difficile infection was more common in both populations of patients receiving PPIs (although the relative risk was much higher in the UHC database) (Table 5). The rate of CDAD in DH patients who received PPIs was 2.6 times higher than in patients who did not receive these acid suppressive agents.
The role of acid suppression in increasing risk for community‐acquired pneumonia is not entirely clear. Theories regarding the loss of an important host defense and bacterial proliferation head the list.6, 8, 27 Gastric and duodenal bacterial overgrowth is significantly more common in patients receiving PPIs than in patients receiving histamine type‐2 (H2) blockers.28 Previous studies have identified an increased rate of hospital‐acquired pneumonia and recurrent community‐acquired pneumonia27 in patients receiving any form of acid suppression therapy, but the risk appears to be greater in patients receiving PPIs than in those receiving H2 receptor antagonists (H2RAs).9 Significantly more patients in the UHC population who were taking PPIs had a concurrent diagnosis of pneumonia, consistent with previous studies alerting to this association6, 8, 9, 27 and consistent with the nonsignificant trend observed in the DH population.
Our study has a number of limitations. Our database comes from a single university‐affiliated public hospital with residents and hospitalists writing orders for all medications. The hospitals in the UHC are also teaching hospitals. Accordingly, our results might not generalize to other settings or reflect prescribing patterns in private, nonteaching hospital environments. Because our study was retrospective, we could not confirm the decision‐making process supporting the prescription of PPIs. Similarly, we could not temporarily relate the existence of the indication with the time the PPI was prescribed. Our list of appropriate indications for prescribing PPIs was developed by reviewing a number of references, and other studies have used slightly different lists (albeit the more commonly recognized indications are the same), but it may be argued that the list either includes or misses diagnoses in error.
While there is considerable debate about the use of PPIs for stress ulcer prophylaxis,29 we specifically chose not to include this as one of our valid indications for PPIs for 4 reasons. First, the American Society of Health‐System Pharmacists (ASHP) Report does not recommend prophylaxis for non‐ICU patients, and only recommends prophylaxis for those ICU patients with a coagulopathy, those requiring mechanical ventilation for more than 48 hours, those with a history of gastrointestinal ulceration or bleeding in the year prior to admission, and those with 2 or more of the following indications: sepsis, ICU stay >1 week, occult bleeding lasting 6 or more days, receiving high‐dose corticosteroids, and selected surgical situations.30 At the time the guideline was written, the authors note that there was insufficient data on PPIs to make any recommendations on their use, but no subsequent guidelines have been issued.30 Second, a review by Mohebbi and Hesch published in 2009, and a meta‐analysis by Lin and colleagues published in 2010, summarize subsequent randomized trials that suggest that PPIs and H2 blockers are, at best, similarly effective at preventing upper gastrointestinal (GI) bleeding among critically ill patients.31, 32 Third, the NICE guidelines do not include stress ulcer prophylaxis as an appropriate indication for PPIs except in the prevention and treatment of NSAID [non‐steroidal anti‐inflammatory drug]‐associated ulcers.19 Finally, H2RAs are currently the only medications with an FDA‐approved indication for stress ulcer prophylaxis. We acknowledge that PPIs may be a reasonable and acceptable choice for stress ulcer prophylaxis in patients who meet indications, but we were unable to identify such patients in either of our administrative databases.
In our Denver Health population, only 31% of our patients spent any time in the intensive care unit, and only a fraction of these would have both an accepted indication for stress ulcer prophylaxis by the ASHP guidelines and an intolerance or contraindication to an H2RA or sulcralfate. While our administrative database lacked the detail necessary to identify this small group of patients, the number of patients who might have been misclassified as not having a valid PPI indication was likely very small. Similar to the findings of previous studies,15, 18, 23, 29 prophylaxis against gastrointestinal bleeding was the stated justification for prescribing the PPI in 56% of the DH patient charts reviewed. It is impossible for us to estimate the number of patients in our administrative database for whom stress ulcer prophylaxis was justified by existing guidelines, as it would be necessary to gather a number of specific clinical details for each patient including: 1) ICU stay; 2) presence of coagulopathy; 3) duration of mechanical ventilation; 4) presence of sepsis; 5) duration of ICU stay; 6) presence of occult bleeding for >6 days; and 7) use of high‐dose corticosteroids. This level of clinical detail would likely only be available through a prospective study design, as has been suggested by other authors.33 Further research into the use, safety, and effectiveness of PPIs specifically for stress ulcer prophylaxis is warranted.
In conclusion, we found that 73% of nearly 1 million Medicine patients discharged from academic medical centers received a PPI without a valid indication during their hospitalization. The implications of our findings are broad. PPIs are more expensive31 than H2RAs and there is increasing evidence that they have significant side effects. In both databases we examined, the rate of C. difficile infection was higher in patients receiving PPIs than others. The prescribing habits of physicians in these university hospital settings appear to be far out of line with published guidelines and evidence‐based practice. Reducing inappropriate prescribing of PPIs would be an important educational and quality assurance project in most institutions.
- IMS Health Web site. Available at: http://www.imshealth.com/deployedfiles/ims/Global/Content/Corporate/Press%20Room/Top‐line%20Market%20Data/2009%20Top‐line%20Market%20Data/Top%20Therapy%20Classes%20by%20U.S.Sales.pdf. Accessed May 1,2011.
- ,, , et al.Comparison of omeprazole and cimetidine in reflux oesophagitis: symptomatic, endoscopic, and histological evaluations.Gut.1990;31(9):968–972.
- ,,, et al.Omeprazole before endoscopy in patients with gastrointestinal bleeding.N Engl J Med.2007;356(16):1631–1640.
- ,,,.Use of gastric acid‐suppressive agents and the risk of community‐acquired Clostridium difficile‐associated disease.JAMA.2005;294(23):2989–2995.
- ,,, et al.Risk of adverse outcomes associated with concomitant use of clopidogrel and proton pump inhibitors following acute coronary syndrome.JAMA.2009;301(9):937–944.
- ,,,,,.Risk of community‐acquired pneumonia and use of gastric acid‐suppressive drugs.JAMA.2004;292(16):1955–1960.
- ,,,.Long‐term proton pump inhibitor therapy and risk of hip fracture.JAMA2006;296(24):2947–2953.
- ,,,,,.Use of proton pump inhibitors and the risk of community‐acquired pneumonia: a population‐based case‐control study.Arch Intern Med.2007;167(9):950–955.
- ,,,.Acid‐suppressive medication use and the risk for hospital‐acquired pneumonia.JAMA.2009;301(20):2120–2128.
- US Food and Drug Administration (FDA) Website. Available at: http://www.fda.gov/Safety/MedWatch/SafetyInformation/SafetyAlertsfor HumanMedicalProducts/ucm245275.htm. Accessed March 2,2011.
- ,,,.Inappropriate prescribing of proton pump inhibitors in primary care.Postgrad Med J.2007;83(975):66–68.
- ,.Stress ulcer prophylaxis in hospitalized patients not in intensive care units.Am J Health Syst Pharm.2007;64(13):1396–1400.
- ,,,.Predictors of inappropriate utilization of intravenous proton pump inhibitors.Aliment Pharmacol Ther.2007;25(5):609–615.
- ,,.Overuse of acid‐suppressive therapy in hospitalized patients.Am J Gastroenterol.2000;95(11):3118–3122.
- ,,,,,.Patterns and predictors of proton pump inhibitor overuse among academic and non‐academic hospitalists.Intern Med2010;49(23):2561–2568.
- ,,, et al.Hospital use of acid‐suppressive medications and its fall‐out on prescribing in general practice: a 1‐month survey.Aliment Pharmacol Ther.2003;17(12):1503–1506.
- ,,.Overuse and inappropriate prescribing of proton pump inhibitors in patients with Clostridium difficile‐associated disease.QJM.2008;101(6):445–448.
- ,,,.Acid suppressive therapy use on an inpatient internal medicine service.Ann Pharmacother.2006;40(7–8):1261–1266.
- National Institute of Clinical Excellence (NICE), National Health Service (NHS), Dyspepsia: Management of dyspepsia in adults in primary care. Web site. Available at: http://www.nice.org.uk/nicemedia/live/10950/29460/29460.pdf. Accessed May 1,2011.
- ,,.When should stress ulcer prophylaxis be used in the ICU?Curr Opin Crit Care.2009;15(2):139–143.
- ,.An evaluation of the use of proton pump inhibitors.Pharm World Sci2001;23(3):116–117.
- ,,.Overuse of proton pump inhibitors.J Clin Pharm Ther.2000;25(5):333–340.
- ,,,.Pattern of intravenous proton pump inhibitors use in ICU and non‐ICU setting: a prospective observational study.Saudi J Gastroenterol.2010;16(4):275–279.
- ,,, et al.Overuse of PPIs in patients at admission, during treatment, and at discharge in a tertiary Spanish hospital.Curr Clin Pharmacol.2010;5(4):288–297.
- ,,.Systematic review of the risk of enteric infection in patients taking acid suppression.Am J Gastroenterol.2007;102(9):2047–2056.
- ,,, et al.Iatrogenic gastric acid suppression and the risk of nosocomial Clostridium difficile infection.Arch Intern Med.2010;170(9):784–790.
- ,,,,.Recurrent community‐acquired pneumonia in patients starting acid‐suppressing drugs.Am J Med.2010;123(1):47–53.
- ,,, et al.Bacterial overgrowth during treatment with omeprazole compared with cimetidine: a prospective randomised double blind study.Gut.1996;39(1):54–59.
- ,,,.Why do physicians prescribe stress ulcer prophylaxis to general medicine patients?South Med J2010;103(11):1103–1110.
- ASHP therapeutic guidelines on stress ulcer prophylaxis.ASHP Commission on Therapeutics and approved by the ASHP Board of Directors on November 14, 1998.Am J Health Syst Pharm.1999;56(4):347–379.
- ,.Stress ulcer prophylaxis in the intensive care unit.Proc (Bayl Univ Med Cent).2009;22(4):373–376.
- ,,,,.The efficacy and safety of proton pump inhibitors vs histamine‐2 receptor antagonists for stress ulcer bleeding prophylaxis among critical care patients: a meta‐analysis.Crit Care Med.2010;38(4):1197–1205.
- ,,.Proton pump inhibitors for the prevention of stress‐related mucosal disease in critically‐ill patients: a meta‐analysis.J Med Assoc Thai.2009;92(5):632–637.
- ,,,.Proton pump inhibitors for prophylaxis of nosocomial upper gastrointestinal tract bleeding: effect of standardized guidelines on prescribing practice.Arch Intern Med.2010;170(9):779–783.
Proton pump inhibitors (PPIs) are the third most commonly prescribed class of medication in the United States, with $13.6 billion in yearly sales.1 Despite their effectiveness in treating acid reflux2 and their mortality benefit in the treatment of patients with gastrointestinal bleeding,3 recent literature has identified a number of risks associated with PPIs, including an increased incidence of Clostridium difficile infection,4 decreased effectiveness of clopidogrel in patients with acute coronary syndrome,5 increased risk of community‐ and hospital‐acquired pneumonia, and an increased risk of hip fracture.69 Additionally, in March of 2011, the US Food and Drug Administration (FDA) issued a warning regarding the potential for PPIs to cause low magnesium levels which can, in turn, cause muscle spasms, an irregular heartbeat, and convulsions.10
Inappropriate PPI prescription practice has been demonstrated in the primary care setting,11 as well as in small studies conducted in the hospital setting.1216 We hypothesized that many hospitalized patients receive these medications without having an accepted indication, and examined 2 populations of hospitalized patients, including administrative data from 6.5 million discharges from US university hospitals, to look for appropriate diagnoses justifying their use.
METHODS
We performed a retrospective review of administrative data collected between January 1, 2008 and December 31, 2009 from 2 patient populations: (a) those discharged from Denver Health (DH), a university‐affiliated public safety net hospital in Denver, CO; and (b) patients discharged from 112 academic health centers and 256 of their affiliated hospitals that participate in the University HealthSystem Consortium (UHC). The Colorado Multiple Institution Review Board reviewed and approved the conduct of this study.
Inclusion criteria for both populations were age >18 or <90 years, and hospitalization on a Medicine service. Prisoners and women known to be pregnant were excluded. In both cohorts, if patients had more than 1 admission during the 2‐year study period, only data from the first admission were used.
We recorded demographics, admitting diagnosis, and discharge diagnoses together with information pertaining to the name, route, and duration of administration of all PPIs (ie, omeprazole, lansoprazole, esomeprazole, pantoprazole, rabeprazole). We created a broadly inclusive set of valid indications for PPIs by incorporating diagnoses that could be identified by International Classification of Diseases, Ninth Revision.
(ICD‐9) codes from a number of previously published sources including the National Institute of Clinical Excellence (NICE) guidelines issued by the National Health Service (NHS) of the United Kingdom in 200012, 1721 (Table 1).
| Indication | ICD‐9 Code |
|---|---|
| |
| Helicobacter pylori | 041.86 |
| Abnormality of secretion of gastrin | 251.5 |
| Esophageal varices with bleeding | 456.0 |
| Esophageal varices without mention of bleeding | 456.1 |
| Esophageal varices in diseases classified elsewhere | 456.2 |
| Esophagitis | 530.10530.19 |
| Perforation of esophagus | 530.4 |
| Gastroesophageal laceration‐hemorrhage syndrome | 530.7 |
| Esophageal reflux | 530.81 |
| Barrett's esophagus | 530.85 |
| Gastric ulcer | 531.0031.91 |
| Duodenal ulcer | 532.00532.91 |
| Peptic ulcer, site unspecified | 533.00533.91 |
| Gastritis and duodenitis | 535.00535.71 |
| Gastroparesis | 536.3 |
| Dyspepsia and other specified disorders of function of stomach | 536.8 |
| Hemorrhage of gastrointestinal tract, unspecified | 578.9 |
To assess the accuracy of the administrative data from DH, we also reviewed the Emergency Department histories, admission histories, progress notes, electronic pharmacy records, endoscopy reports, and discharge summaries of 123 patients randomly selected (ie, a 5% sample) from the group of patients identified by administrative data to have received a PPI without a valid indication, looking for any accepted indication that might have been missed in the administrative data.
All analyses were performed using SAS Enterprise Guide 4.1 (SAS Institute, Cary, NC). A Student t test was used to compare continuous variables and a chi‐square test was used to compare categorical variables. Bonferroni corrections were used for multiple comparisons, such that P values less than 0.01 were considered to be significant for categorical variables.
RESULTS
Inclusion criteria were met by 9875 patients in the Denver Health database and 6,592,100 patients in the UHC database. The demographics and primary discharge diagnoses for these patients are summarized in Table 2.
| DH (N = 9875) | UHC (N = 6,592,100) | ||||
|---|---|---|---|---|---|
| Received a PPI | No PPI | Received a PPI | No PPI | ||
| |||||
| No. (%) | 3962 (40) | 5913 (60) | 918,474 (14) | 5,673,626 (86) | |
| Age (mean SD) | 53 15 | 51 16 | 59 17 | 55 18 | |
| Gender (% male) | 2197 (55) | 3438 (58) | 464,552 (51) | 2,882,577 (51) | |
| Race (% white) | 1610 (41) | 2425 (41) | 619,571 (67) | 3,670,450 (65) | |
| Top 5 primary discharge diagnoses | |||||
| Chest pain | 229 (6) | 462 (8) | Coronary atherosclerosis | 35,470 (4) | 186,321 (3) |
| Alcohol withdrawal | 147 (4) | 174 (3) | Acute myocardial infarction | 26,507 (3) | 132,159 (2) |
| Pneumonia, organism unspecified | 142 (4) | 262 (4) | Heart failure | 21,143 (2) | 103,751 (2) |
| Acute pancreatitis | 132 (3) | 106 (2) | Septicemia | 20,345 (2) | 64,915 (1) |
| Obstructive chronic bronchitis with (acute) exacerbation | 89 (2) | 154 (3) | Chest pain | 16,936 (2) | 107,497 (2) |
Only 39% and 27% of the patients in the DH and UHC databases, respectively, had a valid indication for PPIs on the basis of discharge diagnoses (Table 3). In the DH data, if admission ICD‐9 codes were also inspected for valid PPI indications, 1579 (40%) of patients receiving PPIs had a valid indication (admission ICD‐9 codes were not available for patients in the UHC database). Thirty‐one percent of Denver Health patients spent time in the intensive care unit (ICU) during their hospital stay and 65% of those patients received a PPI without a valid indication, as compared to 59% of patients who remained on the General Medicine ward (Table 3).
| DH (N = 9875) | UHC (N = 6,592,100) | |
|---|---|---|
| ||
| Patients receiving PPIs (% of total) | 3962 (40) | 918,474 (14) |
| Any ICU stay, N (% of all patients) | 1238 (31) | |
| General Medicine ward only, N (% of all patients) | 2724 (69) | |
| Patients with indication for PPI (% of all patients receiving PPIs)* | 1540 (39) | 247,142 (27) |
| Any ICU stay, N (% of all ICU patients) | 434 (35) | |
| General Medicine ward only, N (% of all ward patients) | 1106 (41) | |
| Patients without indication for PPI (% of those receiving PPIs)* | 2422 (61) | 671,332 (73) |
| Any ICU stay, N (% of all ICU patients) | 804 (65) | |
| General Medicine ward only, N (% of all ward patients) | 1618 (59) | |
Higher rates of concurrent C. difficile infections were observed in patients receiving PPIs in both databases; a higher rate of concurrent diagnosis of pneumonia was seen in patients receiving PPIs in the UHC population, with a nonsignificant trend towards the same finding in DH patients (Table 4).
| Denver Health | UHC | |||||
|---|---|---|---|---|---|---|
| Concurrent diagnosis | (+) PPI 3962 | () PPI 5913 | P | (+) PPI 918,474 | () PPI 5,673,626 | P |
| ||||||
| C. difficile | 46 (1.16) | 26 (0.44) | <0.0001 | 12,113 (1.32) | 175 (0.0031) | <0.0001 |
| Pneumonia | 400 (10.1) | 517 (8.7) | 0.0232 | 75,274 (8.2) | 300,557 (5.3) | <0.0001 |
Chart review in the DH population found valid indications for PPIs in 19% of patients who were thought not have a valid indication on the basis of the administrative data (Table 5). For 56% of those in whom no valid indication was confirmed, physicians identified prophylaxis as the justification.
| Characteristic | N (%) |
|---|---|
| |
| Valid indication found on chart review only | 23 (19) |
| No valid indication after chart review | 100 (81) |
| Written indication: prophylaxis | 56 (56) |
| No written documentation of indication present in the chart | 33 (33) |
| Written indication: continue home medication | 9 (9) |
| Intubated with or without written indication of prophylaxis | 16 (16) |
DISCUSSION
The important finding of this study was that the majority of patients in 2 large groups of Medicine patients hospitalized in university‐affiliated hospitals received PPIs without having a valid indication. To our knowledge, the more than 900,000 UHC patients who received a PPI during their hospitalization represent the largest inpatient population evaluated for appropriateness of PPI prescriptions.
Our finding that 41% of the patients admitted to the DH Medicine service received a PPI during their hospital stay is similar to what has been observed by others.9, 14, 22 The rate of PPI prescription was lower in the UHC population (14%) for unclear reasons. By our definition, 61% lacked an adequate diagnosis to justify the prescription of the PPI. After performing a chart review on a randomly selected 5% of these records, we found that the DH administrative database had failed to identify 19% of patients who had a valid indication for receiving a PPI. Adjusting the administrative data accordingly still resulted in 50% of DH patients not having a valid indication for receiving a PPI. This is consistent with the 54% recorded by Batuwitage and colleagues11 in the outpatient setting by direct chart review, as well as a range of 60%‐75% for hospitalized patients in other studies.12, 13, 15, 23, 24
Stomach acidity is believed to provide an important host defense against lower gastrointestinal tract infections including Salmonella, Campylobacter, and Clostridium difficile.25 A recent study by Howell et al26 showed a doseresponse effect between PPI use and C. difficile infection, supporting a causal connection between loss of stomach acidity and development of Clostridium difficile‐associated diarrhea (CDAD). We found that C. difficile infection was more common in both populations of patients receiving PPIs (although the relative risk was much higher in the UHC database) (Table 5). The rate of CDAD in DH patients who received PPIs was 2.6 times higher than in patients who did not receive these acid suppressive agents.
The role of acid suppression in increasing risk for community‐acquired pneumonia is not entirely clear. Theories regarding the loss of an important host defense and bacterial proliferation head the list.6, 8, 27 Gastric and duodenal bacterial overgrowth is significantly more common in patients receiving PPIs than in patients receiving histamine type‐2 (H2) blockers.28 Previous studies have identified an increased rate of hospital‐acquired pneumonia and recurrent community‐acquired pneumonia27 in patients receiving any form of acid suppression therapy, but the risk appears to be greater in patients receiving PPIs than in those receiving H2 receptor antagonists (H2RAs).9 Significantly more patients in the UHC population who were taking PPIs had a concurrent diagnosis of pneumonia, consistent with previous studies alerting to this association6, 8, 9, 27 and consistent with the nonsignificant trend observed in the DH population.
Our study has a number of limitations. Our database comes from a single university‐affiliated public hospital with residents and hospitalists writing orders for all medications. The hospitals in the UHC are also teaching hospitals. Accordingly, our results might not generalize to other settings or reflect prescribing patterns in private, nonteaching hospital environments. Because our study was retrospective, we could not confirm the decision‐making process supporting the prescription of PPIs. Similarly, we could not temporarily relate the existence of the indication with the time the PPI was prescribed. Our list of appropriate indications for prescribing PPIs was developed by reviewing a number of references, and other studies have used slightly different lists (albeit the more commonly recognized indications are the same), but it may be argued that the list either includes or misses diagnoses in error.
While there is considerable debate about the use of PPIs for stress ulcer prophylaxis,29 we specifically chose not to include this as one of our valid indications for PPIs for 4 reasons. First, the American Society of Health‐System Pharmacists (ASHP) Report does not recommend prophylaxis for non‐ICU patients, and only recommends prophylaxis for those ICU patients with a coagulopathy, those requiring mechanical ventilation for more than 48 hours, those with a history of gastrointestinal ulceration or bleeding in the year prior to admission, and those with 2 or more of the following indications: sepsis, ICU stay >1 week, occult bleeding lasting 6 or more days, receiving high‐dose corticosteroids, and selected surgical situations.30 At the time the guideline was written, the authors note that there was insufficient data on PPIs to make any recommendations on their use, but no subsequent guidelines have been issued.30 Second, a review by Mohebbi and Hesch published in 2009, and a meta‐analysis by Lin and colleagues published in 2010, summarize subsequent randomized trials that suggest that PPIs and H2 blockers are, at best, similarly effective at preventing upper gastrointestinal (GI) bleeding among critically ill patients.31, 32 Third, the NICE guidelines do not include stress ulcer prophylaxis as an appropriate indication for PPIs except in the prevention and treatment of NSAID [non‐steroidal anti‐inflammatory drug]‐associated ulcers.19 Finally, H2RAs are currently the only medications with an FDA‐approved indication for stress ulcer prophylaxis. We acknowledge that PPIs may be a reasonable and acceptable choice for stress ulcer prophylaxis in patients who meet indications, but we were unable to identify such patients in either of our administrative databases.
In our Denver Health population, only 31% of our patients spent any time in the intensive care unit, and only a fraction of these would have both an accepted indication for stress ulcer prophylaxis by the ASHP guidelines and an intolerance or contraindication to an H2RA or sulcralfate. While our administrative database lacked the detail necessary to identify this small group of patients, the number of patients who might have been misclassified as not having a valid PPI indication was likely very small. Similar to the findings of previous studies,15, 18, 23, 29 prophylaxis against gastrointestinal bleeding was the stated justification for prescribing the PPI in 56% of the DH patient charts reviewed. It is impossible for us to estimate the number of patients in our administrative database for whom stress ulcer prophylaxis was justified by existing guidelines, as it would be necessary to gather a number of specific clinical details for each patient including: 1) ICU stay; 2) presence of coagulopathy; 3) duration of mechanical ventilation; 4) presence of sepsis; 5) duration of ICU stay; 6) presence of occult bleeding for >6 days; and 7) use of high‐dose corticosteroids. This level of clinical detail would likely only be available through a prospective study design, as has been suggested by other authors.33 Further research into the use, safety, and effectiveness of PPIs specifically for stress ulcer prophylaxis is warranted.
In conclusion, we found that 73% of nearly 1 million Medicine patients discharged from academic medical centers received a PPI without a valid indication during their hospitalization. The implications of our findings are broad. PPIs are more expensive31 than H2RAs and there is increasing evidence that they have significant side effects. In both databases we examined, the rate of C. difficile infection was higher in patients receiving PPIs than others. The prescribing habits of physicians in these university hospital settings appear to be far out of line with published guidelines and evidence‐based practice. Reducing inappropriate prescribing of PPIs would be an important educational and quality assurance project in most institutions.
- IMS Health Web site. Available at: http://www.imshealth.com/deployedfiles/ims/Global/Content/Corporate/Press%20Room/Top‐line%20Market%20Data/2009%20Top‐line%20Market%20Data/Top%20Therapy%20Classes%20by%20U.S.Sales.pdf. Accessed May 1,2011.
- ,, , et al.Comparison of omeprazole and cimetidine in reflux oesophagitis: symptomatic, endoscopic, and histological evaluations.Gut.1990;31(9):968–972.
- ,,, et al.Omeprazole before endoscopy in patients with gastrointestinal bleeding.N Engl J Med.2007;356(16):1631–1640.
- ,,,.Use of gastric acid‐suppressive agents and the risk of community‐acquired Clostridium difficile‐associated disease.JAMA.2005;294(23):2989–2995.
- ,,, et al.Risk of adverse outcomes associated with concomitant use of clopidogrel and proton pump inhibitors following acute coronary syndrome.JAMA.2009;301(9):937–944.
- ,,,,,.Risk of community‐acquired pneumonia and use of gastric acid‐suppressive drugs.JAMA.2004;292(16):1955–1960.
- ,,,.Long‐term proton pump inhibitor therapy and risk of hip fracture.JAMA2006;296(24):2947–2953.
- ,,,,,.Use of proton pump inhibitors and the risk of community‐acquired pneumonia: a population‐based case‐control study.Arch Intern Med.2007;167(9):950–955.
- ,,,.Acid‐suppressive medication use and the risk for hospital‐acquired pneumonia.JAMA.2009;301(20):2120–2128.
- US Food and Drug Administration (FDA) Website. Available at: http://www.fda.gov/Safety/MedWatch/SafetyInformation/SafetyAlertsfor HumanMedicalProducts/ucm245275.htm. Accessed March 2,2011.
- ,,,.Inappropriate prescribing of proton pump inhibitors in primary care.Postgrad Med J.2007;83(975):66–68.
- ,.Stress ulcer prophylaxis in hospitalized patients not in intensive care units.Am J Health Syst Pharm.2007;64(13):1396–1400.
- ,,,.Predictors of inappropriate utilization of intravenous proton pump inhibitors.Aliment Pharmacol Ther.2007;25(5):609–615.
- ,,.Overuse of acid‐suppressive therapy in hospitalized patients.Am J Gastroenterol.2000;95(11):3118–3122.
- ,,,,,.Patterns and predictors of proton pump inhibitor overuse among academic and non‐academic hospitalists.Intern Med2010;49(23):2561–2568.
- ,,, et al.Hospital use of acid‐suppressive medications and its fall‐out on prescribing in general practice: a 1‐month survey.Aliment Pharmacol Ther.2003;17(12):1503–1506.
- ,,.Overuse and inappropriate prescribing of proton pump inhibitors in patients with Clostridium difficile‐associated disease.QJM.2008;101(6):445–448.
- ,,,.Acid suppressive therapy use on an inpatient internal medicine service.Ann Pharmacother.2006;40(7–8):1261–1266.
- National Institute of Clinical Excellence (NICE), National Health Service (NHS), Dyspepsia: Management of dyspepsia in adults in primary care. Web site. Available at: http://www.nice.org.uk/nicemedia/live/10950/29460/29460.pdf. Accessed May 1,2011.
- ,,.When should stress ulcer prophylaxis be used in the ICU?Curr Opin Crit Care.2009;15(2):139–143.
- ,.An evaluation of the use of proton pump inhibitors.Pharm World Sci2001;23(3):116–117.
- ,,.Overuse of proton pump inhibitors.J Clin Pharm Ther.2000;25(5):333–340.
- ,,,.Pattern of intravenous proton pump inhibitors use in ICU and non‐ICU setting: a prospective observational study.Saudi J Gastroenterol.2010;16(4):275–279.
- ,,, et al.Overuse of PPIs in patients at admission, during treatment, and at discharge in a tertiary Spanish hospital.Curr Clin Pharmacol.2010;5(4):288–297.
- ,,.Systematic review of the risk of enteric infection in patients taking acid suppression.Am J Gastroenterol.2007;102(9):2047–2056.
- ,,, et al.Iatrogenic gastric acid suppression and the risk of nosocomial Clostridium difficile infection.Arch Intern Med.2010;170(9):784–790.
- ,,,,.Recurrent community‐acquired pneumonia in patients starting acid‐suppressing drugs.Am J Med.2010;123(1):47–53.
- ,,, et al.Bacterial overgrowth during treatment with omeprazole compared with cimetidine: a prospective randomised double blind study.Gut.1996;39(1):54–59.
- ,,,.Why do physicians prescribe stress ulcer prophylaxis to general medicine patients?South Med J2010;103(11):1103–1110.
- ASHP therapeutic guidelines on stress ulcer prophylaxis.ASHP Commission on Therapeutics and approved by the ASHP Board of Directors on November 14, 1998.Am J Health Syst Pharm.1999;56(4):347–379.
- ,.Stress ulcer prophylaxis in the intensive care unit.Proc (Bayl Univ Med Cent).2009;22(4):373–376.
- ,,,,.The efficacy and safety of proton pump inhibitors vs histamine‐2 receptor antagonists for stress ulcer bleeding prophylaxis among critical care patients: a meta‐analysis.Crit Care Med.2010;38(4):1197–1205.
- ,,.Proton pump inhibitors for the prevention of stress‐related mucosal disease in critically‐ill patients: a meta‐analysis.J Med Assoc Thai.2009;92(5):632–637.
- ,,,.Proton pump inhibitors for prophylaxis of nosocomial upper gastrointestinal tract bleeding: effect of standardized guidelines on prescribing practice.Arch Intern Med.2010;170(9):779–783.
Copyright © 2011 Society of Hospital Medicine
Bacterial Contamination of Work Wear
In September 2007, the British Department of Health developed guidelines for health care workers regarding uniforms and work wear that banned the traditional white coat and other long‐sleeved garments in an attempt to decrease nosocomial bacterial transmission.1 Similar policies have recently been adopted in Scotland.2 Interestingly, the National Health Service report acknowledged that evidence was lacking that would support that white coats and long‐sleeved garments caused nosocomial infection.1, 3 Although many studies have documented that health care work clothes are contaminated with bacteria, including methicillin‐resistant Staphylococcal aureus (MRSA) and other pathogenic species,413 none have determined whether avoiding white coats and switching to short‐sleeved garments decreases bacterial contamination.
We performed a prospective, randomized, controlled trial designed to compare the extent of bacterial contamination of physicians' white coats with that of newly laundered, standardized short‐sleeved uniforms. Our hypotheses were that infrequently cleaned white coats would have greater bacterial contamination than uniforms, that the extent of contamination would be inversely related to the frequency with which the coats were washed, and that the increased contamination of the cuffs of the white coats would result in increased contamination of the skin of the wrists. Our results led us also to assess the rate at which bacterial contamination of short‐sleeved uniforms occurs during the workday.
Methods
The study was conducted at Denver Health, a university‐affiliated public safety‐net hospital and was approved by the Colorado Multiple Institutional Review Board.
Trial Design
The study was a prospective, randomized, controlled trial. No protocol changes occurred during the study.
Participants
Participants included residents and hospitalists directly caring for patients on internal medicine units between August 1, 2008 and November 15, 2009.
Intervention
Subjects wore either a standard, newly laundered, short‐sleeved uniform or continued to wear their own white coats.
Outcomes
The primary end point was the percentage of subjects contaminated with MRSA. Cultures were collected using a standardized RODAC imprint method14 with BBL RODAC plates containing trypticase soy agar with lecithin and polysorbate 80 (Becton Dickinson, Sparks, MD) 8 hours after the physicians started their work day. All physicians had cultures obtained from the breast pocket and sleeve cuff (long‐sleeved for the white coats, short‐sleeved for the uniforms) and from the skin of the volar surface of the wrist of their dominant hand. Those wearing white coats also had cultures obtained from the mid‐biceps level of the sleeve of the dominant hand, as this location closely approximated the location of the cuffs of the short‐sleeved uniforms.
Cultures were incubated in ambient air at 35C‐37C for 1822 hours. After incubation, visible colonies were counted using a dissecting microscope to a maximum of 200 colonies at the recommendation of the manufacturer. Colonies that were morphologically consistent with Staphylococcus species by colony growth and Gram stain were further tested for coagulase using a BactiStaph rapid latex agglutination test (Remel, Lenexa, KS). If positive, these colonies were subcultured to sheep blood agar (Remel, Lenexa, KS) and BBL MRSA Chromagar (Becton Dickinson, Sparks, MD) and incubated for an additional 1824 hours. Characteristic growth on blood agar that also produced mauve‐colored colonies on chromagar was taken to indicate MRSA.
A separate set of 10 physicians donned newly laundered, short‐sleeved uniforms at 6:30 AM for culturing from the breast pocket and sleeve cuff of the dominant hand prior to and 2.5, 5, and 8 hours after they were donned by the participants (with culturing of each site done on separate days to avoid the effects of obtaining multiple cultures at the same site on the same day). These cultures were not assessed for MRSA.
At the time that consent was obtained, all participants completed an anonymous survey that assessed the frequency with which they normally washed or changed their white coats.
Sample Size
Based on the finding that 20% of our first 20 participants were colonized with MRSA, we determined that to find a 25% difference in the percentage of subjects colonized with MRSA in the 2 groups, with a power of 0.8 and P < 0.05 being significant (2‐sided Fisher's exact test), 50 subjects would be needed in each group.
Randomization
Randomization of potential participants occurred 1 day prior to the study using a computer‐generated table of random numbers. The principal investigator and a coinvestigator enrolled participants. Consent was obtained from those randomized to wear a newly laundered standard short‐sleeved uniform at the time of randomization so that they could don the uniforms when arriving at the hospital the following morning (at approximately 6:30 AM). Physicians in this group were also instructed not to wear their white coats at any time during the day they were wearing the uniforms. Physicians randomized to wear their own white coats were not notified or consented until the day of the study, a few hours prior to the time the cultures were obtained. This approach prevented them from either changing their white coats or washing them prior to the time the cultures were taken.
Because our study included both employees of the hospital and trainees, a number of protection measures were required. No information of any sort was collected about those who agreed or refused to participate in the study. In addition, the request to participate in the study did not come from the person's direct supervisor.
Statistical Methods
All data were collected and entered using Excel for Mac 2004 version 11.5.4. All analyses were performed using SAS Enterprise Guide 4.1 (SAS Institute, Inc., Cary, NC).
The Wilcoxon rank‐sum test and chi square analysis were used to seek differences in colony count and percentage of cultures with MRSA, respectively, in cultures obtained: (1) from the sleeve cuffs and pockets of the white coats compared with those from the sleeve cuffs and pockets of the uniforms, (2) from the sleeve cuffs of the white coats compared with those from the sleeve cuffs of the short‐sleeved uniforms, (3) from the mid‐biceps area of the sleeve sof the white coats compared with those from the sleeve cuffs of the uniforms, and (4) from the skin of the wrists of those wearing white coats compared with those wearing the uniforms. Bonferroni's correction for multiple comparisons was applied, with a P < 0.125 indicating significance.
Friedman's test and repeated‐measures logistic regression were used to seek differences in colony count or of the percentage of cultures with MRSA, respectively, on white coats or uniforms by site of culture on both garments. A P < 0.05 indicated significance for these analyses.
The Kruskal‐Wallis and chi‐square tests were utilized to test the effect of white coat wash frequency on colony count and MRSA contamination, respectively.
All data are presented as medians with 95% confidence intervals or proportions.
Results
Participant Flow
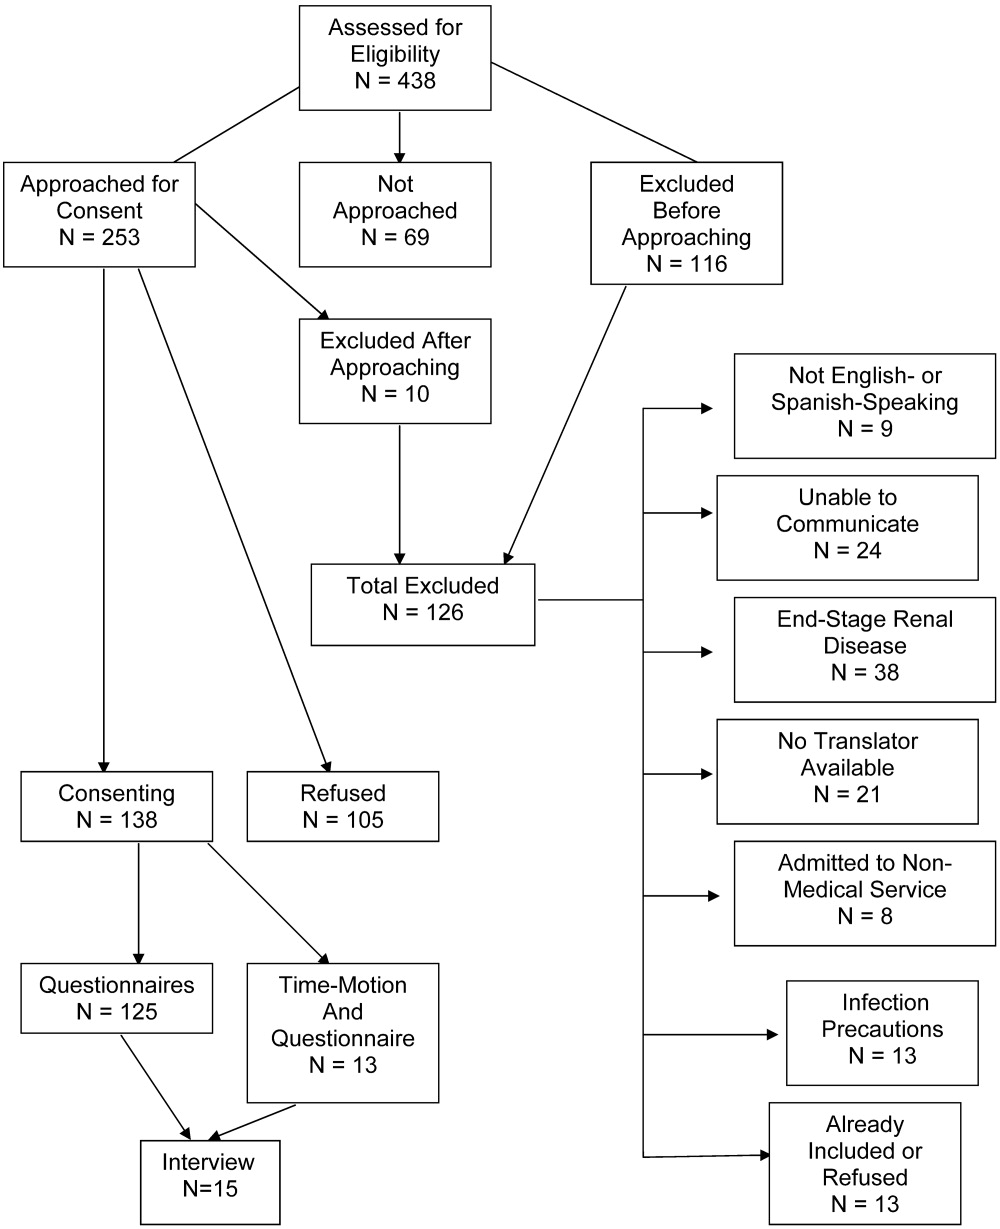
Fifty physicians were studied in each group, all of whom completed the survey. In general, more than 95% of potential participants approached agreed to participate in the study (Figure 1).

Recruitment
The first and last physicians were studied in August 2008 and November 2009, respectively. The trial ended when the specified number of participants (50 in each group) had been enrolled.
Data on Entry
No data were recorded from the participants at the time of randomization in compliance with institutional review board regulations pertaining to employment issues that could arise when studying members of the workforce.
Outcomes
No significant differences were found between the colony counts cultured from white coats (104 [80127]) versus newly laundered uniforms (142 [83213]), P = 0.61. No significant differences were found between the colony counts cultured from the sleeve cuffs of the white coats (58.5 [4866]) versus the uniforms (37 [2768]), P = 0.07, or between the colony counts cultured from the pockets of the white coats (45.5 [3254]) versus the uniforms (74.5 [4897], P = 0.040. Bonferroni corrections were used for multiple comparisons such that a P < 0.0125 was considered significant. Cultures from at least 1 site of 8 of 50 physicians (16%) wearing white coats and 10 of 50 physicians (20%) wearing short‐sleeved uniforms were positive for MRSA (P = .60).
Colony counts were greater in cultures obtained from the sleeve cuffs of the white coats compared with the pockets or mid‐biceps area (Table 1). For the uniforms, no difference in colony count in cultures from the pockets versus sleeve cuffs was observed. No difference was found when comparing the number of subjects with MRSA contamination of the 3 sites of the white coats or the 2 sites of the uniforms (Table 1).
| White Coat (n = 50) | P | Uniforms (n = 50) | P | |
|---|---|---|---|---|
| Colony count, median (95% CI) | ||||
| Sleeve cuff | 58.5 (4866) | < 0.0001 | 37.0 (2768) | 0.25 |
| 45.5 (3254) | 74.5 (4897) | |||
| Mid‐biceps area of sleeve | 25.5 (2029) | |||
| MRSA contamination, n (%) | ||||
| Sleeve cuff | 4 (8%) | 0.71 | 6 (12%) | 0.18 |
| 5 (10%) | 9 (18%) | |||
| Mid‐biceps area of sleeve | 3 (6%) |
No difference was observed with respect to colony count or the percentage of subjects positive for MRSA in cultures obtained from the mid‐biceps area of the white coats versus those from the cuffs of the short‐sleeved uniforms (Table 2).
| White Coat Mid‐Biceps (n = 50) | Uniform Sleeve Cuff (n = 50) | P | |
|---|---|---|---|
| Colony count, median (95% CI) | 25.5 (2029) | 37.0 (2768) | 0.07 |
| MRSA contamination, n (%) | 3 (6%) | 6 (12%) | 0.49 |
No difference was observed with respect to colony count or the percentage of subjects positive for MRSA in cultures obtained from the volar surface of the wrists of subjects wearing either of the 2 garments (Table 3).
| White Coat (n = 50) | Uniform (n = 50) | P | |
|---|---|---|---|
| Colony count, median (95% CI) | 23.5 (1740) | 40.5 (2859) | 0.09 |
| MRSA Contamination, n (% of subjects) | 3 (6%) | 5 (10%) | 0.72 |
The frequency with which physicians randomized to wearing their white coats admitted to washing or changing their coats varied markedly (Table 4). No significant differences were found with respect to total colony count (P = 0.81), colony count by site (data not shown), or percentage of physicians contaminated with MRSA (P = 0.22) as a function of washing or changing frequency (Table 4).
| White Coat Washing Frequency | Number of Subjects (%) | Total Colony Count (All Sites), Median (95% CI) | Number with MRSA Contamination, n (%) |
|---|---|---|---|
| Weekly | 15 (30%) | 124 (107229) | 1 (7%) |
| Every 2 weeks | 21 (42%) | 156 (90237) | 6 (29%) |
| Every 4 weeks | 8 (16%) | 89 (41206) | 0 (0%) |
| Every 8 weeks | 5 (10%) | 140 (58291) | 2 (40%) |
| Rarely | 1 (2%) | 150 | 0 (0%) |
Sequential culturing showed that the newly laundered uniforms were nearly sterile prior to putting them on. By 3 hours of wear, however, nearly 50% of the colonies counted at 8 hours were already present (Figure 2).

Harms
No adverse events occurred during the course of the study in either group.
Discussion
The important findings of this study are that, contrary to our hypotheses, at the end of an 8‐hour workday, no significant differences were found between the extent of bacterial or MRSA contamination of infrequently washed white coats compared with those of newly laundered uniforms, no difference was observed with respect to the extent of bacterial or MRSA contamination of the wrists of physicians wearing either of the 2 garments, and no association was apparent between the extent of bacterial or MRSA contamination and the frequency with which white coats were washed or changed. In addition, we also found that bacterial contamination of newly laundered uniforms occurred within hours of putting them on.
Interpretation
Numerous studies have demonstrated that white coats and uniforms worn by health care providers are frequently contaminated with bacteria, including both methicillin‐sensitive and ‐resistant Staphylococcus aureus and other pathogens.413 This contamination may come from nasal or perineal carriage of the health care provider, from the environment, and/or from patients who are colonized or infected.11, 15 Although many have suggested that patients can become contaminated from contact with health care providers' clothing and studies employing pulsed‐field gel electrophoresis and other techniques have suggested that cross‐infection can occur,10, 1618 others have not confirmed this contention,19, 20 and Lessing and colleagues16 concluded that transmission from staff to patients was a rare phenomenon. The systematic review reported to the Department of Health in England,3 the British Medical Association guidelines regarding dress codes for doctors,21 and the department's report on which the new clothing guidelines were based1 concluded there was no conclusive evidence indicating that work clothes posed a risk of spreading infection to patients. Despite this, the Working Group and the British Medical Association recommended that white coats should not be worn when providing patient care and that shirts and blouses should be short‐sleeved.1 Recent evidence‐based reviews concluded that there was insufficient evidence to justify this policy,3, 22 and our data indicate that the policy will not decrease bacterial or MRSA contamination of physicians' work clothes or skin.
The recommendation that long‐sleeved clothing should be avoided comes from studies indicating that cuffs of these garments are more heavily contaminated than other areas5, 8 and are more likely to come in contact with patients.1 Wong and colleagues5 reported that cuffs and lower front pockets had greater contamination than did the backs of white coats, but no difference was seen in colony count from cuffs compared with pockets. Loh and colleagues8 found greater bacterial contamination on the cuffs than on the backs of white coats, but their conclusion came from comparing the percentage of subjects with selected colony counts (ie, between 100 and 199 only), and the analysis did not adjust for repeated sampling of each participant. Apparently, colony counts from the cuffs were not different than those from the pockets. Callaghan7 found that contamination of nursing uniforms was equal at all sites. We found that sleeve cuffs of white coats had slightly but significantly more contamination with bacteria than either the pocket or the midsleeve areas, but interestingly, we found no difference in colony count from cultures taken from the skin at the wrists of the subjects wearing either garment. We found no difference in the extent of bacterial contamination by site in the subjects wearing short‐sleeved uniforms or in the percentage of subjects contaminated with MRSA by site of culture of either garment.
Contrary to our hypothesis, we found no association between the frequency with which white coats were changed or washed and the extent of bacterial contamination, despite the physicians having admitted to washing or changing their white coats infrequently (Table 4). Similar findings were reported by Loh and colleagues8 and by Treakle and colleagues.12
Our finding that contamination of clean uniforms happens rapidly is consistent with published data. Speers and colleagues4 found increasing contamination of nurses' aprons and dresses comparing samples obtained early in the day with those taken several hours later. Boyce and colleagues6 found that 65% of nursing uniforms were contaminated with MRSA after performing morning patient‐care activities on patients with MRSA wound or urine infections. Perry and colleagues9 found that 39% of uniforms that were laundered at home were contaminated with MRSA, vancomycin‐resistant enterococci, or Clostridium difficile at the beginning of the work shift, increasing to 54% by the end of a 24‐hour shift, and Babb and colleagues20 found that nearly 100% of nurses' gowns were contaminated within the first day of use (33% with Staphylococcus aureus). Dancer22 recently suggested that if staff were afforded clean coats every day, it is possible that concerns over potential contamination would be less of an issue. Our data suggest, however, that work clothes would have to be changed every few hours if the intent were to reduce bacterial contamination.
Limitations
Our study has a number of potential limitations. The RODAC imprint method only sampled a small area of both the white coats and the uniforms, and accordingly, the culture data might not accurately reflect the total degree of contamination. However, we cultured 3 areas on the white coats and 2 on the uniforms, including areas thought to be more heavily contaminated (sleeve cuffs of white coats). Although this area had greater colony counts, the variation in bacterial and MRSA contamination from all areas was small.
We did not culture the anterior nares to determine if the participants were colonized with MRSA. Normal health care workers have varying degrees of nasal colonization with MRSA, and this could account for some of the 16%‐20% MRSA contamination rate we observed. However, previous studies have shown that nasal colonization of healthcare workers only minimally contributes to uniform contamination.4
Although achieving good hand hygiene compliance has been a major focus at our hospital, we did not track the hand hygiene compliance of the physicians in either group. Accordingly, not finding reduced bacterial contamination in those wearing short‐sleeved uniforms could be explained if physicians in this group had systematically worse hand‐washing compliance than those randomized to wearing their own white coats. Our use of concurrent controls limits this possibility, as does that during the time of this study, hand hygiene compliance (assessed by monthly surreptitious observation) was approximately 90% throughout the hospital.
Despite the infrequent wash frequencies reported, the physicians' responses to the survey could have overestimated the true wash frequency as a result of the Hawthorne effect. The colony count and MRSA contamination rates observed, however, suggest that even if this occurred, it would not have altered our conclusion that bacterial contamination was not associated with wash frequency.
Generalizability
Because data were collected from a single, university‐affiliated public teaching hospital from hospitalists and residents working on the internal medicine service, the results might not be generalizable to other types of institutions, other personnel, or other services.
In conclusion, bacterial contamination of work clothes occurs within the first few hours after donning them. By the end of an 8‐hour work day, we found no data supporting the contention that long‐sleeved white coats were more heavily contaminated than were short‐sleeved uniforms. Our data do not support discarding white coats for uniforms that are changed on a daily basis or for requiring health care workers to avoid long‐sleeved garments.
Acknowledgements
The authors thank Henry Fonseca and his team for providing our physician uniforms. They also thank the Denver Health Department of Medicine Small Grants program for supporting this study.
- Department of Health. Uniforms and workwear: an evidence base for developing local policy. National Health Service, September 17, 2007. Available at: http://www.dh.gov.uk/en/Publicationsandstatistics/Publications/Publicationspolicyandguidance/DH_078433. Accessed January 29,2010.
- Scottish Government Health Directorates. NHS Scotland Dress Code. Available at: http://www.sehd.scot.nhs.uk/mels/CEL2008_53.pdf. Accessed February 10,2010.
- ,,,.Uniform: an evidence review of the microbiological significance of uniforms and uniform policy in the prevention and control of healthcare‐associated infections. Report to the Department of Health (England).J Hosp Infect.2007;66:301–307.
- ,,,.Contamination of nurses' uniforms with Staphylococcus aureus.Lancet.1969;2:233–235.
- ,,.Microbial flora on doctors' white coats.Brit Med J.1991;303:1602–1604.
- ,,,.Environmental contamination due to methicillin‐resistant Staphylococcus aureus: possible infection control implications.Infect Control Hosp Epidemiol.1997;18:622–627.
- ,Bacterial contamination of nurses' uniforms: a study.Nursing Stand.1998;13:37–42.
- ,,.Bacterial flora on the white coats of medical students.J Hosp Infection.2000;45:65–68.
- ,,.Bacterial contamination of uniforms.J Hosp Infect.2001;48:238–241.
- ,,, et al.Significance of methicillin‐resistant Staphylococcus aureus (MRSA) survey in a university teaching hospital.J Infec Chemother.2003;9:172–177.
- ,,, et al.Detection of methicillin‐resistant Staphylococcus aureus and vancomycin‐resistant enterococci on the gowns and gloves of healthcare workers.Infect Control Hosp Epidemiol2008;29 (7):583–9.
- ,,,,,.Bacterial contamination of health care workers' white coats.Am J Infect Control.2009;37:101–105.
- ,,,,,.Meticillin‐resistant Staphylococcus aureus contamination of healthcare workers' uniforms in long‐term care facilities.J Hosp Infect.2009;71:170–175.
- ,,,,.Comparison of the Rodac imprint method to selective enrichment broth for recovery of vancomycin‐resistant enterococci and drug‐resistant Enterobacteriaceae from environmental surfaces.J Clin Microbiol.2000;38:4646–4648.
- ,,.Effect of clothing on dispersal of Staphylococcus aureus by males and females.Lancet.1974;2:1131–1133.
- ,,.When should healthcare workers be screened for methicillin‐resistant Staphylococcus aureus?J Hosp Infect.1996;34:205–210.
- ,,.Methicillin‐resistant Staphylococcus aureus transmission: the possible importance of unrecognized health care worker carriage.Am J Infect Control.2008;36:93–97.
- ,,, et al.Methicillin‐resistant Staphylococcus aureus carriage, infection and transmission in dialysis patients, healthcare workers and their family members.Nephrol Dial Transplant.2008;23:1659–1665.
- ,,.Are active microbiological surveillance and subsequent isolation needed to prevent the spread of methicillin‐resistant Staphylococcus aureus.Clin Infect Dis.2005;40:405–409.
- ,,.Contamination of protective clothing and nurses' uniforms in an isolation ward.J Hosp Infect.1983;4:149–157.
- British Medical Association. Uniform and dress code for doctors. December 6, 2007. Available at: http://www.bma.org.uk/employmentandcontracts/working_arrangements/CCSCdresscode051207.jsp. Accessed February 9,2010.
- .Pants, policies and paranoia.J Hosp Infect.2010;74:10–15.
In September 2007, the British Department of Health developed guidelines for health care workers regarding uniforms and work wear that banned the traditional white coat and other long‐sleeved garments in an attempt to decrease nosocomial bacterial transmission.1 Similar policies have recently been adopted in Scotland.2 Interestingly, the National Health Service report acknowledged that evidence was lacking that would support that white coats and long‐sleeved garments caused nosocomial infection.1, 3 Although many studies have documented that health care work clothes are contaminated with bacteria, including methicillin‐resistant Staphylococcal aureus (MRSA) and other pathogenic species,413 none have determined whether avoiding white coats and switching to short‐sleeved garments decreases bacterial contamination.
We performed a prospective, randomized, controlled trial designed to compare the extent of bacterial contamination of physicians' white coats with that of newly laundered, standardized short‐sleeved uniforms. Our hypotheses were that infrequently cleaned white coats would have greater bacterial contamination than uniforms, that the extent of contamination would be inversely related to the frequency with which the coats were washed, and that the increased contamination of the cuffs of the white coats would result in increased contamination of the skin of the wrists. Our results led us also to assess the rate at which bacterial contamination of short‐sleeved uniforms occurs during the workday.
Methods
The study was conducted at Denver Health, a university‐affiliated public safety‐net hospital and was approved by the Colorado Multiple Institutional Review Board.
Trial Design
The study was a prospective, randomized, controlled trial. No protocol changes occurred during the study.
Participants
Participants included residents and hospitalists directly caring for patients on internal medicine units between August 1, 2008 and November 15, 2009.
Intervention
Subjects wore either a standard, newly laundered, short‐sleeved uniform or continued to wear their own white coats.
Outcomes
The primary end point was the percentage of subjects contaminated with MRSA. Cultures were collected using a standardized RODAC imprint method14 with BBL RODAC plates containing trypticase soy agar with lecithin and polysorbate 80 (Becton Dickinson, Sparks, MD) 8 hours after the physicians started their work day. All physicians had cultures obtained from the breast pocket and sleeve cuff (long‐sleeved for the white coats, short‐sleeved for the uniforms) and from the skin of the volar surface of the wrist of their dominant hand. Those wearing white coats also had cultures obtained from the mid‐biceps level of the sleeve of the dominant hand, as this location closely approximated the location of the cuffs of the short‐sleeved uniforms.
Cultures were incubated in ambient air at 35C‐37C for 1822 hours. After incubation, visible colonies were counted using a dissecting microscope to a maximum of 200 colonies at the recommendation of the manufacturer. Colonies that were morphologically consistent with Staphylococcus species by colony growth and Gram stain were further tested for coagulase using a BactiStaph rapid latex agglutination test (Remel, Lenexa, KS). If positive, these colonies were subcultured to sheep blood agar (Remel, Lenexa, KS) and BBL MRSA Chromagar (Becton Dickinson, Sparks, MD) and incubated for an additional 1824 hours. Characteristic growth on blood agar that also produced mauve‐colored colonies on chromagar was taken to indicate MRSA.
A separate set of 10 physicians donned newly laundered, short‐sleeved uniforms at 6:30 AM for culturing from the breast pocket and sleeve cuff of the dominant hand prior to and 2.5, 5, and 8 hours after they were donned by the participants (with culturing of each site done on separate days to avoid the effects of obtaining multiple cultures at the same site on the same day). These cultures were not assessed for MRSA.
At the time that consent was obtained, all participants completed an anonymous survey that assessed the frequency with which they normally washed or changed their white coats.
Sample Size
Based on the finding that 20% of our first 20 participants were colonized with MRSA, we determined that to find a 25% difference in the percentage of subjects colonized with MRSA in the 2 groups, with a power of 0.8 and P < 0.05 being significant (2‐sided Fisher's exact test), 50 subjects would be needed in each group.
Randomization
Randomization of potential participants occurred 1 day prior to the study using a computer‐generated table of random numbers. The principal investigator and a coinvestigator enrolled participants. Consent was obtained from those randomized to wear a newly laundered standard short‐sleeved uniform at the time of randomization so that they could don the uniforms when arriving at the hospital the following morning (at approximately 6:30 AM). Physicians in this group were also instructed not to wear their white coats at any time during the day they were wearing the uniforms. Physicians randomized to wear their own white coats were not notified or consented until the day of the study, a few hours prior to the time the cultures were obtained. This approach prevented them from either changing their white coats or washing them prior to the time the cultures were taken.
Because our study included both employees of the hospital and trainees, a number of protection measures were required. No information of any sort was collected about those who agreed or refused to participate in the study. In addition, the request to participate in the study did not come from the person's direct supervisor.
Statistical Methods
All data were collected and entered using Excel for Mac 2004 version 11.5.4. All analyses were performed using SAS Enterprise Guide 4.1 (SAS Institute, Inc., Cary, NC).
The Wilcoxon rank‐sum test and chi square analysis were used to seek differences in colony count and percentage of cultures with MRSA, respectively, in cultures obtained: (1) from the sleeve cuffs and pockets of the white coats compared with those from the sleeve cuffs and pockets of the uniforms, (2) from the sleeve cuffs of the white coats compared with those from the sleeve cuffs of the short‐sleeved uniforms, (3) from the mid‐biceps area of the sleeve sof the white coats compared with those from the sleeve cuffs of the uniforms, and (4) from the skin of the wrists of those wearing white coats compared with those wearing the uniforms. Bonferroni's correction for multiple comparisons was applied, with a P < 0.125 indicating significance.
Friedman's test and repeated‐measures logistic regression were used to seek differences in colony count or of the percentage of cultures with MRSA, respectively, on white coats or uniforms by site of culture on both garments. A P < 0.05 indicated significance for these analyses.
The Kruskal‐Wallis and chi‐square tests were utilized to test the effect of white coat wash frequency on colony count and MRSA contamination, respectively.
All data are presented as medians with 95% confidence intervals or proportions.
Results
Participant Flow
Fifty physicians were studied in each group, all of whom completed the survey. In general, more than 95% of potential participants approached agreed to participate in the study (Figure 1).
Recruitment
The first and last physicians were studied in August 2008 and November 2009, respectively. The trial ended when the specified number of participants (50 in each group) had been enrolled.
Data on Entry
No data were recorded from the participants at the time of randomization in compliance with institutional review board regulations pertaining to employment issues that could arise when studying members of the workforce.
Outcomes
No significant differences were found between the colony counts cultured from white coats (104 [80127]) versus newly laundered uniforms (142 [83213]), P = 0.61. No significant differences were found between the colony counts cultured from the sleeve cuffs of the white coats (58.5 [4866]) versus the uniforms (37 [2768]), P = 0.07, or between the colony counts cultured from the pockets of the white coats (45.5 [3254]) versus the uniforms (74.5 [4897], P = 0.040. Bonferroni corrections were used for multiple comparisons such that a P < 0.0125 was considered significant. Cultures from at least 1 site of 8 of 50 physicians (16%) wearing white coats and 10 of 50 physicians (20%) wearing short‐sleeved uniforms were positive for MRSA (P = .60).
Colony counts were greater in cultures obtained from the sleeve cuffs of the white coats compared with the pockets or mid‐biceps area (Table 1). For the uniforms, no difference in colony count in cultures from the pockets versus sleeve cuffs was observed. No difference was found when comparing the number of subjects with MRSA contamination of the 3 sites of the white coats or the 2 sites of the uniforms (Table 1).
| White Coat (n = 50) | P | Uniforms (n = 50) | P | |
|---|---|---|---|---|
| Colony count, median (95% CI) | ||||
| Sleeve cuff | 58.5 (4866) | < 0.0001 | 37.0 (2768) | 0.25 |
| 45.5 (3254) | 74.5 (4897) | |||
| Mid‐biceps area of sleeve | 25.5 (2029) | |||
| MRSA contamination, n (%) | ||||
| Sleeve cuff | 4 (8%) | 0.71 | 6 (12%) | 0.18 |
| 5 (10%) | 9 (18%) | |||
| Mid‐biceps area of sleeve | 3 (6%) |
No difference was observed with respect to colony count or the percentage of subjects positive for MRSA in cultures obtained from the mid‐biceps area of the white coats versus those from the cuffs of the short‐sleeved uniforms (Table 2).
| White Coat Mid‐Biceps (n = 50) | Uniform Sleeve Cuff (n = 50) | P | |
|---|---|---|---|
| Colony count, median (95% CI) | 25.5 (2029) | 37.0 (2768) | 0.07 |
| MRSA contamination, n (%) | 3 (6%) | 6 (12%) | 0.49 |
No difference was observed with respect to colony count or the percentage of subjects positive for MRSA in cultures obtained from the volar surface of the wrists of subjects wearing either of the 2 garments (Table 3).
| White Coat (n = 50) | Uniform (n = 50) | P | |
|---|---|---|---|
| Colony count, median (95% CI) | 23.5 (1740) | 40.5 (2859) | 0.09 |
| MRSA Contamination, n (% of subjects) | 3 (6%) | 5 (10%) | 0.72 |
The frequency with which physicians randomized to wearing their white coats admitted to washing or changing their coats varied markedly (Table 4). No significant differences were found with respect to total colony count (P = 0.81), colony count by site (data not shown), or percentage of physicians contaminated with MRSA (P = 0.22) as a function of washing or changing frequency (Table 4).
| White Coat Washing Frequency | Number of Subjects (%) | Total Colony Count (All Sites), Median (95% CI) | Number with MRSA Contamination, n (%) |
|---|---|---|---|
| Weekly | 15 (30%) | 124 (107229) | 1 (7%) |
| Every 2 weeks | 21 (42%) | 156 (90237) | 6 (29%) |
| Every 4 weeks | 8 (16%) | 89 (41206) | 0 (0%) |
| Every 8 weeks | 5 (10%) | 140 (58291) | 2 (40%) |
| Rarely | 1 (2%) | 150 | 0 (0%) |
Sequential culturing showed that the newly laundered uniforms were nearly sterile prior to putting them on. By 3 hours of wear, however, nearly 50% of the colonies counted at 8 hours were already present (Figure 2).
Harms
No adverse events occurred during the course of the study in either group.
Discussion
The important findings of this study are that, contrary to our hypotheses, at the end of an 8‐hour workday, no significant differences were found between the extent of bacterial or MRSA contamination of infrequently washed white coats compared with those of newly laundered uniforms, no difference was observed with respect to the extent of bacterial or MRSA contamination of the wrists of physicians wearing either of the 2 garments, and no association was apparent between the extent of bacterial or MRSA contamination and the frequency with which white coats were washed or changed. In addition, we also found that bacterial contamination of newly laundered uniforms occurred within hours of putting them on.
Interpretation
Numerous studies have demonstrated that white coats and uniforms worn by health care providers are frequently contaminated with bacteria, including both methicillin‐sensitive and ‐resistant Staphylococcus aureus and other pathogens.413 This contamination may come from nasal or perineal carriage of the health care provider, from the environment, and/or from patients who are colonized or infected.11, 15 Although many have suggested that patients can become contaminated from contact with health care providers' clothing and studies employing pulsed‐field gel electrophoresis and other techniques have suggested that cross‐infection can occur,10, 1618 others have not confirmed this contention,19, 20 and Lessing and colleagues16 concluded that transmission from staff to patients was a rare phenomenon. The systematic review reported to the Department of Health in England,3 the British Medical Association guidelines regarding dress codes for doctors,21 and the department's report on which the new clothing guidelines were based1 concluded there was no conclusive evidence indicating that work clothes posed a risk of spreading infection to patients. Despite this, the Working Group and the British Medical Association recommended that white coats should not be worn when providing patient care and that shirts and blouses should be short‐sleeved.1 Recent evidence‐based reviews concluded that there was insufficient evidence to justify this policy,3, 22 and our data indicate that the policy will not decrease bacterial or MRSA contamination of physicians' work clothes or skin.
The recommendation that long‐sleeved clothing should be avoided comes from studies indicating that cuffs of these garments are more heavily contaminated than other areas5, 8 and are more likely to come in contact with patients.1 Wong and colleagues5 reported that cuffs and lower front pockets had greater contamination than did the backs of white coats, but no difference was seen in colony count from cuffs compared with pockets. Loh and colleagues8 found greater bacterial contamination on the cuffs than on the backs of white coats, but their conclusion came from comparing the percentage of subjects with selected colony counts (ie, between 100 and 199 only), and the analysis did not adjust for repeated sampling of each participant. Apparently, colony counts from the cuffs were not different than those from the pockets. Callaghan7 found that contamination of nursing uniforms was equal at all sites. We found that sleeve cuffs of white coats had slightly but significantly more contamination with bacteria than either the pocket or the midsleeve areas, but interestingly, we found no difference in colony count from cultures taken from the skin at the wrists of the subjects wearing either garment. We found no difference in the extent of bacterial contamination by site in the subjects wearing short‐sleeved uniforms or in the percentage of subjects contaminated with MRSA by site of culture of either garment.
Contrary to our hypothesis, we found no association between the frequency with which white coats were changed or washed and the extent of bacterial contamination, despite the physicians having admitted to washing or changing their white coats infrequently (Table 4). Similar findings were reported by Loh and colleagues8 and by Treakle and colleagues.12
Our finding that contamination of clean uniforms happens rapidly is consistent with published data. Speers and colleagues4 found increasing contamination of nurses' aprons and dresses comparing samples obtained early in the day with those taken several hours later. Boyce and colleagues6 found that 65% of nursing uniforms were contaminated with MRSA after performing morning patient‐care activities on patients with MRSA wound or urine infections. Perry and colleagues9 found that 39% of uniforms that were laundered at home were contaminated with MRSA, vancomycin‐resistant enterococci, or Clostridium difficile at the beginning of the work shift, increasing to 54% by the end of a 24‐hour shift, and Babb and colleagues20 found that nearly 100% of nurses' gowns were contaminated within the first day of use (33% with Staphylococcus aureus). Dancer22 recently suggested that if staff were afforded clean coats every day, it is possible that concerns over potential contamination would be less of an issue. Our data suggest, however, that work clothes would have to be changed every few hours if the intent were to reduce bacterial contamination.
Limitations
Our study has a number of potential limitations. The RODAC imprint method only sampled a small area of both the white coats and the uniforms, and accordingly, the culture data might not accurately reflect the total degree of contamination. However, we cultured 3 areas on the white coats and 2 on the uniforms, including areas thought to be more heavily contaminated (sleeve cuffs of white coats). Although this area had greater colony counts, the variation in bacterial and MRSA contamination from all areas was small.
We did not culture the anterior nares to determine if the participants were colonized with MRSA. Normal health care workers have varying degrees of nasal colonization with MRSA, and this could account for some of the 16%‐20% MRSA contamination rate we observed. However, previous studies have shown that nasal colonization of healthcare workers only minimally contributes to uniform contamination.4
Although achieving good hand hygiene compliance has been a major focus at our hospital, we did not track the hand hygiene compliance of the physicians in either group. Accordingly, not finding reduced bacterial contamination in those wearing short‐sleeved uniforms could be explained if physicians in this group had systematically worse hand‐washing compliance than those randomized to wearing their own white coats. Our use of concurrent controls limits this possibility, as does that during the time of this study, hand hygiene compliance (assessed by monthly surreptitious observation) was approximately 90% throughout the hospital.
Despite the infrequent wash frequencies reported, the physicians' responses to the survey could have overestimated the true wash frequency as a result of the Hawthorne effect. The colony count and MRSA contamination rates observed, however, suggest that even if this occurred, it would not have altered our conclusion that bacterial contamination was not associated with wash frequency.
Generalizability
Because data were collected from a single, university‐affiliated public teaching hospital from hospitalists and residents working on the internal medicine service, the results might not be generalizable to other types of institutions, other personnel, or other services.
In conclusion, bacterial contamination of work clothes occurs within the first few hours after donning them. By the end of an 8‐hour work day, we found no data supporting the contention that long‐sleeved white coats were more heavily contaminated than were short‐sleeved uniforms. Our data do not support discarding white coats for uniforms that are changed on a daily basis or for requiring health care workers to avoid long‐sleeved garments.
Acknowledgements
The authors thank Henry Fonseca and his team for providing our physician uniforms. They also thank the Denver Health Department of Medicine Small Grants program for supporting this study.
- Department of Health. Uniforms and workwear: an evidence base for developing local policy. National Health Service, September 17, 2007. Available at: http://www.dh.gov.uk/en/Publicationsandstatistics/Publications/Publicationspolicyandguidance/DH_078433. Accessed January 29,2010.
- Scottish Government Health Directorates. NHS Scotland Dress Code. Available at: http://www.sehd.scot.nhs.uk/mels/CEL2008_53.pdf. Accessed February 10,2010.
- ,,,.Uniform: an evidence review of the microbiological significance of uniforms and uniform policy in the prevention and control of healthcare‐associated infections. Report to the Department of Health (England).J Hosp Infect.2007;66:301–307.
- ,,,.Contamination of nurses' uniforms with Staphylococcus aureus.Lancet.1969;2:233–235.
- ,,.Microbial flora on doctors' white coats.Brit Med J.1991;303:1602–1604.
- ,,,.Environmental contamination due to methicillin‐resistant Staphylococcus aureus: possible infection control implications.Infect Control Hosp Epidemiol.1997;18:622–627.
- ,Bacterial contamination of nurses' uniforms: a study.Nursing Stand.1998;13:37–42.
- ,,.Bacterial flora on the white coats of medical students.J Hosp Infection.2000;45:65–68.
- ,,.Bacterial contamination of uniforms.J Hosp Infect.2001;48:238–241.
- ,,, et al.Significance of methicillin‐resistant Staphylococcus aureus (MRSA) survey in a university teaching hospital.J Infec Chemother.2003;9:172–177.
- ,,, et al.Detection of methicillin‐resistant Staphylococcus aureus and vancomycin‐resistant enterococci on the gowns and gloves of healthcare workers.Infect Control Hosp Epidemiol2008;29 (7):583–9.
- ,,,,,.Bacterial contamination of health care workers' white coats.Am J Infect Control.2009;37:101–105.
- ,,,,,.Meticillin‐resistant Staphylococcus aureus contamination of healthcare workers' uniforms in long‐term care facilities.J Hosp Infect.2009;71:170–175.
- ,,,,.Comparison of the Rodac imprint method to selective enrichment broth for recovery of vancomycin‐resistant enterococci and drug‐resistant Enterobacteriaceae from environmental surfaces.J Clin Microbiol.2000;38:4646–4648.
- ,,.Effect of clothing on dispersal of Staphylococcus aureus by males and females.Lancet.1974;2:1131–1133.
- ,,.When should healthcare workers be screened for methicillin‐resistant Staphylococcus aureus?J Hosp Infect.1996;34:205–210.
- ,,.Methicillin‐resistant Staphylococcus aureus transmission: the possible importance of unrecognized health care worker carriage.Am J Infect Control.2008;36:93–97.
- ,,, et al.Methicillin‐resistant Staphylococcus aureus carriage, infection and transmission in dialysis patients, healthcare workers and their family members.Nephrol Dial Transplant.2008;23:1659–1665.
- ,,.Are active microbiological surveillance and subsequent isolation needed to prevent the spread of methicillin‐resistant Staphylococcus aureus.Clin Infect Dis.2005;40:405–409.
- ,,.Contamination of protective clothing and nurses' uniforms in an isolation ward.J Hosp Infect.1983;4:149–157.
- British Medical Association. Uniform and dress code for doctors. December 6, 2007. Available at: http://www.bma.org.uk/employmentandcontracts/working_arrangements/CCSCdresscode051207.jsp. Accessed February 9,2010.
- .Pants, policies and paranoia.J Hosp Infect.2010;74:10–15.
Copyright © 2011 Society of Hospital Medicine
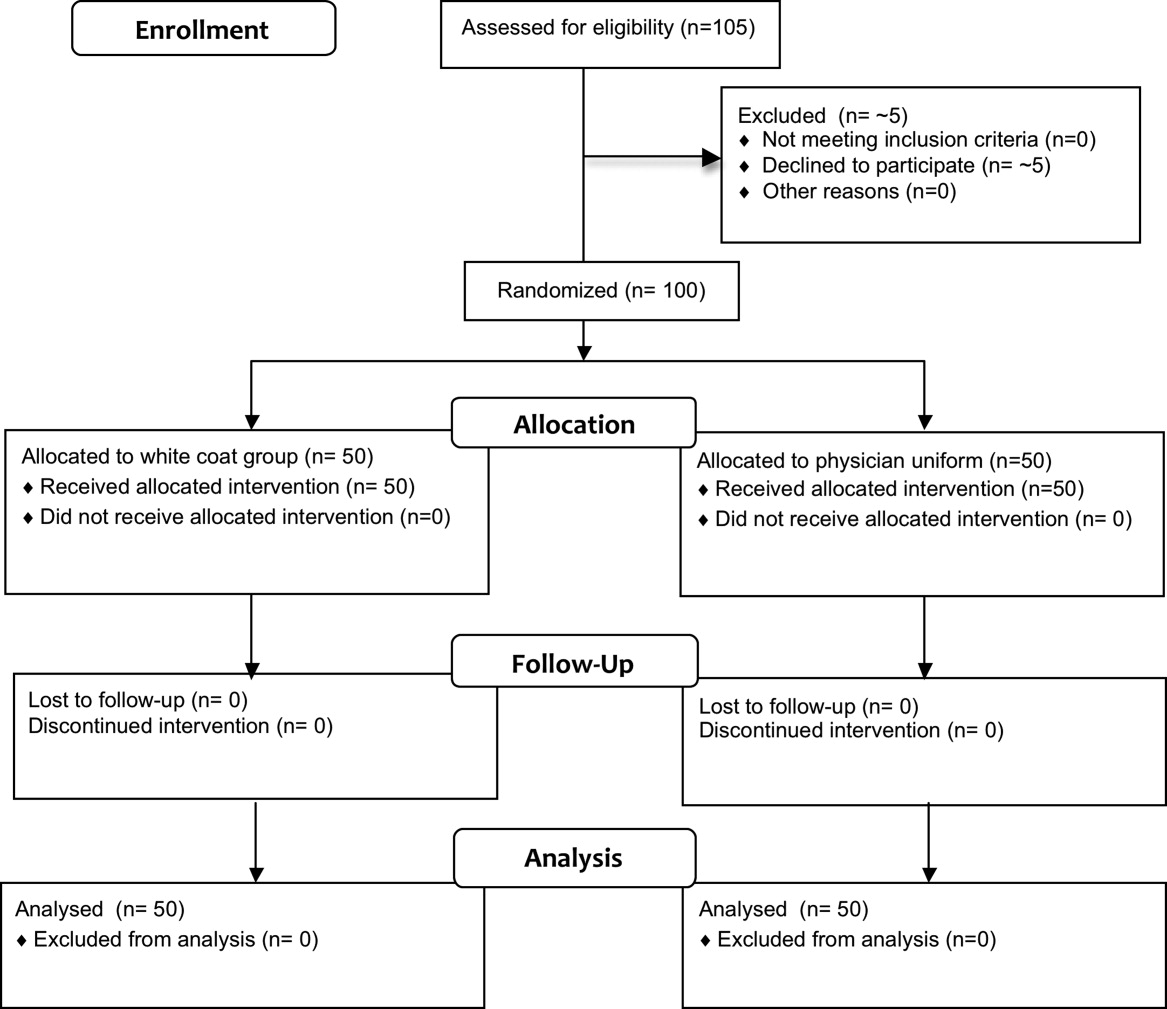
Intimate Partner Violence
The prevalence of intimate partner violence (IPV; defined as mental and/or physical violence directed from 1 person in an intimate relationship to the other) varies widely, depending on the population sampled and method of data collection. In the United States, IPV against women, occurring within the year prior to contact with a healthcare professional, ranges from 2% to 15% in surveys done by telephone, in primary care clinics, or in face‐to‐face home interviews19 and from 10% to 30% in surveys of patients visiting urgent care or emergency departments.1012 The prevalence of IPV occurring at any time during the life of the patient ranges from 18% in the aforementioned settings to as high as 88% in women applying for welfare.1, 2, 4, 5, 10, 1214
Although reports indicate that victims of IPV are more likely to be hospitalized,1517 the only study assessing the prevalence of IPV in hospitalized patients included women on medical, surgical, and obstetrical services and reported 1‐year and lifetime prevalences of only 5% and 23%, respectively.18
We hypothesized that the prevalence of IPV in hospitalized patients would be at least as high as that reported from emergency departments and sought to measure the 1‐year and lifetime prevalences of IPV in women admitted to a general internal medicine service. In addition, because studies done in various outpatient settings have reported that victims of IPV have a variety of somatic complaints and an increased prevalence of chronic and functional illnesses,1923 we also sought to determine whether women with a history of IPV and women without a history of IPV had different numbers or types of positive responses to questions asked on the review of systems.
PATIENTS AND METHODS
This study was approved by the Colorado Multiple Institution Review Board, and informed consent was obtained from all participants.
Women between the ages of 18 and 60 who were admitted to the internal medicine floor service of Denver Health Medical Center (a university‐affiliated public safety‐net hospital) between January 1 and February 28, 2004 and between October 1 and October 30, 2004 were approached to participate. These dates were selected on the basis of the availability of our interviewers. Patients older than 60 were excluded to avoid overlap between IPV and the problem of elder abuse. Women were excluded if they were unable to give informed consent, were pregnant, were incarcerated, were on contact precautions, or spoke a language other than English or Spanish. Although IPV is common in pregnant women and may occur in women who are incarcerated, these are considered vulnerable populations with respect to obtaining approval from internal review boards.
The questionnaire consisted of 23 review‐of‐systems questions,24 4 questions adapted from a previously validated screen for IPV11 (Table 1), and 1 question about attempts to seek help (Table 1). Women were considered to have experienced IPV if they gave positive responses to any of the 4 questions targeting IPV. According to patient preference, the combined questionnaire was either read and filled out by each subject independently or was read to her by a female interviewer who then recorded the subject's verbal responses. All interviewers were women with a shared common concern about, and interest in, IPV. Although none had advanced training in psychology, social work, or other formal discipline that involved interviewing skills, all interviews were scripted so that interactions with subjects and completion of the questionnaires would be uniform. Responses indicating sometimes were considered to be positive. Responses that were not answered, left blank, or marked as not applicable were considered to be negative.
| 1. Have you ever been hit, kicked, punched, or otherwise hurt by someone? If so, by whom? Friend, boyfriend, girlfriend, husband, family member, somebody you do not know, other |
| 2. Within the last year, have you been hit, kicked, or otherwise hurt by someone? If so, by whom? Friend, boyfriend, girlfriend, husband, family member, somebody you do not know, other |
| 3. Do you feel safe in your current relationship? |
| 4. Is there a partner from a previous relationship who is making you feel unsafe now? |
| 5. If you answered yes to any of the above, have you ever asked for help from police, shelter, counselor, physician? If so, how long ago? |
Each patient's medical record was reviewed to determine her age, race, number of previous hospital admissions, visits to the emergency department and walk‐in clinic, visits to primary care and subspecialty physicians, and whether the patient had been screened for IPV as recorded on the admission history and physical template. Admission diagnosis was obtained from the history and physical template, and the discharge diagnosis was obtained from the discharge paperwork. Functional diagnoses were considered to be symptoms (eg, shortness of breath) or problems (eg, constipation) that could not clearly be linked to a specific disease process. All participants were offered a card containing a list of resources for victims of IPV.
Data were analyzed with SAS 8.1 (SAS Institute, Cary, NC) and SPSS 11.5 (SPSS, Chicago, IL). The Student t test was used to compare continuous variables. Data are reported as means standard deviation. Chi‐square analysis was used to test associations between race, primary language, level of education, insurance status, admitting diagnosis, discharge diagnosis, number of previous hospital admissions, visit type, and the presence of IPV. For these, P < 0.05 was considered to be significant. The association of positive review‐of‐systems responses with the presence of IPV was also tested by chi‐square analysis, but P < 0.002 was considered to be significant on the basis of a Bonferroni adjustment for multiple comparisons. A receiver operating characteristic curve was used to assess the relationship between the number of positive responses to the questions included in the review of systems and a history of IPV. The odds ratio and confidence intervals were calculated to test the association between the number of positive responses to the review‐of‐systems questions and a lifetime history of IPV.
RESULTS
Throughout the dates of the study, 245 women were admitted to the internal medicine service, and 106 were excluded (Figure 1). Of the 139 eligible women, 78 were available to the interviewers and asked to participate, and 72 (92%) agreed. IPV occurring within the year prior to the interview or at any point in the patient's lifetime was reported by 16 (22%) and 44 (61%) subjects, respectively. No significant differences were seen in women who did or did not experience IPV at anytime in their life with respect to age, race, insurance status, education, number of scheduled outpatient, urgent, or emergent visits, or admission or discharge diagnosis even when the diagnoses were grouped into a functional category (although at best our study was powered to detect only >35% differences in prevalences; Tables 2 and 3). Of women reporting a lifetime history of IPV, 26 of 44 (59%) had previously sought help, and 9 of those 26 (35%) said that they sought help from a physician.

| IPV History | No IPV History | |
|---|---|---|
| ||
| Number (%) | 44 (61) | 28 (39) |
| Age (mean standard deviation) | 44 10 | 45 12 |
| Race [n, (%)] | ||
| Caucasian | 18 (41) | 6 (21) |
| Hispanic | 13 (30) | 15 (54) |
| African American | 12 (27) | 6 (21) |
| Other | 1 (2) | 1 (4) |
| Insurance status [n (%)] | ||
| Insured | 12 (27) | 5 (18) |
| Uninsured | 32 (73) | 23 (82) |
| Education [n (%)] | ||
| Grade school | 4 (9) | 3 (11) |
| Some high school | 13 (30) | 5 (18) |
| High school diploma | 15 (34) | 9 (32) |
| Some college | 9 (20) | 7 (25) |
| College degree | 2 (5) | 2 (7) |
| Postgraduate | 1 (2) | 2 (7) |
| Previous visit type (median, IQR) | ||
| Scheduled outpatient (includes primary care and subspecialty) | 2 (8) | 1.5 (7) |
| Emergency department and walk‐in clinic | 2 (3.5) | 1 (3) |
| Previous hospital admissions [n (%)] | ||
| 0 | 24 (55) | 16 (57) |
| 1 | 16 (36) | 4 (14) |
| 2 | 0 (0) | 4 (14) |
| 3 | 2 (5) | 2 (7) |
| >3 | 2 (5) | 2 (7) |
| Admission or Discharge Diagnosis | Admission | Discharge | ||
|---|---|---|---|---|
| IPV (n = 44) | No IPV (n = 28) | IPV (n = 44) | No IPV (n = 28) | |
| ||||
| Cardiovascular | ||||
| Chest pain (%)* | 8 (18) | 5 (18) | 6 (14) | 4 (14) |
| Cardiomyopathy | 0 | 0 | 1 | 0 |
| Cerebrovascular accident | 1 | 0 | 1 | 0 |
| Deep venous thrombosis | 0 | 0 | 1 | 0 |
| Hypertensive emergency | 0 | 0 | 1 | 0 |
| Palpitations* | 0 | 1 | 0 | 1 |
| Valvular disease | 0 | 0 | 1 | 0 |
| Venous stasis | 0 | 1 | 0 | 1 |
| Total (%) | 9 (20) | 7 (25) | 11 (25) | 6 (21) |
| Gastrointestinal | ||||
| Abdominal pain (%)* | 7 (16) | 4 (14) | 2 | 1 |
| Ascites | 0 | 1 | 0 | 0 |
| Constipation* | 0 | 0 | 1 | 0 |
| End‐stage liver disease | 1 | 1 | 1 | 2 |
| Esophagitis | 0 | 0 | 1 | 0 |
| Hepatitis | 1 | 0 | 1 | 0 |
| Nausea/vomiting* | 2 | 0 | 1 | 0 |
| Pancreatitis | 0 | 1 | 3 | 2 |
| Peptic ulcer disease | 1 | 0 | 1 | 0 |
| Upper gastrointestinal bleeding | 2 | 0 | 1 | 0 |
| Total (%) | 14 (32) | 7 (25) | 12 (27) | 5 (18) |
| Hematology/oncology | ||||
| Abdominal mass | 0 | 0 | 0 | 1 |
| Anemia | 1 | 0 | 1 | 0 |
| Breast cancer | 0 | 1 | 0 | 1 |
| Cervical cancer | 1 | 0 | 1 | 0 |
| Colon cancer | 0 | 1 | 0 | 1 |
| Sickle cell anemia | 1 | 0 | 1 | 0 |
| Thrombocytosis | 1 | 0 | 1 | 0 |
| Total (%) | 4 (9) | 2 (7) | 4 (9) | 3 (11) |
| Infectious disease | ||||
| Bacteremia/sepsis | 3 | 0 | 3 | 0 |
| Cellulitis | 1 | 0 | 1 | 1 |
| Cholangitis | 0 | 0 | 1 | 0 |
| Community‐acquired pneumonia | 2 | 2 | 2 | 1 |
| Endocarditis | 1 | 0 | 1 | 0 |
| Fever | 0 | 1 | 0 | 1 |
| Pelvic inflammatory disease | 0 | 0 | 0 | 1 |
| Urinary tract infection | 1 | 0 | 1 | 0 |
| Total (%) | 8 (18) | 3 (11) | 9 (20) | 4 (14) |
| Pulmonary | ||||
| Acute exacerbation of COPD | 0 | 0 | 1 | 0 |
| Asthma exacerbation | 1 | 1 | 1 | 2 |
| Pleuritic chest pain* | 0 | 0 | 1 | 0 |
| Pulmonary embolism | 0 | 0 | 1 | 0 |
| Shortness of breath* | 4 | 0 | 1 | 0 |
| Total (%) | 5 (11) | 1 (4) | 5 (11) | 2 (7) |
| Renal/genitourinary | ||||
| Acute renal failure | 0 | 1 | 0 | 1 |
| End‐stage renal disease | 1 | 2 | 1 | 2 |
| Nephrotic syndrome | 0 | 1 | 0 | 2 |
| Vaginal bleeding | 1 | 0 | 1 | 0 |
| Total (%) | 2 (5) | 4 (14) | 2 (5) | 5 (18) |
| Other | ||||
| Diabetic ketoacidosis | 0 | 1 | 0 | 1 |
| Extremity pain* | 0 | 1 | 0 | 0 |
| Mediastinal thickening | 0 | 0 | 0 | 1 |
| Hyponatremia | 0 | 1 | 0 | 1 |
| Lower extremity swelling | 2 | 1 | 0 | 0 |
| Somatization* | 0 | 0 | 1 | 0 |
| Total (%) | 2 (5) | 4 (14) | 1 (2) | 3 (11) |
| Total functional diagnoses (%) | 21 (48) | 11 (39) | 12 (27) | 6 (21) |
Women with a 1‐year history of IPV and women without a 1‐year history of IPV had 11.4 4.7 and 7.7 5.4 positive responses to the review of systems (P < 0.01), respectively. Women with a lifetime history of IPV and women without a lifetime history of IPV had 10.9 4.4 and 7.7 5.4 positive responses (P < 0.01), respectively. The receiver operating characteristic curve of the number of positive responses versus a lifetime history of IPV is presented in Figure 2. Subjects with 10 or more positive responses were 4.8 times more likely to report a lifetime history of IPV than subjects with 9 or fewer positive responses (confidence interval = 1.614.2, P = 0.003). The c‐statistic indicating the ability of the review of systems to properly classify cases when there were 10 or more positive responses was 0.692.
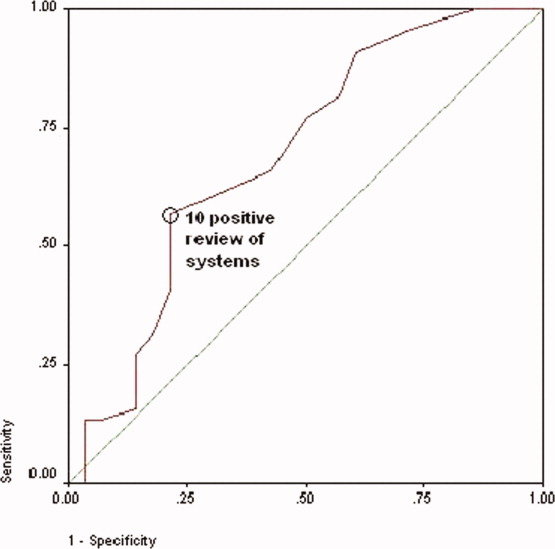
No differences were observed in the responses to the individual review of systems questions in women who did or did not have a lifetime history of IPV, with the exception that those with a positive history more commonly complained of difficulty sleeping and numbness and tingling in their hands or feet (although at best our study was sufficiently powered to detect only >20% differences in prevalences; Table 4). Although the sensitivity of having problems sleeping or experiencing numbness or tingling in patients with IPV was high, the specificity and positive and negative predictive values were not (Table 5).
| Review‐of‐Systems Questions | IPV History (n = 44) | No IPV History (n = 28) | P Value |
|---|---|---|---|
| |||
| 1. Shortness of breath | 25 (57) | 10 (36) | 0.081 |
| 2. Chest pain/pressure | 19 (43) | 9 (32) | 0.349 |
| 3. Abdominal pain | 17 (39) | 10 (36) | 0.803 |
| 4. Headaches | 24 (55) | 13 (46) | 0.502 |
| 5. Rashes | 15 (34) | 9 (32) | 0.864 |
| 6. Bruising | 32 (73) | 12 (43) | 0.011 |
| 7. Joint pain/stiffness | 27 (61) | 11 (39) | 0.067 |
| 8. Muscle pain/spasms | 22 (50) | 11 (39) | 0.374 |
| 9. Pain with intercourse | 8 (19) | 4 (14) | 0.753 |
| 10. Pelvic pain/cramps | 13 (30) | 5 (18) | 0.264 |
| 11. Nausea/vomiting | 19 (43) | 11 (39) | 0.744 |
| 12. Nervous/anxious | 28 (64) | 14 (50) | 0.253 |
| 13. Sad/crying | 21 (48) | 12 (43) | 0.686 |
| 14. Weight gain/loss | 26 (59) | 17 (61) | 0.891 |
| 15. Trouble sleeping | 37 (84) | 12 (43) | 0.000* |
| 16. Fever/chills | 19 (43) | 6 (21) | 0.059 |
| 17. Frequent/painful urination | 11 (25) | 6 (21) | 0.728 |
| 18. Pounding/emrregular heart beat | 14 (32) | 7 (25) | 0.535 |
| 19. Dizzy/passing out | 13 (30) | 7 (25) | 0.675 |
| 20. Memory problem | 19 (43) | 7 (25) | 0.117 |
| 21. Diarrhea/constipation | 27 (61) | 10 (36) | 0.034 |
| 22. Numbness/tingling | 35 (80) | 9 (32) | <0.0001* |
| 23. Pain chewing/swallowing | 8 (18) | 5 (18) | 0.972 |
| Trouble Sleeping | Numbness/Tingling | |
|---|---|---|
| Sensitivity (%) | 84 | 74 |
| Specificity (%) | 57 | 68 |
| Positive predictive value (%) | 76 | 78 |
| Negative predictive value (%) | 70 | 68 |
The admission history forms filled out by first‐year admitting residents showed that only 18 (25%) of the women were screened for IPV, even though the history and physical examination template used at Denver Health Medical Center includes a prompt in the social history section pertaining to a history of violence as a reminder.
DISCUSSION
The important findings of this study were that women admitted to the internal medicine service of a university‐affiliated public safety‐net hospital had a high prevalence of IPV (22% and 61% 1‐year and lifetime prevalences, respectively), that most women with a history of IPV had previously sought help for the problem, many from physicians, that women were more likely to have a history of IPV if they had >10 positive responses to questions asked in a routine review of systems (particularly problems sleeping and experiencing numbness or tingling in their extremities), and that routine screening for IPV was uncommon at the time of admission.
These conclusions should be interpreted with respect to a number of limitations in our study. First, although our study was designed to be a consecutive series, the interviewers did not have sufficient time to meet with and interview every woman admitted before they were discharged. This occurred in part because the interviewers were available only for a portion of each day, some patients were discharged within 24 hours of admission, and many were out of their rooms for ancillary testing. Within the interviewers' time constraints, however, all hospitalized women meeting entry criteria who were available were approached. Our data could, however, overrepresent the prevalence of IPV if hospitalized women with a history of IPV had longer hospital stays than those who did not or if those experiencing IPV were out of their rooms less frequently (eg, for diagnostic tests). On the other hand, our data could underrepresent the true prevalence of IPV if patients with a history of IPV had shorter hospital stays or if they received more ancillary testing that caused them to be out of their rooms more frequently. Second, none of our interviewers had specific training in interviewing techniques. Accordingly, our data could have underestimated the true prevalence of IPV if interviewers with advanced training in probing sensitive topics had more success in eliciting positive responses. Third, the relationship between a history of IPV and multiple positive responses to the review of systems may be confounded if some of these patients also had a history of adverse childhood experiences or other experiences resulting in posttraumatic stress disorder as these patients also have an increased prevalence of chronic and functional disorders.2527 Finally, as our numbers were small, we were not powered to detect clinically important differences in demographics or specific positive answers on the review of systems.
To the best of our knowledge, the only study presenting IPV prevalence data in patients hospitalized for other than psychiatric problems was performed by McKenzie and colleagues18 in 1997. In their group of 130 patients (61 on internal medicine, 59 on surgery, 7 on obstetrics, and 3 on psychiatry), the 1‐year and lifetime prevalences of IPV were only 5% and 26%, respectively. McKenzie and colleagues used only 1 question to screen for IPV, but that single question incorporated 2 of the 4 questions used in our survey. Forty‐three of our 44 patients (98%) with a history of IPV were discovered on the basis of these 2 questions. The hospitals in which the 2 studies were done were similar, as were the ages and levels of education of the 2 populations studied and the percentage of eligible patients who agreed to participate. The patients in the 2 studies were different with respect to race, language mix, and the percentage who were insured, but neither study found differences in the prevalence of IPV as a function of race or insurance (although others have found an association of IPV with being uninsured1, 3, 4, 12, 23). Our study was conducted in women admitted exclusively to an internal medicine service, whereas nearly half of the patients studied by McKenzie and colleagues were admitted to surgical, gynecologic, or psychiatric services. Although McKenzie and colleagues found no difference in the prevalence of IPV as a function of admitting service, others have suggested that the prevalence of IPV is higher in patients admitted for trauma or psychiatric problems.1517, 28 The percentage of patients who self‐administered the questionnaires was 57% in our study and 77% in the study by McKenzie and colleagues. Neither study, however, found a difference in the percentage of IPV in patients who self‐administered the survey versus those who were interviewed. Women may have become more comfortable discussing this issue in the 10‐year interval between these 2 studies, or the prevalence of IPV may have increased. The only other study of IPV in hospitalized patients of which we are aware reported a 90% 1‐year prevalence in suicidal women admitted to a psychiatric service.28
Several studies have reported that victims of IPV have multiple somatic complaints and an increased prevalence of chronic and functional illnesses.1923 We confirmed that women experiencing IPV have more positive responses to questions posed in a review of systems, but the low specificity and positive and negative predictive values of the responses make this association of little clinical utility.
For only 18 of the 72 patients (25%) in our study was there evidence that they were screened for a history of IPV by the admitting resident. If more women were screened without a response being recorded, or if women were screened only for a current history of violence, our data may not accurately reflect the true rate at which screening occurred; however, the rate of screening that we observed is consistent with a number of other studies.12, 22, 2931 Fourteen of 18 patients who were screened for IPV by the resident gave negative responses. Ten of these, however, gave positive responses to our interviewers. Accordingly, the sensitivity, specificity, and positive and negative predictive values of the information recorded by the admitting resident were 40%, 100%, 100%, and 57%, respectively (assuming that the responses given to the IPV survey represent the gold standard), and this confirms that routine screening underestimates the prevalence of this problem. Accordingly, we identified 2 problems pertaining to screening for IPV: (1) it is not routinely done at the time of hospital admission, and (2) responses reported during routine screening are frequently incorrect. A number of barriers to routine screening have been previously identified, as have interventions designed to increase screening.32 Providing specific screening questions increases the identification of victims of IPV, but simply educating healthcare providers does not.32 Our history and physical templates have a prompt for violence victim to facilitate the screening, but as a result of this study, we are changing our prompting question and indicating what should be done if the response is positive.
The US Preventive Services Task Force and the Canadian Task Force on Preventive Health Care both concluded that there was insufficient evidence to recommend for or against routine screening for IPV.3335 Their rationale was that trials assessing the effectiveness of screening have not been published, that studies designed to assess the effectiveness of any resulting intervention are few in number, focused on pregnant women, and limited by problems in study design, that no studies have determined the accuracy of the screening tools, and that none have addressed the potential harm of screening.3335 The US Preventive Services Task Force did recommend screening if providers were concerned about IPV.34 Our data would suggest that there is little in the admission history that distinguishes women who might be victims of IPV from those who might not. Guidelines published by the American Medical Association, the American Academy of Family Physicians, and the American College of Obstetricians and Gynecologists promote routine screening of all patients.3638 Janssen and colleagues39 support the importance of screening on the basis that IPV is associated with numerous physical and mental health problems (eg, arthritis, migraines and other types of headaches, vaginal bleeding, ulcers, spastic colon, chronic pain, substance abuse, depression, and suicide ideation) and that establishing the link between these conditions and IPV could be important with respect to developing appropriate diagnostic and therapeutic approaches to patients' complaints. Screening also allows physicians to become more knowledgeable about their patients' lives, facilitating their ability to provide a supportive relationship that, in turn, increases women's likelihood of using an intervention method.39 We did not confirm an increased prevalence of any of the complaints noted by Janssen and colleagues in the women experiencing a history of IPV, but we did find an increased prevalence of insomnia and extremity numbness in women admitting to IPV as well as an overall increase in the number of positive responses to the review of systems. Screening identifies women who should receive information about reporting IPV, obtaining available assistance, planning for personal safety, and formal counseling as these have all been shown to reduce the severity of IPV and to improve the quality of life in rather large, randomized controlled trials.4043
As previously observed by others,13, 22, 29, 4446 the large majority of women that we approached welcomed screening for IPV. Over half of those with a history of IPV had previously sought help for the problem, over one‐third of these sought help from physicians, and most took the resource card that we offered, regardless of whether they did or did not have a history of IPV (this suggests either that our data may actually underestimate the true prevalence of IPV or that patients taking the information knew of others experiencing this problem). Accordingly, regardless of whether physicians believe that routine screening is warranted, patients see physicians and other healthcare workers as a resource for this problem.
We have confirmed that a history of IPV is very common in women admitted to an internal medicine service of a university‐affiliated public hospital and that female victims of IPV have more positive responses on the review of systems (particularly difficulty sleeping and extremity numbness or tingling) than those who have not. Although we initially hypothesized that finding numerous somatic complaints might serve as a marker for IPV, thereby identifying patients for whom more careful screening should occur, finding such a high prevalence of IPV argues that screening should be a routine part of the history for all women admitted to internal medicine inpatient services.
Acknowledgements
The authors thank the patients who agreed to participate in this study during their hospitalization. They also thank Cheri Maestas and Debbie Rodriquez for their support and help in interviewing patients.
- ,,.Prevalence and determinants of intimate partner abuse among public hospital primary care patients.J Gen Intern Med.2000;15:811–817.
- ,,,.Women's experiences with violence: a national study.Womens Health Issues.2007;17:3–12.
- ,,,.Multistate analysis of factors associated with intimate partner violence.Am J Prev Med.2002;22:156–164.
- ,,,.Frequency and correlates of intimate partner violence by type: physical, sexual, and psychological battering.Am J Public Health.2000;90:553–559.
- ,,,,.Prevalence of domestic violence among patients in three ambulatory care internal medicine clinics.J Gen Intern Med.1991;6:317–322.
- ,,,.Prevalence of partner violence against 7,443 African American, White and Hispanic women receiving care at urban public primary care clinics.Public Health Nurs.2005;22:98–107.
- ,,,,.Evaluating domestic partner abuse in a family practice clinic.Fam Med.1997;29:492–495.
- ,.Prevalence and predictors of physical partner abuse among Mexican American women.Am J Public Health.2001;91:441–445.
- ,,.Rates of intimate partner violence in the United States.Am J Public Health.1998;88:1702–1704.
- ,,,.Domestic violence against women incidence and prevalence in an emergency department population.JAMA.1995;273:1763–1767.
- ,,, et al.Accuracy of 3 brief screening questions for detecting partner violence in the emergency department.JAMA.1997;277:1357–1361.
- ,,.A prevalence survey of abuse and screening for abuse in urgent care patients.Obstet Gynecol.1998;91:511–514.
- Morbidity and Mortality Weekly Report.Use of medical care, police assistance and restraining orders by women reporting intimate partner violence—Massachusetts, 1996–1997.JAMA.2000;284:558.
- ,,.Interpersonal violence among women seeking welfare: unraveling lives.Am J Public Health.2006;96:1409–1415.
- ,.A 5‐year follow‐up study of 117 battered women.Am J Public Health.1991;81:1486–1488.
- ,,.Rates and relative risk of hospital admission among women in violent intimate partner relationships.Am J Public Health.2000;90:1416–1420.
- ,,,.Intimate partner violence against women: do victims cost health plans more?J Fam Pract.1999;48:439–443.
- ,,,.Prevalence of domestic violence in an inpatient female population.J Gen Intern Med.1998;13:277–279.
- ,,, et al.Intimate partner violence and physical health consequences.Arch Intern Med.2002;162:1157–1163.
- ,,,,.Physical health consequences of physical and psychological intimate partner violence.Arch Fam Med.2000;9:451–457.
- ,,, et al.Sexual and physical abuse in women with functional or organic gastrointestinal disorders.Ann Intern Med.1990;113:828–833.
- ,,.Prevalence of intimate partner violence and health implications for women using emergency departments and primary care clinics.Womens Health Issues.2004;14:19–29.
- ,,, et al.The “battering syndrome”: prevalence and clinical characteristics of domestic violence in primary care internal medicine practices.Ann Intern Med.1995;123:737–746.
- ,.DeGowin and DeGowin's Bedside Diagnostic Examination.5th ed.New York, NY:Macmillan Publishing;1987:18–29.
- ,,, et al.Relationship of childhood abuse and household dysfunction to many of the leading causes of death in adults. The Adverse Childhood Experiences (ACE) Study.Am J Prev Med.1998;14:245–258.
- ,,,,,.Posttraumatic stress disorder and health status among female and male medical patients.J Trauma Stress.2004;17:1–9.
- ,,,,.Posttraumatic stress disorder and physical comorbidity among female children and adolescents: results from service‐use data.Pediatrics.2005:116;e767–e776.
- ,,,,.Prevalence and severity of intimate partner violence and associations with family functioning and alcohol abuse in psychiatric inpatients with suicidal intent.J Clin Psychiatry.2006;67:23–29.
- ,,.Intimate partner violence screening and intervention: data from eleven Pennsylvania and California community hospital emergency departments.J Emerg Nurs.2001;27:141–149.
- ,.Missed opportunities: emergency department visits by police‐identified victims of intimate partner violence.Emerg Med.2006;47:190–199.
- ,,, et al.Intimate partner violence and patient screening across medical specialties.Acad Emerg Med.2005;12:712–722.
- ,,,,.Screening for intimate partner violence by health care providers: barriers and interventions.Am J Prev Med.2000;19:230–237.
- ,,,.Screening women and elderly adults for family and intimate partner violence: a review of the evidence for the U.S. Preventive Services Task Force.Ann Intern Med.2004;140:387–396.
- U.S. Preventive Services Task Force.Screening for family and intimate partner violence: recommendation statement.Ann Intern Med.2004;140:382–386.
- ,.Interventions for violence against women: scientific review.JAMA.2003;289:589–600.
- American Medical Association. Policy H‐515.965: family and intimate partner violence. Available at: http://www.ama‐assn.org. Accessed May2007.
- American Academy of Family Physicians. Family and intimate partner violence and abuse. Available at: www.aafp.org/x16506.xml. Accessed May2007.
- Domestic Violence.Washington, DC:American College of Obstetrics and Gynecology;1999. Educational Bulletin Number; No. 257.
- ,,.Assessment for intimate partner violence: where do we stand?J Am Board Fam Med.2006;19:413–415.
- ,,,,,.What happens when health care providers ask about intimate partner violence? A description of consequences from the perspectives of female survivors.JAMA.2003;58:76–81.
- ,,,,,.Assessing intimate partner violence in health care settings leads to women's receipt of interventions and improved health.Public Health Rep.2006;121:435–444.
- ,,.An evaluation of interventions to decrease intimate partner violence to pregnant women.Public Health Nurs.2000;17:443–451.
- ,.Reducing violence using community‐based advocacy for women with abusive partners.J Consult Clin Psychol.1999;67:43–53.
- ,,,,.Help‐seeking for intimate partner violence and forced sex in South Carolina.Am J Prev Med.2000;19:316–320.
- ,,, et al.Women's opinions about domestic violence screening and mandatory reporting.Am J Prev Med.2000;19:279–285.
- ,,,.The factors associated with disclosure of intimate partner abuse to clinicians.J Fam Pract.2001;50:338–344.
The prevalence of intimate partner violence (IPV; defined as mental and/or physical violence directed from 1 person in an intimate relationship to the other) varies widely, depending on the population sampled and method of data collection. In the United States, IPV against women, occurring within the year prior to contact with a healthcare professional, ranges from 2% to 15% in surveys done by telephone, in primary care clinics, or in face‐to‐face home interviews19 and from 10% to 30% in surveys of patients visiting urgent care or emergency departments.1012 The prevalence of IPV occurring at any time during the life of the patient ranges from 18% in the aforementioned settings to as high as 88% in women applying for welfare.1, 2, 4, 5, 10, 1214
Although reports indicate that victims of IPV are more likely to be hospitalized,1517 the only study assessing the prevalence of IPV in hospitalized patients included women on medical, surgical, and obstetrical services and reported 1‐year and lifetime prevalences of only 5% and 23%, respectively.18
We hypothesized that the prevalence of IPV in hospitalized patients would be at least as high as that reported from emergency departments and sought to measure the 1‐year and lifetime prevalences of IPV in women admitted to a general internal medicine service. In addition, because studies done in various outpatient settings have reported that victims of IPV have a variety of somatic complaints and an increased prevalence of chronic and functional illnesses,1923 we also sought to determine whether women with a history of IPV and women without a history of IPV had different numbers or types of positive responses to questions asked on the review of systems.
PATIENTS AND METHODS
This study was approved by the Colorado Multiple Institution Review Board, and informed consent was obtained from all participants.
Women between the ages of 18 and 60 who were admitted to the internal medicine floor service of Denver Health Medical Center (a university‐affiliated public safety‐net hospital) between January 1 and February 28, 2004 and between October 1 and October 30, 2004 were approached to participate. These dates were selected on the basis of the availability of our interviewers. Patients older than 60 were excluded to avoid overlap between IPV and the problem of elder abuse. Women were excluded if they were unable to give informed consent, were pregnant, were incarcerated, were on contact precautions, or spoke a language other than English or Spanish. Although IPV is common in pregnant women and may occur in women who are incarcerated, these are considered vulnerable populations with respect to obtaining approval from internal review boards.
The questionnaire consisted of 23 review‐of‐systems questions,24 4 questions adapted from a previously validated screen for IPV11 (Table 1), and 1 question about attempts to seek help (Table 1). Women were considered to have experienced IPV if they gave positive responses to any of the 4 questions targeting IPV. According to patient preference, the combined questionnaire was either read and filled out by each subject independently or was read to her by a female interviewer who then recorded the subject's verbal responses. All interviewers were women with a shared common concern about, and interest in, IPV. Although none had advanced training in psychology, social work, or other formal discipline that involved interviewing skills, all interviews were scripted so that interactions with subjects and completion of the questionnaires would be uniform. Responses indicating sometimes were considered to be positive. Responses that were not answered, left blank, or marked as not applicable were considered to be negative.
| 1. Have you ever been hit, kicked, punched, or otherwise hurt by someone? If so, by whom? Friend, boyfriend, girlfriend, husband, family member, somebody you do not know, other |
| 2. Within the last year, have you been hit, kicked, or otherwise hurt by someone? If so, by whom? Friend, boyfriend, girlfriend, husband, family member, somebody you do not know, other |
| 3. Do you feel safe in your current relationship? |
| 4. Is there a partner from a previous relationship who is making you feel unsafe now? |
| 5. If you answered yes to any of the above, have you ever asked for help from police, shelter, counselor, physician? If so, how long ago? |
Each patient's medical record was reviewed to determine her age, race, number of previous hospital admissions, visits to the emergency department and walk‐in clinic, visits to primary care and subspecialty physicians, and whether the patient had been screened for IPV as recorded on the admission history and physical template. Admission diagnosis was obtained from the history and physical template, and the discharge diagnosis was obtained from the discharge paperwork. Functional diagnoses were considered to be symptoms (eg, shortness of breath) or problems (eg, constipation) that could not clearly be linked to a specific disease process. All participants were offered a card containing a list of resources for victims of IPV.
Data were analyzed with SAS 8.1 (SAS Institute, Cary, NC) and SPSS 11.5 (SPSS, Chicago, IL). The Student t test was used to compare continuous variables. Data are reported as means standard deviation. Chi‐square analysis was used to test associations between race, primary language, level of education, insurance status, admitting diagnosis, discharge diagnosis, number of previous hospital admissions, visit type, and the presence of IPV. For these, P < 0.05 was considered to be significant. The association of positive review‐of‐systems responses with the presence of IPV was also tested by chi‐square analysis, but P < 0.002 was considered to be significant on the basis of a Bonferroni adjustment for multiple comparisons. A receiver operating characteristic curve was used to assess the relationship between the number of positive responses to the questions included in the review of systems and a history of IPV. The odds ratio and confidence intervals were calculated to test the association between the number of positive responses to the review‐of‐systems questions and a lifetime history of IPV.
RESULTS
Throughout the dates of the study, 245 women were admitted to the internal medicine service, and 106 were excluded (Figure 1). Of the 139 eligible women, 78 were available to the interviewers and asked to participate, and 72 (92%) agreed. IPV occurring within the year prior to the interview or at any point in the patient's lifetime was reported by 16 (22%) and 44 (61%) subjects, respectively. No significant differences were seen in women who did or did not experience IPV at anytime in their life with respect to age, race, insurance status, education, number of scheduled outpatient, urgent, or emergent visits, or admission or discharge diagnosis even when the diagnoses were grouped into a functional category (although at best our study was powered to detect only >35% differences in prevalences; Tables 2 and 3). Of women reporting a lifetime history of IPV, 26 of 44 (59%) had previously sought help, and 9 of those 26 (35%) said that they sought help from a physician.
| IPV History | No IPV History | |
|---|---|---|
| ||
| Number (%) | 44 (61) | 28 (39) |
| Age (mean standard deviation) | 44 10 | 45 12 |
| Race [n, (%)] | ||
| Caucasian | 18 (41) | 6 (21) |
| Hispanic | 13 (30) | 15 (54) |
| African American | 12 (27) | 6 (21) |
| Other | 1 (2) | 1 (4) |
| Insurance status [n (%)] | ||
| Insured | 12 (27) | 5 (18) |
| Uninsured | 32 (73) | 23 (82) |
| Education [n (%)] | ||
| Grade school | 4 (9) | 3 (11) |
| Some high school | 13 (30) | 5 (18) |
| High school diploma | 15 (34) | 9 (32) |
| Some college | 9 (20) | 7 (25) |
| College degree | 2 (5) | 2 (7) |
| Postgraduate | 1 (2) | 2 (7) |
| Previous visit type (median, IQR) | ||
| Scheduled outpatient (includes primary care and subspecialty) | 2 (8) | 1.5 (7) |
| Emergency department and walk‐in clinic | 2 (3.5) | 1 (3) |
| Previous hospital admissions [n (%)] | ||
| 0 | 24 (55) | 16 (57) |
| 1 | 16 (36) | 4 (14) |
| 2 | 0 (0) | 4 (14) |
| 3 | 2 (5) | 2 (7) |
| >3 | 2 (5) | 2 (7) |
| Admission or Discharge Diagnosis | Admission | Discharge | ||
|---|---|---|---|---|
| IPV (n = 44) | No IPV (n = 28) | IPV (n = 44) | No IPV (n = 28) | |
| ||||
| Cardiovascular | ||||
| Chest pain (%)* | 8 (18) | 5 (18) | 6 (14) | 4 (14) |
| Cardiomyopathy | 0 | 0 | 1 | 0 |
| Cerebrovascular accident | 1 | 0 | 1 | 0 |
| Deep venous thrombosis | 0 | 0 | 1 | 0 |
| Hypertensive emergency | 0 | 0 | 1 | 0 |
| Palpitations* | 0 | 1 | 0 | 1 |
| Valvular disease | 0 | 0 | 1 | 0 |
| Venous stasis | 0 | 1 | 0 | 1 |
| Total (%) | 9 (20) | 7 (25) | 11 (25) | 6 (21) |
| Gastrointestinal | ||||
| Abdominal pain (%)* | 7 (16) | 4 (14) | 2 | 1 |
| Ascites | 0 | 1 | 0 | 0 |
| Constipation* | 0 | 0 | 1 | 0 |
| End‐stage liver disease | 1 | 1 | 1 | 2 |
| Esophagitis | 0 | 0 | 1 | 0 |
| Hepatitis | 1 | 0 | 1 | 0 |
| Nausea/vomiting* | 2 | 0 | 1 | 0 |
| Pancreatitis | 0 | 1 | 3 | 2 |
| Peptic ulcer disease | 1 | 0 | 1 | 0 |
| Upper gastrointestinal bleeding | 2 | 0 | 1 | 0 |
| Total (%) | 14 (32) | 7 (25) | 12 (27) | 5 (18) |
| Hematology/oncology | ||||
| Abdominal mass | 0 | 0 | 0 | 1 |
| Anemia | 1 | 0 | 1 | 0 |
| Breast cancer | 0 | 1 | 0 | 1 |
| Cervical cancer | 1 | 0 | 1 | 0 |
| Colon cancer | 0 | 1 | 0 | 1 |
| Sickle cell anemia | 1 | 0 | 1 | 0 |
| Thrombocytosis | 1 | 0 | 1 | 0 |
| Total (%) | 4 (9) | 2 (7) | 4 (9) | 3 (11) |
| Infectious disease | ||||
| Bacteremia/sepsis | 3 | 0 | 3 | 0 |
| Cellulitis | 1 | 0 | 1 | 1 |
| Cholangitis | 0 | 0 | 1 | 0 |
| Community‐acquired pneumonia | 2 | 2 | 2 | 1 |
| Endocarditis | 1 | 0 | 1 | 0 |
| Fever | 0 | 1 | 0 | 1 |
| Pelvic inflammatory disease | 0 | 0 | 0 | 1 |
| Urinary tract infection | 1 | 0 | 1 | 0 |
| Total (%) | 8 (18) | 3 (11) | 9 (20) | 4 (14) |
| Pulmonary | ||||
| Acute exacerbation of COPD | 0 | 0 | 1 | 0 |
| Asthma exacerbation | 1 | 1 | 1 | 2 |
| Pleuritic chest pain* | 0 | 0 | 1 | 0 |
| Pulmonary embolism | 0 | 0 | 1 | 0 |
| Shortness of breath* | 4 | 0 | 1 | 0 |
| Total (%) | 5 (11) | 1 (4) | 5 (11) | 2 (7) |
| Renal/genitourinary | ||||
| Acute renal failure | 0 | 1 | 0 | 1 |
| End‐stage renal disease | 1 | 2 | 1 | 2 |
| Nephrotic syndrome | 0 | 1 | 0 | 2 |
| Vaginal bleeding | 1 | 0 | 1 | 0 |
| Total (%) | 2 (5) | 4 (14) | 2 (5) | 5 (18) |
| Other | ||||
| Diabetic ketoacidosis | 0 | 1 | 0 | 1 |
| Extremity pain* | 0 | 1 | 0 | 0 |
| Mediastinal thickening | 0 | 0 | 0 | 1 |
| Hyponatremia | 0 | 1 | 0 | 1 |
| Lower extremity swelling | 2 | 1 | 0 | 0 |
| Somatization* | 0 | 0 | 1 | 0 |
| Total (%) | 2 (5) | 4 (14) | 1 (2) | 3 (11) |
| Total functional diagnoses (%) | 21 (48) | 11 (39) | 12 (27) | 6 (21) |
Women with a 1‐year history of IPV and women without a 1‐year history of IPV had 11.4 4.7 and 7.7 5.4 positive responses to the review of systems (P < 0.01), respectively. Women with a lifetime history of IPV and women without a lifetime history of IPV had 10.9 4.4 and 7.7 5.4 positive responses (P < 0.01), respectively. The receiver operating characteristic curve of the number of positive responses versus a lifetime history of IPV is presented in Figure 2. Subjects with 10 or more positive responses were 4.8 times more likely to report a lifetime history of IPV than subjects with 9 or fewer positive responses (confidence interval = 1.614.2, P = 0.003). The c‐statistic indicating the ability of the review of systems to properly classify cases when there were 10 or more positive responses was 0.692.
No differences were observed in the responses to the individual review of systems questions in women who did or did not have a lifetime history of IPV, with the exception that those with a positive history more commonly complained of difficulty sleeping and numbness and tingling in their hands or feet (although at best our study was sufficiently powered to detect only >20% differences in prevalences; Table 4). Although the sensitivity of having problems sleeping or experiencing numbness or tingling in patients with IPV was high, the specificity and positive and negative predictive values were not (Table 5).
| Review‐of‐Systems Questions | IPV History (n = 44) | No IPV History (n = 28) | P Value |
|---|---|---|---|
| |||
| 1. Shortness of breath | 25 (57) | 10 (36) | 0.081 |
| 2. Chest pain/pressure | 19 (43) | 9 (32) | 0.349 |
| 3. Abdominal pain | 17 (39) | 10 (36) | 0.803 |
| 4. Headaches | 24 (55) | 13 (46) | 0.502 |
| 5. Rashes | 15 (34) | 9 (32) | 0.864 |
| 6. Bruising | 32 (73) | 12 (43) | 0.011 |
| 7. Joint pain/stiffness | 27 (61) | 11 (39) | 0.067 |
| 8. Muscle pain/spasms | 22 (50) | 11 (39) | 0.374 |
| 9. Pain with intercourse | 8 (19) | 4 (14) | 0.753 |
| 10. Pelvic pain/cramps | 13 (30) | 5 (18) | 0.264 |
| 11. Nausea/vomiting | 19 (43) | 11 (39) | 0.744 |
| 12. Nervous/anxious | 28 (64) | 14 (50) | 0.253 |
| 13. Sad/crying | 21 (48) | 12 (43) | 0.686 |
| 14. Weight gain/loss | 26 (59) | 17 (61) | 0.891 |
| 15. Trouble sleeping | 37 (84) | 12 (43) | 0.000* |
| 16. Fever/chills | 19 (43) | 6 (21) | 0.059 |
| 17. Frequent/painful urination | 11 (25) | 6 (21) | 0.728 |
| 18. Pounding/emrregular heart beat | 14 (32) | 7 (25) | 0.535 |
| 19. Dizzy/passing out | 13 (30) | 7 (25) | 0.675 |
| 20. Memory problem | 19 (43) | 7 (25) | 0.117 |
| 21. Diarrhea/constipation | 27 (61) | 10 (36) | 0.034 |
| 22. Numbness/tingling | 35 (80) | 9 (32) | <0.0001* |
| 23. Pain chewing/swallowing | 8 (18) | 5 (18) | 0.972 |
| Trouble Sleeping | Numbness/Tingling | |
|---|---|---|
| Sensitivity (%) | 84 | 74 |
| Specificity (%) | 57 | 68 |
| Positive predictive value (%) | 76 | 78 |
| Negative predictive value (%) | 70 | 68 |
The admission history forms filled out by first‐year admitting residents showed that only 18 (25%) of the women were screened for IPV, even though the history and physical examination template used at Denver Health Medical Center includes a prompt in the social history section pertaining to a history of violence as a reminder.
DISCUSSION
The important findings of this study were that women admitted to the internal medicine service of a university‐affiliated public safety‐net hospital had a high prevalence of IPV (22% and 61% 1‐year and lifetime prevalences, respectively), that most women with a history of IPV had previously sought help for the problem, many from physicians, that women were more likely to have a history of IPV if they had >10 positive responses to questions asked in a routine review of systems (particularly problems sleeping and experiencing numbness or tingling in their extremities), and that routine screening for IPV was uncommon at the time of admission.
These conclusions should be interpreted with respect to a number of limitations in our study. First, although our study was designed to be a consecutive series, the interviewers did not have sufficient time to meet with and interview every woman admitted before they were discharged. This occurred in part because the interviewers were available only for a portion of each day, some patients were discharged within 24 hours of admission, and many were out of their rooms for ancillary testing. Within the interviewers' time constraints, however, all hospitalized women meeting entry criteria who were available were approached. Our data could, however, overrepresent the prevalence of IPV if hospitalized women with a history of IPV had longer hospital stays than those who did not or if those experiencing IPV were out of their rooms less frequently (eg, for diagnostic tests). On the other hand, our data could underrepresent the true prevalence of IPV if patients with a history of IPV had shorter hospital stays or if they received more ancillary testing that caused them to be out of their rooms more frequently. Second, none of our interviewers had specific training in interviewing techniques. Accordingly, our data could have underestimated the true prevalence of IPV if interviewers with advanced training in probing sensitive topics had more success in eliciting positive responses. Third, the relationship between a history of IPV and multiple positive responses to the review of systems may be confounded if some of these patients also had a history of adverse childhood experiences or other experiences resulting in posttraumatic stress disorder as these patients also have an increased prevalence of chronic and functional disorders.2527 Finally, as our numbers were small, we were not powered to detect clinically important differences in demographics or specific positive answers on the review of systems.
To the best of our knowledge, the only study presenting IPV prevalence data in patients hospitalized for other than psychiatric problems was performed by McKenzie and colleagues18 in 1997. In their group of 130 patients (61 on internal medicine, 59 on surgery, 7 on obstetrics, and 3 on psychiatry), the 1‐year and lifetime prevalences of IPV were only 5% and 26%, respectively. McKenzie and colleagues used only 1 question to screen for IPV, but that single question incorporated 2 of the 4 questions used in our survey. Forty‐three of our 44 patients (98%) with a history of IPV were discovered on the basis of these 2 questions. The hospitals in which the 2 studies were done were similar, as were the ages and levels of education of the 2 populations studied and the percentage of eligible patients who agreed to participate. The patients in the 2 studies were different with respect to race, language mix, and the percentage who were insured, but neither study found differences in the prevalence of IPV as a function of race or insurance (although others have found an association of IPV with being uninsured1, 3, 4, 12, 23). Our study was conducted in women admitted exclusively to an internal medicine service, whereas nearly half of the patients studied by McKenzie and colleagues were admitted to surgical, gynecologic, or psychiatric services. Although McKenzie and colleagues found no difference in the prevalence of IPV as a function of admitting service, others have suggested that the prevalence of IPV is higher in patients admitted for trauma or psychiatric problems.1517, 28 The percentage of patients who self‐administered the questionnaires was 57% in our study and 77% in the study by McKenzie and colleagues. Neither study, however, found a difference in the percentage of IPV in patients who self‐administered the survey versus those who were interviewed. Women may have become more comfortable discussing this issue in the 10‐year interval between these 2 studies, or the prevalence of IPV may have increased. The only other study of IPV in hospitalized patients of which we are aware reported a 90% 1‐year prevalence in suicidal women admitted to a psychiatric service.28
Several studies have reported that victims of IPV have multiple somatic complaints and an increased prevalence of chronic and functional illnesses.1923 We confirmed that women experiencing IPV have more positive responses to questions posed in a review of systems, but the low specificity and positive and negative predictive values of the responses make this association of little clinical utility.
For only 18 of the 72 patients (25%) in our study was there evidence that they were screened for a history of IPV by the admitting resident. If more women were screened without a response being recorded, or if women were screened only for a current history of violence, our data may not accurately reflect the true rate at which screening occurred; however, the rate of screening that we observed is consistent with a number of other studies.12, 22, 2931 Fourteen of 18 patients who were screened for IPV by the resident gave negative responses. Ten of these, however, gave positive responses to our interviewers. Accordingly, the sensitivity, specificity, and positive and negative predictive values of the information recorded by the admitting resident were 40%, 100%, 100%, and 57%, respectively (assuming that the responses given to the IPV survey represent the gold standard), and this confirms that routine screening underestimates the prevalence of this problem. Accordingly, we identified 2 problems pertaining to screening for IPV: (1) it is not routinely done at the time of hospital admission, and (2) responses reported during routine screening are frequently incorrect. A number of barriers to routine screening have been previously identified, as have interventions designed to increase screening.32 Providing specific screening questions increases the identification of victims of IPV, but simply educating healthcare providers does not.32 Our history and physical templates have a prompt for violence victim to facilitate the screening, but as a result of this study, we are changing our prompting question and indicating what should be done if the response is positive.
The US Preventive Services Task Force and the Canadian Task Force on Preventive Health Care both concluded that there was insufficient evidence to recommend for or against routine screening for IPV.3335 Their rationale was that trials assessing the effectiveness of screening have not been published, that studies designed to assess the effectiveness of any resulting intervention are few in number, focused on pregnant women, and limited by problems in study design, that no studies have determined the accuracy of the screening tools, and that none have addressed the potential harm of screening.3335 The US Preventive Services Task Force did recommend screening if providers were concerned about IPV.34 Our data would suggest that there is little in the admission history that distinguishes women who might be victims of IPV from those who might not. Guidelines published by the American Medical Association, the American Academy of Family Physicians, and the American College of Obstetricians and Gynecologists promote routine screening of all patients.3638 Janssen and colleagues39 support the importance of screening on the basis that IPV is associated with numerous physical and mental health problems (eg, arthritis, migraines and other types of headaches, vaginal bleeding, ulcers, spastic colon, chronic pain, substance abuse, depression, and suicide ideation) and that establishing the link between these conditions and IPV could be important with respect to developing appropriate diagnostic and therapeutic approaches to patients' complaints. Screening also allows physicians to become more knowledgeable about their patients' lives, facilitating their ability to provide a supportive relationship that, in turn, increases women's likelihood of using an intervention method.39 We did not confirm an increased prevalence of any of the complaints noted by Janssen and colleagues in the women experiencing a history of IPV, but we did find an increased prevalence of insomnia and extremity numbness in women admitting to IPV as well as an overall increase in the number of positive responses to the review of systems. Screening identifies women who should receive information about reporting IPV, obtaining available assistance, planning for personal safety, and formal counseling as these have all been shown to reduce the severity of IPV and to improve the quality of life in rather large, randomized controlled trials.4043
As previously observed by others,13, 22, 29, 4446 the large majority of women that we approached welcomed screening for IPV. Over half of those with a history of IPV had previously sought help for the problem, over one‐third of these sought help from physicians, and most took the resource card that we offered, regardless of whether they did or did not have a history of IPV (this suggests either that our data may actually underestimate the true prevalence of IPV or that patients taking the information knew of others experiencing this problem). Accordingly, regardless of whether physicians believe that routine screening is warranted, patients see physicians and other healthcare workers as a resource for this problem.
We have confirmed that a history of IPV is very common in women admitted to an internal medicine service of a university‐affiliated public hospital and that female victims of IPV have more positive responses on the review of systems (particularly difficulty sleeping and extremity numbness or tingling) than those who have not. Although we initially hypothesized that finding numerous somatic complaints might serve as a marker for IPV, thereby identifying patients for whom more careful screening should occur, finding such a high prevalence of IPV argues that screening should be a routine part of the history for all women admitted to internal medicine inpatient services.
Acknowledgements
The authors thank the patients who agreed to participate in this study during their hospitalization. They also thank Cheri Maestas and Debbie Rodriquez for their support and help in interviewing patients.
- ,,.Prevalence and determinants of intimate partner abuse among public hospital primary care patients.J Gen Intern Med.2000;15:811–817.
- ,,,.Women's experiences with violence: a national study.Womens Health Issues.2007;17:3–12.
- ,,,.Multistate analysis of factors associated with intimate partner violence.Am J Prev Med.2002;22:156–164.
- ,,,.Frequency and correlates of intimate partner violence by type: physical, sexual, and psychological battering.Am J Public Health.2000;90:553–559.
- ,,,,.Prevalence of domestic violence among patients in three ambulatory care internal medicine clinics.J Gen Intern Med.1991;6:317–322.
- ,,,.Prevalence of partner violence against 7,443 African American, White and Hispanic women receiving care at urban public primary care clinics.Public Health Nurs.2005;22:98–107.
- ,,,,.Evaluating domestic partner abuse in a family practice clinic.Fam Med.1997;29:492–495.
- ,.Prevalence and predictors of physical partner abuse among Mexican American women.Am J Public Health.2001;91:441–445.
- ,,.Rates of intimate partner violence in the United States.Am J Public Health.1998;88:1702–1704.
- ,,,.Domestic violence against women incidence and prevalence in an emergency department population.JAMA.1995;273:1763–1767.
- ,,, et al.Accuracy of 3 brief screening questions for detecting partner violence in the emergency department.JAMA.1997;277:1357–1361.
- ,,.A prevalence survey of abuse and screening for abuse in urgent care patients.Obstet Gynecol.1998;91:511–514.
- Morbidity and Mortality Weekly Report.Use of medical care, police assistance and restraining orders by women reporting intimate partner violence—Massachusetts, 1996–1997.JAMA.2000;284:558.
- ,,.Interpersonal violence among women seeking welfare: unraveling lives.Am J Public Health.2006;96:1409–1415.
- ,.A 5‐year follow‐up study of 117 battered women.Am J Public Health.1991;81:1486–1488.
- ,,.Rates and relative risk of hospital admission among women in violent intimate partner relationships.Am J Public Health.2000;90:1416–1420.
- ,,,.Intimate partner violence against women: do victims cost health plans more?J Fam Pract.1999;48:439–443.
- ,,,.Prevalence of domestic violence in an inpatient female population.J Gen Intern Med.1998;13:277–279.
- ,,, et al.Intimate partner violence and physical health consequences.Arch Intern Med.2002;162:1157–1163.
- ,,,,.Physical health consequences of physical and psychological intimate partner violence.Arch Fam Med.2000;9:451–457.
- ,,, et al.Sexual and physical abuse in women with functional or organic gastrointestinal disorders.Ann Intern Med.1990;113:828–833.
- ,,.Prevalence of intimate partner violence and health implications for women using emergency departments and primary care clinics.Womens Health Issues.2004;14:19–29.
- ,,, et al.The “battering syndrome”: prevalence and clinical characteristics of domestic violence in primary care internal medicine practices.Ann Intern Med.1995;123:737–746.
- ,.DeGowin and DeGowin's Bedside Diagnostic Examination.5th ed.New York, NY:Macmillan Publishing;1987:18–29.
- ,,, et al.Relationship of childhood abuse and household dysfunction to many of the leading causes of death in adults. The Adverse Childhood Experiences (ACE) Study.Am J Prev Med.1998;14:245–258.
- ,,,,,.Posttraumatic stress disorder and health status among female and male medical patients.J Trauma Stress.2004;17:1–9.
- ,,,,.Posttraumatic stress disorder and physical comorbidity among female children and adolescents: results from service‐use data.Pediatrics.2005:116;e767–e776.
- ,,,,.Prevalence and severity of intimate partner violence and associations with family functioning and alcohol abuse in psychiatric inpatients with suicidal intent.J Clin Psychiatry.2006;67:23–29.
- ,,.Intimate partner violence screening and intervention: data from eleven Pennsylvania and California community hospital emergency departments.J Emerg Nurs.2001;27:141–149.
- ,.Missed opportunities: emergency department visits by police‐identified victims of intimate partner violence.Emerg Med.2006;47:190–199.
- ,,, et al.Intimate partner violence and patient screening across medical specialties.Acad Emerg Med.2005;12:712–722.
- ,,,,.Screening for intimate partner violence by health care providers: barriers and interventions.Am J Prev Med.2000;19:230–237.
- ,,,.Screening women and elderly adults for family and intimate partner violence: a review of the evidence for the U.S. Preventive Services Task Force.Ann Intern Med.2004;140:387–396.
- U.S. Preventive Services Task Force.Screening for family and intimate partner violence: recommendation statement.Ann Intern Med.2004;140:382–386.
- ,.Interventions for violence against women: scientific review.JAMA.2003;289:589–600.
- American Medical Association. Policy H‐515.965: family and intimate partner violence. Available at: http://www.ama‐assn.org. Accessed May2007.
- American Academy of Family Physicians. Family and intimate partner violence and abuse. Available at: www.aafp.org/x16506.xml. Accessed May2007.
- Domestic Violence.Washington, DC:American College of Obstetrics and Gynecology;1999. Educational Bulletin Number; No. 257.
- ,,.Assessment for intimate partner violence: where do we stand?J Am Board Fam Med.2006;19:413–415.
- ,,,,,.What happens when health care providers ask about intimate partner violence? A description of consequences from the perspectives of female survivors.JAMA.2003;58:76–81.
- ,,,,,.Assessing intimate partner violence in health care settings leads to women's receipt of interventions and improved health.Public Health Rep.2006;121:435–444.
- ,,.An evaluation of interventions to decrease intimate partner violence to pregnant women.Public Health Nurs.2000;17:443–451.
- ,.Reducing violence using community‐based advocacy for women with abusive partners.J Consult Clin Psychol.1999;67:43–53.
- ,,,,.Help‐seeking for intimate partner violence and forced sex in South Carolina.Am J Prev Med.2000;19:316–320.
- ,,, et al.Women's opinions about domestic violence screening and mandatory reporting.Am J Prev Med.2000;19:279–285.
- ,,,.The factors associated with disclosure of intimate partner abuse to clinicians.J Fam Pract.2001;50:338–344.
Copyright © 2008 Society of Hospital Medicine
Time for Health Education of Hospitalized Patients
Educating patients about smoking cessation when they are hospitalized for acute coronary syndrome results in a 57% 1‐year quit rate.1 This rate is far higher than the typical 15%‐30% 1‐year quit rates observed with smoking cessation programs administered in the outpatient setting24 and suggests that hospitalized patients may be uniquely motivated to respond to health education.
Kerzman and colleagues5 found that 42% of hospitalized patients expressed a wish to receive more comprehensive counseling about their medications before being discharged from the hospital. And although the Joint Commission on Hospital Accreditation and the Centers for Medicare and Medicaid Services have established core quality measures mandating that patients hospitalized with congestive heart failure receive education as one component of a high‐quality discharge process,6, 7 approximately one third of patients nationally do not receive adequate patient education.8
Barber‐Parker9 suggested that because patient acuity in hospitals was so high and patients were so commonly absent from their nursing units for testing and treatment, there was little time available for health education during their hospitalization. Anecdotal observations in our institution suggested, however, that adult patients hospitalized on the general Internal Medicine service spent much of their day doing little more than lying in bed watching television. Accordingly, we hypothesized that considerable time might be available for patient education during a hospitalization. We therefore sought to quantify the fraction of time patients were not involved in treatment activities, diagnostic testing, or other evaluations and to determine whether during these times they wanted and were feeling well enough to participate in educational activities. We also sought to determine what patients wanted to know about their health problems and what types of educational activities they most preferred.
MATERIALS AND METHODS
We conducted a time‐motion and survey study from June 25, 2005, to August 15, 2005, at Denver Health Medical Center, an academic public safety‐net hospital affiliated with the University of Colorado School of Medicine. All patients older than 18 years of age who spoke English or Spanish and were admitted to the general Internal Medicine service were candidates for enrollment. Exclusion criteria were being admitted to the intensive care unit, having an inability to communicate, being in contact precautions, and being previously enrolled. The study was approved by the Colorado Multiple Institutional Review Board. Written informed consent was obtained for all study participants.
At 8:00 AM, all patients admitted during the previous 15 hours were assigned a random number from a random number table and were approached for consent in numeric order. With 2 data collectors working daily, a maximum of 12 patients could be enrolled each day. Consenting subjects who passed a vision test were given the Test of Functional Health Literacy in Adults at the time of enrollment and a written questionnaire (in either English or Spanish) on a daily basis for a maximum of 6 days. Some of these patients also participated in a structured interview that was designed to elicit their views on health education topics and formats for education of hospitalized patients. Others, again determined by random number, were subjects of a time‐motion study.
Demographic data collected included age, sex, language, race, comorbidities, insurance status, and discharge diagnosis.
Time‐Motion Study
Patients were observed from 8:00 AM to noon and from 1:00 to 5:00 PM7 days a week. Data were collected using TimerPro on a Dell Axim A5 pocket PC and imported daily into an Excel spreadsheet. Observations were categorized as downtime, busy time, or provider time and subcategorized as summarized in Table 1.
| First level | Second level | Third level |
|---|---|---|
| Downtime | Alone | TV |
| Resting | ||
| Sleeping | ||
| Reading | ||
| Telephone | ||
| Other | ||
| Friends/family | TV | |
| Resting | ||
| Sleeping | ||
| Reading | ||
| Telephone/talk | ||
| Other | ||
| Provider | Physician | |
| Nurse | ||
| Physician and nurse | ||
| Physician and other | ||
| Other | ||
| Busy | ADL | |
| Meal | ||
| Out of room | ||
| Other |
Questionnaire
We were unable to find a validated questionnaire in the literature that was designed to assess patient opinion or level of interest in educational activities during a hospitalization. Accordingly, we developed our own using a 5‐point Likert scale (Box 1). Two outcomes researchers with expertise in using questionnaires for clinical research independently reviewed the questionnaire to establish face validity.
Box 1. Daily Questionnaire on In‐Hospital Health Education
The following statements were read to the patients on a daily basis and answered using the following scale: 1 = Strongly Disagree, 2 = Disagree, 3 = Neutral, 4 = Agree, 5 = Strongly Agree
I feel well enough today to learn about my illness or my health.
I want to learn more about my illness or my health today.
I have time to learn about my health today.
It is important to me to learn more about my illness or health while in the hospital.
Interview
All patients were asked the open‐ended questions listed in Box 2, and the entire interview was recorded on audiotape for subsequent analysis.
Box 2. Interview Questions with Probes for Educational Preferences
What things related to your health would you like to learn more about while you are in the hospital? (list up to three topics in order of impotance to you).
How can we help you learn more about your illness or health while in the hospital?
Who should do the teaching (eg, an MD, a nurse, a dietician, a medical student, peers, physical therapists, respiratory therapists)?
Who else should be present (eg, patients with similar illness, family, no one)?
How should this teaching be done (eg, didactic sessions, hands‐on, video tape, pre‐ and post‐testing)?
Data Analysis
All analyses were performed using SAS, version 9.1 (SAS Institute, Inc., Cary, NC). A P value < 0.05 was considered significant.
Time‐Motion Data
Mixed‐effects general linear models (growth curve or repeated measures), using SAS Proc Mixed, were used to test whether the proportions of downtime, busy time, and provider time differed by day of hospitalization. Linear growth curve models were used to test whether a linear trend was present. If not, repeated‐measures models were used to obtain estimates by day of hospitalization.
Questionnaire Data
Mixed‐effects general linear models (growth curve or repeated measures) were used to determine whether patient responses differed by day of hospitalization, as described above.
Interview Data
Tape recordings were reviewed in depth to code participant responses to the structured questions. We utilized the template style of analysis, coding segments of the interviews and identifying illustrative quotes whenever possible. Key patterns and themes were summarized along with specific patient preferences regarding topics of interest and learning opportunities while in the hospital and after discharge.
RESULTS
Patient selection is described in Figure 1, and patient demographics are summarized in Tables 2 and 3.

| Demographic | Time‐motion | Interview | Questionnaire |
|---|---|---|---|
| |||
| Study subjects | 13 | 15 | 125 |
| Sex | |||
| Male | 6 (46) | 7 (47) | 61 (49) |
| Female | 7 (54) | 8 (53) | 64 (51) |
| Age (years), median (IQR) | 47 (20) | 51 (20.5) | 51 (18) |
| Race/ethnicity | |||
| White, non‐Hispanic | 6 (46) | 5 (33) | 46 (37) |
| Black/African American | 3 (23) | 4 (27) | 27 (22) |
| American Indian | 0 (0) | 0 (0) | 1 (1) |
| Hispanic | 4 (31) | 6 (40) | 51 (41) |
| Primary language | |||
| English | 12 (92) | 14 (93) | 109 (87) |
| Spanish | 1 (8) | 1 (7) | 16 (13) |
| Health literacy* | |||
| Adequate | 3 (75) | 9 (82) | 60 (71) |
| Marginal | 1 (25) | 0 (0) | 6 (7) |
| Inadequate | 0 (0) | 2 (18) | 18 (22) |
| Insurance status | |||
| Self‐pay | 3 (23) | 1 (7) | 24 (19) |
| Medicaid | 1 (8) | 4 (27) | 19 (15) |
| Medicare | 3 (23) | 0 (0) | 2 (2) |
| Colorado Indigent Care Program | 3 (23) | 7 (47) | 51 (41) |
| Private | 2 (15) | 1 (7) | 5 (4) |
| Other | 1 (8) | 2 (14) | 24 (18) |
| Time‐motion | Interview | Questionnaire | |
|---|---|---|---|
| Study subjects (n) | 13 | 15 | 125 |
| Discharge diagnoses (selected) | |||
| Coronary artery disease (including angina) | 1 (8) | 2 (13) | 24 (19) |
| Congestive heart failure | 1 (8) | 1 (7) | 4 (3) |
| Upper gastrointestinal bleeding, gastritis, reflux | 2 (15) | 4 (27) | 14 (11) |
| Syncope | 2 (15) | 0 | 5 (4) |
| Acute renal failure | 0 | 0 | 5 (4) |
| Pancreatitis | 0 | 1 (7) | 6 (5) |
| Venous thromboembolism | 2 (15) | 1 (7) | 3 (2) |
| Chronic obstructive pulmonary disease | 0 | 0 | 4 (3) |
| Diabetic ketoacidosis | 1 (8) | 1 (7) | 3 (2) |
| Pyelonephritis | 0 | 0 | 5 (4) |
| Pneumonia | 2 (15) | 1 (7) | 5 (4) |
| Comorbidities | |||
| Diabetes | 5 (38) | 9 (60) | 41 (33) |
| Hypertension | 1 (8) | 9 (60) | 55 (44) |
| Dyslipidemia | 6 (46) | 2 (13) | 26 (21) |
| Tobacco | 5 (38) | 7 (47) | 55 (44) |
| Chronic obstructive pulmonary disease | 2 (15) | 4 (27) | 15 (12) |
| Congestive heart failure | 2 (15) | 2 (13) | 13 (10) |
| Coronary heart disease | 3 (23) | 3 (20) | 21 (17) |
Time‐Motion Study
Thirteen patients were studied. Of the 315 patient‐hours observed, 71% were categorized as downtime, 15% as provider time, and 14% as busy time. The proportion of downtime ranged from a low of 0.65 (SE 0.04) on hospital Day 2 to a high of 0.76 (SE 0.06) on hospital Day 4, but the differences in downtime proportions by day did not reach statistical significance (P = .65; Fig. 2). The lowest percentage of downtime observed in any patient on any day was 39%. The 125 hours of downtime observed consisted of 1317 separate blocks of time, 80% of which were less than 15 minutes in duration, 14% of which were 15 to 30 minutes in duration, and 6% of which exceeded 30 minutes in duration.
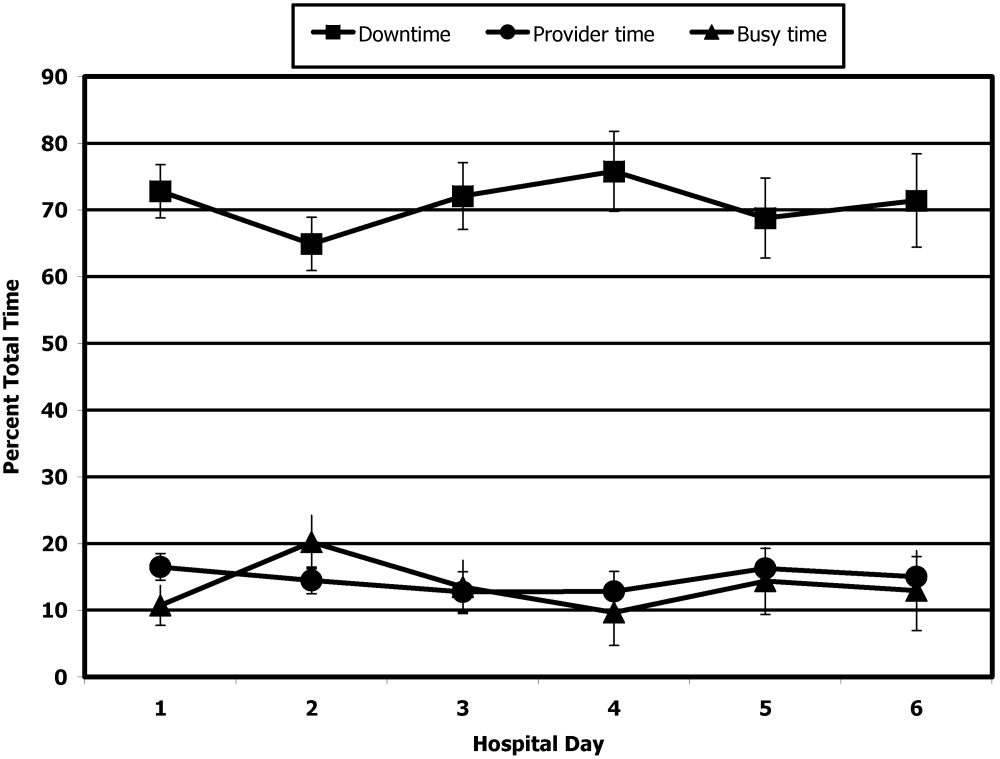
Thirty‐six full days of observation, defined as greater than 7 hours of observation in 1 day, were used to assess the amount of time spent with providers. Of the 60 minutes/day (IQR = 44) that patients spent with health care providers, 21 minutes/day (IQR = 34) was spent with phlebotomists, physical or occupational therapists, dieticians, or social workers, 25 minutes/day (IQR = 25) was spent with patients' nurses, and a median of only 9 minutes/day (IQR = 11) was spent with their physicians.
Questionnaire
A total of 311 questionnaires were administered to the 138 consenting participants. Irrespective of the day of testing, 79% to 97% strongly agreed or agreed with the 4 statements (Fig. 3). In response to the first statementI feel well enough to learnpatient scores increased steadily over the 6 days of hospitalization patients were surveyed (coefficient = 0.15, P = .004). On hospital day 1, the mean score was 3.85 (SE 0.08), and by day 6 the mean score had increased to 4.75 (SE 0.08) However, there was no significant change over time in patients' desire to learn, self‐perceived time available to learn, or importance placed on learning during their hospital stay.

Interview
Fifteen interviews were conducted. Representative comments are presented in Table 4. Responses generally indicated that the patients had anxieties and uncertainties about their health and safety after discharge. Most participants wanted to know more about the condition for which they had been hospitalized, including information pertaining to management, prevention, etiology, and prognosis of their disease. Diabetic patients asked for information on insulin dosing, nutrition, and the effect of the disease on their bodies.
| Theme | Sample quotes |
|---|---|
| Preferred topics | |
| Self‐management | I need to know what to do when I go home, how to take care of it. Medical peopledon't give enough information to the patient and patient's family so they can help themselves. You need to encourage patients to help themselves, take some responsibility for themselves. |
| Prevention of disease recurrence or progression | It's okay to tell people that they have something and give them medicine, but also tell them what they can do to prevent it or make it less painful. I've known about bronchitis for many years, but didn't know it would affect my heart. |
| What's happening to me? | Am I going to diehow long? |
| Just fix me | I came to the hospital to get fixed, not educated. I'm results‐oriented, not cause‐oriented. |
| Preferred learning methods | |
| One‐to‐one didactics with MDs | I'd like one‐to‐one time with someone who has the time to listen. One to one with doctors who can explain what can happen, what to take, what not to take. |
| Family involvement | Get the family involved so the family understands the limitations of the person, how medications affect them. To say a person has a heart condition is a very vague statement. If they [family] understand more, it's better. |
| Groups | A group of people with similar illnessI like groups where everyone listens. I'd participate in groups at the hospital but not at home. |
| Video | Hospital TV is not meeting my needs. |
| Printed material | A doctor or nurse tell me what's going on and then also handouts on dietary and nutrition. |
| Electronic learning | I learned a lot through the encyclopedia of family health care, and through Web sites |
Patients preferred to pick their own topics for education rather than having topics chosen for them. Patients also showed in interest in prevention. One diabetic patient wanted to know how to prevent her children from becoming diabetic, and a cardiac patient wanted education on heart disease prevention. Other recurrent themes included the desire to know what was causing their illness and information about prognosis.
Almost all the patients were interested in more than one type of learning experience. The most frequently cited preference was to have a doctor or other knowledgeable health care professional answer questions specific to their individual situation. Video and group learning were each mentioned by approximately half the participants. Most patients thought that having family present during educational discussions was important.
Video was the most frequently mentioned learning tool, and patients thought it would be useful to have this modality available in the hospital as well as the home. Two patients expressed interest in computerized learning (one of whom had used health Web sites before his hospitalization). Most patients wanted handouts or reading material in addition to other methods of communicating information. Although many patients said they felt comfortable discussing their problems in group settings, some did not.
DISCUSSION
The important findings of this study are that hospitalized patients have a substantial amount of time available for health education and a considerable willingness and interest in participating in health educational activities. We found that although there was a great deal of time available on all days of hospitalization studied, patients felt increasingly well enough to participate in educational activities through their hospital stay.
We are unaware of other studies that have attempted to quantify the amount of time hospitalized patients are available for educational activities or whether they feel capable of participating in these activities. McBride10 found that 95% of hospitalized patients supported a health‐promoting hospital and that almost 80% wanted to modify at least 1 aspect of their lifestyle. Martin and colleagues11 found that patient satisfaction was improved by a patient‐centered unit incorporating dedicated nursing staff to promote patient involvement and provide personalized care and education. Barber‐Parker9 suggested that high patient acuity, short durations of hospitalization, and lack of patient availability because of testing and treatment limited the opportunities that patients had for health education during their hospitalization. These conclusions were reached on the basis of surveys of nurses' perceptions, however, rather than on direct observations or assessments of patients' perceptions.
Our findings suggest that many types of patient educational approaches may be needed to achieve maximal effectiveness and that regardless of the specific approach employed, the focus should be on the primary reason for a patient's hospitalization, what the hospitalization meant, why it happened and what the patient can do to prevent hospitalization from occurring in the future.
Transitions in care have been identified as periods in which communication lapses occur and outcomes can be adversely affected.12 A recent study by Epstein and colleagues13 found that almost 12% of patients had new or worsening symptoms of disease within the first few days after discharge from the hospital and that 22% either did not pick up their medications or understand how to take them (consistent with the observations of Kerzman and colleagues).5 The most common action taken in response to these findings was nurse‐mediated patient education. Our study indicates there is potential for further educational processes in hospitals, which may improve the safety of transitions from a hospital setting to outpatient care.
Although many disease management programs have been studied in the outpatient setting,1417 very few have been extended into hospitals. Accordingly, hospitalists are ideally suited to develop and implement disease management programs in concert with outpatient efforts.18 Our study suggests there is an underutilized opportunity for hospital‐based physicians and other health care providers to work with patients at a time when they are uniquely focused on their own health and free from many of the time constraints of their normal lives.
Although JCAHO mandates that hospitalized patients receive education and training specific to the patient's needs and as appropriate to the care, treatment and services provided,19 there is a paucity of data describing the educational processes in US hospitals. Johansson and colleagues20 conducted a survey in a Finnish hospital where patient education is also mandated. Written materials were given to about 55% of the patients. Demonstration and practice were used with about one third, whereas the Internet and videotapes were used for fewer than 10%. Although patients underwent educational activities throughout their hospitalization, and most were satisfied with the process, Johansson and colleagues found that only 59% felt that what they knew about their care was sufficient, almost a third felt they did not know enough about the side effects of their medical care, and almost half felt they did not have sufficient input into what they were being taught.
Although we found a large amount of time that might be used for patient education during a hospitalization, this time was commonly limited to 15‐minute blocks, as has been noted previously.9 This observation implies that educational activities should be designed so they can be conducted over short periods and/or stopped for short periods when interruptions occur or that the processes of care during a hospitalization should be altered to create larger blocks of continuous time available for educational activities.
A number of issues could have biased our results. Only 66% of the patients who were approached to participate agreed to do so. Because those declining may have been sicker and because sicker patients may require more diagnostic testing or more invasive treatment, we may have overestimated both the amount of downtime available and the willingness of patients to participate in educational activities. If we assume, however, that all patients who refused to participate either disagreed or strongly disagreed with the statements in the questionnaire regarding their interest in educational activities, the fraction of patients agreeing or strongly agreeing with idea that they were well enough and interested would still be 57% to 75% of the population sampled. Accordingly, this potential bias, if it occurred, would not alter our conclusions.
The time‐motion studies were only performed between 8:00 AM and 5:00 PM, such that the resulting data do not reflect any diagnostic testing, therapeutic interventions, or contact with health care providers that occurred at other times. This may have contributed to the strikingly small amount of time that patients spent with their physicians and nurses. If patient time after 5:00 PM and before 8:00 AM had been observed and included, it is likely that the absolute amount of time spent with physicians and nurses would increase, whereas the overall proportion of patient time spent with providers would decrease.
We were also only able to collect data on 13 time‐motion subjects. This limited sample size from a single institution may not be representative of all hospitalized non‐ICU patients on general medical wards. Accordingly, we make no claims that our data can be generalized to the entire population of patients admitted to non‐ICU medical services. However, the results of our surveys, which sampled a much broader patient population and supported our time‐motion findings, suggest that our time‐motion findings are likely to be representative of significant underutilized time and motivation for patient education in the hospital setting.
Also, it is important to note that although the time‐motion studies were only done with 13 patients, these studies are extremely labor intensive and are rarely done with much larger samples. In addition, the SDs on the data collected from the time‐motion studies were quite small. It is possible that if a larger sample were studied, the percentage of free time might be larger or smaller than what we observed for the 13 patients we studied. However, it would be quite unlikely that the amount of free time would be so small (eg, 10%‐15%) that it would invalidate our conclusion that considerable time is available for patient education over and above what currently occurs in most hospital settings.
A patient's self‐perception of his or her ability to learn may not reflect that patient's true cognitive readiness to do so. JCAHO requirements mandate that nurses be trained to assess patients for their ability to learn and to do so as part of the admission process. After reviewing all day 1 patient responses to our questionnaires, in no instance did a nurse assess a patient as having a barrier to learning when the patient had reported feeling well enough to learn. Accordingly, although we performed no direct tests of patients' ability to learn, this retrospective independent assessment did not suggest that patients systematically overestimated their ability to learn.
Finding that hospitalized patients are unoccupied for approximately 70% of their daytime hours and that most patients are both highly motivated to learn and have few barriers to doing so indicates that educational activities during hospitalizations have substantial potential for expansion. The current structure for educating hospitalized patients should be supplemented to take these findings into account.
Acknowledgements
We thank Dr. John Steiner and Dr. Sheena Bull for their assistance in study design as well as the development of the questionnaire and interview tools. We also thank Carolyn Nowels for her assistance with the qualitative data analysis. The assistance of Dr. Bull and Dr. Steiner was made possible through NHLBI grant U01HL079160, and funding for data collection was made possible by the University of Colorado at Denver and Health Sciences Center Department of Medicine, Division of General Internal Medicine small grants program.
- ,.Randomized controlled trial of smoking cessation intervention after admission for coronary heart disease.BMJ.2003;327:1254–1257.
- .Treatment of tobacco use and dependence.N Engl J Med.2002;346:506–512.
- ,, et al.A clinical practice guideline for treating tobacco use and dependence: a US Public Health Service report.JAMA.2000;283:3244–3254.
- ,,, et al.National Institutes of Health state‐of‐the science conference statement: tobacco use: prevention, cessation and control.Ann Intern Med.2006;145:839–844.
- ,,.What do discharged patients know about their medications?Patient Educ Couns.2005;56:276–282.
- Joint Commission on Accreditation of Healthcare Organizations.A Comprehensive Review for the Development and Testing for National Implementation of Hospital Core Measures.2006:1–40.
- .ACC/AHA 2005 guideline update for the diagnosis and management of chronic heart failure in the adult: a report of the American College of Cardiology/ American Heart Association task force on practice guidelines.J Am Coll Cardiol.2005;46:1–82.
- JCAHO data. Available: https://cimprod.uhc.edu/CoreMeasures/Products/DownloadSystem/WebPages/ViewReportsDownloadList.aspx.
- .Integrating patient teaching into bedside patient care: a participant‐observation study of hospital nurses.Patient Educ Couns.2002;48:107–113.
- .Health promotion in the acute hospital setting: the receptivity of adult in‐patients.Patient Educ Couns.2004;54:73–78.
- ,,,,,.Randomized trial of a patient‐centered hospital unit.Patient Educ Couns.1998;34:125–133.
- ,,,,,.Deficits in communication and information transfer between hospital‐based and primary care physicians: implications for patient safety and continuity of care. HYPERLINK “javascript:AL_get(this,%20'jour',%20'JAMA.');”JAMA.2007;297:831–841.
- ,,,,.Frequency of new or worsening symptoms in the posthospitalization period.J Hosp Med.2007;2:58–68.
- ,,,.Patient self‐management of chronic disease in primary care.JAMA.2002;288:2469–2475.
- ,,.Effectiveness of self‐management training in type 2 diabetes.Diabetes Care.2001;24:561–587.
- ,,.Quality of life assessment after patient education a randomized controlled study on asthma and chronic obstructive pulmonary disease.Am J Respir Crit Care Med.2001;95:56–63.
- ,.The effects of a health educational and exercise program for older adults with osteoarthritis for the hip or knee.J Rheumatol.1997;24:1378–1383.
- ,,,.Expanding the roles of hospitalist physicians to include public health.J Hosp Med.2007;2:93–101.
- The Joint Commission on Accreditation of Healthcare Organizations Comprehensive Accreditation Manual for Hospitals: The Official Handbook. January2007. p.152
- ,,,.Need for change in patient education: a Finnish survey from the patient's perspective.Patient Educ Couns.2003;51:239–245.
Educating patients about smoking cessation when they are hospitalized for acute coronary syndrome results in a 57% 1‐year quit rate.1 This rate is far higher than the typical 15%‐30% 1‐year quit rates observed with smoking cessation programs administered in the outpatient setting24 and suggests that hospitalized patients may be uniquely motivated to respond to health education.
Kerzman and colleagues5 found that 42% of hospitalized patients expressed a wish to receive more comprehensive counseling about their medications before being discharged from the hospital. And although the Joint Commission on Hospital Accreditation and the Centers for Medicare and Medicaid Services have established core quality measures mandating that patients hospitalized with congestive heart failure receive education as one component of a high‐quality discharge process,6, 7 approximately one third of patients nationally do not receive adequate patient education.8
Barber‐Parker9 suggested that because patient acuity in hospitals was so high and patients were so commonly absent from their nursing units for testing and treatment, there was little time available for health education during their hospitalization. Anecdotal observations in our institution suggested, however, that adult patients hospitalized on the general Internal Medicine service spent much of their day doing little more than lying in bed watching television. Accordingly, we hypothesized that considerable time might be available for patient education during a hospitalization. We therefore sought to quantify the fraction of time patients were not involved in treatment activities, diagnostic testing, or other evaluations and to determine whether during these times they wanted and were feeling well enough to participate in educational activities. We also sought to determine what patients wanted to know about their health problems and what types of educational activities they most preferred.
MATERIALS AND METHODS
We conducted a time‐motion and survey study from June 25, 2005, to August 15, 2005, at Denver Health Medical Center, an academic public safety‐net hospital affiliated with the University of Colorado School of Medicine. All patients older than 18 years of age who spoke English or Spanish and were admitted to the general Internal Medicine service were candidates for enrollment. Exclusion criteria were being admitted to the intensive care unit, having an inability to communicate, being in contact precautions, and being previously enrolled. The study was approved by the Colorado Multiple Institutional Review Board. Written informed consent was obtained for all study participants.
At 8:00 AM, all patients admitted during the previous 15 hours were assigned a random number from a random number table and were approached for consent in numeric order. With 2 data collectors working daily, a maximum of 12 patients could be enrolled each day. Consenting subjects who passed a vision test were given the Test of Functional Health Literacy in Adults at the time of enrollment and a written questionnaire (in either English or Spanish) on a daily basis for a maximum of 6 days. Some of these patients also participated in a structured interview that was designed to elicit their views on health education topics and formats for education of hospitalized patients. Others, again determined by random number, were subjects of a time‐motion study.
Demographic data collected included age, sex, language, race, comorbidities, insurance status, and discharge diagnosis.
Time‐Motion Study
Patients were observed from 8:00 AM to noon and from 1:00 to 5:00 PM7 days a week. Data were collected using TimerPro on a Dell Axim A5 pocket PC and imported daily into an Excel spreadsheet. Observations were categorized as downtime, busy time, or provider time and subcategorized as summarized in Table 1.
| First level | Second level | Third level |
|---|---|---|
| Downtime | Alone | TV |
| Resting | ||
| Sleeping | ||
| Reading | ||
| Telephone | ||
| Other | ||
| Friends/family | TV | |
| Resting | ||
| Sleeping | ||
| Reading | ||
| Telephone/talk | ||
| Other | ||
| Provider | Physician | |
| Nurse | ||
| Physician and nurse | ||
| Physician and other | ||
| Other | ||
| Busy | ADL | |
| Meal | ||
| Out of room | ||
| Other |
Questionnaire
We were unable to find a validated questionnaire in the literature that was designed to assess patient opinion or level of interest in educational activities during a hospitalization. Accordingly, we developed our own using a 5‐point Likert scale (Box 1). Two outcomes researchers with expertise in using questionnaires for clinical research independently reviewed the questionnaire to establish face validity.
Box 1. Daily Questionnaire on In‐Hospital Health Education
The following statements were read to the patients on a daily basis and answered using the following scale: 1 = Strongly Disagree, 2 = Disagree, 3 = Neutral, 4 = Agree, 5 = Strongly Agree
I feel well enough today to learn about my illness or my health.
I want to learn more about my illness or my health today.
I have time to learn about my health today.
It is important to me to learn more about my illness or health while in the hospital.
Interview
All patients were asked the open‐ended questions listed in Box 2, and the entire interview was recorded on audiotape for subsequent analysis.
Box 2. Interview Questions with Probes for Educational Preferences
What things related to your health would you like to learn more about while you are in the hospital? (list up to three topics in order of impotance to you).
How can we help you learn more about your illness or health while in the hospital?
Who should do the teaching (eg, an MD, a nurse, a dietician, a medical student, peers, physical therapists, respiratory therapists)?
Who else should be present (eg, patients with similar illness, family, no one)?
How should this teaching be done (eg, didactic sessions, hands‐on, video tape, pre‐ and post‐testing)?
Data Analysis
All analyses were performed using SAS, version 9.1 (SAS Institute, Inc., Cary, NC). A P value < 0.05 was considered significant.
Time‐Motion Data
Mixed‐effects general linear models (growth curve or repeated measures), using SAS Proc Mixed, were used to test whether the proportions of downtime, busy time, and provider time differed by day of hospitalization. Linear growth curve models were used to test whether a linear trend was present. If not, repeated‐measures models were used to obtain estimates by day of hospitalization.
Questionnaire Data
Mixed‐effects general linear models (growth curve or repeated measures) were used to determine whether patient responses differed by day of hospitalization, as described above.
Interview Data
Tape recordings were reviewed in depth to code participant responses to the structured questions. We utilized the template style of analysis, coding segments of the interviews and identifying illustrative quotes whenever possible. Key patterns and themes were summarized along with specific patient preferences regarding topics of interest and learning opportunities while in the hospital and after discharge.
RESULTS
Patient selection is described in Figure 1, and patient demographics are summarized in Tables 2 and 3.
| Demographic | Time‐motion | Interview | Questionnaire |
|---|---|---|---|
| |||
| Study subjects | 13 | 15 | 125 |
| Sex | |||
| Male | 6 (46) | 7 (47) | 61 (49) |
| Female | 7 (54) | 8 (53) | 64 (51) |
| Age (years), median (IQR) | 47 (20) | 51 (20.5) | 51 (18) |
| Race/ethnicity | |||
| White, non‐Hispanic | 6 (46) | 5 (33) | 46 (37) |
| Black/African American | 3 (23) | 4 (27) | 27 (22) |
| American Indian | 0 (0) | 0 (0) | 1 (1) |
| Hispanic | 4 (31) | 6 (40) | 51 (41) |
| Primary language | |||
| English | 12 (92) | 14 (93) | 109 (87) |
| Spanish | 1 (8) | 1 (7) | 16 (13) |
| Health literacy* | |||
| Adequate | 3 (75) | 9 (82) | 60 (71) |
| Marginal | 1 (25) | 0 (0) | 6 (7) |
| Inadequate | 0 (0) | 2 (18) | 18 (22) |
| Insurance status | |||
| Self‐pay | 3 (23) | 1 (7) | 24 (19) |
| Medicaid | 1 (8) | 4 (27) | 19 (15) |
| Medicare | 3 (23) | 0 (0) | 2 (2) |
| Colorado Indigent Care Program | 3 (23) | 7 (47) | 51 (41) |
| Private | 2 (15) | 1 (7) | 5 (4) |
| Other | 1 (8) | 2 (14) | 24 (18) |
| Time‐motion | Interview | Questionnaire | |
|---|---|---|---|
| Study subjects (n) | 13 | 15 | 125 |
| Discharge diagnoses (selected) | |||
| Coronary artery disease (including angina) | 1 (8) | 2 (13) | 24 (19) |
| Congestive heart failure | 1 (8) | 1 (7) | 4 (3) |
| Upper gastrointestinal bleeding, gastritis, reflux | 2 (15) | 4 (27) | 14 (11) |
| Syncope | 2 (15) | 0 | 5 (4) |
| Acute renal failure | 0 | 0 | 5 (4) |
| Pancreatitis | 0 | 1 (7) | 6 (5) |
| Venous thromboembolism | 2 (15) | 1 (7) | 3 (2) |
| Chronic obstructive pulmonary disease | 0 | 0 | 4 (3) |
| Diabetic ketoacidosis | 1 (8) | 1 (7) | 3 (2) |
| Pyelonephritis | 0 | 0 | 5 (4) |
| Pneumonia | 2 (15) | 1 (7) | 5 (4) |
| Comorbidities | |||
| Diabetes | 5 (38) | 9 (60) | 41 (33) |
| Hypertension | 1 (8) | 9 (60) | 55 (44) |
| Dyslipidemia | 6 (46) | 2 (13) | 26 (21) |
| Tobacco | 5 (38) | 7 (47) | 55 (44) |
| Chronic obstructive pulmonary disease | 2 (15) | 4 (27) | 15 (12) |
| Congestive heart failure | 2 (15) | 2 (13) | 13 (10) |
| Coronary heart disease | 3 (23) | 3 (20) | 21 (17) |
Time‐Motion Study
Thirteen patients were studied. Of the 315 patient‐hours observed, 71% were categorized as downtime, 15% as provider time, and 14% as busy time. The proportion of downtime ranged from a low of 0.65 (SE 0.04) on hospital Day 2 to a high of 0.76 (SE 0.06) on hospital Day 4, but the differences in downtime proportions by day did not reach statistical significance (P = .65; Fig. 2). The lowest percentage of downtime observed in any patient on any day was 39%. The 125 hours of downtime observed consisted of 1317 separate blocks of time, 80% of which were less than 15 minutes in duration, 14% of which were 15 to 30 minutes in duration, and 6% of which exceeded 30 minutes in duration.
Thirty‐six full days of observation, defined as greater than 7 hours of observation in 1 day, were used to assess the amount of time spent with providers. Of the 60 minutes/day (IQR = 44) that patients spent with health care providers, 21 minutes/day (IQR = 34) was spent with phlebotomists, physical or occupational therapists, dieticians, or social workers, 25 minutes/day (IQR = 25) was spent with patients' nurses, and a median of only 9 minutes/day (IQR = 11) was spent with their physicians.
Questionnaire
A total of 311 questionnaires were administered to the 138 consenting participants. Irrespective of the day of testing, 79% to 97% strongly agreed or agreed with the 4 statements (Fig. 3). In response to the first statementI feel well enough to learnpatient scores increased steadily over the 6 days of hospitalization patients were surveyed (coefficient = 0.15, P = .004). On hospital day 1, the mean score was 3.85 (SE 0.08), and by day 6 the mean score had increased to 4.75 (SE 0.08) However, there was no significant change over time in patients' desire to learn, self‐perceived time available to learn, or importance placed on learning during their hospital stay.
Interview
Fifteen interviews were conducted. Representative comments are presented in Table 4. Responses generally indicated that the patients had anxieties and uncertainties about their health and safety after discharge. Most participants wanted to know more about the condition for which they had been hospitalized, including information pertaining to management, prevention, etiology, and prognosis of their disease. Diabetic patients asked for information on insulin dosing, nutrition, and the effect of the disease on their bodies.
| Theme | Sample quotes |
|---|---|
| Preferred topics | |
| Self‐management | I need to know what to do when I go home, how to take care of it. Medical peopledon't give enough information to the patient and patient's family so they can help themselves. You need to encourage patients to help themselves, take some responsibility for themselves. |
| Prevention of disease recurrence or progression | It's okay to tell people that they have something and give them medicine, but also tell them what they can do to prevent it or make it less painful. I've known about bronchitis for many years, but didn't know it would affect my heart. |
| What's happening to me? | Am I going to diehow long? |
| Just fix me | I came to the hospital to get fixed, not educated. I'm results‐oriented, not cause‐oriented. |
| Preferred learning methods | |
| One‐to‐one didactics with MDs | I'd like one‐to‐one time with someone who has the time to listen. One to one with doctors who can explain what can happen, what to take, what not to take. |
| Family involvement | Get the family involved so the family understands the limitations of the person, how medications affect them. To say a person has a heart condition is a very vague statement. If they [family] understand more, it's better. |
| Groups | A group of people with similar illnessI like groups where everyone listens. I'd participate in groups at the hospital but not at home. |
| Video | Hospital TV is not meeting my needs. |
| Printed material | A doctor or nurse tell me what's going on and then also handouts on dietary and nutrition. |
| Electronic learning | I learned a lot through the encyclopedia of family health care, and through Web sites |
Patients preferred to pick their own topics for education rather than having topics chosen for them. Patients also showed in interest in prevention. One diabetic patient wanted to know how to prevent her children from becoming diabetic, and a cardiac patient wanted education on heart disease prevention. Other recurrent themes included the desire to know what was causing their illness and information about prognosis.
Almost all the patients were interested in more than one type of learning experience. The most frequently cited preference was to have a doctor or other knowledgeable health care professional answer questions specific to their individual situation. Video and group learning were each mentioned by approximately half the participants. Most patients thought that having family present during educational discussions was important.
Video was the most frequently mentioned learning tool, and patients thought it would be useful to have this modality available in the hospital as well as the home. Two patients expressed interest in computerized learning (one of whom had used health Web sites before his hospitalization). Most patients wanted handouts or reading material in addition to other methods of communicating information. Although many patients said they felt comfortable discussing their problems in group settings, some did not.
DISCUSSION
The important findings of this study are that hospitalized patients have a substantial amount of time available for health education and a considerable willingness and interest in participating in health educational activities. We found that although there was a great deal of time available on all days of hospitalization studied, patients felt increasingly well enough to participate in educational activities through their hospital stay.
We are unaware of other studies that have attempted to quantify the amount of time hospitalized patients are available for educational activities or whether they feel capable of participating in these activities. McBride10 found that 95% of hospitalized patients supported a health‐promoting hospital and that almost 80% wanted to modify at least 1 aspect of their lifestyle. Martin and colleagues11 found that patient satisfaction was improved by a patient‐centered unit incorporating dedicated nursing staff to promote patient involvement and provide personalized care and education. Barber‐Parker9 suggested that high patient acuity, short durations of hospitalization, and lack of patient availability because of testing and treatment limited the opportunities that patients had for health education during their hospitalization. These conclusions were reached on the basis of surveys of nurses' perceptions, however, rather than on direct observations or assessments of patients' perceptions.
Our findings suggest that many types of patient educational approaches may be needed to achieve maximal effectiveness and that regardless of the specific approach employed, the focus should be on the primary reason for a patient's hospitalization, what the hospitalization meant, why it happened and what the patient can do to prevent hospitalization from occurring in the future.
Transitions in care have been identified as periods in which communication lapses occur and outcomes can be adversely affected.12 A recent study by Epstein and colleagues13 found that almost 12% of patients had new or worsening symptoms of disease within the first few days after discharge from the hospital and that 22% either did not pick up their medications or understand how to take them (consistent with the observations of Kerzman and colleagues).5 The most common action taken in response to these findings was nurse‐mediated patient education. Our study indicates there is potential for further educational processes in hospitals, which may improve the safety of transitions from a hospital setting to outpatient care.
Although many disease management programs have been studied in the outpatient setting,1417 very few have been extended into hospitals. Accordingly, hospitalists are ideally suited to develop and implement disease management programs in concert with outpatient efforts.18 Our study suggests there is an underutilized opportunity for hospital‐based physicians and other health care providers to work with patients at a time when they are uniquely focused on their own health and free from many of the time constraints of their normal lives.
Although JCAHO mandates that hospitalized patients receive education and training specific to the patient's needs and as appropriate to the care, treatment and services provided,19 there is a paucity of data describing the educational processes in US hospitals. Johansson and colleagues20 conducted a survey in a Finnish hospital where patient education is also mandated. Written materials were given to about 55% of the patients. Demonstration and practice were used with about one third, whereas the Internet and videotapes were used for fewer than 10%. Although patients underwent educational activities throughout their hospitalization, and most were satisfied with the process, Johansson and colleagues found that only 59% felt that what they knew about their care was sufficient, almost a third felt they did not know enough about the side effects of their medical care, and almost half felt they did not have sufficient input into what they were being taught.
Although we found a large amount of time that might be used for patient education during a hospitalization, this time was commonly limited to 15‐minute blocks, as has been noted previously.9 This observation implies that educational activities should be designed so they can be conducted over short periods and/or stopped for short periods when interruptions occur or that the processes of care during a hospitalization should be altered to create larger blocks of continuous time available for educational activities.
A number of issues could have biased our results. Only 66% of the patients who were approached to participate agreed to do so. Because those declining may have been sicker and because sicker patients may require more diagnostic testing or more invasive treatment, we may have overestimated both the amount of downtime available and the willingness of patients to participate in educational activities. If we assume, however, that all patients who refused to participate either disagreed or strongly disagreed with the statements in the questionnaire regarding their interest in educational activities, the fraction of patients agreeing or strongly agreeing with idea that they were well enough and interested would still be 57% to 75% of the population sampled. Accordingly, this potential bias, if it occurred, would not alter our conclusions.
The time‐motion studies were only performed between 8:00 AM and 5:00 PM, such that the resulting data do not reflect any diagnostic testing, therapeutic interventions, or contact with health care providers that occurred at other times. This may have contributed to the strikingly small amount of time that patients spent with their physicians and nurses. If patient time after 5:00 PM and before 8:00 AM had been observed and included, it is likely that the absolute amount of time spent with physicians and nurses would increase, whereas the overall proportion of patient time spent with providers would decrease.
We were also only able to collect data on 13 time‐motion subjects. This limited sample size from a single institution may not be representative of all hospitalized non‐ICU patients on general medical wards. Accordingly, we make no claims that our data can be generalized to the entire population of patients admitted to non‐ICU medical services. However, the results of our surveys, which sampled a much broader patient population and supported our time‐motion findings, suggest that our time‐motion findings are likely to be representative of significant underutilized time and motivation for patient education in the hospital setting.
Also, it is important to note that although the time‐motion studies were only done with 13 patients, these studies are extremely labor intensive and are rarely done with much larger samples. In addition, the SDs on the data collected from the time‐motion studies were quite small. It is possible that if a larger sample were studied, the percentage of free time might be larger or smaller than what we observed for the 13 patients we studied. However, it would be quite unlikely that the amount of free time would be so small (eg, 10%‐15%) that it would invalidate our conclusion that considerable time is available for patient education over and above what currently occurs in most hospital settings.
A patient's self‐perception of his or her ability to learn may not reflect that patient's true cognitive readiness to do so. JCAHO requirements mandate that nurses be trained to assess patients for their ability to learn and to do so as part of the admission process. After reviewing all day 1 patient responses to our questionnaires, in no instance did a nurse assess a patient as having a barrier to learning when the patient had reported feeling well enough to learn. Accordingly, although we performed no direct tests of patients' ability to learn, this retrospective independent assessment did not suggest that patients systematically overestimated their ability to learn.
Finding that hospitalized patients are unoccupied for approximately 70% of their daytime hours and that most patients are both highly motivated to learn and have few barriers to doing so indicates that educational activities during hospitalizations have substantial potential for expansion. The current structure for educating hospitalized patients should be supplemented to take these findings into account.
Acknowledgements
We thank Dr. John Steiner and Dr. Sheena Bull for their assistance in study design as well as the development of the questionnaire and interview tools. We also thank Carolyn Nowels for her assistance with the qualitative data analysis. The assistance of Dr. Bull and Dr. Steiner was made possible through NHLBI grant U01HL079160, and funding for data collection was made possible by the University of Colorado at Denver and Health Sciences Center Department of Medicine, Division of General Internal Medicine small grants program.
- ,.Randomized controlled trial of smoking cessation intervention after admission for coronary heart disease.BMJ.2003;327:1254–1257.
- .Treatment of tobacco use and dependence.N Engl J Med.2002;346:506–512.
- ,, et al.A clinical practice guideline for treating tobacco use and dependence: a US Public Health Service report.JAMA.2000;283:3244–3254.
- ,,, et al.National Institutes of Health state‐of‐the science conference statement: tobacco use: prevention, cessation and control.Ann Intern Med.2006;145:839–844.
- ,,.What do discharged patients know about their medications?Patient Educ Couns.2005;56:276–282.
- Joint Commission on Accreditation of Healthcare Organizations.A Comprehensive Review for the Development and Testing for National Implementation of Hospital Core Measures.2006:1–40.
- .ACC/AHA 2005 guideline update for the diagnosis and management of chronic heart failure in the adult: a report of the American College of Cardiology/ American Heart Association task force on practice guidelines.J Am Coll Cardiol.2005;46:1–82.
- JCAHO data. Available: https://cimprod.uhc.edu/CoreMeasures/Products/DownloadSystem/WebPages/ViewReportsDownloadList.aspx.
- .Integrating patient teaching into bedside patient care: a participant‐observation study of hospital nurses.Patient Educ Couns.2002;48:107–113.
- .Health promotion in the acute hospital setting: the receptivity of adult in‐patients.Patient Educ Couns.2004;54:73–78.
- ,,,,,.Randomized trial of a patient‐centered hospital unit.Patient Educ Couns.1998;34:125–133.
- ,,,,,.Deficits in communication and information transfer between hospital‐based and primary care physicians: implications for patient safety and continuity of care. HYPERLINK “javascript:AL_get(this,%20'jour',%20'JAMA.');”JAMA.2007;297:831–841.
- ,,,,.Frequency of new or worsening symptoms in the posthospitalization period.J Hosp Med.2007;2:58–68.
- ,,,.Patient self‐management of chronic disease in primary care.JAMA.2002;288:2469–2475.
- ,,.Effectiveness of self‐management training in type 2 diabetes.Diabetes Care.2001;24:561–587.
- ,,.Quality of life assessment after patient education a randomized controlled study on asthma and chronic obstructive pulmonary disease.Am J Respir Crit Care Med.2001;95:56–63.
- ,.The effects of a health educational and exercise program for older adults with osteoarthritis for the hip or knee.J Rheumatol.1997;24:1378–1383.
- ,,,.Expanding the roles of hospitalist physicians to include public health.J Hosp Med.2007;2:93–101.
- The Joint Commission on Accreditation of Healthcare Organizations Comprehensive Accreditation Manual for Hospitals: The Official Handbook. January2007. p.152
- ,,,.Need for change in patient education: a Finnish survey from the patient's perspective.Patient Educ Couns.2003;51:239–245.
Copyright © 2008 Society of Hospital Medicine