User login
Update in Hospital Medicine: Practical Lessons from the Literature
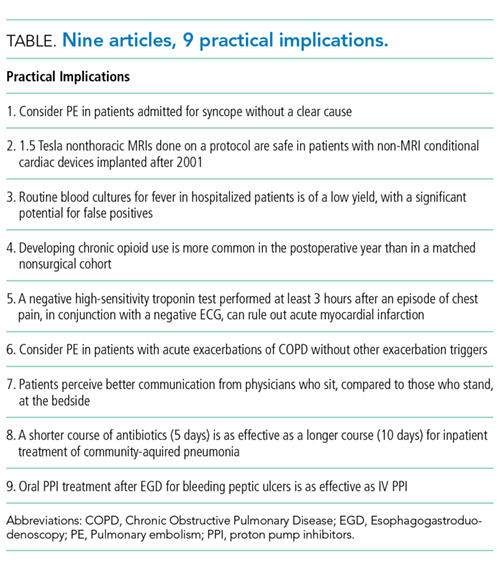
ESSENTIAL PUBLICATIONS
Prevalence of Pulmonary Embolism among Patients Hospitalized for Syncope. Prandoni P et al. New England Journal of Medicine, 2016;375(16):1524-31.1
Background
Pulmonary embolism (PE), a potentially fatal disease, is rarely considered as a likely cause of syncope. To determine the prevalence of PE among patients presenting with their first episode of syncope, the authors performed a systematic workup for pulmonary embolism in adult patients admitted for syncope at 11 hospitals in Italy.
Findings
Of the 2584 patients who presented to the emergency department (ED) with syncope during the study, 560 patients were admitted and met the inclusion criteria. A modified Wells Score was applied, and a D-dimer was measured on every hospitalized patient. Those with a high pretest probability, a Wells Score of 4.0 or higher, or a positive D-dimer underwent further testing for pulmonary embolism by a CT scan, a ventilation perfusion scan, or an autopsy. Ninety-seven of the 560 patients admitted to the hospital for syncope were found to have a PE (17%). One in
Cautions
Nearly 72% of the patients with common explanations for syncope, such as vasovagal, drug-induced, or volume depletion, were discharged from the ED and not included in the study. The authors focused on the prevalence of PE. The causation between PE and syncope is not clear in each of the patients. Of the patients’ diagnosis by a CT, only 67% of the PEs were found to be in a main pulmonary artery or lobar artery. The other 33% were segmental or subsegmental. Of those diagnosed by a ventilation perfusion scan, 50% of the patients had 25% or more of the area of both lungs involved. The other 50% involved less than 25% of the area of both lungs. Also, it is important to note that 75% of the patients admitted to the hospital in this study were 70 years of age or older.
Implications
After common diagnoses are ruled out, it is important to consider pulmonary embolism in patients hospitalized with syncope. Providers should calculate a Wells Score and measure a D-dimer to guide the decision making.
Assessing the Risks Associated with MRI in Patients with a Pacemaker or Defibrillator. Russo RJ et al. New England Journal of Medicine, 2017;376(8):755-64.2
Background
Magnetic resonance imaging (MRI) in patients with implantable cardiac devices is considered a safety risk due to the potential of cardiac lead heating and subsequent myocardial injury or alterations of the pacing properties. Although manufacturers have developed “MRI-conditional” devices designed to reduce these risks, still 2 million people in the United States and 6 million people worldwide have “non–MRI-conditional” devices. The authors evaluated the event rates in patients with “non-MRI-conditional” devices undergoing an MRI.
Findings
The authors prospectively followed up 1500 adults with cardiac devices placed since 2001 who received nonthoracic MRIs according to a specific protocol available in the supplemental materials published with this article in the New England Journal of Medicine. Of the 1000 patients with pacemakers only, they observed 5 atrial arrhythmias and 6 electrical resets. Of the 500 patients with implantable cardioverter defibrillators (ICDs), they observed 1 atrial arrhythmia and 1 generator failure (although this case had deviated from the protocol). All of the atrial arrhythmias were self-terminating. No deaths, lead failure requiring an immediate replacement, a loss of capture, or ventricular arrhythmias were observed.
Cautions
Patients who were pacing dependent were excluded. No devices implanted before 2001 were included in the study, and the MRIs performed were only 1.5 Tesla (a lower field strength than the also available 3 Tesla MRIs).
Implications
It is safe to proceed with 1.5 Tesla nonthoracic MRIs in patients, following the protocol outlined in this article, with non–MRI conditional cardiac devices implanted since 2001.
Culture If Spikes? Indications and Yield of Blood Cultures in Hospitalized Medical Patients. Linsenmeyer K et al. Journal of Hospital Medicine, 2016;11(5):336-40.3
Background
Blood cultures are frequently drawn for the evaluation of an inpatient fever. This “culture if spikes” approach may lead to unnecessary testing and false positive results. In this study, the authors evaluated rates of true positive and false positive blood cultures in the setting of an inpatient fever.
Findings
The patients hospitalized on the general medicine or cardiology floors at a Veterans Affairs teaching hospital were prospectively followed over 7 months. A total of 576 blood cultures were ordered among 323 unique patients. The patients were older (average age of 70 years) and predominantly male (94%). The true-positive rate for cultures, determined by a consensus among the microbiology and infectious disease departments based on a review of clinical and laboratory data, was 3.6% compared with a false-positive rate of 2.3%. The clinical characteristics associated with a higher likelihood of a true positive included: the indication for a culture as a follow-up from a previous culture (likelihood ratio [LR] 3.4), a working diagnosis of bacteremia or endocarditis (LR 3.7), and the constellation of fever and leukocytosis in a patient who has not been on antibiotics (LR 5.6).
Cautions
This study was performed at a single center with patients in the medicine and cardiology services, and thus, the data is representative of clinical practice patterns specific to that site.
Implications
Reflexive ordering of blood cultures for inpatient fever is of a low yield with a false-positive rate that approximates the true positive rate. A large number of patients are tested unnecessarily, and for those with positive tests, physicians are as likely to be misled as they are certain to truly identify a pathogen. The positive predictive value of blood cultures is improved when drawn on patients who are not on antibiotics and when the patient has a specific diagnosis, such as pneumonia, previous bacteremia, or suspected endocarditis.
Incidence of and Risk Factors for Chronic Opioid Use among Opioid-Naive Patients in the Postoperative Period. Sun EC et al. JAMA Internal Medicine, 2016;176(9):1286-93.4
Background
Each day in the United States, 650,000 opioid prescriptions are filled, and 78 people suffer an opiate-related death. Opioids are frequently prescribed for inpatient management of postoperative pain. In this study, authors compared the development of chronic opioid use between patients who had undergone surgery and those who had not.
Findings
This was a retrospective analysis of a nationwide insurance claims database. A total of 641,941 opioid-naive patients underwent 1 of 11 designated surgeries in the study period and were compared with 18,011,137 opioid-naive patients who did not undergo surgery. Chronic opioid use was defined as the filling of 10 or more prescriptions or receiving more than a 120-day supply between 90 and 365 days postoperatively (or following the assigned faux surgical date in those not having surgery). This was observed in a small proportion of the surgical patients (less than 0.5%). However, several procedures were associated with the increased odds of postoperative chronic opioid use, including a simple mastectomy (Odds ratio [OR] 2.65), a cesarean delivery (OR 1.28), an open appendectomy (OR 1.69), an open and laparoscopic cholecystectomy (ORs 3.60 and 1.62, respectively), and a total hip and total knee arthroplasty (ORs 2.52 and 5.10, respectively). Also, male sex, age greater than 50 years, preoperative benzodiazepines or antidepressants, and a history of drug abuse were associated with increased odds.
Cautions
This study was limited by the claims-based data and that the nonsurgical population was inherently different from the surgical population in ways that could lead to confounding.
Implications
In perioperative care, there is a need to focus on multimodal approaches to pain and to implement opioid reducing and sparing strategies that might include options such as acetaminophen, NSAIDs, neuropathic pain medications, and Lidocaine patches. Moreover, at discharge, careful consideration should be given to the quantity and duration of the postoperative opioids.
Rapid Rule-out of Acute Myocardial Infarction with a Single High-Sensitivity Cardiac Troponin T Measurement below the Limit of Detection: A Collaborative Meta-Analysis. Pickering JW et al. Annals of Internal Medicine, 2017;166:715-24.5
Background
High-sensitivity cardiac troponin testing (hs-cTnT) is now available in the United States. Studies have found that these can play a significant role in a rapid rule-out of acute myocardial infarction (AMI).
Findings
In this meta-analysis, the authors identified 11 studies with 9241 participants that prospectively evaluated patients presenting to the emergency department (ED) with chest pain, underwent an ECG, and had hs-cTnT drawn. A total of 30% of the patients were classified as low risk with negative hs-cTnT and negative ECG (defined as no ST changes or T-wave inversions indicative of ischemia). Among the low risk patients, only 14 of the 2825 (0.5%) had AMI according to the Global Task Forces definition.6 Seven of these were in patients with hs-cTnT drawn within 3 hours of a chest pain onset. The pooled negative predictive value was 99.0% (CI 93.8%–99.8%).
Cautions
The heterogeneity between the studies in this meta-analysis, especially in the exclusion criteria, warrants careful consideration when being implemented in new settings. A more sensitive test will result in more positive troponins due to different limits of detection. Thus, medical teams and institutions need to plan accordingly. Caution should be taken for any patient presenting within 3 hours of a chest pain onset.
Implications
Rapid rule-out protocols—which include clinical evaluation, a negative ECG, and a negative high-sensitivity cardiac troponin—identify a large proportion of low-risk patients who are unlikely to have a true AMI.
Prevalence and Localization of Pulmonary Embolism in Unexplained Acute Exacerbations of COPD: A Systematic Review and Meta-analysis. Aleva FE et al. Chest, 2017;151(3):544-54.7
Background
Acute exacerbations of chronic obstructive pulmonary disease (AE-COPD) are frequent. In up to 30%, no clear trigger is found. Previous studies suggested that 1 in 4 of these patients may have a pulmonary embolus (PE).7 This study reviewed the literature and meta-data to describe the prevalence, the embolism location, and the clinical predictors of PE among patients with unexplained AE-COPD.
Findings
A systematic review of the literature and meta-analysis identified 7 studies with 880 patients. In the pooled analysis, 16% had PE (range: 3%–29%). Of the 120 patients with PE, two-thirds were in lobar or larger arteries and one-third in segmental or smaller. Pleuritic chest pain and signs of cardiac compromise (hypotension, syncope, and right-sided heart failure) were associated with PE.
Cautions
This study was heterogeneous leading to a broad confidence interval for prevalence ranging from 8%–25%. Given the frequency of AE-COPD with no identified trigger, physicians need to attend to risks of repeat radiation exposure when considering an evaluation for PE.
Implications
One in 6 patients with unexplained AE-COPD was found to have PE; the odds were greater in those with pleuritic chest pain or signs of cardiac compromise. In patients with AE-COPD with an unclear trigger, the providers should consider an evaluation for PE by using a clinical prediction rule and/or a D-dimer.
Sitting at Patients’ Bedsides May Improve Patients’ Perceptions of Physician Communication Skills. Merel SE et al. Journal of Hospital Medicine, 2016;11(12):865-8.9
Background
Sitting at a patient’s bedside in the inpatient setting is considered a best practice, yet it has not been widely adopted. The authors conducted a cluster-randomized trial of physicians on a single 28-bed hospitalist only run unit where physicians were assigned to sitting or standing for the first 3 days of a 7-day workweek assignment. New admissions or transfers to the unit were considered eligible for the study.
Findings
Sixteen hospitalists saw on an average 13 patients daily during the study (a total of 159 patients were included in the analysis after 52 patients were excluded or declined to participate). The hospitalists were 69% female, and 81% had been in practice 3 years or less. The average time spent in the patient’s room was 12:00 minutes while seated and 12:10 minutes while standing. There was no difference in the patients’ perception of the amount of time spent—the patients overestimated this by 4 minutes in both groups. Sitting was associated with higher ratings for “listening carefully” and “explaining things in a way that was easy to understand.” There was no difference in ratings on the physicians interrupting the patient when talking or in treating patients with courtesy and respect.
Cautions
The study had a small sample size, was limited to English-speaking patients, and was a single-site study. It involved only attending-level physicians and did not involve nonphysician team members. The physicians were not blinded and were aware that the interactions were monitored, perhaps creating a Hawthorne effect. The analysis did not control for other factors such as the severity of the illness, the number of consultants used, or the degree of health literacy.
Implications
This study supports an important best practice highlighted in etiquette-based medicine 10: sitting at the bedside provided a benefit in the patient’s perception of communication by physicians without a negative effect on the physician’s workflow.
The Duration of Antibiotic Treatment in Community-Acquired Pneumonia: A Multi-Center Randomized Clinical Trial. Uranga A et al. JAMA Intern Medicine, 2016;176(9):1257-65.11
Background
The optimal duration of treatment for community-acquired pneumonia (CAP) is unclear; a growing body of evidence suggests shorter and longer durations may be equivalent.
Findings
At 4 hospitals in Spain, 312 adults with a mean age of 65 years and a diagnosis of CAP (non-ICU) were randomized to a short (5 days) versus a long (provider discretion) course of antibiotics. In the short-course group, the antibiotics were stopped after 5 days if the body temperature had been 37.8o C or less for 48 hours, and no more than 1 sign of clinical instability was present (SBP < 90 mmHg, HR >100/min, RR > 24/min, O2Sat < 90%). The median number of antibiotic days was 5 for the short-course group and 10 for the long-course group (P < .01). There was no difference in the resolution of pneumonia symptoms at 10 days or 30 days or in 30-day mortality. There were no differences in in-hospital side effects. However, 30-day readmissions were higher in the long-course group compared with the short-course group (6.6% vs 1.4%; P = .02). The results were similar across all of the Pneumonia Severity Index (PSI) classes.
Cautions
Most of the patients were not severely ill (~60% PSI I-III), the level of comorbid disease was low, and nearly 80% of the patients received fluoroquinolone. There was a significant cross over with 30% of patients assigned to the short-course group receiving antibiotics for more than 5 days.
Implications
Inpatient providers should aim to treat patients with community-acquired pneumonia (regardless of the severity of the illness) for 5 days. At day 5, if the patient is afebrile and has no signs of clinical instability, clinicians should be comfortable stopping antibiotics.
Is the Era of Intravenous Proton Pump Inhibitors Coming to an End in Patients with Bleeding Peptic Ulcers? A Meta-Analysis of the Published Literature. Jian Z et al. British Journal of Clinical Pharmacology, 2016;82(3):880-9.12
Background
Guidelines recommend intravenous proton pump inhibitors (PPI) after an endoscopy for patients with a bleeding peptic ulcer. Yet, acid suppression with oral PPI is deemed equivalent to the intravenous route.
Findings
This systematic review and meta-analysis identified 7 randomized controlled trials involving 859 patients. After an endoscopy, the patients were randomized to receive either oral or intravenous PPI. Most of the patients had “high-risk” peptic ulcers (active bleeding, a visible vessel, an adherent clot). The PPI dose and frequency varied between the studies. Re-bleeding rates were no different between the oral and intravenous route at 72 hours (2.4% vs 5.1%; P = .26), 7 days (5.6% vs 6.8%; P =.68), or 30 days (7.9% vs 8.8%; P = .62). There was also no difference in 30-day mortality (2.1% vs 2.4%; P = .88), and the length of stay was the same in both groups. Side effects were not reported.
Cautions
This systematic review and meta-analysis included multiple heterogeneous small studies of moderate quality. A large number of patients were excluded, increasing the risk of a selection bias.
Implications
There is no clear indication for intravenous PPI in the treatment of bleeding peptic ulcers following an endoscopy. Converting to oral PPI is equivalent to intravenous and is a safe, effective, and cost-saving option for patients with bleeding peptic ulcers.
1. Prandoni P, Lensing AW, Prins MH, et al. Prevalence of pulmonary embolism among patients hospitalized for syncope. N Engl J Med. 2016; 375(16):1524-1531. PubMed
2. Russo RJ, Costa HS, Silva PD, et al. Assessing the risks associated with MRI in patients with a pacemaker or defibrillator. N Engl J Med. 2017;376(8):755-764. PubMed
3. Linsenmeyer K, Gupta K, Strymish JM, Dhanani M, Brecher SM, Breu AC. Culture if spikes? Indications and yield of blood cultures in hospitalized medical patients. J Hosp Med. 2016;11(5):336-340. PubMed
4. Sun EC, Darnall BD, Baker LC, Mackey S. Incidence of and risk factors for chronic opioid use among opioid-naive patients in the postoperative period. JAMA Intern Med. 2016;176(9):1286-1293. PubMed
5. Pickering JW, Than MP, Cullen L, et al. Rapid rule-out of acute myocardial infarction with a single high-sensitivity cardiac troponin T measurement below the limit of detection: A collaborative meta-analysis. Ann Intern Med. 2017;166(10):715-724. PubMed
6. Thygesen K, Alpert JS, White HD, Jaffe AS, Apple FS, Galvani M, et al; Joint ESC/ACCF/AHA/WHF Task Force for the Redefinition of Myocardial Infarction. Universal definition of myocardial infarction. Circulation. 2007;116:2634-2653. PubMed
7. Aleva FE, Voets LWLM, Simons SO, de Mast Q, van der Ven AJAM, Heijdra YF. Prevalence and localization of pulmonary embolism in unexplained acute exacerbations of COPD: A systematic review and meta-analysis. Chest. 2017; 151(3):544-554. PubMed
8. Rizkallah J, Man SFP, Sin DD. Prevalence of pulmonary embolism in acute exacerbations of COPD: A systematic review and meta-analysis. Chest. 2009;135(3):786-793. PubMed
9. Merel SE, McKinney CM, Ufkes P, Kwan AC, White AA. Sitting at patients’ bedsides may improve patients’ perceptions of physician communication skills. J Hosp Med. 2016;11(12):865-868. PubMed
10. Kahn MW. Etiquette-based medicine. N Engl J Med. 2008;358(19):1988-1989. PubMed
11. Uranga A, España PP, Bilbao A, et al. Duration of antibiotic treatment in community-acquired pneumonia: A multicenter randomized clinical trial. JAMA Intern Med. 2016;176(9):1257-1265. PubMed
12. Jian Z, Li H, Race NS, Ma T, Jin H, Yin Z. Is the era of intravenous proton pump inhibitors coming to an end in patients with bleeding peptic ulcers? Meta-analysis of the published literature. Br J Clin Pharmacol. 2016;82(3):880-889. PubMed
ESSENTIAL PUBLICATIONS
Prevalence of Pulmonary Embolism among Patients Hospitalized for Syncope. Prandoni P et al. New England Journal of Medicine, 2016;375(16):1524-31.1
Background
Pulmonary embolism (PE), a potentially fatal disease, is rarely considered as a likely cause of syncope. To determine the prevalence of PE among patients presenting with their first episode of syncope, the authors performed a systematic workup for pulmonary embolism in adult patients admitted for syncope at 11 hospitals in Italy.
Findings
Of the 2584 patients who presented to the emergency department (ED) with syncope during the study, 560 patients were admitted and met the inclusion criteria. A modified Wells Score was applied, and a D-dimer was measured on every hospitalized patient. Those with a high pretest probability, a Wells Score of 4.0 or higher, or a positive D-dimer underwent further testing for pulmonary embolism by a CT scan, a ventilation perfusion scan, or an autopsy. Ninety-seven of the 560 patients admitted to the hospital for syncope were found to have a PE (17%). One in
Cautions
Nearly 72% of the patients with common explanations for syncope, such as vasovagal, drug-induced, or volume depletion, were discharged from the ED and not included in the study. The authors focused on the prevalence of PE. The causation between PE and syncope is not clear in each of the patients. Of the patients’ diagnosis by a CT, only 67% of the PEs were found to be in a main pulmonary artery or lobar artery. The other 33% were segmental or subsegmental. Of those diagnosed by a ventilation perfusion scan, 50% of the patients had 25% or more of the area of both lungs involved. The other 50% involved less than 25% of the area of both lungs. Also, it is important to note that 75% of the patients admitted to the hospital in this study were 70 years of age or older.
Implications
After common diagnoses are ruled out, it is important to consider pulmonary embolism in patients hospitalized with syncope. Providers should calculate a Wells Score and measure a D-dimer to guide the decision making.
Assessing the Risks Associated with MRI in Patients with a Pacemaker or Defibrillator. Russo RJ et al. New England Journal of Medicine, 2017;376(8):755-64.2
Background
Magnetic resonance imaging (MRI) in patients with implantable cardiac devices is considered a safety risk due to the potential of cardiac lead heating and subsequent myocardial injury or alterations of the pacing properties. Although manufacturers have developed “MRI-conditional” devices designed to reduce these risks, still 2 million people in the United States and 6 million people worldwide have “non–MRI-conditional” devices. The authors evaluated the event rates in patients with “non-MRI-conditional” devices undergoing an MRI.
Findings
The authors prospectively followed up 1500 adults with cardiac devices placed since 2001 who received nonthoracic MRIs according to a specific protocol available in the supplemental materials published with this article in the New England Journal of Medicine. Of the 1000 patients with pacemakers only, they observed 5 atrial arrhythmias and 6 electrical resets. Of the 500 patients with implantable cardioverter defibrillators (ICDs), they observed 1 atrial arrhythmia and 1 generator failure (although this case had deviated from the protocol). All of the atrial arrhythmias were self-terminating. No deaths, lead failure requiring an immediate replacement, a loss of capture, or ventricular arrhythmias were observed.
Cautions
Patients who were pacing dependent were excluded. No devices implanted before 2001 were included in the study, and the MRIs performed were only 1.5 Tesla (a lower field strength than the also available 3 Tesla MRIs).
Implications
It is safe to proceed with 1.5 Tesla nonthoracic MRIs in patients, following the protocol outlined in this article, with non–MRI conditional cardiac devices implanted since 2001.
Culture If Spikes? Indications and Yield of Blood Cultures in Hospitalized Medical Patients. Linsenmeyer K et al. Journal of Hospital Medicine, 2016;11(5):336-40.3
Background
Blood cultures are frequently drawn for the evaluation of an inpatient fever. This “culture if spikes” approach may lead to unnecessary testing and false positive results. In this study, the authors evaluated rates of true positive and false positive blood cultures in the setting of an inpatient fever.
Findings
The patients hospitalized on the general medicine or cardiology floors at a Veterans Affairs teaching hospital were prospectively followed over 7 months. A total of 576 blood cultures were ordered among 323 unique patients. The patients were older (average age of 70 years) and predominantly male (94%). The true-positive rate for cultures, determined by a consensus among the microbiology and infectious disease departments based on a review of clinical and laboratory data, was 3.6% compared with a false-positive rate of 2.3%. The clinical characteristics associated with a higher likelihood of a true positive included: the indication for a culture as a follow-up from a previous culture (likelihood ratio [LR] 3.4), a working diagnosis of bacteremia or endocarditis (LR 3.7), and the constellation of fever and leukocytosis in a patient who has not been on antibiotics (LR 5.6).
Cautions
This study was performed at a single center with patients in the medicine and cardiology services, and thus, the data is representative of clinical practice patterns specific to that site.
Implications
Reflexive ordering of blood cultures for inpatient fever is of a low yield with a false-positive rate that approximates the true positive rate. A large number of patients are tested unnecessarily, and for those with positive tests, physicians are as likely to be misled as they are certain to truly identify a pathogen. The positive predictive value of blood cultures is improved when drawn on patients who are not on antibiotics and when the patient has a specific diagnosis, such as pneumonia, previous bacteremia, or suspected endocarditis.
Incidence of and Risk Factors for Chronic Opioid Use among Opioid-Naive Patients in the Postoperative Period. Sun EC et al. JAMA Internal Medicine, 2016;176(9):1286-93.4
Background
Each day in the United States, 650,000 opioid prescriptions are filled, and 78 people suffer an opiate-related death. Opioids are frequently prescribed for inpatient management of postoperative pain. In this study, authors compared the development of chronic opioid use between patients who had undergone surgery and those who had not.
Findings
This was a retrospective analysis of a nationwide insurance claims database. A total of 641,941 opioid-naive patients underwent 1 of 11 designated surgeries in the study period and were compared with 18,011,137 opioid-naive patients who did not undergo surgery. Chronic opioid use was defined as the filling of 10 or more prescriptions or receiving more than a 120-day supply between 90 and 365 days postoperatively (or following the assigned faux surgical date in those not having surgery). This was observed in a small proportion of the surgical patients (less than 0.5%). However, several procedures were associated with the increased odds of postoperative chronic opioid use, including a simple mastectomy (Odds ratio [OR] 2.65), a cesarean delivery (OR 1.28), an open appendectomy (OR 1.69), an open and laparoscopic cholecystectomy (ORs 3.60 and 1.62, respectively), and a total hip and total knee arthroplasty (ORs 2.52 and 5.10, respectively). Also, male sex, age greater than 50 years, preoperative benzodiazepines or antidepressants, and a history of drug abuse were associated with increased odds.
Cautions
This study was limited by the claims-based data and that the nonsurgical population was inherently different from the surgical population in ways that could lead to confounding.
Implications
In perioperative care, there is a need to focus on multimodal approaches to pain and to implement opioid reducing and sparing strategies that might include options such as acetaminophen, NSAIDs, neuropathic pain medications, and Lidocaine patches. Moreover, at discharge, careful consideration should be given to the quantity and duration of the postoperative opioids.
Rapid Rule-out of Acute Myocardial Infarction with a Single High-Sensitivity Cardiac Troponin T Measurement below the Limit of Detection: A Collaborative Meta-Analysis. Pickering JW et al. Annals of Internal Medicine, 2017;166:715-24.5
Background
High-sensitivity cardiac troponin testing (hs-cTnT) is now available in the United States. Studies have found that these can play a significant role in a rapid rule-out of acute myocardial infarction (AMI).
Findings
In this meta-analysis, the authors identified 11 studies with 9241 participants that prospectively evaluated patients presenting to the emergency department (ED) with chest pain, underwent an ECG, and had hs-cTnT drawn. A total of 30% of the patients were classified as low risk with negative hs-cTnT and negative ECG (defined as no ST changes or T-wave inversions indicative of ischemia). Among the low risk patients, only 14 of the 2825 (0.5%) had AMI according to the Global Task Forces definition.6 Seven of these were in patients with hs-cTnT drawn within 3 hours of a chest pain onset. The pooled negative predictive value was 99.0% (CI 93.8%–99.8%).
Cautions
The heterogeneity between the studies in this meta-analysis, especially in the exclusion criteria, warrants careful consideration when being implemented in new settings. A more sensitive test will result in more positive troponins due to different limits of detection. Thus, medical teams and institutions need to plan accordingly. Caution should be taken for any patient presenting within 3 hours of a chest pain onset.
Implications
Rapid rule-out protocols—which include clinical evaluation, a negative ECG, and a negative high-sensitivity cardiac troponin—identify a large proportion of low-risk patients who are unlikely to have a true AMI.
Prevalence and Localization of Pulmonary Embolism in Unexplained Acute Exacerbations of COPD: A Systematic Review and Meta-analysis. Aleva FE et al. Chest, 2017;151(3):544-54.7
Background
Acute exacerbations of chronic obstructive pulmonary disease (AE-COPD) are frequent. In up to 30%, no clear trigger is found. Previous studies suggested that 1 in 4 of these patients may have a pulmonary embolus (PE).7 This study reviewed the literature and meta-data to describe the prevalence, the embolism location, and the clinical predictors of PE among patients with unexplained AE-COPD.
Findings
A systematic review of the literature and meta-analysis identified 7 studies with 880 patients. In the pooled analysis, 16% had PE (range: 3%–29%). Of the 120 patients with PE, two-thirds were in lobar or larger arteries and one-third in segmental or smaller. Pleuritic chest pain and signs of cardiac compromise (hypotension, syncope, and right-sided heart failure) were associated with PE.
Cautions
This study was heterogeneous leading to a broad confidence interval for prevalence ranging from 8%–25%. Given the frequency of AE-COPD with no identified trigger, physicians need to attend to risks of repeat radiation exposure when considering an evaluation for PE.
Implications
One in 6 patients with unexplained AE-COPD was found to have PE; the odds were greater in those with pleuritic chest pain or signs of cardiac compromise. In patients with AE-COPD with an unclear trigger, the providers should consider an evaluation for PE by using a clinical prediction rule and/or a D-dimer.
Sitting at Patients’ Bedsides May Improve Patients’ Perceptions of Physician Communication Skills. Merel SE et al. Journal of Hospital Medicine, 2016;11(12):865-8.9
Background
Sitting at a patient’s bedside in the inpatient setting is considered a best practice, yet it has not been widely adopted. The authors conducted a cluster-randomized trial of physicians on a single 28-bed hospitalist only run unit where physicians were assigned to sitting or standing for the first 3 days of a 7-day workweek assignment. New admissions or transfers to the unit were considered eligible for the study.
Findings
Sixteen hospitalists saw on an average 13 patients daily during the study (a total of 159 patients were included in the analysis after 52 patients were excluded or declined to participate). The hospitalists were 69% female, and 81% had been in practice 3 years or less. The average time spent in the patient’s room was 12:00 minutes while seated and 12:10 minutes while standing. There was no difference in the patients’ perception of the amount of time spent—the patients overestimated this by 4 minutes in both groups. Sitting was associated with higher ratings for “listening carefully” and “explaining things in a way that was easy to understand.” There was no difference in ratings on the physicians interrupting the patient when talking or in treating patients with courtesy and respect.
Cautions
The study had a small sample size, was limited to English-speaking patients, and was a single-site study. It involved only attending-level physicians and did not involve nonphysician team members. The physicians were not blinded and were aware that the interactions were monitored, perhaps creating a Hawthorne effect. The analysis did not control for other factors such as the severity of the illness, the number of consultants used, or the degree of health literacy.
Implications
This study supports an important best practice highlighted in etiquette-based medicine 10: sitting at the bedside provided a benefit in the patient’s perception of communication by physicians without a negative effect on the physician’s workflow.
The Duration of Antibiotic Treatment in Community-Acquired Pneumonia: A Multi-Center Randomized Clinical Trial. Uranga A et al. JAMA Intern Medicine, 2016;176(9):1257-65.11
Background
The optimal duration of treatment for community-acquired pneumonia (CAP) is unclear; a growing body of evidence suggests shorter and longer durations may be equivalent.
Findings
At 4 hospitals in Spain, 312 adults with a mean age of 65 years and a diagnosis of CAP (non-ICU) were randomized to a short (5 days) versus a long (provider discretion) course of antibiotics. In the short-course group, the antibiotics were stopped after 5 days if the body temperature had been 37.8o C or less for 48 hours, and no more than 1 sign of clinical instability was present (SBP < 90 mmHg, HR >100/min, RR > 24/min, O2Sat < 90%). The median number of antibiotic days was 5 for the short-course group and 10 for the long-course group (P < .01). There was no difference in the resolution of pneumonia symptoms at 10 days or 30 days or in 30-day mortality. There were no differences in in-hospital side effects. However, 30-day readmissions were higher in the long-course group compared with the short-course group (6.6% vs 1.4%; P = .02). The results were similar across all of the Pneumonia Severity Index (PSI) classes.
Cautions
Most of the patients were not severely ill (~60% PSI I-III), the level of comorbid disease was low, and nearly 80% of the patients received fluoroquinolone. There was a significant cross over with 30% of patients assigned to the short-course group receiving antibiotics for more than 5 days.
Implications
Inpatient providers should aim to treat patients with community-acquired pneumonia (regardless of the severity of the illness) for 5 days. At day 5, if the patient is afebrile and has no signs of clinical instability, clinicians should be comfortable stopping antibiotics.
Is the Era of Intravenous Proton Pump Inhibitors Coming to an End in Patients with Bleeding Peptic Ulcers? A Meta-Analysis of the Published Literature. Jian Z et al. British Journal of Clinical Pharmacology, 2016;82(3):880-9.12
Background
Guidelines recommend intravenous proton pump inhibitors (PPI) after an endoscopy for patients with a bleeding peptic ulcer. Yet, acid suppression with oral PPI is deemed equivalent to the intravenous route.
Findings
This systematic review and meta-analysis identified 7 randomized controlled trials involving 859 patients. After an endoscopy, the patients were randomized to receive either oral or intravenous PPI. Most of the patients had “high-risk” peptic ulcers (active bleeding, a visible vessel, an adherent clot). The PPI dose and frequency varied between the studies. Re-bleeding rates were no different between the oral and intravenous route at 72 hours (2.4% vs 5.1%; P = .26), 7 days (5.6% vs 6.8%; P =.68), or 30 days (7.9% vs 8.8%; P = .62). There was also no difference in 30-day mortality (2.1% vs 2.4%; P = .88), and the length of stay was the same in both groups. Side effects were not reported.
Cautions
This systematic review and meta-analysis included multiple heterogeneous small studies of moderate quality. A large number of patients were excluded, increasing the risk of a selection bias.
Implications
There is no clear indication for intravenous PPI in the treatment of bleeding peptic ulcers following an endoscopy. Converting to oral PPI is equivalent to intravenous and is a safe, effective, and cost-saving option for patients with bleeding peptic ulcers.
1. Prandoni P, Lensing AW, Prins MH, et al. Prevalence of pulmonary embolism among patients hospitalized for syncope. N Engl J Med. 2016; 375(16):1524-1531. PubMed
2. Russo RJ, Costa HS, Silva PD, et al. Assessing the risks associated with MRI in patients with a pacemaker or defibrillator. N Engl J Med. 2017;376(8):755-764. PubMed
3. Linsenmeyer K, Gupta K, Strymish JM, Dhanani M, Brecher SM, Breu AC. Culture if spikes? Indications and yield of blood cultures in hospitalized medical patients. J Hosp Med. 2016;11(5):336-340. PubMed
4. Sun EC, Darnall BD, Baker LC, Mackey S. Incidence of and risk factors for chronic opioid use among opioid-naive patients in the postoperative period. JAMA Intern Med. 2016;176(9):1286-1293. PubMed
5. Pickering JW, Than MP, Cullen L, et al. Rapid rule-out of acute myocardial infarction with a single high-sensitivity cardiac troponin T measurement below the limit of detection: A collaborative meta-analysis. Ann Intern Med. 2017;166(10):715-724. PubMed
6. Thygesen K, Alpert JS, White HD, Jaffe AS, Apple FS, Galvani M, et al; Joint ESC/ACCF/AHA/WHF Task Force for the Redefinition of Myocardial Infarction. Universal definition of myocardial infarction. Circulation. 2007;116:2634-2653. PubMed
7. Aleva FE, Voets LWLM, Simons SO, de Mast Q, van der Ven AJAM, Heijdra YF. Prevalence and localization of pulmonary embolism in unexplained acute exacerbations of COPD: A systematic review and meta-analysis. Chest. 2017; 151(3):544-554. PubMed
8. Rizkallah J, Man SFP, Sin DD. Prevalence of pulmonary embolism in acute exacerbations of COPD: A systematic review and meta-analysis. Chest. 2009;135(3):786-793. PubMed
9. Merel SE, McKinney CM, Ufkes P, Kwan AC, White AA. Sitting at patients’ bedsides may improve patients’ perceptions of physician communication skills. J Hosp Med. 2016;11(12):865-868. PubMed
10. Kahn MW. Etiquette-based medicine. N Engl J Med. 2008;358(19):1988-1989. PubMed
11. Uranga A, España PP, Bilbao A, et al. Duration of antibiotic treatment in community-acquired pneumonia: A multicenter randomized clinical trial. JAMA Intern Med. 2016;176(9):1257-1265. PubMed
12. Jian Z, Li H, Race NS, Ma T, Jin H, Yin Z. Is the era of intravenous proton pump inhibitors coming to an end in patients with bleeding peptic ulcers? Meta-analysis of the published literature. Br J Clin Pharmacol. 2016;82(3):880-889. PubMed
© 2018 Society of Hospital Medicine
Characterizing Hospitalist Practice and Perceptions of Critical Care Delivery
Despite calls for board-certified intensivist physicians to lead critical care delivery,1-3 the intensivist shortage in the United States continues to worsen,4 with projected shortfalls of 22% by 2020 and 35% by 2030.5 Many hospitals currently have inadequate or no board-certified intensivist support.6 The intensivist shortage has necessitated the development of alternative intensive care unit (ICU) staffing models, including engagement in telemedicine,7 the utilization of advanced practice providers,8 and dependence on hospitalists9 to deliver critical care services to ICU patients. Presently, research does not clearly show consistent differences in clinical outcomes based on the training of the clinical provider, although optimized teamwork and team rounds in the ICU do seem to be associated with improved outcomes.10-12
In its 2016 annual survey of hospital medicine (HM) leaders, the Society of Hospital Medicine (SHM) documented that most HM groups care for ICU patients, with up to 80% of hospitalist groups in some regions delivering critical care.13 In many United States hospitals, hospitalists serve as the primary if not lone physician providers of critical care.6,14 HM, with its team-based approach and on-site presence, shares many of the key attributes and values that define high-functioning critical care teams, and many hospitalists likely capably deliver some critical care services.9 However, hospitalists are also a highly heterogeneous work force with varied exposure to and comfort with critical care medicine, making it difficult to generalize hospitalists’ scope of practice in the ICU.
Because hospitalists render a significant amount of critical care in the United States, we surveyed practicing hospitalists to understand their demographics and practice roles in the ICU setting and to ascertain how they are supported when doing so. Additionally, we sought to identify mismatches between the ICU services that hospitalists provide and what they feel prepared and supported to deliver. Finally, we attempted to elucidate how hospitalists who practice in the ICU might respond to novel educational offerings targeted to mitigate cognitive or procedural gaps.
METHODS
We developed and deployed a survey to address the aforementioned questions. The survey content was developed iteratively by the Critical Care Task Force of SHM’s Education Committee and subsequently approved by SHM’s Education Committee and Board of Directors. Members of the Critical Care Task Force include critical care physicians and hospitalists. The survey included 25 items (supplemental Appendix A). Seventeen questions addressed the demographics and practice roles of hospitalists in the ICU, 5 addressed cognitive and procedural practice gaps, and 3 addressed how hospitalists would respond to educational opportunities in critical care. We used conditional formatting to ensure that only respondents who deliver ICU care could answer questions related to ICU practice. The survey was delivered by using an online survey platform (Survey Monkey, San Mateo, CA).
The survey was deployed in 3 phases from March to October of 2016. Initially, we distributed a pilot survey to professional contacts of the Critical Care Task Force to solicit feedback and refine the survey’s format and content. These contacts were largely academic hospitalists from our local institutions. We then distributed the survey to hospitalists via professional networks with instructions to forward the link to interested hospitalists. Finally, we distributed the survey to approximately 4000 hospitalists randomly selected from SHM’s national listserv of approximately 12,000 hospitalists. Respondents could enter a drawing for a monetary prize upon completion of the survey.
None of the survey questions changed during the 3 phases of survey deployment, and the data reported herein were compiled from all 3 phases of the survey deployment. Frequency tables were created using Tableau (version 10.0; Tableau Software, Seattle, WA). Comparisons between categorical questions were made by using χ2 and Fischer exact tests to calculate P values for associations by using SAS (version 9.3; SAS Institute, Cary, NC). Associations with P values below .05 were considered statistically significant.
RESULTS
Objective 1: Demographics and Practice Role
Four hundred and twenty-five hospitalists responded to the survey. The first 2 phases (pilot survey and distribution via professional networks) generated 101 responses, and the third phase (via SHM’s listserv) generated an additional 324 responses. As the survey was anonymous, we could not determine which hospitals or geographic regions were represented. Three hundred and twenty-five of the 425 hospitalists who completed the survey (77%) reported that they delivered care in the ICU. Of these 325 hospitalists, 45 served only as consultants, while the remaining 280 (66% of the total sample) served as the primary attending physician in the ICU. Among these primary providers of care in the ICU, 60 (21%) practiced in rural settings and 220 (79%) practiced in nonrural settings (Figure 1).
The demographics of our respondents were similar to those of the SHM annual survey,13 in which 66% of respondents delivered ICU care. Forty-one percent of our respondents worked in critical access or small community hospitals, 24% in academic medical centers, and 34% in large community centers with an academic affiliation. The SHM annual survey cohort included more physicians from nonteaching hospitals (58.7%) and fewer from academic medical centers (14.8%).13
Hospitalists’ presence in the ICU varied by practice setting (Table 1). 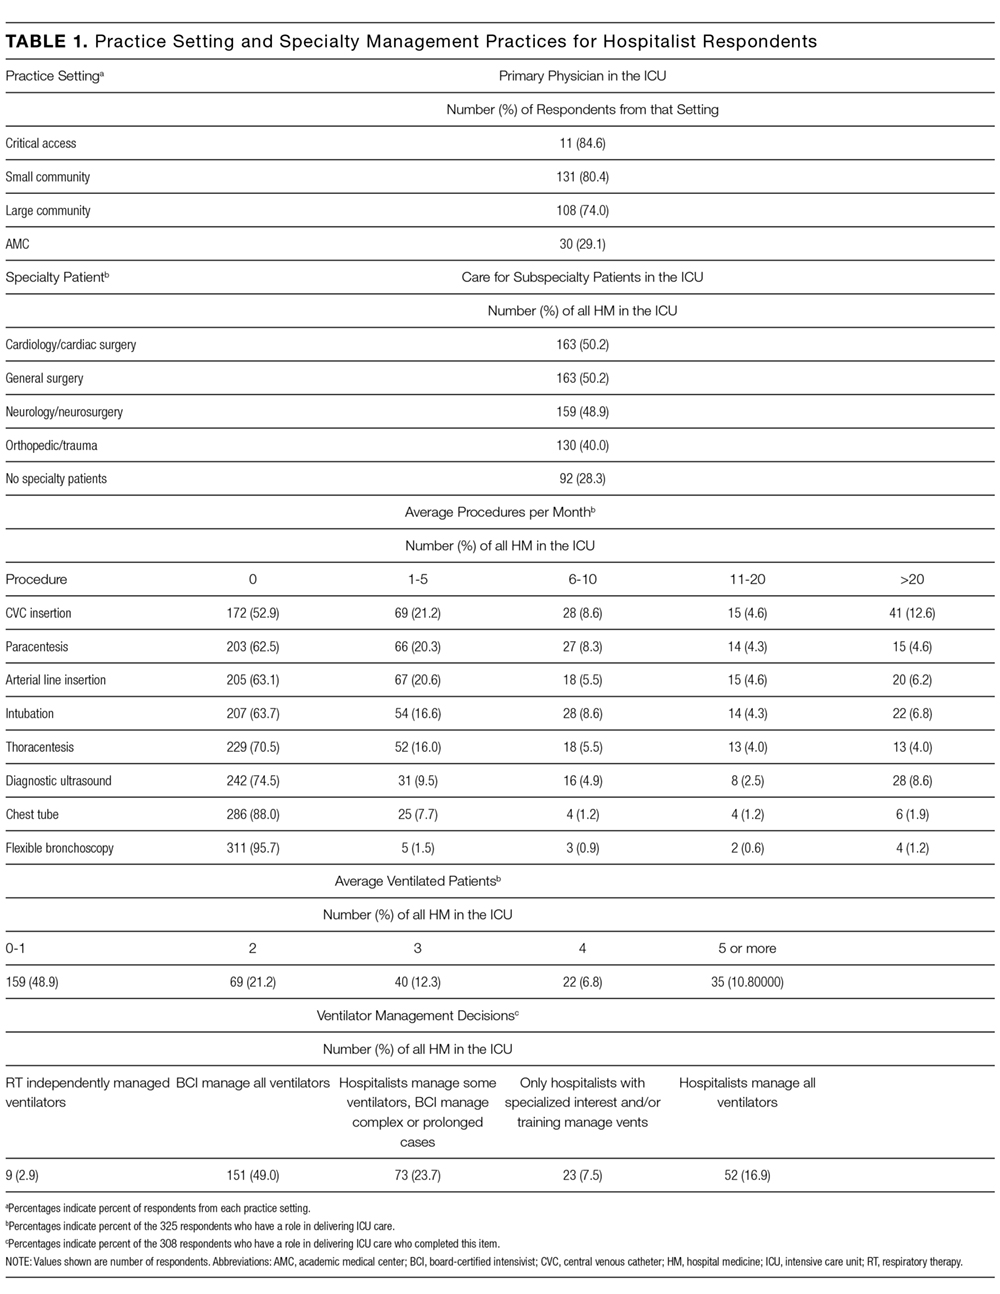
Hospitalists were significantly more prevalent in rural ICUs than in nonrural settings (96% vs 73%; Table 2). 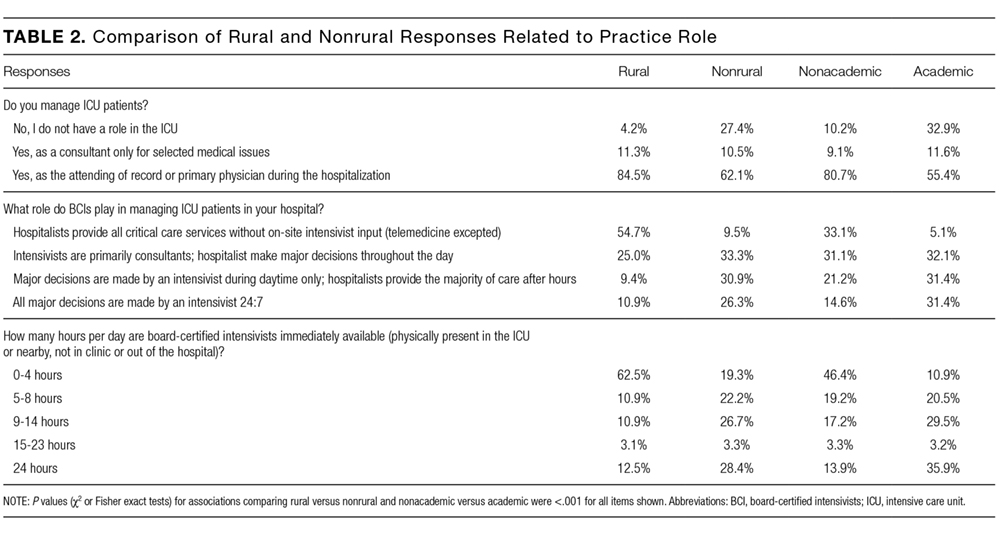
We found similar results when comparing academic hospitalists (those working in an academic medical center or academic-affiliated hospital) with nonacademic hospitalists (those working in critical access or small community centers). Specifically, hospitalists in nonacademic settings were significantly more prevalent in ICUs (90% vs 67%; Table 2), more likely to serve as the primary attending (81% vs 55%), and more likely to deliver all critical care services (64% vs 25%). Sixty-four percent of respondents from nonacademic settings reported that hospitalists manage all or most ICU patients in their hospital as opposed to 25% for academic respondents (χ2P value for association <.001). Intensivist availability was also significantly lower in nonacademic ICUs (Table 2).
We also sought to determine whether the ability to transfer critically ill patients to higher levels of care effectively mitigated shortfalls in intensivist staffing. When restricted to hospitalists who served as primary providers for ICU patients, 28% of all respondents and 51% of rural hospitalists reported transferring patients to a higher level of care.
Sixty-seven percent of hospitalists who served as primary physicians for ICU patients in any setting reported at least moderate difficulty arranging transfers to higher levels of care.
Objective 2: Identifying the Practice Gap
Hospitalists’ perceptions of practicing critical care beyond their skill level and without sufficient board-certified intensivist support varied by both practice location and practice type (Table 3). 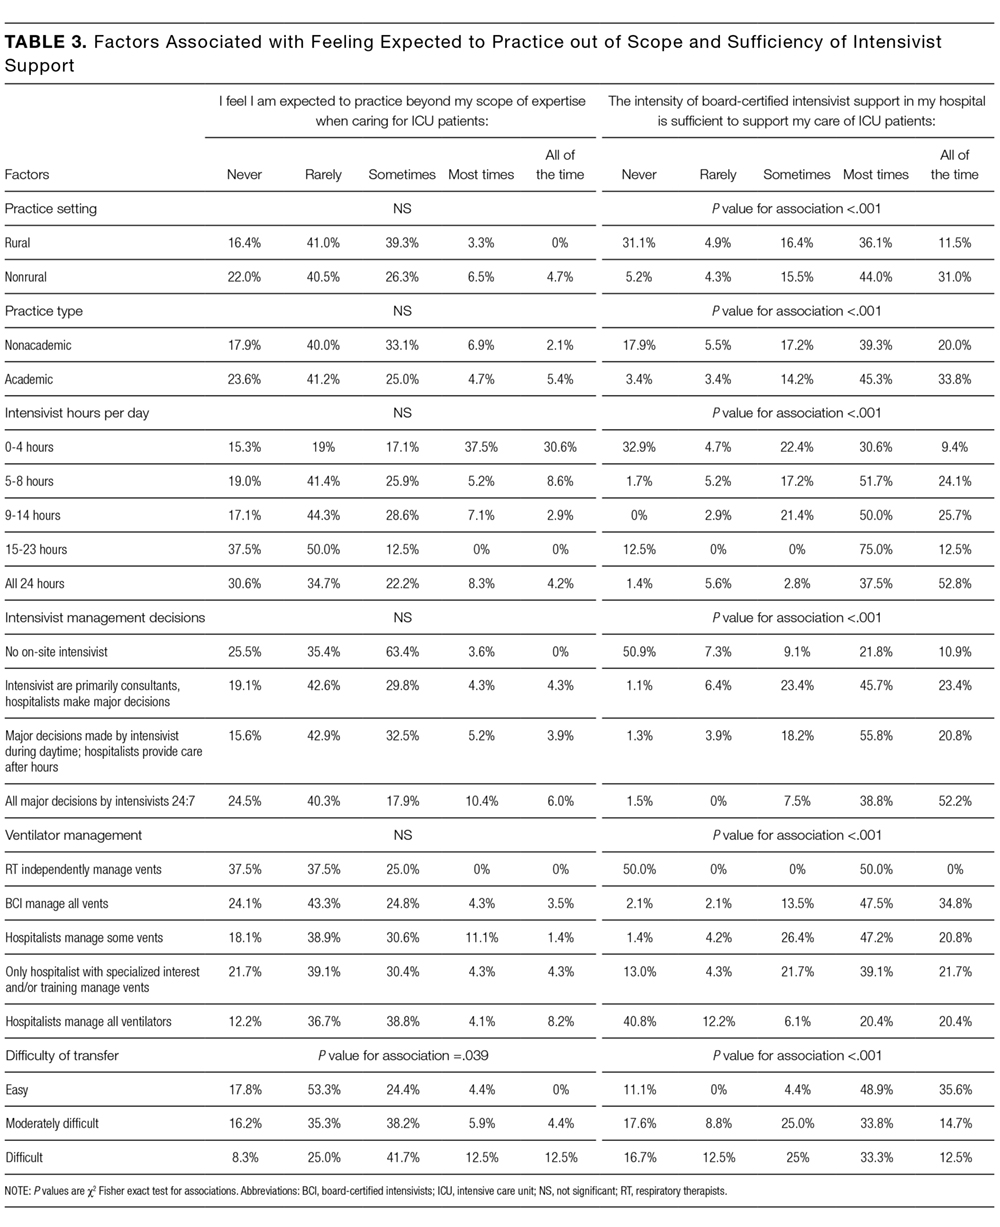
There were similar discrepancies between academic and nonacademic respondents. Forty-two percent of respondents practicing in nonacademic settings reported being expected to practice beyond their scope at least some of the time, and 18% reported that intensivist support was never sufficient. This contrasts with academic hospitalists, of whom 35% reported feeling expected to practice outside their scope, and less than 4% reported the available support from intensivists was never sufficient. For comparisons of academic and nonacademic respondents, only perceptions of sufficient board-certified intensivist support reached statistical significance (Table 3).
The role of intensivists in making management decisions and the strategy for ventilator management decisions correlated significantly with perception of intensivist support (P < .001) but not with the perception of practicing beyond one’s scope. The number of ventilated patients did not correlate significantly with either perception of intensivist support or of being expected to practice beyond scope.
Difficulty transferring patients to a higher level of care was the only attribute that significantly correlated with hospitalists’ perceptions of having to practice beyond their skill level (P < .05; Table 3). Difficulty of transfer was also significantly associated with perceived adequacy of board-certified intensivist support (P < .001). Total hours of intensivist coverage, intensivist role in decision making, and ventilator management arrangements also correlated significantly with the perceived adequacy of board-certified intensivist support (P < .001 for all; Table 3).
Objective 3: Assessing Interest in Critical Care Education
More than 85% of respondents indicated interest in obtaining additional critical care training and some form of certification short of fellowship training. Preferred modes of content delivery included courses or precourses at national meetings, academies, or online modules. Hospitalists in smaller communities indicated preference for online resources.
DISCUSSION
This survey of a large national cohort of hospitalists from diverse practice settings validates previous studies suggesting that hospitalists deliver critical care services, most notably in community and rural hospitals.13 A substantial subset of our respondents represented rural practice settings, which allowed us to compare rural and nonrural hospitalists as well as those practicing in academic and nonacademic settings. In assessing both the objective services that hospitalists provided as well as their subjective perceptions of how they practiced, we could correlate factors associated with the sense of practicing beyond one’s skill or feeling inadequately supported by board-certified intensivists.
More than a third of responding hospitalists who practiced in the ICU reported that they practiced beyond their self-perceived skill level, and almost three-fourths indicated that they practiced without consistent or adequate board-certified intensivist support. Rural and nonacademic hospitalists were far more likely to report delivering critical care beyond their comfort level and having insufficient board-certified intensivist support.
Calls for board-certified intensivists to deliver critical care to all critically ill patients do not reflect the reality in many American hospitals and, either by intent or by default, hospitalists have become the major and often sole providers of critical care services in many hospitals without robust intensivist support. We suspect that this phenomenon has been consistently underreported in the literature because academic hospitalists generally do not practice critical care.15
Many potential solutions to the intensivist shortage have been explored. Prior efforts in the United States have focused largely on care standardization and the recruitment of more trainees into existing critical care training pathways.16 Other countries have created multidisciplinary critical care training pathways that delink critical care from specific subspecialty training programs.17 Another potential solution to ensure that critically ill patients receive care from board-certified intensivists is to regionalize critical care such that the sickest patients are consistently transferred to referral centers with robust intensivist staffing.1,18 While such an approach has been effectively implemented for trauma patients7, it has yet to materialize on a systemic basis for other critically ill cohorts. Moreover, our data suggest that hospitalists who attempt to transfer patients to higher levels of critical care find doing so burdensome and difficult.
Our surveyed hospitalists overwhelmingly expressed interest in augmenting their critical care skills and knowledge. However, most existing critical care educational offerings are not optimized for hospitalists, either focusing on very specific skills or knowledge (eg, procedural techniques or point-of-care ultrasound) or providing entry-level or very foundational education. None of these offerings provide comprehensive, structured training schemas for hospitalists who need to evolve beyond basic critical care skills to manage critically ill patients competently and consistently for extended periods of time.
Our study has several limitations. First, we estimate that about 10% of invited participants responded to this survey, but as respondents could forward the survey via professional networks, this is only an estimate. It is possible but unlikely that some respondents could have completed the survey more than once. Second, because our analysis identified only associations, we cannot infer causality for any of our findings. Third, the questionnaire was not designed to capture the acuity threshold at which point each respondent would prefer to transfer their patients into an ICU setting or to another institution for assistance in critical care management. We recognize that definitions and perceptions of patient acuity vary markedly from one hospital to the next, and a patient who can be comfortably managed in a floor setting in one hospital may require ICU care in a smaller or less well-resourced hospital. Practice patterns relating to acuity thresholds could have a substantial impact both on critical care patient volumes and on provider perceptions and, as such, warrant further study.
Finally, as respondents participated voluntarily, our sample may have overrepresented hospitalists who practice or are interested in critical care, thereby overestimating the scope of the problem and hospitalists’ interest in nonfellowship critical care training and certification. However, this seems unlikely given that, relative to SHM’s annual survey, we overrepresented hospitalists from academic and large community medical centers who generally provide less critical care than other hospitalists.13 Provided that roughly 85% of the estimated 50,000 American hospitalists practice outside of academic medical centers,13 perhaps as many as 37,000 hospitalists regularly deliver care to critically ill patients in ICUs. In light of the evolving intensivist shortage,4,5 this number seems likely to continue to grow. Whatever biases may exist in our sample, it is evident that a substantial number of ICU patients are managed by hospitalists who feel unprepared and undersupported to perform the task.
Without a massive and sustained increase in the number of board-certified intensivists or a systemic national plan to regionalize critical care delivery, hospitalists will continue to practice critical care, frequently with inadequate knowledge, skills, or intensivist support. Fortunately, these same hospitalists appear to be highly interested in augmenting their skills to care for their critically ill patients. The HM and critical care communities must rise to this challenge and help these providers deliver safe, appropriate, and high-quality care to their critically ill patients.
Disclosure
Mark V. Williams, MD, FACP, MHM, receives funding from the Patient Centered Outcomes Research Institute, Agency for Healthcare Research and Quality, Centers for Medicare & Medicaid Services, and Society of Hospital Medicine honoraria.
Society of Hospital Medicine Resources
1. Barnato AE, Kahn JM, Rubenfeld GD, et al. Prioritizing the organization and management of intensive care services in the United States: the PrOMIS Conference. Crit Care Med. 2007;35(4):1003-1011. PubMed
2. The Leapfrog Group. Factsheet: ICU Physician Staffing. Leapfrog Hospital Survey. Washington, DC: The Leapfrog Group; 2016.
3. Baumann MH, Simpson SQ, Stahl M, Raoof S, Marciniuk DD, Gutterman DD. First, do no harm: less training not equal quality care. Am J Crit Care. Jul 2012;21(4):227-230. PubMed
4. Krell K. Critical care workforce. Crit Care Med. 2008;36(4):1350-1353. PubMed
5. Angus DC, Kelley MA, Schmitz RJ, White A, Popovich J, Jr. Caring for the critically ill patient. Current and projected workforce requirements for care of the critically ill and patients with pulmonary disease: can we meet the requirements of an aging population? JAMA. 2000;284(21):2762-2770. PubMed
6. Hyzy RC, Flanders SA, Pronovost PJ, et al. Characteristics of intensive care units in Michigan: not an open and closed case. J Hosp Med. 2010;5(1):4-9. PubMed
7. Kahn JM, Cicero BD, Wallace DJ, Iwashyna TJ. Adoption of ICU telemedicine in the United States. Crit Care Med. 2014;42(2):362-368. PubMed
8. Kleinpell RM, Ely EW, Grabenkort R. Nurse practitioners and physician assistants in the intensive care unit: an evidence-based review. Crit Care Med. 2008;36(10):2888-2897. PubMed
9. Heisler M. Hospitalists and intensivists: partners in caring for the critically ill--the time has come. J Hosp Med. 2010;5(1):1-3. PubMed
10. Checkley W, Martin GS, Brown SM, et al. Structure, process, and annual ICU mortality across 69 centers: United States Critical Illness and Injury Trials Group Critical Illness Outcomes Study. Crit Care Med. 2014;42(2):344-356. PubMed
11. Wise KR, Akopov VA, Williams BR, Jr., Ido MS, Leeper KV, Jr., Dressler DD. Hospitalists and intensivists in the medical ICU: a prospective observational study comparing mortality and length of stay between two staffing models. J Hosp Med. 2012;7(3):183-189. PubMed
12. Yoo EJ, Edwards JD, Dean ML, Dudley RA. Multidisciplinary Critical Care and Intensivist Staffing: Results of a Statewide Survey and Association With Mortality. J Intensive Care Med. 2016;31(5):325-332. PubMed
13. Society of Hospital Medicine. 2016 State of Hospital Medicine Report. Philadelphia: Society of Hospital Medicine; 2016.
14. Siegal EM, Dressler DD, Dichter JR, Gorman MJ, Lipsett PA. Training a hospitalist workforce to address the intensivist shortage in American hospitals: a position paper from the Society of Hospital Medicine and the Society of Critical Care Medicine. Crit Care Med. 2012;40(6):1952-1956. PubMed
15. Weled BJ, Adzhigirey LA, Hodgman TM, et al. Critical Care Delivery: The Importance of Process of Care and ICU Structure to Improved Outcomes: An Update From the American College of Critical Care Medicine Task Force on Models of Critical Care. Crit Care Med. 2015;43(7):1520-1525. PubMed
16. Kelley MA, Angus D, Chalfin DB, et al. The critical care crisis in the United States: a report from the profession. Chest. 2004;125(4):1514-1517. PubMed
17. Bion JF, Ramsay G, Roussos C, Burchardi H. Intensive care training and specialty status in Europe: international comparisons. Task Force on Educational issues of the European Society of Intensive Care Medicine. Intensive Care Med. 1998;24(4);372-377. PubMed
18. Kahn JM, Branas CC, Schwab CW, Asch DA. Regionalization of medical critical care: what can we learn from the trauma experience? Crit Care Med. 2008;36(11):3085-3088. PubMed
Despite calls for board-certified intensivist physicians to lead critical care delivery,1-3 the intensivist shortage in the United States continues to worsen,4 with projected shortfalls of 22% by 2020 and 35% by 2030.5 Many hospitals currently have inadequate or no board-certified intensivist support.6 The intensivist shortage has necessitated the development of alternative intensive care unit (ICU) staffing models, including engagement in telemedicine,7 the utilization of advanced practice providers,8 and dependence on hospitalists9 to deliver critical care services to ICU patients. Presently, research does not clearly show consistent differences in clinical outcomes based on the training of the clinical provider, although optimized teamwork and team rounds in the ICU do seem to be associated with improved outcomes.10-12
In its 2016 annual survey of hospital medicine (HM) leaders, the Society of Hospital Medicine (SHM) documented that most HM groups care for ICU patients, with up to 80% of hospitalist groups in some regions delivering critical care.13 In many United States hospitals, hospitalists serve as the primary if not lone physician providers of critical care.6,14 HM, with its team-based approach and on-site presence, shares many of the key attributes and values that define high-functioning critical care teams, and many hospitalists likely capably deliver some critical care services.9 However, hospitalists are also a highly heterogeneous work force with varied exposure to and comfort with critical care medicine, making it difficult to generalize hospitalists’ scope of practice in the ICU.
Because hospitalists render a significant amount of critical care in the United States, we surveyed practicing hospitalists to understand their demographics and practice roles in the ICU setting and to ascertain how they are supported when doing so. Additionally, we sought to identify mismatches between the ICU services that hospitalists provide and what they feel prepared and supported to deliver. Finally, we attempted to elucidate how hospitalists who practice in the ICU might respond to novel educational offerings targeted to mitigate cognitive or procedural gaps.
METHODS
We developed and deployed a survey to address the aforementioned questions. The survey content was developed iteratively by the Critical Care Task Force of SHM’s Education Committee and subsequently approved by SHM’s Education Committee and Board of Directors. Members of the Critical Care Task Force include critical care physicians and hospitalists. The survey included 25 items (supplemental Appendix A). Seventeen questions addressed the demographics and practice roles of hospitalists in the ICU, 5 addressed cognitive and procedural practice gaps, and 3 addressed how hospitalists would respond to educational opportunities in critical care. We used conditional formatting to ensure that only respondents who deliver ICU care could answer questions related to ICU practice. The survey was delivered by using an online survey platform (Survey Monkey, San Mateo, CA).
The survey was deployed in 3 phases from March to October of 2016. Initially, we distributed a pilot survey to professional contacts of the Critical Care Task Force to solicit feedback and refine the survey’s format and content. These contacts were largely academic hospitalists from our local institutions. We then distributed the survey to hospitalists via professional networks with instructions to forward the link to interested hospitalists. Finally, we distributed the survey to approximately 4000 hospitalists randomly selected from SHM’s national listserv of approximately 12,000 hospitalists. Respondents could enter a drawing for a monetary prize upon completion of the survey.
None of the survey questions changed during the 3 phases of survey deployment, and the data reported herein were compiled from all 3 phases of the survey deployment. Frequency tables were created using Tableau (version 10.0; Tableau Software, Seattle, WA). Comparisons between categorical questions were made by using χ2 and Fischer exact tests to calculate P values for associations by using SAS (version 9.3; SAS Institute, Cary, NC). Associations with P values below .05 were considered statistically significant.
RESULTS
Objective 1: Demographics and Practice Role
Four hundred and twenty-five hospitalists responded to the survey. The first 2 phases (pilot survey and distribution via professional networks) generated 101 responses, and the third phase (via SHM’s listserv) generated an additional 324 responses. As the survey was anonymous, we could not determine which hospitals or geographic regions were represented. Three hundred and twenty-five of the 425 hospitalists who completed the survey (77%) reported that they delivered care in the ICU. Of these 325 hospitalists, 45 served only as consultants, while the remaining 280 (66% of the total sample) served as the primary attending physician in the ICU. Among these primary providers of care in the ICU, 60 (21%) practiced in rural settings and 220 (79%) practiced in nonrural settings (Figure 1).
The demographics of our respondents were similar to those of the SHM annual survey,13 in which 66% of respondents delivered ICU care. Forty-one percent of our respondents worked in critical access or small community hospitals, 24% in academic medical centers, and 34% in large community centers with an academic affiliation. The SHM annual survey cohort included more physicians from nonteaching hospitals (58.7%) and fewer from academic medical centers (14.8%).13
Hospitalists’ presence in the ICU varied by practice setting (Table 1).
Hospitalists were significantly more prevalent in rural ICUs than in nonrural settings (96% vs 73%; Table 2).
We found similar results when comparing academic hospitalists (those working in an academic medical center or academic-affiliated hospital) with nonacademic hospitalists (those working in critical access or small community centers). Specifically, hospitalists in nonacademic settings were significantly more prevalent in ICUs (90% vs 67%; Table 2), more likely to serve as the primary attending (81% vs 55%), and more likely to deliver all critical care services (64% vs 25%). Sixty-four percent of respondents from nonacademic settings reported that hospitalists manage all or most ICU patients in their hospital as opposed to 25% for academic respondents (χ2P value for association <.001). Intensivist availability was also significantly lower in nonacademic ICUs (Table 2).
We also sought to determine whether the ability to transfer critically ill patients to higher levels of care effectively mitigated shortfalls in intensivist staffing. When restricted to hospitalists who served as primary providers for ICU patients, 28% of all respondents and 51% of rural hospitalists reported transferring patients to a higher level of care.
Sixty-seven percent of hospitalists who served as primary physicians for ICU patients in any setting reported at least moderate difficulty arranging transfers to higher levels of care.
Objective 2: Identifying the Practice Gap
Hospitalists’ perceptions of practicing critical care beyond their skill level and without sufficient board-certified intensivist support varied by both practice location and practice type (Table 3).
There were similar discrepancies between academic and nonacademic respondents. Forty-two percent of respondents practicing in nonacademic settings reported being expected to practice beyond their scope at least some of the time, and 18% reported that intensivist support was never sufficient. This contrasts with academic hospitalists, of whom 35% reported feeling expected to practice outside their scope, and less than 4% reported the available support from intensivists was never sufficient. For comparisons of academic and nonacademic respondents, only perceptions of sufficient board-certified intensivist support reached statistical significance (Table 3).
The role of intensivists in making management decisions and the strategy for ventilator management decisions correlated significantly with perception of intensivist support (P < .001) but not with the perception of practicing beyond one’s scope. The number of ventilated patients did not correlate significantly with either perception of intensivist support or of being expected to practice beyond scope.
Difficulty transferring patients to a higher level of care was the only attribute that significantly correlated with hospitalists’ perceptions of having to practice beyond their skill level (P < .05; Table 3). Difficulty of transfer was also significantly associated with perceived adequacy of board-certified intensivist support (P < .001). Total hours of intensivist coverage, intensivist role in decision making, and ventilator management arrangements also correlated significantly with the perceived adequacy of board-certified intensivist support (P < .001 for all; Table 3).
Objective 3: Assessing Interest in Critical Care Education
More than 85% of respondents indicated interest in obtaining additional critical care training and some form of certification short of fellowship training. Preferred modes of content delivery included courses or precourses at national meetings, academies, or online modules. Hospitalists in smaller communities indicated preference for online resources.
DISCUSSION
This survey of a large national cohort of hospitalists from diverse practice settings validates previous studies suggesting that hospitalists deliver critical care services, most notably in community and rural hospitals.13 A substantial subset of our respondents represented rural practice settings, which allowed us to compare rural and nonrural hospitalists as well as those practicing in academic and nonacademic settings. In assessing both the objective services that hospitalists provided as well as their subjective perceptions of how they practiced, we could correlate factors associated with the sense of practicing beyond one’s skill or feeling inadequately supported by board-certified intensivists.
More than a third of responding hospitalists who practiced in the ICU reported that they practiced beyond their self-perceived skill level, and almost three-fourths indicated that they practiced without consistent or adequate board-certified intensivist support. Rural and nonacademic hospitalists were far more likely to report delivering critical care beyond their comfort level and having insufficient board-certified intensivist support.
Calls for board-certified intensivists to deliver critical care to all critically ill patients do not reflect the reality in many American hospitals and, either by intent or by default, hospitalists have become the major and often sole providers of critical care services in many hospitals without robust intensivist support. We suspect that this phenomenon has been consistently underreported in the literature because academic hospitalists generally do not practice critical care.15
Many potential solutions to the intensivist shortage have been explored. Prior efforts in the United States have focused largely on care standardization and the recruitment of more trainees into existing critical care training pathways.16 Other countries have created multidisciplinary critical care training pathways that delink critical care from specific subspecialty training programs.17 Another potential solution to ensure that critically ill patients receive care from board-certified intensivists is to regionalize critical care such that the sickest patients are consistently transferred to referral centers with robust intensivist staffing.1,18 While such an approach has been effectively implemented for trauma patients7, it has yet to materialize on a systemic basis for other critically ill cohorts. Moreover, our data suggest that hospitalists who attempt to transfer patients to higher levels of critical care find doing so burdensome and difficult.
Our surveyed hospitalists overwhelmingly expressed interest in augmenting their critical care skills and knowledge. However, most existing critical care educational offerings are not optimized for hospitalists, either focusing on very specific skills or knowledge (eg, procedural techniques or point-of-care ultrasound) or providing entry-level or very foundational education. None of these offerings provide comprehensive, structured training schemas for hospitalists who need to evolve beyond basic critical care skills to manage critically ill patients competently and consistently for extended periods of time.
Our study has several limitations. First, we estimate that about 10% of invited participants responded to this survey, but as respondents could forward the survey via professional networks, this is only an estimate. It is possible but unlikely that some respondents could have completed the survey more than once. Second, because our analysis identified only associations, we cannot infer causality for any of our findings. Third, the questionnaire was not designed to capture the acuity threshold at which point each respondent would prefer to transfer their patients into an ICU setting or to another institution for assistance in critical care management. We recognize that definitions and perceptions of patient acuity vary markedly from one hospital to the next, and a patient who can be comfortably managed in a floor setting in one hospital may require ICU care in a smaller or less well-resourced hospital. Practice patterns relating to acuity thresholds could have a substantial impact both on critical care patient volumes and on provider perceptions and, as such, warrant further study.
Finally, as respondents participated voluntarily, our sample may have overrepresented hospitalists who practice or are interested in critical care, thereby overestimating the scope of the problem and hospitalists’ interest in nonfellowship critical care training and certification. However, this seems unlikely given that, relative to SHM’s annual survey, we overrepresented hospitalists from academic and large community medical centers who generally provide less critical care than other hospitalists.13 Provided that roughly 85% of the estimated 50,000 American hospitalists practice outside of academic medical centers,13 perhaps as many as 37,000 hospitalists regularly deliver care to critically ill patients in ICUs. In light of the evolving intensivist shortage,4,5 this number seems likely to continue to grow. Whatever biases may exist in our sample, it is evident that a substantial number of ICU patients are managed by hospitalists who feel unprepared and undersupported to perform the task.
Without a massive and sustained increase in the number of board-certified intensivists or a systemic national plan to regionalize critical care delivery, hospitalists will continue to practice critical care, frequently with inadequate knowledge, skills, or intensivist support. Fortunately, these same hospitalists appear to be highly interested in augmenting their skills to care for their critically ill patients. The HM and critical care communities must rise to this challenge and help these providers deliver safe, appropriate, and high-quality care to their critically ill patients.
Disclosure
Mark V. Williams, MD, FACP, MHM, receives funding from the Patient Centered Outcomes Research Institute, Agency for Healthcare Research and Quality, Centers for Medicare & Medicaid Services, and Society of Hospital Medicine honoraria.
Society of Hospital Medicine Resources
1. Barnato AE, Kahn JM, Rubenfeld GD, et al. Prioritizing the organization and management of intensive care services in the United States: the PrOMIS Conference. Crit Care Med. 2007;35(4):1003-1011. PubMed
2. The Leapfrog Group. Factsheet: ICU Physician Staffing. Leapfrog Hospital Survey. Washington, DC: The Leapfrog Group; 2016.
3. Baumann MH, Simpson SQ, Stahl M, Raoof S, Marciniuk DD, Gutterman DD. First, do no harm: less training not equal quality care. Am J Crit Care. Jul 2012;21(4):227-230. PubMed
4. Krell K. Critical care workforce. Crit Care Med. 2008;36(4):1350-1353. PubMed
5. Angus DC, Kelley MA, Schmitz RJ, White A, Popovich J, Jr. Caring for the critically ill patient. Current and projected workforce requirements for care of the critically ill and patients with pulmonary disease: can we meet the requirements of an aging population? JAMA. 2000;284(21):2762-2770. PubMed
6. Hyzy RC, Flanders SA, Pronovost PJ, et al. Characteristics of intensive care units in Michigan: not an open and closed case. J Hosp Med. 2010;5(1):4-9. PubMed
7. Kahn JM, Cicero BD, Wallace DJ, Iwashyna TJ. Adoption of ICU telemedicine in the United States. Crit Care Med. 2014;42(2):362-368. PubMed
8. Kleinpell RM, Ely EW, Grabenkort R. Nurse practitioners and physician assistants in the intensive care unit: an evidence-based review. Crit Care Med. 2008;36(10):2888-2897. PubMed
9. Heisler M. Hospitalists and intensivists: partners in caring for the critically ill--the time has come. J Hosp Med. 2010;5(1):1-3. PubMed
10. Checkley W, Martin GS, Brown SM, et al. Structure, process, and annual ICU mortality across 69 centers: United States Critical Illness and Injury Trials Group Critical Illness Outcomes Study. Crit Care Med. 2014;42(2):344-356. PubMed
11. Wise KR, Akopov VA, Williams BR, Jr., Ido MS, Leeper KV, Jr., Dressler DD. Hospitalists and intensivists in the medical ICU: a prospective observational study comparing mortality and length of stay between two staffing models. J Hosp Med. 2012;7(3):183-189. PubMed
12. Yoo EJ, Edwards JD, Dean ML, Dudley RA. Multidisciplinary Critical Care and Intensivist Staffing: Results of a Statewide Survey and Association With Mortality. J Intensive Care Med. 2016;31(5):325-332. PubMed
13. Society of Hospital Medicine. 2016 State of Hospital Medicine Report. Philadelphia: Society of Hospital Medicine; 2016.
14. Siegal EM, Dressler DD, Dichter JR, Gorman MJ, Lipsett PA. Training a hospitalist workforce to address the intensivist shortage in American hospitals: a position paper from the Society of Hospital Medicine and the Society of Critical Care Medicine. Crit Care Med. 2012;40(6):1952-1956. PubMed
15. Weled BJ, Adzhigirey LA, Hodgman TM, et al. Critical Care Delivery: The Importance of Process of Care and ICU Structure to Improved Outcomes: An Update From the American College of Critical Care Medicine Task Force on Models of Critical Care. Crit Care Med. 2015;43(7):1520-1525. PubMed
16. Kelley MA, Angus D, Chalfin DB, et al. The critical care crisis in the United States: a report from the profession. Chest. 2004;125(4):1514-1517. PubMed
17. Bion JF, Ramsay G, Roussos C, Burchardi H. Intensive care training and specialty status in Europe: international comparisons. Task Force on Educational issues of the European Society of Intensive Care Medicine. Intensive Care Med. 1998;24(4);372-377. PubMed
18. Kahn JM, Branas CC, Schwab CW, Asch DA. Regionalization of medical critical care: what can we learn from the trauma experience? Crit Care Med. 2008;36(11):3085-3088. PubMed
© 2018 Society of Hospital Medicine
Future Hospitalist: Top 10 tips for carrying out a successful quality improvement project
Editor’s Note: This column is a quarterly feature written by members of the Physicians in Training Committee. It aims to encourage and educate students, residents, and early career hospitalists.
One of the biggest challenges early career hospitalists, residents and medical students face in launching their first quality improvement (QI) project is knowing how and where to get started. QI can be highly rewarding, but it can also take valuable time and resources without guarantees of sustainable improvement. In this article, we outline 10 key factors to consider when starting a new project.
1. Frame your project so that it aligns with your hospital’s current goals
Choose a project with your hospital’s goals in mind. Securing resources such as health IT, financial, or staffing support will prove difficult unless you get buy-in from hospital leadership. If your project does not directly address hospital goals, frame the purpose to demonstrate that it still fits with leadership priorities. For example, though improving handoffs from daytime to nighttime providers may not be a specific goal, leadership should appreciate that this project is expected to improve patient safety.
2. Be SMART about goals
Many QI projects fail because the scope of the initial project is too large, unrealistic, or vague. Creating a clear and focused aim statement and keeping it “SMART” (Specific, Measurable, Achievable, Realistic, and Timely) will bring structure to the project.1 “We will reduce Congestive Heart Failure readmissions on 5 medicine units at our hospital by 2.5% in 6 months” is an example of a SMART aim statement. 
3. Involve the right people from the start
QI project disasters often start with the wrong team. Select members based on who is needed and not who is available. It is critical to include representatives or “champions” from each area that will be affected. People will buy into a new methodology much more quickly if they were engaged in its development or know that respected members in their area were involved.
4. Use a simple, systematic approach to guide improvement work
Various QI models exist and each offers a systematic approach for assessing and improving care services. The Model for Improvement developed by the Associates in Process Improvement2 is a simple and powerful framework for quality improvement that asks three questions: (1) What are we trying to accomplish? (2) How will we know a change is an improvement? (3) What changes can we make that will result in improvement? The model incorporates Plan-Do-Study-Act (PDSA) cycles to test changes on a small scale.
5. Good projects start with good background data

6. Choose interventions that are high impact, low effort
People will more easily change if the change itself is easy. So consider the question “does this intervention add significant work?” The best interventions change a process without causing undue burden to the clinicians and staff involved.
7. If you can’t measure it, you can’t improve it
After implementation, collect enough data to know whether the changes made improved the process. Study outcome, process, and balancing measures. If possible, use data already being collected by your institution. While it is critical to have quantitative measures, qualitative data such as surveys and observations can also enrich understanding.
Example: Increasing early discharges in medical unit.
Outcome measure – This is the desired outcome that the project aims to improve. This may be the percentage of discharges before noon (DBN) or the average discharge time.
Process measure – This is a measure of a specific change made to improve the outcome metric. The discharge orders may need to be placed earlier in the electronic medical record to improve DBN. This average discharge order time is an example of a process measure.
Balance measure – This metric evaluates whether the intended outcome is leading to unintended consequences. For example, tracking the readmission rate is an important balance measure to assess whether improved DBN is associated with rushed discharges and possible unsafe transitions.
8. Communicate project goals and progress

9. Manage resistance to change
“People responsible for planning and implementing change often forget that while the first task of change management is to understand the destination and how to get there, the first task of transition management is to convince people to leave home.” – William Bridges
Inertia is powerful. We may consider our continuous performance improvement initiative as “the next big thing” but others may not share this enthusiasm. We therefore need to build a compelling reason for others to become engaged and accept major changes to work flow. Different strategies may be needed depending on your audience. Though for some, data and a rational analysis will be persuasive, for others the emotional argument will be the most motivating. Share personal anecdotes and use patient stories. In addition, let providers know “what’s in it for them.” Some may have a personal interest in your project or may need QI experience for career advancement; others might be motivated by the possibilities for scholarship arising from this work.
10. Make the work count twice
Consider QI as a scholarly initiative from the start to bring rigor to the project at all phases. Describe the project in an abstract or manuscript once improvements have been made. Publication is a great way to boost team morale and help make a business case for future improvement work. The Standards for Quality Improvement Reporting Excellence (SQUIRE) guidelines provide an excellent framework for designing and writing up an improvement project.4 The guidelines focus on why the project was started, what was done, what was found, and what the findings mean.
Driving change is challenging, and it is tempting to jump ahead to “fixing the problem.” But implementing a successful QI project requires intelligent direction, strategic planning, and skillful execution. It is our hope that following the above tips will help you develop the best possible ideas and approach implementation in a systematic way, ultimately leading to meaningful change.
Dr. Reyna is assistant professor in the division of hospital medicine and unit medical director at Mount Sinai Medical Center in New York City. She is a Certified Clinical Microsystems Coach. Dr. Burger is associate professor and associate program director, internal medicine residency, at Mount Sinai Beth Israel. He is on the faculty for the SGIM Annual Meeting Precourse on QI and is head of the high value care committee at the department of medicine at Mount Sinai Beth Israel. Dr. Cho is assistant professor and director of quality and safety in the division of hospital medicine at Mount Sinai. He is a senior fellow at the Lown Institute.
References
1. MacLeod L. Making SMART goals smarter. Physician Exec. 2012 Mar-Apr;38(2):68-70, 72.
2. Langley GL, Moen R, Nolan KM, Nolan TW, Norman CL, Provost LP. The Improvement Guide: A Practical Approach to Enhancing Organizational Performance (2nd edition). San Francisco: Jossey-Bass Publishers; 2009.
3. Nelson EC, Batalden PB, Godfrey MM. Quality By Design: A Clinical Microsystems Approach. San Francisco, California: Jossey-Bass; 2007.
4. Ogrinc G, Davies L, Goodman D et.al. SQUIRE 2.0 (Standards for Quality Improvement Reporting Excellence): revised publication guidelines from a detailed consensus process. BMJ Qual Saf. 2015 Sep 14.
Editor’s Note: This column is a quarterly feature written by members of the Physicians in Training Committee. It aims to encourage and educate students, residents, and early career hospitalists.
One of the biggest challenges early career hospitalists, residents and medical students face in launching their first quality improvement (QI) project is knowing how and where to get started. QI can be highly rewarding, but it can also take valuable time and resources without guarantees of sustainable improvement. In this article, we outline 10 key factors to consider when starting a new project.
1. Frame your project so that it aligns with your hospital’s current goals
Choose a project with your hospital’s goals in mind. Securing resources such as health IT, financial, or staffing support will prove difficult unless you get buy-in from hospital leadership. If your project does not directly address hospital goals, frame the purpose to demonstrate that it still fits with leadership priorities. For example, though improving handoffs from daytime to nighttime providers may not be a specific goal, leadership should appreciate that this project is expected to improve patient safety.
2. Be SMART about goals
Many QI projects fail because the scope of the initial project is too large, unrealistic, or vague. Creating a clear and focused aim statement and keeping it “SMART” (Specific, Measurable, Achievable, Realistic, and Timely) will bring structure to the project.1 “We will reduce Congestive Heart Failure readmissions on 5 medicine units at our hospital by 2.5% in 6 months” is an example of a SMART aim statement.
3. Involve the right people from the start
QI project disasters often start with the wrong team. Select members based on who is needed and not who is available. It is critical to include representatives or “champions” from each area that will be affected. People will buy into a new methodology much more quickly if they were engaged in its development or know that respected members in their area were involved.
4. Use a simple, systematic approach to guide improvement work
Various QI models exist and each offers a systematic approach for assessing and improving care services. The Model for Improvement developed by the Associates in Process Improvement2 is a simple and powerful framework for quality improvement that asks three questions: (1) What are we trying to accomplish? (2) How will we know a change is an improvement? (3) What changes can we make that will result in improvement? The model incorporates Plan-Do-Study-Act (PDSA) cycles to test changes on a small scale.
5. Good projects start with good background data
6. Choose interventions that are high impact, low effort
People will more easily change if the change itself is easy. So consider the question “does this intervention add significant work?” The best interventions change a process without causing undue burden to the clinicians and staff involved.
7. If you can’t measure it, you can’t improve it
After implementation, collect enough data to know whether the changes made improved the process. Study outcome, process, and balancing measures. If possible, use data already being collected by your institution. While it is critical to have quantitative measures, qualitative data such as surveys and observations can also enrich understanding.
Example: Increasing early discharges in medical unit.
Outcome measure – This is the desired outcome that the project aims to improve. This may be the percentage of discharges before noon (DBN) or the average discharge time.
Process measure – This is a measure of a specific change made to improve the outcome metric. The discharge orders may need to be placed earlier in the electronic medical record to improve DBN. This average discharge order time is an example of a process measure.
Balance measure – This metric evaluates whether the intended outcome is leading to unintended consequences. For example, tracking the readmission rate is an important balance measure to assess whether improved DBN is associated with rushed discharges and possible unsafe transitions.
8. Communicate project goals and progress
9. Manage resistance to change
“People responsible for planning and implementing change often forget that while the first task of change management is to understand the destination and how to get there, the first task of transition management is to convince people to leave home.” – William Bridges
Inertia is powerful. We may consider our continuous performance improvement initiative as “the next big thing” but others may not share this enthusiasm. We therefore need to build a compelling reason for others to become engaged and accept major changes to work flow. Different strategies may be needed depending on your audience. Though for some, data and a rational analysis will be persuasive, for others the emotional argument will be the most motivating. Share personal anecdotes and use patient stories. In addition, let providers know “what’s in it for them.” Some may have a personal interest in your project or may need QI experience for career advancement; others might be motivated by the possibilities for scholarship arising from this work.
10. Make the work count twice
Consider QI as a scholarly initiative from the start to bring rigor to the project at all phases. Describe the project in an abstract or manuscript once improvements have been made. Publication is a great way to boost team morale and help make a business case for future improvement work. The Standards for Quality Improvement Reporting Excellence (SQUIRE) guidelines provide an excellent framework for designing and writing up an improvement project.4 The guidelines focus on why the project was started, what was done, what was found, and what the findings mean.
Driving change is challenging, and it is tempting to jump ahead to “fixing the problem.” But implementing a successful QI project requires intelligent direction, strategic planning, and skillful execution. It is our hope that following the above tips will help you develop the best possible ideas and approach implementation in a systematic way, ultimately leading to meaningful change.
Dr. Reyna is assistant professor in the division of hospital medicine and unit medical director at Mount Sinai Medical Center in New York City. She is a Certified Clinical Microsystems Coach. Dr. Burger is associate professor and associate program director, internal medicine residency, at Mount Sinai Beth Israel. He is on the faculty for the SGIM Annual Meeting Precourse on QI and is head of the high value care committee at the department of medicine at Mount Sinai Beth Israel. Dr. Cho is assistant professor and director of quality and safety in the division of hospital medicine at Mount Sinai. He is a senior fellow at the Lown Institute.
References
1. MacLeod L. Making SMART goals smarter. Physician Exec. 2012 Mar-Apr;38(2):68-70, 72.
2. Langley GL, Moen R, Nolan KM, Nolan TW, Norman CL, Provost LP. The Improvement Guide: A Practical Approach to Enhancing Organizational Performance (2nd edition). San Francisco: Jossey-Bass Publishers; 2009.
3. Nelson EC, Batalden PB, Godfrey MM. Quality By Design: A Clinical Microsystems Approach. San Francisco, California: Jossey-Bass; 2007.
4. Ogrinc G, Davies L, Goodman D et.al. SQUIRE 2.0 (Standards for Quality Improvement Reporting Excellence): revised publication guidelines from a detailed consensus process. BMJ Qual Saf. 2015 Sep 14.