User login
Predictors of Medication Adherence
In the outpatient setting, medication adherence (defined as percentage of prescribed medication doses taken by a patient during a specific time period) ranges between 40% and 80% for chronic conditions.1 During acute care hospitalization, changes are often made to patients' medication regimens, which can be confusing and contribute to nonadherence, medication errors, and harmful adverse events.2 Indeed, it is estimated that almost half of patients encounter a medication error after discharge, and approximately 12%17% experience an adverse drug event after returning home.36 It is likely that some of these adverse events may be the result of medication nonadherence.7 Improved patientprovider communication, systems to reconcile prehospitalization and posthospitalization medications, as well as development of mechanisms to enhance adherence, may prevent many of these errors and have become new targets for quality improvement.4, 8 Although postdischarge medication adherence is a crucial target for avoiding adverse events and rehospitalization, few studies have focused on understanding its incidence and predictors, in particular, patient demographic factors such as age and insurance status.911
In addition, few studies have looked at general and posthospital adherence in a population where health literacy is measured, an important area because medication changes during hospitalization may be particularly confusing for patients with low health literacy.11, 12 Health literacy is defined as the degree to which an individual has the capacity to obtain, process, and understand basic health information and services needed to make appropriate health decisions.13 Prior outpatient research shows that low health literacy is associated with poor patient understanding of the medication regimen and instructions for medication use, which may contribute to postdischarge medication nonadherence.14, 15 Understanding the factors associated with postdischarge medication adherence could help refine interventions that are oriented toward improving transitions in care, patient safety, and reducing unnecessary rehospitalization.
We report here on factors associated with postdischarge medication adherence using data from the Pharmacist Intervention for Low Literacy in Cardiovascular Disease (PILL‐CVD) study.16
METHODS
Study and Participants
PILL‐CVD was a federally funded, 2‐site randomized controlled trial using pharmacist‐assisted medication reconciliation, inpatient pharmacist counseling, low‐literacy adherence aids, and telephone follow‐up that aimed to decrease rates of serious medication errors after hospital discharge.16 The study targeted patients with cardiovascular disease (hospitalized on cardiology or general medical or geriatric services for acute coronary syndromes [ACS] or acute decompensated heart failure [ADHF]) at 2 large academic hospitals, Brigham and Women's Hospital (BWH) and Vanderbilt University Hospital (VUH).
Subjects were eligible for enrollment if they met criteria for ACS or ADHF, were likely to be discharged to home as determined by the primary medical team at the time of study enrollment, and took primary responsibility for administering their medications prior to admission (caregivers could be involved in medication management after discharge). Exclusion criteria included severe visual or hearing impairment, inability to communicate in English or Spanish, active psychiatric illness, dementia, delirium, illness too severe to participate, lack of a home phone number, being in police custody, or participation in another intensive medication adherence program (eg, due to renal transplant).
Out of 6416 patients originally screened for possible enrollment, 862 were randomly assigned to receive usual care or usual care plus the intervention, and 851 remained in the study.16 Both the main study and this secondary data analysis were approved by the Institutional Review Boards of each site.
Baseline Measures
Following informed consent and study enrollment, a variety of baseline data were collected on study participants from medical records and patient interview, including primary language, demographic information (age, race, insurance status, income, and education level), cognition (through administration of the 05‐point MiniCog scale),17 and level of health literacy (through use of the 036‐point short form of the Test of Functional Health Literacy in Adults [s‐TOFHLA] scale).18 Baseline information was also collected on medication use, including number of preadmission medications, measurement of self‐reported adherence prior to admission (using the Morisky scale, a validated 04‐point questionnaire shown to correlate with disease control and indicative of general patterns of adherence),19 and a medication understanding score, adapted from other instruments, which quantifies understanding of the indication, dose, and frequency of up to 5 randomly selected preadmission medications on a 03‐point scale.16, 20, 21
Outcome Measures
Outcomes were collected 30 days postdischarge through a structured questionnaire, administered by telephone. Only patients who completed this call are included in the present analysis. Postdischarge medication adherence was assessed by asking patients to report the number of days out of the previous week they had taken each medication from their postdischarge regimen exactly as prescribed.22 A score was calculated for each medication as the proportion of adherent days (eg, if a patient reported missing 2 days of a medication in the previous week, then adherence would be 5/7 or 71%). A global postdischarge adherence score was then derived for each patient by averaging the adherence score for all regularly scheduled medications. This quantitative measure focused on adherence to medications patients knew they should be taking and did not measure medication discrepancies (sometimes termed unintentional nonadherence).
Analysis
Patient characteristics were summarized and reported using simple descriptive statistics. Candidate predictors of postdischarge medication adherence were chosen a priori from patient characteristics assessed during hospital admission. These included patient age, gender, race, ethnicity, marital status, insurance, years of education, presence of primary care physician (PCP), study site, number of preadmission medications, medication understanding, baseline adherence, cognition, and health literacy. Unadjusted results were calculated using univariable linear regression, with each patient's adherence score as the dependent variable and each predictor as the independent variable. Adjusted results were then derived using multivariable linear regression with all the candidate predictors in the model.
Lastly, because of missing data for some predictors, in particular baseline adherence and medication understanding, multiple imputation techniques were used to impute missing data and increase statistical power.23 We used the Markov Chain Monte Carlo (MCMC) method for multiple imputation, which generally assumes that the data came from a normal distribution and that the missing data are missing at random. Because of the essentially normal distribution of the data, and because the amount of missing data was so small (<1% for almost all variables, 5% for baseline adherence, and 8% for medication understanding), we expected little bias and present the complete case analysis, which maximized statistical power.
Two‐sided P values <0.05 were considered significant, and SAS version 9.2 (Cary, NC) was used for all analyses.
RESULTS
Table 1 shows descriptive baseline patient characteristics of study sample (responders) as well as nonresponders at 30 days. For the responders, the mean age of the 646 patients was 61.2 years, 94.7% were insured, and 19.3% had inadequate or marginal health literacy. Patients were prescribed an average of 8 preadmission medications. Most patients (92.3%) had a regular PCP prior to admission. Nonresponders had nonsignificant trends towards having lower health literacy, medication understanding, and baseline medication adherence.
| Characteristic | Total N, 30‐Day Respondents | Value | Total N, Nonrespondents | Value |
|---|---|---|---|---|
| ||||
| Age, mean in yr (SD) | 646 | 61.2 (13.5) | 45 | 55.4 (14.3) |
| Gender, N (percentage) | 646 | 45 | ||
| Female | 272 (42.1) | 18 (40.0) | ||
| Male | 374 (57.9) | 27 (60.0) | ||
| Race, N (percentage) | 643 | 45 | ||
| White | 511 (79.5) | 32 (71.1) | ||
| Black | 104 (16.2) | 11 (24.4) | ||
| Other | 28 (4.4) | 2 (4.4) | ||
| Ethnicity, N (percentage) | 639 | 45 | ||
| Hispanic | 24 (3.8) | 1 (2.2) | ||
| Not Hispanic | 615 (96.2) | 44 (97.8) | ||
| Marital status, N (percentage) | 646 | 45 | ||
| Married/cohabitate | 382 (59.1) | 20 (44.4) | ||
| Separated/divorced | 118 (18.3) | 11 (24.4) | ||
| Widowed | 81 (12.5) | 5 (11.1) | ||
| Never married | 65 (10.1) | 9 (2.0) | ||
| Insurance type, N (percentage) | 646 | 45 | ||
| Medicaid | 53 (8.2) | 5 (11.1) | ||
| Medicare | 270 (41.8) | 13 (28.9) | ||
| Private | 289 (44.7) | 19 (42.2) | ||
| Self‐pay | 34 (5.3) | 8 (17.8) | ||
| Years of education, mean in yr (SD) | 643 | 14.0 (3.1) | 45 | 13.3 (2.7) |
| Presence of PCP prior to admission, N (percentage) | 646 | 45 | ||
| Yes | 596 (92.3) | 38 (84.4) | ||
| No | 50 (7.74) | 7 (15.6) | ||
| Site, N (percentage) | 646 | 45 | ||
| Site 1 | 358 (55.4) | 8 (17.8) | ||
| Site 2 | 288 (44.6) | 37 (82.2) | ||
| No. of preadmission medications, mean no. (SD) | 641 | 7.8 (4.8) | 45 | 7.7 (5.4) |
| Medication understanding score, mean (SD)* | 597 | 2.4 (0.5) | 40 | 2.2 (0.62) |
| Health literacy (s‐TOFHLA) score, mean (SD) | 642 | 29.1 (8.9) | 45 | 26.0 (12.0) |
| Baseline adherence (SD) | 613 | 2.7 (1.1) | 45 | 2.4 (1.2) |
| MiniCog score, N (percentage) | 646 | 45 | ||
| Demented | 63 (9.8) | 5 (11.1) | ||
| Not demented | 583 (90.2) | 40 (88.9) | ||
The average postdischarge adherence score was 95% (standard deviation [SD] = 10.2%), and less than 10% of patients had an adherence score of less than 85%; overall the distribution was left‐skewed. Table 2 illustrates crude and adjusted parameter estimates for variables in the model. Table 3 shows significant findings in the fully adjusted model, which used multiple imputation techniques to account for missing data.
| Predictor | Crude Parameter Estimate (Beta) With 95% Confidence Intervals | P Value | Adjusted Parameter Estimate (Beta) With 95% Confidence Intervals | P Value |
|---|---|---|---|---|
| ||||
| Age per 10 yr | 0.010 (0.007, 0.020) | <0.0001 | 0.010 (0.002, 0.020) | 0.018 |
| Male gender | 0.012 (0.004, 0.028) | 0.137 | 0.003 (0.014, 0.020) | 0.727 |
| Race/ethnicity | ||||
| White | 0.011 (0.009, 0.031) | 0.266 | Ref | Ref |
| Black | 0.017 (0.038, 0.005) | 0.13 | 0.006 (0.017, 0.030) | 0.598 |
| Other | 0.010 (0.029, 0.049) | 0.599 | 0.017 (0.027, 0.062) | 0.446 |
| Hispanic/Latino | 0.005 (0.037, 0.047) | 0.803 | 0.036 (0.013, 0.085) | 0.149 |
| Marital status | ||||
| Married/cohabitate | 0.006 (0.011, 0.022) | 0.500 | Ref | Ref |
| Separated/divorced | 0.005 (0.025, 0.016) | 0.664 | 0.009 (0.014, 0.031) | 0.446 |
| Widowed | 0.001 (0.023, 0.025) | 0.922 | 0.013 (0.039, 0.013) | 0.338 |
| Never married | 0.009 (0.035, 0.018) | 0.515 | 0.004 (0.033, 0.025) | 0.784 |
| Insurance type | ||||
| Private | 0.008 (0.008, 0.024) | 0.347 | Ref | Ref |
| Medicaid | 0.046 (0.075, 0.018) | 0.002 | 0.026 (0.058, 0.007) | 0.121 |
| Medicare | 0.012 (0.004, 0.028) | 0.138 | 0.002 (0.023, 0.018) | 0.844 |
| Self‐pay | 0.027 (0.062, 0.008) | 0.135 | 0.029 (0.073, 0.015) | 0.202 |
| Years of education | 0.003 (0.0003, 0.005) | 0.028 | 0.0001 (0.003, 0.003) | 0.949 |
| Presence of PCP prior to admission | 0.007 (0.022, 0.037) | 0.630 | 0.002 (0.032, 0.036) | 0.888 |
| Site | 0.050 (0.065, 0.034) | <0.0001 | 0.038 (0.056, 0.021) | <0.0001 |
| No. of preadmission medications | 0.0003 (0.002, 0.001) | 0.684 | 0.0001 (0.002, 0.002) | 0.918 |
| Medication understanding score per point | 0.007 (0.009, 0.023) | 0.390 | 0.006 (0.011, 0.023) | 0.513 |
| Health literacy (s‐TOFHLA) score per 10 points | 0.0006 (0.008, 0.01) | 0.897 | 0.003 (0.008, 0.01) | 0.644 |
| Baseline adherence per point | 0.023 (0.016, 0.031) | <0.0001 | 0.017 (0.009, 0.024) | <0.0001 |
| Cognitive function | 0.004 (0.022, 0.031) | 0.757 | 0.008 (0.019, 0.036) | 0.549 |
| Predictor | Parameter Estimate (Beta) With 95% Confidence Intervals | P Value |
|---|---|---|
| ||
| Age per 10 yr | 0.010 (0.004, 0.020) | 0.004 |
| Insurance type | ||
| Private | Ref | Ref |
| Medicaid | 0.045 (0.076, 0.014) | 0.005 |
| Medicare | 0.010 (0.030, 0.010) | 0.333 |
| Self‐pay | 0.013 (0.050, 0.025) | 0.512 |
| Site | 0.036 (0.053, 0.019) | <0.0001 |
| Baseline adherence per point | 0.016 (0.008, 0.024) | <0.0001 |
Intervention arm was of borderline statistical significance in predicting postdischarge adherence (P = 0.052), and so was removed from the final model. Study site, age, insurance, and baseline adherence were the only significant independent predictors of postdischarge adherence in the fully adjusted model (Table 3). For example, for every 10‐year increase in age, patients had, on average, an adjusted 1% absolute increase in their adherence score (95% confidence interval [CI] 0.4% to 2.0%). For every 1‐point increase in baseline medication adherence (based on the Morisky scale), there was a 1.6% absolute increase in medication adherence (95% CI 0.8% to 2.4%). In unadjusted analyses, patients with Medicaid were less adherent with medications after discharge than were patients with private insurance. This difference became nonsignificant in adjusted analyses, but when analyses were repeated using multiple imputation techniques, the results again became statistically significantMedicaid insurance was associated with a 4.5% absolute decrease in postdischarge adherence compared with private insurance (95% CI 7.6% to 1.4%). Study site (specifically, Brigham and Women's Hospital) was also a significant predictor of greater postdischarge medication adherence. Years of education was a significant predictor of adherence in unadjusted analyses, but was not an independent predictor when adjusted for other factors. When baseline adherence was removed from the multiple imputation model, there were no changes in which factors were significant predictors of adherence.
DISCUSSION
In this study, we found that low baseline adherence, younger age, Medicaid insurance, and study site were significant predictors of lower 30‐day medication adherence. Of particular interest is our finding regarding baseline adherence, a simple measure to obtain on hospitalized patients. It is notable that in our study, education was not an independent significant predictor of postdischarge adherence, even when baseline adherence was removed from the model. The same is true for medication understanding, cognitive function, and health literacy.
Older patients appeared more adherent with medications in the month after hospital discharge, perhaps reflecting increased interaction with the healthcare system (appointments, number of physician interactions), a greater belief in the importance of chronic medication management, or a higher level of experience with managing medications. A similar relationship between age and adherence has been shown in outpatient studies of patients with hypertension, diabetes, and other chronic diseases.2427
Medicaid patients may be less likely to remain adherent because of the plan's limited coverage of medications relative to patients' ability to pay. For example, Medicaid in Tennessee covers the first 5 generic medications at no cost to the patient but has co‐payments for additional medications and for brand name drugs. Medicaid in Massachusetts has co‐payments of $1 to $3 for each medication. Alternatively, Medicaid insurance may be a marker for other patient characteristics associated with low adherence for which we were not fully able to adjust.
Site differences were also notable in this study; these differences could have been due to differences in insurance coverage in Tennessee versus Massachusetts (which has near‐universal coverage), differences in types of insurance (eg, fewer patients at Brigham and Women's Hospital had Medicaid than at Vanderbilt), cultural and geographic differences between the 2 locations, or other differences in transitional care between the 2 sites.
This study corroborates previous literature on medication adherence (specifically unintentional nonadherence) in the outpatient setting,4, 811 for example, on the association of younger age with low adherence in certain populations. On the other hand, it may contrast with previous literature which has sometimes shown a relationship between patient education or health literacy and medication adherence.14, 15, 2835 However, previous studies have not focused on the transition from inpatient to outpatient settings. Perhaps intensive medication education in the hospital, even under usual care, mitigates the effects of these factors on postdischarge adherence. Finally, baseline adherence seems to correlate with postdischarge adherence, a finding which makes intuitive sense and has been previously reported for specific medications.36
There are several limitations to this study. Although large, the study was performed at only 2 clinical sites where most patients were white and fairly well‐educated, perhaps because patients admitted to a tertiary care center with ACS or ADHF are more affluent than general medical inpatients as a whole; this may limit generalizability. Postdischarge medication adherence might have been higher than in other patient populations given the nature of the population, possible loss‐to‐follow‐up bias, and the fact that half of the subjects received an intervention designed to improve medication management after discharge; such low rates of nonadherence in our study may have reduced our ability to detect important predictors in our models. In addition, the period of follow‐up was 30 days, thus limiting our findings to short‐term postdischarge medication adherence. Postdischarge medication adherence was based on patient self‐report, which not only assumed that the patient was still managing his/her own medications after discharge, but may also be susceptible to both recall and social acceptability bias, which might overestimate our adherence scores, again limiting our ability to detect important predictors of nonadherence. However, other studies have shown a good correlation between self‐reported medication adherence and other more objective measures,37, 38 and recall was only for 7 days, a measure used previously in the literature39, 40 and one designed to reduce recall bias. Systematic underreporting in certain patient populations is less likely but possible.
In the future, research should focus on targeting patients who have low baseline adherence to evaluate the effects of various interventions on postdischarge medication outcomes. Repeating the study in a population with a high prevalence of low health literacy might be illuminating, given that previous studies have shown that patients with low health literacy have less ability to identify their medications and have less refill adherence.29, 30
In conclusion, in patients hospitalized with cardiovascular disease, predictors of lower postdischarge adherence include younger age, Medicaid insurance, and low baseline adherence. It may be prudent to assess baseline adherence and insurance type in hospitalized patients in order to identify those who may benefit from additional assistance to improve medication adherence and medication safety during transitions in care.
Acknowledgements
Meeting Presentations: SGIM New England Regional Meeting, oral presentation, Boston, MA, March 4, 2011; and SGIM National Meeting, poster presentation, Phoenix, AZ, May 6, 2011. Dr Schnipper had full access to all of the data in the study and takes responsibility for the integrity of the data and the accuracy of the data analysis.
Disclosures: Financial support was provided by R01 HL089755 (NHLBI, Kripalani), K23 HL077597 (NHLBI, Kripalani), K08 HL072806 (NHLBI, Schnipper), T32HP10251‐02 (Cohen), and by the Division of General Medicine, Massachusetts General Hospital and the Harvard Medical School Fellowship in General Medicine and Primary Care (Cohen). Dr Kripalani is a consultant to and holds equity in PictureRx, LLC, which makes patient education tools to improve medication management. PictureRx did not provide materials or funding for this study. All other authors disclose no relevant or financial conflicts of interest.
- ,.Adherence to medication.N Engl J Med.2005;353(5):487–497.
- ,,,.Posthospital medication discrepancies: prevalence and contributing factors.Arch Intern Med.2005;165(16):1842–1847.
- ,.Medication use in the transition from hospital to home.Ann Acad Med Singapore.2008;37(2):136–141.
- ,,,.Medical errors related to discontinuity of care from an inpatient to an outpatient setting.J Gen Intern Med.2003;18(8):646–651.
- ,,,,.The incidence and severity of adverse events affecting patients after discharge from the hospital.Ann Intern Med.2003;138(3):161–167.
- ,,,,.Adverse drug events occurring following hospital discharge.J Gen Intern Med.2005;20(4):317–323.
- ,,, et al.Role of pharmacist counseling in preventing adverse drug events after hospitalization.Arch Intern Med.2006;166(5):565–571.
- ,,.Reconcilable differences: correcting medication errors at hospital admission and discharge.Qual Saf Health Care.2006;15(2):122–126.
- ,.Risk of rehospitalization among bipolar disorder patients who are nonadherent to antipsychotic therapy after hospital discharge.Am J Health Syst Pharm.2009;66(4):358–365.
- ,,,,.Continuity and adherence to long‐term drug treatment by geriatric patients after hospital discharge: a prospective cohort study.Drugs Aging.2008;25(10):861–870.
- ,,,.Medication use among inner‐city patients after hospital discharge: patient‐reported barriers and solutions.Mayo Clin Proc.2008;83(5):529–535.
- ,,,,,.Relationship of health literacy to intentional and unintentional non‐adherence of hospital discharge medications.J Gen Intern Med.2012;27(2):173–178.
- Office of Disease Prevention and Health Promotion, US Department of Health and Human Services.Healthy People 2010. Available at: http://www.healthypeople.gov/Document/pdf/uih/2010uih.pdf. Accessed February 15,2012.
- ,,, et al.Literacy and misunderstanding prescription drug labels.Ann Intern Med.2006;145(12):887–894.
- ,,,,,.Predictors of medication self‐management skill in a low‐literacy population.J Gen Intern Med.2006;21(8):852–856.
- ,,, et al;for the PILL‐CVD Study Group.Rationale and design of the Pharmacist Intervention for Low Literacy in Cardiovascular Disease (PILL‐CVD) study.Circ Cardiovasc Qual Outcomes.2010;3(2):212–219.
- ,,,,.Simplifying detection of cognitive impairment: comparison of the Mini‐Cog and Mini‐Mental State Examination in a multiethnic sample.J Am Geriatr Soc.2005;53(5):871–874.
- .Short Test of Functional Health Literacy in Adults.Snow Camp, NC:Peppercorn Books and Press;1998.
- ,,,.Predictive validity of a medication adherence measure in an outpatient setting.J Clin Hypertens (Greenwich).2008;10(5):348–354.
- ,,,,,.Health literacy and medication understanding among hospitalized adults.J Hosp Med. In press.
- ,,,,,.Health literacy and medication understanding among hospitalized adults.J Hosp Med.2011;6(9):488–493.
- ,,.The summary of diabetes self‐care activities measure: results from 7 studies and a revised scale.Diabetes Care.2000;23(7):943–950.
- .Multiple Imputation for Nonresponse in Surveys.New York, NY:John Wiley 1987.
- ,,, et al.Medication adherence in HIV‐infected adults: effect of patient age, cognitive status, and substance abuse.AIDS.2004;18(suppl 1):S19–S25.
- ,,.Factors associated with antihypertensive drug compliance in 83,884 Chinese patients: a cohort study.J Epidemiol Community Health.2010;64(10):895–901.
- ,,,,,.Adherence to oral hypoglycemic agents in 26,782 Chinese patients: a cohort study.J Clin Pharmacol.2011;51(10):1474–1482.
- ,,,,.Effect of a pharmacy‐based health literacy intervention and patient characteristics on medication refill adherence in an urban health system.Ann Pharmacother.2010;44(1):80–87.
- ,,.Adherence to combination antiretroviral therapies in HIV patients of low health literacy.J Gen Intern Med.1999;14(5):267–273.
- ,,,,,.Factors associated with medication refill adherence in cardiovascular‐related diseases: a focus on health literacy.J Gen Intern Med.2006;21(12):1215–1221.
- ,,,,.Limited health literacy is a barrier to medication reconciliation in ambulatory care.J Gen Intern Med.2007;22(11):1523–1526.
- ,,,,.The impact of low health literacy on surgical practice.Am J Surg.2004;188(3):250–253.
- ,,,,.Relationships between beliefs about medications and adherence.Am J Health Syst Pharm.2009;66(7):657–664.
- ,,,.Health literacy and anticoagulation‐related outcomes among patients taking warfarin.J Gen Intern Med.2006;21(8):841–846.
- ,,,,,.Health literacy, antiretroviral adherence, and HIV‐RNA suppression: a longitudinal perspective.J Gen Intern Med.2006;21(8):835–840.
- ,,, et al.Risk factors for nonadherence to warfarin: results from the IN‐RANGE study.Pharmacoepidemiol Drug Saf.2008;17(9):853–860.
- ,,, et al.Predictors of low clopidogrel adherence following percutaneous coronary intervention.Am J Cardiol.2011;108(6):822–827.
- ,,,,,.Correlation between adherence rates measured by MEMS and self‐reported questionnaires: a meta‐analysis.Health Qual Life Outcomes.2010;8:99.
- ,,,,,.Concordance of adherence measurement using self‐reported adherence questionnaires and medication monitoring devices.Pharmacoeconomics.2010;28(12):1097–1107.
- ,,,.Polypharmacy and medication adherence in patients with type 2 diabetes.Diabetes Care.2003;26(5):1408–1412.
- ,,,.Improving adherence and reducing medication discrepancies in patients with diabetes.Ann Pharmacother.2003;37(7–8):962–969.
In the outpatient setting, medication adherence (defined as percentage of prescribed medication doses taken by a patient during a specific time period) ranges between 40% and 80% for chronic conditions.1 During acute care hospitalization, changes are often made to patients' medication regimens, which can be confusing and contribute to nonadherence, medication errors, and harmful adverse events.2 Indeed, it is estimated that almost half of patients encounter a medication error after discharge, and approximately 12%17% experience an adverse drug event after returning home.36 It is likely that some of these adverse events may be the result of medication nonadherence.7 Improved patientprovider communication, systems to reconcile prehospitalization and posthospitalization medications, as well as development of mechanisms to enhance adherence, may prevent many of these errors and have become new targets for quality improvement.4, 8 Although postdischarge medication adherence is a crucial target for avoiding adverse events and rehospitalization, few studies have focused on understanding its incidence and predictors, in particular, patient demographic factors such as age and insurance status.911
In addition, few studies have looked at general and posthospital adherence in a population where health literacy is measured, an important area because medication changes during hospitalization may be particularly confusing for patients with low health literacy.11, 12 Health literacy is defined as the degree to which an individual has the capacity to obtain, process, and understand basic health information and services needed to make appropriate health decisions.13 Prior outpatient research shows that low health literacy is associated with poor patient understanding of the medication regimen and instructions for medication use, which may contribute to postdischarge medication nonadherence.14, 15 Understanding the factors associated with postdischarge medication adherence could help refine interventions that are oriented toward improving transitions in care, patient safety, and reducing unnecessary rehospitalization.
We report here on factors associated with postdischarge medication adherence using data from the Pharmacist Intervention for Low Literacy in Cardiovascular Disease (PILL‐CVD) study.16
METHODS
Study and Participants
PILL‐CVD was a federally funded, 2‐site randomized controlled trial using pharmacist‐assisted medication reconciliation, inpatient pharmacist counseling, low‐literacy adherence aids, and telephone follow‐up that aimed to decrease rates of serious medication errors after hospital discharge.16 The study targeted patients with cardiovascular disease (hospitalized on cardiology or general medical or geriatric services for acute coronary syndromes [ACS] or acute decompensated heart failure [ADHF]) at 2 large academic hospitals, Brigham and Women's Hospital (BWH) and Vanderbilt University Hospital (VUH).
Subjects were eligible for enrollment if they met criteria for ACS or ADHF, were likely to be discharged to home as determined by the primary medical team at the time of study enrollment, and took primary responsibility for administering their medications prior to admission (caregivers could be involved in medication management after discharge). Exclusion criteria included severe visual or hearing impairment, inability to communicate in English or Spanish, active psychiatric illness, dementia, delirium, illness too severe to participate, lack of a home phone number, being in police custody, or participation in another intensive medication adherence program (eg, due to renal transplant).
Out of 6416 patients originally screened for possible enrollment, 862 were randomly assigned to receive usual care or usual care plus the intervention, and 851 remained in the study.16 Both the main study and this secondary data analysis were approved by the Institutional Review Boards of each site.
Baseline Measures
Following informed consent and study enrollment, a variety of baseline data were collected on study participants from medical records and patient interview, including primary language, demographic information (age, race, insurance status, income, and education level), cognition (through administration of the 05‐point MiniCog scale),17 and level of health literacy (through use of the 036‐point short form of the Test of Functional Health Literacy in Adults [s‐TOFHLA] scale).18 Baseline information was also collected on medication use, including number of preadmission medications, measurement of self‐reported adherence prior to admission (using the Morisky scale, a validated 04‐point questionnaire shown to correlate with disease control and indicative of general patterns of adherence),19 and a medication understanding score, adapted from other instruments, which quantifies understanding of the indication, dose, and frequency of up to 5 randomly selected preadmission medications on a 03‐point scale.16, 20, 21
Outcome Measures
Outcomes were collected 30 days postdischarge through a structured questionnaire, administered by telephone. Only patients who completed this call are included in the present analysis. Postdischarge medication adherence was assessed by asking patients to report the number of days out of the previous week they had taken each medication from their postdischarge regimen exactly as prescribed.22 A score was calculated for each medication as the proportion of adherent days (eg, if a patient reported missing 2 days of a medication in the previous week, then adherence would be 5/7 or 71%). A global postdischarge adherence score was then derived for each patient by averaging the adherence score for all regularly scheduled medications. This quantitative measure focused on adherence to medications patients knew they should be taking and did not measure medication discrepancies (sometimes termed unintentional nonadherence).
Analysis
Patient characteristics were summarized and reported using simple descriptive statistics. Candidate predictors of postdischarge medication adherence were chosen a priori from patient characteristics assessed during hospital admission. These included patient age, gender, race, ethnicity, marital status, insurance, years of education, presence of primary care physician (PCP), study site, number of preadmission medications, medication understanding, baseline adherence, cognition, and health literacy. Unadjusted results were calculated using univariable linear regression, with each patient's adherence score as the dependent variable and each predictor as the independent variable. Adjusted results were then derived using multivariable linear regression with all the candidate predictors in the model.
Lastly, because of missing data for some predictors, in particular baseline adherence and medication understanding, multiple imputation techniques were used to impute missing data and increase statistical power.23 We used the Markov Chain Monte Carlo (MCMC) method for multiple imputation, which generally assumes that the data came from a normal distribution and that the missing data are missing at random. Because of the essentially normal distribution of the data, and because the amount of missing data was so small (<1% for almost all variables, 5% for baseline adherence, and 8% for medication understanding), we expected little bias and present the complete case analysis, which maximized statistical power.
Two‐sided P values <0.05 were considered significant, and SAS version 9.2 (Cary, NC) was used for all analyses.
RESULTS
Table 1 shows descriptive baseline patient characteristics of study sample (responders) as well as nonresponders at 30 days. For the responders, the mean age of the 646 patients was 61.2 years, 94.7% were insured, and 19.3% had inadequate or marginal health literacy. Patients were prescribed an average of 8 preadmission medications. Most patients (92.3%) had a regular PCP prior to admission. Nonresponders had nonsignificant trends towards having lower health literacy, medication understanding, and baseline medication adherence.
| Characteristic | Total N, 30‐Day Respondents | Value | Total N, Nonrespondents | Value |
|---|---|---|---|---|
| ||||
| Age, mean in yr (SD) | 646 | 61.2 (13.5) | 45 | 55.4 (14.3) |
| Gender, N (percentage) | 646 | 45 | ||
| Female | 272 (42.1) | 18 (40.0) | ||
| Male | 374 (57.9) | 27 (60.0) | ||
| Race, N (percentage) | 643 | 45 | ||
| White | 511 (79.5) | 32 (71.1) | ||
| Black | 104 (16.2) | 11 (24.4) | ||
| Other | 28 (4.4) | 2 (4.4) | ||
| Ethnicity, N (percentage) | 639 | 45 | ||
| Hispanic | 24 (3.8) | 1 (2.2) | ||
| Not Hispanic | 615 (96.2) | 44 (97.8) | ||
| Marital status, N (percentage) | 646 | 45 | ||
| Married/cohabitate | 382 (59.1) | 20 (44.4) | ||
| Separated/divorced | 118 (18.3) | 11 (24.4) | ||
| Widowed | 81 (12.5) | 5 (11.1) | ||
| Never married | 65 (10.1) | 9 (2.0) | ||
| Insurance type, N (percentage) | 646 | 45 | ||
| Medicaid | 53 (8.2) | 5 (11.1) | ||
| Medicare | 270 (41.8) | 13 (28.9) | ||
| Private | 289 (44.7) | 19 (42.2) | ||
| Self‐pay | 34 (5.3) | 8 (17.8) | ||
| Years of education, mean in yr (SD) | 643 | 14.0 (3.1) | 45 | 13.3 (2.7) |
| Presence of PCP prior to admission, N (percentage) | 646 | 45 | ||
| Yes | 596 (92.3) | 38 (84.4) | ||
| No | 50 (7.74) | 7 (15.6) | ||
| Site, N (percentage) | 646 | 45 | ||
| Site 1 | 358 (55.4) | 8 (17.8) | ||
| Site 2 | 288 (44.6) | 37 (82.2) | ||
| No. of preadmission medications, mean no. (SD) | 641 | 7.8 (4.8) | 45 | 7.7 (5.4) |
| Medication understanding score, mean (SD)* | 597 | 2.4 (0.5) | 40 | 2.2 (0.62) |
| Health literacy (s‐TOFHLA) score, mean (SD) | 642 | 29.1 (8.9) | 45 | 26.0 (12.0) |
| Baseline adherence (SD) | 613 | 2.7 (1.1) | 45 | 2.4 (1.2) |
| MiniCog score, N (percentage) | 646 | 45 | ||
| Demented | 63 (9.8) | 5 (11.1) | ||
| Not demented | 583 (90.2) | 40 (88.9) | ||
The average postdischarge adherence score was 95% (standard deviation [SD] = 10.2%), and less than 10% of patients had an adherence score of less than 85%; overall the distribution was left‐skewed. Table 2 illustrates crude and adjusted parameter estimates for variables in the model. Table 3 shows significant findings in the fully adjusted model, which used multiple imputation techniques to account for missing data.
| Predictor | Crude Parameter Estimate (Beta) With 95% Confidence Intervals | P Value | Adjusted Parameter Estimate (Beta) With 95% Confidence Intervals | P Value |
|---|---|---|---|---|
| ||||
| Age per 10 yr | 0.010 (0.007, 0.020) | <0.0001 | 0.010 (0.002, 0.020) | 0.018 |
| Male gender | 0.012 (0.004, 0.028) | 0.137 | 0.003 (0.014, 0.020) | 0.727 |
| Race/ethnicity | ||||
| White | 0.011 (0.009, 0.031) | 0.266 | Ref | Ref |
| Black | 0.017 (0.038, 0.005) | 0.13 | 0.006 (0.017, 0.030) | 0.598 |
| Other | 0.010 (0.029, 0.049) | 0.599 | 0.017 (0.027, 0.062) | 0.446 |
| Hispanic/Latino | 0.005 (0.037, 0.047) | 0.803 | 0.036 (0.013, 0.085) | 0.149 |
| Marital status | ||||
| Married/cohabitate | 0.006 (0.011, 0.022) | 0.500 | Ref | Ref |
| Separated/divorced | 0.005 (0.025, 0.016) | 0.664 | 0.009 (0.014, 0.031) | 0.446 |
| Widowed | 0.001 (0.023, 0.025) | 0.922 | 0.013 (0.039, 0.013) | 0.338 |
| Never married | 0.009 (0.035, 0.018) | 0.515 | 0.004 (0.033, 0.025) | 0.784 |
| Insurance type | ||||
| Private | 0.008 (0.008, 0.024) | 0.347 | Ref | Ref |
| Medicaid | 0.046 (0.075, 0.018) | 0.002 | 0.026 (0.058, 0.007) | 0.121 |
| Medicare | 0.012 (0.004, 0.028) | 0.138 | 0.002 (0.023, 0.018) | 0.844 |
| Self‐pay | 0.027 (0.062, 0.008) | 0.135 | 0.029 (0.073, 0.015) | 0.202 |
| Years of education | 0.003 (0.0003, 0.005) | 0.028 | 0.0001 (0.003, 0.003) | 0.949 |
| Presence of PCP prior to admission | 0.007 (0.022, 0.037) | 0.630 | 0.002 (0.032, 0.036) | 0.888 |
| Site | 0.050 (0.065, 0.034) | <0.0001 | 0.038 (0.056, 0.021) | <0.0001 |
| No. of preadmission medications | 0.0003 (0.002, 0.001) | 0.684 | 0.0001 (0.002, 0.002) | 0.918 |
| Medication understanding score per point | 0.007 (0.009, 0.023) | 0.390 | 0.006 (0.011, 0.023) | 0.513 |
| Health literacy (s‐TOFHLA) score per 10 points | 0.0006 (0.008, 0.01) | 0.897 | 0.003 (0.008, 0.01) | 0.644 |
| Baseline adherence per point | 0.023 (0.016, 0.031) | <0.0001 | 0.017 (0.009, 0.024) | <0.0001 |
| Cognitive function | 0.004 (0.022, 0.031) | 0.757 | 0.008 (0.019, 0.036) | 0.549 |
| Predictor | Parameter Estimate (Beta) With 95% Confidence Intervals | P Value |
|---|---|---|
| ||
| Age per 10 yr | 0.010 (0.004, 0.020) | 0.004 |
| Insurance type | ||
| Private | Ref | Ref |
| Medicaid | 0.045 (0.076, 0.014) | 0.005 |
| Medicare | 0.010 (0.030, 0.010) | 0.333 |
| Self‐pay | 0.013 (0.050, 0.025) | 0.512 |
| Site | 0.036 (0.053, 0.019) | <0.0001 |
| Baseline adherence per point | 0.016 (0.008, 0.024) | <0.0001 |
Intervention arm was of borderline statistical significance in predicting postdischarge adherence (P = 0.052), and so was removed from the final model. Study site, age, insurance, and baseline adherence were the only significant independent predictors of postdischarge adherence in the fully adjusted model (Table 3). For example, for every 10‐year increase in age, patients had, on average, an adjusted 1% absolute increase in their adherence score (95% confidence interval [CI] 0.4% to 2.0%). For every 1‐point increase in baseline medication adherence (based on the Morisky scale), there was a 1.6% absolute increase in medication adherence (95% CI 0.8% to 2.4%). In unadjusted analyses, patients with Medicaid were less adherent with medications after discharge than were patients with private insurance. This difference became nonsignificant in adjusted analyses, but when analyses were repeated using multiple imputation techniques, the results again became statistically significantMedicaid insurance was associated with a 4.5% absolute decrease in postdischarge adherence compared with private insurance (95% CI 7.6% to 1.4%). Study site (specifically, Brigham and Women's Hospital) was also a significant predictor of greater postdischarge medication adherence. Years of education was a significant predictor of adherence in unadjusted analyses, but was not an independent predictor when adjusted for other factors. When baseline adherence was removed from the multiple imputation model, there were no changes in which factors were significant predictors of adherence.
DISCUSSION
In this study, we found that low baseline adherence, younger age, Medicaid insurance, and study site were significant predictors of lower 30‐day medication adherence. Of particular interest is our finding regarding baseline adherence, a simple measure to obtain on hospitalized patients. It is notable that in our study, education was not an independent significant predictor of postdischarge adherence, even when baseline adherence was removed from the model. The same is true for medication understanding, cognitive function, and health literacy.
Older patients appeared more adherent with medications in the month after hospital discharge, perhaps reflecting increased interaction with the healthcare system (appointments, number of physician interactions), a greater belief in the importance of chronic medication management, or a higher level of experience with managing medications. A similar relationship between age and adherence has been shown in outpatient studies of patients with hypertension, diabetes, and other chronic diseases.2427
Medicaid patients may be less likely to remain adherent because of the plan's limited coverage of medications relative to patients' ability to pay. For example, Medicaid in Tennessee covers the first 5 generic medications at no cost to the patient but has co‐payments for additional medications and for brand name drugs. Medicaid in Massachusetts has co‐payments of $1 to $3 for each medication. Alternatively, Medicaid insurance may be a marker for other patient characteristics associated with low adherence for which we were not fully able to adjust.
Site differences were also notable in this study; these differences could have been due to differences in insurance coverage in Tennessee versus Massachusetts (which has near‐universal coverage), differences in types of insurance (eg, fewer patients at Brigham and Women's Hospital had Medicaid than at Vanderbilt), cultural and geographic differences between the 2 locations, or other differences in transitional care between the 2 sites.
This study corroborates previous literature on medication adherence (specifically unintentional nonadherence) in the outpatient setting,4, 811 for example, on the association of younger age with low adherence in certain populations. On the other hand, it may contrast with previous literature which has sometimes shown a relationship between patient education or health literacy and medication adherence.14, 15, 2835 However, previous studies have not focused on the transition from inpatient to outpatient settings. Perhaps intensive medication education in the hospital, even under usual care, mitigates the effects of these factors on postdischarge adherence. Finally, baseline adherence seems to correlate with postdischarge adherence, a finding which makes intuitive sense and has been previously reported for specific medications.36
There are several limitations to this study. Although large, the study was performed at only 2 clinical sites where most patients were white and fairly well‐educated, perhaps because patients admitted to a tertiary care center with ACS or ADHF are more affluent than general medical inpatients as a whole; this may limit generalizability. Postdischarge medication adherence might have been higher than in other patient populations given the nature of the population, possible loss‐to‐follow‐up bias, and the fact that half of the subjects received an intervention designed to improve medication management after discharge; such low rates of nonadherence in our study may have reduced our ability to detect important predictors in our models. In addition, the period of follow‐up was 30 days, thus limiting our findings to short‐term postdischarge medication adherence. Postdischarge medication adherence was based on patient self‐report, which not only assumed that the patient was still managing his/her own medications after discharge, but may also be susceptible to both recall and social acceptability bias, which might overestimate our adherence scores, again limiting our ability to detect important predictors of nonadherence. However, other studies have shown a good correlation between self‐reported medication adherence and other more objective measures,37, 38 and recall was only for 7 days, a measure used previously in the literature39, 40 and one designed to reduce recall bias. Systematic underreporting in certain patient populations is less likely but possible.
In the future, research should focus on targeting patients who have low baseline adherence to evaluate the effects of various interventions on postdischarge medication outcomes. Repeating the study in a population with a high prevalence of low health literacy might be illuminating, given that previous studies have shown that patients with low health literacy have less ability to identify their medications and have less refill adherence.29, 30
In conclusion, in patients hospitalized with cardiovascular disease, predictors of lower postdischarge adherence include younger age, Medicaid insurance, and low baseline adherence. It may be prudent to assess baseline adherence and insurance type in hospitalized patients in order to identify those who may benefit from additional assistance to improve medication adherence and medication safety during transitions in care.
Acknowledgements
Meeting Presentations: SGIM New England Regional Meeting, oral presentation, Boston, MA, March 4, 2011; and SGIM National Meeting, poster presentation, Phoenix, AZ, May 6, 2011. Dr Schnipper had full access to all of the data in the study and takes responsibility for the integrity of the data and the accuracy of the data analysis.
Disclosures: Financial support was provided by R01 HL089755 (NHLBI, Kripalani), K23 HL077597 (NHLBI, Kripalani), K08 HL072806 (NHLBI, Schnipper), T32HP10251‐02 (Cohen), and by the Division of General Medicine, Massachusetts General Hospital and the Harvard Medical School Fellowship in General Medicine and Primary Care (Cohen). Dr Kripalani is a consultant to and holds equity in PictureRx, LLC, which makes patient education tools to improve medication management. PictureRx did not provide materials or funding for this study. All other authors disclose no relevant or financial conflicts of interest.
- ,.Adherence to medication.N Engl J Med.2005;353(5):487–497.
- ,,,.Posthospital medication discrepancies: prevalence and contributing factors.Arch Intern Med.2005;165(16):1842–1847.
- ,.Medication use in the transition from hospital to home.Ann Acad Med Singapore.2008;37(2):136–141.
- ,,,.Medical errors related to discontinuity of care from an inpatient to an outpatient setting.J Gen Intern Med.2003;18(8):646–651.
- ,,,,.The incidence and severity of adverse events affecting patients after discharge from the hospital.Ann Intern Med.2003;138(3):161–167.
- ,,,,.Adverse drug events occurring following hospital discharge.J Gen Intern Med.2005;20(4):317–323.
- ,,, et al.Role of pharmacist counseling in preventing adverse drug events after hospitalization.Arch Intern Med.2006;166(5):565–571.
- ,,.Reconcilable differences: correcting medication errors at hospital admission and discharge.Qual Saf Health Care.2006;15(2):122–126.
- ,.Risk of rehospitalization among bipolar disorder patients who are nonadherent to antipsychotic therapy after hospital discharge.Am J Health Syst Pharm.2009;66(4):358–365.
- ,,,,.Continuity and adherence to long‐term drug treatment by geriatric patients after hospital discharge: a prospective cohort study.Drugs Aging.2008;25(10):861–870.
- ,,,.Medication use among inner‐city patients after hospital discharge: patient‐reported barriers and solutions.Mayo Clin Proc.2008;83(5):529–535.
- ,,,,,.Relationship of health literacy to intentional and unintentional non‐adherence of hospital discharge medications.J Gen Intern Med.2012;27(2):173–178.
- Office of Disease Prevention and Health Promotion, US Department of Health and Human Services.Healthy People 2010. Available at: http://www.healthypeople.gov/Document/pdf/uih/2010uih.pdf. Accessed February 15,2012.
- ,,, et al.Literacy and misunderstanding prescription drug labels.Ann Intern Med.2006;145(12):887–894.
- ,,,,,.Predictors of medication self‐management skill in a low‐literacy population.J Gen Intern Med.2006;21(8):852–856.
- ,,, et al;for the PILL‐CVD Study Group.Rationale and design of the Pharmacist Intervention for Low Literacy in Cardiovascular Disease (PILL‐CVD) study.Circ Cardiovasc Qual Outcomes.2010;3(2):212–219.
- ,,,,.Simplifying detection of cognitive impairment: comparison of the Mini‐Cog and Mini‐Mental State Examination in a multiethnic sample.J Am Geriatr Soc.2005;53(5):871–874.
- .Short Test of Functional Health Literacy in Adults.Snow Camp, NC:Peppercorn Books and Press;1998.
- ,,,.Predictive validity of a medication adherence measure in an outpatient setting.J Clin Hypertens (Greenwich).2008;10(5):348–354.
- ,,,,,.Health literacy and medication understanding among hospitalized adults.J Hosp Med. In press.
- ,,,,,.Health literacy and medication understanding among hospitalized adults.J Hosp Med.2011;6(9):488–493.
- ,,.The summary of diabetes self‐care activities measure: results from 7 studies and a revised scale.Diabetes Care.2000;23(7):943–950.
- .Multiple Imputation for Nonresponse in Surveys.New York, NY:John Wiley 1987.
- ,,, et al.Medication adherence in HIV‐infected adults: effect of patient age, cognitive status, and substance abuse.AIDS.2004;18(suppl 1):S19–S25.
- ,,.Factors associated with antihypertensive drug compliance in 83,884 Chinese patients: a cohort study.J Epidemiol Community Health.2010;64(10):895–901.
- ,,,,,.Adherence to oral hypoglycemic agents in 26,782 Chinese patients: a cohort study.J Clin Pharmacol.2011;51(10):1474–1482.
- ,,,,.Effect of a pharmacy‐based health literacy intervention and patient characteristics on medication refill adherence in an urban health system.Ann Pharmacother.2010;44(1):80–87.
- ,,.Adherence to combination antiretroviral therapies in HIV patients of low health literacy.J Gen Intern Med.1999;14(5):267–273.
- ,,,,,.Factors associated with medication refill adherence in cardiovascular‐related diseases: a focus on health literacy.J Gen Intern Med.2006;21(12):1215–1221.
- ,,,,.Limited health literacy is a barrier to medication reconciliation in ambulatory care.J Gen Intern Med.2007;22(11):1523–1526.
- ,,,,.The impact of low health literacy on surgical practice.Am J Surg.2004;188(3):250–253.
- ,,,,.Relationships between beliefs about medications and adherence.Am J Health Syst Pharm.2009;66(7):657–664.
- ,,,.Health literacy and anticoagulation‐related outcomes among patients taking warfarin.J Gen Intern Med.2006;21(8):841–846.
- ,,,,,.Health literacy, antiretroviral adherence, and HIV‐RNA suppression: a longitudinal perspective.J Gen Intern Med.2006;21(8):835–840.
- ,,, et al.Risk factors for nonadherence to warfarin: results from the IN‐RANGE study.Pharmacoepidemiol Drug Saf.2008;17(9):853–860.
- ,,, et al.Predictors of low clopidogrel adherence following percutaneous coronary intervention.Am J Cardiol.2011;108(6):822–827.
- ,,,,,.Correlation between adherence rates measured by MEMS and self‐reported questionnaires: a meta‐analysis.Health Qual Life Outcomes.2010;8:99.
- ,,,,,.Concordance of adherence measurement using self‐reported adherence questionnaires and medication monitoring devices.Pharmacoeconomics.2010;28(12):1097–1107.
- ,,,.Polypharmacy and medication adherence in patients with type 2 diabetes.Diabetes Care.2003;26(5):1408–1412.
- ,,,.Improving adherence and reducing medication discrepancies in patients with diabetes.Ann Pharmacother.2003;37(7–8):962–969.
Copyright © 2012 Society of Hospital Medicine
Glycemic Control in Medical Inpatients
Diabetes mellitus is a common comorbid condition in hospitalized patients. In 2003, diabetes was listed as a diagnosis in 17.2% of hospital discharges in the United States.1 Because these diagnosis codes do not account for undiagnosed diabetes or hospital‐related hyperglycemia, the true prevalence of diabetes or hyperglycemia in hospitalized patients is likely higher and has been estimated to be as great as 38%.2 Hyperglycemia has been associated with adverse outcomes among hospitalized patients, including infectious complications, increased length of stay, and increased mortality.27 However, because hyperglycemia is not usually the primary reason patients with diabetes are hospitalized, its management is often not a focus in the inpatient setting. Sliding‐scale insulin alone continues to be commonly prescribed despite clinical evidence showing it to be ineffective in achieving glycemic control.8, 9
Recent randomized controlled trials have demonstrated that aggressive treatment of inpatient hyperglycemia improves outcomes in surgical and medical intensive care units10, 11 and in patients admitted for myocardial infarction.12, 13 Based on this clinical evidence and strong observational data linking hyperglycemia to poor patient outcomes in the non‐ICU setting,27 the American Diabetes Association (ADA) now advocates good metabolic control, defined as preprandial glucose levels of 90‐130 mg/dL and peak postprandial glucose levels < 180 mg/dL in hospitalized non‐ICU patients with hyperglycemia14 (note that these targets are less aggressive than those for ICU patients, for whom randomized controlled trials showed the benefits of reduced mortality provided by tight glucose control).11 To reach these targets, the ADA and American College of Endocrinology suggest that multidisciplinary teams develop and implement hyperglycemia management guidelines and protocols.15 Protocols should promote the use of continuous intravenous insulin or scheduled subcutaneous insulin as opposed to the use of sliding‐scale insulin alone. Subcutaneous insulin protocols should include target glucose levels; basal, nutritional, and supplemental insulin; and daily adjustments based on previous glucose levels, insulin sensitivity, nutritional intake, illness, and medications.6, 15 To date, few published protocols or algorithms for inpatient subcutaneous insulin have been shown to be effective.16, 17 It is therefore not known how best to design and implement an inpatient diabetes management protocol that is effective, efficient, and self‐perpetuating. The aims of our pilot study were to develop and implement a subcutaneous insulin protocol on a general medicine service, to identify barriers to implementation, and to determine the effect of this protocol on glycemic control.
METHODS
Setting and Participants
This prospective quality‐improvement pilot study was conducted at Brigham and Women's Hospital (BWH) from January 10, 2005, through June 23, 2005. Patients were eligible to participate if they were admitted to either of 2 General Medicine Service (GMS) teams with either a known diagnosis of type 2 diabetes or inpatient hyperglycemia (random laboratory glucose level > 180 mg/dL) and at least 1 fasting point‐of‐care glucose reading > 140 mg/dL. Patients were excluded if they had diabetic ketoacidosis, hyperosmolar hyperglycemic state, another absolute indication for intravenous insulin, or fasting glucose < 60 mg/dL on no insulin or if they were pregnant. Each GMS team consisted of a teaching attending, a junior or senior resident, 2 interns, and a clinical pharmacist. Twenty‐six physicians attended on these 2 teams during the study period, 13 of whom were hospitalists. This study was approved by the BWH Institutional Review Board; patient consent to participate in this study was deemed not necessary because of the relatively nonsensitive nature of the data (eg, glucose control, insulin orders), the noninvasive means of data collection (eg, chart review), and the steps taken by research personnel to minimize any breach in patient confidentiality.
Intervention
A multidisciplinary team composed of a diabetologist (M.L.P.), a hospitalist (J.L.S.), and a pharmacist (J.M.T.) developed a subcutaneous insulin protocol that was approved by the BWH Pharmacy and Therapeutics Diabetes Subcommittee. The protocol consisted of a set of treatment recommendations made by a pharmacist to be carried out by the medical team. The primary components are shown in Table 1 (a full description can be found in the Appendix). The main emphasis of the protocol was on discontinuing oral antihyperglycemic agents during hospitalization, initiating basal insulin in most patients, and adjusting basal insulin daily as needed.
|
| Oral agents |
| 1. Stop oral agents in most patients |
| Glucose testing |
| 2. Check bedside blood glucose before meals and at bedtime if eating, or every 6 hours if not eating |
| Insulin |
| 3. Start basal insulin Patient's home dose or NPH 0.1 units/kg before breakfast and at bedtime or insulin glargine 0.2 units/kg at bedtime (max dose 20 units) If NPO, consider half dose unless hyperglycemic |
| 4. Start nutritional insulin Discrete meals: insulin aspart 0.05‐0.1 units/kg per meal or home dose 0‐15 minutes prior to eating Continuous tube feeds: regular insulin every 6 hours or NPH every morning and at bedtime (0.1‐0.2 units/kg per day in addition to basal insulin) Hold if NPO |
| 5. Start correctional insulin Scale provided based on blood glucose and daily scheduled insulin requirements |
| Daily Adjustments |
6. Adjust scheduled insulin daily
|
| Other Considerations |
| 7. Hypoglycemia management (protocols for fruit juice, glucagons, IV dextrose, and when to call physician) |
| 8. Discharge orders (recommendations to discharge most patients on admission medication regimen, avoid sliding scale insulin, simplify dosing for patients requiring new insulin regimens, ensure adequate patient education and prompt outpatient follow‐up) |
All medical residents received general instructions regarding inpatient diabetes control by the research team's diabetologist (M.L.P.) through a 1‐hour department‐wide didactic lecture. The standards of care taught were identical to those in the protocol. In addition, the research team's hospitalist (J.L.S.) contacted each medical resident assigned to the 2 GMS teams electronically to introduce the protocol and describe the purpose and logistics of the pilot study.
A research assistant prospectively identified eligible patients each weekday by screening all patients admitted to the 2 GMS teams using the daily computerized sign‐out system used by all medical residents. Specifically, laboratory random glucose levels, inpatient medications, and medical history were reviewed to determine if each patient met eligibility criteria. Eligibility criteria were confirmed by medical record review. The pharmacist recommended to the primary team that the protocol be initiated for eligible patients. In addition, the pharmacist recommended daily adjustment of the insulin dose according to the protocol as appropriate. A chronologically organized summary of clinical data relevant to glycemic management for each patient, including bedside blood glucose measurements, general dietary intake, use of intravenous dextrose solutions, and administration of systemic steroids, oral diabetes medications, and all insulins, was provided to the team each day by the research assistant.
Measurements
The resident's acceptance of the protocol or reasons for declining it were recorded by the pharmacist on the day the protocol was recommended. Protocol acceptance was categorized as yes, no, or partial. Partial acceptance was defined as resident agreement to use the protocol, but with stated caveats or modifications. Clinical data were collected on each eligible patient for up to 7 days on GMS. Several data sources were used, including physician admission notes, the hospital's computerized clinical data system, vital‐sign sheets, medication administration records, and personal communication with nurses regarding any missing or discrepant data.
All insulin use (prescribed drug, dose, route, schedule and actual administered drug, dose, route, and time) was recorded each day by the research assistant. Use of basal and nutritional insulin and daily dose adjustments if previous hypo‐ or hyperglycemia (categorized as yes, no, or not applicable for each patient each day) were determined by the study pharmacist (J.M.T.) through retrospective review of all orders.
Up to 4 routine bedside blood glucose measurements were recorded each day: for patients eating discrete meals, these were the measurements taken before meals and at bedtime; for patients not eating or receiving continuous nutrition, these were the measurements taken closest to 6 AM, noon, 6 PM, and midnight. Additional measurements were not recorded to avoid ascertainment bias caused by follow‐up testing of abnormal glucose values. Glucose readings on the day of admission were excluded from analysis because these values are not amenable to inpatient ordering practices.
Study outcomes included overall protocol acceptance rate, insulin prescribing practices including use of basal insulin (ie, long‐acting agents such as NPH and insulin glargine), nutritional insulin (ie, scheduled regular, lispro, or aspart insulin given before each meal), daily dose adjustments under the protocol, and mean percentage of glucose readings per person greater than 180 mg/dL (hyperglycemia) and below 60 mg/dL (hypoglycemia). Comparable data from a previous cohort study of 91 GMS patients were used as baseline data for comparisons with the results of the present study.9
Other patient data collected included age, sex, weight, baseline A1C (taken at or within 6 months of admission), diabetic medications used prior to admission (none, oral agents only, or any insulin use); daily inpatient use of oral or intravenous steroids, oral diabetic medications, dextrose‐containing intravenous fluids, tube feeds, total parenteral nutrition, and general nutritional intake (nothing by mouth, clear diet, low carbohydrate diet, house diet).
Statistical Analysis
Characteristics of the study subjects and process and outcome measures were analyzed descriptively using rates, means, and standard deviations or medians with interquartile ranges as appropriate. Comparisons between the pilot study and baseline cohorts were performed using Fisher's exact test for dichotomous outcomes (eg, use of basal insulin). For rates of hyperglycemia (ie, fraction of readings > 180 mg/dL), we used binomial logistic regression, accounting for potential correlation among repeated events by individual patients with a dispersion parameter18 (note that we did not use the same analysis for rates of hypoglycemia because it was such a rare event; for analysis of hypoglycemia, the variables were dichotomized). We also analyzed outcomes by hospital day (through hospital day 5, the limit used in the baseline study) to determine daily trends during the course of hospitalization; for these analyses we used the Mantel‐Haenszel chi‐square test for dichotomous variables and binomial logistic regression with hospital day as the independent variable for rates of hyperglycemia. Two‐sided P values < .05 were considered significant. SAS version 9.1 (Cary, NC) was used for all analyses.
RESULTS
After screening all 785 admissions to the 2 medical teams during the study period, we prospectively identified 109 patients (14%) for the pilot study. Twenty patients were subsequently excluded: 7 patients who were discharged the same day they were identified, 4 who did not have a fasting blood glucose value greater than 140 mg/dL, 4 patients who had type 1 diabetes, 2 patients who were admitted with diabetic ketoacidosis, and 3 patients whose data could not be accessed because of repeated unavailability of the medical record. Characteristics of the remaining 89 study subjects are shown in Table 2 and are compared to 91 baseline subjects. The mean age of the study subjects was 68.7 years; 45% were men. Five patients (6%) did not have a previous diagnosis of diabetes, and 51% were taking insulin prior to admission; the median A1C was 6.8%.
| Characteristic | Baseline (n = 91) | Pilot (n = 89) |
|---|---|---|
| ||
| Age (years), mean (SD) | 66.0 (14.5) | 68.7 (14.7) |
| Male | 53/91 (58%) | 40/89 (45%) |
| No diagnosis of diabetes at admission | 7/91 (8%) | 5/89 (6%) |
| Preadmission diabetes regimen | ||
| None | 15/91 (16%) | 14/78 (18%) |
| Oral medications only | 32/91 (35%) | 24/78 (31%) |
| Insulin | 44/91 (48%) | 40/78 (51%) |
| A1C (IQR) | 7.0 (6.0, 8.0) | 6.8 (6.3, 7.8) |
| Hospital length of stay (days), median (IQR) | 5 (3, 7) | 5 (3, 7) |
The medical residents agreed, at least in theory, to follow the subcutaneous insulin protocol for 50 patients (56%), partially accepted it for 8 (9%), and declined for 31 (35%). Reasons for declining the protocol included fear of hypoglycemia, severity of patient's other disease states or overall poor health of patient, concern for the effects of renal insufficiency on insulin clearance, concern for the effect of steroid tapers on glucose levels, desire to titrate oral medications, and anticipation of patient's imminent discharge. Other reasons such as the glucose levels are not that bad and let's watch the glucose levels for one more day suggest that some residents did not view hyperglycemia as an acute problem requiring immediate attention.
Regarding insulin‐ordering practices (Table 3), basal insulin was prescribed for 57 patients (64%) in the pilot group compared to 45 patients (49%) in the baseline group (P = .05). Nutritional insulin was prescribed to 12 patients (13%) in the pilot group compared to no patients in the baseline group (P < .001). Oral hypoglycemic agents were prescribed less often in the pilot study than at baseline (20% vs. 38%, P = .01). The use of a standard default sliding scale from the hospital computer order set was high and was not significantly different in the pilot study compared with that at baseline (93% vs. 90%, P = .78). Twenty‐four of the 83 patients in the pilot group (29%) received sliding‐scale insulin without ever receiving basal or nutritional insulin during hospitalization compared to 45 of 91 patients in the baseline group (49%; P = .01 for comparison). Among patients started on basal insulin, 42% (24 of 57) were started after the first full hospital day. The initial basal insulin dose was appropriate according to the protocol (within 20%) in 38 of 57 patients (67%). Only 20 of 61 patients (33%) who had any hypo‐ or hyperglycemia had any change to their insulin regimen made during days 2 through 7 of their hospitalization on GMS, similar to the rate noted at baseline (36%).
| Measure | Baseline | Pilot | P value |
|---|---|---|---|
| |||
| Process | |||
| Any basal insulin during hospitalization | 45/91 (49%) | 57/89 (64%) | 0.05 |
| Any nutritional insulin during hospitalization | 0/91 (0%) | 12/89 (13%) | < 0.001 |
| Change in dose to any insulin order during hospitalization | 24/66 (36%) | 20/61 (33%) | 0.71 |
| Standard sliding scale from hospital computer order set | 75/83 (90%) | 76/82 (93%) | 0.78 |
| Any oral antihyperglycemic agents during hospitalization | 35/91 (38%) | 18/89 (20%) | 0.01 |
| Outcome | |||
| Mean percentage of glucose readings > 180 mg/dL (SD) | 33.3% (33.3%) | 31.6% (29.6%) | 0.85 |
| Any hyperglycemia (glucose > 180 mg/dL) | 66/89 (74%) | 59/78 (76%) | 0.86 |
| 1%‐20% of readings | 17/89 (19%) | 15/78 (19%) | 0.85 for trend |
| 20%‐40% | 15/89 (17%) | 15/78 (19%) | |
| 40%‐60% | 15/89 (17%) | 15/78 (19%) | |
| 60%‐80% | 7/89 (8%) | 6/78 (8%) | |
| >80% | 12/89 (13%) | 8/78 (10%) | |
| Any hypoglycemia (glucose < 60 mg/dL) | 6/89 (7%) | 10/78 (13%) | 0.20 |
Regarding glucose control (Table 3), the mean percentage of glucose readings per patient greater than 180 mg/dL was not significantly different in the pilot study compared to baseline (31.6% vs. 33.3%, P = .85). Despite implementation of the protocol and increased use of basal and nutritional insulin, 76% of patients had at least 1 routine glucose reading greater than 180 mg/dL, and 37% of patients had at least 40% of their routine glucose readings greater than 180 mg/dL, comparable to baseline (74% and 38%, respectively, P = NS for both comparisons). At least 1 hypoglycemic event (glucose reading below 60 mg/dL) occurred in 7% of patients at baseline and 13% during the pilot study (P = .20). Eleven hypoglycemic events in the pilot study were between 50 and 59 mg/dL (55%), 6 were between 40 and 49 mg/dL (30%), 3 were between 30 and 39 mg/dL (15%), and none were less than 30 mg/dL. Nine occurred before breakfast (45%), 5 before dinner (25%), 3 before lunch (15%), and 3 at bedtime (15%).
During the pilot study, the use of basal insulin did improve over the first 5 days of hospitalization (Fig. 1), in both the percentage of patients prescribed any basal insulin and the percentage of each patient's total insulin dose (basal, nutritional, and supplemental) given as basal (both P < .001 for trend). Hyperglycemia rates also improved during hospitalization (Fig. 1), decreasing from 48% on hospital day 1 to 34% on hospital day 5 (P = .004 for trend). These trends were not observed in the baseline group, with hyperglycemia rates of 37% on hospital day 1 and 34% on hospital day 5 (P = .16 for trend).
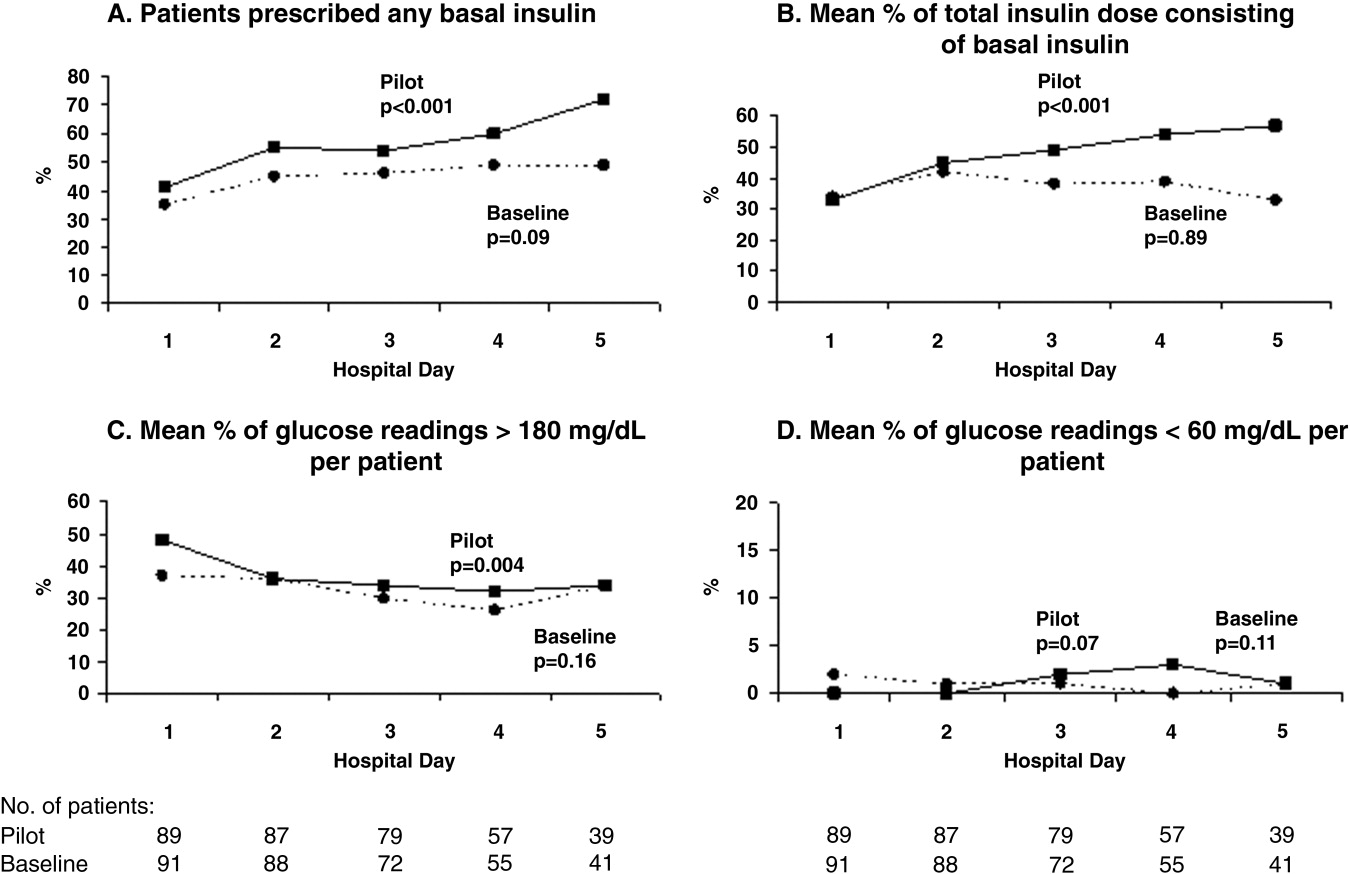
Patients for whom the resident accepted or partially accepted the protocol had higher use of basal insulin (91% vs. 13%, P < .0001), higher use of nutritional insulin (21% vs. 0%, P = .01), and more frequent dose adjustments (47% vs. 7%, P = .01) compared with patients for whom the resident declined the protocol. However, the rate of hyperglycemia was higher in patients for whom the protocol was accepted or partially accepted than in patients for whom the protocol was declined (37% vs. 20%, P = .02).
DISCUSSION
Our subcutaneous insulin protocol focused on increasing the use of basal and nutritional insulin, avoiding the use of sliding‐scale insulin by itself, and performing daily insulin adjustments in response to the hypo‐ or hyperglycemia of general medical inpatients with diabetes or hyperglycemia.
The most notable finding of our pilot study was that residents were resistant to using the protocol, both in general and in its specific recommendations. Despite receiving education about inpatient diabetes control and protocol recommendations from the team pharmacist, and despite being on a hospitalist‐run medical service, the residents accepted use of the protocol for only half the eligible patients. Patients who were started on basal insulin were often underdosed or started after the first day of hospitalization, and daily dose adjustments were not consistently made despite persistent hypo‐ or hyperglycemia. Although the use of nutritional insulin was greater compared with that in the baseline group, it was still only prescribed for 13% of patients. Use of a standard sliding scale from the hospital computer order set was common in the pilot study and similar to that in the baseline group. These results suggest significant resistance to changing the current standard of practice.
Despite this lack of adherence to the protocol, some modest improvements in processes of care were seen. Basal insulin was ordered more often during the pilot study than at baseline, especially over the course of a hospital stay. Nutritional insulin was also ordered more often during the pilot study than at baseline, but was still infrequent. Oral antihyperglycemic agents were ordered less often during the pilot study than at baseline. This demonstrates that use of the protocol may be able to improve process outcomes. However, the modest improvements in process outcomes could have simply been a result of increased awareness and education, not the protocol itself.
Regarding patient outcomes, the overall hyperglycemia rate did not improve in the pilot study relative to that at baseline. Importantly, hypoglycemia rates did not increase significantly compared with those at baseline. However, because of the small number of hypoglycemia events, the sample size may not have been sufficient to detect a true difference between groups.
The most likely reason that the protocol did not show an effect on glycemic control was that its recommendations were not adhered to. In turn, this may have been a result of incomplete education, training, and implementation measures and/or inherent problems with the protocol that made its recommendations difficult to follow. Another possibility is that the protocol itself may not have been capable of improving glucose control, even when properly used. However, we do know that resident agreement to use the protocol did lead to higher rates of recommended best practices being carried out, such as basal insulin use and daily insulin dose adjustments, and that use of the protocol was associated with improvements in glucose control over the hospital stay. A larger study with a higher degree of protocol adherence would be better able to evaluate the merits of the protocol itself, as would a randomized controlled trial using instrumental variables to measure treatment efficacy. Another possibility explanation for the lack of effect is that glucose control on admission happened to be worse in the pilot group than in the control group: rates of hyperglycemia on day 1 were 48% in the pilot group compared with 37% in the baseline group (Fig. 1). Also, the decreased use of oral agents in the pilot group, a purposeful change to decrease the risk of hypoglycemia, may have counteracted the beneficial effects of more appropriate insulin use. Finally, there were few patients with poorly controlled diabetes at baseline (18 patients with A1C 8.0 in the baseline group and 12 such patients in the pilot group), arguably those most likely to benefit.
There is a pressing need to identify protocols that can improve glucose control in the non‐ICU inpatient setting and successfully implement these protocols with a minimum of resources and effort. To date, most studies that have improved glucose control in the non‐ICU setting have relied on frequent input from diabetologists or nurse‐practitioners.14, 15
The results of this study should be viewed in light of its limitations, including its relatively small sample size (thus limiting our ability to detect possible significant differences between groups) and that it was conducted at a single institution (thus limiting its generalizability). Patients were enrolled on weekdays, so patients admitted and discharged over a weekend or on a holiday may have been missed. Also, because of the nonrandomized design of the study, we cannot exclude the possibility that the improvements noted in the pilot study were a result of the increased education provided or of increased awareness and general improvement in diabetes management over the course of the study. Finally, implementation of the protocol was somewhat labor intensive and required staff support that could be difficult to replicate in other institutions. However, most of the study staff's effort was necessary either to implement the protocol in the absence of an order set or to evaluate barriers to implementation. Widespread implementation of a protocol with an order set, education, and the use of highly reliable tools should be possible with much less effort and resources. The strengths of this study include its prospective data collection methods, which included rigorous inclusion criteria and collection of detailed clinical data.
Our study findings suggest several approaches to improve care in the future. To combat resistance to change, the American Association of Clinical Endocrinologists strongly recommends that each institution ensure that all its clinicians involved agree about general philosophies of diabetes management.19 A more expansive, hospital‐wide educational and promotional plan may increase the initial acceptance of the protocol. Interviews with residents also indicated there was unfamiliarity with diabetes management and significant concerns about the harmful affects of tight glucose control (ie, risk of hypoglycemia), especially in certain patient subgroups. These results confirmed the need for more practical individualized training and sparked the implementation of small‐group, case‐based educational sessions on inpatient diabetes management for all house officers, with a particular focus on patients with multiple comorbidities, on steroid tapers, and/or with renal failure.
The lack of nutritional insulin orders, delays in ordering basal insulin, and use of inadequate doses of insulin may be counteracted by the use of an order set, in our case built into our computer physician order entry (CPOE) system. The use of CPOE also allows reminders to be automatically sent to clinicians if eligible patients are not started on these orders. Clinical inertia (eg, failure to adjust the insulin doses of specific patients despite hyperglycemia) is more difficult to combat but may be addressed through better organization of clinical data, individualized, case‐based education, and CPOE reminders and eventually through culture change.
As a result of our pilot study, additional revisions were made to the protocol in hopes of increasing protocol adherence. For example, for patients eating discrete meals who are not taking insulin at home, the pilot protocol had suggested a starting insulin dose range for basal and nutritional insulin that required 2 separate calculations. The revised protocol was simplified to recommend a total daily insulin dose to be split evenly between basal and nutritional insulin. The daily adjustment instructions were also simplified. The pilot protocol had included a complicated table of adjustment recommendations based on bedside glucose trends. The revised protocol recommends adjusting the new daily dose by adding the total units of insulin given the previous day (including supplemental doses), making minor adjustments for hyper‐ or hypoglycemia and other clinical factors (like renal failure), and splitting this dose evenly between scheduled basal and nutritional insulin. In addition, 3 order sets were built into our computerized physician order entry system to facilitate early and appropriate insulin orders for patients with different diets (discrete meals, continuous tube feeds, and nothing by mouth); 3 different insulin sliding scales were created for patients with different degrees of insulin resistance; a diabetes management page for our electronic medication administration record is being developed to better organize clinical data; and hospital‐wide education and individualized training are ongoing.
In conclusion, the adherence to an inpatient glycemic management protocol that focused on increasing use of basal insulin and performing daily insulin adjustments was only fair. Barriers to successful implementation included clinical inertia regarding individual patients, unfamiliarity with inpatient diabetes management strategies, fear of hypoglycemia, and resistance to changing the current standard of practice. Targeted education, standard order sets, better organization of clinical data, protocol simplification, and institutional culture changes may be necessary for successful protocol implementation and improved inpatient glucose control.
- Agency for Healthcare Research and Quality. HCUPnet, Healthcare Cost and Utilization Project. 8/17/05; http://www.ahrq.gove/HCUPnet/. Accessed 7/17/06,2006.
- ,,,,,.Hyperglycemia: an independent marker of in‐hospital mortality in patients with undiagnosed diabetes.J Clin Endocrinol Metab.2002;87:978–982.
- ,,, et al.Hyperglycaemia is associated with poor outcomes in patients admitted to hospital with acute exacerbations of chronic obstructive pulmonary disease.Thorax2006;61:284–289.
- ,,,,.Stress hyperglycemia and prognosis of stroke in nondiabetic and diabetic patients: a systematic overview.Stroke.2001;32:2426–2432.
- ,,,.Hyperglycemia is associated with adverse outcomes in patients receiving total parenteral nutrition.Diabetes Care.2005;28:2367–2371.
- ,,, et al.Management of diabetes and hyperglycemia in hospitals.Diabetes Care.2004;27:553–597.
- ,,,,,.The relation between hyperglycemia and outcomes in 2,471 patients admitted to the hospital with community‐acquired pneumonia.Diabetes Care.2005;28:810–815.
- ,,.Glycemic control and sliding scale insulin use in medical inpatients with diabetes mellitus.Arch Intern Med.1997;157:545–552.
- ,,,,.Inpatient management of diabetes and hyperglycemia among general medicine patients at a large teaching hospital.J Hosp Med.2006;1:145–150.
- ,,, et al.Intensive insulin therapy in the medical ICU.N Engl J Med.2006;354:449–461.
- ,,, et al.Intensive insulin therapy in the critically ill patients.N Engl J Med.2001;345:1359–1367.
- .Prospective randomised study of intensive insulin treatment on long term survival after acute myocardial infarction in patients with diabetes mellitus.DIGAMI (Diabetes Mellitus, Insulin Glucose Infusion in Acute Myocardial Infarction) Study Group.BMJ.1997;314:1512–1515.
- ,,, et al.Intense metabolic control by means of insulin in patients with diabetes mellitus and acute myocardial infarction (DIGAMI 2): effects on mortality and morbidity.Eur Heart J.2005;26:650–661.
- American Diabetes Association.Standards of Medical Care in Diabetes ‐ 2006.Diabetes Care.2006;29:S4–S42.
- ACE/ADA Task Force on Inpatient Diabetes.American College of Endocrinology and American Diabetes Association consensus statement on inpatient diabetes and glycemic control: A call to action.Diabetes Care.2006;29:1955–1962.
- ,,,.Eliminating inpatient sliding‐scale insulin: a reeducation project with medical house staff.Diabetes Care.2005;28:1008–11.
- ,,, et al.Randomized study of basal‐bolus insulin therapy in the inpatient management of patients with type 2 diabetes (RABBIT 2 Trial).Diabetes Care.2007;30:2181–2186.
- .Extra‐binomial variation in logistic linear models.Appl Stat.1982;31:144–148.
- ,.Hospital management of diabetes.Endocrinol Metab Clin North Am.2005;34:99–116.
Diabetes mellitus is a common comorbid condition in hospitalized patients. In 2003, diabetes was listed as a diagnosis in 17.2% of hospital discharges in the United States.1 Because these diagnosis codes do not account for undiagnosed diabetes or hospital‐related hyperglycemia, the true prevalence of diabetes or hyperglycemia in hospitalized patients is likely higher and has been estimated to be as great as 38%.2 Hyperglycemia has been associated with adverse outcomes among hospitalized patients, including infectious complications, increased length of stay, and increased mortality.27 However, because hyperglycemia is not usually the primary reason patients with diabetes are hospitalized, its management is often not a focus in the inpatient setting. Sliding‐scale insulin alone continues to be commonly prescribed despite clinical evidence showing it to be ineffective in achieving glycemic control.8, 9
Recent randomized controlled trials have demonstrated that aggressive treatment of inpatient hyperglycemia improves outcomes in surgical and medical intensive care units10, 11 and in patients admitted for myocardial infarction.12, 13 Based on this clinical evidence and strong observational data linking hyperglycemia to poor patient outcomes in the non‐ICU setting,27 the American Diabetes Association (ADA) now advocates good metabolic control, defined as preprandial glucose levels of 90‐130 mg/dL and peak postprandial glucose levels < 180 mg/dL in hospitalized non‐ICU patients with hyperglycemia14 (note that these targets are less aggressive than those for ICU patients, for whom randomized controlled trials showed the benefits of reduced mortality provided by tight glucose control).11 To reach these targets, the ADA and American College of Endocrinology suggest that multidisciplinary teams develop and implement hyperglycemia management guidelines and protocols.15 Protocols should promote the use of continuous intravenous insulin or scheduled subcutaneous insulin as opposed to the use of sliding‐scale insulin alone. Subcutaneous insulin protocols should include target glucose levels; basal, nutritional, and supplemental insulin; and daily adjustments based on previous glucose levels, insulin sensitivity, nutritional intake, illness, and medications.6, 15 To date, few published protocols or algorithms for inpatient subcutaneous insulin have been shown to be effective.16, 17 It is therefore not known how best to design and implement an inpatient diabetes management protocol that is effective, efficient, and self‐perpetuating. The aims of our pilot study were to develop and implement a subcutaneous insulin protocol on a general medicine service, to identify barriers to implementation, and to determine the effect of this protocol on glycemic control.
METHODS
Setting and Participants
This prospective quality‐improvement pilot study was conducted at Brigham and Women's Hospital (BWH) from January 10, 2005, through June 23, 2005. Patients were eligible to participate if they were admitted to either of 2 General Medicine Service (GMS) teams with either a known diagnosis of type 2 diabetes or inpatient hyperglycemia (random laboratory glucose level > 180 mg/dL) and at least 1 fasting point‐of‐care glucose reading > 140 mg/dL. Patients were excluded if they had diabetic ketoacidosis, hyperosmolar hyperglycemic state, another absolute indication for intravenous insulin, or fasting glucose < 60 mg/dL on no insulin or if they were pregnant. Each GMS team consisted of a teaching attending, a junior or senior resident, 2 interns, and a clinical pharmacist. Twenty‐six physicians attended on these 2 teams during the study period, 13 of whom were hospitalists. This study was approved by the BWH Institutional Review Board; patient consent to participate in this study was deemed not necessary because of the relatively nonsensitive nature of the data (eg, glucose control, insulin orders), the noninvasive means of data collection (eg, chart review), and the steps taken by research personnel to minimize any breach in patient confidentiality.
Intervention
A multidisciplinary team composed of a diabetologist (M.L.P.), a hospitalist (J.L.S.), and a pharmacist (J.M.T.) developed a subcutaneous insulin protocol that was approved by the BWH Pharmacy and Therapeutics Diabetes Subcommittee. The protocol consisted of a set of treatment recommendations made by a pharmacist to be carried out by the medical team. The primary components are shown in Table 1 (a full description can be found in the Appendix). The main emphasis of the protocol was on discontinuing oral antihyperglycemic agents during hospitalization, initiating basal insulin in most patients, and adjusting basal insulin daily as needed.
|
| Oral agents |
| 1. Stop oral agents in most patients |
| Glucose testing |
| 2. Check bedside blood glucose before meals and at bedtime if eating, or every 6 hours if not eating |
| Insulin |
| 3. Start basal insulin Patient's home dose or NPH 0.1 units/kg before breakfast and at bedtime or insulin glargine 0.2 units/kg at bedtime (max dose 20 units) If NPO, consider half dose unless hyperglycemic |
| 4. Start nutritional insulin Discrete meals: insulin aspart 0.05‐0.1 units/kg per meal or home dose 0‐15 minutes prior to eating Continuous tube feeds: regular insulin every 6 hours or NPH every morning and at bedtime (0.1‐0.2 units/kg per day in addition to basal insulin) Hold if NPO |
| 5. Start correctional insulin Scale provided based on blood glucose and daily scheduled insulin requirements |
| Daily Adjustments |
6. Adjust scheduled insulin daily
|
| Other Considerations |
| 7. Hypoglycemia management (protocols for fruit juice, glucagons, IV dextrose, and when to call physician) |
| 8. Discharge orders (recommendations to discharge most patients on admission medication regimen, avoid sliding scale insulin, simplify dosing for patients requiring new insulin regimens, ensure adequate patient education and prompt outpatient follow‐up) |
All medical residents received general instructions regarding inpatient diabetes control by the research team's diabetologist (M.L.P.) through a 1‐hour department‐wide didactic lecture. The standards of care taught were identical to those in the protocol. In addition, the research team's hospitalist (J.L.S.) contacted each medical resident assigned to the 2 GMS teams electronically to introduce the protocol and describe the purpose and logistics of the pilot study.
A research assistant prospectively identified eligible patients each weekday by screening all patients admitted to the 2 GMS teams using the daily computerized sign‐out system used by all medical residents. Specifically, laboratory random glucose levels, inpatient medications, and medical history were reviewed to determine if each patient met eligibility criteria. Eligibility criteria were confirmed by medical record review. The pharmacist recommended to the primary team that the protocol be initiated for eligible patients. In addition, the pharmacist recommended daily adjustment of the insulin dose according to the protocol as appropriate. A chronologically organized summary of clinical data relevant to glycemic management for each patient, including bedside blood glucose measurements, general dietary intake, use of intravenous dextrose solutions, and administration of systemic steroids, oral diabetes medications, and all insulins, was provided to the team each day by the research assistant.
Measurements
The resident's acceptance of the protocol or reasons for declining it were recorded by the pharmacist on the day the protocol was recommended. Protocol acceptance was categorized as yes, no, or partial. Partial acceptance was defined as resident agreement to use the protocol, but with stated caveats or modifications. Clinical data were collected on each eligible patient for up to 7 days on GMS. Several data sources were used, including physician admission notes, the hospital's computerized clinical data system, vital‐sign sheets, medication administration records, and personal communication with nurses regarding any missing or discrepant data.
All insulin use (prescribed drug, dose, route, schedule and actual administered drug, dose, route, and time) was recorded each day by the research assistant. Use of basal and nutritional insulin and daily dose adjustments if previous hypo‐ or hyperglycemia (categorized as yes, no, or not applicable for each patient each day) were determined by the study pharmacist (J.M.T.) through retrospective review of all orders.
Up to 4 routine bedside blood glucose measurements were recorded each day: for patients eating discrete meals, these were the measurements taken before meals and at bedtime; for patients not eating or receiving continuous nutrition, these were the measurements taken closest to 6 AM, noon, 6 PM, and midnight. Additional measurements were not recorded to avoid ascertainment bias caused by follow‐up testing of abnormal glucose values. Glucose readings on the day of admission were excluded from analysis because these values are not amenable to inpatient ordering practices.
Study outcomes included overall protocol acceptance rate, insulin prescribing practices including use of basal insulin (ie, long‐acting agents such as NPH and insulin glargine), nutritional insulin (ie, scheduled regular, lispro, or aspart insulin given before each meal), daily dose adjustments under the protocol, and mean percentage of glucose readings per person greater than 180 mg/dL (hyperglycemia) and below 60 mg/dL (hypoglycemia). Comparable data from a previous cohort study of 91 GMS patients were used as baseline data for comparisons with the results of the present study.9
Other patient data collected included age, sex, weight, baseline A1C (taken at or within 6 months of admission), diabetic medications used prior to admission (none, oral agents only, or any insulin use); daily inpatient use of oral or intravenous steroids, oral diabetic medications, dextrose‐containing intravenous fluids, tube feeds, total parenteral nutrition, and general nutritional intake (nothing by mouth, clear diet, low carbohydrate diet, house diet).
Statistical Analysis
Characteristics of the study subjects and process and outcome measures were analyzed descriptively using rates, means, and standard deviations or medians with interquartile ranges as appropriate. Comparisons between the pilot study and baseline cohorts were performed using Fisher's exact test for dichotomous outcomes (eg, use of basal insulin). For rates of hyperglycemia (ie, fraction of readings > 180 mg/dL), we used binomial logistic regression, accounting for potential correlation among repeated events by individual patients with a dispersion parameter18 (note that we did not use the same analysis for rates of hypoglycemia because it was such a rare event; for analysis of hypoglycemia, the variables were dichotomized). We also analyzed outcomes by hospital day (through hospital day 5, the limit used in the baseline study) to determine daily trends during the course of hospitalization; for these analyses we used the Mantel‐Haenszel chi‐square test for dichotomous variables and binomial logistic regression with hospital day as the independent variable for rates of hyperglycemia. Two‐sided P values < .05 were considered significant. SAS version 9.1 (Cary, NC) was used for all analyses.
RESULTS
After screening all 785 admissions to the 2 medical teams during the study period, we prospectively identified 109 patients (14%) for the pilot study. Twenty patients were subsequently excluded: 7 patients who were discharged the same day they were identified, 4 who did not have a fasting blood glucose value greater than 140 mg/dL, 4 patients who had type 1 diabetes, 2 patients who were admitted with diabetic ketoacidosis, and 3 patients whose data could not be accessed because of repeated unavailability of the medical record. Characteristics of the remaining 89 study subjects are shown in Table 2 and are compared to 91 baseline subjects. The mean age of the study subjects was 68.7 years; 45% were men. Five patients (6%) did not have a previous diagnosis of diabetes, and 51% were taking insulin prior to admission; the median A1C was 6.8%.
| Characteristic | Baseline (n = 91) | Pilot (n = 89) |
|---|---|---|
| ||
| Age (years), mean (SD) | 66.0 (14.5) | 68.7 (14.7) |
| Male | 53/91 (58%) | 40/89 (45%) |
| No diagnosis of diabetes at admission | 7/91 (8%) | 5/89 (6%) |
| Preadmission diabetes regimen | ||
| None | 15/91 (16%) | 14/78 (18%) |
| Oral medications only | 32/91 (35%) | 24/78 (31%) |
| Insulin | 44/91 (48%) | 40/78 (51%) |
| A1C (IQR) | 7.0 (6.0, 8.0) | 6.8 (6.3, 7.8) |
| Hospital length of stay (days), median (IQR) | 5 (3, 7) | 5 (3, 7) |
The medical residents agreed, at least in theory, to follow the subcutaneous insulin protocol for 50 patients (56%), partially accepted it for 8 (9%), and declined for 31 (35%). Reasons for declining the protocol included fear of hypoglycemia, severity of patient's other disease states or overall poor health of patient, concern for the effects of renal insufficiency on insulin clearance, concern for the effect of steroid tapers on glucose levels, desire to titrate oral medications, and anticipation of patient's imminent discharge. Other reasons such as the glucose levels are not that bad and let's watch the glucose levels for one more day suggest that some residents did not view hyperglycemia as an acute problem requiring immediate attention.
Regarding insulin‐ordering practices (Table 3), basal insulin was prescribed for 57 patients (64%) in the pilot group compared to 45 patients (49%) in the baseline group (P = .05). Nutritional insulin was prescribed to 12 patients (13%) in the pilot group compared to no patients in the baseline group (P < .001). Oral hypoglycemic agents were prescribed less often in the pilot study than at baseline (20% vs. 38%, P = .01). The use of a standard default sliding scale from the hospital computer order set was high and was not significantly different in the pilot study compared with that at baseline (93% vs. 90%, P = .78). Twenty‐four of the 83 patients in the pilot group (29%) received sliding‐scale insulin without ever receiving basal or nutritional insulin during hospitalization compared to 45 of 91 patients in the baseline group (49%; P = .01 for comparison). Among patients started on basal insulin, 42% (24 of 57) were started after the first full hospital day. The initial basal insulin dose was appropriate according to the protocol (within 20%) in 38 of 57 patients (67%). Only 20 of 61 patients (33%) who had any hypo‐ or hyperglycemia had any change to their insulin regimen made during days 2 through 7 of their hospitalization on GMS, similar to the rate noted at baseline (36%).
| Measure | Baseline | Pilot | P value |
|---|---|---|---|
| |||
| Process | |||
| Any basal insulin during hospitalization | 45/91 (49%) | 57/89 (64%) | 0.05 |
| Any nutritional insulin during hospitalization | 0/91 (0%) | 12/89 (13%) | < 0.001 |
| Change in dose to any insulin order during hospitalization | 24/66 (36%) | 20/61 (33%) | 0.71 |
| Standard sliding scale from hospital computer order set | 75/83 (90%) | 76/82 (93%) | 0.78 |
| Any oral antihyperglycemic agents during hospitalization | 35/91 (38%) | 18/89 (20%) | 0.01 |
| Outcome | |||
| Mean percentage of glucose readings > 180 mg/dL (SD) | 33.3% (33.3%) | 31.6% (29.6%) | 0.85 |
| Any hyperglycemia (glucose > 180 mg/dL) | 66/89 (74%) | 59/78 (76%) | 0.86 |
| 1%‐20% of readings | 17/89 (19%) | 15/78 (19%) | 0.85 for trend |
| 20%‐40% | 15/89 (17%) | 15/78 (19%) | |
| 40%‐60% | 15/89 (17%) | 15/78 (19%) | |
| 60%‐80% | 7/89 (8%) | 6/78 (8%) | |
| >80% | 12/89 (13%) | 8/78 (10%) | |
| Any hypoglycemia (glucose < 60 mg/dL) | 6/89 (7%) | 10/78 (13%) | 0.20 |
Regarding glucose control (Table 3), the mean percentage of glucose readings per patient greater than 180 mg/dL was not significantly different in the pilot study compared to baseline (31.6% vs. 33.3%, P = .85). Despite implementation of the protocol and increased use of basal and nutritional insulin, 76% of patients had at least 1 routine glucose reading greater than 180 mg/dL, and 37% of patients had at least 40% of their routine glucose readings greater than 180 mg/dL, comparable to baseline (74% and 38%, respectively, P = NS for both comparisons). At least 1 hypoglycemic event (glucose reading below 60 mg/dL) occurred in 7% of patients at baseline and 13% during the pilot study (P = .20). Eleven hypoglycemic events in the pilot study were between 50 and 59 mg/dL (55%), 6 were between 40 and 49 mg/dL (30%), 3 were between 30 and 39 mg/dL (15%), and none were less than 30 mg/dL. Nine occurred before breakfast (45%), 5 before dinner (25%), 3 before lunch (15%), and 3 at bedtime (15%).
During the pilot study, the use of basal insulin did improve over the first 5 days of hospitalization (Fig. 1), in both the percentage of patients prescribed any basal insulin and the percentage of each patient's total insulin dose (basal, nutritional, and supplemental) given as basal (both P < .001 for trend). Hyperglycemia rates also improved during hospitalization (Fig. 1), decreasing from 48% on hospital day 1 to 34% on hospital day 5 (P = .004 for trend). These trends were not observed in the baseline group, with hyperglycemia rates of 37% on hospital day 1 and 34% on hospital day 5 (P = .16 for trend).
Patients for whom the resident accepted or partially accepted the protocol had higher use of basal insulin (91% vs. 13%, P < .0001), higher use of nutritional insulin (21% vs. 0%, P = .01), and more frequent dose adjustments (47% vs. 7%, P = .01) compared with patients for whom the resident declined the protocol. However, the rate of hyperglycemia was higher in patients for whom the protocol was accepted or partially accepted than in patients for whom the protocol was declined (37% vs. 20%, P = .02).
DISCUSSION
Our subcutaneous insulin protocol focused on increasing the use of basal and nutritional insulin, avoiding the use of sliding‐scale insulin by itself, and performing daily insulin adjustments in response to the hypo‐ or hyperglycemia of general medical inpatients with diabetes or hyperglycemia.
The most notable finding of our pilot study was that residents were resistant to using the protocol, both in general and in its specific recommendations. Despite receiving education about inpatient diabetes control and protocol recommendations from the team pharmacist, and despite being on a hospitalist‐run medical service, the residents accepted use of the protocol for only half the eligible patients. Patients who were started on basal insulin were often underdosed or started after the first day of hospitalization, and daily dose adjustments were not consistently made despite persistent hypo‐ or hyperglycemia. Although the use of nutritional insulin was greater compared with that in the baseline group, it was still only prescribed for 13% of patients. Use of a standard sliding scale from the hospital computer order set was common in the pilot study and similar to that in the baseline group. These results suggest significant resistance to changing the current standard of practice.
Despite this lack of adherence to the protocol, some modest improvements in processes of care were seen. Basal insulin was ordered more often during the pilot study than at baseline, especially over the course of a hospital stay. Nutritional insulin was also ordered more often during the pilot study than at baseline, but was still infrequent. Oral antihyperglycemic agents were ordered less often during the pilot study than at baseline. This demonstrates that use of the protocol may be able to improve process outcomes. However, the modest improvements in process outcomes could have simply been a result of increased awareness and education, not the protocol itself.
Regarding patient outcomes, the overall hyperglycemia rate did not improve in the pilot study relative to that at baseline. Importantly, hypoglycemia rates did not increase significantly compared with those at baseline. However, because of the small number of hypoglycemia events, the sample size may not have been sufficient to detect a true difference between groups.
The most likely reason that the protocol did not show an effect on glycemic control was that its recommendations were not adhered to. In turn, this may have been a result of incomplete education, training, and implementation measures and/or inherent problems with the protocol that made its recommendations difficult to follow. Another possibility is that the protocol itself may not have been capable of improving glucose control, even when properly used. However, we do know that resident agreement to use the protocol did lead to higher rates of recommended best practices being carried out, such as basal insulin use and daily insulin dose adjustments, and that use of the protocol was associated with improvements in glucose control over the hospital stay. A larger study with a higher degree of protocol adherence would be better able to evaluate the merits of the protocol itself, as would a randomized controlled trial using instrumental variables to measure treatment efficacy. Another possibility explanation for the lack of effect is that glucose control on admission happened to be worse in the pilot group than in the control group: rates of hyperglycemia on day 1 were 48% in the pilot group compared with 37% in the baseline group (Fig. 1). Also, the decreased use of oral agents in the pilot group, a purposeful change to decrease the risk of hypoglycemia, may have counteracted the beneficial effects of more appropriate insulin use. Finally, there were few patients with poorly controlled diabetes at baseline (18 patients with A1C 8.0 in the baseline group and 12 such patients in the pilot group), arguably those most likely to benefit.
There is a pressing need to identify protocols that can improve glucose control in the non‐ICU inpatient setting and successfully implement these protocols with a minimum of resources and effort. To date, most studies that have improved glucose control in the non‐ICU setting have relied on frequent input from diabetologists or nurse‐practitioners.14, 15
The results of this study should be viewed in light of its limitations, including its relatively small sample size (thus limiting our ability to detect possible significant differences between groups) and that it was conducted at a single institution (thus limiting its generalizability). Patients were enrolled on weekdays, so patients admitted and discharged over a weekend or on a holiday may have been missed. Also, because of the nonrandomized design of the study, we cannot exclude the possibility that the improvements noted in the pilot study were a result of the increased education provided or of increased awareness and general improvement in diabetes management over the course of the study. Finally, implementation of the protocol was somewhat labor intensive and required staff support that could be difficult to replicate in other institutions. However, most of the study staff's effort was necessary either to implement the protocol in the absence of an order set or to evaluate barriers to implementation. Widespread implementation of a protocol with an order set, education, and the use of highly reliable tools should be possible with much less effort and resources. The strengths of this study include its prospective data collection methods, which included rigorous inclusion criteria and collection of detailed clinical data.
Our study findings suggest several approaches to improve care in the future. To combat resistance to change, the American Association of Clinical Endocrinologists strongly recommends that each institution ensure that all its clinicians involved agree about general philosophies of diabetes management.19 A more expansive, hospital‐wide educational and promotional plan may increase the initial acceptance of the protocol. Interviews with residents also indicated there was unfamiliarity with diabetes management and significant concerns about the harmful affects of tight glucose control (ie, risk of hypoglycemia), especially in certain patient subgroups. These results confirmed the need for more practical individualized training and sparked the implementation of small‐group, case‐based educational sessions on inpatient diabetes management for all house officers, with a particular focus on patients with multiple comorbidities, on steroid tapers, and/or with renal failure.
The lack of nutritional insulin orders, delays in ordering basal insulin, and use of inadequate doses of insulin may be counteracted by the use of an order set, in our case built into our computer physician order entry (CPOE) system. The use of CPOE also allows reminders to be automatically sent to clinicians if eligible patients are not started on these orders. Clinical inertia (eg, failure to adjust the insulin doses of specific patients despite hyperglycemia) is more difficult to combat but may be addressed through better organization of clinical data, individualized, case‐based education, and CPOE reminders and eventually through culture change.
As a result of our pilot study, additional revisions were made to the protocol in hopes of increasing protocol adherence. For example, for patients eating discrete meals who are not taking insulin at home, the pilot protocol had suggested a starting insulin dose range for basal and nutritional insulin that required 2 separate calculations. The revised protocol was simplified to recommend a total daily insulin dose to be split evenly between basal and nutritional insulin. The daily adjustment instructions were also simplified. The pilot protocol had included a complicated table of adjustment recommendations based on bedside glucose trends. The revised protocol recommends adjusting the new daily dose by adding the total units of insulin given the previous day (including supplemental doses), making minor adjustments for hyper‐ or hypoglycemia and other clinical factors (like renal failure), and splitting this dose evenly between scheduled basal and nutritional insulin. In addition, 3 order sets were built into our computerized physician order entry system to facilitate early and appropriate insulin orders for patients with different diets (discrete meals, continuous tube feeds, and nothing by mouth); 3 different insulin sliding scales were created for patients with different degrees of insulin resistance; a diabetes management page for our electronic medication administration record is being developed to better organize clinical data; and hospital‐wide education and individualized training are ongoing.
In conclusion, the adherence to an inpatient glycemic management protocol that focused on increasing use of basal insulin and performing daily insulin adjustments was only fair. Barriers to successful implementation included clinical inertia regarding individual patients, unfamiliarity with inpatient diabetes management strategies, fear of hypoglycemia, and resistance to changing the current standard of practice. Targeted education, standard order sets, better organization of clinical data, protocol simplification, and institutional culture changes may be necessary for successful protocol implementation and improved inpatient glucose control.
- Agency for Healthcare Research and Quality. HCUPnet, Healthcare Cost and Utilization Project. 8/17/05; http://www.ahrq.gove/HCUPnet/. Accessed 7/17/06,2006.
- ,,,,,.Hyperglycemia: an independent marker of in‐hospital mortality in patients with undiagnosed diabetes.J Clin Endocrinol Metab.2002;87:978–982.
- ,,, et al.Hyperglycaemia is associated with poor outcomes in patients admitted to hospital with acute exacerbations of chronic obstructive pulmonary disease.Thorax2006;61:284–289.
- ,,,,.Stress hyperglycemia and prognosis of stroke in nondiabetic and diabetic patients: a systematic overview.Stroke.2001;32:2426–2432.
- ,,,.Hyperglycemia is associated with adverse outcomes in patients receiving total parenteral nutrition.Diabetes Care.2005;28:2367–2371.
- ,,, et al.Management of diabetes and hyperglycemia in hospitals.Diabetes Care.2004;27:553–597.
- ,,,,,.The relation between hyperglycemia and outcomes in 2,471 patients admitted to the hospital with community‐acquired pneumonia.Diabetes Care.2005;28:810–815.
- ,,.Glycemic control and sliding scale insulin use in medical inpatients with diabetes mellitus.Arch Intern Med.1997;157:545–552.
- ,,,,.Inpatient management of diabetes and hyperglycemia among general medicine patients at a large teaching hospital.J Hosp Med.2006;1:145–150.
- ,,, et al.Intensive insulin therapy in the medical ICU.N Engl J Med.2006;354:449–461.
- ,,, et al.Intensive insulin therapy in the critically ill patients.N Engl J Med.2001;345:1359–1367.
- .Prospective randomised study of intensive insulin treatment on long term survival after acute myocardial infarction in patients with diabetes mellitus.DIGAMI (Diabetes Mellitus, Insulin Glucose Infusion in Acute Myocardial Infarction) Study Group.BMJ.1997;314:1512–1515.
- ,,, et al.Intense metabolic control by means of insulin in patients with diabetes mellitus and acute myocardial infarction (DIGAMI 2): effects on mortality and morbidity.Eur Heart J.2005;26:650–661.
- American Diabetes Association.Standards of Medical Care in Diabetes ‐ 2006.Diabetes Care.2006;29:S4–S42.
- ACE/ADA Task Force on Inpatient Diabetes.American College of Endocrinology and American Diabetes Association consensus statement on inpatient diabetes and glycemic control: A call to action.Diabetes Care.2006;29:1955–1962.
- ,,,.Eliminating inpatient sliding‐scale insulin: a reeducation project with medical house staff.Diabetes Care.2005;28:1008–11.
- ,,, et al.Randomized study of basal‐bolus insulin therapy in the inpatient management of patients with type 2 diabetes (RABBIT 2 Trial).Diabetes Care.2007;30:2181–2186.
- .Extra‐binomial variation in logistic linear models.Appl Stat.1982;31:144–148.
- ,.Hospital management of diabetes.Endocrinol Metab Clin North Am.2005;34:99–116.

Quality of Inpatient Diabetes Management
Diabetes mellitus is a common comorbidity of hospitalization; in 2003 diabetes was a secondary diagnosis in 17.8% of all adult hospital discharges.1 When undiagnosed diabetes is included, the prevalence of inpatient diabetes or hyperglycemia may be as high as 38%.2 Recent studies show that hyperglycemia in hospitalized patients complicates numerous illnesses and is an independent predictor of adverse outcomes.3 Treatment of inpatient hyperglycemia improves outcomes, including mortality, for patients in surgical intensive care units4 and possibly for those admitted for myocardial infarction.5, 6 For these reasons, the American Diabetes Association and the American College of Endocrinology now recommend that glucose levels of all patients admitted to non‐critical‐care units be maintained below 180 mg/dL.3, 7
Evidence‐based recommendations for achieving these goals include effective protocols for subcutaneous insulin therapy for patients who do not require continuous intravenous insulin infusion. Components of these protocols include use of basal insulin and scheduled nutritional insulin, avoiding use of supplemental (sliding‐scale) insulin alone (which has been shown to be ineffective and possibly deleterious in prior studies),8 and adjustment of insulin orders to reflect nutritional intake, insulin sensitivity, and previous response to therapy.7
We conducted this study to evaluate the current state of glycemic control and adherence to current recommendations on a general medicine service run by hospitalists in a busy teaching hospital. We also sought to correlate insulin‐ordering practices with the quality of glycemic control in these patients.
METHODS
Setting and Participants
This prospective cohort study was conducted at Brigham and Women's Hospital (BWH) from August 1 through September 30, 2004. Eligible subjects were patients admitted to 3 General Medicine Service (GMS) teams with either a known diagnosis of diabetes or inpatient hyperglycemia (random glucose > 200 mg/dL). Patients admitted for diabetic ketoacidosis, hyperosmolar hyperglycemic state, or gestational diabetes were excluded. Members of the BWH/Faulkner Hospitalist Service are the teaching attendings on these 3 teams (each consisting of 2 interns and 1 junior or senior resident) and are the attendings of record for approximately 90% of the patients on these teams. A research assistant identified potential subjects each weekday from the daily computerized sign‐out system used by all medical residents by searching for diabetes on the patient summary, a diabetic medication in the automatically abstracted medication list, or a laboratory glucose value greater than 200 mg/dL from automatically abstracted daily laboratory results. Eligibility criteria were confirmed by medical record review, and any question of eligibility was reviewed with the principal investigator. This study was approved by the BWH Institutional Review Board; patient consent was not deemed necessary for this study given the relatively nonsensitive nature of the data (eg, glucose control, insulin orders), the noninvasive means of collecting it (eg, chart review), and the steps taken by research personnel to minimize any breach in patient confidentiality.
Measurements
We abstracted clinical data on each eligible subject for up to 5 days on GMS. Several data sources were used, including physician admission notes, the hospital's computerized clinical data system, nursing notes, vital sign sheets, the medication administration record, and personal communication with nurses about any missing or discrepant data. Up to 4 routine bedside blood glucose measurements were recorded each day: the measurements taken before meals and at bedtime for patients eating discrete meals or the measurements closest to 6 AM, noon, 6 PM, and midnight for patients not eating or receiving continuous nutrition. Additional measurements were not recorded to avoid ascertainment bias caused by follow‐up testing of abnormal glucose values.
Study outcomes included the percentage of glucose readings below 60 mg/dL (hypoglycemia) and greater than 180 mg/dL (hyperglycemia). Use of several types of insulin ordering practices were also recorded: use of basal insulin (ie, long‐acting agents such as NPH and insulin glargine), scheduled prandial insulin (eg, regular insulin, insulin lispro, and insulin aspart given before each meal), daily adjustments to insulin orders, use of different insulin sliding scales for patients with different daily insulin requirements, orders to hold or adjust insulin doses in patients not eating, and the percentage of the total daily insulin dose given as basal insulin.
Other patient variables collected were age, sex, weight; medical comorbidities (using a modified Charlson score)9; severity of illness (using a simplified APACHE III score)8; admission diagnosis; baseline HbA1C (taken at or within 6 months of admission); severe complications of diabetes (blindness, dialysis, renal transplant, amputation due to peripheral vascular disease, vascular bypass surgery); diabetic medications prior to admission (none, oral agents only, or any insulin use); daily inpatient use of oral or intravenous steroids, oral diabetic medications, dextrose‐containing intravenous fluids, tube feeds, inpatient total parenteral nutrition, and general nutritional intake (all, most, some, little, or none for each meal).
Statistical Analysis
Characteristics of the study subjects and process and outcome measures were analyzed descriptively using rates, means with standard deviations, and medians with interquartile ranges as appropriate. We also analyzed outcomes by patient‐day to determine daily trends during the course of hospitalization. In these analyses, we used the Mantel‐Haenszel chi‐square test for the dichotomous variables (eg, daily use of any basal insulin) and univariable linear regression with general linear models clustered by patient, that is, repeated‐measures analysis, for the continuous variables. We used an arcsin(square‐root) transformation for those continuous outcomes that were percentages (eg, percentage of glucose readings > 180 mg/dL) and logarithmic transformation for right‐tailed continuous variables (eg, total number of units of insulin administered).
To determine the effects of various insulin‐ordering practices on glucose control, we also performed multivariable analysis of mean glucose levels per patient‐day. We chose mean glucose rather than rates of specific glucose ranges as the outcome because of the low rate of hypoglycemia and the additional sensitivity of this method. First, univariable analysis was performed using the Student's t test, analysis of variance, or Spearman correlation as appropriate for each predictor. Multiple linear regression models were then constructed, using variables significant in the univariable testing at the P < .10 level. Confounding variables that changed beta coefficients by 10% or more were retained, whereas collinear terms were removed by hand; patient age and sex were also retained in the models as a priori selected confounding variables.
As with the repeated‐measures analysis, we used general linear models, accounting for within‐patient clustering, with an exchangeable correlation structure. In addition, standard regression techniques could not be applied to the basal insulin variable because use of basal insulin is a mediator of subsequently lower glucose levels but often is the result of previously elevated glucose levels. Instead, we used a marginal structural model,10, 11 weighting the usual regression analysis to statistically remove the effect of confounding by indication. The weights for this analysis were based on the inverse probability of use of basal insulin, given previous glucose levels and prior use of basal insulin and were estimated from a separate logistic regression analysis. Results were considered significant at P < .05 except as noted above. SAS version 8.1 (Cary, NC) was used for all analyses.
RESULTS
We prospectively identified 123 patients for the study. Subsequently, 16 patients were excluded, 11 who did not have diabetes or inpatient hyperglycemia (most of whom had been placed on insulin prophylactically to avoid steroid‐induced hyperglycemia), 2 who were admitted for diabetic ketoacidosis, 2 who were not on GMS teams 13, and 1 whose data could not be accessed. Characteristics of the remaining 107 study subjects are shown in Table 1. The mean age of the subjects was 65.2 years; 55% were men. Nine patients had no previous diagnosis of diabetes, 43% were taking insulin prior to admission, 14% had severe diabetic complications, and the median HbA1C was 7.
| Characteristic | |
|---|---|
| |
| Age, mean (SD), y | 65.2 (14.5) |
| Male | 59/107 (55) |
| No diagnosis of diabetes at admission | 9/107 (8) |
| Preadmission diabetes medication regimen: | |
| None | 24/106 (22) |
| Oral medications only | 36/106 (34) |
| Insulin | 46/106 (43) |
| HbA1C, median (IQR) | 7 (6, 8) |
| Diabetic complications | 15/107 (14) |
| Hospital length of stay, median (IQR), d | 5 (3, 7) |
| Charlson score, mean (SD) | 5.3 (3.0) |
| APACHE III score, mean (SD) | 36.9 (15.6) |
Regarding insulin‐ordering practices (Table 2), 47 patients (43%) had basal insulin prescribed, while 4% of patients had an order for scheduled mealtime short‐ or rapid‐acting insulin. Of the 89 patients on sliding‐scale insulin, 80 (90%) had orders written for the default sliding scale built into the computerized physician order entry system at BWH. There was no correlation between intensity of the sliding scale and the patient's total daily insulin dose (data not shown). Of the patients on sliding‐scale insulin, 47% were prescribed basal insulin, 39% were prescribed oral agents, and 23% were prescribed neither.
| Measure | |
|---|---|
| |
| Process | |
| Any basal insulin during hospitalization | 47/107 (43) |
| Separate nutritional insulin order | 4/107 (3.7) |
| Change in dose to any insulin order during hospitalization if any hyper‐ or hypoglycemia | 26/75 (35) |
| Standard sliding scale from hospital computer order set | 80/89 (90) |
| Any oral diabetic agents during hospitalization | 39/107 (36) |
| Outcomes | |
| Any hyperglycemia (glucose > 180 mg/dL) | 74/98 (76) |
| 0%20% of readings | 20/98 (20) |
| 20%40% | 19/98 (19) |
| 40%60% | 19/98 (19) |
| 60%80% | 6/98 (6.1) |
| Greater than 80% | 10/98 (10) |
| Any hypoglycemia (glucose < 60 mg/dL) | 11/98 (11) |
| 0%20% of readings | 9/98 (9.2) |
| 20%40% | 2/98 (2.0) |
Regarding glucose control, 317 of 1022 glucose meter readings (31%) were greater than 180 mg/dL, and the mean rate of glucose readings greater than 180 mg/dL per patient was also 31%. Approximately three quarters of all patients had at least one routine glucose reading greater than 180 mg/dL, and 35% of patients had at least 40% of their routine glucose readings greater than 180 mg/dL (Table 2). Twelve of 1022 readings (1.2%) were less than 60 mg/dL, and 11% of patients had at least one glucose reading less than 60 mg/dL (Table 2).
Despite a relatively constant percentage of glucose readings greater than 180 mg/dL per patient over the first 5 days of hospitalization (25%36% each day), we found no evidence of change in the percentage of patients prescribed basal insulin or the percentage of insulin given as basal insulin, and there was a small but significant increase in the total amount of insulin prescribed (Table 3). Of the 75 patients with at least one episode of hypo‐ or hyperglycemia, 43 (57%) were ever prescribed basal insulin, 29 (39%) were prescribed oral diabetes agents, and only 26 (35%) had any change to their insulin regimen during the first 5 days of their hospitalization on GMS. Of the 47 patients prescribed basal insulin in the hospital, 41 had been taking insulin prior to admission.
| Hospital day | P value for Trend | |||||
|---|---|---|---|---|---|---|
| 1 | 2 | 3 | 4 | 5 | ||
| ||||||
| Number of patients | 107 | 105 | 85 | 66 | 48 | |
| Mean adjusted total daily insulin units* | 17 | 22 | 23 | 20 | 27 | 0.03 |
| Patients prescribed any basal insulin (%) | 29/79 (37) | 41/93 (44) | 33/74 (45) | 27/57 (47) | 20/43 (47) | 0.18 |
| Mean % of total insulin dose consisting of basal insulin | 35 | 42 | 38 | 39 | 33 | 0.80 |
| Mean % glucose readings < 60 mg/dL | 2 | 1 | 1 | 0 | 1 | 0.13 |
| Mean % glucose readings> 180 mg/dL | 36 | 34 | 29 | 25 | 32 | 0.13 |
In a multivariable analysis of the mean glucose reading per patient‐day, we found several predictors of lower glucose readings, including diet‐controlled diabetes prior to admission and prescription of oral hypoglycemic medications in the hospital. We also found several predictors of higher glucose readings, including severe diabetic complications and higher glucose level at admission. Finally, we noted variation both by medical team (each composed of 1 medical attending, 1 resident, and 2 interns) and by floor of the hospital (each staffed by a different cadre of nurses). Adjusting for these factors (as well as for the daily use of dextrose‐containing intravenous fluids and steroids, sex, age, Charlson comorbidity score, APACHE 3 score, prior diagnosis of diabetes, HbA1C level, and length of hospital stay) use of sliding‐scale insulin alone (eg, without scheduled basal or nutritional insulin) was associated with a daily average glucose reading that was 20 mg/dL higher than that for those prescribed scheduled insulin or those not prescribed a sliding scale at all (95% confidence interval, 5.035 mg/dL; Table 4). In a separate analysis, adjusting for the same clinical factors, we could find no relationship between change in daily dose of basal insulin and change in daily average glucose level (data not shown).
| Characteristic | Effect size (95% CI)* | P value |
|---|---|---|
| ||
| Sliding scale insulin alone | 20 (5.035) | 0.01 |
| Oral diabetes regimen during hospitalization | 22 (413.0) | 0.02 |
| Diet‐controlled diabetes prior to admission | 32 (577.6) | 0.01 |
| No prior diagnosis of diabetes | 28 (3.260) | 0.08 |
| Complications of diabetes | 44 (2167) | < 0.001 |
| HbA1C | 6.1 (120.0073) | 0.05 |
| Admission glucose | 0.19 (0.0670.31) | 0.002 |
| Medical Team‖ | 47 (6727) | < 0.001 |
| Hospital Floor | 46 (6824) | < 0.001 |
DISCUSSION
In this observational study, we found several deficiencies in the management of diabetes and hyperglycemia among hospitalized patients on a hospitalist‐run general medical service. These deficiencies were both in processes of care (eg, limited use of basal and especially nutritional insulin) and in outcomes (ie, glycemic control) compared with national guidelines. We also found evidence of clinical inertia when comparing outpatient to inpatient regimens, when evaluating daily changes in management, and when evaluating responses to previous hyperglycemia. Finally, we demonstrated that use of an insulin sliding scale by itself was associated with worse glycemic control after extensive adjustment for a variety of clinical factors.
Of note, other than the use of sliding‐scale insulin by itself, we could not find a relationship between specific daily adjustments to insulin orders and daily glycemic control in this study. However, we did find differences in glycemic control by medical team and by floor (the latter a proxy for nursing staff). This suggests that glycemic control depends on the exact details of how insulin is managed, rather than on crude measures of insulin adjustment such as change in dose in response to hyperglycemia. These findings also suggest that interventions focused on medical and nursing staff may be able to improve inpatient glycemic control.
The association between the use of oral diabetic agents and improved glucose control was notable and could represent an actual benefit of these agents (especially when added to sliding‐scale insulin by itself) and/or the result of uncontrolled confounding (ie, as a marker of well‐controlled diabetes). Further study is needed to distinguish among these possibilities.
Previous studies have shown evidence of poor inpatient glycemic control as well as the deleterious effects of sliding‐scale insulin by itself.8 This study is perhaps most notable for the suggestion that little, if anything, has changed over the previous decade in this area, despite recent well‐done observational and randomized controlled trials demonstrating the hazards of inpatient hyperglycemia and the publication of expert consensus statements on inpatient glucose management. Strategies to improve glucose control have been investigated to a greater extent in intensive care units12, 13 than on general medical wards,14 perhaps because the strength of evidence is strongest in this setting. Without such strong evidence for general medical patients, factors such as clinician fear of hypoglycemia, clinical inertia, and resistance to institutional change may play predominant roles.
Clinical inertia (ie, recognition of the problem but failure to act)15 has been demonstrated previously in the outpatient management of diabetes16, 17; this study provides evidence of the phenomenon in the inpatient setting. Work by Phillips and colleagues15 has shown that clinical inertia results from at least 3 problems: overestimation of care provided; use of soft reasons to avoid intensification of therapy; and lack of education, training, and practice organization aimed at achieving specific goals. All 3 problems likely contribute to clinical inertia in inpatient diabetes management. Revised educational programs; systems for improving care such as reminders, flow sheets, and order sets; and performance feedback can help address clinical inertia and improve care.15
This study should be viewed in light of its limitations, including relatively small sample size, thus limiting our ability to detect other possible significant predictors of glycemic control, and the use of a single institution, thus limiting generalizability. However, recent data from the University HealthSystem Consortium revealed that our institution was typical of the 37 participating academic medical centers in that study.18 In addition, only 9 patients were identified without a prior diagnosis of diabetes, raising the possibility that some patients with undiagnosed diabetes were missed in our study. However, our search strategy included a daily review of automatically abstracted laboratory values, making this possibility less likely. Strengths of this study include its prospective data collection methods with rigorous inclusion criteria, collection of detailed clinical data, and use of a novel statistical technique to more accurately assess the complex relationship between insulin use and glycemic control, appropriately adjusting for confounding by indication caused by prior glucose measurements.
Future research should focus on patient, clinician, and system barriers to improving inpatient glycemic management, using the clinical inertia framework as a starting point, and on the creation of insulin protocols that can be used and proven effective in the non‐ICU inpatient setting. Also needed are improved measures of the quality of glycemic control, insulin orders, and daily insulin adjustment.
In conclusion, inpatient glycemic management was shown to be in need of improvement. Institutionwide quality improvement efforts should probably target both physician and nursing behavior and should focus on increasing use of basal and nutritional insulin, as proposed in recent guidelines, avoiding use of sliding‐scale insulin by itself, and performing daily insulin adjustment in response to previous hypo‐ or hyperglycemia. Hospitalists can play a major role in these institutionwide quality improvement efforts.
Acknowledgements
We thank Paul Szumita, PharmD, and LeRoi Hicks, MD, MPH, for assistance with the conception of this project and E. John Orav, PhD, for statistical assistance.
- Agency for Healthcare Research and Quality. HCUPnet, Healthcare Cost and Utilization Project. 8/17/2005. Available at: http://www.ahrq.gov/HCUPnet/. Accessed November 29,2005.
- ,,,,,.Hyperglycemia: an independent marker of in‐hospital mortality in patients with undiagnosed diabetes.J Clin Endocrinol Metab.2002;87:978–982.
- ,,, et al.Management of diabetes and hyperglycemia in hospitals.Diabetes Care.2004;27:553–597.
- ,,, et al.Intensive insulin therapy in the critically ill patients.N Engl J Med.2001;345:1359–1367.
- .Prospective randomised study of intensive insulin treatment on long term survival after acute myocardial infarction in patients with diabetes mellitus. DIGAMI (Diabetes Mellitus, Insulin Glucose Infusion in Acute Myocardial Infarction) Study Group.Br Med J.1997;314:1512–1515.
- ,,, et al.Intense metabolic control by means of insulin in patients with diabetes mellitus and acute myocardial infarction (DIGAMI 2): effects on mortality and morbidity.Eur Heart J2005;26:650–661.
- ,,, et al.American College of Endocrinology position statement on inpatient diabetes and metabolic control.Endocr Pract.2004;10(Suppl2):4–9.
- ,,.Glycemic control and sliding scale insulin use in medical inpatients with diabetes mellitus.Arch Intern Med.1997;157:545–552.
- ,,,,.Can comorbidity be measured by questionnaire rather than medical record review?Med Care.1996;34:73–84.
- ,,.Marginal structural models to estimate the joint causal effect of nonrandomized treatments.J Am Stat Assoc—App Case Stud.2001;96:440–448.
- .Correction for non‐compliance in equivalence trials.Stat Med.1998;17:269–302; discussion87–89.
- ,,, et al.Implementation of a safe and effective insulin infusion protocol in a medical intensive care unit.Diabetes Care.2004;27:461–7.
- .Effect of an intensive glucose management protocol on the mortality of critically ill adult patients.Mayo Clin Proc.2004;79:992–1000.
- ,,,.Eliminating inpatient sliding‐scale insulin: a reeducation project with medical house staff.Diabetes Care.2005;28:1008–1011.
- ,,, et al.Clinical inertia.Ann Intern Med.2001;135:825–834.
- ,,,,.Diabetes in urban African‐Americans. XV. Identification of barriers to provider adherence to management protocols.Diabetes Care.1999;22:1617–1620.
- ,,, et al.Clinical inertia in the management of type 2 diabetes metabolic risk factors.Diabet Med.2004;21:150–155.
- University HealthSystem Consortium.Glycemic control 2005 findings and conclusions. Paper presented at Glycemic Control 2005 Knowledge Transfer Meeting. August 19,2005, Chicago, IL.
Diabetes mellitus is a common comorbidity of hospitalization; in 2003 diabetes was a secondary diagnosis in 17.8% of all adult hospital discharges.1 When undiagnosed diabetes is included, the prevalence of inpatient diabetes or hyperglycemia may be as high as 38%.2 Recent studies show that hyperglycemia in hospitalized patients complicates numerous illnesses and is an independent predictor of adverse outcomes.3 Treatment of inpatient hyperglycemia improves outcomes, including mortality, for patients in surgical intensive care units4 and possibly for those admitted for myocardial infarction.5, 6 For these reasons, the American Diabetes Association and the American College of Endocrinology now recommend that glucose levels of all patients admitted to non‐critical‐care units be maintained below 180 mg/dL.3, 7
Evidence‐based recommendations for achieving these goals include effective protocols for subcutaneous insulin therapy for patients who do not require continuous intravenous insulin infusion. Components of these protocols include use of basal insulin and scheduled nutritional insulin, avoiding use of supplemental (sliding‐scale) insulin alone (which has been shown to be ineffective and possibly deleterious in prior studies),8 and adjustment of insulin orders to reflect nutritional intake, insulin sensitivity, and previous response to therapy.7
We conducted this study to evaluate the current state of glycemic control and adherence to current recommendations on a general medicine service run by hospitalists in a busy teaching hospital. We also sought to correlate insulin‐ordering practices with the quality of glycemic control in these patients.
METHODS
Setting and Participants
This prospective cohort study was conducted at Brigham and Women's Hospital (BWH) from August 1 through September 30, 2004. Eligible subjects were patients admitted to 3 General Medicine Service (GMS) teams with either a known diagnosis of diabetes or inpatient hyperglycemia (random glucose > 200 mg/dL). Patients admitted for diabetic ketoacidosis, hyperosmolar hyperglycemic state, or gestational diabetes were excluded. Members of the BWH/Faulkner Hospitalist Service are the teaching attendings on these 3 teams (each consisting of 2 interns and 1 junior or senior resident) and are the attendings of record for approximately 90% of the patients on these teams. A research assistant identified potential subjects each weekday from the daily computerized sign‐out system used by all medical residents by searching for diabetes on the patient summary, a diabetic medication in the automatically abstracted medication list, or a laboratory glucose value greater than 200 mg/dL from automatically abstracted daily laboratory results. Eligibility criteria were confirmed by medical record review, and any question of eligibility was reviewed with the principal investigator. This study was approved by the BWH Institutional Review Board; patient consent was not deemed necessary for this study given the relatively nonsensitive nature of the data (eg, glucose control, insulin orders), the noninvasive means of collecting it (eg, chart review), and the steps taken by research personnel to minimize any breach in patient confidentiality.
Measurements
We abstracted clinical data on each eligible subject for up to 5 days on GMS. Several data sources were used, including physician admission notes, the hospital's computerized clinical data system, nursing notes, vital sign sheets, the medication administration record, and personal communication with nurses about any missing or discrepant data. Up to 4 routine bedside blood glucose measurements were recorded each day: the measurements taken before meals and at bedtime for patients eating discrete meals or the measurements closest to 6 AM, noon, 6 PM, and midnight for patients not eating or receiving continuous nutrition. Additional measurements were not recorded to avoid ascertainment bias caused by follow‐up testing of abnormal glucose values.
Study outcomes included the percentage of glucose readings below 60 mg/dL (hypoglycemia) and greater than 180 mg/dL (hyperglycemia). Use of several types of insulin ordering practices were also recorded: use of basal insulin (ie, long‐acting agents such as NPH and insulin glargine), scheduled prandial insulin (eg, regular insulin, insulin lispro, and insulin aspart given before each meal), daily adjustments to insulin orders, use of different insulin sliding scales for patients with different daily insulin requirements, orders to hold or adjust insulin doses in patients not eating, and the percentage of the total daily insulin dose given as basal insulin.
Other patient variables collected were age, sex, weight; medical comorbidities (using a modified Charlson score)9; severity of illness (using a simplified APACHE III score)8; admission diagnosis; baseline HbA1C (taken at or within 6 months of admission); severe complications of diabetes (blindness, dialysis, renal transplant, amputation due to peripheral vascular disease, vascular bypass surgery); diabetic medications prior to admission (none, oral agents only, or any insulin use); daily inpatient use of oral or intravenous steroids, oral diabetic medications, dextrose‐containing intravenous fluids, tube feeds, inpatient total parenteral nutrition, and general nutritional intake (all, most, some, little, or none for each meal).
Statistical Analysis
Characteristics of the study subjects and process and outcome measures were analyzed descriptively using rates, means with standard deviations, and medians with interquartile ranges as appropriate. We also analyzed outcomes by patient‐day to determine daily trends during the course of hospitalization. In these analyses, we used the Mantel‐Haenszel chi‐square test for the dichotomous variables (eg, daily use of any basal insulin) and univariable linear regression with general linear models clustered by patient, that is, repeated‐measures analysis, for the continuous variables. We used an arcsin(square‐root) transformation for those continuous outcomes that were percentages (eg, percentage of glucose readings > 180 mg/dL) and logarithmic transformation for right‐tailed continuous variables (eg, total number of units of insulin administered).
To determine the effects of various insulin‐ordering practices on glucose control, we also performed multivariable analysis of mean glucose levels per patient‐day. We chose mean glucose rather than rates of specific glucose ranges as the outcome because of the low rate of hypoglycemia and the additional sensitivity of this method. First, univariable analysis was performed using the Student's t test, analysis of variance, or Spearman correlation as appropriate for each predictor. Multiple linear regression models were then constructed, using variables significant in the univariable testing at the P < .10 level. Confounding variables that changed beta coefficients by 10% or more were retained, whereas collinear terms were removed by hand; patient age and sex were also retained in the models as a priori selected confounding variables.
As with the repeated‐measures analysis, we used general linear models, accounting for within‐patient clustering, with an exchangeable correlation structure. In addition, standard regression techniques could not be applied to the basal insulin variable because use of basal insulin is a mediator of subsequently lower glucose levels but often is the result of previously elevated glucose levels. Instead, we used a marginal structural model,10, 11 weighting the usual regression analysis to statistically remove the effect of confounding by indication. The weights for this analysis were based on the inverse probability of use of basal insulin, given previous glucose levels and prior use of basal insulin and were estimated from a separate logistic regression analysis. Results were considered significant at P < .05 except as noted above. SAS version 8.1 (Cary, NC) was used for all analyses.
RESULTS
We prospectively identified 123 patients for the study. Subsequently, 16 patients were excluded, 11 who did not have diabetes or inpatient hyperglycemia (most of whom had been placed on insulin prophylactically to avoid steroid‐induced hyperglycemia), 2 who were admitted for diabetic ketoacidosis, 2 who were not on GMS teams 13, and 1 whose data could not be accessed. Characteristics of the remaining 107 study subjects are shown in Table 1. The mean age of the subjects was 65.2 years; 55% were men. Nine patients had no previous diagnosis of diabetes, 43% were taking insulin prior to admission, 14% had severe diabetic complications, and the median HbA1C was 7.
| Characteristic | |
|---|---|
| |
| Age, mean (SD), y | 65.2 (14.5) |
| Male | 59/107 (55) |
| No diagnosis of diabetes at admission | 9/107 (8) |
| Preadmission diabetes medication regimen: | |
| None | 24/106 (22) |
| Oral medications only | 36/106 (34) |
| Insulin | 46/106 (43) |
| HbA1C, median (IQR) | 7 (6, 8) |
| Diabetic complications | 15/107 (14) |
| Hospital length of stay, median (IQR), d | 5 (3, 7) |
| Charlson score, mean (SD) | 5.3 (3.0) |
| APACHE III score, mean (SD) | 36.9 (15.6) |
Regarding insulin‐ordering practices (Table 2), 47 patients (43%) had basal insulin prescribed, while 4% of patients had an order for scheduled mealtime short‐ or rapid‐acting insulin. Of the 89 patients on sliding‐scale insulin, 80 (90%) had orders written for the default sliding scale built into the computerized physician order entry system at BWH. There was no correlation between intensity of the sliding scale and the patient's total daily insulin dose (data not shown). Of the patients on sliding‐scale insulin, 47% were prescribed basal insulin, 39% were prescribed oral agents, and 23% were prescribed neither.
| Measure | |
|---|---|
| |
| Process | |
| Any basal insulin during hospitalization | 47/107 (43) |
| Separate nutritional insulin order | 4/107 (3.7) |
| Change in dose to any insulin order during hospitalization if any hyper‐ or hypoglycemia | 26/75 (35) |
| Standard sliding scale from hospital computer order set | 80/89 (90) |
| Any oral diabetic agents during hospitalization | 39/107 (36) |
| Outcomes | |
| Any hyperglycemia (glucose > 180 mg/dL) | 74/98 (76) |
| 0%20% of readings | 20/98 (20) |
| 20%40% | 19/98 (19) |
| 40%60% | 19/98 (19) |
| 60%80% | 6/98 (6.1) |
| Greater than 80% | 10/98 (10) |
| Any hypoglycemia (glucose < 60 mg/dL) | 11/98 (11) |
| 0%20% of readings | 9/98 (9.2) |
| 20%40% | 2/98 (2.0) |
Regarding glucose control, 317 of 1022 glucose meter readings (31%) were greater than 180 mg/dL, and the mean rate of glucose readings greater than 180 mg/dL per patient was also 31%. Approximately three quarters of all patients had at least one routine glucose reading greater than 180 mg/dL, and 35% of patients had at least 40% of their routine glucose readings greater than 180 mg/dL (Table 2). Twelve of 1022 readings (1.2%) were less than 60 mg/dL, and 11% of patients had at least one glucose reading less than 60 mg/dL (Table 2).
Despite a relatively constant percentage of glucose readings greater than 180 mg/dL per patient over the first 5 days of hospitalization (25%36% each day), we found no evidence of change in the percentage of patients prescribed basal insulin or the percentage of insulin given as basal insulin, and there was a small but significant increase in the total amount of insulin prescribed (Table 3). Of the 75 patients with at least one episode of hypo‐ or hyperglycemia, 43 (57%) were ever prescribed basal insulin, 29 (39%) were prescribed oral diabetes agents, and only 26 (35%) had any change to their insulin regimen during the first 5 days of their hospitalization on GMS. Of the 47 patients prescribed basal insulin in the hospital, 41 had been taking insulin prior to admission.
| Hospital day | P value for Trend | |||||
|---|---|---|---|---|---|---|
| 1 | 2 | 3 | 4 | 5 | ||
| ||||||
| Number of patients | 107 | 105 | 85 | 66 | 48 | |
| Mean adjusted total daily insulin units* | 17 | 22 | 23 | 20 | 27 | 0.03 |
| Patients prescribed any basal insulin (%) | 29/79 (37) | 41/93 (44) | 33/74 (45) | 27/57 (47) | 20/43 (47) | 0.18 |
| Mean % of total insulin dose consisting of basal insulin | 35 | 42 | 38 | 39 | 33 | 0.80 |
| Mean % glucose readings < 60 mg/dL | 2 | 1 | 1 | 0 | 1 | 0.13 |
| Mean % glucose readings> 180 mg/dL | 36 | 34 | 29 | 25 | 32 | 0.13 |
In a multivariable analysis of the mean glucose reading per patient‐day, we found several predictors of lower glucose readings, including diet‐controlled diabetes prior to admission and prescription of oral hypoglycemic medications in the hospital. We also found several predictors of higher glucose readings, including severe diabetic complications and higher glucose level at admission. Finally, we noted variation both by medical team (each composed of 1 medical attending, 1 resident, and 2 interns) and by floor of the hospital (each staffed by a different cadre of nurses). Adjusting for these factors (as well as for the daily use of dextrose‐containing intravenous fluids and steroids, sex, age, Charlson comorbidity score, APACHE 3 score, prior diagnosis of diabetes, HbA1C level, and length of hospital stay) use of sliding‐scale insulin alone (eg, without scheduled basal or nutritional insulin) was associated with a daily average glucose reading that was 20 mg/dL higher than that for those prescribed scheduled insulin or those not prescribed a sliding scale at all (95% confidence interval, 5.035 mg/dL; Table 4). In a separate analysis, adjusting for the same clinical factors, we could find no relationship between change in daily dose of basal insulin and change in daily average glucose level (data not shown).
| Characteristic | Effect size (95% CI)* | P value |
|---|---|---|
| ||
| Sliding scale insulin alone | 20 (5.035) | 0.01 |
| Oral diabetes regimen during hospitalization | 22 (413.0) | 0.02 |
| Diet‐controlled diabetes prior to admission | 32 (577.6) | 0.01 |
| No prior diagnosis of diabetes | 28 (3.260) | 0.08 |
| Complications of diabetes | 44 (2167) | < 0.001 |
| HbA1C | 6.1 (120.0073) | 0.05 |
| Admission glucose | 0.19 (0.0670.31) | 0.002 |
| Medical Team‖ | 47 (6727) | < 0.001 |
| Hospital Floor | 46 (6824) | < 0.001 |
DISCUSSION
In this observational study, we found several deficiencies in the management of diabetes and hyperglycemia among hospitalized patients on a hospitalist‐run general medical service. These deficiencies were both in processes of care (eg, limited use of basal and especially nutritional insulin) and in outcomes (ie, glycemic control) compared with national guidelines. We also found evidence of clinical inertia when comparing outpatient to inpatient regimens, when evaluating daily changes in management, and when evaluating responses to previous hyperglycemia. Finally, we demonstrated that use of an insulin sliding scale by itself was associated with worse glycemic control after extensive adjustment for a variety of clinical factors.
Of note, other than the use of sliding‐scale insulin by itself, we could not find a relationship between specific daily adjustments to insulin orders and daily glycemic control in this study. However, we did find differences in glycemic control by medical team and by floor (the latter a proxy for nursing staff). This suggests that glycemic control depends on the exact details of how insulin is managed, rather than on crude measures of insulin adjustment such as change in dose in response to hyperglycemia. These findings also suggest that interventions focused on medical and nursing staff may be able to improve inpatient glycemic control.
The association between the use of oral diabetic agents and improved glucose control was notable and could represent an actual benefit of these agents (especially when added to sliding‐scale insulin by itself) and/or the result of uncontrolled confounding (ie, as a marker of well‐controlled diabetes). Further study is needed to distinguish among these possibilities.
Previous studies have shown evidence of poor inpatient glycemic control as well as the deleterious effects of sliding‐scale insulin by itself.8 This study is perhaps most notable for the suggestion that little, if anything, has changed over the previous decade in this area, despite recent well‐done observational and randomized controlled trials demonstrating the hazards of inpatient hyperglycemia and the publication of expert consensus statements on inpatient glucose management. Strategies to improve glucose control have been investigated to a greater extent in intensive care units12, 13 than on general medical wards,14 perhaps because the strength of evidence is strongest in this setting. Without such strong evidence for general medical patients, factors such as clinician fear of hypoglycemia, clinical inertia, and resistance to institutional change may play predominant roles.
Clinical inertia (ie, recognition of the problem but failure to act)15 has been demonstrated previously in the outpatient management of diabetes16, 17; this study provides evidence of the phenomenon in the inpatient setting. Work by Phillips and colleagues15 has shown that clinical inertia results from at least 3 problems: overestimation of care provided; use of soft reasons to avoid intensification of therapy; and lack of education, training, and practice organization aimed at achieving specific goals. All 3 problems likely contribute to clinical inertia in inpatient diabetes management. Revised educational programs; systems for improving care such as reminders, flow sheets, and order sets; and performance feedback can help address clinical inertia and improve care.15
This study should be viewed in light of its limitations, including relatively small sample size, thus limiting our ability to detect other possible significant predictors of glycemic control, and the use of a single institution, thus limiting generalizability. However, recent data from the University HealthSystem Consortium revealed that our institution was typical of the 37 participating academic medical centers in that study.18 In addition, only 9 patients were identified without a prior diagnosis of diabetes, raising the possibility that some patients with undiagnosed diabetes were missed in our study. However, our search strategy included a daily review of automatically abstracted laboratory values, making this possibility less likely. Strengths of this study include its prospective data collection methods with rigorous inclusion criteria, collection of detailed clinical data, and use of a novel statistical technique to more accurately assess the complex relationship between insulin use and glycemic control, appropriately adjusting for confounding by indication caused by prior glucose measurements.
Future research should focus on patient, clinician, and system barriers to improving inpatient glycemic management, using the clinical inertia framework as a starting point, and on the creation of insulin protocols that can be used and proven effective in the non‐ICU inpatient setting. Also needed are improved measures of the quality of glycemic control, insulin orders, and daily insulin adjustment.
In conclusion, inpatient glycemic management was shown to be in need of improvement. Institutionwide quality improvement efforts should probably target both physician and nursing behavior and should focus on increasing use of basal and nutritional insulin, as proposed in recent guidelines, avoiding use of sliding‐scale insulin by itself, and performing daily insulin adjustment in response to previous hypo‐ or hyperglycemia. Hospitalists can play a major role in these institutionwide quality improvement efforts.
Acknowledgements
We thank Paul Szumita, PharmD, and LeRoi Hicks, MD, MPH, for assistance with the conception of this project and E. John Orav, PhD, for statistical assistance.
- Agency for Healthcare Research and Quality. HCUPnet, Healthcare Cost and Utilization Project. 8/17/2005. Available at: http://www.ahrq.gov/HCUPnet/. Accessed November 29,2005.
- ,,,,,.Hyperglycemia: an independent marker of in‐hospital mortality in patients with undiagnosed diabetes.J Clin Endocrinol Metab.2002;87:978–982.
- ,,, et al.Management of diabetes and hyperglycemia in hospitals.Diabetes Care.2004;27:553–597.
- ,,, et al.Intensive insulin therapy in the critically ill patients.N Engl J Med.2001;345:1359–1367.
- .Prospective randomised study of intensive insulin treatment on long term survival after acute myocardial infarction in patients with diabetes mellitus. DIGAMI (Diabetes Mellitus, Insulin Glucose Infusion in Acute Myocardial Infarction) Study Group.Br Med J.1997;314:1512–1515.
- ,,, et al.Intense metabolic control by means of insulin in patients with diabetes mellitus and acute myocardial infarction (DIGAMI 2): effects on mortality and morbidity.Eur Heart J2005;26:650–661.
- ,,, et al.American College of Endocrinology position statement on inpatient diabetes and metabolic control.Endocr Pract.2004;10(Suppl2):4–9.
- ,,.Glycemic control and sliding scale insulin use in medical inpatients with diabetes mellitus.Arch Intern Med.1997;157:545–552.
- ,,,,.Can comorbidity be measured by questionnaire rather than medical record review?Med Care.1996;34:73–84.
- ,,.Marginal structural models to estimate the joint causal effect of nonrandomized treatments.J Am Stat Assoc—App Case Stud.2001;96:440–448.
- .Correction for non‐compliance in equivalence trials.Stat Med.1998;17:269–302; discussion87–89.
- ,,, et al.Implementation of a safe and effective insulin infusion protocol in a medical intensive care unit.Diabetes Care.2004;27:461–7.
- .Effect of an intensive glucose management protocol on the mortality of critically ill adult patients.Mayo Clin Proc.2004;79:992–1000.
- ,,,.Eliminating inpatient sliding‐scale insulin: a reeducation project with medical house staff.Diabetes Care.2005;28:1008–1011.
- ,,, et al.Clinical inertia.Ann Intern Med.2001;135:825–834.
- ,,,,.Diabetes in urban African‐Americans. XV. Identification of barriers to provider adherence to management protocols.Diabetes Care.1999;22:1617–1620.
- ,,, et al.Clinical inertia in the management of type 2 diabetes metabolic risk factors.Diabet Med.2004;21:150–155.
- University HealthSystem Consortium.Glycemic control 2005 findings and conclusions. Paper presented at Glycemic Control 2005 Knowledge Transfer Meeting. August 19,2005, Chicago, IL.
Copyright © 2006 Society of Hospital Medicine