User login
Treatment Facility: An Important Prognostic Factor for Dedifferentiated Liposarcoma Survival (FULL)
Approximately 17% to 25% of all softtissue sarcomas (STS) are liposarcomas, making liposarcoma the most common type of STS.1 The 2013 World Health Organization (WHO) classification separates liposarcoma into 4 histologic subtypes: atypical lipomatous tumor/well-differentiated (ALT/ WDLPS), dedifferentiated (DDLPS), myxoid, and pleomorphic.2 Each subtype has unique histology, morphology, and natural history. WDLPS and DDLPS are the most common histologic subtypes, comprising approximately 50% of all sarcomas that arise in the retroperitoneum.3 DDLPS represents 18% of all liposarcomas, making it the second most common subtype of liposarcoma.4
In 1979, DDLPS was first characterized.5 Most (90%) cases of DDLPS present de novo, whereas the other 10% transform from preexisting low-grade WDLPS.2 DDLPSs are formed by an amplification of 12q14-15 involving the MDM2 gene.4 These malignancies most commonly present in the retroperitoneum as a large painless mass, consisting of both fatty and nonfatty components.2 Primary site has been previously reported as a major prognostic factor for DDLPSs, with retroperitoneal DDLPSs demonstrating the worst prognosis.6 DDLPSs have a high risk of local recurrence, with some reports estimating recurrence rates approaching 40%.2 Overall mortality at 5 years for DDLPS is estimated to be between 30% and 40%.4
Previous literature has determined that median income, race, health insurance, and facility type are related to survival outcomes for patients with DDLPS.7-9 When comparing the most common types of cancers, residents of poorer US counties consistently had a higher risk of mortality than residents in affluent US counties, and all racial minorities showed worse survival outcomes when compared with white patients.7 Differences in survival outcomes have been reported in patients attending different treatment facilities for other cancers including pancreatic cancers, glioblastomas, and oral cancers, with multiple studies concluding that academic and research programs are associated with the longest survival outcomes.10-12 For many cancers, insurance status has been shown to be a significant prognostic factor, with private insurance typically resulting in the best prognosis.8,9
The goal of this retrospective study was to assess the prognostic effects of socioeconomic variables on the overall survival (OS) probabilities in a large cohort of DDLPS patients in order to inform clinicians about a potentially at-risk population.
Method
The National Cancer Database (NCDB) was created by the Commission on Cancer (CoC) of the American College of Surgeons and the American Cancer Society. The NCDB is the largest cancer database in the US and includes data on almost 70% of US patients with cancer. CoC-accredited cancer programs add data on patients with cancer to the NCDB. The authors accessed the NCDB data through the use of the NCDB Participant Use File program.
Patients’ data from 2004 through 2015 were abstracted. Only patients with the International Classification of Diseases for Oncology histology code 8858, corresponding to DDLPS, were analyzed. Patients with other comorbid malignant tumors were excluded to accurately capture the true survival rates for DDLPS. Variables analyzed included age, sex, race, insurance status, treatment facility type, median household income by zip code, and percentage of adults in the patient’s zip code with no high school (HS) education.
Median survival, 5- and 10-year OS probabilities, and Kaplan-Meier survival curves were calculated for multiple variables, specifically race, insurance status, treatment facility type, median family income, and percentage of adults without a HS degree. Both 5- and 10-year OS probabilities were determined by race with the patients separated into white, African American, Asian, American Indian/Alaska Native (AI/AN), and Asian Indian or Pakistani groups. Our study categorized Chinese, Japanese, Filipino, Hmong, Korean, Vietnamese, Thai, Guamanian, Asian not otherwise specified, and other Asian ethnicity patients together into one collective Asian group. Insurance status was classified into Medicare, Medicaid, other government insurance, and private insurance groups. Other government insurance consisted of US Department of Veterans Affairs, Indian Health Service, Public Health Service, and other government health care programs. Further analysis could not be performed into the distribution of the other government insurance variable.
Facility types were divided into 4 groups: community, comprehensive community, academic/ research, and integrated network cancer treatment facilities. Median income quartiles and the percentage of adults with no high school degree were estimated by comparison of the patient’s zip code with US Census Bureau data. Median household income was separated into 4 groups, including lowest level of household income (< $38,000), low level of household income ($38,000 to $47,999), moderate level of household income ($48,000 to $62,999), and highest level of household income (≥ $63,000). The percentages of adults with no high school degree were divided into 4 groups: lowest level of HS education (≥ 21% ), low level of HS education (13.0% to 20.9%), moderate level of HS education (7.0% to 12.9%), and highest level of HS education (≤ 7%). The 5- and 10-year survival probabilities were calculated using the number of months between the date of diagnosis and the date of death or last known contact.
Continuous variables are presented as median and interquartile range (IQR) whereas categorical variables are presented as frequencies and proportion. IBM SPSS version 25.0 was used to produce Kaplan-Meier survival curves and descriptive statistics. This study used Kaplan- Meier survival tables and log-rank tests to analyze both the 5- and 10-year OS rates for the 5 variables listed above. This study also used a multivariable Cox regression model that accommodated the correlative nature of outcomes within facilities to study the association of the treatment facility type and other socioeconomic factors, while controlling for age, race (which was collapsed into 3 categories), sex, primary site, tumor stage, and treatment approaches. The proportional hazards assumption was individually checked for all pertinent variables. Any patient records that were missing data were excluded from the multivariable Cox regression model, which was analyzed with SAS version 9.4 (Cary, NC). P < 0.05 was used to indicate statistical significance for all analyses.
Results
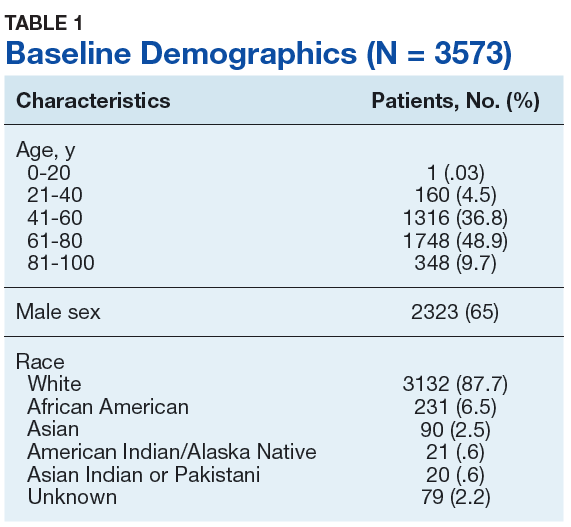
Table 1 provides descriptive analysis for demographic characteristics of the 3573 patients including age, sex, and race. The median age at diagnosis was 64 years. There were 1073 more men (65%) than women (35%) in this analysis. Whites were the predominant racial category, comprising 87.7% of the patient population, followed by African Americans (6.5%) and Asians (2.5%).
Socioeconomic Variables
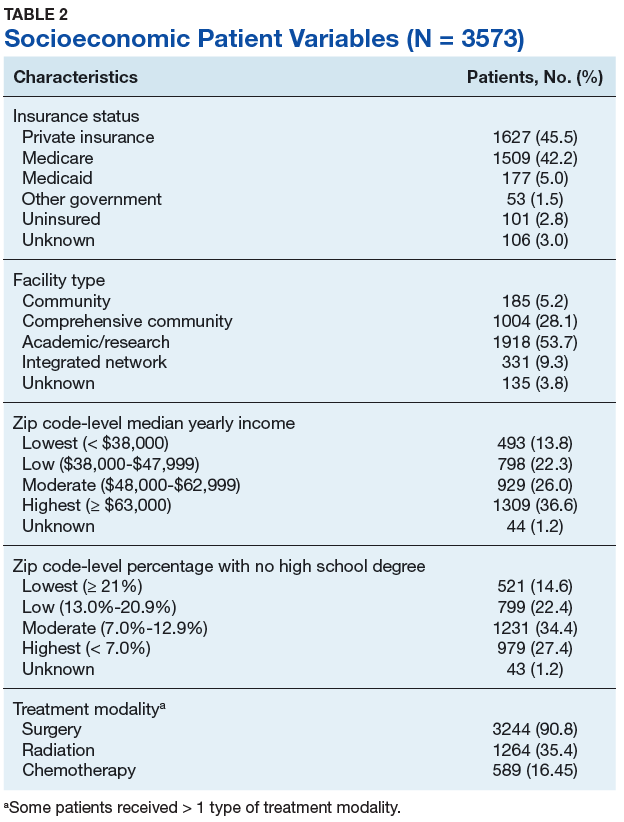
The largest proportion of the patient population (45.5%) had private insurance (Table 2). Medicare came in a close second covering almost 42.2% of the population, followed by Medicaid (5.0%), uninsured (2.8%), and other government insurance (1.5%). About half (53.7%) of the patients were treated at academic or research facilities, while the fewest number of patients (5.2%) underwent treatment at community cancer facilities. The largest percentage (36.6%) of patients lived in zip codes with the highest level of median household income, while 26.0% and 22.3% had moderate and low levels of income, respectively. About 14% of patients lived within an area of the lowest level of income. Similarly, almost 15% of patients lived in an area of lowest level of HS education. The greatest percentage of the patient population (34.5%) lived in a zip code with moderate level of HS education. Surgery was the most common treatment modality with 90.8% of the cohort undergoing surgery, while 35.4% and 16.5% were treated with radiation and chemotherapy, respectively (some patients received more than one type of treatment modality).
Survival Data
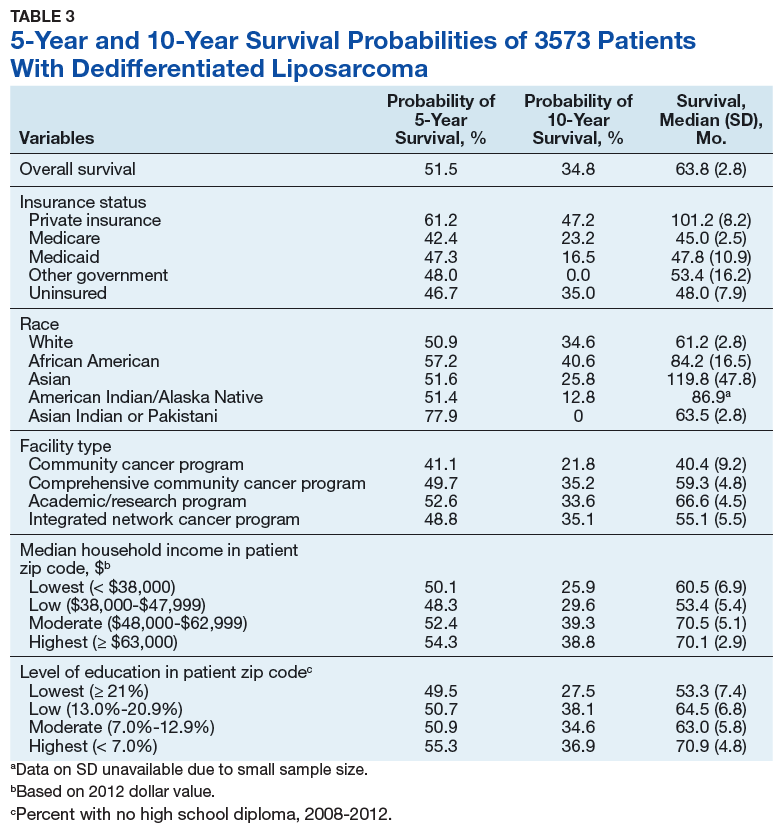
Survival data were available for 3112 patients. Kaplan-Meier survival curves were used to analyze OS according to insurance status, racial background, treatment facility type, median family income, and percentage of adults with no high school education. Overall 5- and 10- year OS probabilities were 51.5% and 34.8%, respectively, while the median OS (SD) was 63.57 (2.8) months (Table 3).
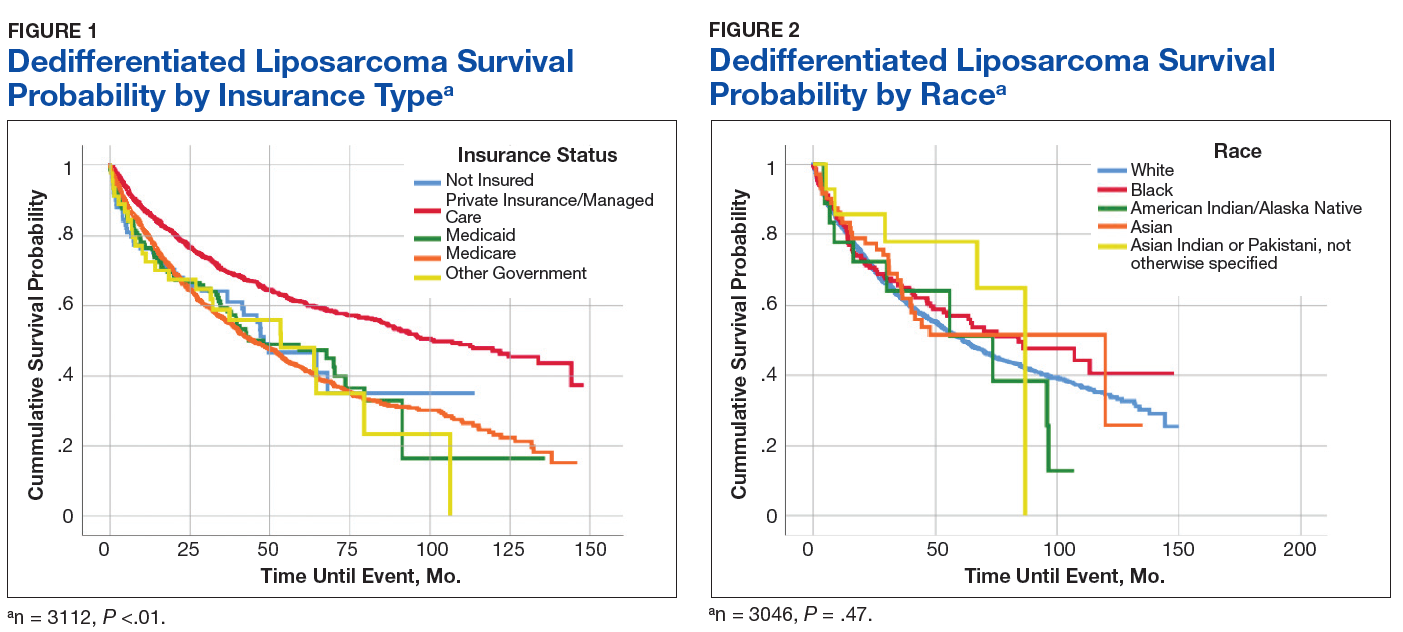
Private insurance showed significantly higher 5- and 10-year OS probabilities and median OS: 5-year OS was 61.2%, 10-year OS was 47.2%, and median survival (SD) was 101.2 (8.2) months compared with that of all other insurance groups (Medicare, Medicaid, other government insurance, and uninsured) (Figure 1). These other insurance types were fairly similar in their 5-year and median OS, but surprisingly, patients with no insurance had the second longest 10-year OS. The difference between the 5-year OS probabilities of private insurance compared with an average of the other insurances was 15.1%, which had almost doubled to 28.5% at 10 years, with a median OS difference of almost 5 years (56 months; data not shown).
Using the Kaplan-Meier survival curve, Asian Indians had the longest 5-year OS probability of 77.9% and African Americans had the longest 10-year OS probability of 40.6%. However, Asians as a group demonstrated the longest median (SD) OS outcome with 119.8 (47.8) months (Figure 2).
Overall, academic/research programs had the longest median OS and 5-year OS probability (SD) of 66.6 (4.5) months and 52.6%, respectively (Figure 3). Comprehensive community cancer programs and integrated network cancer programs had nearly identical 10-year OS rates (35.2% vs 35.1%, respectively). Community cancer programs had the worst 5- and 10-year OS probabilities (41.1% and 21.8%, respectively).
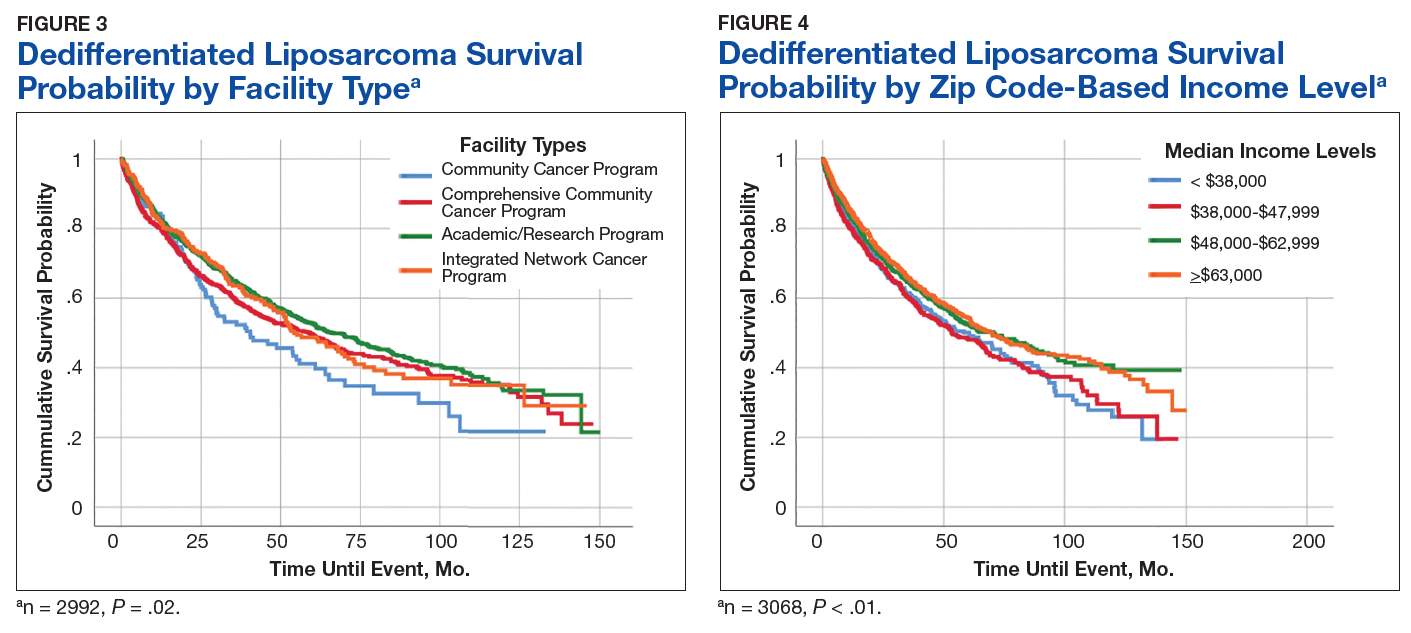
The top 2 income quartiles combined to demonstrate the longest median, 5-year, and 10-year OS probabilities and were very similar. Patients living in a zip code with the highest income level had the longest 5-year OS rates of 54.3%, while patients living in zip codes with a moderate income level had the longest 10-year OS at 39.3% and the longest median OS of about 71 months. Patients with the lowest level of median household income had the worst 5-year OS rates (48.3%) and a median (SD) OS of 53.4 (5.4) months (Figure 4).
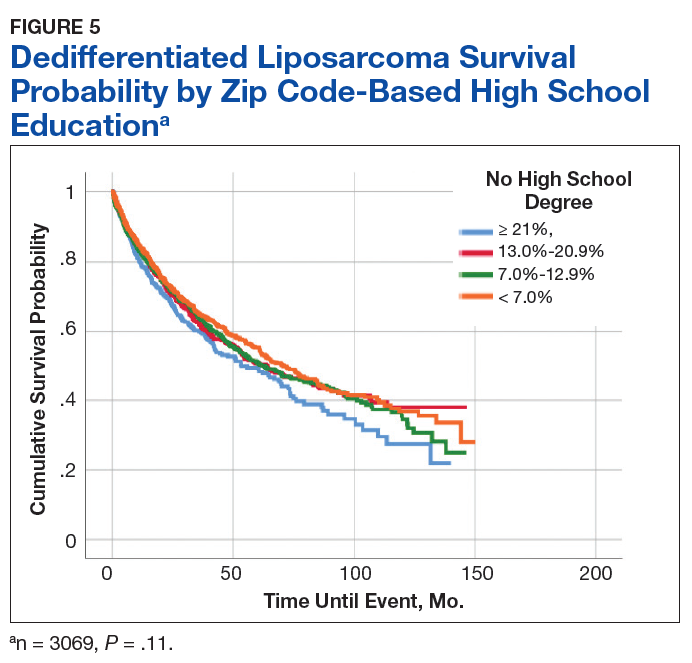
A Kaplan-Meier curve for percentage of adults without a HS degree is displayed in Figure 5. Zip codes with the highest level of education had the longest 5-year OS rates and median (SD) OS of 55.3% and 70.9 (4.8) months, respectively. The longest 10-year OS outcomes at 38.1% were found in patients who lived in areas of low-education levels. The worst 5- and 10- year OS outcomes and median OS were found in the least educated zip codes.
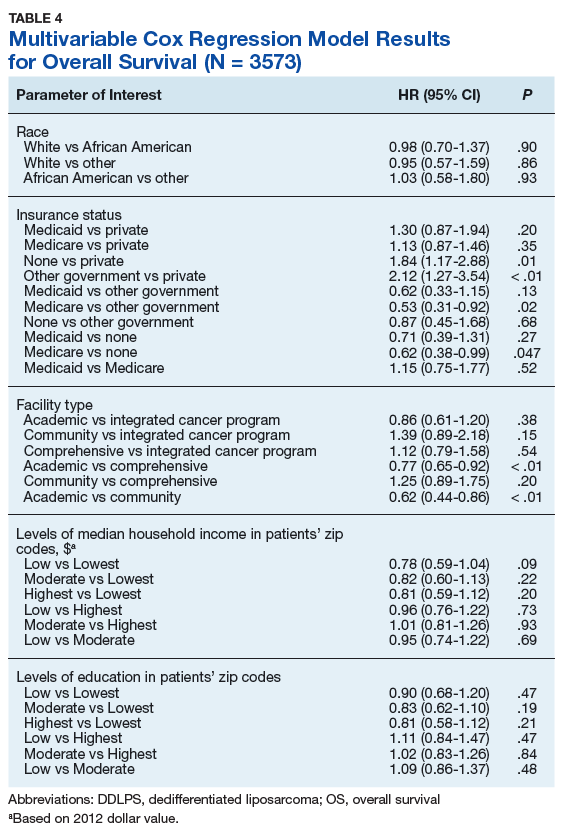
Results from the Cox regression model of OS are displayed in Table 4. Race and ethnicity, zip code-level median household income, and zip code-level education were not associated with OS. Patients with no insurance had an increased risk of death (hazard ratio [HR], 1.84; 95% CI, 1.17-2.88; P < .01) when compared with patients with private insurance. Patients with other government insurance also had an increased risk of death (HR, 2.12; 95% CI, 1.27-3.54; P < .01) when compared with patients with private insurance while controlling for all other variables. Patients with Medicare had a decreased risk of death when compared with patients with other government insurance and no insurance (HR, 0.53; 95% CI, 0.31-0.92; P = .02 and HR, 0.62; 95% CI, 0.38-0.99; P = .05, respectively). Patients treated at academic centers had better OS when compared with patients treated at comprehensive treatment centers (HR, 0.77; 95% CI, 0.65-0.92;P < .01) and community treatment centers (HR, 0.62; 95% CI, 0.44-0.86; P < .01).
Discussion
This study is the largest study to date that specifically studies the type of treatment facilities and socioeconomic factors, including insurance status, race, income, and education, and how they affect survival of DDLPS. The overall 5- and 10-year OS probabilities for DDLPS in this study were 51.5% and 34.8%, respectively, with median OS of 63.6 months. These results were more encouraging than previous reports, which found a 5-year survival probability of 36.5% and a median OS of 45 months.13,14
The largest age grouping was aged 61 to 80 years (48.9% of the cohort), and the median age at diagnosis was 64 years. DDLPSs most typically present between the ages of 50 and 70 years.15 Our cohort was 65% male. Previous studies have indicated that DDLPSs affect the sexes equally; however, another study showed a similar male predominance (68.8%) at the MD Anderson Cancer Center in Houston, Texas.13,16
In our study, approximately 88% of patients were white, 6.5% were African American, and 2.5% were Asian, which differed from a previous study of 84 patients that had a 78.6% white, 4.8% Asian, and 1.2% African American patient population.14
Asian Indian or Pakistani patients had the best 5-year OS probability at 77.9%, followed by African American (57.2%), Asian (51.6%), AI/AN (51.4%), and white patients (50.9%). This trend had disappeared by 10 years and Asian, AI/AN, African American, and Asian Indian or Pakistani groups all demonstrated longer median OS than did white patients. In fact, Asian patients had the longest median OS at 119.8 months, which was almost double that of white patients with the lowest median OS of 61.2 months. This finding is contrary to previous studies, which reported that racial minorities typically had worse OS outcomes when compared with white patients in different types of cancer.7,17 Notably, these findings were not statistically significant in our current study in the log-rank or multivariable analyses.
Private insurance was the most common form of insurance followed in decreasing order by Medicare, Medicaid, uninsured, and other government insurance. About 42% of the cohort had Medicare, which is a federally funded US insurance program designated for patients aged ≥ 65 years and certain younger patients with disabilities.
Patients with private insurance demonstrated the longest OS, essentially twice the median OS of all other insured groups at 101 months. Medicare had the worst 5-year OS probability and median OS of all groups. A previous study of 77 patients with DDLPS reported that patients aged > 65 years had reduced OS.13 Medicare patients in this study were older, with a mean and median age at DDLPS diagnosis of 71 and 72 years, respectively, while private insurance had a mean and median age at diagnosis of 56 and 57 years, respectively. Medicare inherently covers older patients and this age difference could account for the decrease in overall survival.
Improved OS for privately insured patients was most notable compared with the uninsured or patients with other government insurance. Uninsured patients had an 83.7% increased risk of mortality when compared with patients with private insurance. When compared with patients with private insurance, patients with other government insurance had an 111.5% increased risk of mortality. Comparing patients with Medicare vs patients with no insurance or other government insurance, there was a decreased risk of mortality of 38.5% and 46.6%, respectively. This decreased OS in patients with other government insurance could be related to the choice of treatment facility, because only 31% of the patients with other government insurance went to academic or research centers when compared with the 58.4% and 50.8% of patients with private and Medicare insurance treated there (data not shown). Such centers often have access to more advanced technology and protocols that may not be available at other treatment facilities.
A little more than half of the patients in the cohort went to an academic or research center for treatment (53.7%); comprehensive community cancer programs were the second most common treatment facility at 28%. Patients treated at academic or research centers demonstrated the best outcomes with a 5-year OS of 52.6%, followed in decreasing order by comprehensive community cancer programs (49.7%), integrated network cancer programs (48.8%), and community cancer programs (41.1%). In our patient cocohort, patients treated at an academic/research center had slightly decreased 10-year OS rates compared with those patients treated at a comprehensive community cancer program, although the median OS for the academic/research centers were still the highest of all treatment facilities.
Treatment options varied significantly by facility, and the number of patients treated surgically followed a similar trend, with 92% undergoing surgery as the primary treatment at academic or research programs compared with 89% at comprehensive cancer programs and 82.7% at community cancer programs (data not shown). Another potential explaination for differing OS outcomes across facilities is the surgical margin outcome. Surgeries performed at community cancer programs or comprehensive cancer programs resulted with no residual tumor in 36% and 40% of cases, respectively, whereas cases performed at academic or research programs resulted with no residual tumor in 47% of cases (data not shown). Regardless, multivariate analysis demonstrated a marked decrease in the chance of mortality when comparing treatment received at academic facility centers with that received at comprehensive cancer centers (22.9%) and community cancer centers (38.3%) (data not shown).
A recent study demonstrated improved outcomes for patients with retroperitoneal or extremity STS treated at high-volume treatment centers.18 Patients treated at high-volume centers were found to have an 8% decreased risk of death compared with patients treated at low-volume centers. Notably, they found highvolume academic centers demonstrated the strongest improvement in survival, while highvolume community centers showed decreased survival.18 Similarly, we found that patients treated at academic/research institutions had improved 5-year OS and greater median OS than did patients treated at community cancer programs or comprehensive community cancer programs.
The top 2 income quartiles (≥ $48,000) combined to demonstrate the longest median, 5-year, and 10-year OS and were fairly similar between the quartiles. Patients living in zip codes with a median income of $38,000 to $47,999 had the worst 5-year OS and median OS. The log-rank analysis showed statistical evidence of differences in survival associated with income, but within the context of the multivariable analysis, there was no remaining evidence of a difference.
The longest 5-year OS outcomes were seen in patients living in zip codes with the highest level of education (55.3%). However, the difference in OS was not statistically significant using either the log-rank analysis or multivariate analysis.
Limitations
This study has certain inherent limitations in using a retrospective design and a large database such as the NCDB. Many different pathologists at CoC-accredited cancer programs perform the pathology that contributes to the data in the NCDB. There was no pathological review of these findings, which could potentially introduce error into the findings of this study. With the NCDB, potential selection bias is possible because patients in the database are added only from CoC-accredited cancer programs. This risk is minimized because NCDB contains data on most newly diagnosed cancer patients in the US. Further potential risks, which are unable to be controlled for, include potential interobserver error and data that may be incompletely, improperly, or inaccurately recorded from the patients’ charts. Without patient-specific information regarding income and education, it is challenging to utilize zip codes to estimate socioeconomic status and educational level. Even though a patient may live in a zip code identified with specific economic and educational characteristics, that patient may not share those characteristics. Furthermore, patients with Medicare tend to be older than patients with other forms of insurance, which limits the significance of comparisons across insurance groups. A future SEER (Surveillance, Epidemiology, and End Results) program study to confirm this study’s results and the effects of socioeconomic variables on DDLPS would be an excellent followup study.
Conclusion
This study used a large cohort of patients with DDLPS to study the effects of treatment facility, insurance status, and socioeconomic variables on survival outcomes. Although insurance status, median household income, and treatment facility were associated with differences in median OS and 5- and 10-year OS probabilities, evidence for a difference remained for only insurance status and facility type within the context of a multivariable analysis irrespective of age, race, sex, insurance status, education, and median income. Patients with private insurance and Medicaid had a decreased risk of mortality compared with other government insurance and no insurance. Patients receiving treatment at academic research programs had the highest median and 5-year OS of 66.6 months and 52.6%, respectively. Patients receiving treatment at academic centers had improved survival outcomes with a decrease in mortality of 23% and 38% compared to comprehensive or community cancer programs.
1. Dodd LG. Update on liposarcoma: a review for cytopathologists. Diagn Cytopathol. 2012;40(12):1122-1131.
2. Mangham D. World Health Organisation classification of tumours: pathology and genetics of tumours of soft tissue and bone. J Bone Joint Surg Am. 2004;86(3):466.
3. Dalal KM, Kattan MW, Antonescu CR, Brennan MF, Singer S. Subtype specific prognostic nomogram for patients with primary liposarcoma of the retroperitoneum, extremity, or trunk. Ann Surg. 2006;244(3):381-391.
4. Coindre JM, Pédeutour F, Aurias A. Well-differentiated and dedifferentiated liposarcomas. Virchows Arch. 2010;456(2):167-179.
5. Evans HL. Liposarcoma: a study of 55 cases with a reassessment of its classification. Am J Surg Pathol. 1979;3(6):507-523.
6. Henricks WH, Chu YC, Goldblum JR, Weiss SW. Dedifferentiated liposarcoma: a clinicopathological analysis of 155 cases with a proposal for an expanded definition of dedifferentiation. Am J Surg Pathol. 1997;21(3):271-281.
7. Ward E, Jemal A, Cokkinides V, et al. Cancer disparities by race/ethnicity and socioeconomic status. CA Cancer J Clin. 2004;54(2):78-93.
8. Halpern MT, Ward EM, Pavluck AL, Schrag NM, Bian J, Chen AY. Association of insurance status and ethnicity with cancer stage at diagnosis for 12 cancer sites: a retrospective analysis. Lancet Oncol. 2008;9(3):222-231.
9. Niu X, Roche LM, Pawlish KS, Henry KA. Cancer survival disparities by health insurance status. Cancer Med. 2013;2(3):403-411.
10. Hauser A, Dutta SW, Showalter TN, Sheehan JP, Grover S, Trifiletti DM. Impact of academic facility type and volume on post-surgical outcomes following diagnosis of glioblastoma. J Clin Neurosci. 2018;47:103-110.
11. Chu Q, Medeiros K, Zhou M, et al. Effect of facility type on outcome following pancreatectomy for pancreatic adenocarcinoma: analysis of the National Cancer Data Base [Abstract FP26-02]. HPB (Oxford). 2016;18(suppl 1):E81-E82.
12. Rubin SJ, Cohen MB, Kirke DN, Qureshi MM, Truong MT, Jalisi S. Comparison of facility type outcomes for oral cavity cancer: analysis of the National Cancer Database. Laryngoscope. 2017;127(11):2551-2557.
13. Lahat G, Anaya DA, Wang X, Tuvin D, Lev D, Pollock RE. Resectable well-differentiated versus dedifferentiated liposarcomas: two different diseases possibly requiring different treatment approaches. Ann Surg Oncol. 2008;15(6):1585-1593.
14. Livingston JA, Bugano D, Barbo A, et al. Role of chemotherapy in dedifferentiated liposarcoma of the retroperitoneum: defining the benefit and challenges of the standard. Sci Rep. 2017;7(1):11836.
15. Brennan MF, Antonescu CR, Alektiar KM, Maki RG. Management of Soft Tissue Sarcoma. 2nd ed. New York, NY: Springer; 2016.
16. Goldblum JR, Folpe AL, Weiss SW. Enzinger and Weiss’s Soft Tissue Tumors. 6th ed. Philadelphia, PA: Saunders; 2014.
17. White A, Djenaba J, Rim SH, Johnson CJ, Coleman MP, Allemani C. Colon cancer survival in the United States by race and stage (2001‐2009): findings from the CONCORD‐2 study. Cancer. 2017;123 (suppl 24):5014-5036.
18. Murphy JD, Padwal J, Guss ZD, Okamoto K, Sardar R. Impact of hospital volume on patterns of care and outcomes in soft tissue sarcoma [ASCO Abstract e23550]. J Clin Oncol. 2018;36(suppl 15):e23550
Approximately 17% to 25% of all softtissue sarcomas (STS) are liposarcomas, making liposarcoma the most common type of STS.1 The 2013 World Health Organization (WHO) classification separates liposarcoma into 4 histologic subtypes: atypical lipomatous tumor/well-differentiated (ALT/ WDLPS), dedifferentiated (DDLPS), myxoid, and pleomorphic.2 Each subtype has unique histology, morphology, and natural history. WDLPS and DDLPS are the most common histologic subtypes, comprising approximately 50% of all sarcomas that arise in the retroperitoneum.3 DDLPS represents 18% of all liposarcomas, making it the second most common subtype of liposarcoma.4
In 1979, DDLPS was first characterized.5 Most (90%) cases of DDLPS present de novo, whereas the other 10% transform from preexisting low-grade WDLPS.2 DDLPSs are formed by an amplification of 12q14-15 involving the MDM2 gene.4 These malignancies most commonly present in the retroperitoneum as a large painless mass, consisting of both fatty and nonfatty components.2 Primary site has been previously reported as a major prognostic factor for DDLPSs, with retroperitoneal DDLPSs demonstrating the worst prognosis.6 DDLPSs have a high risk of local recurrence, with some reports estimating recurrence rates approaching 40%.2 Overall mortality at 5 years for DDLPS is estimated to be between 30% and 40%.4
Previous literature has determined that median income, race, health insurance, and facility type are related to survival outcomes for patients with DDLPS.7-9 When comparing the most common types of cancers, residents of poorer US counties consistently had a higher risk of mortality than residents in affluent US counties, and all racial minorities showed worse survival outcomes when compared with white patients.7 Differences in survival outcomes have been reported in patients attending different treatment facilities for other cancers including pancreatic cancers, glioblastomas, and oral cancers, with multiple studies concluding that academic and research programs are associated with the longest survival outcomes.10-12 For many cancers, insurance status has been shown to be a significant prognostic factor, with private insurance typically resulting in the best prognosis.8,9
The goal of this retrospective study was to assess the prognostic effects of socioeconomic variables on the overall survival (OS) probabilities in a large cohort of DDLPS patients in order to inform clinicians about a potentially at-risk population.
Method
The National Cancer Database (NCDB) was created by the Commission on Cancer (CoC) of the American College of Surgeons and the American Cancer Society. The NCDB is the largest cancer database in the US and includes data on almost 70% of US patients with cancer. CoC-accredited cancer programs add data on patients with cancer to the NCDB. The authors accessed the NCDB data through the use of the NCDB Participant Use File program.
Patients’ data from 2004 through 2015 were abstracted. Only patients with the International Classification of Diseases for Oncology histology code 8858, corresponding to DDLPS, were analyzed. Patients with other comorbid malignant tumors were excluded to accurately capture the true survival rates for DDLPS. Variables analyzed included age, sex, race, insurance status, treatment facility type, median household income by zip code, and percentage of adults in the patient’s zip code with no high school (HS) education.
Median survival, 5- and 10-year OS probabilities, and Kaplan-Meier survival curves were calculated for multiple variables, specifically race, insurance status, treatment facility type, median family income, and percentage of adults without a HS degree. Both 5- and 10-year OS probabilities were determined by race with the patients separated into white, African American, Asian, American Indian/Alaska Native (AI/AN), and Asian Indian or Pakistani groups. Our study categorized Chinese, Japanese, Filipino, Hmong, Korean, Vietnamese, Thai, Guamanian, Asian not otherwise specified, and other Asian ethnicity patients together into one collective Asian group. Insurance status was classified into Medicare, Medicaid, other government insurance, and private insurance groups. Other government insurance consisted of US Department of Veterans Affairs, Indian Health Service, Public Health Service, and other government health care programs. Further analysis could not be performed into the distribution of the other government insurance variable.
Facility types were divided into 4 groups: community, comprehensive community, academic/ research, and integrated network cancer treatment facilities. Median income quartiles and the percentage of adults with no high school degree were estimated by comparison of the patient’s zip code with US Census Bureau data. Median household income was separated into 4 groups, including lowest level of household income (< $38,000), low level of household income ($38,000 to $47,999), moderate level of household income ($48,000 to $62,999), and highest level of household income (≥ $63,000). The percentages of adults with no high school degree were divided into 4 groups: lowest level of HS education (≥ 21% ), low level of HS education (13.0% to 20.9%), moderate level of HS education (7.0% to 12.9%), and highest level of HS education (≤ 7%). The 5- and 10-year survival probabilities were calculated using the number of months between the date of diagnosis and the date of death or last known contact.
Continuous variables are presented as median and interquartile range (IQR) whereas categorical variables are presented as frequencies and proportion. IBM SPSS version 25.0 was used to produce Kaplan-Meier survival curves and descriptive statistics. This study used Kaplan- Meier survival tables and log-rank tests to analyze both the 5- and 10-year OS rates for the 5 variables listed above. This study also used a multivariable Cox regression model that accommodated the correlative nature of outcomes within facilities to study the association of the treatment facility type and other socioeconomic factors, while controlling for age, race (which was collapsed into 3 categories), sex, primary site, tumor stage, and treatment approaches. The proportional hazards assumption was individually checked for all pertinent variables. Any patient records that were missing data were excluded from the multivariable Cox regression model, which was analyzed with SAS version 9.4 (Cary, NC). P < 0.05 was used to indicate statistical significance for all analyses.
Results
Table 1 provides descriptive analysis for demographic characteristics of the 3573 patients including age, sex, and race. The median age at diagnosis was 64 years. There were 1073 more men (65%) than women (35%) in this analysis. Whites were the predominant racial category, comprising 87.7% of the patient population, followed by African Americans (6.5%) and Asians (2.5%).
Socioeconomic Variables
The largest proportion of the patient population (45.5%) had private insurance (Table 2). Medicare came in a close second covering almost 42.2% of the population, followed by Medicaid (5.0%), uninsured (2.8%), and other government insurance (1.5%). About half (53.7%) of the patients were treated at academic or research facilities, while the fewest number of patients (5.2%) underwent treatment at community cancer facilities. The largest percentage (36.6%) of patients lived in zip codes with the highest level of median household income, while 26.0% and 22.3% had moderate and low levels of income, respectively. About 14% of patients lived within an area of the lowest level of income. Similarly, almost 15% of patients lived in an area of lowest level of HS education. The greatest percentage of the patient population (34.5%) lived in a zip code with moderate level of HS education. Surgery was the most common treatment modality with 90.8% of the cohort undergoing surgery, while 35.4% and 16.5% were treated with radiation and chemotherapy, respectively (some patients received more than one type of treatment modality).
Survival Data
Survival data were available for 3112 patients. Kaplan-Meier survival curves were used to analyze OS according to insurance status, racial background, treatment facility type, median family income, and percentage of adults with no high school education. Overall 5- and 10- year OS probabilities were 51.5% and 34.8%, respectively, while the median OS (SD) was 63.57 (2.8) months (Table 3).
Private insurance showed significantly higher 5- and 10-year OS probabilities and median OS: 5-year OS was 61.2%, 10-year OS was 47.2%, and median survival (SD) was 101.2 (8.2) months compared with that of all other insurance groups (Medicare, Medicaid, other government insurance, and uninsured) (Figure 1). These other insurance types were fairly similar in their 5-year and median OS, but surprisingly, patients with no insurance had the second longest 10-year OS. The difference between the 5-year OS probabilities of private insurance compared with an average of the other insurances was 15.1%, which had almost doubled to 28.5% at 10 years, with a median OS difference of almost 5 years (56 months; data not shown).
Using the Kaplan-Meier survival curve, Asian Indians had the longest 5-year OS probability of 77.9% and African Americans had the longest 10-year OS probability of 40.6%. However, Asians as a group demonstrated the longest median (SD) OS outcome with 119.8 (47.8) months (Figure 2).
Overall, academic/research programs had the longest median OS and 5-year OS probability (SD) of 66.6 (4.5) months and 52.6%, respectively (Figure 3). Comprehensive community cancer programs and integrated network cancer programs had nearly identical 10-year OS rates (35.2% vs 35.1%, respectively). Community cancer programs had the worst 5- and 10-year OS probabilities (41.1% and 21.8%, respectively).
The top 2 income quartiles combined to demonstrate the longest median, 5-year, and 10-year OS probabilities and were very similar. Patients living in a zip code with the highest income level had the longest 5-year OS rates of 54.3%, while patients living in zip codes with a moderate income level had the longest 10-year OS at 39.3% and the longest median OS of about 71 months. Patients with the lowest level of median household income had the worst 5-year OS rates (48.3%) and a median (SD) OS of 53.4 (5.4) months (Figure 4).
A Kaplan-Meier curve for percentage of adults without a HS degree is displayed in Figure 5. Zip codes with the highest level of education had the longest 5-year OS rates and median (SD) OS of 55.3% and 70.9 (4.8) months, respectively. The longest 10-year OS outcomes at 38.1% were found in patients who lived in areas of low-education levels. The worst 5- and 10- year OS outcomes and median OS were found in the least educated zip codes.
Results from the Cox regression model of OS are displayed in Table 4. Race and ethnicity, zip code-level median household income, and zip code-level education were not associated with OS. Patients with no insurance had an increased risk of death (hazard ratio [HR], 1.84; 95% CI, 1.17-2.88; P < .01) when compared with patients with private insurance. Patients with other government insurance also had an increased risk of death (HR, 2.12; 95% CI, 1.27-3.54; P < .01) when compared with patients with private insurance while controlling for all other variables. Patients with Medicare had a decreased risk of death when compared with patients with other government insurance and no insurance (HR, 0.53; 95% CI, 0.31-0.92; P = .02 and HR, 0.62; 95% CI, 0.38-0.99; P = .05, respectively). Patients treated at academic centers had better OS when compared with patients treated at comprehensive treatment centers (HR, 0.77; 95% CI, 0.65-0.92;P < .01) and community treatment centers (HR, 0.62; 95% CI, 0.44-0.86; P < .01).
Discussion
This study is the largest study to date that specifically studies the type of treatment facilities and socioeconomic factors, including insurance status, race, income, and education, and how they affect survival of DDLPS. The overall 5- and 10-year OS probabilities for DDLPS in this study were 51.5% and 34.8%, respectively, with median OS of 63.6 months. These results were more encouraging than previous reports, which found a 5-year survival probability of 36.5% and a median OS of 45 months.13,14
The largest age grouping was aged 61 to 80 years (48.9% of the cohort), and the median age at diagnosis was 64 years. DDLPSs most typically present between the ages of 50 and 70 years.15 Our cohort was 65% male. Previous studies have indicated that DDLPSs affect the sexes equally; however, another study showed a similar male predominance (68.8%) at the MD Anderson Cancer Center in Houston, Texas.13,16
In our study, approximately 88% of patients were white, 6.5% were African American, and 2.5% were Asian, which differed from a previous study of 84 patients that had a 78.6% white, 4.8% Asian, and 1.2% African American patient population.14
Asian Indian or Pakistani patients had the best 5-year OS probability at 77.9%, followed by African American (57.2%), Asian (51.6%), AI/AN (51.4%), and white patients (50.9%). This trend had disappeared by 10 years and Asian, AI/AN, African American, and Asian Indian or Pakistani groups all demonstrated longer median OS than did white patients. In fact, Asian patients had the longest median OS at 119.8 months, which was almost double that of white patients with the lowest median OS of 61.2 months. This finding is contrary to previous studies, which reported that racial minorities typically had worse OS outcomes when compared with white patients in different types of cancer.7,17 Notably, these findings were not statistically significant in our current study in the log-rank or multivariable analyses.
Private insurance was the most common form of insurance followed in decreasing order by Medicare, Medicaid, uninsured, and other government insurance. About 42% of the cohort had Medicare, which is a federally funded US insurance program designated for patients aged ≥ 65 years and certain younger patients with disabilities.
Patients with private insurance demonstrated the longest OS, essentially twice the median OS of all other insured groups at 101 months. Medicare had the worst 5-year OS probability and median OS of all groups. A previous study of 77 patients with DDLPS reported that patients aged > 65 years had reduced OS.13 Medicare patients in this study were older, with a mean and median age at DDLPS diagnosis of 71 and 72 years, respectively, while private insurance had a mean and median age at diagnosis of 56 and 57 years, respectively. Medicare inherently covers older patients and this age difference could account for the decrease in overall survival.
Improved OS for privately insured patients was most notable compared with the uninsured or patients with other government insurance. Uninsured patients had an 83.7% increased risk of mortality when compared with patients with private insurance. When compared with patients with private insurance, patients with other government insurance had an 111.5% increased risk of mortality. Comparing patients with Medicare vs patients with no insurance or other government insurance, there was a decreased risk of mortality of 38.5% and 46.6%, respectively. This decreased OS in patients with other government insurance could be related to the choice of treatment facility, because only 31% of the patients with other government insurance went to academic or research centers when compared with the 58.4% and 50.8% of patients with private and Medicare insurance treated there (data not shown). Such centers often have access to more advanced technology and protocols that may not be available at other treatment facilities.
A little more than half of the patients in the cohort went to an academic or research center for treatment (53.7%); comprehensive community cancer programs were the second most common treatment facility at 28%. Patients treated at academic or research centers demonstrated the best outcomes with a 5-year OS of 52.6%, followed in decreasing order by comprehensive community cancer programs (49.7%), integrated network cancer programs (48.8%), and community cancer programs (41.1%). In our patient cocohort, patients treated at an academic/research center had slightly decreased 10-year OS rates compared with those patients treated at a comprehensive community cancer program, although the median OS for the academic/research centers were still the highest of all treatment facilities.
Treatment options varied significantly by facility, and the number of patients treated surgically followed a similar trend, with 92% undergoing surgery as the primary treatment at academic or research programs compared with 89% at comprehensive cancer programs and 82.7% at community cancer programs (data not shown). Another potential explaination for differing OS outcomes across facilities is the surgical margin outcome. Surgeries performed at community cancer programs or comprehensive cancer programs resulted with no residual tumor in 36% and 40% of cases, respectively, whereas cases performed at academic or research programs resulted with no residual tumor in 47% of cases (data not shown). Regardless, multivariate analysis demonstrated a marked decrease in the chance of mortality when comparing treatment received at academic facility centers with that received at comprehensive cancer centers (22.9%) and community cancer centers (38.3%) (data not shown).
A recent study demonstrated improved outcomes for patients with retroperitoneal or extremity STS treated at high-volume treatment centers.18 Patients treated at high-volume centers were found to have an 8% decreased risk of death compared with patients treated at low-volume centers. Notably, they found highvolume academic centers demonstrated the strongest improvement in survival, while highvolume community centers showed decreased survival.18 Similarly, we found that patients treated at academic/research institutions had improved 5-year OS and greater median OS than did patients treated at community cancer programs or comprehensive community cancer programs.
The top 2 income quartiles (≥ $48,000) combined to demonstrate the longest median, 5-year, and 10-year OS and were fairly similar between the quartiles. Patients living in zip codes with a median income of $38,000 to $47,999 had the worst 5-year OS and median OS. The log-rank analysis showed statistical evidence of differences in survival associated with income, but within the context of the multivariable analysis, there was no remaining evidence of a difference.
The longest 5-year OS outcomes were seen in patients living in zip codes with the highest level of education (55.3%). However, the difference in OS was not statistically significant using either the log-rank analysis or multivariate analysis.
Limitations
This study has certain inherent limitations in using a retrospective design and a large database such as the NCDB. Many different pathologists at CoC-accredited cancer programs perform the pathology that contributes to the data in the NCDB. There was no pathological review of these findings, which could potentially introduce error into the findings of this study. With the NCDB, potential selection bias is possible because patients in the database are added only from CoC-accredited cancer programs. This risk is minimized because NCDB contains data on most newly diagnosed cancer patients in the US. Further potential risks, which are unable to be controlled for, include potential interobserver error and data that may be incompletely, improperly, or inaccurately recorded from the patients’ charts. Without patient-specific information regarding income and education, it is challenging to utilize zip codes to estimate socioeconomic status and educational level. Even though a patient may live in a zip code identified with specific economic and educational characteristics, that patient may not share those characteristics. Furthermore, patients with Medicare tend to be older than patients with other forms of insurance, which limits the significance of comparisons across insurance groups. A future SEER (Surveillance, Epidemiology, and End Results) program study to confirm this study’s results and the effects of socioeconomic variables on DDLPS would be an excellent followup study.
Conclusion
This study used a large cohort of patients with DDLPS to study the effects of treatment facility, insurance status, and socioeconomic variables on survival outcomes. Although insurance status, median household income, and treatment facility were associated with differences in median OS and 5- and 10-year OS probabilities, evidence for a difference remained for only insurance status and facility type within the context of a multivariable analysis irrespective of age, race, sex, insurance status, education, and median income. Patients with private insurance and Medicaid had a decreased risk of mortality compared with other government insurance and no insurance. Patients receiving treatment at academic research programs had the highest median and 5-year OS of 66.6 months and 52.6%, respectively. Patients receiving treatment at academic centers had improved survival outcomes with a decrease in mortality of 23% and 38% compared to comprehensive or community cancer programs.
1. Dodd LG. Update on liposarcoma: a review for cytopathologists. Diagn Cytopathol. 2012;40(12):1122-1131.
2. Mangham D. World Health Organisation classification of tumours: pathology and genetics of tumours of soft tissue and bone. J Bone Joint Surg Am. 2004;86(3):466.
3. Dalal KM, Kattan MW, Antonescu CR, Brennan MF, Singer S. Subtype specific prognostic nomogram for patients with primary liposarcoma of the retroperitoneum, extremity, or trunk. Ann Surg. 2006;244(3):381-391.
4. Coindre JM, Pédeutour F, Aurias A. Well-differentiated and dedifferentiated liposarcomas. Virchows Arch. 2010;456(2):167-179.
5. Evans HL. Liposarcoma: a study of 55 cases with a reassessment of its classification. Am J Surg Pathol. 1979;3(6):507-523.
6. Henricks WH, Chu YC, Goldblum JR, Weiss SW. Dedifferentiated liposarcoma: a clinicopathological analysis of 155 cases with a proposal for an expanded definition of dedifferentiation. Am J Surg Pathol. 1997;21(3):271-281.
7. Ward E, Jemal A, Cokkinides V, et al. Cancer disparities by race/ethnicity and socioeconomic status. CA Cancer J Clin. 2004;54(2):78-93.
8. Halpern MT, Ward EM, Pavluck AL, Schrag NM, Bian J, Chen AY. Association of insurance status and ethnicity with cancer stage at diagnosis for 12 cancer sites: a retrospective analysis. Lancet Oncol. 2008;9(3):222-231.
9. Niu X, Roche LM, Pawlish KS, Henry KA. Cancer survival disparities by health insurance status. Cancer Med. 2013;2(3):403-411.
10. Hauser A, Dutta SW, Showalter TN, Sheehan JP, Grover S, Trifiletti DM. Impact of academic facility type and volume on post-surgical outcomes following diagnosis of glioblastoma. J Clin Neurosci. 2018;47:103-110.
11. Chu Q, Medeiros K, Zhou M, et al. Effect of facility type on outcome following pancreatectomy for pancreatic adenocarcinoma: analysis of the National Cancer Data Base [Abstract FP26-02]. HPB (Oxford). 2016;18(suppl 1):E81-E82.
12. Rubin SJ, Cohen MB, Kirke DN, Qureshi MM, Truong MT, Jalisi S. Comparison of facility type outcomes for oral cavity cancer: analysis of the National Cancer Database. Laryngoscope. 2017;127(11):2551-2557.
13. Lahat G, Anaya DA, Wang X, Tuvin D, Lev D, Pollock RE. Resectable well-differentiated versus dedifferentiated liposarcomas: two different diseases possibly requiring different treatment approaches. Ann Surg Oncol. 2008;15(6):1585-1593.
14. Livingston JA, Bugano D, Barbo A, et al. Role of chemotherapy in dedifferentiated liposarcoma of the retroperitoneum: defining the benefit and challenges of the standard. Sci Rep. 2017;7(1):11836.
15. Brennan MF, Antonescu CR, Alektiar KM, Maki RG. Management of Soft Tissue Sarcoma. 2nd ed. New York, NY: Springer; 2016.
16. Goldblum JR, Folpe AL, Weiss SW. Enzinger and Weiss’s Soft Tissue Tumors. 6th ed. Philadelphia, PA: Saunders; 2014.
17. White A, Djenaba J, Rim SH, Johnson CJ, Coleman MP, Allemani C. Colon cancer survival in the United States by race and stage (2001‐2009): findings from the CONCORD‐2 study. Cancer. 2017;123 (suppl 24):5014-5036.
18. Murphy JD, Padwal J, Guss ZD, Okamoto K, Sardar R. Impact of hospital volume on patterns of care and outcomes in soft tissue sarcoma [ASCO Abstract e23550]. J Clin Oncol. 2018;36(suppl 15):e23550