User login
Orthopedic Implant Waste: Analysis and Quantification
The cost of health care in the United States is increasing at an unsustainable rate.1-3 To decrease or even reverse this trend, we must decrease the cost of care without adversely affecting quality. Porter4 defined value as the quality of care divided by its cost. The economics of total joint arthroplasty (TJA) has received a great deal of attention because of both increasing demand and increasing cost.5-9 About 33% of all orthopedic surgeries and the majority of TJAs are paid for by Medicare.9 In recent years, the rate of reimbursement for orthopedic cases has steadily declined while the cost of implants has increased.3,10,11 Given the significant cost of implants, health care providers in some subspecialties have focused on implant costs as a potential area for cost reduction.12 For example, in TJA this has proved effective in reducing the overall cost, as has decreasing length of stay after surgery.8,10,13-16
With little evidence suggesting any specific orthopedic implant has outcomes superior to those of others, with the exception of select poorly performing outliers, we must increase value of care by lowering the cost when considering these devices.17,18 In addition, some experts have suggested that intraoperative waste is a significant factor in TJA cost, and it does contribute to the average implant cost for a TJA case.6,19 Using data collected from 72 institutions, Zywiel and colleagues19 estimated the annual cost of wasted hip and knee arthroplasty implants to be more than $36 million in the United States.
However, considering the aging US population, TJA is not the only orthopedic surgery with increased demand. An estimated 600,000 spine surgeries are performed each year in the United States.20 Between 1992 and 2003, Medicare spending for lumbar spinal fusion increased 500%.21 In addition, in a 15-month observational study of incidence of intraoperative waste in spine surgery, Soroceanu and colleagues22 reported waste occurring in 20% of spine procedures.
Although these studies have described implant waste in TJA and spine surgeries, little has been published on the cost of wasted implants in a center performing the full range of orthopedic procedures. In this article, we detail the implant waste costs incurred by surgeons for all orthopedic subspecialties at a single orthopedic specialty hospital over a 1-year period. Our study goals were to identify types of implants wasted, and incidence and cost of implant waste, for all total hip arthroplasties (THAs), total knee arthroplasties (TKAs), and lumbar spinal fusions performed at the hospital and to determine whether case volume or years in surgical practice affect the rate or cost of implants wasted.
Methods
We performed a retrospective economic analysis of 1 year of administrative implant data from our institution. Collected data were quantified and analyzed for factors that might explain any variance in implant waste among surgeons. We were granted exempt institutional review board status, as no patient information was involved in this study.
We reviewed the administrative implant data for the 12-month period beginning June 2012 and ending May 2013. For that period, number of cases in which an implant was used and number of cases in which an implant was wasted were recorded. For each instance of waste, type and cost of the wasted implant were entered into the administrative database. In addition, overall cost of implants for the year and cost of wasted implants were determined. Data were available for 81 surgeons across 8 orthopedic divisions (subspecialties). From this information, we determined percentage of cases in which waste occurred, percentage of total implant cost wasted, average cost of waste per case, and most commonly wasted implants. All 3 variables were also calculated for THAs, TKAs, and lumbar spinal fusion procedures.
Statistical Analysis
The data were analyzed to determine if surgeon case volume or years in surgical practice affected implant waste. All analyses were performed at department, division (subspecialty), and surgeon levels. Case volume was analyzed in 3 groups: top 25%, middle 50%, and lower 25%. Number of years in surgical practice was analyzed in 3 groups: fewer than 10 years, 10 to 19 years, and 20 years or more. Normality assumption of variables was tested using the Shapiro-Wilk test (P < .05). For between-group differences, 1-way analysis of variance and the Tukey honestly significant difference post hoc test were performed for variables with a normal distribution, and the Kruskal-Wallis and Mann-Whitney tests were performed for variables without a normal distribution.
For the subspecialty-level analyses, only the Adult Reconstruction, Sports Medicine, and Spine divisions were analyzed for the effects of volume, and only the Sports Medicine and Spine divisions were analyzed for the effect of surgical experience, as surgeon numbers were insufficient for adequate grouping(s).
Data are presented as means with corresponding 95% confidence intervals (CIs). Categorical variables are presented as counts with percentages. All statistical analyses were performed with SPSS Version 21.0 (IBM SPSS) statistical software. Statistical significance was set at .05.
Results
During the 1-year period, 8954 department cases involved an implant of any type. Waste occurred in 12% (1072) of these cases. The rate ranged from 8% in the Adult Reconstruction division to 30% in the Trauma division (Table 1), and the rate for individual surgeons ranged from 3% to 100%, though the surgeon with 100% performed only 1 case, and the next highest rate was 50%.
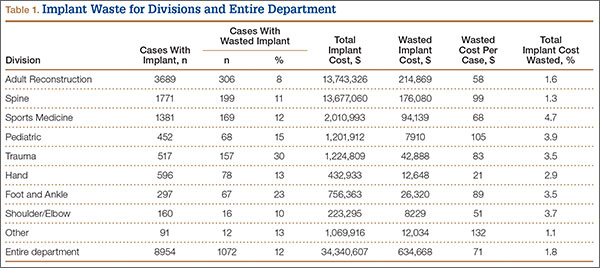
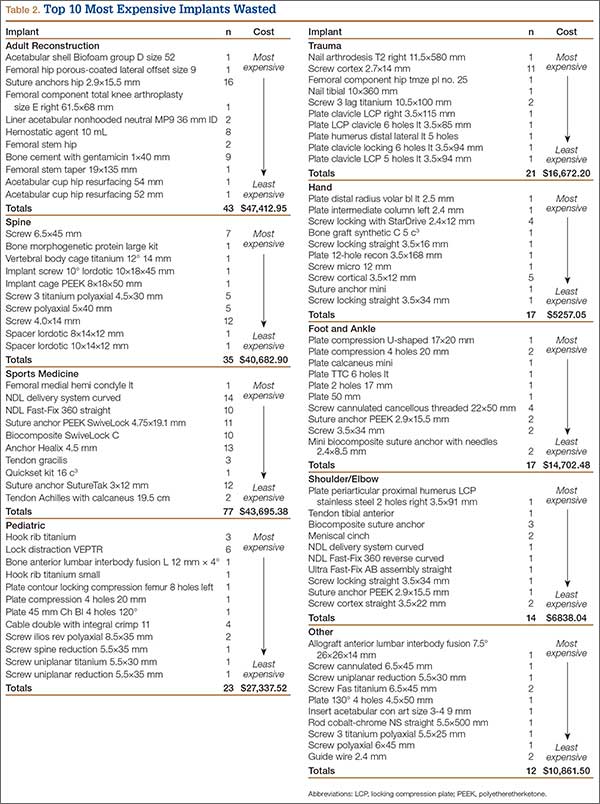
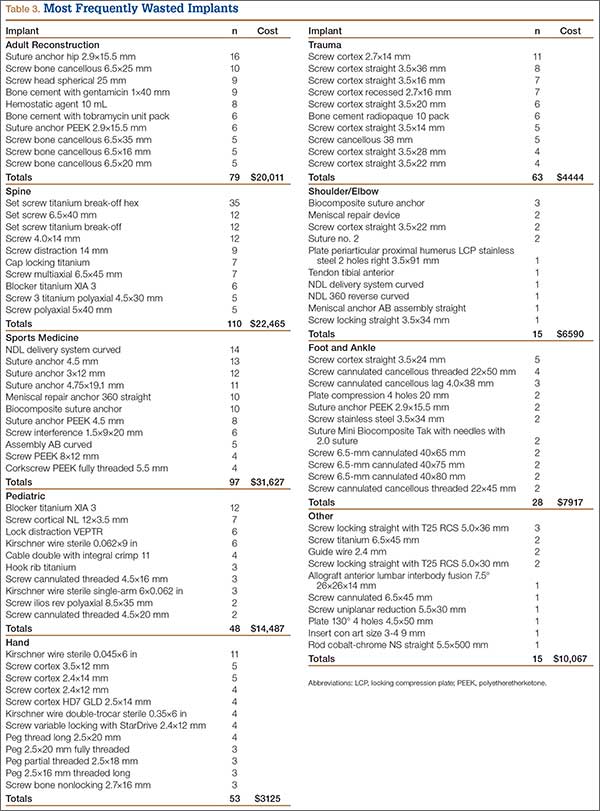
Total implant cost for our hospital during the period was $34,340,607. Of that total cost, 1.8% ($634,668) was lost because of implant waste. Percentage of total implant cost wasted ranged from 1.6% in the Adult Reconstruction division to 4.7% in the Sports Medicine division (Table 1). Percentage of total implant cost wasted for individual surgeons ranged from 0.2% to 16.1%. Tables 2 and 3 list the most commonly wasted implants by count and cost, respectively.
When total cost of wasted implants was averaged over all implant cases performed during the period, the loss resulting from waste amounted to $71 per case for the department and ranged from $21 per case for the Hand division to $105 per case for the Pediatric division (Table 1). For individual surgeons, the loss ranged from $4 to $250 per case.
During the period studied, an implant was wasted in 9% (100) of the 1076 primary THAs performed, 4% (42) of the 1003 primary TKAs, and 14% (30) of the 217 lumbar spinal fusions (Tables 4, 5).
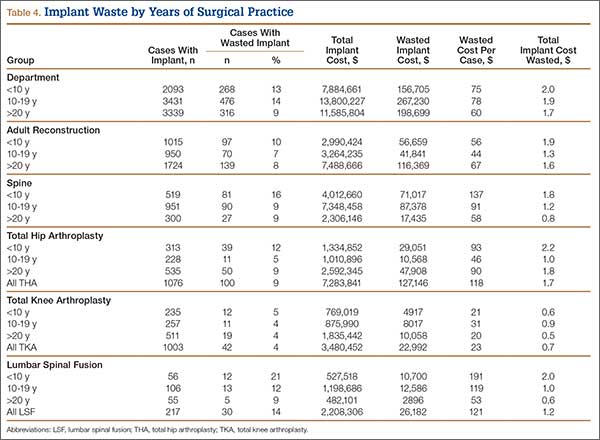
There was no significant difference between groups for department (P = .46) or for the Adult Reconstruction (P = .83), Spine (P = .10), or Sports Medicine (P = .69) division. Analyzing for variance by years in surgical practice, we found a significant difference for department (P = .01) but not for the Adult Reconstruction (P = .12) or Spine (P = .14) division. The department difference resulted from a significant difference (P = .001; 95% CI, 1.112-17.408) between surgeons (<10 years of surgical practice) who wasted implants in 12.8% of their cases and surgeons (>20 years of surgical practice) who wasted implants in 9% of their cases (Table 4).
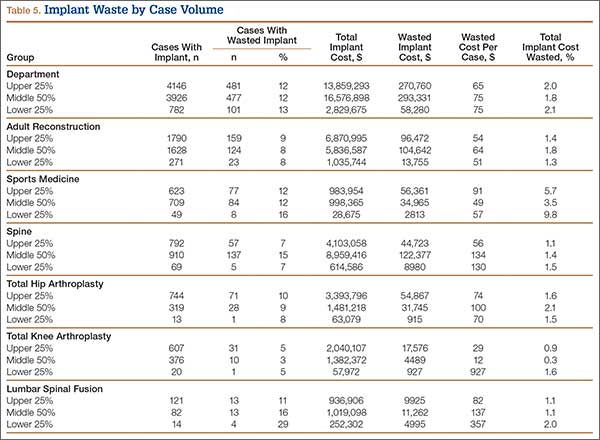
There was no significant difference between groups for department (P = .83) or for the Adult Reconstruction (P = .29) or Spine (P = .41) division when analyzed by years in surgical practice. Analyzing by case volume, we found a significant difference for the Sports Medicine division (P = .004): Percentage of total implant waste was significantly higher (P = .003; 95% CI, –12.61 to –2.97) for surgeons with the lower 25% of case volume (9.8%) than for surgeons with the middle 50% of case volume (3.5%) (Table 5). No other significant difference was found for department (P = .52) or for the Adult Reconstruction (P = .69) or Spine (P = .45) division.
Analyzing by case volume and years in surgical practice, we found no significant difference for department (case volume, P = .76; years in surgical practice, P = .07), Adult Reconstruction division (case volume, P = .47; years in surgical practice, P = .78), Spine division (case volume, P = .11; years in surgical practice, P = .15), or Sports Medicine division (case volume, P = .08).
Selected Procedures
Total Hip Arthroplasty. Regarding variance by case volume and years in surgical practice, we found no significant difference for any variable analyzed: percentage of cases with waste (volume, P = .072; years in practice, P = .076), percentage of total implant cost wasted (volume, P = .074; years in practice, P = .12), cost of waste per case (volume, P = .075; years in practice, P = .32).
Total Knee Arthroplasty. Regarding variance by years in surgical practice, we found no significant difference for any variable analyzed: percentage of cases with waste (P = .38), percentage of total implant cost wasted (P = .50), cost of waste per case (P = .50). Regarding variance by volume, there was no significant difference for percentage of cases with waste (P = .70) or cost of waste per case (P = .05), but we found a significant difference for percentage of total implant cost wasted (P = .038). That difference was caused by an outlier: One surgeon with the lower 25% of case volume wasted an implant in the only TKA he performed that year. Correction for the outlier removed the significance.
Posterior Lumbar Spinal Fusion. Regarding variance by case volume and years in surgical practice, we found no significant difference for any variable analyzed: percentage of cases with waste (volume, P = .36; years in surgical practice, P = .22), percentage of total implant cost wasted (volume, P = .33; years in surgical practice, P = .41), cost of waste per case (volume, P = .34; years in practice, P = .15).
Discussion
The steadily increasing demand for orthopedic surgeries and declining rates of reimbursement by Medicare and other insurance providers have led many hospitals to look for ways to control the cost of these surgeries. Reducing operating room costs, lowering implant prices, and shortening hospital stays have all proved successful.6,15,20,23 One area that has not been thoroughly explored is the cost burden of wasted implants. Our findings suggest implant waste contributes significantly to the cost of orthopedic surgeries.
One weakness of this study is that its data, though encompassing all orthopedic subspecialties and procedures, come from a single teaching institution and therefore are less representative of all orthopedic departments across the United States. However, the findings are useful in that the analysis was performed across multiple specialties at a high-volume institution and may be applied to similar institutions. Another weakness of this study is that the data cover only 1 year. Collecting data over a longer period could improve the magnitude and power of the analysis. Nonetheless, 1 year of data is a good starting point in identifying the issues and guiding the initiation of measures to address them. Last, we did not explore the reason for each instance of waste during the period reviewed. Knowing the reason for implant waste would be helpful in developing strategies to reduce implant waste.
Our study results showed that, in 1 year, implant waste occurred in 1.8% of procedures that required an implant—representing a loss of $634,000. Other studies have quantified implant waste for selected procedures or single departments, but to our knowledge none has quantified implant waste for an entire orthopedic department or hospital. It is therefore difficult to compare our institutional results with other results. For instance, definitions of waste differ. A study that found waste in 20% of spine surgery cases22 included all intraoperative waste, whereas our 11% of spine cases were implant waste only. Similarly, though rates of implant waste in trauma cases differed significantly between a multi-institution study by Zywiel and colleagues24 (0.6%) and our institution (30%), their study excluded arthroplasty cases from the trauma subset and reported implant waste for a single vendor, whereas we included arthroplasty cases and a wide array of implant vendors. In addition, costs cannot be directly compared because, in our study, implants wasted may have differed. Although the Trauma division had the highest incidence of waste (30%) in our analysis, it did not have the highest waste-related costs. Instead, the Adult Reconstruction division, with waste in 8% of cases, had the highest waste cost, $214,869. The cost difference is certainly the result of the difference in type of implants wasted. The implants most commonly wasted in the Trauma division were screws, which cost between $17 and $150; a single femoral stem, though wasted less often, cost significantly more, $2000 to $6000.
Our results showed a combined implant waste incidence of 6.8% for primary THA and primary TKA cases over the year. In their multi-institution study, Zywiel and colleagues19 reported a combined incidence of implant waste in 2% of THA and TKA cases. The difference is that Zywiel and colleagues19 reported data from a single implant vendor and included revision surgeries, hip hemiarthroplasties, and unicondylar knee arthroplasties. Another study reported implant waste in 5.7% of all TKA cases but did not specify whether revision or unicondylar arthroplasties were included.25 For lumbar spinal fusion, we found an implant waste incidence of 14%. Given the lack of studies in this area, we cannot make a comparison of results.
To our knowledge, there has been no other study of the effects of case volume and years in surgical practice on implant waste. Our analysis showed that waste incidence was not related to surgeon case volume but was related to years in surgical practice. Incidence of waste was significantly lower among surgeons practicing 20 years or more than among surgeons practicing fewer than 10 years. The difference may be a reflection that case volume during a single year is not totally indicative of a surgeon’s lifetime case volume. For example, several surgeons with many years of experience and a significant lifetime case volume had an annual case volume in the lower 25% of the department because they were approaching retirement or had only recently joined the institution. More rigorous prospective studies are needed to further understand this relationship.
Conclusions
Our study demonstrated significant costs related to implant waste. These costs are important to consider not only for traditional cases, such as total joint and spine procedures, in which implant costs are routinely scrutinized, but for all subspecialties, such as sports medicine, in which the majority of cases are performed on an outpatient basis. Considering the estimated $36 million wasted during THAs and TKAs and $126 million wasted on spine surgeries in the United States annually, and the significant waste we observed in other orthopedic subspecialties, decreasing the rate of intraoperative waste during orthopedic surgeries represents another area that could provide significant cost reduction through implant cost savings.19,22 A few successful programs have been reported. Soroceanu and colleagues22 found an almost 50% decrease in intraoperative waste during spine surgery after an educational program was used to address such waste. Elsewhere, use of a computer-based system (e.Label and Compatibility) led to an estimated cost reduction of $75,000 in implant waste.25 Efforts to develop and implement other programs to reduce implant waste are needed and should be part of any orthopedic operating room cost reduction strategy.
1. Alhassani A, Chandra A, Chernew ME. The sources of the SGR “hole.” N Engl J Med. 2012;366(4):289-291.
2. Hariri S, Bozic KJ, Lavernia C, Prestipino A, Rubash HE. Medicare physician reimbursement: past, present, and future. J Bone Joint Surg Am. 2007;89(11):2536-2546.
3. Keehan SP, Sisko AM, Truffer CJ, et al. National health spending projections through 2020: economic recovery and reform drive faster spending growth. Health Aff. 2011;30(8):1594-1605.
4. Porter ME. What is value in health care? N Engl J Med. 2010;363(26):2477-2481.
5. Belatti DA, Phisitkul P. Trends in orthopedics: an analysis of Medicare claims, 2000–2010. Orthopedics. 2013;36(3):e366-e372.
6. Kurtz S, Ong K, Lau E, Mowat F, Halpern M. Projections of primary and revision hip and knee arthroplasty in the United States from 2005 to 2030. J Bone Joint Surg Am. 2007;89(4):780-785.
7. Lavernia CJ, Hernandez VH, Rossi MD. Payment analysis of total hip replacement. Curr Opin Orthop. 2007;18(5):23-27.
8. Mendenhall S. 2003 hip and knee implant review. Orthop Network News. 2003;14(3):2.
9. Mendenhall S. 2008 hip and knee implant review. Orthop Network News. 2008;19(3):20.
10. Healy WL, Rana AJ, Iorio R. Hospital economics of primary total knee arthroplasty at a teaching hospital. Clin Orthop Relat Res. 2011;469(1):87-94.
11. Mendenhall S. 2007 hip and knee implant review. Orthop Network News. 2007;18(3):16.
12. Iorio R, Davis CM 3rd, Healy WL, Fehring TK, O’Connor MI, York S. Impact of the economic downturn on adult reconstruction surgery: a survey of the American Association of Hip and Knee Surgeons. J Arthroplasty. 2010;25(7):1005-1014.
13. Healy WL, Iorio R, Ko J, Appleby D, Lemos DW. Impact of cost reduction programs on short-term patient outcome and hospital cost of total knee arthroplasty. J Bone Joint Surg Am. 2002;84(3):348-353.
14. Iorio R, Robb WJ, Healy WL, et al. Orthopaedic surgeon workforce and volume assessment for total hip and knee replacement in the United States: preparing for an epidemic. J Bone Joint Surg Am. 2008;90(7):1598-1605.
15. Rana AJ, Iorio R, Healy WL. Hospital economics of primary THA decreasing reimbursement and increasing cost, 1990 to 2008. Clin Orthop Relat Res. 2011;469(2):355-361.
16. Robinson JC, Pozen A, Tseng S, Bozic KJ. Variability in costs associated with total hip and knee replacement implants. J Bone Joint Surg Am. 2012;94(18):1693-1698.
17. de Steiger RN, Miller LN, Davidson DC, Ryan P, Graves SE. Joint registry approach for identification of outlier prostheses. Acta Orthop. 2013;84(4):348-352.
18. Havelin LI, Fenstad AM, Salomonsson R, et al. The Nordic Arthroplasty Register Association: a unique collaboration between 3 national hip arthroplasty registries with 280,201 THRs. Acta Orthop. 2009;80(4):393-401.
19. Zywiel MG, Ulrich SD, Suda AJ, Duncan JL, McGrath MS, Mont MA. Incidence and cost of intraoperative waste of hip and knee arthroplasty implants. J Arthroplasty. 2010;25(4):558-562.
20. Kim P, Kurokawa R, Itoki K. Technical advancements and utilization of spine surgery—international disparities in trend-dynamics between Japan, Korea, and the USA. Neurol Med Chir. 2010;50(9):853-858.
21. Weinstein JN, Lurie JD, Olson PR, Bronner KK, Fisher ES. United States’ trends and regional variations in lumbar spine surgery: 1992–2003. Spine. 2006;31(23):2707-2714.
22. Soroceanu A, Canacari E, Brown E, Robinson A, McGuire KJ. Intraoperative waste in spine surgery: incidence, cost, and effectiveness of an educational program. Spine. 2011;36(19):E1270-E1273.
23. Bosco JA, Alvarado CM, Slover JD, Iorio R, Hutzler LH. Decreasing total joint implant costs and physician specific cost variation through negotiation. J Arthroplasty. 2014;29(4):678-680.
24. Zywiel MG, Delanois RE, McGrath MS, Ulrich SD, Duncan JL, Mont MA. Intraoperative waste of trauma implants: a cost burden to hospitals worth addressing? J Orthop Trauma. 2009;23(10):710-715.
25. Ast MP, Mayman DJ, Su EP, Gonzalez Della Valle AM, Parks ML, Haas SB. The reduction of implant-related errors and waste in total knee arthroplasty using a novel, computer based, e.Label and Compatibility system. J Arthroplasty. 2014;29(1):132-136.
The cost of health care in the United States is increasing at an unsustainable rate.1-3 To decrease or even reverse this trend, we must decrease the cost of care without adversely affecting quality. Porter4 defined value as the quality of care divided by its cost. The economics of total joint arthroplasty (TJA) has received a great deal of attention because of both increasing demand and increasing cost.5-9 About 33% of all orthopedic surgeries and the majority of TJAs are paid for by Medicare.9 In recent years, the rate of reimbursement for orthopedic cases has steadily declined while the cost of implants has increased.3,10,11 Given the significant cost of implants, health care providers in some subspecialties have focused on implant costs as a potential area for cost reduction.12 For example, in TJA this has proved effective in reducing the overall cost, as has decreasing length of stay after surgery.8,10,13-16
With little evidence suggesting any specific orthopedic implant has outcomes superior to those of others, with the exception of select poorly performing outliers, we must increase value of care by lowering the cost when considering these devices.17,18 In addition, some experts have suggested that intraoperative waste is a significant factor in TJA cost, and it does contribute to the average implant cost for a TJA case.6,19 Using data collected from 72 institutions, Zywiel and colleagues19 estimated the annual cost of wasted hip and knee arthroplasty implants to be more than $36 million in the United States.
However, considering the aging US population, TJA is not the only orthopedic surgery with increased demand. An estimated 600,000 spine surgeries are performed each year in the United States.20 Between 1992 and 2003, Medicare spending for lumbar spinal fusion increased 500%.21 In addition, in a 15-month observational study of incidence of intraoperative waste in spine surgery, Soroceanu and colleagues22 reported waste occurring in 20% of spine procedures.
Although these studies have described implant waste in TJA and spine surgeries, little has been published on the cost of wasted implants in a center performing the full range of orthopedic procedures. In this article, we detail the implant waste costs incurred by surgeons for all orthopedic subspecialties at a single orthopedic specialty hospital over a 1-year period. Our study goals were to identify types of implants wasted, and incidence and cost of implant waste, for all total hip arthroplasties (THAs), total knee arthroplasties (TKAs), and lumbar spinal fusions performed at the hospital and to determine whether case volume or years in surgical practice affect the rate or cost of implants wasted.
Methods
We performed a retrospective economic analysis of 1 year of administrative implant data from our institution. Collected data were quantified and analyzed for factors that might explain any variance in implant waste among surgeons. We were granted exempt institutional review board status, as no patient information was involved in this study.
We reviewed the administrative implant data for the 12-month period beginning June 2012 and ending May 2013. For that period, number of cases in which an implant was used and number of cases in which an implant was wasted were recorded. For each instance of waste, type and cost of the wasted implant were entered into the administrative database. In addition, overall cost of implants for the year and cost of wasted implants were determined. Data were available for 81 surgeons across 8 orthopedic divisions (subspecialties). From this information, we determined percentage of cases in which waste occurred, percentage of total implant cost wasted, average cost of waste per case, and most commonly wasted implants. All 3 variables were also calculated for THAs, TKAs, and lumbar spinal fusion procedures.
Statistical Analysis
The data were analyzed to determine if surgeon case volume or years in surgical practice affected implant waste. All analyses were performed at department, division (subspecialty), and surgeon levels. Case volume was analyzed in 3 groups: top 25%, middle 50%, and lower 25%. Number of years in surgical practice was analyzed in 3 groups: fewer than 10 years, 10 to 19 years, and 20 years or more. Normality assumption of variables was tested using the Shapiro-Wilk test (P < .05). For between-group differences, 1-way analysis of variance and the Tukey honestly significant difference post hoc test were performed for variables with a normal distribution, and the Kruskal-Wallis and Mann-Whitney tests were performed for variables without a normal distribution.
For the subspecialty-level analyses, only the Adult Reconstruction, Sports Medicine, and Spine divisions were analyzed for the effects of volume, and only the Sports Medicine and Spine divisions were analyzed for the effect of surgical experience, as surgeon numbers were insufficient for adequate grouping(s).
Data are presented as means with corresponding 95% confidence intervals (CIs). Categorical variables are presented as counts with percentages. All statistical analyses were performed with SPSS Version 21.0 (IBM SPSS) statistical software. Statistical significance was set at .05.
Results
During the 1-year period, 8954 department cases involved an implant of any type. Waste occurred in 12% (1072) of these cases. The rate ranged from 8% in the Adult Reconstruction division to 30% in the Trauma division (Table 1), and the rate for individual surgeons ranged from 3% to 100%, though the surgeon with 100% performed only 1 case, and the next highest rate was 50%.
Total implant cost for our hospital during the period was $34,340,607. Of that total cost, 1.8% ($634,668) was lost because of implant waste. Percentage of total implant cost wasted ranged from 1.6% in the Adult Reconstruction division to 4.7% in the Sports Medicine division (Table 1). Percentage of total implant cost wasted for individual surgeons ranged from 0.2% to 16.1%. Tables 2 and 3 list the most commonly wasted implants by count and cost, respectively.
When total cost of wasted implants was averaged over all implant cases performed during the period, the loss resulting from waste amounted to $71 per case for the department and ranged from $21 per case for the Hand division to $105 per case for the Pediatric division (Table 1). For individual surgeons, the loss ranged from $4 to $250 per case.
During the period studied, an implant was wasted in 9% (100) of the 1076 primary THAs performed, 4% (42) of the 1003 primary TKAs, and 14% (30) of the 217 lumbar spinal fusions (Tables 4, 5).
There was no significant difference between groups for department (P = .46) or for the Adult Reconstruction (P = .83), Spine (P = .10), or Sports Medicine (P = .69) division. Analyzing for variance by years in surgical practice, we found a significant difference for department (P = .01) but not for the Adult Reconstruction (P = .12) or Spine (P = .14) division. The department difference resulted from a significant difference (P = .001; 95% CI, 1.112-17.408) between surgeons (<10 years of surgical practice) who wasted implants in 12.8% of their cases and surgeons (>20 years of surgical practice) who wasted implants in 9% of their cases (Table 4).
There was no significant difference between groups for department (P = .83) or for the Adult Reconstruction (P = .29) or Spine (P = .41) division when analyzed by years in surgical practice. Analyzing by case volume, we found a significant difference for the Sports Medicine division (P = .004): Percentage of total implant waste was significantly higher (P = .003; 95% CI, –12.61 to –2.97) for surgeons with the lower 25% of case volume (9.8%) than for surgeons with the middle 50% of case volume (3.5%) (Table 5). No other significant difference was found for department (P = .52) or for the Adult Reconstruction (P = .69) or Spine (P = .45) division.
Analyzing by case volume and years in surgical practice, we found no significant difference for department (case volume, P = .76; years in surgical practice, P = .07), Adult Reconstruction division (case volume, P = .47; years in surgical practice, P = .78), Spine division (case volume, P = .11; years in surgical practice, P = .15), or Sports Medicine division (case volume, P = .08).
Selected Procedures
Total Hip Arthroplasty. Regarding variance by case volume and years in surgical practice, we found no significant difference for any variable analyzed: percentage of cases with waste (volume, P = .072; years in practice, P = .076), percentage of total implant cost wasted (volume, P = .074; years in practice, P = .12), cost of waste per case (volume, P = .075; years in practice, P = .32).
Total Knee Arthroplasty. Regarding variance by years in surgical practice, we found no significant difference for any variable analyzed: percentage of cases with waste (P = .38), percentage of total implant cost wasted (P = .50), cost of waste per case (P = .50). Regarding variance by volume, there was no significant difference for percentage of cases with waste (P = .70) or cost of waste per case (P = .05), but we found a significant difference for percentage of total implant cost wasted (P = .038). That difference was caused by an outlier: One surgeon with the lower 25% of case volume wasted an implant in the only TKA he performed that year. Correction for the outlier removed the significance.
Posterior Lumbar Spinal Fusion. Regarding variance by case volume and years in surgical practice, we found no significant difference for any variable analyzed: percentage of cases with waste (volume, P = .36; years in surgical practice, P = .22), percentage of total implant cost wasted (volume, P = .33; years in surgical practice, P = .41), cost of waste per case (volume, P = .34; years in practice, P = .15).
Discussion
The steadily increasing demand for orthopedic surgeries and declining rates of reimbursement by Medicare and other insurance providers have led many hospitals to look for ways to control the cost of these surgeries. Reducing operating room costs, lowering implant prices, and shortening hospital stays have all proved successful.6,15,20,23 One area that has not been thoroughly explored is the cost burden of wasted implants. Our findings suggest implant waste contributes significantly to the cost of orthopedic surgeries.
One weakness of this study is that its data, though encompassing all orthopedic subspecialties and procedures, come from a single teaching institution and therefore are less representative of all orthopedic departments across the United States. However, the findings are useful in that the analysis was performed across multiple specialties at a high-volume institution and may be applied to similar institutions. Another weakness of this study is that the data cover only 1 year. Collecting data over a longer period could improve the magnitude and power of the analysis. Nonetheless, 1 year of data is a good starting point in identifying the issues and guiding the initiation of measures to address them. Last, we did not explore the reason for each instance of waste during the period reviewed. Knowing the reason for implant waste would be helpful in developing strategies to reduce implant waste.
Our study results showed that, in 1 year, implant waste occurred in 1.8% of procedures that required an implant—representing a loss of $634,000. Other studies have quantified implant waste for selected procedures or single departments, but to our knowledge none has quantified implant waste for an entire orthopedic department or hospital. It is therefore difficult to compare our institutional results with other results. For instance, definitions of waste differ. A study that found waste in 20% of spine surgery cases22 included all intraoperative waste, whereas our 11% of spine cases were implant waste only. Similarly, though rates of implant waste in trauma cases differed significantly between a multi-institution study by Zywiel and colleagues24 (0.6%) and our institution (30%), their study excluded arthroplasty cases from the trauma subset and reported implant waste for a single vendor, whereas we included arthroplasty cases and a wide array of implant vendors. In addition, costs cannot be directly compared because, in our study, implants wasted may have differed. Although the Trauma division had the highest incidence of waste (30%) in our analysis, it did not have the highest waste-related costs. Instead, the Adult Reconstruction division, with waste in 8% of cases, had the highest waste cost, $214,869. The cost difference is certainly the result of the difference in type of implants wasted. The implants most commonly wasted in the Trauma division were screws, which cost between $17 and $150; a single femoral stem, though wasted less often, cost significantly more, $2000 to $6000.
Our results showed a combined implant waste incidence of 6.8% for primary THA and primary TKA cases over the year. In their multi-institution study, Zywiel and colleagues19 reported a combined incidence of implant waste in 2% of THA and TKA cases. The difference is that Zywiel and colleagues19 reported data from a single implant vendor and included revision surgeries, hip hemiarthroplasties, and unicondylar knee arthroplasties. Another study reported implant waste in 5.7% of all TKA cases but did not specify whether revision or unicondylar arthroplasties were included.25 For lumbar spinal fusion, we found an implant waste incidence of 14%. Given the lack of studies in this area, we cannot make a comparison of results.
To our knowledge, there has been no other study of the effects of case volume and years in surgical practice on implant waste. Our analysis showed that waste incidence was not related to surgeon case volume but was related to years in surgical practice. Incidence of waste was significantly lower among surgeons practicing 20 years or more than among surgeons practicing fewer than 10 years. The difference may be a reflection that case volume during a single year is not totally indicative of a surgeon’s lifetime case volume. For example, several surgeons with many years of experience and a significant lifetime case volume had an annual case volume in the lower 25% of the department because they were approaching retirement or had only recently joined the institution. More rigorous prospective studies are needed to further understand this relationship.
Conclusions
Our study demonstrated significant costs related to implant waste. These costs are important to consider not only for traditional cases, such as total joint and spine procedures, in which implant costs are routinely scrutinized, but for all subspecialties, such as sports medicine, in which the majority of cases are performed on an outpatient basis. Considering the estimated $36 million wasted during THAs and TKAs and $126 million wasted on spine surgeries in the United States annually, and the significant waste we observed in other orthopedic subspecialties, decreasing the rate of intraoperative waste during orthopedic surgeries represents another area that could provide significant cost reduction through implant cost savings.19,22 A few successful programs have been reported. Soroceanu and colleagues22 found an almost 50% decrease in intraoperative waste during spine surgery after an educational program was used to address such waste. Elsewhere, use of a computer-based system (e.Label and Compatibility) led to an estimated cost reduction of $75,000 in implant waste.25 Efforts to develop and implement other programs to reduce implant waste are needed and should be part of any orthopedic operating room cost reduction strategy.
1. Alhassani A, Chandra A, Chernew ME. The sources of the SGR “hole.” N Engl J Med. 2012;366(4):289-291.
2. Hariri S, Bozic KJ, Lavernia C, Prestipino A, Rubash HE. Medicare physician reimbursement: past, present, and future. J Bone Joint Surg Am. 2007;89(11):2536-2546.
3. Keehan SP, Sisko AM, Truffer CJ, et al. National health spending projections through 2020: economic recovery and reform drive faster spending growth. Health Aff. 2011;30(8):1594-1605.
4. Porter ME. What is value in health care? N Engl J Med. 2010;363(26):2477-2481.
5. Belatti DA, Phisitkul P. Trends in orthopedics: an analysis of Medicare claims, 2000–2010. Orthopedics. 2013;36(3):e366-e372.
6. Kurtz S, Ong K, Lau E, Mowat F, Halpern M. Projections of primary and revision hip and knee arthroplasty in the United States from 2005 to 2030. J Bone Joint Surg Am. 2007;89(4):780-785.
7. Lavernia CJ, Hernandez VH, Rossi MD. Payment analysis of total hip replacement. Curr Opin Orthop. 2007;18(5):23-27.
8. Mendenhall S. 2003 hip and knee implant review. Orthop Network News. 2003;14(3):2.
9. Mendenhall S. 2008 hip and knee implant review. Orthop Network News. 2008;19(3):20.
10. Healy WL, Rana AJ, Iorio R. Hospital economics of primary total knee arthroplasty at a teaching hospital. Clin Orthop Relat Res. 2011;469(1):87-94.
11. Mendenhall S. 2007 hip and knee implant review. Orthop Network News. 2007;18(3):16.
12. Iorio R, Davis CM 3rd, Healy WL, Fehring TK, O’Connor MI, York S. Impact of the economic downturn on adult reconstruction surgery: a survey of the American Association of Hip and Knee Surgeons. J Arthroplasty. 2010;25(7):1005-1014.
13. Healy WL, Iorio R, Ko J, Appleby D, Lemos DW. Impact of cost reduction programs on short-term patient outcome and hospital cost of total knee arthroplasty. J Bone Joint Surg Am. 2002;84(3):348-353.
14. Iorio R, Robb WJ, Healy WL, et al. Orthopaedic surgeon workforce and volume assessment for total hip and knee replacement in the United States: preparing for an epidemic. J Bone Joint Surg Am. 2008;90(7):1598-1605.
15. Rana AJ, Iorio R, Healy WL. Hospital economics of primary THA decreasing reimbursement and increasing cost, 1990 to 2008. Clin Orthop Relat Res. 2011;469(2):355-361.
16. Robinson JC, Pozen A, Tseng S, Bozic KJ. Variability in costs associated with total hip and knee replacement implants. J Bone Joint Surg Am. 2012;94(18):1693-1698.
17. de Steiger RN, Miller LN, Davidson DC, Ryan P, Graves SE. Joint registry approach for identification of outlier prostheses. Acta Orthop. 2013;84(4):348-352.
18. Havelin LI, Fenstad AM, Salomonsson R, et al. The Nordic Arthroplasty Register Association: a unique collaboration between 3 national hip arthroplasty registries with 280,201 THRs. Acta Orthop. 2009;80(4):393-401.
19. Zywiel MG, Ulrich SD, Suda AJ, Duncan JL, McGrath MS, Mont MA. Incidence and cost of intraoperative waste of hip and knee arthroplasty implants. J Arthroplasty. 2010;25(4):558-562.
20. Kim P, Kurokawa R, Itoki K. Technical advancements and utilization of spine surgery—international disparities in trend-dynamics between Japan, Korea, and the USA. Neurol Med Chir. 2010;50(9):853-858.
21. Weinstein JN, Lurie JD, Olson PR, Bronner KK, Fisher ES. United States’ trends and regional variations in lumbar spine surgery: 1992–2003. Spine. 2006;31(23):2707-2714.
22. Soroceanu A, Canacari E, Brown E, Robinson A, McGuire KJ. Intraoperative waste in spine surgery: incidence, cost, and effectiveness of an educational program. Spine. 2011;36(19):E1270-E1273.
23. Bosco JA, Alvarado CM, Slover JD, Iorio R, Hutzler LH. Decreasing total joint implant costs and physician specific cost variation through negotiation. J Arthroplasty. 2014;29(4):678-680.
24. Zywiel MG, Delanois RE, McGrath MS, Ulrich SD, Duncan JL, Mont MA. Intraoperative waste of trauma implants: a cost burden to hospitals worth addressing? J Orthop Trauma. 2009;23(10):710-715.
25. Ast MP, Mayman DJ, Su EP, Gonzalez Della Valle AM, Parks ML, Haas SB. The reduction of implant-related errors and waste in total knee arthroplasty using a novel, computer based, e.Label and Compatibility system. J Arthroplasty. 2014;29(1):132-136.