User login
Socioeconomic and Racial Disparities in Diabetic Ketoacidosis Admissions in Youth With Type 1 Diabetes
Type 1 diabetes mellitus (T1D) is a common chronic condition of childhood. Its incidence has risen steadily over the past two decades.1 Treatment requires complex daily tasks, including blood glucose monitoring and insulin administration. The potential long-term complications of T1D—kidney failure, retinopathy, cardiovascular disease, and death—are grave but can be attenuated with effective glycemic management.2 Still, less than 25% of youths aged 13 to 19 years achieve target hemoglobin A1c (HbA1c) levels.3
Diabetic ketoacidosis (DKA) is an acute, life-threatening complication of T1D associated with suboptimal glycemic management. In the United States, DKA hospitalizations increased during 2009-2014.4 One study found the average standardized cost of a DKA-related pediatric hospitalization exceeded $7000,5 an amount not including missed school days, parent/caregiver workdays, and social and family disruptions. Costs extend to psychological well-being, with patients reporting that they “keep thinking [DKA] may happen again.”6
The burden of T1D-related morbidity is not equitably distributed. Recent evidence suggests that racial/ethnic minorities and those with public insurance experience disproportionately high rates of DKA.7,8 Neighborhood socioeconomic measures, like poverty, add an important dimension illustrative of ecological conditions in which patients reside. These measures have been studied in relation to hospitalization rates for chronic conditions like asthma and heart failure.9,10 For example, one recent study found links between area-level poverty in the United States and the likelihood of readmissions for pediatric patients following an admission for DKA.11 We sought to build on this finding by investigating whether area-level poverty, which we measured as the census tract poverty rate, patient race, and insurance status were associated with the likelihood of initial DKA hospitalization and severity of DKA presentation.
METHODS
Design
We conducted a single-center, retrospective cohort study that examined data on youth with T1D extracted from the Cincinnati Children’s Hospital Medical Center (CCHMC) electronic medical record (EMR). CCHMC is an urban, tertiary-care, freestanding pediatric hospital, with near-complete market penetration in Hamilton County, Ohio, particularly for subspecialty care. The racial and ethnic breakdown of Hamilton County’s general population is 68% White, 27% Black/African American, 3% Asian, and 4% Hispanic or Latino (adds to more than 100% due to rounding).12 The CCHMC Institutional Review Board approved this study.
Study Population
We identified eligible patients through a clinical registry within the EMR, which includes all T1D patients seen at CCHMC within the preceding 24 months. Patients are added to this registry upon initial T1D diagnosis by a research nurse who evaluates autoantibody status and clinical presentation. All patients ≤18 years old who had T1D, were active on the registry, and had an address within Hamilton County as of December 31, 2017, were included. Those with type 2 diabetes mellitus or secondary causes of diabetes were excluded. We captured patients on the registry as of December 31, 2017, and then examined whether they had been hospitalized from January 1, 2011, to December 31, 2017.
Covariates
We extracted demographic and clinical data for patients within the T1D registry as of December 31, 2017, and, for those hospitalized, at the time of their admission. Specifically, we extracted date of birth (to calculate age at encounter), sex, and ethnicity. Age was treated as a continuous variable. We defined ethnicity as Latinx (inclusive of Hispanic) or non-Latinx. We calculated duration of T1D diagnosis for patients within the registry by taking the difference of the diabetes onset date and the end of the study period. We extracted whether registry patients had an insulin pump or a continuous glucose monitor (CGM). Hospitalized patients were identified as new-onset or established T1D by comparing their hospitalization with the T1D diagnosis onset date.
For the entire T1D registry, we also assessed a key clinical characteristic: a patient’s median HbA1c. We enumerated the median HbA1c of all patients’ medians within the calendar year 2017, consistent with the methodology of a large international T1D registry.13 Among the subset of patients who were hospitalized, we obtained the HbA1c value during or prior to hospitalization.
Exposures
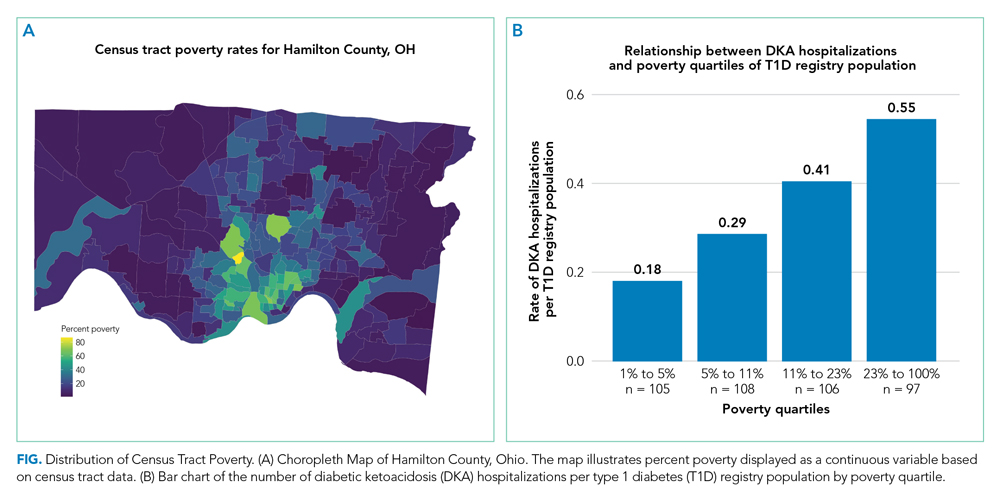
We captured exposure variables from EMR documentation of patients’ address, race, and insurance status. Given the small regional population of Latinx patients, we did not include ethnicity as an exposure. We used the address and insurance status at the beginning of the study period for established T1D patients, or at the time of diagnosis for new-onset patients, for analyses related to the likelihood of DKA admission. We used the address at the time of hospitalization for analyses of DKA presentation severity. We geocoded home addresses using ArcGIS software (Version 10.5.1; Esri), successfully geocoding >95% to the street level and assigning patients to a corresponding census tract—a census-defined geography consisting of approximately 4000 people.14 Census tracts, when drawn after the decennial (every 10 years) census, are designed to be sociodemographically homogenous15 and have long been used in medical and public health research.16 We connected geocoded addresses to the census tract poverty rate, defined as the percentage of individuals within a tract living below the federal poverty level. For our analyses, we primarily treated census tract poverty as a continuous variable ranging from 0% to 100%. We visualized the distribution of census tract poverty across Hamilton County using a choropleth map (Figure, part A). We also grouped the registry population into quartiles, ordered by census tract poverty levels, to ease the graphical display for Figure, part B. We defined race as White, Black (inclusive of African American), or other. We categorized insurance as Medicaid/public or Non-Medicaid/private.
Outcomes
The primary outcome was a hospitalization for DKA during the study period. We identified eligible events by admission diagnosis of DKA (International Classification of Disease, 10th Revision, Clinical Modification, E13.10 or E10.10). Secondarily, we assessed admission severity for each patient’s first DKA hospitalization using initial pH from a venous blood gas and initial bicarbonate from the basic metabolic panel. These measures were chosen in accordance with the American Diabetes Association’s published classification of DKA severity, which uses pH, bicarbonate, and mental status.17 We defined the time for correction as the minutes from admission time until the anion gap was ≤12 or the bicarbonate was ≥18. We calculated total inpatient bed-days and pediatric intensive care unit (PICU) bed-days, and identified whether a patient was readmitted for DKA during the study period.
Statistical Analyses
We used descriptive statistics to characterize demographic and clinical information for patients within the T1D registry and for the hospitalized subset. We examined DKA severity data for all admitted patients by diagnosis status (new-onset T1D vs established). Associations between categorical outcomes were assessed using the Chi-square or Fisher exact test, and continuous outcomes were evaluated using the Mann-Whitney Rank Sum test.
We individually examined the effects of census tract poverty, race, and insurance on the odds of hospitalization through logistic regression. After confirming overlap and variability in census tract poverty rates by race and admission status (Appendix Table 1), we included these exposures in a multivariable model to capture their independent effects. Because the impact of census tract poverty, race, and insurance on hospitalization odds could vary depending on T1D diagnosis status, we conducted a sensitivity analysis by repeating the multivariable model with only established T1D patients.
Given that median HbA1c levels differed for T1D registry patients based on census tract poverty, race, and insurance, we used linear regression in a post-hoc analysis to evaluate associations between those exposures and median HbA1c. Age, gender, ethnicity, and duration of diabetes were not included in the models given that these variables did not differ by outcome variables. Diabetes technology—CGM and insulin pumps—was not included as a confounder because we hypothesized it mediated the effect of area-level poverty. For analyses, SigmaPlot (Version 14.0; SPSS Inc.) and R statistical software were used (The R Project for Statistical Computing).
RESULTS
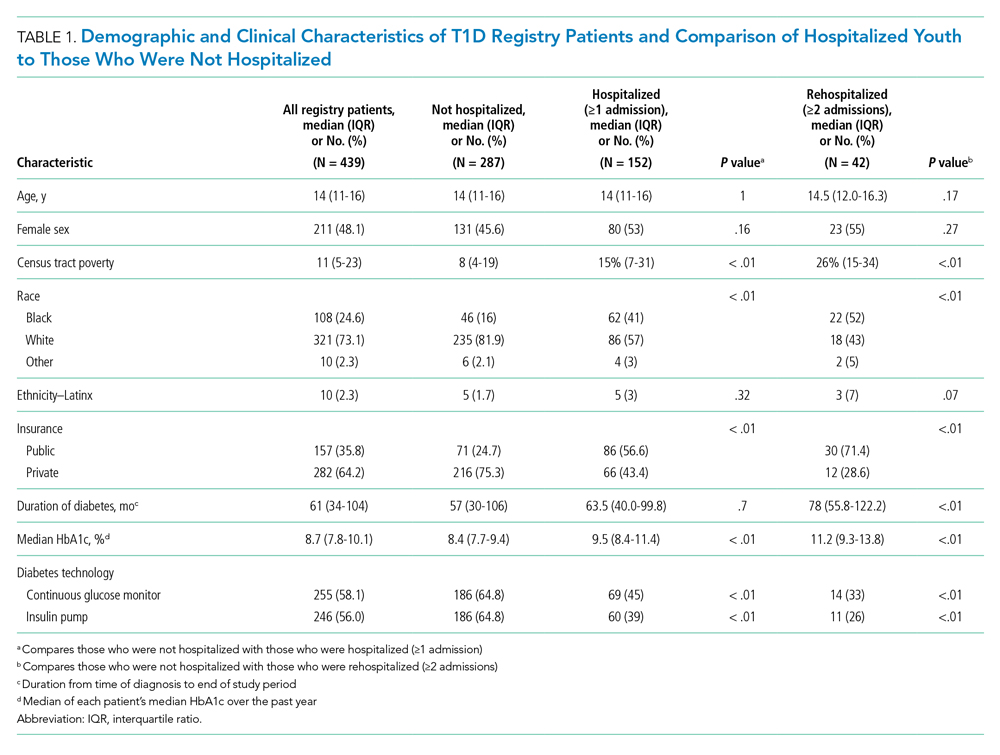
A total of 439 patients were in the T1D registry and lived in Hamilton County as of December 31, 2017. Their demographic characteristics are listed in Table 1. Their median age was 14 years; 48% were female. The median poverty rate of the census tracts in which these youth lived was 11%. A total of 24.6% of patients identified as Black, 73.1% as White, and 2.3% as Hispanic; 35.8% were publicly insured. Patients had a median duration of T1D of 61 months (5 years, 1 month), with a median HbA1c (of all patients’ medians) of 8.7%. A total of 58.1% had a CGM, and 56% used an insulin pump.
Hospitalization Characteristics of Those in the T1D Registry
Approximately one-third of registry patients (n = 152) experienced ≥1 hospitalization for DKA during the study period (inclusive of new-onset and established diagnosis). Age, gender, ethnicity, and duration of T1D diagnosis were similar between those who experienced a hospitalization and those who did not. The median census tract poverty rate was higher among those who were hospitalized compared to those who were not (15% vs 8%, P < .01). Among hospitalized patients, 41% identified as Black; among all who were not hospitalized, 16% identified as Black (P < .01). Among all hospitalized patients, 56.6% were covered by public insurance, while 24.7% of non-hospitalized patients were covered by public insurance (P < .01). Hospitalized patients were more likely to have a higher median HbA1c (9.5% vs 8.4%, P < .01) and were significantly less likely to have a CGM or insulin pump (both P < .01). These associations were magnified among the roughly 10% of the T1D registry population (n = 42) who experienced ≥2 hospitalizations.
Figure, part A is a choropleth map depicting the distribution of poverty by census tract across Hamilton County. The map is complemented by part B of the Figure, which displays the T1D registry population split into poverty quartiles and each quartile’s DKA admission rate per T1D registry population. As census tract poverty increases, so too does the rate of DKA hospitalizations. There is an almost threefold difference between the hospitalization rate of the highest poverty quartile and that of the lowest.
Likelihood of Hospitalization
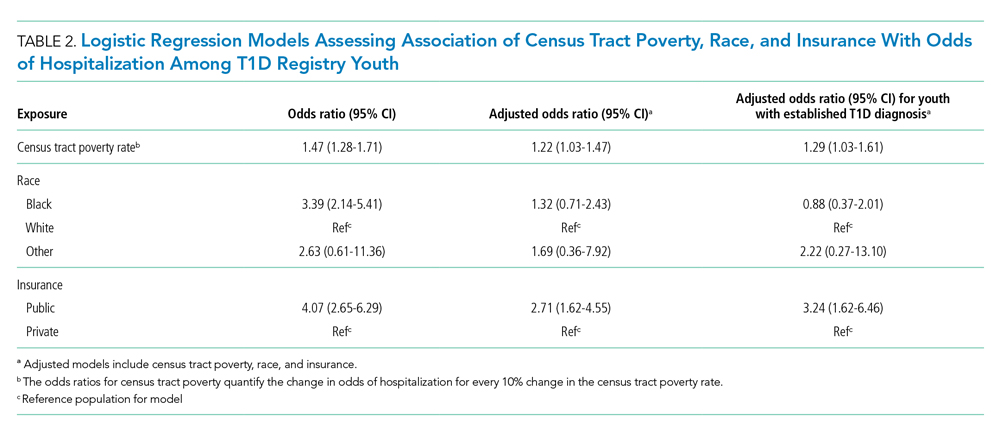
We examined the exposures of interest—census tract poverty, race, and insurance—and odds of hospitalization at a patient level using logistic regression models (Table 2). In the multivariable model that included these exposures, we found that for every 10% increase in the census tract poverty rate, the odds of being hospitalized for DKA increased by 22% (95% CI, 1.03-1.47). Race was not significantly associated with odds of DKA hospitalization in the multivariable model. Public insurance was associated with a 2.71-times higher odds of hospitalization compared to those with private insurance (95% CI, 1.62-4.55). Our sensitivity analysis of only those with established T1D diagnoses showed similar results to that of the entire T1D registry population.
Severity of DKA Presentation
A total of 152 registry patients were admitted; 89 patients had new-onset T1D, and 63 had an established T1D diagnosis. We examined presenting factors (initial pH, initial bicarbonate, HbA1c) and clinical characteristics (time to correction, inpatient bed-days, PICU bed-days) by census tract poverty, race, and insurance for all hospitalized patients. There were no significant differences in presenting factors or outcomes by census tract poverty or insurance. However, we did note certain differences by race. Indeed, though initial pH, bicarbonate, and time to correction did not meaningfully differ by race, Black patients had a longer length of stay than their White peers (Appendix Table 2; 3.06 vs 2.16 days, P < .01). We further examined this by diagnosis status, as newly diagnosed patients often stay longer for diabetes education.18 Black patients had a longer length of stay than White patients, regardless of whether they had new-onset (3.85 vs 2.99 days, P < .01) or established T1D (1.83 vs 0.97 days, P < .01). Additionally, we found that the HbA1c was significantly higher in Black versus White patients (12.4% vs 10.8%, P = .01). HbA1c was significantly different between established T1D patients identifying as Black and those identifying as White (11.7% vs 9.5%, P < .01); however, HbA1c did not differ by race for newly diagnosed patients (12.5% vs 13.0%, P = .63).
Median HbA1c of All T1D Registry Patients
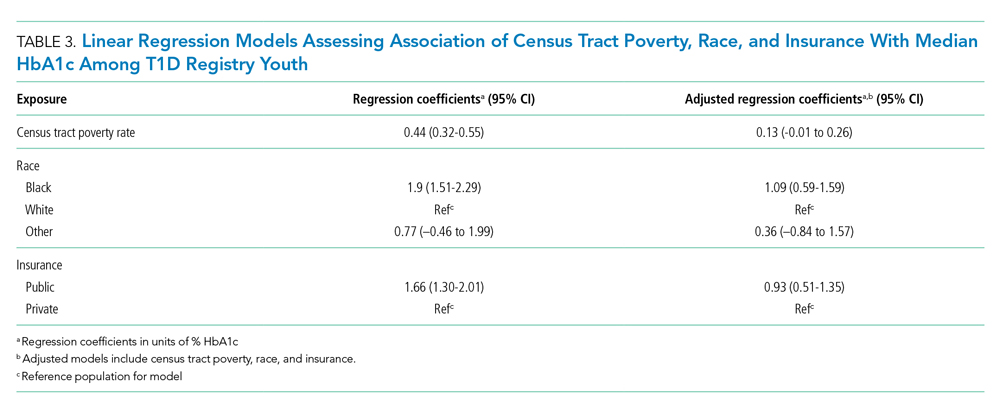
Given the suggestion of HbA1c variability by exposure variables, we performed a post-hoc linear regression analysis. Table 3 displays the linear regression models assessing associations of census tract poverty, race, and insurance on median HbA1c for all T1D registry patients. In the multivariable model, census tract poverty was no longer associated with higher HbA1c levels (0.13, 95% CI, –0.01 to 0.26). However, Black patients continued to have significantly higher HbA1c levels than White patients (1.09% higher; 95% CI, 0.59-1.59). Also, those with public insurance had significantly higher HbA1c levels than those with private insurance (0.93% higher; 95% CI, 0.51-1.35).
DISCUSSION
Living in high poverty areas, identifying as Black, and having public insurance were each associated with a higher likelihood of hospitalization for DKA in an unadjusted model. When we examined these exposures together in a multivariable model, census tract poverty and insurance remained associated with a higher likelihood of hospitalization for DKA. Race—with a wide confidence interval—was no longer associated with a higher likelihood of hospitalization. The increased likelihood of hospitalization initially seen for Black patients may be because they are more likely to reside in high poverty areas and be on public insurance—inequities associated with structural racism.
These results mirror those of other studies that have found area-level poverty to be associated with higher rates of intensive care admissions and hospitalizations for conditions like asthma.10,19 Our findings are also similar to those of a previous study that found that area-level deprivation was associated with a greater likelihood of DKA readmissions in pediatric and adult patients, as well as an adult study that showed increased neighborhood deprivation was associated with higher odds of DKA hospitalization.11,20 Further examination of the mechanisms underlying DKA hospitalization is clearly warranted and would be informed by a deeper awareness of the social determinants of health—such as community context and the neighborhood/built environment21—and their links to racial inequities.
Neighborhood socioeconomic status, here measured as census tract poverty, is likely linked to hospitalization for DKA through contextual factors like food insecurity, limited access to supportive care (eg, presence of a school nurse who can co-manage T1D with the patient/family and medical team), and adverse environmental exposures.22-24 To improve the health of patients, prevent hospitalizations, and achieve health equity, we suggest that both individual factors and these contextual factors need to be evaluated and addressed through community-connected interventions.25,26 For example, interventions that deploy community health workers to navigate the complexities of health systems have been effective in reducing HbA1c levels in adults with type 2 diabetes mellitus27 and are beginning to be studied in pediatrics.28
Black patients had a higher median HbA1c compared to their White counterparts in the T1D registry. One study has previously shown that hemoglobin glycation biologically differed by around 0.5% in Black patients compared to White patients.29 Despite this purported biological difference, a greater difference in HbA1c—nearly 2 points—was seen in the univariate model, illustrating that contextual factors such as socioeconomic status and treatment patterns, like the use of diabetes technology, exceed this biological difference.30-32 Our multivariable results support the importance of these contextual factors, as the HbA1c difference decreased from 1.9 to 1.09 after census tract poverty and insurance were included.
Such differences by race also emerge from experiences of discrimination and bias. Thus, to improve outcomes and equity, we must understand and address racism and its many ill effects. Different levels of racism, such as structural or personally mediated racism, interact with social determinants of health in various ways.33,34 For example, redlining—racially discriminatory grading of neighborhoods’ creditworthiness in the 1930s—is an example of structural racism that continues to affect the health of patients today.35,36 Black families are more likely to live in areas with higher poverty, even after controlling for household income level.37 The interaction between race and poverty is complex given these historical underpinnings of structural racism, as evidenced by race no longer being associated with an increased likelihood of DKA hospitalization in our multivariable analysis. The longer length of stay for Black patients despite similar presenting severity also exemplifies this complexity. For example, longer stays could result from explicit or implicit biases that lead providers to keep patients longer due to preconceived beliefs that the caregiver does not understand diabetes management.38 However, it also could be that the caregiver takes longer to complete diabetes education due to systemic barriers, such as work-related obligations during business hours when diabetes educators are present, or transportation and childcare needs.39 These barriers are often tied to socioeconomic status, making it more difficult for those in poverty to complete required education. We cannot conclude from our study the reasons for the difference in length of stay, just that differences exist. Moving forward, we suggest that design of interventions aimed at achieving health equity consider the complex interplay between health, healthcare systems, racism, and neighborhood context.
There were limitations to our study. First, given that this was an observational study, unmeasured confounders like patient or parental education and personal income could affect the strength of associations seen in our models. Second, although the CCHMC’s Diabetes Center treats nearly all children with T1D in Hamilton County, some patients, or hospitalizations at other centers, could have been missed. Third, the demographics of Hamilton County may not generalize to other diabetes centers. Fourth, although more granular data—such as census block groups or blocks—are available from the US Census Bureau, we chose census tracts as our unit of analysis to reduce sampling error that emerges from the use of such smaller geographies. Last, we measured census tract poverty rather than other contextual markers of one’s neighborhood, like vacant housing or the proportion of those receiving public benefits. However, these measures are often highly correlated with census tract poverty.40
CONCLUSION
Census tract poverty, race, and insurance were each associated with an increased likelihood of hospitalization for DKA. However, in a multivariable model, the effect of race was reduced so it was no longer significant, indicating that racial differences in DKA hospitalization are at least partially explained by differences in socioeconomic factors. The severity of DKA presentation did not differ by census tract poverty or insurance, although Black patients experienced differences in care despite similar markers of DKA severity. Addressing contextual factors—such as social determinants of health and racism—is warranted for future interventions that aim to eliminate equity gaps for T1D patients.
1. Mayer-Davis EJ, Lawrence JM, Dabelea D, et al. Incidence trends of type 1 and type 2 diabetes among youths, 2002–2012. N Engl J Med. 2017;376(15):1419-1429. https://doi.org/10.1056/NEJMoa1610187
2. Writing Group for the DCCT/EDIC Research Group, Orchard TJ, Nathan DM, et al. Association between 7 years of intensive treatment of type 1 diabetes and long-term mortality. JAMA. 2015;313(1):45-53. https://doi.org/10.1001/jama.2014.16107
3. Wood JR, Miller KM, Maahs DM, et al. Most youth with type 1 diabetes in the T1D Exchange Clinic Registry do not meet American Diabetes Association or International Society for Pediatric and Adolescent Diabetes clinical guidelines. Diabetes Care. 2013;36(7):2035-2037. https://doi.org/10.2337/dc12-1959
4. Benoit SR. Trends in diabetic ketoacidosis hospitalizations and in-hospital mortality—United States, 2000–2014. MMWR Morb Mortal Wkly Rep. 2018;67(12):362-365. https://doi.org/10.15585/mmwr.mm6712a3
5. Tieder JS, McLeod L, Keren R, et al. Variation in resource use and readmission for diabetic ketoacidosis in children’s hospitals. Pediatrics. 2013;132(2):229-236. https://doi.org/10.1542/peds.2013-0359
6. Moffett MA, Buckingham JC, Baker CR, Hawthorne G, Leech NJ. Patients’ experience of admission to hospital with diabetic ketoacidosis and its psychological impact: an exploratory qualitative study. Practical Diabetes. 2013;30(5):203-207. https://doi.org/10.1002/pdi.1777
7. Maahs DM, Hermann JM, Holman N, et al. Rates of diabetic ketoacidosis: international comparison with 49,859 pediatric patients with type 1 diabetes from England, Wales, the U.S., Austria, and Germany. Diabetes Care. 2015;38(10):1876-1882. https://doi.org/10.2337/dc15-0780
8. Malik FS, Hall M, Mangione-Smith R, et al. Patient characteristics associated with differences in admission frequency for diabetic ketoacidosis in United States children’s hospitals. J Pediatr. 2016;171:104-110. https://doi.org/10.1016/j.jpeds.2015.12.015
9. Manickam RN, Mu Y, Kshirsagar AV, Bang H. Area-level poverty and excess hospital readmission ratios. Am J Med. 2017;130(4):e153-e155. https://doi.org/10.1016/j.amjmed.2016.08.047
10. Beck AF, Moncrief T, Huang B, et al. Inequalities in neighborhood child asthma admission rates and underlying community characteristics in one US county. J Pediatr. 2013;163(2):574-580.e1. https://doi.org/10.1016/j.jpeds.2013.01.064
11. Everett E, Mathioudakis N. Association of area deprivation and diabetic ketoacidosis readmissions: comparative risk analysis of adults vs children with type 1 diabetes. J Clin Endocrinol Metab. 2019;104(8):3473-3480. https://doi.org/10.1210/jc.2018-02232
12. U.S. Census Bureau. QuickFacts: Hamilton County, Ohio. Accessed March 2, 2020. https://www.census.gov/quickfacts/hamiltoncountyohio
13. Witsch M, Kosteria I, Kordonouri O, et al. Possibilities and challenges of a large international benchmarking in pediatric diabetology—the SWEET experience. Pediatr Diabetes. 2016;17(S23):7-15. https://doi.org/10.1111/pedi.12432
14. U.S. Census Bureau. Glossary. Accessed April 22, 2021. https://www.census.gov/programs-surveys/geography/about/glossary.html
15. U.S. Census Bureau. Geographic areas reference manual. Chapter 10: Census tracts and block numbering areas. Accessed April 22, 2021. https://www.census.gov/programs-surveys/geography/guidance/geographic-areas-reference-manual.html
16. Krieger N, Chen JT, Waterman PD, Rehkopf DH, Subramanian SV. Painting a truer picture of US socioeconomic and racial/ethnic health inequalities: The Public Health Disparities Geocoding Project. Am J Public Health. 2005;95(2):312-323. https://doi.org/10.2105/AJPH.2003.032482
17. Kitabchi AE, Umpierrez GE, Murphy MB, et al. Management of hyperglycemic crises in patients with diabetes. Diabetes Care. 2001;24(1):131-153. https://doi.org/10.2337/diacare.24.1.131
18. Lawson S, Redel JM, Smego A, et al. Assessment of a day hospital management program for children with type 1 diabetes. JAMA Netw Open. 2020;3(3):e200347. https://doi.org/10.1001/jamanetworkopen.2020.0347
19. Andrist E, Riley CL, Brokamp C, Taylor S, Beck AF. Neighborhood poverty and pediatric intensive care use. Pediatrics. 2019;144(6):e20190748. https://doi.org/10.1542/peds.2019-0748
20. Govan L, Maietti E, Torsney B, et al. The effect of deprivation and HbA1c on admission to hospital for diabetic ketoacidosis in type 1 diabetes. Diabetologia. 2012;55(9):2356-2360. https://doi.org/10.1007/s00125-012-2601-6
21. U.S. Department of Health and Human Services. Healthy People 2030—Social Determinants of Health. Accessed May 13, 2021. https://health.gov/healthypeople/objectives-and-data/social-determinants-health
22. Berkowitz SA, Karter AJ, Corbie-Smith G, et al. Food insecurity, food “deserts,” and glycemic control in patients with diabetes: a longitudinal analysis. Diabetes Care. 2018;41(6):1188-1195. https://doi.org/10.2337/dc17-1981
23. Nguyen TM, Mason KJ, Sanders CG, Yazdani P, Heptulla RA. Targeting blood glucose management in school improves glycemic control in children with poorly controlled type 1 diabetes mellitus. J Pediatr. 2008;153(4):575-578. https://doi.org/10.1016/j.jpeds.2008.04.066
24. Izquierdo R, Morin PC, Bratt K, et al. School-centered telemedicine for children with type 1 diabetes mellitus. J Pediatr. 2009;155(3):374-379. https://doi.org/10.1016/j.jpeds.2009.03.014
25. Council on Community Pediatrics and Committee on Native American Child Health. Policy statement—health equity and children’s rights. Pediatrics. 2010;125(4):838-849. https://doi.org/10.1542/peds.2010-0235
26. Braveman P. What are health disparities and health equity? We need to be clear. Public Health Rep. 2014;129(suppl 2):5-8.
27. Palmas W, March D, Darakjy S, et al. Community health worker interventions to improve glycemic control in people with diabetes: a systematic review and meta-analysis. J Gen Intern Med. 2015;30(7):1004-1012. https://doi.org/10.1007/s11606-015-3247-0
28. Lipman TH, Smith JA, Hawkes CP. Community health workers and the care of children with type 1 diabetes. J Pediatr Nurs. 2019;49:111-112. https://doi.org/10.1016/j.pedn.2019.08.014
29. Bergenstal RM, Gal RL, Connor CG, et al. Racial differences in the relationship of glucose concentrations and hemoglobin A1c levels. Ann Intern Med. 2017;167(2):95-102. https://doi.org/10.7326/M16-2596
30. Agarwal S, Kanapka LG, Raymond JK, et al. Racial-ethnic inequity in young adults with type 1 diabetes. J Clin Endocrinol Metab. 2020;105(8):e2960-e2969. https://doi.org/10.1210/clinem/dgaa236
31. Addala A, Auzanneau M, Miller K, et al. A decade of disparities in diabetes technology use and HbA1c in pediatric type 1 diabetes: a transatlantic comparison. Diabetes Care. 2021;44(1):133-140. https://doi.org/10.2337/dc20-0257
32. Lipman TH, Smith JA, Patil O, Willi SM, Hawkes CP. Racial disparities in treatment and outcomes of children with type 1 diabetes. Pediatr Diabetes. 2021;22(2):241-248. https://doi.org/10.1111/pedi.13139
33. Boyd RW, Lindo EG, Weeks LD, McLemore MR. On racism: a new standard for publishing on racial health inequities. Health Affairs. Accessed July 9, 2020. https://www.healthaffairs.org/do/10.1377/hblog20200630.939347/full/
34. Jones CP. Levels of racism: a theoretic framework and a gardener’s tale. Am J Public Health. 2000;90(8):1212-1215. https://doi.org/10.2105/AJPH.90.8.1212
35. Jacoby SF, Dong B, Beard JH, Wiebe DJ, Morrison CN. The enduring impact of historical and structural racism on urban violence in Philadelphia. Soc Sci Med. 2018;199:87-95. https://doi.org/10.1016/j.socscimed.2017.05.038
36. Bailey ZD, Krieger N, Agénor M, Graves J, Linos N, Bassett MT. Structural racism and health inequities in the USA: evidence and interventions. Lancet. 2017;389(10077):1453-1463. https://doi.org/10.1016/S0140-6736(17)30569-X
37. Reardon SF, Fox L, Townsend J. Neighborhood income composition by household race and income, 1990–2009. Ann Am Acad Pol Soc Sci. 2015;660(1):78-97. https://doi.org/10.1177/0002716215576104
38. Cooper LA, Roter DL, Carson KA, et al. The associations of clinicians’ implicit attitudes about race with medical visit communication and patient ratings of interpersonal care. Am J Public Health. 2012;102(5):979-987. https://doi.org/10.2105/AJPH.2011.300558
39. Lawton J, Waugh N, Noyes K, et al. Improving communication and recall of information in paediatric diabetes consultations: a qualitative study of parents’ experiences and views. BMC Pediatr. 2015;15:67. https://doi.org/10.1186/s12887-015-0388-6
40. Brokamp C, Beck AF, Goyal NK, Ryan P, Greenberg JM, Hall ES. Material community deprivation and hospital utilization during the first year of life: an urban population-based cohort study. Ann Epidemiol. 2019;30:37-43. https://doi.org/10.1016/j.annepidem.2018.11.008
Type 1 diabetes mellitus (T1D) is a common chronic condition of childhood. Its incidence has risen steadily over the past two decades.1 Treatment requires complex daily tasks, including blood glucose monitoring and insulin administration. The potential long-term complications of T1D—kidney failure, retinopathy, cardiovascular disease, and death—are grave but can be attenuated with effective glycemic management.2 Still, less than 25% of youths aged 13 to 19 years achieve target hemoglobin A1c (HbA1c) levels.3
Diabetic ketoacidosis (DKA) is an acute, life-threatening complication of T1D associated with suboptimal glycemic management. In the United States, DKA hospitalizations increased during 2009-2014.4 One study found the average standardized cost of a DKA-related pediatric hospitalization exceeded $7000,5 an amount not including missed school days, parent/caregiver workdays, and social and family disruptions. Costs extend to psychological well-being, with patients reporting that they “keep thinking [DKA] may happen again.”6
The burden of T1D-related morbidity is not equitably distributed. Recent evidence suggests that racial/ethnic minorities and those with public insurance experience disproportionately high rates of DKA.7,8 Neighborhood socioeconomic measures, like poverty, add an important dimension illustrative of ecological conditions in which patients reside. These measures have been studied in relation to hospitalization rates for chronic conditions like asthma and heart failure.9,10 For example, one recent study found links between area-level poverty in the United States and the likelihood of readmissions for pediatric patients following an admission for DKA.11 We sought to build on this finding by investigating whether area-level poverty, which we measured as the census tract poverty rate, patient race, and insurance status were associated with the likelihood of initial DKA hospitalization and severity of DKA presentation.
METHODS
Design
We conducted a single-center, retrospective cohort study that examined data on youth with T1D extracted from the Cincinnati Children’s Hospital Medical Center (CCHMC) electronic medical record (EMR). CCHMC is an urban, tertiary-care, freestanding pediatric hospital, with near-complete market penetration in Hamilton County, Ohio, particularly for subspecialty care. The racial and ethnic breakdown of Hamilton County’s general population is 68% White, 27% Black/African American, 3% Asian, and 4% Hispanic or Latino (adds to more than 100% due to rounding).12 The CCHMC Institutional Review Board approved this study.
Study Population
We identified eligible patients through a clinical registry within the EMR, which includes all T1D patients seen at CCHMC within the preceding 24 months. Patients are added to this registry upon initial T1D diagnosis by a research nurse who evaluates autoantibody status and clinical presentation. All patients ≤18 years old who had T1D, were active on the registry, and had an address within Hamilton County as of December 31, 2017, were included. Those with type 2 diabetes mellitus or secondary causes of diabetes were excluded. We captured patients on the registry as of December 31, 2017, and then examined whether they had been hospitalized from January 1, 2011, to December 31, 2017.
Covariates
We extracted demographic and clinical data for patients within the T1D registry as of December 31, 2017, and, for those hospitalized, at the time of their admission. Specifically, we extracted date of birth (to calculate age at encounter), sex, and ethnicity. Age was treated as a continuous variable. We defined ethnicity as Latinx (inclusive of Hispanic) or non-Latinx. We calculated duration of T1D diagnosis for patients within the registry by taking the difference of the diabetes onset date and the end of the study period. We extracted whether registry patients had an insulin pump or a continuous glucose monitor (CGM). Hospitalized patients were identified as new-onset or established T1D by comparing their hospitalization with the T1D diagnosis onset date.
For the entire T1D registry, we also assessed a key clinical characteristic: a patient’s median HbA1c. We enumerated the median HbA1c of all patients’ medians within the calendar year 2017, consistent with the methodology of a large international T1D registry.13 Among the subset of patients who were hospitalized, we obtained the HbA1c value during or prior to hospitalization.
Exposures
We captured exposure variables from EMR documentation of patients’ address, race, and insurance status. Given the small regional population of Latinx patients, we did not include ethnicity as an exposure. We used the address and insurance status at the beginning of the study period for established T1D patients, or at the time of diagnosis for new-onset patients, for analyses related to the likelihood of DKA admission. We used the address at the time of hospitalization for analyses of DKA presentation severity. We geocoded home addresses using ArcGIS software (Version 10.5.1; Esri), successfully geocoding >95% to the street level and assigning patients to a corresponding census tract—a census-defined geography consisting of approximately 4000 people.14 Census tracts, when drawn after the decennial (every 10 years) census, are designed to be sociodemographically homogenous15 and have long been used in medical and public health research.16 We connected geocoded addresses to the census tract poverty rate, defined as the percentage of individuals within a tract living below the federal poverty level. For our analyses, we primarily treated census tract poverty as a continuous variable ranging from 0% to 100%. We visualized the distribution of census tract poverty across Hamilton County using a choropleth map (Figure, part A). We also grouped the registry population into quartiles, ordered by census tract poverty levels, to ease the graphical display for Figure, part B. We defined race as White, Black (inclusive of African American), or other. We categorized insurance as Medicaid/public or Non-Medicaid/private.
Outcomes
The primary outcome was a hospitalization for DKA during the study period. We identified eligible events by admission diagnosis of DKA (International Classification of Disease, 10th Revision, Clinical Modification, E13.10 or E10.10). Secondarily, we assessed admission severity for each patient’s first DKA hospitalization using initial pH from a venous blood gas and initial bicarbonate from the basic metabolic panel. These measures were chosen in accordance with the American Diabetes Association’s published classification of DKA severity, which uses pH, bicarbonate, and mental status.17 We defined the time for correction as the minutes from admission time until the anion gap was ≤12 or the bicarbonate was ≥18. We calculated total inpatient bed-days and pediatric intensive care unit (PICU) bed-days, and identified whether a patient was readmitted for DKA during the study period.
Statistical Analyses
We used descriptive statistics to characterize demographic and clinical information for patients within the T1D registry and for the hospitalized subset. We examined DKA severity data for all admitted patients by diagnosis status (new-onset T1D vs established). Associations between categorical outcomes were assessed using the Chi-square or Fisher exact test, and continuous outcomes were evaluated using the Mann-Whitney Rank Sum test.
We individually examined the effects of census tract poverty, race, and insurance on the odds of hospitalization through logistic regression. After confirming overlap and variability in census tract poverty rates by race and admission status (Appendix Table 1), we included these exposures in a multivariable model to capture their independent effects. Because the impact of census tract poverty, race, and insurance on hospitalization odds could vary depending on T1D diagnosis status, we conducted a sensitivity analysis by repeating the multivariable model with only established T1D patients.
Given that median HbA1c levels differed for T1D registry patients based on census tract poverty, race, and insurance, we used linear regression in a post-hoc analysis to evaluate associations between those exposures and median HbA1c. Age, gender, ethnicity, and duration of diabetes were not included in the models given that these variables did not differ by outcome variables. Diabetes technology—CGM and insulin pumps—was not included as a confounder because we hypothesized it mediated the effect of area-level poverty. For analyses, SigmaPlot (Version 14.0; SPSS Inc.) and R statistical software were used (The R Project for Statistical Computing).
RESULTS
A total of 439 patients were in the T1D registry and lived in Hamilton County as of December 31, 2017. Their demographic characteristics are listed in Table 1. Their median age was 14 years; 48% were female. The median poverty rate of the census tracts in which these youth lived was 11%. A total of 24.6% of patients identified as Black, 73.1% as White, and 2.3% as Hispanic; 35.8% were publicly insured. Patients had a median duration of T1D of 61 months (5 years, 1 month), with a median HbA1c (of all patients’ medians) of 8.7%. A total of 58.1% had a CGM, and 56% used an insulin pump.
Hospitalization Characteristics of Those in the T1D Registry
Approximately one-third of registry patients (n = 152) experienced ≥1 hospitalization for DKA during the study period (inclusive of new-onset and established diagnosis). Age, gender, ethnicity, and duration of T1D diagnosis were similar between those who experienced a hospitalization and those who did not. The median census tract poverty rate was higher among those who were hospitalized compared to those who were not (15% vs 8%, P < .01). Among hospitalized patients, 41% identified as Black; among all who were not hospitalized, 16% identified as Black (P < .01). Among all hospitalized patients, 56.6% were covered by public insurance, while 24.7% of non-hospitalized patients were covered by public insurance (P < .01). Hospitalized patients were more likely to have a higher median HbA1c (9.5% vs 8.4%, P < .01) and were significantly less likely to have a CGM or insulin pump (both P < .01). These associations were magnified among the roughly 10% of the T1D registry population (n = 42) who experienced ≥2 hospitalizations.
Figure, part A is a choropleth map depicting the distribution of poverty by census tract across Hamilton County. The map is complemented by part B of the Figure, which displays the T1D registry population split into poverty quartiles and each quartile’s DKA admission rate per T1D registry population. As census tract poverty increases, so too does the rate of DKA hospitalizations. There is an almost threefold difference between the hospitalization rate of the highest poverty quartile and that of the lowest.
Likelihood of Hospitalization
We examined the exposures of interest—census tract poverty, race, and insurance—and odds of hospitalization at a patient level using logistic regression models (Table 2). In the multivariable model that included these exposures, we found that for every 10% increase in the census tract poverty rate, the odds of being hospitalized for DKA increased by 22% (95% CI, 1.03-1.47). Race was not significantly associated with odds of DKA hospitalization in the multivariable model. Public insurance was associated with a 2.71-times higher odds of hospitalization compared to those with private insurance (95% CI, 1.62-4.55). Our sensitivity analysis of only those with established T1D diagnoses showed similar results to that of the entire T1D registry population.
Severity of DKA Presentation
A total of 152 registry patients were admitted; 89 patients had new-onset T1D, and 63 had an established T1D diagnosis. We examined presenting factors (initial pH, initial bicarbonate, HbA1c) and clinical characteristics (time to correction, inpatient bed-days, PICU bed-days) by census tract poverty, race, and insurance for all hospitalized patients. There were no significant differences in presenting factors or outcomes by census tract poverty or insurance. However, we did note certain differences by race. Indeed, though initial pH, bicarbonate, and time to correction did not meaningfully differ by race, Black patients had a longer length of stay than their White peers (Appendix Table 2; 3.06 vs 2.16 days, P < .01). We further examined this by diagnosis status, as newly diagnosed patients often stay longer for diabetes education.18 Black patients had a longer length of stay than White patients, regardless of whether they had new-onset (3.85 vs 2.99 days, P < .01) or established T1D (1.83 vs 0.97 days, P < .01). Additionally, we found that the HbA1c was significantly higher in Black versus White patients (12.4% vs 10.8%, P = .01). HbA1c was significantly different between established T1D patients identifying as Black and those identifying as White (11.7% vs 9.5%, P < .01); however, HbA1c did not differ by race for newly diagnosed patients (12.5% vs 13.0%, P = .63).
Median HbA1c of All T1D Registry Patients
Given the suggestion of HbA1c variability by exposure variables, we performed a post-hoc linear regression analysis. Table 3 displays the linear regression models assessing associations of census tract poverty, race, and insurance on median HbA1c for all T1D registry patients. In the multivariable model, census tract poverty was no longer associated with higher HbA1c levels (0.13, 95% CI, –0.01 to 0.26). However, Black patients continued to have significantly higher HbA1c levels than White patients (1.09% higher; 95% CI, 0.59-1.59). Also, those with public insurance had significantly higher HbA1c levels than those with private insurance (0.93% higher; 95% CI, 0.51-1.35).
DISCUSSION
Living in high poverty areas, identifying as Black, and having public insurance were each associated with a higher likelihood of hospitalization for DKA in an unadjusted model. When we examined these exposures together in a multivariable model, census tract poverty and insurance remained associated with a higher likelihood of hospitalization for DKA. Race—with a wide confidence interval—was no longer associated with a higher likelihood of hospitalization. The increased likelihood of hospitalization initially seen for Black patients may be because they are more likely to reside in high poverty areas and be on public insurance—inequities associated with structural racism.
These results mirror those of other studies that have found area-level poverty to be associated with higher rates of intensive care admissions and hospitalizations for conditions like asthma.10,19 Our findings are also similar to those of a previous study that found that area-level deprivation was associated with a greater likelihood of DKA readmissions in pediatric and adult patients, as well as an adult study that showed increased neighborhood deprivation was associated with higher odds of DKA hospitalization.11,20 Further examination of the mechanisms underlying DKA hospitalization is clearly warranted and would be informed by a deeper awareness of the social determinants of health—such as community context and the neighborhood/built environment21—and their links to racial inequities.
Neighborhood socioeconomic status, here measured as census tract poverty, is likely linked to hospitalization for DKA through contextual factors like food insecurity, limited access to supportive care (eg, presence of a school nurse who can co-manage T1D with the patient/family and medical team), and adverse environmental exposures.22-24 To improve the health of patients, prevent hospitalizations, and achieve health equity, we suggest that both individual factors and these contextual factors need to be evaluated and addressed through community-connected interventions.25,26 For example, interventions that deploy community health workers to navigate the complexities of health systems have been effective in reducing HbA1c levels in adults with type 2 diabetes mellitus27 and are beginning to be studied in pediatrics.28
Black patients had a higher median HbA1c compared to their White counterparts in the T1D registry. One study has previously shown that hemoglobin glycation biologically differed by around 0.5% in Black patients compared to White patients.29 Despite this purported biological difference, a greater difference in HbA1c—nearly 2 points—was seen in the univariate model, illustrating that contextual factors such as socioeconomic status and treatment patterns, like the use of diabetes technology, exceed this biological difference.30-32 Our multivariable results support the importance of these contextual factors, as the HbA1c difference decreased from 1.9 to 1.09 after census tract poverty and insurance were included.
Such differences by race also emerge from experiences of discrimination and bias. Thus, to improve outcomes and equity, we must understand and address racism and its many ill effects. Different levels of racism, such as structural or personally mediated racism, interact with social determinants of health in various ways.33,34 For example, redlining—racially discriminatory grading of neighborhoods’ creditworthiness in the 1930s—is an example of structural racism that continues to affect the health of patients today.35,36 Black families are more likely to live in areas with higher poverty, even after controlling for household income level.37 The interaction between race and poverty is complex given these historical underpinnings of structural racism, as evidenced by race no longer being associated with an increased likelihood of DKA hospitalization in our multivariable analysis. The longer length of stay for Black patients despite similar presenting severity also exemplifies this complexity. For example, longer stays could result from explicit or implicit biases that lead providers to keep patients longer due to preconceived beliefs that the caregiver does not understand diabetes management.38 However, it also could be that the caregiver takes longer to complete diabetes education due to systemic barriers, such as work-related obligations during business hours when diabetes educators are present, or transportation and childcare needs.39 These barriers are often tied to socioeconomic status, making it more difficult for those in poverty to complete required education. We cannot conclude from our study the reasons for the difference in length of stay, just that differences exist. Moving forward, we suggest that design of interventions aimed at achieving health equity consider the complex interplay between health, healthcare systems, racism, and neighborhood context.
There were limitations to our study. First, given that this was an observational study, unmeasured confounders like patient or parental education and personal income could affect the strength of associations seen in our models. Second, although the CCHMC’s Diabetes Center treats nearly all children with T1D in Hamilton County, some patients, or hospitalizations at other centers, could have been missed. Third, the demographics of Hamilton County may not generalize to other diabetes centers. Fourth, although more granular data—such as census block groups or blocks—are available from the US Census Bureau, we chose census tracts as our unit of analysis to reduce sampling error that emerges from the use of such smaller geographies. Last, we measured census tract poverty rather than other contextual markers of one’s neighborhood, like vacant housing or the proportion of those receiving public benefits. However, these measures are often highly correlated with census tract poverty.40
CONCLUSION
Census tract poverty, race, and insurance were each associated with an increased likelihood of hospitalization for DKA. However, in a multivariable model, the effect of race was reduced so it was no longer significant, indicating that racial differences in DKA hospitalization are at least partially explained by differences in socioeconomic factors. The severity of DKA presentation did not differ by census tract poverty or insurance, although Black patients experienced differences in care despite similar markers of DKA severity. Addressing contextual factors—such as social determinants of health and racism—is warranted for future interventions that aim to eliminate equity gaps for T1D patients.
1. Mayer-Davis EJ, Lawrence JM, Dabelea D, et al. Incidence trends of type 1 and type 2 diabetes among youths, 2002–2012. N Engl J Med. 2017;376(15):1419-1429. https://doi.org/10.1056/NEJMoa1610187
2. Writing Group for the DCCT/EDIC Research Group, Orchard TJ, Nathan DM, et al. Association between 7 years of intensive treatment of type 1 diabetes and long-term mortality. JAMA. 2015;313(1):45-53. https://doi.org/10.1001/jama.2014.16107
3. Wood JR, Miller KM, Maahs DM, et al. Most youth with type 1 diabetes in the T1D Exchange Clinic Registry do not meet American Diabetes Association or International Society for Pediatric and Adolescent Diabetes clinical guidelines. Diabetes Care. 2013;36(7):2035-2037. https://doi.org/10.2337/dc12-1959
4. Benoit SR. Trends in diabetic ketoacidosis hospitalizations and in-hospital mortality—United States, 2000–2014. MMWR Morb Mortal Wkly Rep. 2018;67(12):362-365. https://doi.org/10.15585/mmwr.mm6712a3
5. Tieder JS, McLeod L, Keren R, et al. Variation in resource use and readmission for diabetic ketoacidosis in children’s hospitals. Pediatrics. 2013;132(2):229-236. https://doi.org/10.1542/peds.2013-0359
6. Moffett MA, Buckingham JC, Baker CR, Hawthorne G, Leech NJ. Patients’ experience of admission to hospital with diabetic ketoacidosis and its psychological impact: an exploratory qualitative study. Practical Diabetes. 2013;30(5):203-207. https://doi.org/10.1002/pdi.1777
7. Maahs DM, Hermann JM, Holman N, et al. Rates of diabetic ketoacidosis: international comparison with 49,859 pediatric patients with type 1 diabetes from England, Wales, the U.S., Austria, and Germany. Diabetes Care. 2015;38(10):1876-1882. https://doi.org/10.2337/dc15-0780
8. Malik FS, Hall M, Mangione-Smith R, et al. Patient characteristics associated with differences in admission frequency for diabetic ketoacidosis in United States children’s hospitals. J Pediatr. 2016;171:104-110. https://doi.org/10.1016/j.jpeds.2015.12.015
9. Manickam RN, Mu Y, Kshirsagar AV, Bang H. Area-level poverty and excess hospital readmission ratios. Am J Med. 2017;130(4):e153-e155. https://doi.org/10.1016/j.amjmed.2016.08.047
10. Beck AF, Moncrief T, Huang B, et al. Inequalities in neighborhood child asthma admission rates and underlying community characteristics in one US county. J Pediatr. 2013;163(2):574-580.e1. https://doi.org/10.1016/j.jpeds.2013.01.064
11. Everett E, Mathioudakis N. Association of area deprivation and diabetic ketoacidosis readmissions: comparative risk analysis of adults vs children with type 1 diabetes. J Clin Endocrinol Metab. 2019;104(8):3473-3480. https://doi.org/10.1210/jc.2018-02232
12. U.S. Census Bureau. QuickFacts: Hamilton County, Ohio. Accessed March 2, 2020. https://www.census.gov/quickfacts/hamiltoncountyohio
13. Witsch M, Kosteria I, Kordonouri O, et al. Possibilities and challenges of a large international benchmarking in pediatric diabetology—the SWEET experience. Pediatr Diabetes. 2016;17(S23):7-15. https://doi.org/10.1111/pedi.12432
14. U.S. Census Bureau. Glossary. Accessed April 22, 2021. https://www.census.gov/programs-surveys/geography/about/glossary.html
15. U.S. Census Bureau. Geographic areas reference manual. Chapter 10: Census tracts and block numbering areas. Accessed April 22, 2021. https://www.census.gov/programs-surveys/geography/guidance/geographic-areas-reference-manual.html
16. Krieger N, Chen JT, Waterman PD, Rehkopf DH, Subramanian SV. Painting a truer picture of US socioeconomic and racial/ethnic health inequalities: The Public Health Disparities Geocoding Project. Am J Public Health. 2005;95(2):312-323. https://doi.org/10.2105/AJPH.2003.032482
17. Kitabchi AE, Umpierrez GE, Murphy MB, et al. Management of hyperglycemic crises in patients with diabetes. Diabetes Care. 2001;24(1):131-153. https://doi.org/10.2337/diacare.24.1.131
18. Lawson S, Redel JM, Smego A, et al. Assessment of a day hospital management program for children with type 1 diabetes. JAMA Netw Open. 2020;3(3):e200347. https://doi.org/10.1001/jamanetworkopen.2020.0347
19. Andrist E, Riley CL, Brokamp C, Taylor S, Beck AF. Neighborhood poverty and pediatric intensive care use. Pediatrics. 2019;144(6):e20190748. https://doi.org/10.1542/peds.2019-0748
20. Govan L, Maietti E, Torsney B, et al. The effect of deprivation and HbA1c on admission to hospital for diabetic ketoacidosis in type 1 diabetes. Diabetologia. 2012;55(9):2356-2360. https://doi.org/10.1007/s00125-012-2601-6
21. U.S. Department of Health and Human Services. Healthy People 2030—Social Determinants of Health. Accessed May 13, 2021. https://health.gov/healthypeople/objectives-and-data/social-determinants-health
22. Berkowitz SA, Karter AJ, Corbie-Smith G, et al. Food insecurity, food “deserts,” and glycemic control in patients with diabetes: a longitudinal analysis. Diabetes Care. 2018;41(6):1188-1195. https://doi.org/10.2337/dc17-1981
23. Nguyen TM, Mason KJ, Sanders CG, Yazdani P, Heptulla RA. Targeting blood glucose management in school improves glycemic control in children with poorly controlled type 1 diabetes mellitus. J Pediatr. 2008;153(4):575-578. https://doi.org/10.1016/j.jpeds.2008.04.066
24. Izquierdo R, Morin PC, Bratt K, et al. School-centered telemedicine for children with type 1 diabetes mellitus. J Pediatr. 2009;155(3):374-379. https://doi.org/10.1016/j.jpeds.2009.03.014
25. Council on Community Pediatrics and Committee on Native American Child Health. Policy statement—health equity and children’s rights. Pediatrics. 2010;125(4):838-849. https://doi.org/10.1542/peds.2010-0235
26. Braveman P. What are health disparities and health equity? We need to be clear. Public Health Rep. 2014;129(suppl 2):5-8.
27. Palmas W, March D, Darakjy S, et al. Community health worker interventions to improve glycemic control in people with diabetes: a systematic review and meta-analysis. J Gen Intern Med. 2015;30(7):1004-1012. https://doi.org/10.1007/s11606-015-3247-0
28. Lipman TH, Smith JA, Hawkes CP. Community health workers and the care of children with type 1 diabetes. J Pediatr Nurs. 2019;49:111-112. https://doi.org/10.1016/j.pedn.2019.08.014
29. Bergenstal RM, Gal RL, Connor CG, et al. Racial differences in the relationship of glucose concentrations and hemoglobin A1c levels. Ann Intern Med. 2017;167(2):95-102. https://doi.org/10.7326/M16-2596
30. Agarwal S, Kanapka LG, Raymond JK, et al. Racial-ethnic inequity in young adults with type 1 diabetes. J Clin Endocrinol Metab. 2020;105(8):e2960-e2969. https://doi.org/10.1210/clinem/dgaa236
31. Addala A, Auzanneau M, Miller K, et al. A decade of disparities in diabetes technology use and HbA1c in pediatric type 1 diabetes: a transatlantic comparison. Diabetes Care. 2021;44(1):133-140. https://doi.org/10.2337/dc20-0257
32. Lipman TH, Smith JA, Patil O, Willi SM, Hawkes CP. Racial disparities in treatment and outcomes of children with type 1 diabetes. Pediatr Diabetes. 2021;22(2):241-248. https://doi.org/10.1111/pedi.13139
33. Boyd RW, Lindo EG, Weeks LD, McLemore MR. On racism: a new standard for publishing on racial health inequities. Health Affairs. Accessed July 9, 2020. https://www.healthaffairs.org/do/10.1377/hblog20200630.939347/full/
34. Jones CP. Levels of racism: a theoretic framework and a gardener’s tale. Am J Public Health. 2000;90(8):1212-1215. https://doi.org/10.2105/AJPH.90.8.1212
35. Jacoby SF, Dong B, Beard JH, Wiebe DJ, Morrison CN. The enduring impact of historical and structural racism on urban violence in Philadelphia. Soc Sci Med. 2018;199:87-95. https://doi.org/10.1016/j.socscimed.2017.05.038
36. Bailey ZD, Krieger N, Agénor M, Graves J, Linos N, Bassett MT. Structural racism and health inequities in the USA: evidence and interventions. Lancet. 2017;389(10077):1453-1463. https://doi.org/10.1016/S0140-6736(17)30569-X
37. Reardon SF, Fox L, Townsend J. Neighborhood income composition by household race and income, 1990–2009. Ann Am Acad Pol Soc Sci. 2015;660(1):78-97. https://doi.org/10.1177/0002716215576104
38. Cooper LA, Roter DL, Carson KA, et al. The associations of clinicians’ implicit attitudes about race with medical visit communication and patient ratings of interpersonal care. Am J Public Health. 2012;102(5):979-987. https://doi.org/10.2105/AJPH.2011.300558
39. Lawton J, Waugh N, Noyes K, et al. Improving communication and recall of information in paediatric diabetes consultations: a qualitative study of parents’ experiences and views. BMC Pediatr. 2015;15:67. https://doi.org/10.1186/s12887-015-0388-6
40. Brokamp C, Beck AF, Goyal NK, Ryan P, Greenberg JM, Hall ES. Material community deprivation and hospital utilization during the first year of life: an urban population-based cohort study. Ann Epidemiol. 2019;30:37-43. https://doi.org/10.1016/j.annepidem.2018.11.008
© 2021 Society of Hospital Medicine
Equitable Post-COVID-19 Care: A Practical Framework to Integrate Health Equity in Diabetes Management
From T1D Exchange, Boston, MA (Dr. Ebekozien, Dr. Odugbesan, and Nicole Rioles); Barbara Davis Center, University of Colorado, Boulder, CO (Dr. Majidi); Cincinnati Children’s Hospital Medical Center, Cincinnati, OH (Dr. Jones); and Nationwide Children’s Hospital, Columbus, OH (Dr. Kamboj)
Health equity has been described as the opportunity for all persons to obtain their highest level of health possible.1 Unfortunately, even with advances in technology and care practices, disparities persist in health care outcomes. Disparities in prevalence, prognosis, and outcomes still exist in diabetes management.2 Non-Hispanic Black and/or Hispanic populations are more likely to have worse glycemic control,3,4 to encounter more barriers in access to care,5 and to have higher levels of acute complications,4 and to use advanced technologies less frequently.4 Diabetes is one of the preexisting conditions that increase morbidity and mortality in COVID-19.6,7 Unfortunately, adverse outcomes from COVID-19 also disproportionately impact a specific vulnerable population.8,9 The urgent transition to managing diabetes remotely during the COVID-19 pandemic may exacerbate long-term inequities because some vulnerable patients might not have access to technology devices necessary for effective remote management.
Here, we describe how quality improvement (QI) tools and principles can be adapted into a framework for advancing health equity. Specifically, we describe a 10-step framework that may be applied in diabetes care management to achieve improvement, using a hypothetical example of increasing use of continuous glucose monitors (CGMs) among patients with type 1 diabetes mellitus.10 This framework was developed to address the literature gap on practical ways health care providers can address inequities using QI principles, and was implemented by 1 of the authors at a local public health department.11 The framework’s iterative and comprehensive design makes it ideal for addressing inequities in chronic diseases like diabetes, which have multiple root causes with no easy solutions. The improvement program pilot received a national model practice award.11,12
10-Step Framework
Step 1: Review program/project baseline data for existing disparities. Diabetes programs and routine QI processes encourage existing data review to determine how effective the current system is working and if the existing process has a predictable pattern.13,14 Our equity-revised framework proposes a more in-depth review to stratify baseline data based on factors that might contribute to inequities, including race, age, income levels, ethnicity, language, sexual orientation, insurance type, and zip code. This process will identify patients not served or unfairly impacted due to socioeconomic factors. For example, using the hypothetical example of improving CGM use, a team completes a preliminary data review and determines that baseline CGM use is 30% in the clinic population. However, in a review to assess for disparities, they also identify that patients on public insurance have a significantly lower CGM uptake of only 15%.
Step 2: Build an equitable project team, including patients with lived experiences. Routine projects typically have clinicians, administrative staff, and analytic staff as members of their team. In a post-COVID-19 world, every team needs to learn directly from people impacted and share decision-making power. The traditional approach to receiving feedback has generally been to collect responses using surveys or focus groups. We propose that individuals/families who are disproportionately impacted be included as active members on QI teams. For example, in the hypothetical example of the CGM project, team members would include patients with type 1 diabetes who are on public insurance and their families.
Step 3: Develop equity-focused goals. The traditional program involves the development of aims that are SMART (specific, measurable, achievable, realistic, time-bound).15 The proposed framework encourages the inclusion of equity-revised goals (SMARTer) using insights from Steps 1 and 2. For example, your typical smart goal might be to increase the percentage of patients using CGM by 20% in 6 months, while a SMARTer goal would be to increase the proportion of patients using CGM by 20% and reduce the disparities among public and private insurance patients by 30% in 6 months.
Step 4: Identify inequitable processes/pathways. Traditional QI programs might use a process map or flow diagram to depict the current state of a process visually.16 For example, in Figure 1, the process map diagram depicts some differences in the process for patients with public insurance as opposed to those with private insurance. The framework also advocates for using visual tools like process maps to depict how there might be inequitable pathways in a system. Visually identifying inequitable processes/pathways can help a team see barriers, address challenges, and pilot innovative solutions.

Step 5: Identify how socioeconomic factors are contributing to the current outcome. A good understanding of factors that contribute to the problem is an essential part of finding fundamental solutions. The fishbone diagram16 is a visualization tool used to identify contributing factors. When investigating contributing factors, it is commonplace to identify factors that fit into 1 of 5 categories: people, process, place, product, and policies (5 Ps). An equity-focused process will include equity as a new major factor category, and the socioeconomic impacts that contribute to inequities will be brainstormed and visually represented. For example, in the hypothetical CGM improvement example, an equity contributing factor is extensive CGM application paperwork for patients on public insurance as compared to those on private insurance. Figure 2 shows equity integrated into a fishbone diagram.

Step 6: Brainstorm possible improvements. Potential improvement ideas for the hypothetical CGM example might include redesigning the existing workflow, piloting CGM educational classes, and using a CGM barrier assessment tool to identify and address barriers to adoption.
Step 7: Use the decision matrix with equity as a criterion to prioritize improvement ideas. Decision matrix15 is a great tool that is frequently used to help teams prioritize potential ideas. Project team members must decide what criteria are important in prioritizing ideas to implement. Common criteria include implementation cost, time, and resources, but in addition to the common criteria, the team can specify ”impact on equity” as one of their criteria, alongside other standard criteria like impact.
Step 8: Test one small change at a time. This step is consistent with other traditional improvement models using the Plan, Do, Study, Act (PDSA) model for improvement.17 During this phase, the team should make predictions on the expected impact of the intervention on outcomes. For example, in the hypothetical example, the team predicts that testing and expanding CGM classes will reduce disparities among public versus private health insurance users by 5% and increase overall CGM uptake by 10%.
Step 9: Measure and compare results with predictions to identify inequitable practices or consequences. After each test of change, the team should review the results, including implementation cost considerations, and compare them to the predictions in the earlier step. The team should also document the potential reasons why their predictions were correct or inaccurate, and whether there were any unforeseen outcomes from the intervention.
Step 10: Celebrate small wins and repeat the process. Making fundamental and equitable changes takes time. This framework aimed at undoing inequities, particularly those inequities that have been amplified by the COVID-19 pandemic, is iterative and ongoing.18,19 Not every test of change will impact the outcome or reduce inequity, but over time, each change will impact the next, generating sustainable effects.
Conclusion
There are ongoing studies examining the adverse outcomes and potential health inequities for patients with diabetes impacted by COVID-19.20 Health care providers need to plan for post-COVID-19 care, keeping in mind that the pandemic might worsen already existing health disparities in diabetes management.3,4,21 This work will involve an intentional approach to address structural and systemic racism.22 Therefore, the work of building health equity solutions must be rooted in racial justice, economic equity, and equitable access to health care and education.
Initiatives like this are currently being funded through foundation grants as well as state and federal research or program grants. Regional and national payors, including the Centers for Medicare & Medicaid Services, are currently piloting long-term sustainable funding models through programs like accountable care organizations and the Accountable Health Communities Model.23
Health systems can successfully address health equity and racial justice, using a framework as described above, to identify determinants of health, develop policies to expand access to care for the most vulnerable patients, distribute decision-making power, and train staff by naming structural racism as a driver of health inequities.
Acknowledgment: The authors acknowledge the contributions of patients, families, diabetes care teams, and collaborators within the T1D Exchange Quality Improvement Collaborative, who continually seek to improve care and outcomes for people living with diabetes.
Corresponding author: Osagie Ebekozien, MD, 11 Avenue De La Fayette, Boston, MA 02115; oebekozien@t1dexchange.org.
Financial disclosures: None.
Funding: T1D Exchange QI Collaborative is funded by The Leona M. and Harry B. Helmsley Charitable Trust. No specific funding was received for this manuscript or the development of this framework.
Keywords: type 1 diabetes; quality improvement; QI framework; racial justice; health disparities.
1. American Public Health Association Health Equity web site. https://www.apha.org/topics-and-issues/health-equity. Accessed June 4, 2020.
2. Lado J, Lipman T. Racial and ethnic disparities in the incidence, treatment, and outcomes of youth with type 1 diabetes. Endocrinol Metab Clin North Am. 2016;45:453-461.
3. Kahkoska AR, Shay CM, Crandell J, et al. Association of race and ethnicity with glycemic control and hemoglobin A1c levels in youth with type 1 diabetes. JAMA Netw Open. 2018;1:e181851.
4. Willi SM, Miller KM, DiMeglio LA, et al; T1D Exchange Clinic Network. Racial-ethnic disparities in management and outcomes among children with type 1 diabetes. Pediatrics. 2015;135:424-434.
5. Valenzuela JM, Seid M, Waitzfelder B, et al. Prevalence of and disparities in barriers to care experienced by youth with type 1 diabetes. J Pediatr. 2014;164:1369-1375.
6. Hussain A, Bhowmik B, do Vale Moreira NC. COVID-19 and diabetes: Knowledge in progress. Diabetes Res Clin Pract. 2020;162:108142.
7. Bhatraju PK, Ghassemieh BJ, Nichols M, et al. Covid-19 in critically ill patients in the Seattle Region - case series. N Engl J Med. 2020;382:2012-2022.
8. Laurencin CT, McClinton A. The COVID-19 pandemic: a call to action to identify and address racial and ethnic disparities. J Racial Ethn Health Disparities. 2020;7:398-402.
9. Shah M, Sachdeva M, Dodiuk-Gad RP. COVID-19 and racial disparities. J Am Acad Dermatol. 2020;83:e35.
10. Ebekozien O, Rioles N, DeSalvo D, et al. Improving continuous glucose monitoring (CGM) use across national centers: results from the T1D Exchange Quality Improvement Collaborative (T1DX-QI). Diabetes. 2020;69(Supplement 1):145-LB.
11. Ebekozien O. QI methodology to address health equity. Presented at American Society of Quality BOSCON 2018; Boston, MA; March 19 and 20, 2018.
12. 2019 Model Practice Award, Building A Culture of Improvement. National Association of County and City Health Officials web site. www.naccho.org/membership/awards/model-practices. Accessed June 4, 2020.
13. Nuckols TK, Keeler E, Anderson LJ, et al. Economic evaluation of quality improvement interventions designed to improve glycemic control in diabetes: a systematic review and weighted regression analysis. Diabetes Care. 2018;41:985‐993.
14. Rossi MC, Nicolucci A, Arcangeli A, et al. Baseline quality-of-care data from a quality-improvement program implemented by a network of diabetes outpatient clinics. Diabetes Care. 2008;31:2166‐2168.
15. McQuillan RF, Silver SA, Harel Z, et al. How to measure and interpret quality improvement data. Clin J Am Soc Nephrol. 2016;11:908-914.
16. Siddiqi FS. Quality improvement in diabetes care: time for us to step up? Can J Diabetes. 2019;43:233.
17. Taylor MJ, McNicholas C, Nicolay C, et al. Systematic review of the application of the plan-do-study-act method to improve quality in healthcare. BMJ Qual Saf. 2014;23:290‐298.
18. Ferdinand KC, Nasser SA. African American COVID-19 mortality: a sentinel event. J Am Coll Cardiol. 2020;75:2746-2748..
19. Muniyappa R, Gubbi S. COVID-19 pandemic, coronaviruses, and diabetes mellitus. Am J Physiol Endocrinol Metab. 2020;318:E736-E741.
20. Ebekozien OA, Noor N, Gallagher MP, Alonso GT. Type 1 diabetes and COVID-19: preliminary findings from a multicenter surveillance study in the U.S. Diabetes Care. 2020;43:e83-e85.
21. Majidi S, Ebekozien O, Noor N, et al. Inequities in health outcomes among patients in the T1D Exchange-QI Collaborative. Diabetes. 2020;69(Supplement 1):1220-P. https://doi.org/10.2337/ db20-1220.-P.
22. Williams DR, Mohammed SA. Discrimination and racial disparities in health: evidence and needed research. J Behav Med. 2009;32:20-47.
23. Centers for Medicare & Medicaid Services. Accountable Health Communities Model. CMS.gov web site. https://innovation.cms.gov/innovation-models/ahcm. Accessed October 10, 2020.
From T1D Exchange, Boston, MA (Dr. Ebekozien, Dr. Odugbesan, and Nicole Rioles); Barbara Davis Center, University of Colorado, Boulder, CO (Dr. Majidi); Cincinnati Children’s Hospital Medical Center, Cincinnati, OH (Dr. Jones); and Nationwide Children’s Hospital, Columbus, OH (Dr. Kamboj)
Health equity has been described as the opportunity for all persons to obtain their highest level of health possible.1 Unfortunately, even with advances in technology and care practices, disparities persist in health care outcomes. Disparities in prevalence, prognosis, and outcomes still exist in diabetes management.2 Non-Hispanic Black and/or Hispanic populations are more likely to have worse glycemic control,3,4 to encounter more barriers in access to care,5 and to have higher levels of acute complications,4 and to use advanced technologies less frequently.4 Diabetes is one of the preexisting conditions that increase morbidity and mortality in COVID-19.6,7 Unfortunately, adverse outcomes from COVID-19 also disproportionately impact a specific vulnerable population.8,9 The urgent transition to managing diabetes remotely during the COVID-19 pandemic may exacerbate long-term inequities because some vulnerable patients might not have access to technology devices necessary for effective remote management.
Here, we describe how quality improvement (QI) tools and principles can be adapted into a framework for advancing health equity. Specifically, we describe a 10-step framework that may be applied in diabetes care management to achieve improvement, using a hypothetical example of increasing use of continuous glucose monitors (CGMs) among patients with type 1 diabetes mellitus.10 This framework was developed to address the literature gap on practical ways health care providers can address inequities using QI principles, and was implemented by 1 of the authors at a local public health department.11 The framework’s iterative and comprehensive design makes it ideal for addressing inequities in chronic diseases like diabetes, which have multiple root causes with no easy solutions. The improvement program pilot received a national model practice award.11,12
10-Step Framework
Step 1: Review program/project baseline data for existing disparities. Diabetes programs and routine QI processes encourage existing data review to determine how effective the current system is working and if the existing process has a predictable pattern.13,14 Our equity-revised framework proposes a more in-depth review to stratify baseline data based on factors that might contribute to inequities, including race, age, income levels, ethnicity, language, sexual orientation, insurance type, and zip code. This process will identify patients not served or unfairly impacted due to socioeconomic factors. For example, using the hypothetical example of improving CGM use, a team completes a preliminary data review and determines that baseline CGM use is 30% in the clinic population. However, in a review to assess for disparities, they also identify that patients on public insurance have a significantly lower CGM uptake of only 15%.
Step 2: Build an equitable project team, including patients with lived experiences. Routine projects typically have clinicians, administrative staff, and analytic staff as members of their team. In a post-COVID-19 world, every team needs to learn directly from people impacted and share decision-making power. The traditional approach to receiving feedback has generally been to collect responses using surveys or focus groups. We propose that individuals/families who are disproportionately impacted be included as active members on QI teams. For example, in the hypothetical example of the CGM project, team members would include patients with type 1 diabetes who are on public insurance and their families.
Step 3: Develop equity-focused goals. The traditional program involves the development of aims that are SMART (specific, measurable, achievable, realistic, time-bound).15 The proposed framework encourages the inclusion of equity-revised goals (SMARTer) using insights from Steps 1 and 2. For example, your typical smart goal might be to increase the percentage of patients using CGM by 20% in 6 months, while a SMARTer goal would be to increase the proportion of patients using CGM by 20% and reduce the disparities among public and private insurance patients by 30% in 6 months.
Step 4: Identify inequitable processes/pathways. Traditional QI programs might use a process map or flow diagram to depict the current state of a process visually.16 For example, in Figure 1, the process map diagram depicts some differences in the process for patients with public insurance as opposed to those with private insurance. The framework also advocates for using visual tools like process maps to depict how there might be inequitable pathways in a system. Visually identifying inequitable processes/pathways can help a team see barriers, address challenges, and pilot innovative solutions.
Step 5: Identify how socioeconomic factors are contributing to the current outcome. A good understanding of factors that contribute to the problem is an essential part of finding fundamental solutions. The fishbone diagram16 is a visualization tool used to identify contributing factors. When investigating contributing factors, it is commonplace to identify factors that fit into 1 of 5 categories: people, process, place, product, and policies (5 Ps). An equity-focused process will include equity as a new major factor category, and the socioeconomic impacts that contribute to inequities will be brainstormed and visually represented. For example, in the hypothetical CGM improvement example, an equity contributing factor is extensive CGM application paperwork for patients on public insurance as compared to those on private insurance. Figure 2 shows equity integrated into a fishbone diagram.
Step 6: Brainstorm possible improvements. Potential improvement ideas for the hypothetical CGM example might include redesigning the existing workflow, piloting CGM educational classes, and using a CGM barrier assessment tool to identify and address barriers to adoption.
Step 7: Use the decision matrix with equity as a criterion to prioritize improvement ideas. Decision matrix15 is a great tool that is frequently used to help teams prioritize potential ideas. Project team members must decide what criteria are important in prioritizing ideas to implement. Common criteria include implementation cost, time, and resources, but in addition to the common criteria, the team can specify ”impact on equity” as one of their criteria, alongside other standard criteria like impact.
Step 8: Test one small change at a time. This step is consistent with other traditional improvement models using the Plan, Do, Study, Act (PDSA) model for improvement.17 During this phase, the team should make predictions on the expected impact of the intervention on outcomes. For example, in the hypothetical example, the team predicts that testing and expanding CGM classes will reduce disparities among public versus private health insurance users by 5% and increase overall CGM uptake by 10%.
Step 9: Measure and compare results with predictions to identify inequitable practices or consequences. After each test of change, the team should review the results, including implementation cost considerations, and compare them to the predictions in the earlier step. The team should also document the potential reasons why their predictions were correct or inaccurate, and whether there were any unforeseen outcomes from the intervention.
Step 10: Celebrate small wins and repeat the process. Making fundamental and equitable changes takes time. This framework aimed at undoing inequities, particularly those inequities that have been amplified by the COVID-19 pandemic, is iterative and ongoing.18,19 Not every test of change will impact the outcome or reduce inequity, but over time, each change will impact the next, generating sustainable effects.
Conclusion
There are ongoing studies examining the adverse outcomes and potential health inequities for patients with diabetes impacted by COVID-19.20 Health care providers need to plan for post-COVID-19 care, keeping in mind that the pandemic might worsen already existing health disparities in diabetes management.3,4,21 This work will involve an intentional approach to address structural and systemic racism.22 Therefore, the work of building health equity solutions must be rooted in racial justice, economic equity, and equitable access to health care and education.
Initiatives like this are currently being funded through foundation grants as well as state and federal research or program grants. Regional and national payors, including the Centers for Medicare & Medicaid Services, are currently piloting long-term sustainable funding models through programs like accountable care organizations and the Accountable Health Communities Model.23
Health systems can successfully address health equity and racial justice, using a framework as described above, to identify determinants of health, develop policies to expand access to care for the most vulnerable patients, distribute decision-making power, and train staff by naming structural racism as a driver of health inequities.
Acknowledgment: The authors acknowledge the contributions of patients, families, diabetes care teams, and collaborators within the T1D Exchange Quality Improvement Collaborative, who continually seek to improve care and outcomes for people living with diabetes.
Corresponding author: Osagie Ebekozien, MD, 11 Avenue De La Fayette, Boston, MA 02115; oebekozien@t1dexchange.org.
Financial disclosures: None.
Funding: T1D Exchange QI Collaborative is funded by The Leona M. and Harry B. Helmsley Charitable Trust. No specific funding was received for this manuscript or the development of this framework.
Keywords: type 1 diabetes; quality improvement; QI framework; racial justice; health disparities.
1. American Public Health Association Health Equity web site. https://www.apha.org/topics-and-issues/health-equity. Accessed June 4, 2020.
2. Lado J, Lipman T. Racial and ethnic disparities in the incidence, treatment, and outcomes of youth with type 1 diabetes. Endocrinol Metab Clin North Am. 2016;45:453-461.
3. Kahkoska AR, Shay CM, Crandell J, et al. Association of race and ethnicity with glycemic control and hemoglobin A1c levels in youth with type 1 diabetes. JAMA Netw Open. 2018;1:e181851.
4. Willi SM, Miller KM, DiMeglio LA, et al; T1D Exchange Clinic Network. Racial-ethnic disparities in management and outcomes among children with type 1 diabetes. Pediatrics. 2015;135:424-434.
5. Valenzuela JM, Seid M, Waitzfelder B, et al. Prevalence of and disparities in barriers to care experienced by youth with type 1 diabetes. J Pediatr. 2014;164:1369-1375.
6. Hussain A, Bhowmik B, do Vale Moreira NC. COVID-19 and diabetes: Knowledge in progress. Diabetes Res Clin Pract. 2020;162:108142.
7. Bhatraju PK, Ghassemieh BJ, Nichols M, et al. Covid-19 in critically ill patients in the Seattle Region - case series. N Engl J Med. 2020;382:2012-2022.
8. Laurencin CT, McClinton A. The COVID-19 pandemic: a call to action to identify and address racial and ethnic disparities. J Racial Ethn Health Disparities. 2020;7:398-402.
9. Shah M, Sachdeva M, Dodiuk-Gad RP. COVID-19 and racial disparities. J Am Acad Dermatol. 2020;83:e35.
10. Ebekozien O, Rioles N, DeSalvo D, et al. Improving continuous glucose monitoring (CGM) use across national centers: results from the T1D Exchange Quality Improvement Collaborative (T1DX-QI). Diabetes. 2020;69(Supplement 1):145-LB.
11. Ebekozien O. QI methodology to address health equity. Presented at American Society of Quality BOSCON 2018; Boston, MA; March 19 and 20, 2018.
12. 2019 Model Practice Award, Building A Culture of Improvement. National Association of County and City Health Officials web site. www.naccho.org/membership/awards/model-practices. Accessed June 4, 2020.
13. Nuckols TK, Keeler E, Anderson LJ, et al. Economic evaluation of quality improvement interventions designed to improve glycemic control in diabetes: a systematic review and weighted regression analysis. Diabetes Care. 2018;41:985‐993.
14. Rossi MC, Nicolucci A, Arcangeli A, et al. Baseline quality-of-care data from a quality-improvement program implemented by a network of diabetes outpatient clinics. Diabetes Care. 2008;31:2166‐2168.
15. McQuillan RF, Silver SA, Harel Z, et al. How to measure and interpret quality improvement data. Clin J Am Soc Nephrol. 2016;11:908-914.
16. Siddiqi FS. Quality improvement in diabetes care: time for us to step up? Can J Diabetes. 2019;43:233.
17. Taylor MJ, McNicholas C, Nicolay C, et al. Systematic review of the application of the plan-do-study-act method to improve quality in healthcare. BMJ Qual Saf. 2014;23:290‐298.
18. Ferdinand KC, Nasser SA. African American COVID-19 mortality: a sentinel event. J Am Coll Cardiol. 2020;75:2746-2748..
19. Muniyappa R, Gubbi S. COVID-19 pandemic, coronaviruses, and diabetes mellitus. Am J Physiol Endocrinol Metab. 2020;318:E736-E741.
20. Ebekozien OA, Noor N, Gallagher MP, Alonso GT. Type 1 diabetes and COVID-19: preliminary findings from a multicenter surveillance study in the U.S. Diabetes Care. 2020;43:e83-e85.
21. Majidi S, Ebekozien O, Noor N, et al. Inequities in health outcomes among patients in the T1D Exchange-QI Collaborative. Diabetes. 2020;69(Supplement 1):1220-P. https://doi.org/10.2337/ db20-1220.-P.
22. Williams DR, Mohammed SA. Discrimination and racial disparities in health: evidence and needed research. J Behav Med. 2009;32:20-47.
23. Centers for Medicare & Medicaid Services. Accountable Health Communities Model. CMS.gov web site. https://innovation.cms.gov/innovation-models/ahcm. Accessed October 10, 2020.