User login
In reply: Stress ulcer prophylaxis
In Reply: We welcome the comments from Dr. Chongnarungsin on our article and the opportunity to further discuss our opinions.
In our paper, we discussed current recommendations for prophylaxis of stress ulcer-related bleeding in hospitalized patients and advocated against the blind administration of drugs without risk stratification.
The landmark trial that provides the most-cited definitions and the risk factors for clinically significant stress ulcer-related bleeding in critically ill patients was published in 1994 by Cook et al.1 In their multicenter prospective cohort study of 2,252 patients, the authors reported that prolonged mechanical ventilation is an important risk factor for clinically significant stress ulcer-related bleeding.
Another major prospective cohort study observed an incidence rate of clinically significant stress ulcer-related bleeding of 3.5%.2
Dr. Chongnarungsin cites another prospective cohort study of 183 patients from the same era,3 wherein the authors defined stress ulcer-related bleeding as bleeding requiring transfusion of packed red blood cells, found on endoscopy or on postmortem evaluation. This was in contrast to the 1994 study of Cook et al,1 who had a more rigorous and comprehensive definition for overt and clinically significant stress ulcer-related bleeding, applied by up to three independent adjudicators not involved in the patients’ care. Their definition not only entailed a more accurate transfusion-dependent bleeding criterion, but also included hemodynamic and laboratory criteria. As such, the “very low rate” of stress ulcer-related bleeding reported by Zandstra et al3 should be critically appraised. Of note, the authors in that study did not report the rates of patients who received early enteral feeding, and their patients received cefotaxime for digestive tract decontamination, an important confounder to the interpretation of the study results.
Indeed, the remarkable variation in estimates of the incidence of stress ulcer-related bleeding is probably related to the lack of a uniform definition. Even when rates of endoscopic and occult bleeding are set aside, agreement is lacking as to which category of bleeding is clinically significant.
Dr. Chongnarungsin also cites the study by Ellison et al4 of a cohort of 874 patients who had no previous gastrointestinal bleeding or peptic ulcer disease and who were enrolled in a multicenter randomized controlled trial of prophylactic intravenous immune globulin to prevent infections associated with an intensive care unit. In a secondary objective, the authors did not identify coagulopathy or prolonged mechanical ventilation as a principal risk factor for bleeding. The authors ascribed this discrepancy with previously published literature to their unique study population, which consisted predominantly of elderly men and rarely included trauma patients. In light of these unique peculiarities of their population, the lack of an association between prolonged mechanical ventilation and stress ulcer-related bleeding cannot be determined. Moreover, that study showed that prolonged nasogastric tube insertion was one of the risk factors for increased risk of gastrointestinal bleeding, and not the risk factor for development of stress ulcer as stated by Dr. Chongnarungsin.
The decrease in the incidence of stress ulcer-related bleeding in critically ill patients over the years could be attributed to an era effect, from advances in critical care medicine and prophylactic methods.5 We agree with Dr. Chongnarungsin that the increased introduction of early enteral feeding may have also contributed to the reduced incidence of stress ulcer-related bleeding.6 However, we think the conclusion that “mechanical ventilation for more than 48 hours does not seem to increase the risk of stress ulcer” is overelaborated, and we believe that strong evidence demonstrates this association.1,2
Alternatively, we recognize the lack of mortality-benefit evidence for stress ulcer prophylaxis. This notwithstanding, according to recent Surviving Sepsis Campaign guidelines, the use of stress ulcer prophylaxis is listed as a 1B recommendation (strong recommendation) for severely septic patients who require prolonged mechanical ventilation. In addition, the updated 2014 guidelines of the American Society of Health-System Pharmacists7 continue to recommend stress ulcer prophylaxis in the context of mechanical ventilation, with H2 receptor antagonists being the preferred first-line agents.8
It is important to acknowledge that these recommendations were endorsed despite the lack of obvious mortality benefit, and it is our opinion that large randomized controlled studies are needed to evaluate the risks and mortality benefit of these prophylaxis methods.
- Cook DJ, Fuller HD, Guyatt GH, et al. Risk factors for gastrointestinal bleeding in critically ill patients. Canadian Critical Care Trials Group. N Engl J Med 1994; 330:377–381.
- Cook DJ, Griffith LE, Walter SD, et al. The attributable mortality and length of intensive care unit stay of clinically important gastrointestinal bleeding in critically ill patients. Crit Care 2001; 5:368–375.
- Zandstra DF, Stoutenbeek CP. The virtual absence of stress-ulceration related bleeding in ICU patients receiving prolonged mechanical ventilation without any prophylaxis. A prospective cohort study. Intensive Care Med 1994; 20:335–340.
- Ellison RT, Perez-Perez G, Welsh CH, et al. Risk factors for upper gastrointestinal bleeding in intensive care unit patients: role of Helicobacter pylori. Federal Hyperimmune Immunoglobulin Therapy Study Group. Crit Care Med 1996; 24:1974–1981.
- Duerksen DR. Stress-related mucosal disease in critically ill patients. Best Pract Res Clin Gastroenterol 2003; 17:327–344.
- Marik PE, Vasu T, Hirani A, Pachinburavan M. Stress ulcer prophylaxis in the new millennium: a systematic review and meta-analysis. Crit Care Med 2010; 38:2222–2228.
- Cohen H, editor. Stop stressing out: the new stress ulcer prophylaxis (SUP) guidelines are finally here! ASHP Midyear Clinical Meeting; 2013 11 Dec 2013; Orlando, FL.
In Reply: We welcome the comments from Dr. Chongnarungsin on our article and the opportunity to further discuss our opinions.
In our paper, we discussed current recommendations for prophylaxis of stress ulcer-related bleeding in hospitalized patients and advocated against the blind administration of drugs without risk stratification.
The landmark trial that provides the most-cited definitions and the risk factors for clinically significant stress ulcer-related bleeding in critically ill patients was published in 1994 by Cook et al.1 In their multicenter prospective cohort study of 2,252 patients, the authors reported that prolonged mechanical ventilation is an important risk factor for clinically significant stress ulcer-related bleeding.
Another major prospective cohort study observed an incidence rate of clinically significant stress ulcer-related bleeding of 3.5%.2
Dr. Chongnarungsin cites another prospective cohort study of 183 patients from the same era,3 wherein the authors defined stress ulcer-related bleeding as bleeding requiring transfusion of packed red blood cells, found on endoscopy or on postmortem evaluation. This was in contrast to the 1994 study of Cook et al,1 who had a more rigorous and comprehensive definition for overt and clinically significant stress ulcer-related bleeding, applied by up to three independent adjudicators not involved in the patients’ care. Their definition not only entailed a more accurate transfusion-dependent bleeding criterion, but also included hemodynamic and laboratory criteria. As such, the “very low rate” of stress ulcer-related bleeding reported by Zandstra et al3 should be critically appraised. Of note, the authors in that study did not report the rates of patients who received early enteral feeding, and their patients received cefotaxime for digestive tract decontamination, an important confounder to the interpretation of the study results.
Indeed, the remarkable variation in estimates of the incidence of stress ulcer-related bleeding is probably related to the lack of a uniform definition. Even when rates of endoscopic and occult bleeding are set aside, agreement is lacking as to which category of bleeding is clinically significant.
Dr. Chongnarungsin also cites the study by Ellison et al4 of a cohort of 874 patients who had no previous gastrointestinal bleeding or peptic ulcer disease and who were enrolled in a multicenter randomized controlled trial of prophylactic intravenous immune globulin to prevent infections associated with an intensive care unit. In a secondary objective, the authors did not identify coagulopathy or prolonged mechanical ventilation as a principal risk factor for bleeding. The authors ascribed this discrepancy with previously published literature to their unique study population, which consisted predominantly of elderly men and rarely included trauma patients. In light of these unique peculiarities of their population, the lack of an association between prolonged mechanical ventilation and stress ulcer-related bleeding cannot be determined. Moreover, that study showed that prolonged nasogastric tube insertion was one of the risk factors for increased risk of gastrointestinal bleeding, and not the risk factor for development of stress ulcer as stated by Dr. Chongnarungsin.
The decrease in the incidence of stress ulcer-related bleeding in critically ill patients over the years could be attributed to an era effect, from advances in critical care medicine and prophylactic methods.5 We agree with Dr. Chongnarungsin that the increased introduction of early enteral feeding may have also contributed to the reduced incidence of stress ulcer-related bleeding.6 However, we think the conclusion that “mechanical ventilation for more than 48 hours does not seem to increase the risk of stress ulcer” is overelaborated, and we believe that strong evidence demonstrates this association.1,2
Alternatively, we recognize the lack of mortality-benefit evidence for stress ulcer prophylaxis. This notwithstanding, according to recent Surviving Sepsis Campaign guidelines, the use of stress ulcer prophylaxis is listed as a 1B recommendation (strong recommendation) for severely septic patients who require prolonged mechanical ventilation. In addition, the updated 2014 guidelines of the American Society of Health-System Pharmacists7 continue to recommend stress ulcer prophylaxis in the context of mechanical ventilation, with H2 receptor antagonists being the preferred first-line agents.8
It is important to acknowledge that these recommendations were endorsed despite the lack of obvious mortality benefit, and it is our opinion that large randomized controlled studies are needed to evaluate the risks and mortality benefit of these prophylaxis methods.
- Cook DJ, Fuller HD, Guyatt GH, et al. Risk factors for gastrointestinal bleeding in critically ill patients. Canadian Critical Care Trials Group. N Engl J Med 1994; 330:377–381.
- Cook DJ, Griffith LE, Walter SD, et al. The attributable mortality and length of intensive care unit stay of clinically important gastrointestinal bleeding in critically ill patients. Crit Care 2001; 5:368–375.
- Zandstra DF, Stoutenbeek CP. The virtual absence of stress-ulceration related bleeding in ICU patients receiving prolonged mechanical ventilation without any prophylaxis. A prospective cohort study. Intensive Care Med 1994; 20:335–340.
- Ellison RT, Perez-Perez G, Welsh CH, et al. Risk factors for upper gastrointestinal bleeding in intensive care unit patients: role of Helicobacter pylori. Federal Hyperimmune Immunoglobulin Therapy Study Group. Crit Care Med 1996; 24:1974–1981.
- Duerksen DR. Stress-related mucosal disease in critically ill patients. Best Pract Res Clin Gastroenterol 2003; 17:327–344.
- Marik PE, Vasu T, Hirani A, Pachinburavan M. Stress ulcer prophylaxis in the new millennium: a systematic review and meta-analysis. Crit Care Med 2010; 38:2222–2228.
- Cohen H, editor. Stop stressing out: the new stress ulcer prophylaxis (SUP) guidelines are finally here! ASHP Midyear Clinical Meeting; 2013 11 Dec 2013; Orlando, FL.
Is hemoglobin A1c an accurate measure of glycemic control in all diabetic patients?
No. Hemoglobin A1c has been validated as a predictor of diabetes-related complications and is a standard measure of the adequacy of glucose control. But sometimes we need to regard its values with suspicion, especially when they are not concordant with the patient’s self-monitored blood glucose levels.
UNIVERSALLY USED
Measuring glycated hemoglobin has become an essential tool for detecting impaired glucose tolerance (when levels are between 5.7% and 6.5%), for diagnosing diabetes mellitus (when levels are ≥ 6.5%), and for following the adequacy of control in established disease. The results reflect glycemic control over the preceding 2 to 3 months and possibly indicate the risk of complications, particularly microvascular disease in the long term.
The significance of hemoglobin A1c was further accentuated with the results of the DETECT-2 project,1 which showed that the risk of diabetic retinopathy is insignificant with levels lower than 6% and rises substantially when it is greater than 6.5%.
However, because the biochemical hallmark of diabetes is hyperglycemia (and not the glycation of proteins), concerns have been raised about the universal validity of hemoglobin A1c in all diabetic patients, especially when it is used to monitor glucose control in the long term.2
FACTORS THAT AFFECT THE GLYCATED HEMOGLOBIN LEVEL
Altered glycation
Although the hemoglobin A1c value correlates well with the mean blood glucose level over the previous months, it is affected more by the most recent glucose levels than by earlier levels, and it is especially affected by the most recent peak in blood glucose.3 It is estimated that approximately 50% of the hemoglobin A1c level is determined by the plasma glucose level during the preceding 1-month period.3
Other factors that affect levels of glycated hemoglobin independently of the average glucose level during the previous months include genetic predisposition (some people are “rapid glycators”), labile glycation (ie, transient glycation of hemoglobin when exposed to very high concentrations of glucose), and the 2,3-diphosphoglycerate concentration and pH of the blood.2
Hemoglobin factors
Age of red blood cells. Red blood cells last about 120 days, and the mean age of all red blood cells in circulation ranges from 38 to 60 days (50 on average). Turnover is dictated by a number of factors, including ethnicity, which in turn significantly affect hemoglobin A1c values.
Race and ethnicity. African American, Asian, and Hispanic patients may have higher hemoglobin A1c values than white people who have the same blood glucose levels. In one study of racial and ethnic differences in mean plasma glucose, levels were higher by 0.37% in African American patients, 0.27% in Hispanics, and 0.33% in Asians than in white patients, and the differences were statistically significant.4 However, there is no clear evidence that these differences are associated with differences in the incidence of microvascular disease.5
Effects due to heritable factors could vary among ethnic groups. Racial differences in hemoglobin A1c may be ascribed to the degree of glycation, caused by multiple factors, and to socioeconomic status. Interestingly, many of the interracial differences in conditions that affect erythrocyte turnover would in theory lead to a lower hemoglobin A1c in nonwhites, which is not the case.6
Pregnancy. The mechanisms of hemoglobin A1c discrepancy in pregnancy are not clear. It has been demonstrated that pregnant women may have lower hemoglobin A1c levels than nonpregnant women.7–9 Hemodilution and increased cell turnover have been postulated to account for the decrease, although a mechanism has not been described. Interestingly, conflicting data have been reported regarding hemoglobin A1c in the last trimester of pregnancy (increase, decrease, or no change). Iron deficiency has been presumed to cause the increase of hemoglobin A1c in the last trimester.10
Moreover, hemoglobin A1c may reflect glucose levels during a shorter time because of increased turnover of red blood cells that occurs during this state. Erythropoietin and erythrocyte production are increased during normal pregnancy while hemoglobin and hematocrit continuously dilute into the third trimester. In normal pregnancy, the red blood cell life span is decreased due to “emergency hemopoiesis” in response to these elevated erythropoietin levels.
Anemia. Hemolytic anemia, acute bleeding, and iron-deficiency anemia all influence glycated hemoglobin levels. The formation of reticulocytes whose hemoglobin lacks glycosylation may lead to falsely low hemoglobin A1c values. Interestingly, iron deficiency by itself has been observed to cause elevation of hemoglobin A1c through unclear mechanisms11; however, iron replacement may lead to reticulocytosis. Alternatively, asplenic patients may have deceptively higher hemoglobin A1c values because of the increased life span of their red blood cells.12
Hemoglobinopathy. Hemoglobin F may cause overestimation of hemoglobin A1c levels, whereas hemoglobin S and hemoglobin C may cause underestimation. Of note, these effects are method-specific, and newer immunoassay techniques are relatively robust even in the presence of common hemoglobin variants. Clinicians should be aware of their institution’s laboratory method for measuring glycated hemoglobin.13
Comorbidities
Chronic illnesses can cause fluctuation in hemoglobin A1c and make it unreliable. Uremia, severe hypertriglyceridemia, severe hyperbilirubinemia, chronic alcoholism, chronic salicylate use, chronic opioid use, and lead poisoning all can falsely increase hemoglobin A1c levels.
Vitamin and mineral deficiencies (eg, deficiencies of vitamin B12 and iron) can reduce red blood cell turnover and therefore falsely elevate hemoglobin A1c levels. Conversely, medical replacement of these deficiencies could lead to higher red blood cell turnover and reduced hemoglobin A1c levels.
Blood transfusions. Recent reports suggest that red blood cell transfusions reduce the hemoglobin A1c concentration in diabetic patients. This effect was most pronounced in patients who received large transfusion volumes or who had a high hemoglobin A1c level before the transfusion.14
Renal failure. Patients with renal failure have higher levels of carbamylated hemoglobin, which is reported to interfere with measurement and interpretation of hemoglobin A1c. Moreover, there is concern that hemoglobin A1c values may be falsely low in these patients because of shortened erythrocyte survival. Other factors that influence hemoglobin A1c and cause the measured levels to be misleadingly low in renal failure patients include use of recombinant human erythropoietin, the uremic environment, and blood transfusions.15
It has been suggested that glycated albumin may be a better marker for assessing glycemic control in patients with severe chronic kidney disease.16
Medications and supplements that affect hemoglobin
Drugs that may cause hemolysis could lower hemoglobin A1c levels. Examples are dapsone, ribavirin, and sulfonamides. Other drugs can change the structure of hemoglobin. For example, hydroxyurea alters hemoglobin A into hemoglobin F, thus lowering the hemoglobin A1c level. Chronic opiate use has been reported to increase hemoglobin A1c levels through mechanisms yet unclear.
Aspirin, vitamin C, and vitamin E have been postulated to interfere with hemoglobin A1c measurement assays, although studies have not been consistent in demonstrating these effects.
Labile diabetes
In some patients with diabetes, blood glucose levels are labile and oscillate between states of hypoglycemia and hyperglycemia, despite optimal hemoglobin A1c levels.17 In these patients, the average blood glucose level may very well correlate appropriately with the glycated hemoglobin level, but the degree of control would not be acceptable. Fasting hyperglycemia or postprandial hyperglycemia, or both, especially in the setting of significant glycemic variability over the month before testing, may not be captured by the hemoglobin A1c measurement. These glycemic excursions may be important, as data suggest that this variability may independently worsen microvascular complications in diabetic patients.18
ALTERNATIVES TO MEASURING THE GLYCATED HEMOGLOBIN
When hemoglobin A1c levels are suspected to be inaccurate, other tests of the adequacy of glycemic control can be used.19
Continuous glucose monitoring is the gold standard and precisely shows the degree of glycemic variability, usually over 5 days. It is often used when hypoglycemia and wide fluctuations in within-day and day-to-day glucose levels are suspected. In addition, we believe that continuous monitoring could be used to confirm the validity of hemoglobin A1c testing. In a clinical setting in which the level does not seem to match the fingerstick blood glucose readings, it can be a useful tool to assess the range and variation in glycemic control.
This method, however, is not practical in all diabetic patients, and it certainly does not have the same long-term predictive prognostic value. Yet it may still have a role in validating measures of long-term glycemic control (eg, hemoglobin A1c). There is evidence that using continuous glucose monitoring periodically can improve glycemic control, lower hemoglobin A1c levels, and lead to fewer hypoglycemic events.20 As discussed earlier, patients who have labile glycemic excursions and higher risk of microvascular complications can still have “normal” hemoglobin A1c levels; in this scenario, the use of continuous glucose monitoring can lead to lower risk and better control.
1,5-anhydroglucitol and fructosamine are circulating biomarkers that reflect short-term glucose control, ie, over 2 to 3 weeks. The higher the average blood glucose level, the lower the 1,5-anhydroglucitol level, since higher glucose levels competitively inhibit renal reabsorption of this molecule. However, its utility is limited in renal failure, liver disease, and pregnancy.
Fructosamines are nonenzymatically glycated proteins. As markers, they are reliable in renal disease but are unreliable in hypoproteinemic states such as liver disease, nephrosis, and lipemia. This group of proteins represents all of serum-stable glycated proteins; they are strongly influenced by the concentration of serum proteins, as well as by coexisting low-molecular-weight substances in the plasma.
Glycated albumin is superior to glycated hemoglobin in reflecting glycemic control, as it has a faster metabolic turnover than hemoglobin and is not affected by hemoglobin-opathies. Unlike fructosamines, it is not influenced by the serum albumin concentration. Moreover, it may be superior to the hemoglobin A1c in patients who have postprandial hypoglycemia.21
Interestingly, recent cross-sectional analyses suggest that fructosamines and glycated albumin are at least as strongly associated with microvascular complications as the hemoglobin A1c is.22
BE ALERT TO FACTORS THAT AFFECT GLYCATED HEMOGLOBIN
Hemoglobin A1c reflects exposure of red blood cells to glucose. Multiple factors—pathologic, physiologic, and environmental—can influence the glycation process, red blood cell turnover, and the hemoglobin structure in ways that can decrease the reliability of the hemoglobin A1c measurement.
Clinicians should be vigilant for the various clinical situations in which hemoglobin A1c is hard to interpret, and they should be familiar with alternative tests (eg, continuous glucose monitoring, 1,5-anhydroglucitol, fructosamines) that can be used to monitor adequate glycemic control in these patients.
- Colaguiri S, Lee CM, Wong TY, Balkau B, Shaw JE, Borch-Johnsen K; DETECT-2 Collaboration Writing Group. Glycemic thresholds for diabetes-specific retinopathy: implications for diagnostic criteria for diabetes. Diabetes Care 2011; 34:145–150.
- Bonora E, Tuomilehto J. The pros and cons of diagnosing diabetes with A1C. Diabetes Care 2011; 34(suppl 2):S184–S190.
- Rohlfing CL, Wiedmeyer HM, Little RR, England JD, Tennill A, Goldstein DE. Defining the relationship between plasma glucose and HbA(1c): analysis of glucose profiles and HbA(1c) in the Diabetes Control and Complications Trial. Diabetes Care 2002; 25:275–278.
- Herman WH, Dungan KM, Wolffenbuttel BH, et al. Racial and ethnic differences in mean plasma glucose, hemoglobin A1c, and 1,5-anhydroglucitol in over 2000 patients with type 2 diabetes. J Clin Endocrinol Metab 2009; 94:1689–1694.
- Selvin E, Steffes MW, Zhu H, et al. Glycated hemoglobin, diabetes, and cardiovascular risk in nondiabetic adults. N Engl J Med 2010; 362:800–811.
- Tahara Y, Shima K. The response of GHb to stepwise plasma glucose change over time in diabetic patients. Diabetes Care 1993; 16:1313–1314.
- Radder JK, van Roosmalen J. HbA1c in healthy, pregnant women. Neth J Med 2005; 63:256–259.
- Mosca A, Paleari R, Dalfra MG, et al. Reference intervals for hemoglobin A1c in pregnant women: data from an Italian multicenter study. Clin Chem 2006; 52:1138–1143.
- Nielsen LR, Ekbom P, Damm P, et al. HbA1c levels are significantly lower in early and late pregnancy. Diabetes Care 2004; 27:1200–1201.
- Makris K, Spanou L. Is there a relationship between mean blood glucose and glycated hemoglobin? J Diabetes Sci Technol 2011; 5:1572–1583.
- Tarim O, Kucukerdogan A, Gunay U, Eralp O, Ercan I. Effects of iron deficiency anemia on hemoglobin A1c in type 1 diabetes mellitus. Pediatr Int 1999; 41:357–362.
- Panzer S, Kronik G, Lechner K, Bettelheim P, Neumann E, Dudczak R. Glycosylated hemoglobins (GHb): an index of red cell survival. Blood 1982; 59:1348–1350.
- National Glycohemoglobin Standardization Program. HbA1c assay interferences. www.ngsp.org/interf.asp. Accessed December 27, 2013.
- Spencer DH, Grossman BJ, Scott MG. Red cell transfusion decreases hemoglobin A1c in patients with diabetes. Clin Chem 2011; 57:344–346.
- Little RR, Rohlfing CL, Tennill AL, et al. Measurement of Hba(1C) in patients with chronic renal failure. Clin Chim Acta 2013; 418:73–76.
- Vos FE, Schollum JB, Walker RJ. Glycated albumin is the preferred marker for assessing glycaemic control in advanced chronic kidney disease. NDT Plus 2011; 4:368–375.
- Kilpatrick ES, Rigby AS, Goode K, Atkin SL. Relating mean blood glucose and glucose variability to the risk of multiple episodes of hypoglycaemia in type 1 diabetes. Diabetologia 2007; 50:2553–2561.
- Monnier L, Mas E, Ginet C, et al. Activation of oxidative stress by acute glucose fluctuations compared with sustained chronic hyperglycemia in patients with type 2 diabetes. JAMA 2006; 295:1681–1687.
- Radin MS. Pitfalls in hemoglobin A1c measurement: when results may be misleading. J Gen Intern Med 2013; Sep 4 [epub ahead of print]. http://link.springer.com/article/10.1007%2Fs11606-013-2595-x/fulltext.html. Accessed January 29, 2014.
- Leinung M, Nardacci E, Patel N, Bettadahalli S, Paika K, Thompson S. Benefits of short-term professional continuous glucose monitoring in clinical practice. Diabetes Technol Ther 2013; 15:744–747.
- Koga M, Kasayama S. Clinical impact of glycated albumin as another glycemic control marker. Endocr J 2010; 57:751–762.
- Selvin E, Francis LM, Ballantyne CM, et al. Nontraditional markers of glycemia: associations with microvascular conditions. Diabetes Care 2011; 34:960–967.
No. Hemoglobin A1c has been validated as a predictor of diabetes-related complications and is a standard measure of the adequacy of glucose control. But sometimes we need to regard its values with suspicion, especially when they are not concordant with the patient’s self-monitored blood glucose levels.
UNIVERSALLY USED
Measuring glycated hemoglobin has become an essential tool for detecting impaired glucose tolerance (when levels are between 5.7% and 6.5%), for diagnosing diabetes mellitus (when levels are ≥ 6.5%), and for following the adequacy of control in established disease. The results reflect glycemic control over the preceding 2 to 3 months and possibly indicate the risk of complications, particularly microvascular disease in the long term.
The significance of hemoglobin A1c was further accentuated with the results of the DETECT-2 project,1 which showed that the risk of diabetic retinopathy is insignificant with levels lower than 6% and rises substantially when it is greater than 6.5%.
However, because the biochemical hallmark of diabetes is hyperglycemia (and not the glycation of proteins), concerns have been raised about the universal validity of hemoglobin A1c in all diabetic patients, especially when it is used to monitor glucose control in the long term.2
FACTORS THAT AFFECT THE GLYCATED HEMOGLOBIN LEVEL
Altered glycation
Although the hemoglobin A1c value correlates well with the mean blood glucose level over the previous months, it is affected more by the most recent glucose levels than by earlier levels, and it is especially affected by the most recent peak in blood glucose.3 It is estimated that approximately 50% of the hemoglobin A1c level is determined by the plasma glucose level during the preceding 1-month period.3
Other factors that affect levels of glycated hemoglobin independently of the average glucose level during the previous months include genetic predisposition (some people are “rapid glycators”), labile glycation (ie, transient glycation of hemoglobin when exposed to very high concentrations of glucose), and the 2,3-diphosphoglycerate concentration and pH of the blood.2
Hemoglobin factors
Age of red blood cells. Red blood cells last about 120 days, and the mean age of all red blood cells in circulation ranges from 38 to 60 days (50 on average). Turnover is dictated by a number of factors, including ethnicity, which in turn significantly affect hemoglobin A1c values.
Race and ethnicity. African American, Asian, and Hispanic patients may have higher hemoglobin A1c values than white people who have the same blood glucose levels. In one study of racial and ethnic differences in mean plasma glucose, levels were higher by 0.37% in African American patients, 0.27% in Hispanics, and 0.33% in Asians than in white patients, and the differences were statistically significant.4 However, there is no clear evidence that these differences are associated with differences in the incidence of microvascular disease.5
Effects due to heritable factors could vary among ethnic groups. Racial differences in hemoglobin A1c may be ascribed to the degree of glycation, caused by multiple factors, and to socioeconomic status. Interestingly, many of the interracial differences in conditions that affect erythrocyte turnover would in theory lead to a lower hemoglobin A1c in nonwhites, which is not the case.6
Pregnancy. The mechanisms of hemoglobin A1c discrepancy in pregnancy are not clear. It has been demonstrated that pregnant women may have lower hemoglobin A1c levels than nonpregnant women.7–9 Hemodilution and increased cell turnover have been postulated to account for the decrease, although a mechanism has not been described. Interestingly, conflicting data have been reported regarding hemoglobin A1c in the last trimester of pregnancy (increase, decrease, or no change). Iron deficiency has been presumed to cause the increase of hemoglobin A1c in the last trimester.10
Moreover, hemoglobin A1c may reflect glucose levels during a shorter time because of increased turnover of red blood cells that occurs during this state. Erythropoietin and erythrocyte production are increased during normal pregnancy while hemoglobin and hematocrit continuously dilute into the third trimester. In normal pregnancy, the red blood cell life span is decreased due to “emergency hemopoiesis” in response to these elevated erythropoietin levels.
Anemia. Hemolytic anemia, acute bleeding, and iron-deficiency anemia all influence glycated hemoglobin levels. The formation of reticulocytes whose hemoglobin lacks glycosylation may lead to falsely low hemoglobin A1c values. Interestingly, iron deficiency by itself has been observed to cause elevation of hemoglobin A1c through unclear mechanisms11; however, iron replacement may lead to reticulocytosis. Alternatively, asplenic patients may have deceptively higher hemoglobin A1c values because of the increased life span of their red blood cells.12
Hemoglobinopathy. Hemoglobin F may cause overestimation of hemoglobin A1c levels, whereas hemoglobin S and hemoglobin C may cause underestimation. Of note, these effects are method-specific, and newer immunoassay techniques are relatively robust even in the presence of common hemoglobin variants. Clinicians should be aware of their institution’s laboratory method for measuring glycated hemoglobin.13
Comorbidities
Chronic illnesses can cause fluctuation in hemoglobin A1c and make it unreliable. Uremia, severe hypertriglyceridemia, severe hyperbilirubinemia, chronic alcoholism, chronic salicylate use, chronic opioid use, and lead poisoning all can falsely increase hemoglobin A1c levels.
Vitamin and mineral deficiencies (eg, deficiencies of vitamin B12 and iron) can reduce red blood cell turnover and therefore falsely elevate hemoglobin A1c levels. Conversely, medical replacement of these deficiencies could lead to higher red blood cell turnover and reduced hemoglobin A1c levels.
Blood transfusions. Recent reports suggest that red blood cell transfusions reduce the hemoglobin A1c concentration in diabetic patients. This effect was most pronounced in patients who received large transfusion volumes or who had a high hemoglobin A1c level before the transfusion.14
Renal failure. Patients with renal failure have higher levels of carbamylated hemoglobin, which is reported to interfere with measurement and interpretation of hemoglobin A1c. Moreover, there is concern that hemoglobin A1c values may be falsely low in these patients because of shortened erythrocyte survival. Other factors that influence hemoglobin A1c and cause the measured levels to be misleadingly low in renal failure patients include use of recombinant human erythropoietin, the uremic environment, and blood transfusions.15
It has been suggested that glycated albumin may be a better marker for assessing glycemic control in patients with severe chronic kidney disease.16
Medications and supplements that affect hemoglobin
Drugs that may cause hemolysis could lower hemoglobin A1c levels. Examples are dapsone, ribavirin, and sulfonamides. Other drugs can change the structure of hemoglobin. For example, hydroxyurea alters hemoglobin A into hemoglobin F, thus lowering the hemoglobin A1c level. Chronic opiate use has been reported to increase hemoglobin A1c levels through mechanisms yet unclear.
Aspirin, vitamin C, and vitamin E have been postulated to interfere with hemoglobin A1c measurement assays, although studies have not been consistent in demonstrating these effects.
Labile diabetes
In some patients with diabetes, blood glucose levels are labile and oscillate between states of hypoglycemia and hyperglycemia, despite optimal hemoglobin A1c levels.17 In these patients, the average blood glucose level may very well correlate appropriately with the glycated hemoglobin level, but the degree of control would not be acceptable. Fasting hyperglycemia or postprandial hyperglycemia, or both, especially in the setting of significant glycemic variability over the month before testing, may not be captured by the hemoglobin A1c measurement. These glycemic excursions may be important, as data suggest that this variability may independently worsen microvascular complications in diabetic patients.18
ALTERNATIVES TO MEASURING THE GLYCATED HEMOGLOBIN
When hemoglobin A1c levels are suspected to be inaccurate, other tests of the adequacy of glycemic control can be used.19
Continuous glucose monitoring is the gold standard and precisely shows the degree of glycemic variability, usually over 5 days. It is often used when hypoglycemia and wide fluctuations in within-day and day-to-day glucose levels are suspected. In addition, we believe that continuous monitoring could be used to confirm the validity of hemoglobin A1c testing. In a clinical setting in which the level does not seem to match the fingerstick blood glucose readings, it can be a useful tool to assess the range and variation in glycemic control.
This method, however, is not practical in all diabetic patients, and it certainly does not have the same long-term predictive prognostic value. Yet it may still have a role in validating measures of long-term glycemic control (eg, hemoglobin A1c). There is evidence that using continuous glucose monitoring periodically can improve glycemic control, lower hemoglobin A1c levels, and lead to fewer hypoglycemic events.20 As discussed earlier, patients who have labile glycemic excursions and higher risk of microvascular complications can still have “normal” hemoglobin A1c levels; in this scenario, the use of continuous glucose monitoring can lead to lower risk and better control.
1,5-anhydroglucitol and fructosamine are circulating biomarkers that reflect short-term glucose control, ie, over 2 to 3 weeks. The higher the average blood glucose level, the lower the 1,5-anhydroglucitol level, since higher glucose levels competitively inhibit renal reabsorption of this molecule. However, its utility is limited in renal failure, liver disease, and pregnancy.
Fructosamines are nonenzymatically glycated proteins. As markers, they are reliable in renal disease but are unreliable in hypoproteinemic states such as liver disease, nephrosis, and lipemia. This group of proteins represents all of serum-stable glycated proteins; they are strongly influenced by the concentration of serum proteins, as well as by coexisting low-molecular-weight substances in the plasma.
Glycated albumin is superior to glycated hemoglobin in reflecting glycemic control, as it has a faster metabolic turnover than hemoglobin and is not affected by hemoglobin-opathies. Unlike fructosamines, it is not influenced by the serum albumin concentration. Moreover, it may be superior to the hemoglobin A1c in patients who have postprandial hypoglycemia.21
Interestingly, recent cross-sectional analyses suggest that fructosamines and glycated albumin are at least as strongly associated with microvascular complications as the hemoglobin A1c is.22
BE ALERT TO FACTORS THAT AFFECT GLYCATED HEMOGLOBIN
Hemoglobin A1c reflects exposure of red blood cells to glucose. Multiple factors—pathologic, physiologic, and environmental—can influence the glycation process, red blood cell turnover, and the hemoglobin structure in ways that can decrease the reliability of the hemoglobin A1c measurement.
Clinicians should be vigilant for the various clinical situations in which hemoglobin A1c is hard to interpret, and they should be familiar with alternative tests (eg, continuous glucose monitoring, 1,5-anhydroglucitol, fructosamines) that can be used to monitor adequate glycemic control in these patients.
- Colaguiri S, Lee CM, Wong TY, Balkau B, Shaw JE, Borch-Johnsen K; DETECT-2 Collaboration Writing Group. Glycemic thresholds for diabetes-specific retinopathy: implications for diagnostic criteria for diabetes. Diabetes Care 2011; 34:145–150.
- Bonora E, Tuomilehto J. The pros and cons of diagnosing diabetes with A1C. Diabetes Care 2011; 34(suppl 2):S184–S190.
- Rohlfing CL, Wiedmeyer HM, Little RR, England JD, Tennill A, Goldstein DE. Defining the relationship between plasma glucose and HbA(1c): analysis of glucose profiles and HbA(1c) in the Diabetes Control and Complications Trial. Diabetes Care 2002; 25:275–278.
- Herman WH, Dungan KM, Wolffenbuttel BH, et al. Racial and ethnic differences in mean plasma glucose, hemoglobin A1c, and 1,5-anhydroglucitol in over 2000 patients with type 2 diabetes. J Clin Endocrinol Metab 2009; 94:1689–1694.
- Selvin E, Steffes MW, Zhu H, et al. Glycated hemoglobin, diabetes, and cardiovascular risk in nondiabetic adults. N Engl J Med 2010; 362:800–811.
- Tahara Y, Shima K. The response of GHb to stepwise plasma glucose change over time in diabetic patients. Diabetes Care 1993; 16:1313–1314.
- Radder JK, van Roosmalen J. HbA1c in healthy, pregnant women. Neth J Med 2005; 63:256–259.
- Mosca A, Paleari R, Dalfra MG, et al. Reference intervals for hemoglobin A1c in pregnant women: data from an Italian multicenter study. Clin Chem 2006; 52:1138–1143.
- Nielsen LR, Ekbom P, Damm P, et al. HbA1c levels are significantly lower in early and late pregnancy. Diabetes Care 2004; 27:1200–1201.
- Makris K, Spanou L. Is there a relationship between mean blood glucose and glycated hemoglobin? J Diabetes Sci Technol 2011; 5:1572–1583.
- Tarim O, Kucukerdogan A, Gunay U, Eralp O, Ercan I. Effects of iron deficiency anemia on hemoglobin A1c in type 1 diabetes mellitus. Pediatr Int 1999; 41:357–362.
- Panzer S, Kronik G, Lechner K, Bettelheim P, Neumann E, Dudczak R. Glycosylated hemoglobins (GHb): an index of red cell survival. Blood 1982; 59:1348–1350.
- National Glycohemoglobin Standardization Program. HbA1c assay interferences. www.ngsp.org/interf.asp. Accessed December 27, 2013.
- Spencer DH, Grossman BJ, Scott MG. Red cell transfusion decreases hemoglobin A1c in patients with diabetes. Clin Chem 2011; 57:344–346.
- Little RR, Rohlfing CL, Tennill AL, et al. Measurement of Hba(1C) in patients with chronic renal failure. Clin Chim Acta 2013; 418:73–76.
- Vos FE, Schollum JB, Walker RJ. Glycated albumin is the preferred marker for assessing glycaemic control in advanced chronic kidney disease. NDT Plus 2011; 4:368–375.
- Kilpatrick ES, Rigby AS, Goode K, Atkin SL. Relating mean blood glucose and glucose variability to the risk of multiple episodes of hypoglycaemia in type 1 diabetes. Diabetologia 2007; 50:2553–2561.
- Monnier L, Mas E, Ginet C, et al. Activation of oxidative stress by acute glucose fluctuations compared with sustained chronic hyperglycemia in patients with type 2 diabetes. JAMA 2006; 295:1681–1687.
- Radin MS. Pitfalls in hemoglobin A1c measurement: when results may be misleading. J Gen Intern Med 2013; Sep 4 [epub ahead of print]. http://link.springer.com/article/10.1007%2Fs11606-013-2595-x/fulltext.html. Accessed January 29, 2014.
- Leinung M, Nardacci E, Patel N, Bettadahalli S, Paika K, Thompson S. Benefits of short-term professional continuous glucose monitoring in clinical practice. Diabetes Technol Ther 2013; 15:744–747.
- Koga M, Kasayama S. Clinical impact of glycated albumin as another glycemic control marker. Endocr J 2010; 57:751–762.
- Selvin E, Francis LM, Ballantyne CM, et al. Nontraditional markers of glycemia: associations with microvascular conditions. Diabetes Care 2011; 34:960–967.
Do all hospitalized patients need stress ulcer prophylaxis?
No. Based on current evidence and guidelines, routine acid-suppressive therapy to prevent stress ulcers has no benefit in hospitalized patients outside the critical-care setting. Only critically ill patients who meet specific criteria, as described in the guidelines of the American Society of Health System Pharmacists, should receive acid-suppressive therapy.
Unfortunately, routine stress ulcer prophylaxis is common in US hospitals, unnecessarily putting patients at risk of complications and adding costs.
STRESS ULCER AND CRITICAL ILLNESS
Stress ulcers—ulcerations of the upper part of the gastrointestinal (GI) mucosa in the setting of acute disease—usually involve the fundus and body of the stomach. The stomach is lined with a glycoprotein mucous layer rich in bicarbonates, forming a physiologic barrier to protect the gastric wall from acid insult by neutralizing hydrogen ions. Disruption of this protective layer can occur in critically ill patients (eg, those with shock or sepsis) through overproduction of uremic toxins, increased reflux of bile salts, compromised blood flow, and increased stomach acidity through gastrin stimulation of parietal cells.
More than 75% of patients with major burns or cranial trauma develop endoscopic mucosal abnormalities within 72 hours of injury.1 In critically ill patients, the risk of ulcer-related overt bleeding is estimated to be 5% to 25%. Furthermore, 1% to 5% of stress ulcers can be deep enough to erode into the submucosa, causing clinically significant GI bleeding, defined as bleeding complicated by hemodynamic compromise or a drop in hemoglobin that requires a blood transfusion.2 In contrast, in inpatients who are not critically ill, the risk of overt bleeding from stress ulcers is less than 1%.3
ADDRESSING RISK
A multicenter prospective cohort study of 2,252 intensive care patients2 reported two main risk factors for significant bleeding caused by stress ulcers: mechanical ventilation for more than 48 hours and coagulopathy, defined as a platelet count below 50 × 109/L, an international normalized ratio greater than 1.5, or a partial thromboplastin time more than twice the control value.4 In hemodynamically stable patients receiving anticoagulation in a general medical or surgical ward, the risk of GI bleeding was low, and acid suppression failed to lower the rate of stress ulcer occurrence.3
Other risk factors include severe sepsis, shock, liver failure, kidney failure, burns over 35% of the total body surface, organ transplantation, cranial trauma, spinal cord trauma, history of peptic ulcer disease, and history of upper GI bleeding.3,5,6 Steroid therapy is not considered a risk factor for stress ulcers unless it is used in the presence of another risk factor such as use of aspirin or nonsteroidal antiinflammatory drugs (NSAIDs).2
INDICATIONS FOR PROPHYLAXIS
Prophylaxis with a proton pump inhibitor (PPI) is indicated in specific conditions—ie, peptic ulcer disease, gastroesophageal reflux disease, chronic NSAID therapy, and Zollinger-Ellison syndrome—and to eradicate Helicobacter pylori infection.7 But in the United States, stress ulcer prophylaxis is overused in general-care floors despite the lack of supporting evidence.
The American Society of Health System Pharmacists guidelines recommend it in the intensive care unit for patients with any of the following: coagulopathy, prolonged mechanical ventilation (more than 48 hours), GI ulcer or bleeding within the past year, sepsis, a stay longer than 1 week in the intensive care unit, occult GI bleeding for 6 or more days, and steroid therapy with more than 250 mg of hydrocortisone daily.8 Hemodynamically stable patients admitted to general-care floors should not receive stress ulcer prophylaxis, as it only negligibly decreases the rate of GI bleeding, from 0.33% to 0.22%.9
WHY ROUTINE ULCER PROPHYLAXIS IS NOT FOR ALL HOSPITALIZED PATIENTS
Although stress ulcer prophylaxis is often considered benign, its lack of proven benefit, additional cost, and risk of adverse effects, including interactions with foods and other drugs, preclude using it routinely for all hospitalized patients.10,11 Chronic use of PPIs has been associated with complications, as discussed below.
Infection
Acid suppression may impair the destruction of ingested microorganisms, resulting in overgrowth of bacteria.12 Overuse of PPIs may increase the risk of several infections:
- Diarrhea due to Clostridium difficile12
- Community-acquired pneumonia, from increased microaspiration of overgrown microorganisms into the lung.12
- Spontaneous bacterial peritonitis in patients with cirrhosis,13 although the mechanism is not clear. (Small-bowel bacterial overgrowth is the hypothesized cause.)
Bone fracture
PPIs lower gastric acidity, and this can inhibit intestinal calcium absorption. Furthermore, PPIs may directly inhibit bone resorption by osteoclasts.14
Reduction in clopidogrel efficacy
PPIs may reduce the efficacy of clopidogrel as a result of competitive inhibition of cytochrome CYP2C19, which is necessary to metabolize clopidogrel to its active forms. Therefore, concomitant use of clopidogrel with omeprazole, esomeprazole, or other CYP2C19 inhibitors is not recommended.15
Nutritional deficiencies
The overgrown microorganisms consume cobalamin in the stomach, resulting in vitamin B12 deficiency. Acid-suppressive therapy can also reduce the absorption of magnesium and iron.12
Unnecessary cost
Heidelbaugh and Inadomi16 reviewed the non-evidence-based use of stress ulcer prophylaxis in patients admitted to a large university hospital and estimated that it entailed a cost to the hospital of $111,791 over the course of a year.
WHICH ULCER PROPHYLAXIS SHOULD BE USED IN CRITICALLY ILL PATIENTS?
Studies have shown histamine-2 blockers to be superior to antacids and sucralfate in preventing stress ulcer and GI bleeding,8,15 but no study has compared PPIs with sucralfate and antacids.
When indicated, an oral PPI is preferred over an oral histamine-2 blocker for GI prophylaxis.17 This practice is considered cost-effective and is associated with lower rates of stress ulcer and GI bleeding. In intubated patients, however, an intravenous histamine-2 blocker is preferable to an intravenous PPI.3,8,11 Interestingly, no difference was reported between PPIs and histamine-2 blockers in terms of mortality rate or reduction in the incidence of nosocomial pneumonia.17
OUR RECOMMENDATION
Only critically ill patients who meet the specific criteria described here should receive stress ulcer prophylaxis. More effort is needed to educate residents, medical staff, and pharmacists about current guidelines. Computerized ordering templates and reminders to discontinue prophylaxis at discharge or step-down may decrease overall use, reduce costs, and limit potential side effects.18
- DePriest JL. Stress ulcer prophylaxis. Do critically ill patients need it? Postgrad Med 1995; 98:159–168.
- Cook DJ, Fuller HD, Guyatt GH, et al. Risk factors for gastrointestinal bleeding in critically ill patients. Canadian Critical Care Trials Group. N Engl J Med 1994; 330:377–381.
- Qadeer MA, Richter JE, Brotman DJ. Hospital-acquired gastrointestinal bleeding outside the critical care unit: risk factors, role of acid suppression, and endoscopy findings. J Hosp Med 2006; 1:13–20.
- Shuman RB, Schuster DP, Zuckerman GR. Prophylactic therapy for stress ulcer bleeding: a reappraisal. Ann Intern Med 1987; 106:562–567.
- Dellinger RP, Levy MM, Rhodes A, et al; Surviving Sepsis Campaign Guidelines Committee including the Pediatric Subgroup. Surviving sepsis campaign: international guidelines for management of severe sepsis and septic shock: 2012. Crit Care Med 2013; 41:580–637.
- Cook DJ, Reeve BK, Guyatt GH, et al. Stress ulcer prophylaxis in critically ill patients. Resolving discordant meta-analyses. JAMA 1996; 275:308–314.
- Kahrilas PJ, Shaheen NJ, Vaezi MF, et al; American Gastroenterological Association. American Gastroenterological Association Medical Position Statement on the management of gastroesophageal reflux disease. Gastroenterology 2008; 135:1383–1391.e1–1391.e5.
- Barkun AN, Bardou M, Pham CQ, Martel M. Proton pump inhibitors vs histamine 2 receptor antagonists for stress-related mucosal bleeding prophylaxis in critically ill patients: a meta-analysis. Am J Gastroenterol 2012; 107:507–520.
- Herzig SJ, Vaughn BP, Howell MD, Ngo LH, Marcantonio ER. Acid-suppressive medication use and the risk for nosocomial gastrointestinal tract bleeding. Arch Intern Med 2011; 171:991–997.
- Cook DJ. Stress ulcer prophylaxis: gastrointestinal bleeding and nosocomial pneumonia. Best evidence synthesis. Scand J Gastroenterol Suppl 1995; 210:48–52.
- Messori A, Trippoli S, Vaiani M, Gorini M, Corrado A. Bleeding and pneumonia in intensive care patients given ranitidine and sucralfate for prevention of stress ulcer: meta-analysis of randomised controlled trials. BMJ 2000; 321:1103–1106.
- Heidelbaugh JJ, Kim AH, Chang R, Walker PC. Overutilization of proton-pump inhibitors: what the clinician needs to know. Therap Adv Gastroenterol 2012; 5:219–232.
- Deshpande A, Pasupuleti V, Thota P, et al. Acid-suppressive therapy is associated with spontaneous bacterial peritonitis in cirrhotic patients: a meta-analysis. J Gastroenterol Hepatol 2013; 28:235–242.
- Farina C, Gagliardi S. Selective inhibition of osteoclast vacuolar H(+)- ATPase. Curr Pharm Des 2002; 8:2033–2048.
- ASHP Therapeutic Guidelines on Stress Ulcer Prophylaxis. ASHP Commission on Therapeutics and approved by the ASHP Board of Directors on November 14, 1998. Am J Health Syst Pharm 1999; 56:347–379.
- Heidelbaugh JJ, Inadomi JM. Magnitude and economic impact of inappropriate use of stress ulcer prophylaxis in non-ICU hospitalized patients. Am J Gastroenterol 2006; 101:2200–2205.
- Alhazzani W, Alenezi F, Jaeschke RZ, Moayyedi P, Cook DJ. Proton pump inhibitors versus histamine 2 receptor antagonists for stress ulcer prophylaxis in critically ill patients: a systematic review and meta-analysis. Crit Care Med 2013; 41:693–705.
- Liberman JD, Whelan CT. Brief report: reducing inappropriate usage of stress ulcer prophylaxis among internal medicine residents. A practice-based educational intervention. J Gen Intern Med 2006; 21:498–500.
No. Based on current evidence and guidelines, routine acid-suppressive therapy to prevent stress ulcers has no benefit in hospitalized patients outside the critical-care setting. Only critically ill patients who meet specific criteria, as described in the guidelines of the American Society of Health System Pharmacists, should receive acid-suppressive therapy.
Unfortunately, routine stress ulcer prophylaxis is common in US hospitals, unnecessarily putting patients at risk of complications and adding costs.
STRESS ULCER AND CRITICAL ILLNESS
Stress ulcers—ulcerations of the upper part of the gastrointestinal (GI) mucosa in the setting of acute disease—usually involve the fundus and body of the stomach. The stomach is lined with a glycoprotein mucous layer rich in bicarbonates, forming a physiologic barrier to protect the gastric wall from acid insult by neutralizing hydrogen ions. Disruption of this protective layer can occur in critically ill patients (eg, those with shock or sepsis) through overproduction of uremic toxins, increased reflux of bile salts, compromised blood flow, and increased stomach acidity through gastrin stimulation of parietal cells.
More than 75% of patients with major burns or cranial trauma develop endoscopic mucosal abnormalities within 72 hours of injury.1 In critically ill patients, the risk of ulcer-related overt bleeding is estimated to be 5% to 25%. Furthermore, 1% to 5% of stress ulcers can be deep enough to erode into the submucosa, causing clinically significant GI bleeding, defined as bleeding complicated by hemodynamic compromise or a drop in hemoglobin that requires a blood transfusion.2 In contrast, in inpatients who are not critically ill, the risk of overt bleeding from stress ulcers is less than 1%.3
ADDRESSING RISK
A multicenter prospective cohort study of 2,252 intensive care patients2 reported two main risk factors for significant bleeding caused by stress ulcers: mechanical ventilation for more than 48 hours and coagulopathy, defined as a platelet count below 50 × 109/L, an international normalized ratio greater than 1.5, or a partial thromboplastin time more than twice the control value.4 In hemodynamically stable patients receiving anticoagulation in a general medical or surgical ward, the risk of GI bleeding was low, and acid suppression failed to lower the rate of stress ulcer occurrence.3
Other risk factors include severe sepsis, shock, liver failure, kidney failure, burns over 35% of the total body surface, organ transplantation, cranial trauma, spinal cord trauma, history of peptic ulcer disease, and history of upper GI bleeding.3,5,6 Steroid therapy is not considered a risk factor for stress ulcers unless it is used in the presence of another risk factor such as use of aspirin or nonsteroidal antiinflammatory drugs (NSAIDs).2
INDICATIONS FOR PROPHYLAXIS
Prophylaxis with a proton pump inhibitor (PPI) is indicated in specific conditions—ie, peptic ulcer disease, gastroesophageal reflux disease, chronic NSAID therapy, and Zollinger-Ellison syndrome—and to eradicate Helicobacter pylori infection.7 But in the United States, stress ulcer prophylaxis is overused in general-care floors despite the lack of supporting evidence.
The American Society of Health System Pharmacists guidelines recommend it in the intensive care unit for patients with any of the following: coagulopathy, prolonged mechanical ventilation (more than 48 hours), GI ulcer or bleeding within the past year, sepsis, a stay longer than 1 week in the intensive care unit, occult GI bleeding for 6 or more days, and steroid therapy with more than 250 mg of hydrocortisone daily.8 Hemodynamically stable patients admitted to general-care floors should not receive stress ulcer prophylaxis, as it only negligibly decreases the rate of GI bleeding, from 0.33% to 0.22%.9
WHY ROUTINE ULCER PROPHYLAXIS IS NOT FOR ALL HOSPITALIZED PATIENTS
Although stress ulcer prophylaxis is often considered benign, its lack of proven benefit, additional cost, and risk of adverse effects, including interactions with foods and other drugs, preclude using it routinely for all hospitalized patients.10,11 Chronic use of PPIs has been associated with complications, as discussed below.
Infection
Acid suppression may impair the destruction of ingested microorganisms, resulting in overgrowth of bacteria.12 Overuse of PPIs may increase the risk of several infections:
- Diarrhea due to Clostridium difficile12
- Community-acquired pneumonia, from increased microaspiration of overgrown microorganisms into the lung.12
- Spontaneous bacterial peritonitis in patients with cirrhosis,13 although the mechanism is not clear. (Small-bowel bacterial overgrowth is the hypothesized cause.)
Bone fracture
PPIs lower gastric acidity, and this can inhibit intestinal calcium absorption. Furthermore, PPIs may directly inhibit bone resorption by osteoclasts.14
Reduction in clopidogrel efficacy
PPIs may reduce the efficacy of clopidogrel as a result of competitive inhibition of cytochrome CYP2C19, which is necessary to metabolize clopidogrel to its active forms. Therefore, concomitant use of clopidogrel with omeprazole, esomeprazole, or other CYP2C19 inhibitors is not recommended.15
Nutritional deficiencies
The overgrown microorganisms consume cobalamin in the stomach, resulting in vitamin B12 deficiency. Acid-suppressive therapy can also reduce the absorption of magnesium and iron.12
Unnecessary cost
Heidelbaugh and Inadomi16 reviewed the non-evidence-based use of stress ulcer prophylaxis in patients admitted to a large university hospital and estimated that it entailed a cost to the hospital of $111,791 over the course of a year.
WHICH ULCER PROPHYLAXIS SHOULD BE USED IN CRITICALLY ILL PATIENTS?
Studies have shown histamine-2 blockers to be superior to antacids and sucralfate in preventing stress ulcer and GI bleeding,8,15 but no study has compared PPIs with sucralfate and antacids.
When indicated, an oral PPI is preferred over an oral histamine-2 blocker for GI prophylaxis.17 This practice is considered cost-effective and is associated with lower rates of stress ulcer and GI bleeding. In intubated patients, however, an intravenous histamine-2 blocker is preferable to an intravenous PPI.3,8,11 Interestingly, no difference was reported between PPIs and histamine-2 blockers in terms of mortality rate or reduction in the incidence of nosocomial pneumonia.17
OUR RECOMMENDATION
Only critically ill patients who meet the specific criteria described here should receive stress ulcer prophylaxis. More effort is needed to educate residents, medical staff, and pharmacists about current guidelines. Computerized ordering templates and reminders to discontinue prophylaxis at discharge or step-down may decrease overall use, reduce costs, and limit potential side effects.18
- DePriest JL. Stress ulcer prophylaxis. Do critically ill patients need it? Postgrad Med 1995; 98:159–168.
- Cook DJ, Fuller HD, Guyatt GH, et al. Risk factors for gastrointestinal bleeding in critically ill patients. Canadian Critical Care Trials Group. N Engl J Med 1994; 330:377–381.
- Qadeer MA, Richter JE, Brotman DJ. Hospital-acquired gastrointestinal bleeding outside the critical care unit: risk factors, role of acid suppression, and endoscopy findings. J Hosp Med 2006; 1:13–20.
- Shuman RB, Schuster DP, Zuckerman GR. Prophylactic therapy for stress ulcer bleeding: a reappraisal. Ann Intern Med 1987; 106:562–567.
- Dellinger RP, Levy MM, Rhodes A, et al; Surviving Sepsis Campaign Guidelines Committee including the Pediatric Subgroup. Surviving sepsis campaign: international guidelines for management of severe sepsis and septic shock: 2012. Crit Care Med 2013; 41:580–637.
- Cook DJ, Reeve BK, Guyatt GH, et al. Stress ulcer prophylaxis in critically ill patients. Resolving discordant meta-analyses. JAMA 1996; 275:308–314.
- Kahrilas PJ, Shaheen NJ, Vaezi MF, et al; American Gastroenterological Association. American Gastroenterological Association Medical Position Statement on the management of gastroesophageal reflux disease. Gastroenterology 2008; 135:1383–1391.e1–1391.e5.
- Barkun AN, Bardou M, Pham CQ, Martel M. Proton pump inhibitors vs histamine 2 receptor antagonists for stress-related mucosal bleeding prophylaxis in critically ill patients: a meta-analysis. Am J Gastroenterol 2012; 107:507–520.
- Herzig SJ, Vaughn BP, Howell MD, Ngo LH, Marcantonio ER. Acid-suppressive medication use and the risk for nosocomial gastrointestinal tract bleeding. Arch Intern Med 2011; 171:991–997.
- Cook DJ. Stress ulcer prophylaxis: gastrointestinal bleeding and nosocomial pneumonia. Best evidence synthesis. Scand J Gastroenterol Suppl 1995; 210:48–52.
- Messori A, Trippoli S, Vaiani M, Gorini M, Corrado A. Bleeding and pneumonia in intensive care patients given ranitidine and sucralfate for prevention of stress ulcer: meta-analysis of randomised controlled trials. BMJ 2000; 321:1103–1106.
- Heidelbaugh JJ, Kim AH, Chang R, Walker PC. Overutilization of proton-pump inhibitors: what the clinician needs to know. Therap Adv Gastroenterol 2012; 5:219–232.
- Deshpande A, Pasupuleti V, Thota P, et al. Acid-suppressive therapy is associated with spontaneous bacterial peritonitis in cirrhotic patients: a meta-analysis. J Gastroenterol Hepatol 2013; 28:235–242.
- Farina C, Gagliardi S. Selective inhibition of osteoclast vacuolar H(+)- ATPase. Curr Pharm Des 2002; 8:2033–2048.
- ASHP Therapeutic Guidelines on Stress Ulcer Prophylaxis. ASHP Commission on Therapeutics and approved by the ASHP Board of Directors on November 14, 1998. Am J Health Syst Pharm 1999; 56:347–379.
- Heidelbaugh JJ, Inadomi JM. Magnitude and economic impact of inappropriate use of stress ulcer prophylaxis in non-ICU hospitalized patients. Am J Gastroenterol 2006; 101:2200–2205.
- Alhazzani W, Alenezi F, Jaeschke RZ, Moayyedi P, Cook DJ. Proton pump inhibitors versus histamine 2 receptor antagonists for stress ulcer prophylaxis in critically ill patients: a systematic review and meta-analysis. Crit Care Med 2013; 41:693–705.
- Liberman JD, Whelan CT. Brief report: reducing inappropriate usage of stress ulcer prophylaxis among internal medicine residents. A practice-based educational intervention. J Gen Intern Med 2006; 21:498–500.
Deep T waves and chest pain
A 67-year-old man with a history of hypertension and hyperlipidemia presented to the emergency department after 3 hours of what he described as a burning sensation in his chest that woke him from sleep. He attributed it at first to a late-night meal and treated himself with some milk and yogurt, which seemed to relieve the symptoms. However, the pain recurred and was associated with difficulty breathing. At that point, he drove himself to the emergency department.
On arrival, his temperature was 36.5°C (97.7°F), blood pressure 134/67 mm Hg, heart rate 89 bpm, respirations 18/min, and oxygen saturation 98% on room air. His cardiovascular, lung, and neurologic examinations were normal. His cardiac enzyme levels (creatine kinase, creatine kinase MB fraction, and troponin T) were within normal limits.
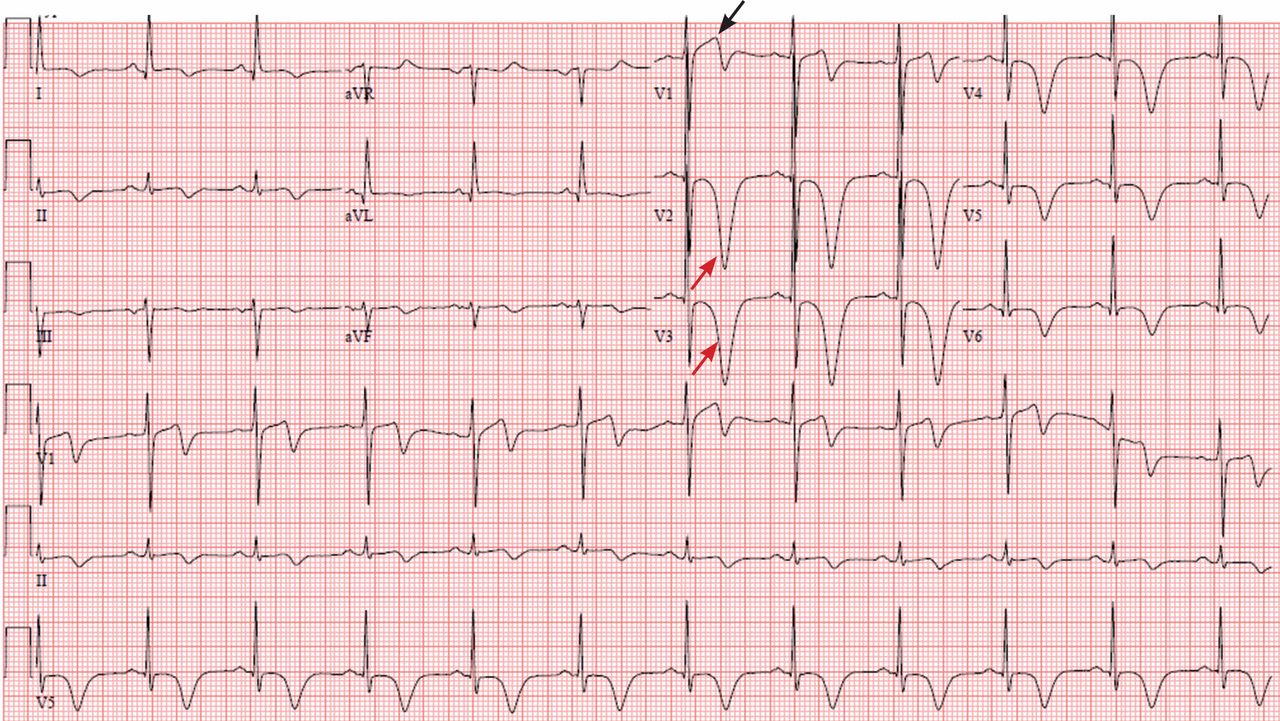
Figure 1 depicts his initial electrocardiogram. It showed deep, symmetric T-wave inversions in the precordial leads especially in V2 and V3, changes known as Wellens syndrome. The ST-T changes in lead V1 suggested a very proximal lesion in the left anterior descending artery (LAD), before the first septal perforator. Also, lateral and high lateral (V5 and V6) findings indicated stenoses of the branching diagonals and left circumflex myocardial territory. Furthermore, the inferior ST-T changes indicated that his LAD may have wrapped around the cardiac apex. All of these findings were prognostically significant.
The patient was given aspirin and was started on intravenous unfractionated heparin and nitroglycerin. He was sent for urgent left-heart catheterization, which showed a 50% to 60% stenosis in the left main coronary artery, with involvement of the left circumflex artery proximally, in addition to a “tight” first-diagonal stenosis, a 90% stenosis in a large (> 3.0-mm) proximal segment of the LAD, an 80% stenosis in a large (> 3.0-mm) mid-LAD segment, and a 40% stenosis in a large (> 3.0-mm) second diagonal artery (Figure 2).
He was referred for cardiac surgery and underwent triple coronary artery bypass grafting: the left internal thoracic artery was grafted to the LAD, a reverse saphenous vein graft was performed to the diagonal artery, and a reverse saphenous vein graft was performed to the obtuse marginal artery.
A PRECURSOR TO INFARCTION
Wellens et al described specific precordial T-wave changes in patients with unstable angina who subsequently developed anterior wall myocardial infarction.1
The importance of Wellens syndrome is that it occurs in the pain-free interval when no other evidence of ischemia or angina may be present.1 Cardiac enzyme levels are typically normal or only minimally elevated; only 12% of patients with this syndrome have elevated cardiac biomarker levels.2
Given the extent of myocardial injury, urgent echocardiography can show a wall-motion abnormality even if cardiac enzyme levels are normal. This gives important insight into electrocardiographic changes and should prompt consideration of revascularization.
Even with extensive medical management, Wellens syndrome progresses to acute anterior wall ischemia. About 75% of patients with Wellens syndrome who receive medical management but do not undergo revascularization (eg, coronary artery bypass grafting, percutaneous coronary intervention) develop extensive anterior wall infarction within days.1,3 Despite negative cardiac biomarkers, Wellens syndrome is considered an acute coronary syndrome requiring urgent cardiac intervention.
- Movahed MR. Wellens’ syndrome or inverted U-waves? Clin Cardiol 2008; 31:133–134.
- de Zwaan C, Bär FW, Janssen JH, et al. Angiographic and clinical characteristics of patients with unstable angina showing an ECG pattern indicating critical narrowing of the proximal LAD coronary artery. Am Heart J 1989; 117:657–665.
- de Zwaan C, Bär FW, Wellens HJ. Characteristic electrocardiographic pattern indicating a critical stenosis high in left anterior descending coronary artery in patients admitted because of impending myocardial infarction. Am Heart J 1982; 103:730–736.
A 67-year-old man with a history of hypertension and hyperlipidemia presented to the emergency department after 3 hours of what he described as a burning sensation in his chest that woke him from sleep. He attributed it at first to a late-night meal and treated himself with some milk and yogurt, which seemed to relieve the symptoms. However, the pain recurred and was associated with difficulty breathing. At that point, he drove himself to the emergency department.
On arrival, his temperature was 36.5°C (97.7°F), blood pressure 134/67 mm Hg, heart rate 89 bpm, respirations 18/min, and oxygen saturation 98% on room air. His cardiovascular, lung, and neurologic examinations were normal. His cardiac enzyme levels (creatine kinase, creatine kinase MB fraction, and troponin T) were within normal limits.
Figure 1 depicts his initial electrocardiogram. It showed deep, symmetric T-wave inversions in the precordial leads especially in V2 and V3, changes known as Wellens syndrome. The ST-T changes in lead V1 suggested a very proximal lesion in the left anterior descending artery (LAD), before the first septal perforator. Also, lateral and high lateral (V5 and V6) findings indicated stenoses of the branching diagonals and left circumflex myocardial territory. Furthermore, the inferior ST-T changes indicated that his LAD may have wrapped around the cardiac apex. All of these findings were prognostically significant.
The patient was given aspirin and was started on intravenous unfractionated heparin and nitroglycerin. He was sent for urgent left-heart catheterization, which showed a 50% to 60% stenosis in the left main coronary artery, with involvement of the left circumflex artery proximally, in addition to a “tight” first-diagonal stenosis, a 90% stenosis in a large (> 3.0-mm) proximal segment of the LAD, an 80% stenosis in a large (> 3.0-mm) mid-LAD segment, and a 40% stenosis in a large (> 3.0-mm) second diagonal artery (Figure 2).
He was referred for cardiac surgery and underwent triple coronary artery bypass grafting: the left internal thoracic artery was grafted to the LAD, a reverse saphenous vein graft was performed to the diagonal artery, and a reverse saphenous vein graft was performed to the obtuse marginal artery.
A PRECURSOR TO INFARCTION
Wellens et al described specific precordial T-wave changes in patients with unstable angina who subsequently developed anterior wall myocardial infarction.1
The importance of Wellens syndrome is that it occurs in the pain-free interval when no other evidence of ischemia or angina may be present.1 Cardiac enzyme levels are typically normal or only minimally elevated; only 12% of patients with this syndrome have elevated cardiac biomarker levels.2
Given the extent of myocardial injury, urgent echocardiography can show a wall-motion abnormality even if cardiac enzyme levels are normal. This gives important insight into electrocardiographic changes and should prompt consideration of revascularization.
Even with extensive medical management, Wellens syndrome progresses to acute anterior wall ischemia. About 75% of patients with Wellens syndrome who receive medical management but do not undergo revascularization (eg, coronary artery bypass grafting, percutaneous coronary intervention) develop extensive anterior wall infarction within days.1,3 Despite negative cardiac biomarkers, Wellens syndrome is considered an acute coronary syndrome requiring urgent cardiac intervention.
- Movahed MR. Wellens’ syndrome or inverted U-waves? Clin Cardiol 2008; 31:133–134.
- de Zwaan C, Bär FW, Janssen JH, et al. Angiographic and clinical characteristics of patients with unstable angina showing an ECG pattern indicating critical narrowing of the proximal LAD coronary artery. Am Heart J 1989; 117:657–665.
- de Zwaan C, Bär FW, Wellens HJ. Characteristic electrocardiographic pattern indicating a critical stenosis high in left anterior descending coronary artery in patients admitted because of impending myocardial infarction. Am Heart J 1982; 103:730–736.
Peripheral opacity on plain chest radiography
An 82-year-old woman was admitted to the hospital with dyspnea and chest discomfort over the past 24 hours. She was known to have paroxysmal atrial fibrillation and was taking warfarin, but that had been stopped 2 weeks earlier because of an acute ischemic stroke.
At the time of admission, she had no fever, cough, orthopnea, or leg swelling. Her physical activity was restricted, with residual right-sided weakness after her stroke. Her heart rate was 125 bpm; her oxygen saturation level was 98% on 2 L of oxygen per minute via nasal cannula. She had an irregularly irregular rhythm, a jugular venous pressure of 7 cm H2O, and no cardiac murmurs. Lung sounds were reduced at the bases, with faint crepitations.
Her hemoglobin concentration and white blood cell count were normal. Her brain-natriuretic peptide level was elevated at 2,648 pg/mL (reference range < 167), but cardiac enzyme levels were normal.
Electrocardiography showed atrial fibrillation with rapid ventricular response.
Plain chest radiography showed a 3-cm wedge-shaped opacity in the right mid-thorax (Figure 1), a finding known as the Hampton hump—a sign of pulmonary infarction caused by embolism.
Contrast-enhanced computed tomography (CT) of the chest showed acute thromboembolism in the right interlobar artery and wedge-shaped consolidation in the right-middle lobe (Figure 2), indicating pulmonary infarction.
Brain CT showed a stable infarction. Anticoagulation was restarted, and the patient was discharged in stable condition.
THE HAMPTON HUMP IN PULMONARY EMBOLISM
Because the lungs have a dual blood supply, pulmonary infarction is seen in only a minority of cases of pulmonary embolism. Infarction is more common in patients with peripheral pulmonary embolism, owing to the rapid inflow of bronchial blood, and in patients with medical comorbidities such as heart failure and chronic lung disease.2
The Hampton hump, first described by Aubrey Otis Hampton in 1940, is a peripheral (pleural-based) opacity that represents alveolar hemorrhage from underlying pulmonary infarction. It is one of several radiographic features that have been associated with pulmonary embolism; another is the Westermark sign, indicating oligemia.3
Worsley et al4 examined the diagnostic value of these radiographic features and found that the Hampton hump had a sensitivity of 22% and a specificity of 82% for detecting pulmonary embolism in the right hemithorax, and 24% and 82%, respectively, in the left hemithorax. The prevalence of pleural-based opacities was not significantly different in patients with or without pulmonary embolism. The authors concluded that chest radiography has limited diagnostic value in excluding or diagnosing pulmonary embolism.
In contrast, computed tomographic pulmonary angiography is the first-line imaging test in patients with suspected pulmonary embolism, because of its high sensitivity and specificity.1
We were not specifically looking for a pulmonary embolism when we found this new opacity on our patient’s radiograph, but this prompted further imaging, which led to the diagnosis. Although a near-normal chest radiograph is the most common radiologic finding in pulmonary embolism, this case shows how careful observation can detect unusual signs.
- Mos IC, Klok FA, Kroft LJ, de Roos A, Huisman MV. Imaging tests in the diagnosis of pulmonary embolism. Semin Respir Crit Care Med 2012; 33:138–143.
- Cha SI, Shin KM, Lee J, et al. Clinical relevance of pulmonary infarction in patients with pulmonary embolism. Thromb Res 2012; 130:e1–e5.
- Algın O, GÖkalp G, Topal U. Signs in chest imaging. Diagn Interv Radiol 2011; 17:18–29.
- Worsley DF, Alavi A, Aronchick JM, Chen JT, Greenspan RH, Ravin CE. Chest radiographic findings in patients with acute pulmonary embolism: observations from the PIOPED study. Radiology 1993; 189:133–136.
An 82-year-old woman was admitted to the hospital with dyspnea and chest discomfort over the past 24 hours. She was known to have paroxysmal atrial fibrillation and was taking warfarin, but that had been stopped 2 weeks earlier because of an acute ischemic stroke.
At the time of admission, she had no fever, cough, orthopnea, or leg swelling. Her physical activity was restricted, with residual right-sided weakness after her stroke. Her heart rate was 125 bpm; her oxygen saturation level was 98% on 2 L of oxygen per minute via nasal cannula. She had an irregularly irregular rhythm, a jugular venous pressure of 7 cm H2O, and no cardiac murmurs. Lung sounds were reduced at the bases, with faint crepitations.
Her hemoglobin concentration and white blood cell count were normal. Her brain-natriuretic peptide level was elevated at 2,648 pg/mL (reference range < 167), but cardiac enzyme levels were normal.
Electrocardiography showed atrial fibrillation with rapid ventricular response.
Plain chest radiography showed a 3-cm wedge-shaped opacity in the right mid-thorax (Figure 1), a finding known as the Hampton hump—a sign of pulmonary infarction caused by embolism.
Contrast-enhanced computed tomography (CT) of the chest showed acute thromboembolism in the right interlobar artery and wedge-shaped consolidation in the right-middle lobe (Figure 2), indicating pulmonary infarction.
Brain CT showed a stable infarction. Anticoagulation was restarted, and the patient was discharged in stable condition.
THE HAMPTON HUMP IN PULMONARY EMBOLISM
Because the lungs have a dual blood supply, pulmonary infarction is seen in only a minority of cases of pulmonary embolism. Infarction is more common in patients with peripheral pulmonary embolism, owing to the rapid inflow of bronchial blood, and in patients with medical comorbidities such as heart failure and chronic lung disease.2
The Hampton hump, first described by Aubrey Otis Hampton in 1940, is a peripheral (pleural-based) opacity that represents alveolar hemorrhage from underlying pulmonary infarction. It is one of several radiographic features that have been associated with pulmonary embolism; another is the Westermark sign, indicating oligemia.3
Worsley et al4 examined the diagnostic value of these radiographic features and found that the Hampton hump had a sensitivity of 22% and a specificity of 82% for detecting pulmonary embolism in the right hemithorax, and 24% and 82%, respectively, in the left hemithorax. The prevalence of pleural-based opacities was not significantly different in patients with or without pulmonary embolism. The authors concluded that chest radiography has limited diagnostic value in excluding or diagnosing pulmonary embolism.
In contrast, computed tomographic pulmonary angiography is the first-line imaging test in patients with suspected pulmonary embolism, because of its high sensitivity and specificity.1
We were not specifically looking for a pulmonary embolism when we found this new opacity on our patient’s radiograph, but this prompted further imaging, which led to the diagnosis. Although a near-normal chest radiograph is the most common radiologic finding in pulmonary embolism, this case shows how careful observation can detect unusual signs.
- Mos IC, Klok FA, Kroft LJ, de Roos A, Huisman MV. Imaging tests in the diagnosis of pulmonary embolism. Semin Respir Crit Care Med 2012; 33:138–143.
- Cha SI, Shin KM, Lee J, et al. Clinical relevance of pulmonary infarction in patients with pulmonary embolism. Thromb Res 2012; 130:e1–e5.
- Algın O, GÖkalp G, Topal U. Signs in chest imaging. Diagn Interv Radiol 2011; 17:18–29.
- Worsley DF, Alavi A, Aronchick JM, Chen JT, Greenspan RH, Ravin CE. Chest radiographic findings in patients with acute pulmonary embolism: observations from the PIOPED study. Radiology 1993; 189:133–136.
Is anticoagulation appropriate for all patients with portal vein thrombosis?
No. in general, the decision to treat portal vein thrombosis with anticoagulant drugs is complex and depends on whether the thrombosis is acute or chronic, and whether the cause is a local factor, cirrhosis of the liver, or a systemic condition (Table 1). A “one-size-fits-all” approach should be avoided (Figure 1).
ACUTE PORTAL VEIN THROMBOSIS WITHOUT CIRRHOSIS
No randomized controlled trial has yet evaluated anticoagulation in acute portal vein thrombosis. But a prospective study published in 2010 showed that the portal vein and its left or right branch were patent in 39% of anticoagulated patients (vs 13% initially), the splenic vein in 80% (vs 57% initially), and the superior mesenteric vein in 73% (vs 42% initially).1 Further, there appears to be a 20% reduction in the overall mortality rate associated with anticoagulation for acute portal vein thrombosis in retrospective studies.2
In the absence of contraindications, anticoagulation with heparin or low-molecular-weight heparin is recommended, with complete bridging to oral anticoagulation with a vitamin K antagonist. Anticoagulation should be continued for at least 3 months, and indefinitely in patients with permanent hypercoaguable risk factors.3
CHRONIC PORTAL VEIN THROMBOSIS WITHOUT CIRRHOSIS
All patients with chronic portal vein thrombosis should undergo esophagogastroduodenoscopy to evaluate for varices. Patients with large varices should be treated orally with a nonselective beta-adrenergic blocker or endoscopically. Though no prospective study has validated this practice, a retrospective analysis showed a decreased risk of first or recurrent bleeding.4
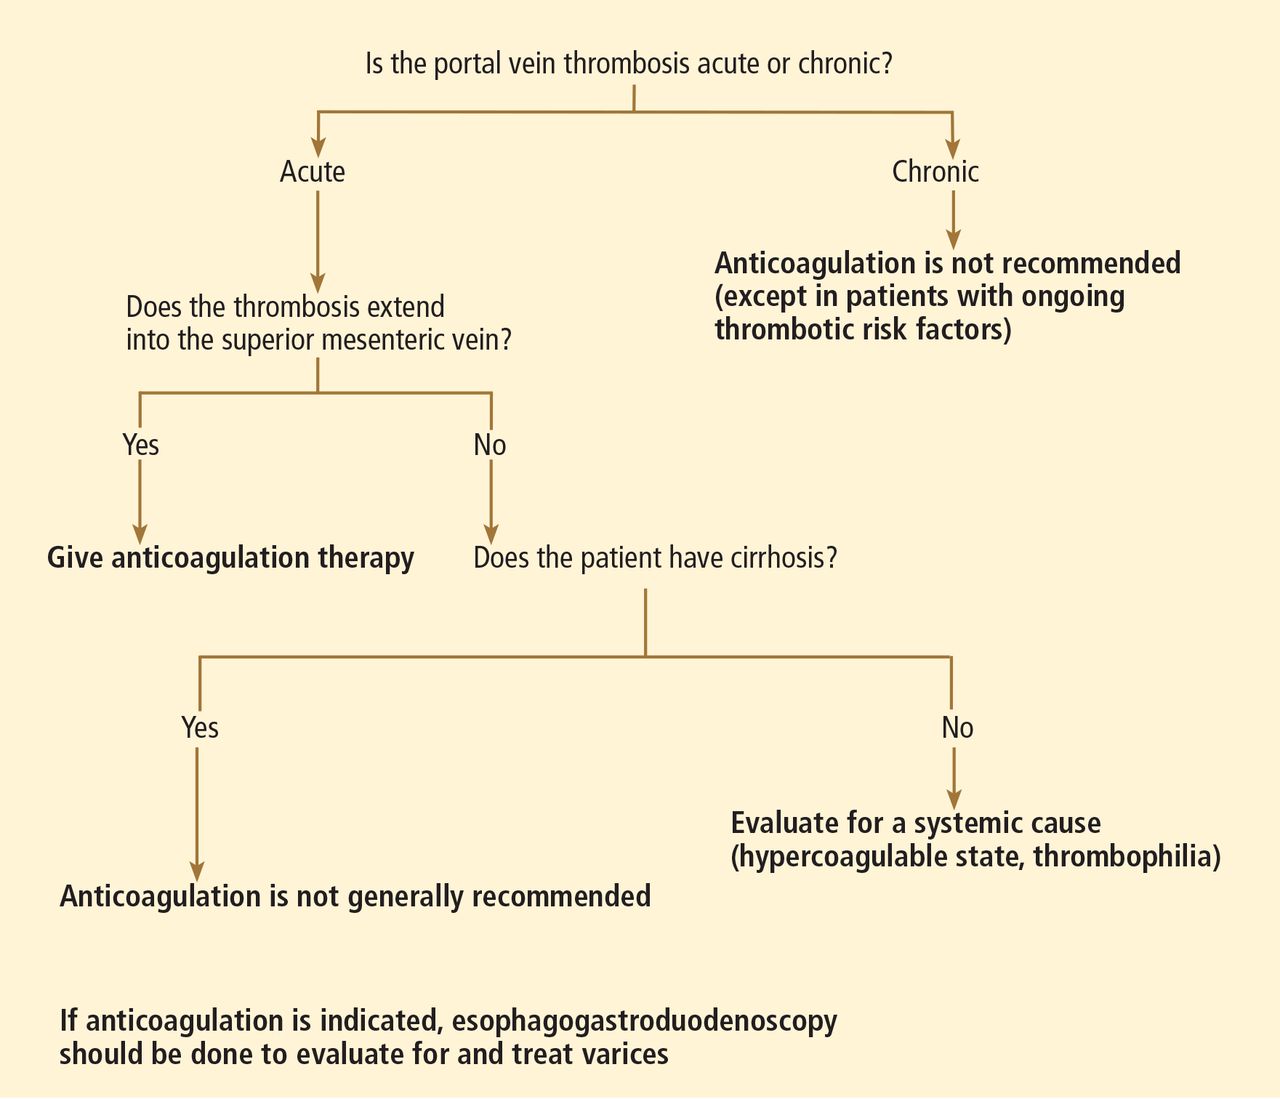
In 2007, a retrospective study showed a lower rate of death in patients with portomesenteric venous thrombosis treated with an oral vitamin K antagonist.5 Patients with chronic portal vein thrombosis with ongoing thrombotic risk factors should be treated with long-term anticoagulation after screening for varices, and if varices are present, primary prophylaxis should be started.3 With this approach, less than 5% of patients died from classic complications of portal vein thrombosis at 5 years of follow-up.4
ACUTE OR CHRONIC PORTAL VEIN THROMBOSIS WITH CIRRHOSIS
Portal vein thrombosis is common in patients with underlying cirrhosis. The risk in patients with cirrhosis significantly increases as liver function worsens. In patients with well-compensated cirrhosis, the risk is less than 1% vs 8% to 25% in those with advanced cirrhosis.6
In patients awaiting liver transplantation, a large retrospective study7 showed that the rate of partial or complete recanalization of the splanchnic veins was significantly higher in those who received anticoagulation (8 of 19) than in those who did not (0 of 10, P = .002). The rate of survival was significantly lower in those who had complete thrombotic obstruction of the portal vein at the time of surgery (P = .04). However, there was no difference in survival rates between those with partial obstruction who received anticoagulation and those with a patent portal vein.7
A later retrospective study8 showed no significant benefit in the rate of transplantation-free survival or survival after liver transplantation in patients with or without chronic portal vein thrombosis.8
Unfortunately, we have no data from prospective controlled trials and only limited data from retrospective studies to make a strong recommendation for or against anticoagulation in either acute and chronic portal vein thrombosis associated with cirrhosis. As such, each case must be evaluated on an individual basis in association with expert consultation.
In our experience, the risk of bleeding in patients with liver cirrhosis is substantial because of the decreased synthesis of coagulation factors and the presence of varices, whereas the efficacy and the benefits of recanalizing the portal vein in asymptomatic patients with liver cirrhosis and portal vein thrombosis are unknown. Therefore, unless the thrombosis extends into the mesenteric vein, thus posing a risk of mesenteric ischemia, we do not generally recommend anticoagulation in asymptomatic portal vein thrombosis in patients with cirrhosis.
- Plessier A, Darwish-Murad S, Hernandez-Guerra M, et al; European Network for Vascular Disorders of the Liver (EN-Vie). Acute portal vein thrombosis unrelated to cirrhosis: a prospective multicenter follow-up study. Hepatology 2010; 51:210–218.
- Kumar S, Sarr MG, Kamath PS. Mesenteric venous thrombosis. N Engl J Med 2001; 345:1683–1688.
- de Franchis R. Evolving consensus in portal hypertension. Report of the Baveno IV consensus workshop on methodology of diagnosis and therapy in portal hypertension. J Hepatol 2005; 43:167–176.
- Condat B, Pessione F, Hillaire S, et al. Current outcome of portal vein thrombosis in adults: risk and benefit of anticoagulant therapy. Gastroenterology 2001; 120:490–497.
- Orr DW, Harrison PM, Devlin J, et al. Chronic mesenteric venous thrombosis: evaluation and determinants of survival during long-term follow-up. Clin Gastroenterol Hepatol 2007; 5:80–86.
- DeLeve LD, Valla DC, Garcia-Tsao G; American Association for the Study of Liver Diseases. Vascular disorders of the liver. Hepatology 2009; 49:1729–1764.
- Francoz C, Belghiti J, Vilgrain V, et al. Splanchnic vein thrombosis in candidates for liver transplantation: usefulness of screening and anticoagulation. Gut 2005; 54:691–697.
- John BV, Konjeti VR, Aggarwal A, et al. The impact of portal vein thrombosis (PVT) on cirrhotics awaiting liver transplantation (abstract). Hepatology 2010; 52(suppl1):888A–889A.
No. in general, the decision to treat portal vein thrombosis with anticoagulant drugs is complex and depends on whether the thrombosis is acute or chronic, and whether the cause is a local factor, cirrhosis of the liver, or a systemic condition (Table 1). A “one-size-fits-all” approach should be avoided (Figure 1).
ACUTE PORTAL VEIN THROMBOSIS WITHOUT CIRRHOSIS
No randomized controlled trial has yet evaluated anticoagulation in acute portal vein thrombosis. But a prospective study published in 2010 showed that the portal vein and its left or right branch were patent in 39% of anticoagulated patients (vs 13% initially), the splenic vein in 80% (vs 57% initially), and the superior mesenteric vein in 73% (vs 42% initially).1 Further, there appears to be a 20% reduction in the overall mortality rate associated with anticoagulation for acute portal vein thrombosis in retrospective studies.2
In the absence of contraindications, anticoagulation with heparin or low-molecular-weight heparin is recommended, with complete bridging to oral anticoagulation with a vitamin K antagonist. Anticoagulation should be continued for at least 3 months, and indefinitely in patients with permanent hypercoaguable risk factors.3
CHRONIC PORTAL VEIN THROMBOSIS WITHOUT CIRRHOSIS
All patients with chronic portal vein thrombosis should undergo esophagogastroduodenoscopy to evaluate for varices. Patients with large varices should be treated orally with a nonselective beta-adrenergic blocker or endoscopically. Though no prospective study has validated this practice, a retrospective analysis showed a decreased risk of first or recurrent bleeding.4
In 2007, a retrospective study showed a lower rate of death in patients with portomesenteric venous thrombosis treated with an oral vitamin K antagonist.5 Patients with chronic portal vein thrombosis with ongoing thrombotic risk factors should be treated with long-term anticoagulation after screening for varices, and if varices are present, primary prophylaxis should be started.3 With this approach, less than 5% of patients died from classic complications of portal vein thrombosis at 5 years of follow-up.4
ACUTE OR CHRONIC PORTAL VEIN THROMBOSIS WITH CIRRHOSIS
Portal vein thrombosis is common in patients with underlying cirrhosis. The risk in patients with cirrhosis significantly increases as liver function worsens. In patients with well-compensated cirrhosis, the risk is less than 1% vs 8% to 25% in those with advanced cirrhosis.6
In patients awaiting liver transplantation, a large retrospective study7 showed that the rate of partial or complete recanalization of the splanchnic veins was significantly higher in those who received anticoagulation (8 of 19) than in those who did not (0 of 10, P = .002). The rate of survival was significantly lower in those who had complete thrombotic obstruction of the portal vein at the time of surgery (P = .04). However, there was no difference in survival rates between those with partial obstruction who received anticoagulation and those with a patent portal vein.7
A later retrospective study8 showed no significant benefit in the rate of transplantation-free survival or survival after liver transplantation in patients with or without chronic portal vein thrombosis.8
Unfortunately, we have no data from prospective controlled trials and only limited data from retrospective studies to make a strong recommendation for or against anticoagulation in either acute and chronic portal vein thrombosis associated with cirrhosis. As such, each case must be evaluated on an individual basis in association with expert consultation.
In our experience, the risk of bleeding in patients with liver cirrhosis is substantial because of the decreased synthesis of coagulation factors and the presence of varices, whereas the efficacy and the benefits of recanalizing the portal vein in asymptomatic patients with liver cirrhosis and portal vein thrombosis are unknown. Therefore, unless the thrombosis extends into the mesenteric vein, thus posing a risk of mesenteric ischemia, we do not generally recommend anticoagulation in asymptomatic portal vein thrombosis in patients with cirrhosis.
- Plessier A, Darwish-Murad S, Hernandez-Guerra M, et al; European Network for Vascular Disorders of the Liver (EN-Vie). Acute portal vein thrombosis unrelated to cirrhosis: a prospective multicenter follow-up study. Hepatology 2010; 51:210–218.
- Kumar S, Sarr MG, Kamath PS. Mesenteric venous thrombosis. N Engl J Med 2001; 345:1683–1688.
- de Franchis R. Evolving consensus in portal hypertension. Report of the Baveno IV consensus workshop on methodology of diagnosis and therapy in portal hypertension. J Hepatol 2005; 43:167–176.
- Condat B, Pessione F, Hillaire S, et al. Current outcome of portal vein thrombosis in adults: risk and benefit of anticoagulant therapy. Gastroenterology 2001; 120:490–497.
- Orr DW, Harrison PM, Devlin J, et al. Chronic mesenteric venous thrombosis: evaluation and determinants of survival during long-term follow-up. Clin Gastroenterol Hepatol 2007; 5:80–86.
- DeLeve LD, Valla DC, Garcia-Tsao G; American Association for the Study of Liver Diseases. Vascular disorders of the liver. Hepatology 2009; 49:1729–1764.
- Francoz C, Belghiti J, Vilgrain V, et al. Splanchnic vein thrombosis in candidates for liver transplantation: usefulness of screening and anticoagulation. Gut 2005; 54:691–697.
- John BV, Konjeti VR, Aggarwal A, et al. The impact of portal vein thrombosis (PVT) on cirrhotics awaiting liver transplantation (abstract). Hepatology 2010; 52(suppl1):888A–889A.
Lung air-fluid level in a smoker
A 49-year-old man was referred for evaluation of an abnormal chest radiograph. A 25-pack-year smoker, he had a history of chronic shortness of breath on exertion with occasional coughing and whitish sputum production. He also had a history of hypertension. He had not had hemoptysis, fever, chills, weight loss, or other symptoms, and he had not traveled recently.
On examination, he appeared comfortable. His breath sounds were decreased bilaterally; the rest of his physical examination was normal. His medical history, social history, and review of systems were otherwise unremarkable.
His white blood cell count was 9.4 × 10⁹/L (reference range 4.5–11.0), with a normal differential. His hemoglobin concentration was 166 g/L (140–175).
Pulmonary function testing demonstrated moderate obstruction, with the following values:
- Forced expiratory volume in the first second of expiration/ forced vital capacity 0.65
- Forced expiratory volume in the first second of expiration 2.40 L (72% of predicted)
- Total lung capacity 7.11 L (92% of predicted)
- Diffusing capacity of lung for carbon monoxide 58% of predicted.
He underwent radiography (Figure 1) and computed tomography of the chest (Figure 2).
DIAGNOSIS: INFECTED EMPHYSEMATOUS BULLAE
The patient had infected emphysematous bullae.
The diagnosis can typically be made by the new development of an air-fluid level in a patient known to have preexisting emphysematous bullae.1 If previous images are not available, the presence of other bullae in a patient with established chronic obstructive pulmonary disease, a thin-walled cavity, and a disproportionate presentation with impressive radiographic findings along with a subtle clinical picture can support the diagnosis.2 In most reported cases, patients are not significantly symptomatic or ill.3 The differential diagnosis includes loculated parapneumonic pleural effusion,4 lung abscess,5 tuberculosis,6 and infected pneumatocele.
Since percutaneous aspiration of the bullae has been discouraged,2 the causative organism is often not identified. Also, the role of bronchoscopy in the diagnostic evaluation and treatment of infected emphysematous bullae appears to be limited.7
Our patient had minimal symptoms and did not appear ill; he had a relatively unremarkable physical examination, no leukocytosis, and negative blood and sputum cultures, suggesting a benign presentation. In addition, chest radiography a few months before this presentation showed multiple large emphysematous bullae (Figure 3). The current chest radiograph suggested multiple thin-walled cavitary lesions with an air-fluid level, which was confirmed on computed tomography.
TREATMENT OF INFECTED EMPHYSEMATOUS BULLAE
Currently, there is no established therapy for infected emphysematous bullae. Because the presentation is usually relatively benign in most case series, conservative treatment with a prolonged course of antibiotics alone seems to be the most appropriate initial course of action. A follow-up evaluation with chest imaging is recommended. On the other hand, in patients with worse symptoms, percutaneous aspiration of the bullae should be considered, as it may guide antibiotic therapy.8
We started our patient on clindamycin and scheduled him for follow-up chest imaging in 6 weeks.
- Burgener FA. Pulmonary cavitary and cystic lesions. In:Burgener FA, Kormano M, Pudas T, editors. Differential Diagnosis in Conventional Radiology. 3rd ed. New York, Thieme; 2008: chap.24.
- Chandra D, Soubra SH, Musher DM. A 57-year-old man with a fluid-containing lung cavity: infection of an emphysematous bulla with methicillin-resistant Staphylococcus aureus. Chest 2006; 130:1942–1946.
- Leatherman JW, McDonald FM, Niewohner DE. Fluid-containing bullae in the lung. South Med J 1985; 78:708–710.
- Sahn SA. Diagnosis and management of parapneumonic effusions and empyema. Clin Infect Dis 2007; 45:1480–1486.
- Hammond JM, Potgieter PD, Hanslo D, Scott H, Roditi D. The etiology and antimicrobial susceptibility patterns of microorganisms in acute community-acquired lung abscess. Chest 1995; 108:937–941.
- Woodring JH, Vandiviere HM, Fried AM, Dillon ML, Williams TD, Melvin IG. Update: the radiographic features of pulmonary tuberculosis. AJR Am J Roentgenol 1986; 146:497–506.
- Chandra D, Rose SR, Carter RB, Musher DM, Hamill RJ. Fluid-containing emphysematous bullae: a spectrum of illness. Eur Respir J 2008; 32:303–306.
- Henao-Martinez AF, Fernandez JF, Adams SG, Restrepo C. Lung bullae with air-fluid levels: what is the appropriate therapeutic approach? Respir Care 2012; 57:642–645.
A 49-year-old man was referred for evaluation of an abnormal chest radiograph. A 25-pack-year smoker, he had a history of chronic shortness of breath on exertion with occasional coughing and whitish sputum production. He also had a history of hypertension. He had not had hemoptysis, fever, chills, weight loss, or other symptoms, and he had not traveled recently.
On examination, he appeared comfortable. His breath sounds were decreased bilaterally; the rest of his physical examination was normal. His medical history, social history, and review of systems were otherwise unremarkable.
His white blood cell count was 9.4 × 10⁹/L (reference range 4.5–11.0), with a normal differential. His hemoglobin concentration was 166 g/L (140–175).
Pulmonary function testing demonstrated moderate obstruction, with the following values:
- Forced expiratory volume in the first second of expiration/ forced vital capacity 0.65
- Forced expiratory volume in the first second of expiration 2.40 L (72% of predicted)
- Total lung capacity 7.11 L (92% of predicted)
- Diffusing capacity of lung for carbon monoxide 58% of predicted.
He underwent radiography (Figure 1) and computed tomography of the chest (Figure 2).
DIAGNOSIS: INFECTED EMPHYSEMATOUS BULLAE
The patient had infected emphysematous bullae.
The diagnosis can typically be made by the new development of an air-fluid level in a patient known to have preexisting emphysematous bullae.1 If previous images are not available, the presence of other bullae in a patient with established chronic obstructive pulmonary disease, a thin-walled cavity, and a disproportionate presentation with impressive radiographic findings along with a subtle clinical picture can support the diagnosis.2 In most reported cases, patients are not significantly symptomatic or ill.3 The differential diagnosis includes loculated parapneumonic pleural effusion,4 lung abscess,5 tuberculosis,6 and infected pneumatocele.
Since percutaneous aspiration of the bullae has been discouraged,2 the causative organism is often not identified. Also, the role of bronchoscopy in the diagnostic evaluation and treatment of infected emphysematous bullae appears to be limited.7
Our patient had minimal symptoms and did not appear ill; he had a relatively unremarkable physical examination, no leukocytosis, and negative blood and sputum cultures, suggesting a benign presentation. In addition, chest radiography a few months before this presentation showed multiple large emphysematous bullae (Figure 3). The current chest radiograph suggested multiple thin-walled cavitary lesions with an air-fluid level, which was confirmed on computed tomography.
TREATMENT OF INFECTED EMPHYSEMATOUS BULLAE
Currently, there is no established therapy for infected emphysematous bullae. Because the presentation is usually relatively benign in most case series, conservative treatment with a prolonged course of antibiotics alone seems to be the most appropriate initial course of action. A follow-up evaluation with chest imaging is recommended. On the other hand, in patients with worse symptoms, percutaneous aspiration of the bullae should be considered, as it may guide antibiotic therapy.8
We started our patient on clindamycin and scheduled him for follow-up chest imaging in 6 weeks.
- Burgener FA. Pulmonary cavitary and cystic lesions. In:Burgener FA, Kormano M, Pudas T, editors. Differential Diagnosis in Conventional Radiology. 3rd ed. New York, Thieme; 2008: chap.24.
- Chandra D, Soubra SH, Musher DM. A 57-year-old man with a fluid-containing lung cavity: infection of an emphysematous bulla with methicillin-resistant Staphylococcus aureus. Chest 2006; 130:1942–1946.
- Leatherman JW, McDonald FM, Niewohner DE. Fluid-containing bullae in the lung. South Med J 1985; 78:708–710.
- Sahn SA. Diagnosis and management of parapneumonic effusions and empyema. Clin Infect Dis 2007; 45:1480–1486.
- Hammond JM, Potgieter PD, Hanslo D, Scott H, Roditi D. The etiology and antimicrobial susceptibility patterns of microorganisms in acute community-acquired lung abscess. Chest 1995; 108:937–941.
- Woodring JH, Vandiviere HM, Fried AM, Dillon ML, Williams TD, Melvin IG. Update: the radiographic features of pulmonary tuberculosis. AJR Am J Roentgenol 1986; 146:497–506.
- Chandra D, Rose SR, Carter RB, Musher DM, Hamill RJ. Fluid-containing emphysematous bullae: a spectrum of illness. Eur Respir J 2008; 32:303–306.
- Henao-Martinez AF, Fernandez JF, Adams SG, Restrepo C. Lung bullae with air-fluid levels: what is the appropriate therapeutic approach? Respir Care 2012; 57:642–645.
Should we still use electrocardiography to diagnose pericardial disease?
Yes. Acute pericarditis has a unique clinical presentation, physical findings, and electrocardiographic (ECG) changes. ECG is always ordered to look for ischemic changes in patients with chest pain. Acute pericarditis develops in stages, which makes it easy to differentiate from early repolarization and, more significantly, myocardial infarction. The ECG changes, along with the clinical presentation and physical findings, can make the diagnosis of pericarditis.
In atypical and complicated cases, advanced imaging studies (ie, echocardiography and cardiac magnetic resonance imaging) have been used to confirm the diagnosis and to follow the course of the disease. However, ECG remains a useful, cost-effective test.
PERICARDIAL DISEASE IS DIVERSE
The pericardium is a thin layer that covers the heart and separates it from other structures in the mediastinum.
Pericardial syndromes include acute, recurrent, constrictive, and effusive-constrictive pericarditis, as well as pericardial effusion with or without tamponade. Causes include viral or bacterial infection, postpericardiotomy syndrome (Dressler syndrome), postmyocardial infarction, primary and metastatic tumors, trauma, uremia, radiation, and autoimmune disease, but pericardial syndromes can also be idiopathic.1
Acute pericarditis is the most common pericardial syndrome and occurs in all age groups. Once diagnosed, it can easily be treated with antiinflammatory drugs. However, recurrent pericarditis, reported in 30% of patients experiencing a first attack of pericarditis, can be difficult to manage, can have a significant impact on the patient’s health, and can be life-threatening.2
CHANGES OF ACUTE PERICARDITIS DEVELOP IN STAGES
Pericarditis can be diagnosed on the basis of ECG changes, clinical signs and symptoms, and laboratory and imaging findings.3 ECG criteria of acute pericarditis have been published.4,5
The characteristic chest pain in acute pericarditis is usually sudden in onset and sharp and occurs over the anterior chest wall. The pain is exacerbated by inspiration and decreases when the patient sits up and leans forward.4
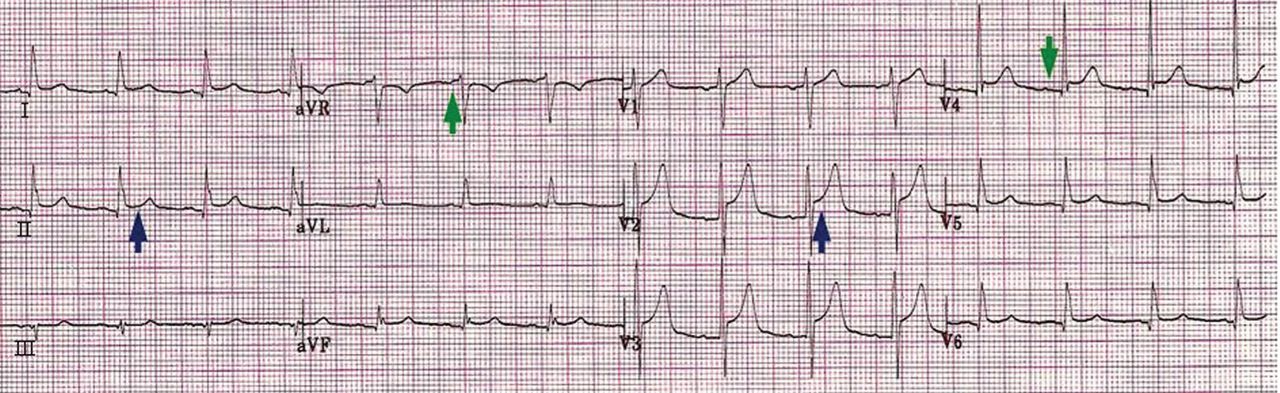
ECG classically shows a widespread saddle-shaped (upward concave) ST-segment elevation in the precordial and limb leads, reflecting subepicardial inflammation. PR-segment depression (with PR-segment elevation in lead aVR) can accompany or precede the ST changes and is known as the “discordant ST-PR segment sign” (Figures 1 and 2). These changes are seen in 60% of patients.
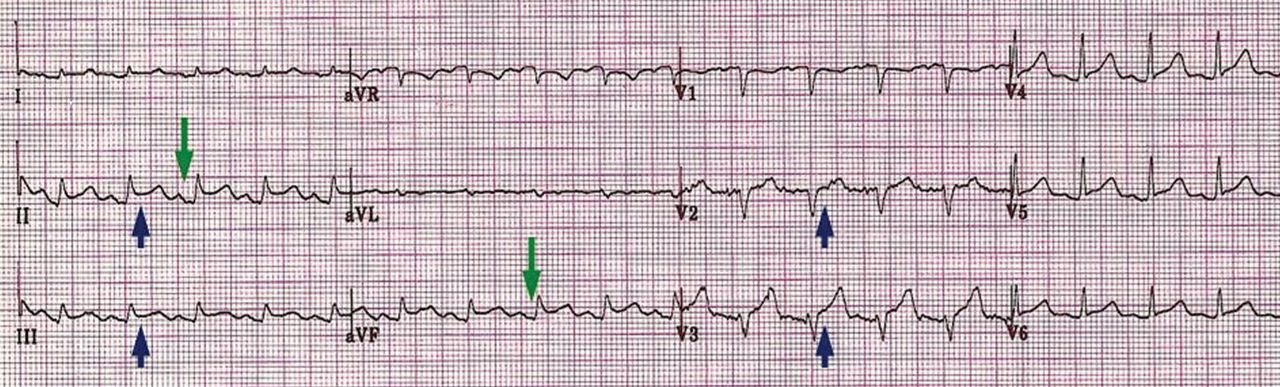
The ECG changes develop in stages, making them easy to differentiate from early repolarization and, more significantly, from myocardial infarction. Four stages are apparent1,4,6–9:
- Stage I occurs in a few hours to days, with diffuse, up-sloping ST-segment elevation and upright T waves, the result of an alteration in ventricular repolarization caused by pericardial inflammation. Because of alteration in repolarization of the atrium secondary to inflammation, the PR segment is elevated in aVR and depressed in the rest of the limb and chest leads.
- Stage II—the ST and PR segments normalize.
- Stage III—widespread T-wave inversion.
- Stage IV—normalization of the T waves.
There is no pathologic Q-wave formation or loss of R-wave progression in acute pericarditis.
The ECG changes of pericarditis vary widely from one patient to another, depending on the extent and severity of pericardial inflammation and the timing of the patient’s presentation. Changes vary in duration. In some cases, ST elevation returns to baseline within a few days without T-wave inversions; in other cases, T-wave inversions can persist for weeks to months. Sometimes the abnormalities resolve by the time symptoms develop.
ASSOCIATED CONDITIONS
Myocardial involvement
In acute myocarditis, findings on ECG can be normal unless the pericardium is involved. Changes that can be seen in myocarditis and that indicate a deeper involvement of inflammation include ST-segment abnormalities, arrhythmias (eg, premature ventricular or atrial contractions), pathologic Q waves, intraventricular conduction delay, and right or left bundle branch block.1,10–12
Elevated troponin and new focal or global left ventricular dysfunction on cardiac imaging indicates myocarditis, especially in a patient with a normal coronary angiogram.10–13
Pericardial effusion: Tachycardia and low QRS voltage
Pericardial effusion is often a complication of pericarditis, but it can also develop from other conditions, such as myxedema, uremia, malignancy, connective tissue disease, aortic dissection, and postpericardiotomy syndrome, and it can also be iatrogenic.
The most common ECG sign of pericardial effusion is tachycardia and low voltage of the QRS complexes. Low voltage is defined as a total amplitude of the QRS complexes in each of the six limb leads less than or equal to 5 mm, and less than or equal to 10 mm in V1 through V6. However, low voltage is not always present in the chest leads.
Mechanisms proposed to explain low QRS voltage associated with pericardial effusion include internal short-circuiting of the electrical currents by accumulated fluids within the pericardial sac, greater distance of the heart from body surface electrodes, reduced cardiac size caused by effusion, and change in the generation and propagation of electrical current in the myocardium.14,15
Cardiac tamponade: Tachycardia, electrical alternans, low QRS voltage
Sinus tachycardia and electrical alternans are specific but not sensitive signs of pericardial tamponade (Figure 3).16,17 Electrical alternans is characterized by beat-to-beat alterations in the axis of QRS complexes in the limb and precordial leads as a result of the mechanical swinging of the heart in a large pericardial effusion.17 There is evidence to suggest that low QRS voltage is more the result of the tamponade than the effusion.18
Treating tamponade with pericardiocentesis, surgical creation of a fistula (“window”) between the pericardial space and the pleural cavity, or anti-inflammatory drugs can resolve low QRS voltage within 1 week.
DIFFERENTIAL DIAGNOSIS OF ACUTE PERICARDITIS
Acute myocardial infarction
ECG changes in acute pericarditis differ from those in acute myocardial infarction in many ways.
ST-segment elevation in pericarditis rarely exceeds 5 mm, in contrast to acute myocardial infarction, in which ST elevation at the J point has to be more than 2 mm and in two anatomically contiguous leads.19
In pericarditis, the changes occur more slowly and in stages, reflecting the evolving inflammation of different areas of the pericardium.
The ST segment is elevated diffusely in the precordial and limb leads in pericarditis, indicating involvement of more than one coronary vascular territory, differentiating it from characteristic regional changes in myocardial infarction.19,20
If concomitant atrial injury is present with acute pericarditis, then PR elevation in aVR with PR depression in other leads may be seen.
Finally, pathologic Q waves or high-grade heart block reflects acute myocardial infarction.
Early repolarization: Elevation of the J point
Early repolarization is sometimes seen in healthy young people, especially in black men.
Early repolarization is characterized by elevation of the J point (ie, the junction between the end of the QRS complex and the beginning of the ST segment). Elevation of the J point causes elevation of the ST segment in the mid to lateral precordial leads (V3–V6) with an up-right T wave.21
Acute pericarditis tends to cause ST-segment elevation in both the limb and precordial leads, whereas ST elevation in early repolarization mainly involves the lateral chest leads.
The PR segment is more prominent in acute pericarditis, especially in lead aVR.
Another finding that strongly favors acute pericarditis is the ratio of the height of the ST-segment junction to the height of the apex of the T wave of more than 0.25 in leads I, V4, V5, and V6 (Figure 4).5,8,22
- Imazio M, Trinchero R. Triage and management of acute pericarditis. Int J Cardiol 2007; 118:286–294.
- Little WC, Freeman GL. Pericardial disease. Circulation 2006; 113:1622–1632.
- Imazio M, Spodick DH, Brucato A, Trinchero R, Markel G, Adler Y. Diagnostic issues in the clinical management of pericarditis. Int J Clin Pract 2010; 64:1384–1392.
- Spodick DH. Acute pericarditis: current concepts and practice. JAMA 2003; 289:1150–1153.
- Troughton RW, Asher CR, Klein AL. Pericarditis. Lancet 2004; 363:717–727.
- Shabetai R. Acute pericarditis. Cardiol Clin 1990; 8:639–644.
- Baljepally R, Spodick DH. PR-segment deviation as the initial electrocardiographic response in acute pericarditis. Am J Cardiol 1998; 81:1505–1506.
- Spodick DH. Diagnostic electrocardiographic sequences in acute pericarditis. Significance of PR segment and PR vector changes. Circulation 1973; 48:575–580.
- Spodick D, editor. The Pericardium: A Comprehensive Textbook. New York, NY: Marcel Dekker; 1997:46–64.
- Smith SC, Ladenson JH, Mason JW, Jaffe AS. Elevations of cardiac troponin I associated with myocarditis. Experimental and clinical correlates. Circulation 1997; 95:163–168.
- Sarda L, Colin P, Boccara F, et al. Myocarditis in patients with clinical presentation of myocardial infarction and normal coronary angiograms. J Am Coll Cardiol 2001; 37:786–792.
- Spodick DH. Arrhythmias during acute pericarditis. A prospective study of 100 consecutive cases. JAMA 1976; 235:39–41.
- Imazio M, Trinchero R. Myopericarditis: etiology, management, and prognosis. Int J Cardiol 2008; 127:17–26.
- Toney JC, Kolmen SN. Cardiac tamponade: fluid and pressure effects on electrocardiographic changes. Proc Soc Exp Biol Med 1966; 121:642–648.
- Karatay CM, Fruehan CT, Lighty GW, Spear RM, Smulyan H. Acute pericardial distension in pigs: effect of fluid conductance on body surface electrocardiogram QRS size. Cardiovasc Res 1993; 27:1033–1038.
- Spodick DH. Acute cardiac tamponade. Pathologic physiology, diagnosis and management. Prog Cardiovasc Dis 1967; 10:64–96.
- Eisenberg MJ, de Romeral LM, Heidenreich PA, Schiller NB, Evans GT. The diagnosis of pericardial effusion and cardiac tamponade by 12-lead ECG. A technology assessment. Chest 1996; 110:318–324.
- Bruch C, Schmermund A, Dagres N, et al. Changes in QRS voltage in cardiac tamponade and pericardial effusion: reversibility after pericardiocentesis and after anti-inflammatory drug treatment. J Am Coll Cardiol 2001; 38:219–226.
- Wang K, Asinger RW, Marriott HJ. ST-segment elevation in conditions other than acute myocardial infarction. N Engl J Med 2003; 349:2128–2135.
- Brady WJ, Perron A, Ullman E. Errors in emergency physician interpretation of ST-segment elevation in emergency department chest pain patients. Acad Emerg Med 2000; 7:1256–1260.
- Kambara H, Phillips J. Long-term evaluation of early repolarization syndrome (normal variant RS-T segment elevation). Am J Cardiol 1976; 38:157–166.
- Ginzton LE, Laks MM. The differential diagnosis of acute pericarditis from the normal variant: new electrocardiographic criteria. Circulation 1982; 65:1004–1009.
Yes. Acute pericarditis has a unique clinical presentation, physical findings, and electrocardiographic (ECG) changes. ECG is always ordered to look for ischemic changes in patients with chest pain. Acute pericarditis develops in stages, which makes it easy to differentiate from early repolarization and, more significantly, myocardial infarction. The ECG changes, along with the clinical presentation and physical findings, can make the diagnosis of pericarditis.
In atypical and complicated cases, advanced imaging studies (ie, echocardiography and cardiac magnetic resonance imaging) have been used to confirm the diagnosis and to follow the course of the disease. However, ECG remains a useful, cost-effective test.
PERICARDIAL DISEASE IS DIVERSE
The pericardium is a thin layer that covers the heart and separates it from other structures in the mediastinum.
Pericardial syndromes include acute, recurrent, constrictive, and effusive-constrictive pericarditis, as well as pericardial effusion with or without tamponade. Causes include viral or bacterial infection, postpericardiotomy syndrome (Dressler syndrome), postmyocardial infarction, primary and metastatic tumors, trauma, uremia, radiation, and autoimmune disease, but pericardial syndromes can also be idiopathic.1
Acute pericarditis is the most common pericardial syndrome and occurs in all age groups. Once diagnosed, it can easily be treated with antiinflammatory drugs. However, recurrent pericarditis, reported in 30% of patients experiencing a first attack of pericarditis, can be difficult to manage, can have a significant impact on the patient’s health, and can be life-threatening.2
CHANGES OF ACUTE PERICARDITIS DEVELOP IN STAGES
Pericarditis can be diagnosed on the basis of ECG changes, clinical signs and symptoms, and laboratory and imaging findings.3 ECG criteria of acute pericarditis have been published.4,5
The characteristic chest pain in acute pericarditis is usually sudden in onset and sharp and occurs over the anterior chest wall. The pain is exacerbated by inspiration and decreases when the patient sits up and leans forward.4
ECG classically shows a widespread saddle-shaped (upward concave) ST-segment elevation in the precordial and limb leads, reflecting subepicardial inflammation. PR-segment depression (with PR-segment elevation in lead aVR) can accompany or precede the ST changes and is known as the “discordant ST-PR segment sign” (Figures 1 and 2). These changes are seen in 60% of patients.
The ECG changes develop in stages, making them easy to differentiate from early repolarization and, more significantly, from myocardial infarction. Four stages are apparent1,4,6–9:
- Stage I occurs in a few hours to days, with diffuse, up-sloping ST-segment elevation and upright T waves, the result of an alteration in ventricular repolarization caused by pericardial inflammation. Because of alteration in repolarization of the atrium secondary to inflammation, the PR segment is elevated in aVR and depressed in the rest of the limb and chest leads.
- Stage II—the ST and PR segments normalize.
- Stage III—widespread T-wave inversion.
- Stage IV—normalization of the T waves.
There is no pathologic Q-wave formation or loss of R-wave progression in acute pericarditis.
The ECG changes of pericarditis vary widely from one patient to another, depending on the extent and severity of pericardial inflammation and the timing of the patient’s presentation. Changes vary in duration. In some cases, ST elevation returns to baseline within a few days without T-wave inversions; in other cases, T-wave inversions can persist for weeks to months. Sometimes the abnormalities resolve by the time symptoms develop.
ASSOCIATED CONDITIONS
Myocardial involvement
In acute myocarditis, findings on ECG can be normal unless the pericardium is involved. Changes that can be seen in myocarditis and that indicate a deeper involvement of inflammation include ST-segment abnormalities, arrhythmias (eg, premature ventricular or atrial contractions), pathologic Q waves, intraventricular conduction delay, and right or left bundle branch block.1,10–12
Elevated troponin and new focal or global left ventricular dysfunction on cardiac imaging indicates myocarditis, especially in a patient with a normal coronary angiogram.10–13
Pericardial effusion: Tachycardia and low QRS voltage
Pericardial effusion is often a complication of pericarditis, but it can also develop from other conditions, such as myxedema, uremia, malignancy, connective tissue disease, aortic dissection, and postpericardiotomy syndrome, and it can also be iatrogenic.
The most common ECG sign of pericardial effusion is tachycardia and low voltage of the QRS complexes. Low voltage is defined as a total amplitude of the QRS complexes in each of the six limb leads less than or equal to 5 mm, and less than or equal to 10 mm in V1 through V6. However, low voltage is not always present in the chest leads.
Mechanisms proposed to explain low QRS voltage associated with pericardial effusion include internal short-circuiting of the electrical currents by accumulated fluids within the pericardial sac, greater distance of the heart from body surface electrodes, reduced cardiac size caused by effusion, and change in the generation and propagation of electrical current in the myocardium.14,15
Cardiac tamponade: Tachycardia, electrical alternans, low QRS voltage
Sinus tachycardia and electrical alternans are specific but not sensitive signs of pericardial tamponade (Figure 3).16,17 Electrical alternans is characterized by beat-to-beat alterations in the axis of QRS complexes in the limb and precordial leads as a result of the mechanical swinging of the heart in a large pericardial effusion.17 There is evidence to suggest that low QRS voltage is more the result of the tamponade than the effusion.18
Treating tamponade with pericardiocentesis, surgical creation of a fistula (“window”) between the pericardial space and the pleural cavity, or anti-inflammatory drugs can resolve low QRS voltage within 1 week.
DIFFERENTIAL DIAGNOSIS OF ACUTE PERICARDITIS
Acute myocardial infarction
ECG changes in acute pericarditis differ from those in acute myocardial infarction in many ways.
ST-segment elevation in pericarditis rarely exceeds 5 mm, in contrast to acute myocardial infarction, in which ST elevation at the J point has to be more than 2 mm and in two anatomically contiguous leads.19
In pericarditis, the changes occur more slowly and in stages, reflecting the evolving inflammation of different areas of the pericardium.
The ST segment is elevated diffusely in the precordial and limb leads in pericarditis, indicating involvement of more than one coronary vascular territory, differentiating it from characteristic regional changes in myocardial infarction.19,20
If concomitant atrial injury is present with acute pericarditis, then PR elevation in aVR with PR depression in other leads may be seen.
Finally, pathologic Q waves or high-grade heart block reflects acute myocardial infarction.
Early repolarization: Elevation of the J point
Early repolarization is sometimes seen in healthy young people, especially in black men.
Early repolarization is characterized by elevation of the J point (ie, the junction between the end of the QRS complex and the beginning of the ST segment). Elevation of the J point causes elevation of the ST segment in the mid to lateral precordial leads (V3–V6) with an up-right T wave.21
Acute pericarditis tends to cause ST-segment elevation in both the limb and precordial leads, whereas ST elevation in early repolarization mainly involves the lateral chest leads.
The PR segment is more prominent in acute pericarditis, especially in lead aVR.
Another finding that strongly favors acute pericarditis is the ratio of the height of the ST-segment junction to the height of the apex of the T wave of more than 0.25 in leads I, V4, V5, and V6 (Figure 4).5,8,22
- Imazio M, Trinchero R. Triage and management of acute pericarditis. Int J Cardiol 2007; 118:286–294.
- Little WC, Freeman GL. Pericardial disease. Circulation 2006; 113:1622–1632.
- Imazio M, Spodick DH, Brucato A, Trinchero R, Markel G, Adler Y. Diagnostic issues in the clinical management of pericarditis. Int J Clin Pract 2010; 64:1384–1392.
- Spodick DH. Acute pericarditis: current concepts and practice. JAMA 2003; 289:1150–1153.
- Troughton RW, Asher CR, Klein AL. Pericarditis. Lancet 2004; 363:717–727.
- Shabetai R. Acute pericarditis. Cardiol Clin 1990; 8:639–644.
- Baljepally R, Spodick DH. PR-segment deviation as the initial electrocardiographic response in acute pericarditis. Am J Cardiol 1998; 81:1505–1506.
- Spodick DH. Diagnostic electrocardiographic sequences in acute pericarditis. Significance of PR segment and PR vector changes. Circulation 1973; 48:575–580.
- Spodick D, editor. The Pericardium: A Comprehensive Textbook. New York, NY: Marcel Dekker; 1997:46–64.
- Smith SC, Ladenson JH, Mason JW, Jaffe AS. Elevations of cardiac troponin I associated with myocarditis. Experimental and clinical correlates. Circulation 1997; 95:163–168.
- Sarda L, Colin P, Boccara F, et al. Myocarditis in patients with clinical presentation of myocardial infarction and normal coronary angiograms. J Am Coll Cardiol 2001; 37:786–792.
- Spodick DH. Arrhythmias during acute pericarditis. A prospective study of 100 consecutive cases. JAMA 1976; 235:39–41.
- Imazio M, Trinchero R. Myopericarditis: etiology, management, and prognosis. Int J Cardiol 2008; 127:17–26.
- Toney JC, Kolmen SN. Cardiac tamponade: fluid and pressure effects on electrocardiographic changes. Proc Soc Exp Biol Med 1966; 121:642–648.
- Karatay CM, Fruehan CT, Lighty GW, Spear RM, Smulyan H. Acute pericardial distension in pigs: effect of fluid conductance on body surface electrocardiogram QRS size. Cardiovasc Res 1993; 27:1033–1038.
- Spodick DH. Acute cardiac tamponade. Pathologic physiology, diagnosis and management. Prog Cardiovasc Dis 1967; 10:64–96.
- Eisenberg MJ, de Romeral LM, Heidenreich PA, Schiller NB, Evans GT. The diagnosis of pericardial effusion and cardiac tamponade by 12-lead ECG. A technology assessment. Chest 1996; 110:318–324.
- Bruch C, Schmermund A, Dagres N, et al. Changes in QRS voltage in cardiac tamponade and pericardial effusion: reversibility after pericardiocentesis and after anti-inflammatory drug treatment. J Am Coll Cardiol 2001; 38:219–226.
- Wang K, Asinger RW, Marriott HJ. ST-segment elevation in conditions other than acute myocardial infarction. N Engl J Med 2003; 349:2128–2135.
- Brady WJ, Perron A, Ullman E. Errors in emergency physician interpretation of ST-segment elevation in emergency department chest pain patients. Acad Emerg Med 2000; 7:1256–1260.
- Kambara H, Phillips J. Long-term evaluation of early repolarization syndrome (normal variant RS-T segment elevation). Am J Cardiol 1976; 38:157–166.
- Ginzton LE, Laks MM. The differential diagnosis of acute pericarditis from the normal variant: new electrocardiographic criteria. Circulation 1982; 65:1004–1009.
A 47-year-old man with chest and neck pain
A 47-year-old man presented with acute shortness of breath and chest and neck pain, which began after he heard popping sounds while boarding a bus. The pain was right-sided, sharp, worse with deep breathing, and associated with a sensation of fullness over the right chest.
His medical conditions included controlled hypertension, gastroesophageal reflux disease, and chronic obstructive pulmonary disease (COPD). The COPD was managed with an albuterol inhaler only. He had a 50-pack-year history of smoking, and he drank alcohol occasionally.
On arrival, he was in mild respiratory distress, but his vital signs were stable. We could hear wheezing on both sides of his chest and feel subcutaneous crepitation on both sides of his chest and neck, the latter more on the right side. The rest of the examination was unremarkable.
Results of a complete blood cell count and metabolic panel were within normal limits. Because of the above findings, nasopharyngeal radiogragraphy was ordered (Figures 1 and 2).
Q: What is the most likely cause of this presentation?
- Esophageal rupture
- Gas gangrene
- Asthma exacerbation
- Ruptured emphysematous bullae
A: This patient had a history of COPD, which put him at risk of developing bullous emphysematous bullae that can rupture and cause subcutaneous emphysema. His nasopharyngeal radiograph (Figure1) showed bilateral extensive subcutaneous emphysema. His lateral nasopharyngeal radiograph (Figure 2) showed air-tracking within the mediastinum and into the retropharyngeal space (arrow). Computed tomography (Figure 3) showed extensive subcutaneous emphysema in the right lateral chest wall (arrow) and large bullae in the right upper lobe (arrow heads). As for the other possibilities:
Esophageal ruptures and tears are iatrogenic in most cases and usually occur after endoscopic procedures, but they can also occur in patients with intractable vomiting. Computed tomography often shows esophageal thickening, periesophageal fluid, mediastinal widening, and extraluminal air. However, in most cases, it is seen as pneumomediastinum and subcutaneous emphysema.1
Gas gangrene is a life-threatening soft-tissue and muscle infection caused by Clostridium perfringens in most cases.2 The pain is out of proportion to the findings on physical examination. Patients usually have toxic signs and symptoms such as fever and hypotension. Our patient was hemodynamically stable, with no changes in skin color.
Severe exacerbations of asthma can lead to alveolar rupture, pneumothorax, and subcutaneous emphysema, although this is a rare complication. Air can dissect along the bronchovascular sheaths into the neck and cause subcutaneous emphysema, or into the pleural space and cause pneumothorax. Our patient had no history of asthma and plainly had emphysematous bullae.3
SUBCUTANEOUS EMPHYSEMA
Subcutaneous emphysema is a collection of air within subcutaneous tissues. It usually presents as bloating of the skin around the neck and the chest wall. It is often seen in patients with pneumothorax.
The most common cause of subcutaneous emphysema is traumatic injury to the chest wall, such as from a motor vehicle accident or a stab wound,4 but it can also occur spontaneously in patients who have severe emphysema with large bullae. As the emphysema progresses, the bullae can easily rupture, and this can lead to pneumothorax, which can lead to subcutaneous emphysema. Primary spontaneous pneumothorax and subcutaneous emphysema can occur in people who have unrecognized lung disease and genetic disorders such as Marfan syndrome and Ehler-Danlos syndrome.5 Other causes include iatrogenic injury, Pneumocystis jirovecii pneumonia (common in patients with human immunodeficiency virus infection), and cystic fibrosis. Pneumothorax occurs in about 30% of cases of P jirovecii pneumonia,6 and in about 6% of patients with cystic fibrosis.7 Bronchocutaneous fistula is an extremely rare complication of lung cancer and can cause subcutaneous emphysema.8 Tuberculosis is another possible cause.9
Subcutaneous emphysema mainly presents with chest or neck pain and wheezing. In severe cases, air can track to the face, causing facial swelling and difficulty breathing due to compression of the larynx. Also, it can track down to the thighs, causing leg pain and swelling.10
On examination, subcutaneous emphysema can be detected by palpating the chest wall, which causes the air bubble to move and produce crackling sounds. Most cases of subcutaneous emphysema are diagnosed clinically. Chest radiography and computed tomography help identify the source of air leak. Ultrasonography is usually used in cases of blunt trauma to the chest as part of the Focal Assessment With Sonography for Trauma protocol.11
Subcutaneous emphysema can resolve spontaneously, requiring only pain management and supplemental oxygen.12 In severe cases, air collection can lead to what is called “massive subcutaneous emphysema,” which requires surgical drainage.
Our patient had large emphysematous bullae in the apical region of the right lung that ruptured and led to subcutaneous emphysema. After placement of a chest tube, he underwent right-sided thoracotomy with bullectomy. His postoperative course was uneventful, and he was discharged a few days later. Three weeks later, repeated chest radiography showed resolution of his subcutaneous emphysema (Figure 4).
- White CS, Templeton PA, Attar S. Esophageal perforation: CT findings. AJR Am J Roentgenol 1993; 160:767–770.
- Aggelidakis J, Lasithiotakis K, Topalidou A, Koutroumpas J, Kouvidis G, Katonis P. Limb salvage after gas gangrene: a case report and review of the literature. World J Emerg Surg 2011; 6:28.
- Romero KJ, Trujillo MH. Spontaneous pneumomediastinum and subcutaneous emphysema in asthma exacerbation: the Macklin effect. Heart Lung 2010; 39:444–447.
- Peart O. Subcutaneous emphysema. Radiol Technol 2006; 77:296.
- Chiu HT, Garcia CK. Familial spontaneous pneumothorax. Curr Opin Pulm Med 2006; 12:268–272.
- Sepkowitz KA, Telzak EE, Gold JW, et al. Pneumothorax in AIDS. Ann Intern Med 1991; 114:455–459.
- Flume PA, Strange C, Ye X, Ebeling M, Hulsey T, Clark LL. Pneumothorax in cystic fibrosis. Chest 2005; 128:720–728.
- Yalçinkaya S, Vural AH, Göncü MT, Özyazicioglu AF. Cavitary lung cancer presenting as subcutaneous emphysema on the contralateral side. Interact Cardiovasc Thorac Surg 2012; 14:338–339.
- Shamaei M, Tabarsi P, Pojhan S, et al. Tuberculosis-associated secondary pneumothorax: a retrospective study of 53 patients. Respir Care 2011; 56:298–302.
- Sherif HM, Ott DA. The use of subcutaneous drains to manage subcutaneous emphysema. Tex Heart Inst J 1999; 26:129–131.
- Wilkerson RG, Stone MB. Sensitivity of bedside ultrasound and supine anteroposterior chest radiographs for the identification of pneumothorax after blunt trauma. Acad Emerg Med 2010; 17:11–17.
- Mattox KL, Allen MK. Systematic approach to pneumothorax, haemothorax, pneumomediastinum and subcutaneous emphysema. Injury 1986; 17:309–312.
A 47-year-old man presented with acute shortness of breath and chest and neck pain, which began after he heard popping sounds while boarding a bus. The pain was right-sided, sharp, worse with deep breathing, and associated with a sensation of fullness over the right chest.
His medical conditions included controlled hypertension, gastroesophageal reflux disease, and chronic obstructive pulmonary disease (COPD). The COPD was managed with an albuterol inhaler only. He had a 50-pack-year history of smoking, and he drank alcohol occasionally.
On arrival, he was in mild respiratory distress, but his vital signs were stable. We could hear wheezing on both sides of his chest and feel subcutaneous crepitation on both sides of his chest and neck, the latter more on the right side. The rest of the examination was unremarkable.
Results of a complete blood cell count and metabolic panel were within normal limits. Because of the above findings, nasopharyngeal radiogragraphy was ordered (Figures 1 and 2).
Q: What is the most likely cause of this presentation?
- Esophageal rupture
- Gas gangrene
- Asthma exacerbation
- Ruptured emphysematous bullae
A: This patient had a history of COPD, which put him at risk of developing bullous emphysematous bullae that can rupture and cause subcutaneous emphysema. His nasopharyngeal radiograph (Figure1) showed bilateral extensive subcutaneous emphysema. His lateral nasopharyngeal radiograph (Figure 2) showed air-tracking within the mediastinum and into the retropharyngeal space (arrow). Computed tomography (Figure 3) showed extensive subcutaneous emphysema in the right lateral chest wall (arrow) and large bullae in the right upper lobe (arrow heads). As for the other possibilities:
Esophageal ruptures and tears are iatrogenic in most cases and usually occur after endoscopic procedures, but they can also occur in patients with intractable vomiting. Computed tomography often shows esophageal thickening, periesophageal fluid, mediastinal widening, and extraluminal air. However, in most cases, it is seen as pneumomediastinum and subcutaneous emphysema.1
Gas gangrene is a life-threatening soft-tissue and muscle infection caused by Clostridium perfringens in most cases.2 The pain is out of proportion to the findings on physical examination. Patients usually have toxic signs and symptoms such as fever and hypotension. Our patient was hemodynamically stable, with no changes in skin color.
Severe exacerbations of asthma can lead to alveolar rupture, pneumothorax, and subcutaneous emphysema, although this is a rare complication. Air can dissect along the bronchovascular sheaths into the neck and cause subcutaneous emphysema, or into the pleural space and cause pneumothorax. Our patient had no history of asthma and plainly had emphysematous bullae.3
SUBCUTANEOUS EMPHYSEMA
Subcutaneous emphysema is a collection of air within subcutaneous tissues. It usually presents as bloating of the skin around the neck and the chest wall. It is often seen in patients with pneumothorax.
The most common cause of subcutaneous emphysema is traumatic injury to the chest wall, such as from a motor vehicle accident or a stab wound,4 but it can also occur spontaneously in patients who have severe emphysema with large bullae. As the emphysema progresses, the bullae can easily rupture, and this can lead to pneumothorax, which can lead to subcutaneous emphysema. Primary spontaneous pneumothorax and subcutaneous emphysema can occur in people who have unrecognized lung disease and genetic disorders such as Marfan syndrome and Ehler-Danlos syndrome.5 Other causes include iatrogenic injury, Pneumocystis jirovecii pneumonia (common in patients with human immunodeficiency virus infection), and cystic fibrosis. Pneumothorax occurs in about 30% of cases of P jirovecii pneumonia,6 and in about 6% of patients with cystic fibrosis.7 Bronchocutaneous fistula is an extremely rare complication of lung cancer and can cause subcutaneous emphysema.8 Tuberculosis is another possible cause.9
Subcutaneous emphysema mainly presents with chest or neck pain and wheezing. In severe cases, air can track to the face, causing facial swelling and difficulty breathing due to compression of the larynx. Also, it can track down to the thighs, causing leg pain and swelling.10
On examination, subcutaneous emphysema can be detected by palpating the chest wall, which causes the air bubble to move and produce crackling sounds. Most cases of subcutaneous emphysema are diagnosed clinically. Chest radiography and computed tomography help identify the source of air leak. Ultrasonography is usually used in cases of blunt trauma to the chest as part of the Focal Assessment With Sonography for Trauma protocol.11
Subcutaneous emphysema can resolve spontaneously, requiring only pain management and supplemental oxygen.12 In severe cases, air collection can lead to what is called “massive subcutaneous emphysema,” which requires surgical drainage.
Our patient had large emphysematous bullae in the apical region of the right lung that ruptured and led to subcutaneous emphysema. After placement of a chest tube, he underwent right-sided thoracotomy with bullectomy. His postoperative course was uneventful, and he was discharged a few days later. Three weeks later, repeated chest radiography showed resolution of his subcutaneous emphysema (Figure 4).
- White CS, Templeton PA, Attar S. Esophageal perforation: CT findings. AJR Am J Roentgenol 1993; 160:767–770.
- Aggelidakis J, Lasithiotakis K, Topalidou A, Koutroumpas J, Kouvidis G, Katonis P. Limb salvage after gas gangrene: a case report and review of the literature. World J Emerg Surg 2011; 6:28.
- Romero KJ, Trujillo MH. Spontaneous pneumomediastinum and subcutaneous emphysema in asthma exacerbation: the Macklin effect. Heart Lung 2010; 39:444–447.
- Peart O. Subcutaneous emphysema. Radiol Technol 2006; 77:296.
- Chiu HT, Garcia CK. Familial spontaneous pneumothorax. Curr Opin Pulm Med 2006; 12:268–272.
- Sepkowitz KA, Telzak EE, Gold JW, et al. Pneumothorax in AIDS. Ann Intern Med 1991; 114:455–459.
- Flume PA, Strange C, Ye X, Ebeling M, Hulsey T, Clark LL. Pneumothorax in cystic fibrosis. Chest 2005; 128:720–728.
- Yalçinkaya S, Vural AH, Göncü MT, Özyazicioglu AF. Cavitary lung cancer presenting as subcutaneous emphysema on the contralateral side. Interact Cardiovasc Thorac Surg 2012; 14:338–339.
- Shamaei M, Tabarsi P, Pojhan S, et al. Tuberculosis-associated secondary pneumothorax: a retrospective study of 53 patients. Respir Care 2011; 56:298–302.
- Sherif HM, Ott DA. The use of subcutaneous drains to manage subcutaneous emphysema. Tex Heart Inst J 1999; 26:129–131.
- Wilkerson RG, Stone MB. Sensitivity of bedside ultrasound and supine anteroposterior chest radiographs for the identification of pneumothorax after blunt trauma. Acad Emerg Med 2010; 17:11–17.
- Mattox KL, Allen MK. Systematic approach to pneumothorax, haemothorax, pneumomediastinum and subcutaneous emphysema. Injury 1986; 17:309–312.
Flashing lights, floaters, and reduced vision
A 62-year-old woman has had flashing lights and floaters in her left eye with progressive loss of vision over the past month. She has not had recent trauma. She does not smoke.
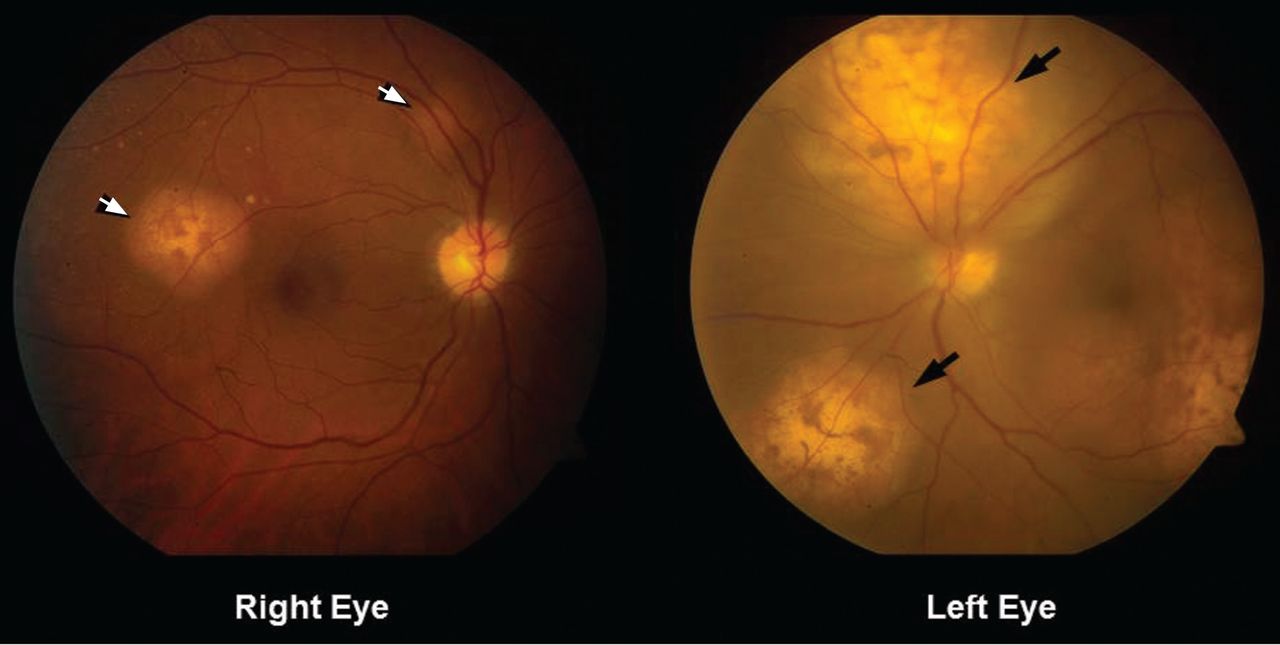
She was referred for an ophthalmologic evaluation. Her visual acuity was 20/20 in the right eye, but she could only count fingers with the left. The anterior segment appeared normal in both eyes. Funduscopic examination of the left eye revealed numerous lobulated, yellowish, choroidal lesions in the posterior pole with overlying subretinal fluid. The lesions involved the fovea, accounting for the poor visual acuity. There were two similar but smaller lesions in the right eye (Figure 1). Ultrasonography confirmed the choroidal location of the lesions (Figure 2).
Q: Which is the most likely diagnosis?
- Retinal detachment
- Choroidal melanoma
- Uveitis
- Uveal metastatic tumor
A: Uveal metastatic tumor is the correct diagnosis. Funduscopic findings of bilateral yellow choroidal lesions are consistent with metastatic cancer.
The patient was admitted to the hospital for a thorough evaluation. Computed tomography of the chest showed a 2.1-by-4.5-cm mass in the lower lobe of the left lung, highly suspicious for malignancy and associated with left hilar lymphadenopathy and right acute pulmonary embolism. Bronchoscopy showed an endobronchial tumor completely occluding the left lower lobe and the lingular orifices.
Pathologic specimens from the endobronchial tumor confirmed adenocarcinoma, consistent with a primary lung cancer.
THE OTHER DIAGNOSTIC CHOICES
Detachment or separation of the retina from the underlying pigment epithelium is one of the most commonly encountered eye emergencies.1 It requires urgent attention, since delay in treatment can cause permanent vision loss.
Retinal detachment differs from uveal metastatic tumor in that it presents and progresses rapidly. The common signs and symptoms are floaters in the center of the visual axis, a sensation of flashing lights (related to retinal traction), and, eventually, loss of vision. The detachment most often represents a break or tear (rhegmatogenous retinal detachment), but it is also a common sequela of neglected diabetic retinopathy. Exudative retinal detachment is usually secondary to uveal inflammation or a uveal tumor.
Choroidal melanoma, the most common primary intraocular malignancy, arises from melanocytes within the choroid. In most cases, it develops from preexisting melanocytic nevi.2 It may present as blurred vision, a paracentral scotoma, painless and progressive visual field loss, and floaters. Choroidal melanoma is usually pigmented (dark brown) and is invariably unilateral.
Uveitis is an inflammation of the uveal tract, which includes the iris, ciliary body, and choroid. It is classified as anterior, intermediate, or posterior uveitis or as panuveitis.3
Although flashing lights, floaters, and reduced vision can occur in uveitis, its other important presenting symptoms (ie, pain, redness, and photophobia) were absent in this patient. The absence of anterior chamber cells and corneal inflammatory deposits (keratic precipitates) also made uveitis less likely.4 However, granulomatous uveitis such as sarcoidosis can present as nodular thickening of the uvea, mimicking an intraocular tumor.5
THE MOST COMMON INTRAOCULAR MALIGNANCY
Uveal metastasis is the most common intraocular malignancy6 and is found on autopsy in up to 12% of people who die of cancer; it involves both eyes in 4.4% of cases. Multiple metastases are seen in one eye in up to 20% of cases.7
The tumors are most often in the choroid, probably because of its extensive blood supply. Breast cancer (in women) and lung cancer (in men) are the most common cancers with uveal metastasis.8 Uveal metastasis from cancers of the prostate, kidney, thyroid, and gastrointestinal tract and from lymphoma and leukemia is less common.8
Patients with choroidal metastasis can see flashing lights, floating spots, and distortion of their vision. In such patients, a careful history and physical examination can uncover signs and symptoms of the hidden cancer, especially of lung cancer.9
Once uveal metastasis is suspected, both eyes and orbits and the central nervous system should be examined, as this disease tends to present bilaterally and to involve the central nervous system.10 Uveal metastases respond to chemotherapy and radiotherapy, depending on the nature of the primary tumor. In general, treatment is based on the extent of the metastasis, prior treatments, and the patient’s overall functional status.
- Hatten B, Browne V. Retinal detachment. Emerg Med J 2011; 28:83.
- Factors predictive of growth and treatment of small choroidal melanoma: COMS Report No. 5. The Collaborative Ocular Melanoma Study Group. Arch Ophthalmol 1997; 115:1537–1544.
- Jabs DA, Nussenblatt RB, Rosenbaum JT; Standardization of Uveitis Nomenclature (SUN) Working Group. Standardization of uveitis nomenclature for reporting clinical data. Results of the First International Workshop. Am J Ophthalmol 2005; 140:509–516.
- Wertheim MS, Mathers WD, Planck SJ, et al. In vivo confocal microscopy of keratic precipitates. Arch Ophthalmol 2004; 122:1773–1781.
- Desai UR, Tawansy KA, Joondeph BC, Schiffman RM. Choroidal granulomas in systemic sarcoidosis. Retina 2001; 21:40–47.
- Singh AD, Damato BE, Pe’er J, Murphree AL, Perry JD, eds. Uveal metastatic tumors. In: Clinical Ophthalmic Oncology. Philadelphia, PA: Saunders-Elsevier; 2007:322–327.
- Eliassi-Rad B, Albert DM, Green WR. Frequency of ocular metastases in patients dying of cancer in eye bank populations. Br J Ophthalmol 1996; 80:125–128.
- Shields CL, Shields JA, Gross NE, Schwartz GP, Lally SE. Survey of 520 eyes with uveal metastases. Ophthalmology 1997; 104:1265–1276.
- Herrag M, Lahmiti S, Yazidi AA, Le Lez ML, Diot P. Choroidal metastasis revealing a lung adenocarcinoma. Ann Thorac Surg 2010; 89:1013–1014.
- Kanthan GL, Jayamohan J, Yip D, Conway RM. Management of metastatic carcinoma of the uveal tract: an evidence-based analysis. Clin Exp Ophthalmol 2007; 35:553–565.
A 62-year-old woman has had flashing lights and floaters in her left eye with progressive loss of vision over the past month. She has not had recent trauma. She does not smoke.
She was referred for an ophthalmologic evaluation. Her visual acuity was 20/20 in the right eye, but she could only count fingers with the left. The anterior segment appeared normal in both eyes. Funduscopic examination of the left eye revealed numerous lobulated, yellowish, choroidal lesions in the posterior pole with overlying subretinal fluid. The lesions involved the fovea, accounting for the poor visual acuity. There were two similar but smaller lesions in the right eye (Figure 1). Ultrasonography confirmed the choroidal location of the lesions (Figure 2).
Q: Which is the most likely diagnosis?
- Retinal detachment
- Choroidal melanoma
- Uveitis
- Uveal metastatic tumor
A: Uveal metastatic tumor is the correct diagnosis. Funduscopic findings of bilateral yellow choroidal lesions are consistent with metastatic cancer.
The patient was admitted to the hospital for a thorough evaluation. Computed tomography of the chest showed a 2.1-by-4.5-cm mass in the lower lobe of the left lung, highly suspicious for malignancy and associated with left hilar lymphadenopathy and right acute pulmonary embolism. Bronchoscopy showed an endobronchial tumor completely occluding the left lower lobe and the lingular orifices.
Pathologic specimens from the endobronchial tumor confirmed adenocarcinoma, consistent with a primary lung cancer.
THE OTHER DIAGNOSTIC CHOICES
Detachment or separation of the retina from the underlying pigment epithelium is one of the most commonly encountered eye emergencies.1 It requires urgent attention, since delay in treatment can cause permanent vision loss.
Retinal detachment differs from uveal metastatic tumor in that it presents and progresses rapidly. The common signs and symptoms are floaters in the center of the visual axis, a sensation of flashing lights (related to retinal traction), and, eventually, loss of vision. The detachment most often represents a break or tear (rhegmatogenous retinal detachment), but it is also a common sequela of neglected diabetic retinopathy. Exudative retinal detachment is usually secondary to uveal inflammation or a uveal tumor.
Choroidal melanoma, the most common primary intraocular malignancy, arises from melanocytes within the choroid. In most cases, it develops from preexisting melanocytic nevi.2 It may present as blurred vision, a paracentral scotoma, painless and progressive visual field loss, and floaters. Choroidal melanoma is usually pigmented (dark brown) and is invariably unilateral.
Uveitis is an inflammation of the uveal tract, which includes the iris, ciliary body, and choroid. It is classified as anterior, intermediate, or posterior uveitis or as panuveitis.3
Although flashing lights, floaters, and reduced vision can occur in uveitis, its other important presenting symptoms (ie, pain, redness, and photophobia) were absent in this patient. The absence of anterior chamber cells and corneal inflammatory deposits (keratic precipitates) also made uveitis less likely.4 However, granulomatous uveitis such as sarcoidosis can present as nodular thickening of the uvea, mimicking an intraocular tumor.5
THE MOST COMMON INTRAOCULAR MALIGNANCY
Uveal metastasis is the most common intraocular malignancy6 and is found on autopsy in up to 12% of people who die of cancer; it involves both eyes in 4.4% of cases. Multiple metastases are seen in one eye in up to 20% of cases.7
The tumors are most often in the choroid, probably because of its extensive blood supply. Breast cancer (in women) and lung cancer (in men) are the most common cancers with uveal metastasis.8 Uveal metastasis from cancers of the prostate, kidney, thyroid, and gastrointestinal tract and from lymphoma and leukemia is less common.8
Patients with choroidal metastasis can see flashing lights, floating spots, and distortion of their vision. In such patients, a careful history and physical examination can uncover signs and symptoms of the hidden cancer, especially of lung cancer.9
Once uveal metastasis is suspected, both eyes and orbits and the central nervous system should be examined, as this disease tends to present bilaterally and to involve the central nervous system.10 Uveal metastases respond to chemotherapy and radiotherapy, depending on the nature of the primary tumor. In general, treatment is based on the extent of the metastasis, prior treatments, and the patient’s overall functional status.
- Hatten B, Browne V. Retinal detachment. Emerg Med J 2011; 28:83.
- Factors predictive of growth and treatment of small choroidal melanoma: COMS Report No. 5. The Collaborative Ocular Melanoma Study Group. Arch Ophthalmol 1997; 115:1537–1544.
- Jabs DA, Nussenblatt RB, Rosenbaum JT; Standardization of Uveitis Nomenclature (SUN) Working Group. Standardization of uveitis nomenclature for reporting clinical data. Results of the First International Workshop. Am J Ophthalmol 2005; 140:509–516.
- Wertheim MS, Mathers WD, Planck SJ, et al. In vivo confocal microscopy of keratic precipitates. Arch Ophthalmol 2004; 122:1773–1781.
- Desai UR, Tawansy KA, Joondeph BC, Schiffman RM. Choroidal granulomas in systemic sarcoidosis. Retina 2001; 21:40–47.
- Singh AD, Damato BE, Pe’er J, Murphree AL, Perry JD, eds. Uveal metastatic tumors. In: Clinical Ophthalmic Oncology. Philadelphia, PA: Saunders-Elsevier; 2007:322–327.
- Eliassi-Rad B, Albert DM, Green WR. Frequency of ocular metastases in patients dying of cancer in eye bank populations. Br J Ophthalmol 1996; 80:125–128.
- Shields CL, Shields JA, Gross NE, Schwartz GP, Lally SE. Survey of 520 eyes with uveal metastases. Ophthalmology 1997; 104:1265–1276.
- Herrag M, Lahmiti S, Yazidi AA, Le Lez ML, Diot P. Choroidal metastasis revealing a lung adenocarcinoma. Ann Thorac Surg 2010; 89:1013–1014.
- Kanthan GL, Jayamohan J, Yip D, Conway RM. Management of metastatic carcinoma of the uveal tract: an evidence-based analysis. Clin Exp Ophthalmol 2007; 35:553–565.