User login
Yes. Acute pericarditis has a unique clinical presentation, physical findings, and electrocardiographic (ECG) changes. ECG is always ordered to look for ischemic changes in patients with chest pain. Acute pericarditis develops in stages, which makes it easy to differentiate from early repolarization and, more significantly, myocardial infarction. The ECG changes, along with the clinical presentation and physical findings, can make the diagnosis of pericarditis.
In atypical and complicated cases, advanced imaging studies (ie, echocardiography and cardiac magnetic resonance imaging) have been used to confirm the diagnosis and to follow the course of the disease. However, ECG remains a useful, cost-effective test.
PERICARDIAL DISEASE IS DIVERSE
The pericardium is a thin layer that covers the heart and separates it from other structures in the mediastinum.
Pericardial syndromes include acute, recurrent, constrictive, and effusive-constrictive pericarditis, as well as pericardial effusion with or without tamponade. Causes include viral or bacterial infection, postpericardiotomy syndrome (Dressler syndrome), postmyocardial infarction, primary and metastatic tumors, trauma, uremia, radiation, and autoimmune disease, but pericardial syndromes can also be idiopathic.1
Acute pericarditis is the most common pericardial syndrome and occurs in all age groups. Once diagnosed, it can easily be treated with antiinflammatory drugs. However, recurrent pericarditis, reported in 30% of patients experiencing a first attack of pericarditis, can be difficult to manage, can have a significant impact on the patient’s health, and can be life-threatening.2
CHANGES OF ACUTE PERICARDITIS DEVELOP IN STAGES
Pericarditis can be diagnosed on the basis of ECG changes, clinical signs and symptoms, and laboratory and imaging findings.3 ECG criteria of acute pericarditis have been published.4,5
The characteristic chest pain in acute pericarditis is usually sudden in onset and sharp and occurs over the anterior chest wall. The pain is exacerbated by inspiration and decreases when the patient sits up and leans forward.4
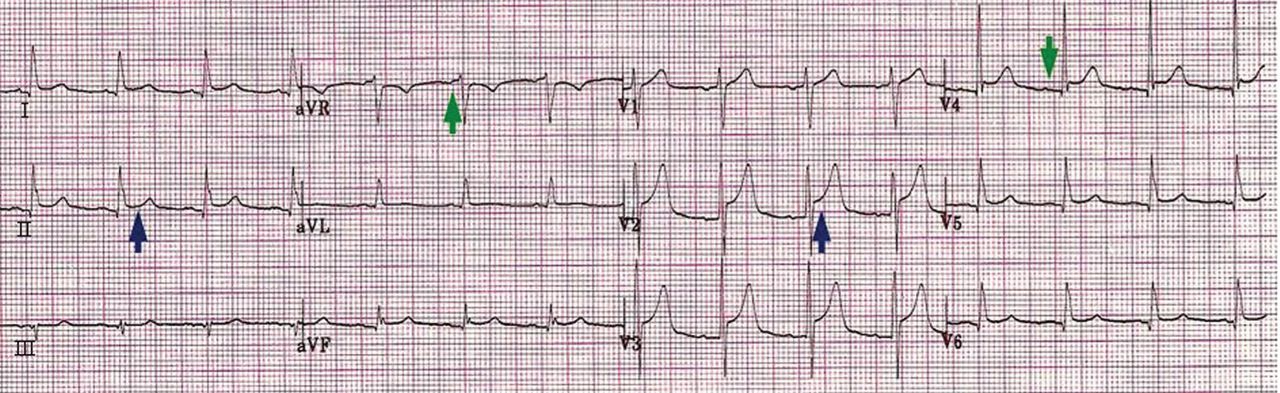
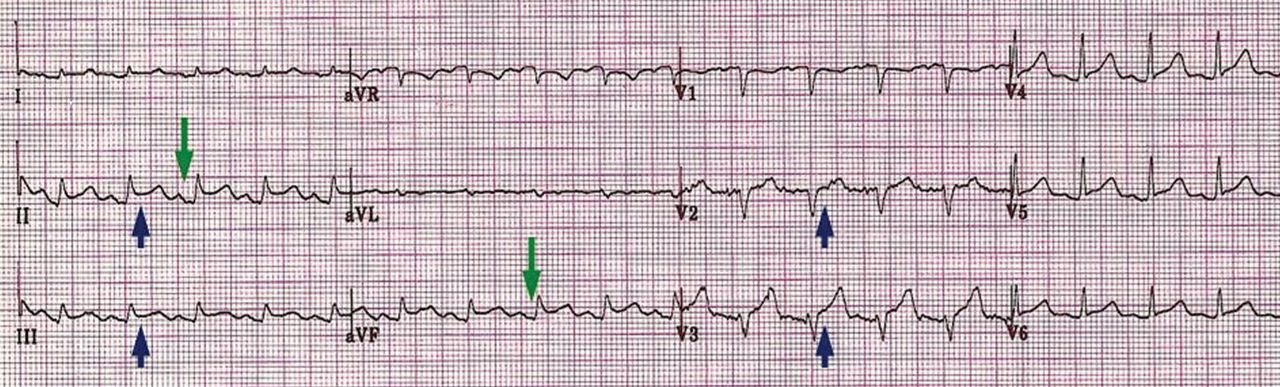
ECG classically shows a widespread saddle-shaped (upward concave) ST-segment elevation in the precordial and limb leads, reflecting subepicardial inflammation. PR-segment depression (with PR-segment elevation in lead aVR) can accompany or precede the ST changes and is known as the “discordant ST-PR segment sign” (Figures 1 and 2). These changes are seen in 60% of patients.
The ECG changes develop in stages, making them easy to differentiate from early repolarization and, more significantly, from myocardial infarction. Four stages are apparent1,4,6–9:
- Stage I occurs in a few hours to days, with diffuse, up-sloping ST-segment elevation and upright T waves, the result of an alteration in ventricular repolarization caused by pericardial inflammation. Because of alteration in repolarization of the atrium secondary to inflammation, the PR segment is elevated in aVR and depressed in the rest of the limb and chest leads.
- Stage II—the ST and PR segments normalize.
- Stage III—widespread T-wave inversion.
- Stage IV—normalization of the T waves.
There is no pathologic Q-wave formation or loss of R-wave progression in acute pericarditis.
The ECG changes of pericarditis vary widely from one patient to another, depending on the extent and severity of pericardial inflammation and the timing of the patient’s presentation. Changes vary in duration. In some cases, ST elevation returns to baseline within a few days without T-wave inversions; in other cases, T-wave inversions can persist for weeks to months. Sometimes the abnormalities resolve by the time symptoms develop.
ASSOCIATED CONDITIONS
Myocardial involvement
In acute myocarditis, findings on ECG can be normal unless the pericardium is involved. Changes that can be seen in myocarditis and that indicate a deeper involvement of inflammation include ST-segment abnormalities, arrhythmias (eg, premature ventricular or atrial contractions), pathologic Q waves, intraventricular conduction delay, and right or left bundle branch block.1,10–12
Elevated troponin and new focal or global left ventricular dysfunction on cardiac imaging indicates myocarditis, especially in a patient with a normal coronary angiogram.10–13
Pericardial effusion: Tachycardia and low QRS voltage
Pericardial effusion is often a complication of pericarditis, but it can also develop from other conditions, such as myxedema, uremia, malignancy, connective tissue disease, aortic dissection, and postpericardiotomy syndrome, and it can also be iatrogenic.
The most common ECG sign of pericardial effusion is tachycardia and low voltage of the QRS complexes. Low voltage is defined as a total amplitude of the QRS complexes in each of the six limb leads less than or equal to 5 mm, and less than or equal to 10 mm in V1 through V6. However, low voltage is not always present in the chest leads.
Mechanisms proposed to explain low QRS voltage associated with pericardial effusion include internal short-circuiting of the electrical currents by accumulated fluids within the pericardial sac, greater distance of the heart from body surface electrodes, reduced cardiac size caused by effusion, and change in the generation and propagation of electrical current in the myocardium.14,15
Cardiac tamponade: Tachycardia, electrical alternans, low QRS voltage
Sinus tachycardia and electrical alternans are specific but not sensitive signs of pericardial tamponade (Figure 3).16,17 Electrical alternans is characterized by beat-to-beat alterations in the axis of QRS complexes in the limb and precordial leads as a result of the mechanical swinging of the heart in a large pericardial effusion.17 There is evidence to suggest that low QRS voltage is more the result of the tamponade than the effusion.18
Treating tamponade with pericardiocentesis, surgical creation of a fistula (“window”) between the pericardial space and the pleural cavity, or anti-inflammatory drugs can resolve low QRS voltage within 1 week.
DIFFERENTIAL DIAGNOSIS OF ACUTE PERICARDITIS
Acute myocardial infarction
ECG changes in acute pericarditis differ from those in acute myocardial infarction in many ways.
ST-segment elevation in pericarditis rarely exceeds 5 mm, in contrast to acute myocardial infarction, in which ST elevation at the J point has to be more than 2 mm and in two anatomically contiguous leads.19
In pericarditis, the changes occur more slowly and in stages, reflecting the evolving inflammation of different areas of the pericardium.
The ST segment is elevated diffusely in the precordial and limb leads in pericarditis, indicating involvement of more than one coronary vascular territory, differentiating it from characteristic regional changes in myocardial infarction.19,20
If concomitant atrial injury is present with acute pericarditis, then PR elevation in aVR with PR depression in other leads may be seen.
Finally, pathologic Q waves or high-grade heart block reflects acute myocardial infarction.
Early repolarization: Elevation of the J point
Early repolarization is sometimes seen in healthy young people, especially in black men.
Early repolarization is characterized by elevation of the J point (ie, the junction between the end of the QRS complex and the beginning of the ST segment). Elevation of the J point causes elevation of the ST segment in the mid to lateral precordial leads (V3–V6) with an up-right T wave.21
Acute pericarditis tends to cause ST-segment elevation in both the limb and precordial leads, whereas ST elevation in early repolarization mainly involves the lateral chest leads.
The PR segment is more prominent in acute pericarditis, especially in lead aVR.
Another finding that strongly favors acute pericarditis is the ratio of the height of the ST-segment junction to the height of the apex of the T wave of more than 0.25 in leads I, V4, V5, and V6 (Figure 4).5,8,22
- Imazio M, Trinchero R. Triage and management of acute pericarditis. Int J Cardiol 2007; 118:286–294.
- Little WC, Freeman GL. Pericardial disease. Circulation 2006; 113:1622–1632.
- Imazio M, Spodick DH, Brucato A, Trinchero R, Markel G, Adler Y. Diagnostic issues in the clinical management of pericarditis. Int J Clin Pract 2010; 64:1384–1392.
- Spodick DH. Acute pericarditis: current concepts and practice. JAMA 2003; 289:1150–1153.
- Troughton RW, Asher CR, Klein AL. Pericarditis. Lancet 2004; 363:717–727.
- Shabetai R. Acute pericarditis. Cardiol Clin 1990; 8:639–644.
- Baljepally R, Spodick DH. PR-segment deviation as the initial electrocardiographic response in acute pericarditis. Am J Cardiol 1998; 81:1505–1506.
- Spodick DH. Diagnostic electrocardiographic sequences in acute pericarditis. Significance of PR segment and PR vector changes. Circulation 1973; 48:575–580.
- Spodick D, editor. The Pericardium: A Comprehensive Textbook. New York, NY: Marcel Dekker; 1997:46–64.
- Smith SC, Ladenson JH, Mason JW, Jaffe AS. Elevations of cardiac troponin I associated with myocarditis. Experimental and clinical correlates. Circulation 1997; 95:163–168.
- Sarda L, Colin P, Boccara F, et al. Myocarditis in patients with clinical presentation of myocardial infarction and normal coronary angiograms. J Am Coll Cardiol 2001; 37:786–792.
- Spodick DH. Arrhythmias during acute pericarditis. A prospective study of 100 consecutive cases. JAMA 1976; 235:39–41.
- Imazio M, Trinchero R. Myopericarditis: etiology, management, and prognosis. Int J Cardiol 2008; 127:17–26.
- Toney JC, Kolmen SN. Cardiac tamponade: fluid and pressure effects on electrocardiographic changes. Proc Soc Exp Biol Med 1966; 121:642–648.
- Karatay CM, Fruehan CT, Lighty GW, Spear RM, Smulyan H. Acute pericardial distension in pigs: effect of fluid conductance on body surface electrocardiogram QRS size. Cardiovasc Res 1993; 27:1033–1038.
- Spodick DH. Acute cardiac tamponade. Pathologic physiology, diagnosis and management. Prog Cardiovasc Dis 1967; 10:64–96.
- Eisenberg MJ, de Romeral LM, Heidenreich PA, Schiller NB, Evans GT. The diagnosis of pericardial effusion and cardiac tamponade by 12-lead ECG. A technology assessment. Chest 1996; 110:318–324.
- Bruch C, Schmermund A, Dagres N, et al. Changes in QRS voltage in cardiac tamponade and pericardial effusion: reversibility after pericardiocentesis and after anti-inflammatory drug treatment. J Am Coll Cardiol 2001; 38:219–226.
- Wang K, Asinger RW, Marriott HJ. ST-segment elevation in conditions other than acute myocardial infarction. N Engl J Med 2003; 349:2128–2135.
- Brady WJ, Perron A, Ullman E. Errors in emergency physician interpretation of ST-segment elevation in emergency department chest pain patients. Acad Emerg Med 2000; 7:1256–1260.
- Kambara H, Phillips J. Long-term evaluation of early repolarization syndrome (normal variant RS-T segment elevation). Am J Cardiol 1976; 38:157–166.
- Ginzton LE, Laks MM. The differential diagnosis of acute pericarditis from the normal variant: new electrocardiographic criteria. Circulation 1982; 65:1004–1009.
Yes. Acute pericarditis has a unique clinical presentation, physical findings, and electrocardiographic (ECG) changes. ECG is always ordered to look for ischemic changes in patients with chest pain. Acute pericarditis develops in stages, which makes it easy to differentiate from early repolarization and, more significantly, myocardial infarction. The ECG changes, along with the clinical presentation and physical findings, can make the diagnosis of pericarditis.
In atypical and complicated cases, advanced imaging studies (ie, echocardiography and cardiac magnetic resonance imaging) have been used to confirm the diagnosis and to follow the course of the disease. However, ECG remains a useful, cost-effective test.
PERICARDIAL DISEASE IS DIVERSE
The pericardium is a thin layer that covers the heart and separates it from other structures in the mediastinum.
Pericardial syndromes include acute, recurrent, constrictive, and effusive-constrictive pericarditis, as well as pericardial effusion with or without tamponade. Causes include viral or bacterial infection, postpericardiotomy syndrome (Dressler syndrome), postmyocardial infarction, primary and metastatic tumors, trauma, uremia, radiation, and autoimmune disease, but pericardial syndromes can also be idiopathic.1
Acute pericarditis is the most common pericardial syndrome and occurs in all age groups. Once diagnosed, it can easily be treated with antiinflammatory drugs. However, recurrent pericarditis, reported in 30% of patients experiencing a first attack of pericarditis, can be difficult to manage, can have a significant impact on the patient’s health, and can be life-threatening.2
CHANGES OF ACUTE PERICARDITIS DEVELOP IN STAGES
Pericarditis can be diagnosed on the basis of ECG changes, clinical signs and symptoms, and laboratory and imaging findings.3 ECG criteria of acute pericarditis have been published.4,5
The characteristic chest pain in acute pericarditis is usually sudden in onset and sharp and occurs over the anterior chest wall. The pain is exacerbated by inspiration and decreases when the patient sits up and leans forward.4
ECG classically shows a widespread saddle-shaped (upward concave) ST-segment elevation in the precordial and limb leads, reflecting subepicardial inflammation. PR-segment depression (with PR-segment elevation in lead aVR) can accompany or precede the ST changes and is known as the “discordant ST-PR segment sign” (Figures 1 and 2). These changes are seen in 60% of patients.
The ECG changes develop in stages, making them easy to differentiate from early repolarization and, more significantly, from myocardial infarction. Four stages are apparent1,4,6–9:
- Stage I occurs in a few hours to days, with diffuse, up-sloping ST-segment elevation and upright T waves, the result of an alteration in ventricular repolarization caused by pericardial inflammation. Because of alteration in repolarization of the atrium secondary to inflammation, the PR segment is elevated in aVR and depressed in the rest of the limb and chest leads.
- Stage II—the ST and PR segments normalize.
- Stage III—widespread T-wave inversion.
- Stage IV—normalization of the T waves.
There is no pathologic Q-wave formation or loss of R-wave progression in acute pericarditis.
The ECG changes of pericarditis vary widely from one patient to another, depending on the extent and severity of pericardial inflammation and the timing of the patient’s presentation. Changes vary in duration. In some cases, ST elevation returns to baseline within a few days without T-wave inversions; in other cases, T-wave inversions can persist for weeks to months. Sometimes the abnormalities resolve by the time symptoms develop.
ASSOCIATED CONDITIONS
Myocardial involvement
In acute myocarditis, findings on ECG can be normal unless the pericardium is involved. Changes that can be seen in myocarditis and that indicate a deeper involvement of inflammation include ST-segment abnormalities, arrhythmias (eg, premature ventricular or atrial contractions), pathologic Q waves, intraventricular conduction delay, and right or left bundle branch block.1,10–12
Elevated troponin and new focal or global left ventricular dysfunction on cardiac imaging indicates myocarditis, especially in a patient with a normal coronary angiogram.10–13
Pericardial effusion: Tachycardia and low QRS voltage
Pericardial effusion is often a complication of pericarditis, but it can also develop from other conditions, such as myxedema, uremia, malignancy, connective tissue disease, aortic dissection, and postpericardiotomy syndrome, and it can also be iatrogenic.
The most common ECG sign of pericardial effusion is tachycardia and low voltage of the QRS complexes. Low voltage is defined as a total amplitude of the QRS complexes in each of the six limb leads less than or equal to 5 mm, and less than or equal to 10 mm in V1 through V6. However, low voltage is not always present in the chest leads.
Mechanisms proposed to explain low QRS voltage associated with pericardial effusion include internal short-circuiting of the electrical currents by accumulated fluids within the pericardial sac, greater distance of the heart from body surface electrodes, reduced cardiac size caused by effusion, and change in the generation and propagation of electrical current in the myocardium.14,15
Cardiac tamponade: Tachycardia, electrical alternans, low QRS voltage
Sinus tachycardia and electrical alternans are specific but not sensitive signs of pericardial tamponade (Figure 3).16,17 Electrical alternans is characterized by beat-to-beat alterations in the axis of QRS complexes in the limb and precordial leads as a result of the mechanical swinging of the heart in a large pericardial effusion.17 There is evidence to suggest that low QRS voltage is more the result of the tamponade than the effusion.18
Treating tamponade with pericardiocentesis, surgical creation of a fistula (“window”) between the pericardial space and the pleural cavity, or anti-inflammatory drugs can resolve low QRS voltage within 1 week.
DIFFERENTIAL DIAGNOSIS OF ACUTE PERICARDITIS
Acute myocardial infarction
ECG changes in acute pericarditis differ from those in acute myocardial infarction in many ways.
ST-segment elevation in pericarditis rarely exceeds 5 mm, in contrast to acute myocardial infarction, in which ST elevation at the J point has to be more than 2 mm and in two anatomically contiguous leads.19
In pericarditis, the changes occur more slowly and in stages, reflecting the evolving inflammation of different areas of the pericardium.
The ST segment is elevated diffusely in the precordial and limb leads in pericarditis, indicating involvement of more than one coronary vascular territory, differentiating it from characteristic regional changes in myocardial infarction.19,20
If concomitant atrial injury is present with acute pericarditis, then PR elevation in aVR with PR depression in other leads may be seen.
Finally, pathologic Q waves or high-grade heart block reflects acute myocardial infarction.
Early repolarization: Elevation of the J point
Early repolarization is sometimes seen in healthy young people, especially in black men.
Early repolarization is characterized by elevation of the J point (ie, the junction between the end of the QRS complex and the beginning of the ST segment). Elevation of the J point causes elevation of the ST segment in the mid to lateral precordial leads (V3–V6) with an up-right T wave.21
Acute pericarditis tends to cause ST-segment elevation in both the limb and precordial leads, whereas ST elevation in early repolarization mainly involves the lateral chest leads.
The PR segment is more prominent in acute pericarditis, especially in lead aVR.
Another finding that strongly favors acute pericarditis is the ratio of the height of the ST-segment junction to the height of the apex of the T wave of more than 0.25 in leads I, V4, V5, and V6 (Figure 4).5,8,22
- Imazio M, Trinchero R. Triage and management of acute pericarditis. Int J Cardiol 2007; 118:286–294.
- Little WC, Freeman GL. Pericardial disease. Circulation 2006; 113:1622–1632.
- Imazio M, Spodick DH, Brucato A, Trinchero R, Markel G, Adler Y. Diagnostic issues in the clinical management of pericarditis. Int J Clin Pract 2010; 64:1384–1392.
- Spodick DH. Acute pericarditis: current concepts and practice. JAMA 2003; 289:1150–1153.
- Troughton RW, Asher CR, Klein AL. Pericarditis. Lancet 2004; 363:717–727.
- Shabetai R. Acute pericarditis. Cardiol Clin 1990; 8:639–644.
- Baljepally R, Spodick DH. PR-segment deviation as the initial electrocardiographic response in acute pericarditis. Am J Cardiol 1998; 81:1505–1506.
- Spodick DH. Diagnostic electrocardiographic sequences in acute pericarditis. Significance of PR segment and PR vector changes. Circulation 1973; 48:575–580.
- Spodick D, editor. The Pericardium: A Comprehensive Textbook. New York, NY: Marcel Dekker; 1997:46–64.
- Smith SC, Ladenson JH, Mason JW, Jaffe AS. Elevations of cardiac troponin I associated with myocarditis. Experimental and clinical correlates. Circulation 1997; 95:163–168.
- Sarda L, Colin P, Boccara F, et al. Myocarditis in patients with clinical presentation of myocardial infarction and normal coronary angiograms. J Am Coll Cardiol 2001; 37:786–792.
- Spodick DH. Arrhythmias during acute pericarditis. A prospective study of 100 consecutive cases. JAMA 1976; 235:39–41.
- Imazio M, Trinchero R. Myopericarditis: etiology, management, and prognosis. Int J Cardiol 2008; 127:17–26.
- Toney JC, Kolmen SN. Cardiac tamponade: fluid and pressure effects on electrocardiographic changes. Proc Soc Exp Biol Med 1966; 121:642–648.
- Karatay CM, Fruehan CT, Lighty GW, Spear RM, Smulyan H. Acute pericardial distension in pigs: effect of fluid conductance on body surface electrocardiogram QRS size. Cardiovasc Res 1993; 27:1033–1038.
- Spodick DH. Acute cardiac tamponade. Pathologic physiology, diagnosis and management. Prog Cardiovasc Dis 1967; 10:64–96.
- Eisenberg MJ, de Romeral LM, Heidenreich PA, Schiller NB, Evans GT. The diagnosis of pericardial effusion and cardiac tamponade by 12-lead ECG. A technology assessment. Chest 1996; 110:318–324.
- Bruch C, Schmermund A, Dagres N, et al. Changes in QRS voltage in cardiac tamponade and pericardial effusion: reversibility after pericardiocentesis and after anti-inflammatory drug treatment. J Am Coll Cardiol 2001; 38:219–226.
- Wang K, Asinger RW, Marriott HJ. ST-segment elevation in conditions other than acute myocardial infarction. N Engl J Med 2003; 349:2128–2135.
- Brady WJ, Perron A, Ullman E. Errors in emergency physician interpretation of ST-segment elevation in emergency department chest pain patients. Acad Emerg Med 2000; 7:1256–1260.
- Kambara H, Phillips J. Long-term evaluation of early repolarization syndrome (normal variant RS-T segment elevation). Am J Cardiol 1976; 38:157–166.
- Ginzton LE, Laks MM. The differential diagnosis of acute pericarditis from the normal variant: new electrocardiographic criteria. Circulation 1982; 65:1004–1009.