User login
Diabetes management: Beyond hemoglobin A1c
When scientists discovered the band of hemoglobin A1c during electrophoresis in the 1950s and 1960s and discerned it was elevated in patients with diabetes, little did they know the important role it would play in the diagnosis and treatment of diabetes in the decades to come.1–3 Despite some caveats, a hemoglobin A1c level of 6.5% or higher is diagnostic of diabetes across most populations, and hemoglobin A1c goals ranging from 6.5% to 7.5% have been set for different subsets of patients depending on comorbidities, complications, risk of hypoglycemia, life expectancy, disease duration, patient preferences, and available resources.4

With a growing number of medications for diabetes—insulin in its various formulations and 11 other classes—hemoglobin A1c targets can now be tailored to fit individual patient profiles. Although helping patients attain their glycemic goals is paramount, other factors should be considered when prescribing or changing a drug treatment regimen, such as cardiovascular risk reduction, weight control, avoidance of hypoglycemia, and minimizing out-of-pocket drug costs (Table 1).
CARDIOVASCULAR BENEFIT
Patients with type 2 diabetes have a 2 to 3 times higher risk of clinical atherosclerotic disease, according to 20 years of surveillance data from the Framingham cohort.5
Mixed results with intensive treatment
Reducing cardiovascular risk remains an important goal in diabetes management, but unfortunately, data from the long-term clinical trials aimed at reducing macrovascular risk with intensive glycemic management have been conflicting.
The United Kingdom Prospective Diabetes Study (UKPDS),6 which enrolled more than 4,000 patients with newly diagnosed type 2 diabetes, did not initially show a statistically significant difference in the incidence of myocardial infarction with intensive control vs conventional control, although intensive treatment did reduce the incidence of microvascular disease. However, 10 years after the trial ended, the incidence was 15% lower in the intensive-treatment group than in the conventional-treatment group, and the difference was statistically significant.7
A 10-year follow-up analysis of the Veterans Affairs Diabetes Trial (VADT)8 showed that patients who had been randomly assigned to intensive glucose control for 5.6 years had 8.6 fewer major cardiovascular events per 1,000 person-years than those assigned to standard therapy, but no improvement in median overall survival. The hemoglobin A1c levels achieved during the trial were 6.9% and 8.4%, respectively.
In 2008, the US Food and Drug Administration (FDA)9 mandated that all new applications for diabetes drugs must include cardiovascular outcome studies. Therefore, we now have data on the cardiovascular benefits of two antihyperglycemic drug classes—incretins and sodium-glucose cotransporter 2 (SGLT2) inhibitors, making them attractive medications to target both cardiac and glucose concerns.
Incretins
The incretin drugs comprise 2 classes, glucagon-like peptide 1 (GLP-1) receptor agonists and dipeptidyl peptidase 4 (DPP-4) inhibitors.
Liraglutide. The Liraglutide Effect and Action in Diabetes: Evaluation of Cardiovascular Outcome Results (LEADER) trial10 compared liraglutide (a GLP-1 receptor agonist) and placebo in 9,000 patients with diabetes who either had or were at high risk of cardiovascular disease. Patients in the liraglutide group had a lower risk of the primary composite end point of death from cardiovascular causes or the first episode of nonfatal (including silent) myocardial infarction or nonfatal stroke, and a lower risk of cardiovascular death, all-cause mortality, and microvascular events than those in the placebo group. The number of patients who would need to be treated to prevent 1 event in 3 years was 66 in the analysis of the primary outcome and 98 in the analysis of death from any cause.9
Lixisenatide. The Evaluation of Lixisenatide in Acute Coronary Syndrome (ELIXA) trial11 studied the effect of the once-daily GLP-1 receptor agonist lixisenatide on cardiovascular outcomes in 6,000 patients with type 2 diabetes with a recent coronary event. In contrast to LEADER, ELIXA did not show a cardiovascular benefit over placebo.
Exenatide. The Exenatide Study of Cardiovascular Event Lowering (EXSCEL)12 assessed another GLP-1 extended-release drug, exenatide, in 14,000 patients, 73% of whom had established cardiovascular disease. In those patients, the drug had a modest benefit in terms of first occurrence of any component of the composite outcome of death from cardiovascular causes, nonfatal myocardial infarction, or nonfatal stroke (3-component major adverse cardiac event [MACE] outcome) in a time-to-event analysis, but the results were not statistically significant. However, the drug did significantly reduce all-cause mortality.
Semaglutide, another GLP-1 receptor agonist recently approved by the FDA, also showed benefit in patients who had cardiovascular disease or were at high risk, with significant reduction in the primary composite end point of death from cardiovascular causes or the first occurrence of nonfatal myocardial infarction (including silent) or nonfatal stroke.13
Dulaglutide, a newer GLP-1 drug, was associated with significantly reduced major adverse cardiovascular events (a composite end point of cardiovascular death, nonfatal myocardial infarction, or nonfatal stroke) in about 9,900 patients with diabetes, with a median follow-up of more than 5 years. Only 31% of the patients in the trial had established cardiovascular disease.14
Comment. GLP-1 drugs as a class are a good option for patients with diabetes who require weight loss, and liraglutide is now FDA-approved for reduction of cardiovascular events in patients with type 2 diabetes with established cardiovascular disease. However, other factors should be considered when prescribing these drugs: they have adverse gastrointestinal effects, the cardiovascular benefit was not a class effect, they are relatively expensive, and they must be injected. Also, they should not be prescribed concurrently with a DPP-4 inhibitor because they target the same pathway.
SGLT2 inhibitors
The other class of diabetes drugs that have shown cardiovascular benefit are the SGLT2 inhibitors.
Empagliflozin. The Empagliflozin Cardiovascular Outcome Event Trial in Type 2 Diabetes Mellitus Patients (EMPA-REG)15 compared the efficacy of empagliflozin vs placebo in 7,000 patients with diabetes and cardiovascular disease and showed relative risk reductions of 38% in death from cardiovascular death, 31% in sudden death, and 35% in heart failure hospitalizations. Empagliflozin also showed benefit in terms of progression of kidney disease and occurrence of clinically relevant renal events in this population.16
Canagliflozin also has cardiovascular outcome data and showed significant benefit when compared with placebo in the primary outcome of the composite of death from cardiovascular causes, nonfatal myocardial infarction, or nonfatal stroke, but no significant effects on cardiovascular death or all-cause mortality.17 Data from this trial also suggested a nonsignificant benefit of canagliflozin in decreasing progression of albuminuria and in the composite outcome of a sustained 40% reduction in the estimated glomerular filtration rate (eGFR), the need for renal replacement therapy, or death from renal causes.
The above data led to an additional indication from the FDA for empagliflozin—and recently, canagliflozin—to prevent cardiovascular death in patients with diabetes with established disease, but other factors should be considered when prescribing them. Patients taking canagliflozin showed a significantly increased risk of amputation. SGLT2 inhibitors as a class also increase the risk of genital infections in men and women; this is an important consideration since patients with diabetes complain of vaginal fungal and urinary tract infections even without the use of these drugs. A higher incidence of fractures with canagliflozin should also be considered when using these medications in elderly and osteoporosis-prone patients at high risk of falling.
Dapagliflozin, the third drug in this class, was associated with a lower rate of hospitalization for heart failure in about 17,160 patients—including 10,186 without atherosclerotic cardiovascular disease—who were followed for a median of 4.2 years.18 It did not show benefit for the primary safety outcome, a composite of major adverse cardiovascular events defined as cardiovascular death, myocardial infarction, or ischemic stroke.
WEIGHT MANAGEMENT
Weight loss can help overweight patients reach their hemoglobin A1c target.
Metformin should be continued as other drugs are added because it does not induce weight gain and may help with weight loss of up to 2 kg as shown in the Diabetes Prevention Program Outcomes Study.19
GLP-1 receptor agonists and SGLT2 inhibitors help with weight loss and are good additions to a basal insulin regimen to minimize weight gain.
Liraglutide was associated with a mean weight loss of 2.3 kg over 36 months of treatment compared with placebo in the LEADER trial.10
In the Trial to Evaluate Cardiovascular and Other Long-term Outcomes With Semaglutide in Subjects With Type 2 Diabetes (SUSTAIN-6),20 the mean body weight in the semaglutide group, compared with the placebo group, was 2.9 kg lower in the group receiving a lower dose and 4.3 kg lower in the group receiving a higher dose of the drug.
In a 24-week trial in 182 patients with type 2 diabetes inadequately controlled on metformin, dapagliflozin produced a statistically significant weight reduction of 2.08 kg (95% confidence interval 2.84–1.31; P < .0001) compared with placebo.21
Lifestyle changes aimed at weight management should be emphasized and discussed at every visit.
HYPOGLYCEMIA RISK
Hypoglycemia is a major consideration when tailoring hemoglobin A1c targets. In the Action to Control Cardiovascular Risk (ACCORD) trial,22 severe, symptomatic hypoglycemia increased the risk of death in both the intensive and conventional treatment groups. In VADT, the occurrence of a recent severe hypoglycemic event was the strongest independent predictor of death within 90 days. Further analysis showed that even though serious hypoglycemia occurred more often in the intensive therapy group, it was associated with progression of coronary artery calcification in the standard therapy group.23 Hence, it is imperative that tight glycemic control not be achieved at the cost of severe or recurrent hypoglycemia.
In terms of hypoglycemia, metformin is an excellent medication. The American Diabetes Association24 recommends metformin as the first-line therapy for newly diagnosed diabetes. Long-term follow-up data from UKPDS showed that metformin decreased mortality and the incidence of myocardial infarction and lowered treatment costs as well as the overall risk of hypoglycemia.25 When prescribed, it should be titrated to the highest dose.
The FDA26 has changed the prescribing information for metformin in patients with renal impairment. Metformin should not be started if the eGFR is less than 45 mL/min/1.73 m2, but it can be continued if the patient is already receiving it and the eGFR is between 30 and 45. Previously, creatinine levels were used to define renal impairment and suitability for metformin. This change has increased the number of patients who can benefit from this medication.
In patients who have a contraindication to metformin, DPP-4 inhibitors can be considered, as they carry a low risk of hypoglycemia as well. Sulfonylureas should be used with caution in these patients, especially if their oral intake is variable. When sulfonylureas were compared to the DPP-4 inhibitor sitagliptin as an add-on to metformin, the rate of hypoglycemia was 32% in the sulfonylurea group vs 5% in the sitagliptin group.27
Of the sulfonylureas, glipizide and glimepiride are better than glyburide because of a comparatively lower risk of hypoglycemia and a higher selectivity for binding the KATP channel on the pancreatic beta cell.28
Meglitinides can be a good option for patients who skip meals, but they are more expensive than other generic oral hypoglycemic agents and require multiple daily dosing.
GLP-1 analogues also have a low risk of hypoglycemia but are only available in injectable formulations. Patients must be willing and able to perform the injections themselves.29
LOOSER TARGETS FOR OLDER PATIENTS
In 2010, among US residents age 65 and older, 10.9 million (about 27%) had diabetes,30 and this number is projected to increase to 26.7 million by 2050.31 This population is prone to hypoglycemia when treated with insulin and sulfonylureas. An injury sustained by a fall induced by hypoglycemia can be life-altering. In addition, no randomized clinical trials show the effect of tight glycemic control on complications in older patients with diabetes because patients older than 80 are often excluded.
A reasonable goal suggested by the European Diabetes Working Party for Older People 201132 and reiterated by the American Geriatrics Society in 201333 is a hemoglobin A1c between 7% and 7.5% for relatively healthy older patients and 7.5% to 8% or 8.5% in frail elderly patients with diabetes.
Consider prescribing medications that carry a low risk of hypoglycemia, can be dose-adjusted for kidney function, and do not rely on manual dexterity for administration (ie, do not require patients to give themselves injections). These include metformin and DPP-4 inhibitors.
DRUG COMBINATIONS
Polypharmacy is a concern for all patients with diabetes, especially since it increases the risk of drug interactions and adverse effects, increases out-of-pocket costs, and decreases the likelihood that patients will remain adherent to their treatment regimen. The use of combination medications can reduce the number of pills or injections required, as well as copayments.
Due to concern for multiple drug-drug interactions (and also due to the progressive nature of diabetes), many people with type 2 diabetes are given insulin in lieu of pills to lower their blood glucose. In addition to premixed insulin combinations (such as combinations of neutral protamine Hagedorn and regular insulin or combinations of insulin analogues), long-acting basal insulins can now be prescribed with a GLP-1 drug in fixed-dose combinations such as insulin glargine plus lixisenatide and insulin degludec plus liraglutide.
COST CONSIDERATIONS
It is important to discuss medication cost with patients, because many newer diabetic drugs are expensive and add to the financial burden of patients already paying for multiple medications, such as antihypertensives and statins.
Metformin and sulfonylureas are less expensive alternatives for patients who cannot afford GLP-1 analogues or SGLT2 inhibitors. Even within the same drug class, the formulary-preferred drug may be cheaper than the nonformulary alternative. Thus, it is helpful to research formulary alternatives before discussing treatment regimens with patients.
- Allen DW, Schroeder WA, Balog J. Observations on the chromatographic heterogeneity of normal adult and fetal human hemoglobin: a study of the effects of crystallization and chromatography on the heterogeneity and isoleucine content. J Amer Chem Soc 1958; 80(7):1628–1634. doi:10.1021/ja01540a030
- Huisman TH, Dozy AM. Studies on the heterogeneity of hemoglobin. V. Binding of hemoglobin with oxidized glutathione. J Lab Clin Med 1962; 60:302–319. pmid:14449875
- Rahbar S, Blumenfeld O, Ranney HM. Studies of an unusual hemoglobin in patients with diabetes mellitus. Biochem Biophys Res Commun 1969; 36(5):838–843. pmid:5808299
- American Diabetes Association. 6. Glycemic targets: standards of medical care in diabetes—2018. Diabetes Care 2018; 41(suppl 1):S55–S64. doi:10.2337/dc18-S006
- Kannel WB, McGee DL. Diabetes and cardiovascular disease. The Framingham study. JAMA 1979; 241(19):2035–2038. pmid:430798
- UK Prospective Diabetes Study (UKPDS) Group. Intensive blood-glucose control with sulphonylureas or insulin compared with conventional treatment and risk of complications in patients with type 2 diabetes (UKPDS 33). Lancet 1998; 352(9131):837–853. [Erratum in Lancet 1999; 354:602.] pmid:9742976
- Holman RR, Paul SK, Bethel MA, Matthews DR, Neil HA. 10-year follow-up of intensive glucose control in type 2 diabetes. N Engl J Med 2008; 359(15):1577–1589. doi:10.1056/NEJMoa0806470
- Hayward RA, Reaven PD, Wiitala WL, et al; VADT Investigators. Follow-up of glycemic control and cardiovascular outcomes in type 2 diabetes. N Engl J Med 2015; 372(23):2197–2206. doi:10.1056/NEJMoa1414266
- US Food and Drug Administration. Guidance for industry: diabetes mellitus—evaluating cardiovascular risk in new antidiabetic therapies to treat type 2 diabetes. https://www.govinfo.gov/content/pkg/FR-2008-12-19/pdf/E8-30086.pdf. Accessed August 6, 2019.
- Marso SP, Daniels GH, Brown-Frandsen K, et al; LEADER Steering Committee; LEADER Trial Investigators. Liraglutide and cardiovascular outcomes in type 2 diabetes. N Engl J Med 2016; 375(4):311–322. doi:10.1056/NEJMoa1603827
- Pfeffer MA, Claggett B, Diaz R, et al; ELIXA Investigators. Lixisenatide in patients with type 2 diabetes and acute coronary syndrome. N Engl J Med 2015; 373(23):2247–2257. doi:10.1056/NEJMoa1509225
- Holman RR, Bethel MA, Mentz RJ, et al; EXSCEL Study Group. Effects of once-weekly exenatide on cardiovascular outcomes in type 2 diabetes. N Engl J Med 2017; 377(13):1228–1239. doi:10.1056/NEJMoa1612917
- Cosmi F, Laini R, Nicolucci A. Semaglutide and cardiovascular outcomes in patients with type 2 diabetes. N Engl J Med 2017; 376(9):890. doi:10.1056/NEJMc1615712
- Gerstein HC, Colhoun HM, Dagenais GR, et al. Dulaglutide and cardiovascular outcomes in type 2 diabetes (REWIND): a double-blind, randomised placebo-controlled trial. Lancet 2019; 394(10193):121–130. doi:10.1016/S0140-6736(19)31149-3
- Zinman B, Wanner C, Lachin JM, et al; EMPA-REG OUTCOME Investigators. Empagliflozin, cardiovascular outcomes, and mortality in type 2 diabetes. N Engl J Med 2015; 373(22):2117–2128. doi:10.1056/NEJMoa1504720
- Wanner C, Inzucchi SE, Lachin JM, et al; EMPA-REG OUTCOME Investigators. Empagliflozin and progression of kidney disease in type 2 diabetes. N Engl J Med 2016; 375(4):323–334. doi:10.1056/NEJMoa1515920
- Neal B, Perkovic V, Mahaffey KW, et al; CANVAS Program Collaborative Group. Canagliflozin and cardiovascular and renal events in type 2 diabetes. N Engl J Med 2017; 377(7):644–657. doi:10.1056/NEJMoa1611925
- Wiviott SD, Raz I, Bonaca MP, et al; DECLARE–TIMI 58 Investigators. Dapagliflozin and cardiovascular outcomes in type 2 diabetes. N Engl J Med 2018. [Epub ahead of print] doi:10.1056/NEJMoa1812389
- Diabetes Prevention Program Research Group; Knowler WC, Fowler SE, Hamman RF, et al. 10-year follow-up of diabetes incidence and weight loss in the Diabetes Prevention Program Outcomes Study. Lancet 2009; 374(9702):1677–1686. doi:10.1016/S0140-6736(09)61457-4
- Marso SP, Bain SC, Consoli A, et al, for the SUSTAIN-6 Investigators. Semaglutide and cardiovascular outcomes in patients with type 2 diabetes. N Engl J Med 2016; 375:1834–1844. doi:10.1056/NEJMoa1607141
- Bolinder J, Ljunggren Ö, Kullberg J, et al. Effects of dapagliflozin on body weight, total fat mass, and regional adipose tissue distribution in patients with type 2 diabetes mellitus with inadequate glycemic control on metformin. J Clin Endocrinol Metab 2012; 97(3):1020–1031. doi:10.1210/jc.2011-2260
- Bonds DE, Miller ME, Bergenstal RM, et al. The association between symptomatic, severe hypoglycaemia and mortality in type 2 diabetes: retrospective epidemiological analysis of the ACCORD study. BMJ 2010; 340:b4909. doi:10.1136/bmj.b4909
- Saremi A, Bahn GD, Reaven PD; Veterans Affairs Diabetes Trial (VADT). A link between hypoglycemia and progression of atherosclerosis in the Veterans Affairs Diabetes Trial (VADT). Diabetes Care 2016; 39(3):448–454. doi:10.2337/dc15-2107
- American Diabetes Association. 8. Pharmacologic approaches to glycemic treatment: standards of medical care in diabetes—2018. Diabetes Care 2018; 41(suppl 1):S73–S85. doi:10.2337/dc18-S008
- Holman RR, Paul SK, Bethel MA, Matthews DR, Neil HA. 10-year follow-up of intensive glucose control in type 2 diabetes. N Engl J Med 2008; 359(15):1577–1589. doi:10.1056/NEJMoa0806470
- US Food and Drug Administration. FDA drug safety communication: FDA revises warnings regarding use of the diabetes medicine metformin in certain patients with reduced kidney function. www.fda.gov/Drugs/DrugSafety/ucm493244.htm. Accessed August 5, 2019.
- Nauck MA, Meininger G, Sheng D, Terranella L, Stein PP; Sitagliptin Study 024 Group. Efficacy and safety of the dipeptidyl peptidase-4 inhibitor, sitagliptin, compared with the sulfonylurea, glipizide, in patients with type 2 diabetes inadequately controlled on metformin alone: a randomized, double-blind, non-inferiority trial. Diabetes Obes Metab 2007; 9(2):194–205. doi:10.1111/j.1463-1326.2006.00704.x
- Gangji AS, Cukierman T, Gerstein HC, Goldsmith CH, Clase CM. A systematic review and meta-analysis of hypoglycemia and cardiovascular events: a comparison of glyburide with other secretagogues and with insulin. Diabetes Care 2007; 30(2):389–394. doi:10.2337/dc06-1789
- Nauck M, Frid A, Hermansen K, et al; LEAD-2 Study Group. Efficacy and safety comparison of liraglutide, glimepiride, and placebo, all in combination with metformin, in type 2 diabetes: the LEAD (liraglutide effect and action in diabetes)-2 study. Diabetes Care 2009; 32(1):84–90. doi:10.2337/dc08-1355
- Centers for Disease Control and Prevention. National diabetes fact sheet: national estimates and general information on diabetes and prediabetes in the United States, 2011. www.cdc.gov/diabetes/pubs/pdf/ndfs_2011.pdf. Accessed August 5, 2019.
- Boyle JP, Thompson TJ, Gregg EW, Barker LE, Williamson DF. Projection of the year 2050 burden of diabetes in the US adult population: dynamic modeling of incidence, mortality, and prediabetes prevalence. Popul Health Metr 2010; 8:29. doi:10.1186/1478-7954-8-29
- Sinclair AJ, Paolisso G, Castro M, Bourdel-Marchasson I, Gadsby R, Rodriguez Mañas L; European Diabetes Working Party for Older People. European Diabetes Working Party for Older People 2011 clinical guidelines for type 2 diabetes mellitus. Executive summary. Diabetes Metab 2011; 37(suppl 3):S27–S38. doi:10.1016/S1262-3636(11)70962-4
- American Geriatrics Society Expert Panel on Care of Older Adults with Diabetes Mellitus; Moreno G, Mangione CM, Kimbro L, Vaisberg E. Guidelines abstracted from the American Geriatrics Society Guidelines for Improving the Care of Older Adults with Diabetes Mellitus: 2013 update. J Am Geriatr Soc 2013; 61(11):2020–2026. doi:10.1111/jgs.12514
When scientists discovered the band of hemoglobin A1c during electrophoresis in the 1950s and 1960s and discerned it was elevated in patients with diabetes, little did they know the important role it would play in the diagnosis and treatment of diabetes in the decades to come.1–3 Despite some caveats, a hemoglobin A1c level of 6.5% or higher is diagnostic of diabetes across most populations, and hemoglobin A1c goals ranging from 6.5% to 7.5% have been set for different subsets of patients depending on comorbidities, complications, risk of hypoglycemia, life expectancy, disease duration, patient preferences, and available resources.4
With a growing number of medications for diabetes—insulin in its various formulations and 11 other classes—hemoglobin A1c targets can now be tailored to fit individual patient profiles. Although helping patients attain their glycemic goals is paramount, other factors should be considered when prescribing or changing a drug treatment regimen, such as cardiovascular risk reduction, weight control, avoidance of hypoglycemia, and minimizing out-of-pocket drug costs (Table 1).
CARDIOVASCULAR BENEFIT
Patients with type 2 diabetes have a 2 to 3 times higher risk of clinical atherosclerotic disease, according to 20 years of surveillance data from the Framingham cohort.5
Mixed results with intensive treatment
Reducing cardiovascular risk remains an important goal in diabetes management, but unfortunately, data from the long-term clinical trials aimed at reducing macrovascular risk with intensive glycemic management have been conflicting.
The United Kingdom Prospective Diabetes Study (UKPDS),6 which enrolled more than 4,000 patients with newly diagnosed type 2 diabetes, did not initially show a statistically significant difference in the incidence of myocardial infarction with intensive control vs conventional control, although intensive treatment did reduce the incidence of microvascular disease. However, 10 years after the trial ended, the incidence was 15% lower in the intensive-treatment group than in the conventional-treatment group, and the difference was statistically significant.7
A 10-year follow-up analysis of the Veterans Affairs Diabetes Trial (VADT)8 showed that patients who had been randomly assigned to intensive glucose control for 5.6 years had 8.6 fewer major cardiovascular events per 1,000 person-years than those assigned to standard therapy, but no improvement in median overall survival. The hemoglobin A1c levels achieved during the trial were 6.9% and 8.4%, respectively.
In 2008, the US Food and Drug Administration (FDA)9 mandated that all new applications for diabetes drugs must include cardiovascular outcome studies. Therefore, we now have data on the cardiovascular benefits of two antihyperglycemic drug classes—incretins and sodium-glucose cotransporter 2 (SGLT2) inhibitors, making them attractive medications to target both cardiac and glucose concerns.
Incretins
The incretin drugs comprise 2 classes, glucagon-like peptide 1 (GLP-1) receptor agonists and dipeptidyl peptidase 4 (DPP-4) inhibitors.
Liraglutide. The Liraglutide Effect and Action in Diabetes: Evaluation of Cardiovascular Outcome Results (LEADER) trial10 compared liraglutide (a GLP-1 receptor agonist) and placebo in 9,000 patients with diabetes who either had or were at high risk of cardiovascular disease. Patients in the liraglutide group had a lower risk of the primary composite end point of death from cardiovascular causes or the first episode of nonfatal (including silent) myocardial infarction or nonfatal stroke, and a lower risk of cardiovascular death, all-cause mortality, and microvascular events than those in the placebo group. The number of patients who would need to be treated to prevent 1 event in 3 years was 66 in the analysis of the primary outcome and 98 in the analysis of death from any cause.9
Lixisenatide. The Evaluation of Lixisenatide in Acute Coronary Syndrome (ELIXA) trial11 studied the effect of the once-daily GLP-1 receptor agonist lixisenatide on cardiovascular outcomes in 6,000 patients with type 2 diabetes with a recent coronary event. In contrast to LEADER, ELIXA did not show a cardiovascular benefit over placebo.
Exenatide. The Exenatide Study of Cardiovascular Event Lowering (EXSCEL)12 assessed another GLP-1 extended-release drug, exenatide, in 14,000 patients, 73% of whom had established cardiovascular disease. In those patients, the drug had a modest benefit in terms of first occurrence of any component of the composite outcome of death from cardiovascular causes, nonfatal myocardial infarction, or nonfatal stroke (3-component major adverse cardiac event [MACE] outcome) in a time-to-event analysis, but the results were not statistically significant. However, the drug did significantly reduce all-cause mortality.
Semaglutide, another GLP-1 receptor agonist recently approved by the FDA, also showed benefit in patients who had cardiovascular disease or were at high risk, with significant reduction in the primary composite end point of death from cardiovascular causes or the first occurrence of nonfatal myocardial infarction (including silent) or nonfatal stroke.13
Dulaglutide, a newer GLP-1 drug, was associated with significantly reduced major adverse cardiovascular events (a composite end point of cardiovascular death, nonfatal myocardial infarction, or nonfatal stroke) in about 9,900 patients with diabetes, with a median follow-up of more than 5 years. Only 31% of the patients in the trial had established cardiovascular disease.14
Comment. GLP-1 drugs as a class are a good option for patients with diabetes who require weight loss, and liraglutide is now FDA-approved for reduction of cardiovascular events in patients with type 2 diabetes with established cardiovascular disease. However, other factors should be considered when prescribing these drugs: they have adverse gastrointestinal effects, the cardiovascular benefit was not a class effect, they are relatively expensive, and they must be injected. Also, they should not be prescribed concurrently with a DPP-4 inhibitor because they target the same pathway.
SGLT2 inhibitors
The other class of diabetes drugs that have shown cardiovascular benefit are the SGLT2 inhibitors.
Empagliflozin. The Empagliflozin Cardiovascular Outcome Event Trial in Type 2 Diabetes Mellitus Patients (EMPA-REG)15 compared the efficacy of empagliflozin vs placebo in 7,000 patients with diabetes and cardiovascular disease and showed relative risk reductions of 38% in death from cardiovascular death, 31% in sudden death, and 35% in heart failure hospitalizations. Empagliflozin also showed benefit in terms of progression of kidney disease and occurrence of clinically relevant renal events in this population.16
Canagliflozin also has cardiovascular outcome data and showed significant benefit when compared with placebo in the primary outcome of the composite of death from cardiovascular causes, nonfatal myocardial infarction, or nonfatal stroke, but no significant effects on cardiovascular death or all-cause mortality.17 Data from this trial also suggested a nonsignificant benefit of canagliflozin in decreasing progression of albuminuria and in the composite outcome of a sustained 40% reduction in the estimated glomerular filtration rate (eGFR), the need for renal replacement therapy, or death from renal causes.
The above data led to an additional indication from the FDA for empagliflozin—and recently, canagliflozin—to prevent cardiovascular death in patients with diabetes with established disease, but other factors should be considered when prescribing them. Patients taking canagliflozin showed a significantly increased risk of amputation. SGLT2 inhibitors as a class also increase the risk of genital infections in men and women; this is an important consideration since patients with diabetes complain of vaginal fungal and urinary tract infections even without the use of these drugs. A higher incidence of fractures with canagliflozin should also be considered when using these medications in elderly and osteoporosis-prone patients at high risk of falling.
Dapagliflozin, the third drug in this class, was associated with a lower rate of hospitalization for heart failure in about 17,160 patients—including 10,186 without atherosclerotic cardiovascular disease—who were followed for a median of 4.2 years.18 It did not show benefit for the primary safety outcome, a composite of major adverse cardiovascular events defined as cardiovascular death, myocardial infarction, or ischemic stroke.
WEIGHT MANAGEMENT
Weight loss can help overweight patients reach their hemoglobin A1c target.
Metformin should be continued as other drugs are added because it does not induce weight gain and may help with weight loss of up to 2 kg as shown in the Diabetes Prevention Program Outcomes Study.19
GLP-1 receptor agonists and SGLT2 inhibitors help with weight loss and are good additions to a basal insulin regimen to minimize weight gain.
Liraglutide was associated with a mean weight loss of 2.3 kg over 36 months of treatment compared with placebo in the LEADER trial.10
In the Trial to Evaluate Cardiovascular and Other Long-term Outcomes With Semaglutide in Subjects With Type 2 Diabetes (SUSTAIN-6),20 the mean body weight in the semaglutide group, compared with the placebo group, was 2.9 kg lower in the group receiving a lower dose and 4.3 kg lower in the group receiving a higher dose of the drug.
In a 24-week trial in 182 patients with type 2 diabetes inadequately controlled on metformin, dapagliflozin produced a statistically significant weight reduction of 2.08 kg (95% confidence interval 2.84–1.31; P < .0001) compared with placebo.21
Lifestyle changes aimed at weight management should be emphasized and discussed at every visit.
HYPOGLYCEMIA RISK
Hypoglycemia is a major consideration when tailoring hemoglobin A1c targets. In the Action to Control Cardiovascular Risk (ACCORD) trial,22 severe, symptomatic hypoglycemia increased the risk of death in both the intensive and conventional treatment groups. In VADT, the occurrence of a recent severe hypoglycemic event was the strongest independent predictor of death within 90 days. Further analysis showed that even though serious hypoglycemia occurred more often in the intensive therapy group, it was associated with progression of coronary artery calcification in the standard therapy group.23 Hence, it is imperative that tight glycemic control not be achieved at the cost of severe or recurrent hypoglycemia.
In terms of hypoglycemia, metformin is an excellent medication. The American Diabetes Association24 recommends metformin as the first-line therapy for newly diagnosed diabetes. Long-term follow-up data from UKPDS showed that metformin decreased mortality and the incidence of myocardial infarction and lowered treatment costs as well as the overall risk of hypoglycemia.25 When prescribed, it should be titrated to the highest dose.
The FDA26 has changed the prescribing information for metformin in patients with renal impairment. Metformin should not be started if the eGFR is less than 45 mL/min/1.73 m2, but it can be continued if the patient is already receiving it and the eGFR is between 30 and 45. Previously, creatinine levels were used to define renal impairment and suitability for metformin. This change has increased the number of patients who can benefit from this medication.
In patients who have a contraindication to metformin, DPP-4 inhibitors can be considered, as they carry a low risk of hypoglycemia as well. Sulfonylureas should be used with caution in these patients, especially if their oral intake is variable. When sulfonylureas were compared to the DPP-4 inhibitor sitagliptin as an add-on to metformin, the rate of hypoglycemia was 32% in the sulfonylurea group vs 5% in the sitagliptin group.27
Of the sulfonylureas, glipizide and glimepiride are better than glyburide because of a comparatively lower risk of hypoglycemia and a higher selectivity for binding the KATP channel on the pancreatic beta cell.28
Meglitinides can be a good option for patients who skip meals, but they are more expensive than other generic oral hypoglycemic agents and require multiple daily dosing.
GLP-1 analogues also have a low risk of hypoglycemia but are only available in injectable formulations. Patients must be willing and able to perform the injections themselves.29
LOOSER TARGETS FOR OLDER PATIENTS
In 2010, among US residents age 65 and older, 10.9 million (about 27%) had diabetes,30 and this number is projected to increase to 26.7 million by 2050.31 This population is prone to hypoglycemia when treated with insulin and sulfonylureas. An injury sustained by a fall induced by hypoglycemia can be life-altering. In addition, no randomized clinical trials show the effect of tight glycemic control on complications in older patients with diabetes because patients older than 80 are often excluded.
A reasonable goal suggested by the European Diabetes Working Party for Older People 201132 and reiterated by the American Geriatrics Society in 201333 is a hemoglobin A1c between 7% and 7.5% for relatively healthy older patients and 7.5% to 8% or 8.5% in frail elderly patients with diabetes.
Consider prescribing medications that carry a low risk of hypoglycemia, can be dose-adjusted for kidney function, and do not rely on manual dexterity for administration (ie, do not require patients to give themselves injections). These include metformin and DPP-4 inhibitors.
DRUG COMBINATIONS
Polypharmacy is a concern for all patients with diabetes, especially since it increases the risk of drug interactions and adverse effects, increases out-of-pocket costs, and decreases the likelihood that patients will remain adherent to their treatment regimen. The use of combination medications can reduce the number of pills or injections required, as well as copayments.
Due to concern for multiple drug-drug interactions (and also due to the progressive nature of diabetes), many people with type 2 diabetes are given insulin in lieu of pills to lower their blood glucose. In addition to premixed insulin combinations (such as combinations of neutral protamine Hagedorn and regular insulin or combinations of insulin analogues), long-acting basal insulins can now be prescribed with a GLP-1 drug in fixed-dose combinations such as insulin glargine plus lixisenatide and insulin degludec plus liraglutide.
COST CONSIDERATIONS
It is important to discuss medication cost with patients, because many newer diabetic drugs are expensive and add to the financial burden of patients already paying for multiple medications, such as antihypertensives and statins.
Metformin and sulfonylureas are less expensive alternatives for patients who cannot afford GLP-1 analogues or SGLT2 inhibitors. Even within the same drug class, the formulary-preferred drug may be cheaper than the nonformulary alternative. Thus, it is helpful to research formulary alternatives before discussing treatment regimens with patients.
- Allen DW, Schroeder WA, Balog J. Observations on the chromatographic heterogeneity of normal adult and fetal human hemoglobin: a study of the effects of crystallization and chromatography on the heterogeneity and isoleucine content. J Amer Chem Soc 1958; 80(7):1628–1634. doi:10.1021/ja01540a030
- Huisman TH, Dozy AM. Studies on the heterogeneity of hemoglobin. V. Binding of hemoglobin with oxidized glutathione. J Lab Clin Med 1962; 60:302–319. pmid:14449875
- Rahbar S, Blumenfeld O, Ranney HM. Studies of an unusual hemoglobin in patients with diabetes mellitus. Biochem Biophys Res Commun 1969; 36(5):838–843. pmid:5808299
- American Diabetes Association. 6. Glycemic targets: standards of medical care in diabetes—2018. Diabetes Care 2018; 41(suppl 1):S55–S64. doi:10.2337/dc18-S006
- Kannel WB, McGee DL. Diabetes and cardiovascular disease. The Framingham study. JAMA 1979; 241(19):2035–2038. pmid:430798
- UK Prospective Diabetes Study (UKPDS) Group. Intensive blood-glucose control with sulphonylureas or insulin compared with conventional treatment and risk of complications in patients with type 2 diabetes (UKPDS 33). Lancet 1998; 352(9131):837–853. [Erratum in Lancet 1999; 354:602.] pmid:9742976
- Holman RR, Paul SK, Bethel MA, Matthews DR, Neil HA. 10-year follow-up of intensive glucose control in type 2 diabetes. N Engl J Med 2008; 359(15):1577–1589. doi:10.1056/NEJMoa0806470
- Hayward RA, Reaven PD, Wiitala WL, et al; VADT Investigators. Follow-up of glycemic control and cardiovascular outcomes in type 2 diabetes. N Engl J Med 2015; 372(23):2197–2206. doi:10.1056/NEJMoa1414266
- US Food and Drug Administration. Guidance for industry: diabetes mellitus—evaluating cardiovascular risk in new antidiabetic therapies to treat type 2 diabetes. https://www.govinfo.gov/content/pkg/FR-2008-12-19/pdf/E8-30086.pdf. Accessed August 6, 2019.
- Marso SP, Daniels GH, Brown-Frandsen K, et al; LEADER Steering Committee; LEADER Trial Investigators. Liraglutide and cardiovascular outcomes in type 2 diabetes. N Engl J Med 2016; 375(4):311–322. doi:10.1056/NEJMoa1603827
- Pfeffer MA, Claggett B, Diaz R, et al; ELIXA Investigators. Lixisenatide in patients with type 2 diabetes and acute coronary syndrome. N Engl J Med 2015; 373(23):2247–2257. doi:10.1056/NEJMoa1509225
- Holman RR, Bethel MA, Mentz RJ, et al; EXSCEL Study Group. Effects of once-weekly exenatide on cardiovascular outcomes in type 2 diabetes. N Engl J Med 2017; 377(13):1228–1239. doi:10.1056/NEJMoa1612917
- Cosmi F, Laini R, Nicolucci A. Semaglutide and cardiovascular outcomes in patients with type 2 diabetes. N Engl J Med 2017; 376(9):890. doi:10.1056/NEJMc1615712
- Gerstein HC, Colhoun HM, Dagenais GR, et al. Dulaglutide and cardiovascular outcomes in type 2 diabetes (REWIND): a double-blind, randomised placebo-controlled trial. Lancet 2019; 394(10193):121–130. doi:10.1016/S0140-6736(19)31149-3
- Zinman B, Wanner C, Lachin JM, et al; EMPA-REG OUTCOME Investigators. Empagliflozin, cardiovascular outcomes, and mortality in type 2 diabetes. N Engl J Med 2015; 373(22):2117–2128. doi:10.1056/NEJMoa1504720
- Wanner C, Inzucchi SE, Lachin JM, et al; EMPA-REG OUTCOME Investigators. Empagliflozin and progression of kidney disease in type 2 diabetes. N Engl J Med 2016; 375(4):323–334. doi:10.1056/NEJMoa1515920
- Neal B, Perkovic V, Mahaffey KW, et al; CANVAS Program Collaborative Group. Canagliflozin and cardiovascular and renal events in type 2 diabetes. N Engl J Med 2017; 377(7):644–657. doi:10.1056/NEJMoa1611925
- Wiviott SD, Raz I, Bonaca MP, et al; DECLARE–TIMI 58 Investigators. Dapagliflozin and cardiovascular outcomes in type 2 diabetes. N Engl J Med 2018. [Epub ahead of print] doi:10.1056/NEJMoa1812389
- Diabetes Prevention Program Research Group; Knowler WC, Fowler SE, Hamman RF, et al. 10-year follow-up of diabetes incidence and weight loss in the Diabetes Prevention Program Outcomes Study. Lancet 2009; 374(9702):1677–1686. doi:10.1016/S0140-6736(09)61457-4
- Marso SP, Bain SC, Consoli A, et al, for the SUSTAIN-6 Investigators. Semaglutide and cardiovascular outcomes in patients with type 2 diabetes. N Engl J Med 2016; 375:1834–1844. doi:10.1056/NEJMoa1607141
- Bolinder J, Ljunggren Ö, Kullberg J, et al. Effects of dapagliflozin on body weight, total fat mass, and regional adipose tissue distribution in patients with type 2 diabetes mellitus with inadequate glycemic control on metformin. J Clin Endocrinol Metab 2012; 97(3):1020–1031. doi:10.1210/jc.2011-2260
- Bonds DE, Miller ME, Bergenstal RM, et al. The association between symptomatic, severe hypoglycaemia and mortality in type 2 diabetes: retrospective epidemiological analysis of the ACCORD study. BMJ 2010; 340:b4909. doi:10.1136/bmj.b4909
- Saremi A, Bahn GD, Reaven PD; Veterans Affairs Diabetes Trial (VADT). A link between hypoglycemia and progression of atherosclerosis in the Veterans Affairs Diabetes Trial (VADT). Diabetes Care 2016; 39(3):448–454. doi:10.2337/dc15-2107
- American Diabetes Association. 8. Pharmacologic approaches to glycemic treatment: standards of medical care in diabetes—2018. Diabetes Care 2018; 41(suppl 1):S73–S85. doi:10.2337/dc18-S008
- Holman RR, Paul SK, Bethel MA, Matthews DR, Neil HA. 10-year follow-up of intensive glucose control in type 2 diabetes. N Engl J Med 2008; 359(15):1577–1589. doi:10.1056/NEJMoa0806470
- US Food and Drug Administration. FDA drug safety communication: FDA revises warnings regarding use of the diabetes medicine metformin in certain patients with reduced kidney function. www.fda.gov/Drugs/DrugSafety/ucm493244.htm. Accessed August 5, 2019.
- Nauck MA, Meininger G, Sheng D, Terranella L, Stein PP; Sitagliptin Study 024 Group. Efficacy and safety of the dipeptidyl peptidase-4 inhibitor, sitagliptin, compared with the sulfonylurea, glipizide, in patients with type 2 diabetes inadequately controlled on metformin alone: a randomized, double-blind, non-inferiority trial. Diabetes Obes Metab 2007; 9(2):194–205. doi:10.1111/j.1463-1326.2006.00704.x
- Gangji AS, Cukierman T, Gerstein HC, Goldsmith CH, Clase CM. A systematic review and meta-analysis of hypoglycemia and cardiovascular events: a comparison of glyburide with other secretagogues and with insulin. Diabetes Care 2007; 30(2):389–394. doi:10.2337/dc06-1789
- Nauck M, Frid A, Hermansen K, et al; LEAD-2 Study Group. Efficacy and safety comparison of liraglutide, glimepiride, and placebo, all in combination with metformin, in type 2 diabetes: the LEAD (liraglutide effect and action in diabetes)-2 study. Diabetes Care 2009; 32(1):84–90. doi:10.2337/dc08-1355
- Centers for Disease Control and Prevention. National diabetes fact sheet: national estimates and general information on diabetes and prediabetes in the United States, 2011. www.cdc.gov/diabetes/pubs/pdf/ndfs_2011.pdf. Accessed August 5, 2019.
- Boyle JP, Thompson TJ, Gregg EW, Barker LE, Williamson DF. Projection of the year 2050 burden of diabetes in the US adult population: dynamic modeling of incidence, mortality, and prediabetes prevalence. Popul Health Metr 2010; 8:29. doi:10.1186/1478-7954-8-29
- Sinclair AJ, Paolisso G, Castro M, Bourdel-Marchasson I, Gadsby R, Rodriguez Mañas L; European Diabetes Working Party for Older People. European Diabetes Working Party for Older People 2011 clinical guidelines for type 2 diabetes mellitus. Executive summary. Diabetes Metab 2011; 37(suppl 3):S27–S38. doi:10.1016/S1262-3636(11)70962-4
- American Geriatrics Society Expert Panel on Care of Older Adults with Diabetes Mellitus; Moreno G, Mangione CM, Kimbro L, Vaisberg E. Guidelines abstracted from the American Geriatrics Society Guidelines for Improving the Care of Older Adults with Diabetes Mellitus: 2013 update. J Am Geriatr Soc 2013; 61(11):2020–2026. doi:10.1111/jgs.12514
KEY POINTS
- Some glucagon-like peptide 1 (GLP-1) receptor agonists have been shown to reduce cardiovascular risk, and liraglutide carries an indication for this use.
- The sodium-glucose cotransporter 2 inhibitors empaglifozin and canaglifozin carry indications to prevent cardiovascular death in patients with diabetes with established cardiovascular disease.
- Metformin, GLP-1 receptor agonists, and dipeptidyl peptidase 4 inhibitors are beneficial in terms of promoting weight loss—or at least not causing weight gain.
- Disadvantages and adverse effects of various drugs must also be considered.
In reply: Metformin for type 2 diabetes
In Reply: We thank Dr. Moskowitz for his kind comments. We agree about the need for assessing vitamin B12 levels during chronic metformin use.
Secondary analysis of patients in the Diabetes Prevention Program Outcomes Study showed a higher incidence of combined low and low-normal vitamin B12 deficiency in users assigned to the metformin group compared with those assigned to the placebo group at the 5-year and 13-year marks after randomization.1 Post hoc analysis of patients in the Hyperinsulinemia: the Outcome of Its Metabolic Effects trial also showed lower levels of vitamin B12 and higher levels of methylmalonic acid associated with significant worsening of a validated neuropathy score in metformin users.2
The mechanism behind the development of vitamin B12 deficiency is not completely understood but could possibly be alterations in intestinal mobility, bacterial overgrowth, or calcium-dependent uptake by ileal cells of the vitamin B12-intrinsic factor complex.3
Our electronic medical record has a built-in tool that suggests checking vitamin B12 whenever a patient requests metformin refills. There are no current guidelines on the need for baseline testing of the vitamin B12 level. The American Diabetes Association recommends periodic measurement of vitamin B12 levels, possibly yearly, in metformin users and more often if there are symptoms indicative of deficiency.4
- Aroda VR, Edelstein SL, Goldberg RB, et al; Diabetes Prevention Program Research Group. Long-term metformin use and vitamin B12 deficiency in the Diabetes Prevention Program Outcomes Study. J Clin Endocrinol Metab 2019; 101(4):1754–1761. doi:10.1210/jc.2015-3754
- Out M, Kooy A, Lehert P, Schalkwijk CA, Stehouwer CDA. Long-term treatment with metformin in type 2 diabetes and methylmalonic acid: post hoc analysis of a randomized controlled 4.3 year trial. J Diabetes Complications 2018; 32(2):171–178. doi:10.1016/j.jdiacomp.2017.11.001
- Liu KW, Dai LK, Jean W. Metformin-related vitamin B12 deficiency. Age Ageing 2006; 35(2):200–201. doi:10.1093/ageing/afj042
- American Diabetes Association. 9. Pharmacologic approaches to glycemic treatment: Standards of Medical Care in Diabetes—2019. Diabetes Care 2019; 42(suppl 1):S90–S102. doi:10.2337/dc19-S009
In Reply: We thank Dr. Moskowitz for his kind comments. We agree about the need for assessing vitamin B12 levels during chronic metformin use.
Secondary analysis of patients in the Diabetes Prevention Program Outcomes Study showed a higher incidence of combined low and low-normal vitamin B12 deficiency in users assigned to the metformin group compared with those assigned to the placebo group at the 5-year and 13-year marks after randomization.1 Post hoc analysis of patients in the Hyperinsulinemia: the Outcome of Its Metabolic Effects trial also showed lower levels of vitamin B12 and higher levels of methylmalonic acid associated with significant worsening of a validated neuropathy score in metformin users.2
The mechanism behind the development of vitamin B12 deficiency is not completely understood but could possibly be alterations in intestinal mobility, bacterial overgrowth, or calcium-dependent uptake by ileal cells of the vitamin B12-intrinsic factor complex.3
Our electronic medical record has a built-in tool that suggests checking vitamin B12 whenever a patient requests metformin refills. There are no current guidelines on the need for baseline testing of the vitamin B12 level. The American Diabetes Association recommends periodic measurement of vitamin B12 levels, possibly yearly, in metformin users and more often if there are symptoms indicative of deficiency.4
- Aroda VR, Edelstein SL, Goldberg RB, et al; Diabetes Prevention Program Research Group. Long-term metformin use and vitamin B12 deficiency in the Diabetes Prevention Program Outcomes Study. J Clin Endocrinol Metab 2019; 101(4):1754–1761. doi:10.1210/jc.2015-3754
- Out M, Kooy A, Lehert P, Schalkwijk CA, Stehouwer CDA. Long-term treatment with metformin in type 2 diabetes and methylmalonic acid: post hoc analysis of a randomized controlled 4.3 year trial. J Diabetes Complications 2018; 32(2):171–178. doi:10.1016/j.jdiacomp.2017.11.001
- Liu KW, Dai LK, Jean W. Metformin-related vitamin B12 deficiency. Age Ageing 2006; 35(2):200–201. doi:10.1093/ageing/afj042
- American Diabetes Association. 9. Pharmacologic approaches to glycemic treatment: Standards of Medical Care in Diabetes—2019. Diabetes Care 2019; 42(suppl 1):S90–S102. doi:10.2337/dc19-S009

Should metformin be used in every patient with type 2 diabetes?
Most patients should receive it, with exceptions as noted below. Metformin is the cornerstone of diabetes therapy and should be considered in all patients with type 2 diabetes. Both the American Diabetes Association (ADA) and the American Association of Clinical Endocrinologists (AACE)1,2 recommend it as first-line treatment for type 2 diabetes. It lowers blood glucose levels by inhibiting hepatic glucose production, and it does not tend to cause hypoglycemia.
However, metformin is underused. A 2012 study showed that only 50% to 70% of patients with type 2 diabetes treated with a sulfonylurea, dipeptidyl peptidase-4 (DPP-4) inhibitor, thiazolidinedione, or glucagon-like peptide-1 analogue also received metformin.3 This occurred despite guidelines recommending continuing metformin when starting other diabetes drugs.4
EVIDENCE METFORMIN IS EFFECTIVE
The United Kingdom Prospective Diabetes Study (UKPDS)5 found that metformin significantly reduced the incidence of:
- Any diabetes-related end point (hazard ratio [HR] 0.68, 95% confidence interval [CI] 0.53–0.87)
- Myocardial infarction (HR 0.61, 95% CI 0.41–0.89)
- Diabetes-related death (HR 0.58, 95% CI 0.37–0.91)
- All-cause mortality (HR 0.64; 95% CI 0.45–0.91).
The Hyperinsulinemia: Outcomes of Its Metabolic Effects (HOME) trial,6 a multicenter trial conducted in the Netherlands, evaluated the effect of adding metformin (vs placebo) to existing insulin regimens. Metformin recipients had a significantly lower rate of macrovascular mortality (HR 0.61, 95% CI 0.40–0.94, P = .02), but not of the primary end point, an aggregate of microvascular and macrovascular morbidity and mortality.
The Study on the Prognosis and Effect of Antidiabetic Drugs on Type 2 Diabetes Mellitus With Coronary Artery Disease trial,7 a multicenter trial conducted in China, compared the effects of metformin vs glipizide on cardiovascular outcomes. At about 3 years of treatment, the metformin group had a significantly lower rate of the composite primary end point of recurrent cardiovascular events (HR 0.54, 95% CI 0.30–0.90). This end point included nonfatal myocardial infarction, nonfatal stroke, arterial revascularization by percutaneous transluminal coronary angioplasty or by coronary artery bypass graft, death from a cardiovascular cause, and death from any cause.
These studies prompted the ADA to emphasize that metformin can reduce the risk of cardiovascular events or death. Metformin also has been shown to be weight-neutral or to induce slight weight loss. Furthermore, it is inexpensive.
WHAT ABOUT THE RENAL EFFECTS?
Because metformin is renally cleared, it has caused some concern about nephrotoxicity, especially lactic acidosis, in patients with impaired renal function. But the most recent guidelines have relaxed the criteria for metformin use in this patient population.
Revised labeling
Metformin’s labeling,8 revised in 2016, states the following:
- If the estimated glomerular filtration rate (eGFR) is below 30 mL/min/1.73 m2, metformin is contraindicated
- If the eGFR is between 30 and 45 mL/min/1.73 m2, metformin is not recommended
- If the eGFR is below 45 mL/min/1.73 m2 in a patient taking metformin, the risks and benefits of continuing treatment should be assessed, the dosage may need to be adjusted, and renal function should be monitored more frequently.8
These labeling revisions were based on a systematic review by Inzucchi et al9 that found metformin is not associated with increased rates of lactic acidosis in patients with mild to moderate kidney disease. Subsequently, an observational study published in 2018 by Lazarus et al10 showed that metformin increases the risk of acidosis only at eGFR levels below 30 mL/min/1.73 m2. Also, a Cochrane review published in 2003 did not find a single case of lactic acidosis in 347 trials with 70,490 patient-years of metformin treatment.11
Previous guidelines used serum creatinine levels, with metformin contraindicated at levels of 1.5 mg/dL or above for men and 1.4 mg/dL for women, or with abnormal creatinine clearance. The ADA and the AACE now use the eGFR1,2 instead of the serum creatinine level to measure kidney function because it better accounts for factors such as the patient’s age, sex, race, and weight.
Despite the evidence, the common patient perception is that metformin is nephrotoxic, and it is important for practitioners to dispel this myth during clinic visits.
What about metformin use with contrast agents?
Labeling has a precautionary note stating that metformin should be held at the time of, or prior to, any imaging procedure involving iodinated contrast agents in patients with an eGFR between 30 and 60 mL/min/1.73 m2; in patients with a history of hepatic impairment, alcoholism, or heart failure; or in patients who will receive intra-arterial iodinated contrast. The eGFR should be reevaluated 48 hours after the imaging procedure.8
Additionally, if the iodinated contrast agent causes acute kidney injury, metformin could accumulate, with resultant lactate accumulation.
The American College of Radiology (ACR) has proposed less stringent guidelines for metformin during radiocontrast imaging studies. This change is based on evidence that lactic acidosis is rare—about 10 cases per 100,000 patient-years—and that there are no reports of lactic acidosis after intravenously administered iodinated contrast in properly selected patients.12,13
The ACR divides patients taking metformin into 2 categories:
- No evidence of acute kidney injury and eGFR greater than 30 mL/min/1.73 m2
- Either acute kidney injury or chronic kidney disease with eGFR below 30 mL/min/1.73 m2 or undergoing arterial catheter studies with a high chance of embolization to the renal arteries.14
For the first group, they recommend against discontinuing metformin before or after giving iodinated contrast or checking kidney function after the procedure.
For the second group, they recommend holding metformin before and 48 hours after the procedure. It should not be restarted until renal function is confirmed to be normal.
METFORMIN AND INSULIN
The ADA recommends1 continuing metformin after initiating insulin. However, in clinical practice, it is often not done.
Clinical trials have shown that combining metformin with insulin significantly improves glycemic control, prevents weight gain, and decreases insulin requirements.15,16 One trial16 also looked at cardiovascular end points during a 4-year follow-up period; combining metformin with insulin decreased the macrovascular disease-related event rate compared with insulin alone.
In the HOME trial,6 which added metformin to the existing insulin regimen, both groups gained weight, but the metformin group had gained about 3 kg less than the placebo group at the end of the 4.3-year trial. Metformin did not increase the risk of hypoglycemia, but it also did not reduce the risk of microvascular disease.
Concomitant metformin reduces costs
These days, practitioners can choose from a large selection of diabetes drugs. These include insulins with better pharmacokinetic profiles, as well as newer classes of noninsulin agents such as sodium-glucose cotransporter-2 inhibitors and glucagon-like peptide-1 analogues.
Metformin is less expensive than these newer drugs, and using it concomitantly with other diabetes drugs can decrease their dosage requirements, which in turn decreases their monthly costs.
GASTROINTESTINAL EFFECTS
Metformin’s gastrointestinal adverse effects such as diarrhea, flatulence, nausea, and vomiting are a barrier to its use. The actual incidence rate of diarrhea varies widely in randomized trials and observational studies, and gastrointestinal effects are worse in metformin-naive patients, as well as those who have chronic gastritis or Helicobacter pylori infection.17
We have found that starting metformin at a low dose and up-titrating it over several weeks increases tolerability. We often start patients at 500 mg/day and increase the dosage by 1 500-mg tablet every 1 to 2 weeks. Also, we have noticed that intolerance is more likely in patients who eat a high-carbohydrate diet, but there is no high-level evidence to back this up because patients in clinical trials all undergo nutrition counseling and are therefore more likely to adhere to the low-carbohydrate diet.
Also, the extended-release formulation is more tolerable than the immediate-release formulation and has similar glycemic efficacy. It may be an option as first-line therapy or for patients who have significant adverse effects from immediate-release metformin.18 For patients on the immediate-release formulation, taking it with meals helps lessen some gastrointestinal effects, and this should be emphasized at every visit.
Finally, we limit the metformin dose to 2,000 mg/day, rather than the 2,550 mg/day allowed on labeling. Garber et al19 found that the lower dosage still provides the maximum clinical efficacy.
OTHER CAUTIONS
Metformin should be avoided in patients with acute or unstable heart failure because of the increased risk of lactic acidosis.
It also should be avoided in patients with hepatic impairment, according to the labeling. But this remains controversial in practice. Zhang et al20 showed that continuing metformin in patients with diabetes and cirrhosis decreases the mortality risk by 57% compared with those taken off metformin.
Diet and lifestyle measures need to be emphasized at each visit. Wing et al21 showed that calorie restriction regardless of weight loss is beneficial for glycemic control and insulin sensitivity in obese patients with diabetes.
TAKE-HOME POINTS
Metformin improves glycemic control without tending to cause weight gain or hypoglycemia. It may also have cardiovascular benefits. Metformin is an inexpensive agent that should be continued, if tolerated, in those who need additional agents for glycemic control. It should be considered in all adult patients with type 2 diabetes.
- American Diabetes Association. 8. Pharmacologic approaches to glycemic treatment: standards of medical care in diabetes-2018. Diabetes Care 2018; 41(suppl 1):S73–S85. doi:10.2337/dc18-S008
- Garber AJ, Abrahamson MJ, Barzilay JI, et al. Consensus statement by the American Association of Clinical Endocrinologists and American College of Endocrinology on the comprehensive type 2 diabetes management algorithm—2018 executive summary. Endocr Pract 2018; 24(1):91–120. doi:10.4158/CS-2017-0153
- Hampp C, Borders-Hemphill V, Moeny DG, Wysowski DK. Use of antidiabetic drugs in the US, 2003–2012. Diabetes Care 2014; 37(5):1367–1374. doi:10.2337/dc13-2289
- Inzucchi SE, Bergenstal RM, Buse JB, et al; American Diabetes Association (ADA); European Association for the Study of Diabetes (EASD). Management of hyperglycemia in type 2 diabetes: a patient-centered approach: position statement of the American Diabetes Association (ADA) and the European Association for the Study of Diabetes (EASD). Diabetes Care 2012; 35(6):1364–1379. doi:10.2337/dc12-0413
- Effect of intensive blood-glucose control with metformin on complications in overweight patients with type 2 diabetes (UKPDS 34). UK Prospective Diabetes Study (UKPDS) Group. Lancet 1998; 352(9131):854–865. pmid:9742977
- Kooy A, de Jager J, Lehert P, et al. Long-term effects of metformin on metabolism and microvascular and macrovascular disease in patients with type 2 diabetes mellitus. Arch Intern Med 2009; 169(6):616–625. doi:10.1001/archinternmed.2009.20
- Hong J, Zhang Y, Lai S, et al; SPREAD-DIMCAD Investigators. Effects of metformin versus glipizide on cardiovascular outcomes in patients with type 2 diabetes and coronary artery disease. Diabetes Care 2013; 36(5):1304–1311. doi:10.2337/dc12-0719
- Glucophage (metformin hydrochloride) and Glucophage XR (extended-release) [package insert]. Princeton, NJ: Bristol-Myers Squibb Company. www.accessdata.fda.gov/drugsatfda_docs/label/2018/020357s034,021202s018lbl.pdf. Accessed December 5, 2018.
- Inzucchi SE, Lipska KJ, Mayo H, Bailey CJ, McGuire DK. Metformin in patients with type 2 diabetes and kidney disease: a systematic review. JAMA 2014; 312(24):2668–2675. doi:10.1001/jama.2014.15298
- Lazarus B, Wu A, Shin JI, et al. Association of metformin use with risk of lactic acidosis across the range of kidney function: a community-based cohort study. JAMA Intern Med 2018; 178(7):903–910. doi:10.1001/jamainternmed.2018.0292
- Salpeter S, Greyber E, Pasternak G, Salpeter E. Risk of fatal and nonfatal lactic acidosis with metformin use in type 2 diabetes mellitus. Cochrane Database Syst Rev 2003; (2):CD002967. doi:10.1002/14651858.CD002967
- Eppenga WL, Lalmohamed A, Geerts AF, et al. Risk of lactic acidosis or elevated lactate concentrations in metformin users with renal impairment: a population-based cohort study. Diabetes Care 2014; 37(8):2218–2224. doi:10.2337/dc13-3023
- Richy FF, Sabidó-Espin M, Guedes S, Corvino FA, Gottwald-Hostalek U. Incidence of lactic acidosis in patients with type 2 diabetes with and without renal impairment treated with metformin: a retrospective cohort study. Diabetes Care 2014; 37(8):2291–2295. doi:10.2337/dc14-0464
- American College of Radiology (ACR). Manual on Contrast Media. Version 10.3. www.acr.org/Clinical-Resources/Contrast-Manual. Accessed December 5, 2018.
- Wulffele MG, Kooy A, Lehert P, et al. Combination of insulin and metformin in the treatment of type 2 diabetes. Diabetes Care 2002; 25(12):2133–2140. pmid:12453950
- Kooy A, de Jager J, Lehert P, et al. Long-term effects of metformin on metabolism and microvascular and macrovascular disease in patients with type 2 diabetes mellitus. Arch Intern Med 2009; 169(6):616–625. doi:10.1001/archinternmed.2009.20
- Bonnet F, Scheen A. Understanding and overcoming metformin gastrointestinal intolerance, Diabetes Obes Metab 2017; 19(4):473–481. doi:10.1111/dom.12854
- Jabbour S, Ziring B. Advantages of extended-release metformin in patients with type 2 diabetes mellitus. Postgrad Med 2011; 123(1):15–23. doi:10.3810/pgm.2011.01.2241
- Garber AJ, Duncan TG, Goodman AM, Mills DJ, Rohlf JL. Efficacy of metformin in type II diabetes: results of a double-blind, placebo-controlled, dose-response trial. Am J Med 1997; 103(6):491–497. pmid:9428832
- Zhang X, Harmsen WS, Mettler TA, et al. Continuation of metformin use after a diagnosis of cirrhosis significantly improves survival of patients with diabetes. Hepatology 2014; 60(6):2008–2016. doi:10.1002/hep.27199
- Wing RR, Blair EH, Bononi P, Marcus MD, Watanabe R, Bergman RN. Caloric restriction per se is a significant factor in improvements in glycemic control and insulin sensitivity during weight loss in obese NIDDM patients. Diabetes Care 1994; 17(1):30–36. pmid:8112186
Most patients should receive it, with exceptions as noted below. Metformin is the cornerstone of diabetes therapy and should be considered in all patients with type 2 diabetes. Both the American Diabetes Association (ADA) and the American Association of Clinical Endocrinologists (AACE)1,2 recommend it as first-line treatment for type 2 diabetes. It lowers blood glucose levels by inhibiting hepatic glucose production, and it does not tend to cause hypoglycemia.
However, metformin is underused. A 2012 study showed that only 50% to 70% of patients with type 2 diabetes treated with a sulfonylurea, dipeptidyl peptidase-4 (DPP-4) inhibitor, thiazolidinedione, or glucagon-like peptide-1 analogue also received metformin.3 This occurred despite guidelines recommending continuing metformin when starting other diabetes drugs.4
EVIDENCE METFORMIN IS EFFECTIVE
The United Kingdom Prospective Diabetes Study (UKPDS)5 found that metformin significantly reduced the incidence of:
- Any diabetes-related end point (hazard ratio [HR] 0.68, 95% confidence interval [CI] 0.53–0.87)
- Myocardial infarction (HR 0.61, 95% CI 0.41–0.89)
- Diabetes-related death (HR 0.58, 95% CI 0.37–0.91)
- All-cause mortality (HR 0.64; 95% CI 0.45–0.91).
The Hyperinsulinemia: Outcomes of Its Metabolic Effects (HOME) trial,6 a multicenter trial conducted in the Netherlands, evaluated the effect of adding metformin (vs placebo) to existing insulin regimens. Metformin recipients had a significantly lower rate of macrovascular mortality (HR 0.61, 95% CI 0.40–0.94, P = .02), but not of the primary end point, an aggregate of microvascular and macrovascular morbidity and mortality.
The Study on the Prognosis and Effect of Antidiabetic Drugs on Type 2 Diabetes Mellitus With Coronary Artery Disease trial,7 a multicenter trial conducted in China, compared the effects of metformin vs glipizide on cardiovascular outcomes. At about 3 years of treatment, the metformin group had a significantly lower rate of the composite primary end point of recurrent cardiovascular events (HR 0.54, 95% CI 0.30–0.90). This end point included nonfatal myocardial infarction, nonfatal stroke, arterial revascularization by percutaneous transluminal coronary angioplasty or by coronary artery bypass graft, death from a cardiovascular cause, and death from any cause.
These studies prompted the ADA to emphasize that metformin can reduce the risk of cardiovascular events or death. Metformin also has been shown to be weight-neutral or to induce slight weight loss. Furthermore, it is inexpensive.
WHAT ABOUT THE RENAL EFFECTS?
Because metformin is renally cleared, it has caused some concern about nephrotoxicity, especially lactic acidosis, in patients with impaired renal function. But the most recent guidelines have relaxed the criteria for metformin use in this patient population.
Revised labeling
Metformin’s labeling,8 revised in 2016, states the following:
- If the estimated glomerular filtration rate (eGFR) is below 30 mL/min/1.73 m2, metformin is contraindicated
- If the eGFR is between 30 and 45 mL/min/1.73 m2, metformin is not recommended
- If the eGFR is below 45 mL/min/1.73 m2 in a patient taking metformin, the risks and benefits of continuing treatment should be assessed, the dosage may need to be adjusted, and renal function should be monitored more frequently.8
These labeling revisions were based on a systematic review by Inzucchi et al9 that found metformin is not associated with increased rates of lactic acidosis in patients with mild to moderate kidney disease. Subsequently, an observational study published in 2018 by Lazarus et al10 showed that metformin increases the risk of acidosis only at eGFR levels below 30 mL/min/1.73 m2. Also, a Cochrane review published in 2003 did not find a single case of lactic acidosis in 347 trials with 70,490 patient-years of metformin treatment.11
Previous guidelines used serum creatinine levels, with metformin contraindicated at levels of 1.5 mg/dL or above for men and 1.4 mg/dL for women, or with abnormal creatinine clearance. The ADA and the AACE now use the eGFR1,2 instead of the serum creatinine level to measure kidney function because it better accounts for factors such as the patient’s age, sex, race, and weight.
Despite the evidence, the common patient perception is that metformin is nephrotoxic, and it is important for practitioners to dispel this myth during clinic visits.
What about metformin use with contrast agents?
Labeling has a precautionary note stating that metformin should be held at the time of, or prior to, any imaging procedure involving iodinated contrast agents in patients with an eGFR between 30 and 60 mL/min/1.73 m2; in patients with a history of hepatic impairment, alcoholism, or heart failure; or in patients who will receive intra-arterial iodinated contrast. The eGFR should be reevaluated 48 hours after the imaging procedure.8
Additionally, if the iodinated contrast agent causes acute kidney injury, metformin could accumulate, with resultant lactate accumulation.
The American College of Radiology (ACR) has proposed less stringent guidelines for metformin during radiocontrast imaging studies. This change is based on evidence that lactic acidosis is rare—about 10 cases per 100,000 patient-years—and that there are no reports of lactic acidosis after intravenously administered iodinated contrast in properly selected patients.12,13
The ACR divides patients taking metformin into 2 categories:
- No evidence of acute kidney injury and eGFR greater than 30 mL/min/1.73 m2
- Either acute kidney injury or chronic kidney disease with eGFR below 30 mL/min/1.73 m2 or undergoing arterial catheter studies with a high chance of embolization to the renal arteries.14
For the first group, they recommend against discontinuing metformin before or after giving iodinated contrast or checking kidney function after the procedure.
For the second group, they recommend holding metformin before and 48 hours after the procedure. It should not be restarted until renal function is confirmed to be normal.
METFORMIN AND INSULIN
The ADA recommends1 continuing metformin after initiating insulin. However, in clinical practice, it is often not done.
Clinical trials have shown that combining metformin with insulin significantly improves glycemic control, prevents weight gain, and decreases insulin requirements.15,16 One trial16 also looked at cardiovascular end points during a 4-year follow-up period; combining metformin with insulin decreased the macrovascular disease-related event rate compared with insulin alone.
In the HOME trial,6 which added metformin to the existing insulin regimen, both groups gained weight, but the metformin group had gained about 3 kg less than the placebo group at the end of the 4.3-year trial. Metformin did not increase the risk of hypoglycemia, but it also did not reduce the risk of microvascular disease.
Concomitant metformin reduces costs
These days, practitioners can choose from a large selection of diabetes drugs. These include insulins with better pharmacokinetic profiles, as well as newer classes of noninsulin agents such as sodium-glucose cotransporter-2 inhibitors and glucagon-like peptide-1 analogues.
Metformin is less expensive than these newer drugs, and using it concomitantly with other diabetes drugs can decrease their dosage requirements, which in turn decreases their monthly costs.
GASTROINTESTINAL EFFECTS
Metformin’s gastrointestinal adverse effects such as diarrhea, flatulence, nausea, and vomiting are a barrier to its use. The actual incidence rate of diarrhea varies widely in randomized trials and observational studies, and gastrointestinal effects are worse in metformin-naive patients, as well as those who have chronic gastritis or Helicobacter pylori infection.17
We have found that starting metformin at a low dose and up-titrating it over several weeks increases tolerability. We often start patients at 500 mg/day and increase the dosage by 1 500-mg tablet every 1 to 2 weeks. Also, we have noticed that intolerance is more likely in patients who eat a high-carbohydrate diet, but there is no high-level evidence to back this up because patients in clinical trials all undergo nutrition counseling and are therefore more likely to adhere to the low-carbohydrate diet.
Also, the extended-release formulation is more tolerable than the immediate-release formulation and has similar glycemic efficacy. It may be an option as first-line therapy or for patients who have significant adverse effects from immediate-release metformin.18 For patients on the immediate-release formulation, taking it with meals helps lessen some gastrointestinal effects, and this should be emphasized at every visit.
Finally, we limit the metformin dose to 2,000 mg/day, rather than the 2,550 mg/day allowed on labeling. Garber et al19 found that the lower dosage still provides the maximum clinical efficacy.
OTHER CAUTIONS
Metformin should be avoided in patients with acute or unstable heart failure because of the increased risk of lactic acidosis.
It also should be avoided in patients with hepatic impairment, according to the labeling. But this remains controversial in practice. Zhang et al20 showed that continuing metformin in patients with diabetes and cirrhosis decreases the mortality risk by 57% compared with those taken off metformin.
Diet and lifestyle measures need to be emphasized at each visit. Wing et al21 showed that calorie restriction regardless of weight loss is beneficial for glycemic control and insulin sensitivity in obese patients with diabetes.
TAKE-HOME POINTS
Metformin improves glycemic control without tending to cause weight gain or hypoglycemia. It may also have cardiovascular benefits. Metformin is an inexpensive agent that should be continued, if tolerated, in those who need additional agents for glycemic control. It should be considered in all adult patients with type 2 diabetes.
- American Diabetes Association. 8. Pharmacologic approaches to glycemic treatment: standards of medical care in diabetes-2018. Diabetes Care 2018; 41(suppl 1):S73–S85. doi:10.2337/dc18-S008
- Garber AJ, Abrahamson MJ, Barzilay JI, et al. Consensus statement by the American Association of Clinical Endocrinologists and American College of Endocrinology on the comprehensive type 2 diabetes management algorithm—2018 executive summary. Endocr Pract 2018; 24(1):91–120. doi:10.4158/CS-2017-0153
- Hampp C, Borders-Hemphill V, Moeny DG, Wysowski DK. Use of antidiabetic drugs in the US, 2003–2012. Diabetes Care 2014; 37(5):1367–1374. doi:10.2337/dc13-2289
- Inzucchi SE, Bergenstal RM, Buse JB, et al; American Diabetes Association (ADA); European Association for the Study of Diabetes (EASD). Management of hyperglycemia in type 2 diabetes: a patient-centered approach: position statement of the American Diabetes Association (ADA) and the European Association for the Study of Diabetes (EASD). Diabetes Care 2012; 35(6):1364–1379. doi:10.2337/dc12-0413
- Effect of intensive blood-glucose control with metformin on complications in overweight patients with type 2 diabetes (UKPDS 34). UK Prospective Diabetes Study (UKPDS) Group. Lancet 1998; 352(9131):854–865. pmid:9742977
- Kooy A, de Jager J, Lehert P, et al. Long-term effects of metformin on metabolism and microvascular and macrovascular disease in patients with type 2 diabetes mellitus. Arch Intern Med 2009; 169(6):616–625. doi:10.1001/archinternmed.2009.20
- Hong J, Zhang Y, Lai S, et al; SPREAD-DIMCAD Investigators. Effects of metformin versus glipizide on cardiovascular outcomes in patients with type 2 diabetes and coronary artery disease. Diabetes Care 2013; 36(5):1304–1311. doi:10.2337/dc12-0719
- Glucophage (metformin hydrochloride) and Glucophage XR (extended-release) [package insert]. Princeton, NJ: Bristol-Myers Squibb Company. www.accessdata.fda.gov/drugsatfda_docs/label/2018/020357s034,021202s018lbl.pdf. Accessed December 5, 2018.
- Inzucchi SE, Lipska KJ, Mayo H, Bailey CJ, McGuire DK. Metformin in patients with type 2 diabetes and kidney disease: a systematic review. JAMA 2014; 312(24):2668–2675. doi:10.1001/jama.2014.15298
- Lazarus B, Wu A, Shin JI, et al. Association of metformin use with risk of lactic acidosis across the range of kidney function: a community-based cohort study. JAMA Intern Med 2018; 178(7):903–910. doi:10.1001/jamainternmed.2018.0292
- Salpeter S, Greyber E, Pasternak G, Salpeter E. Risk of fatal and nonfatal lactic acidosis with metformin use in type 2 diabetes mellitus. Cochrane Database Syst Rev 2003; (2):CD002967. doi:10.1002/14651858.CD002967
- Eppenga WL, Lalmohamed A, Geerts AF, et al. Risk of lactic acidosis or elevated lactate concentrations in metformin users with renal impairment: a population-based cohort study. Diabetes Care 2014; 37(8):2218–2224. doi:10.2337/dc13-3023
- Richy FF, Sabidó-Espin M, Guedes S, Corvino FA, Gottwald-Hostalek U. Incidence of lactic acidosis in patients with type 2 diabetes with and without renal impairment treated with metformin: a retrospective cohort study. Diabetes Care 2014; 37(8):2291–2295. doi:10.2337/dc14-0464
- American College of Radiology (ACR). Manual on Contrast Media. Version 10.3. www.acr.org/Clinical-Resources/Contrast-Manual. Accessed December 5, 2018.
- Wulffele MG, Kooy A, Lehert P, et al. Combination of insulin and metformin in the treatment of type 2 diabetes. Diabetes Care 2002; 25(12):2133–2140. pmid:12453950
- Kooy A, de Jager J, Lehert P, et al. Long-term effects of metformin on metabolism and microvascular and macrovascular disease in patients with type 2 diabetes mellitus. Arch Intern Med 2009; 169(6):616–625. doi:10.1001/archinternmed.2009.20
- Bonnet F, Scheen A. Understanding and overcoming metformin gastrointestinal intolerance, Diabetes Obes Metab 2017; 19(4):473–481. doi:10.1111/dom.12854
- Jabbour S, Ziring B. Advantages of extended-release metformin in patients with type 2 diabetes mellitus. Postgrad Med 2011; 123(1):15–23. doi:10.3810/pgm.2011.01.2241
- Garber AJ, Duncan TG, Goodman AM, Mills DJ, Rohlf JL. Efficacy of metformin in type II diabetes: results of a double-blind, placebo-controlled, dose-response trial. Am J Med 1997; 103(6):491–497. pmid:9428832
- Zhang X, Harmsen WS, Mettler TA, et al. Continuation of metformin use after a diagnosis of cirrhosis significantly improves survival of patients with diabetes. Hepatology 2014; 60(6):2008–2016. doi:10.1002/hep.27199
- Wing RR, Blair EH, Bononi P, Marcus MD, Watanabe R, Bergman RN. Caloric restriction per se is a significant factor in improvements in glycemic control and insulin sensitivity during weight loss in obese NIDDM patients. Diabetes Care 1994; 17(1):30–36. pmid:8112186
Diabetes and obesity: Managing dual epidemics
The odds are high that practitioners who manage patients with diabetes are also managing patients who are overweight or obese. The numbers are staggering: more than two-thirds of American adults with type 2 diabetes are obese, and the need to address these dual epidemics is clear. Many strategies exist, but how does a practitioner select the best option for an individual patient? This Cleveland Clinic Journal of Medicine supplement on diabetes and obesity includes articles by experts who review the evidence on the impact of different diets and exercise and the use of “weight-friendly” diabetes medications, drug therapy, and metabolic surgery in managing obesity in patients with diabetes.
For some patients with type 2 diabetes, changes in diet and exercise are beneficial in managing the disease and can lead to weight loss. Diets abound, but what diets are best, particularly for patients with obesity? Zahrae Sandouk, MD, and I review several popular diets and what is known about their effects on weight loss, glycemic control, and cardiovascular risk.
As for exercise, both aerobic and resistance training are essential to improve glucose regulation and cardiovascular health. John P. Kirwan, PhD, Jessica Sacks, and Stephan Nieuwoudt review exercise recommendations, modalities, and the metabolic benefits of exercise for this patient population.
Drug therapy typically focuses on the diabetes side of the coin and not necessarily the obesity side; however, practitioners are increasingly helping patients establish goals on both fronts. To that end, Mary Angelynne Esquivel, MD, and I discuss medications for treatment of type 2 diabetes that also have weight loss as a side effect, including glucagon-like peptide-1 receptor agonists, sodium-glucose cotransporter-2 inhibitors, neuroendocrine peptide hormones, alpha-glucosidase inhibitors, and metformin.
The heightened focus on addressing obesity warrants consideration of medications for weight loss. Bartolome Burguera, MD, PhD, Khawla F. Ali, MD, and Juan P. Brito, MD, discuss a potential shift in thinking: using antiobesity drugs to manage type 2 diabetes. The authors review pharmacologic therapies approved for managing obesity in the context of diabetes.
While initially used for patients with severe obesity, bariatric surgery is now called metabolic surgery when used for type 2 diabetes because of its dramatic impact in reversing type 2 diabetes. Philip R. Schauer, MD, Zubaidah Nor Hanipah, MD, and Francesco Rubino, MD, describe the benefits of metabolic surgery and review the evidence that led diabetes organizations to set new guidelines with a lower body mass index threshold than previously recommended.
The dual epidemics of diabetes and obesity present physicians with a complex set of considerations to help patients achieve their treatment goals on both fronts in the battle. I hope you find this supplement on diabetes and obesity informative and useful to you to enhance patient care.

Diabetes with obesity—Is there an ideal diet?
According to National Health and Nutrition Examination Survey data, more than one-third of adults in the United States are obese and more than two-thirds of adults with type 2 diabetes mellitus (DM) are obese.1 In light of overall increased life expectancy, the Centers for Disease Control and Prevention estimates that adults in the United States have a 40% lifetime risk of developing diabetes, as diabetes and obesity remain at epidemic levels.2
Weight loss in individuals who are overweight or obese is effective in preventing type 2 DM and improving management of the disease.3,4 Dietary changes play a central role in achieving weight loss, as do other important lifestyle interventions such as exercise, behavior modification, and pharmacotherapy. Achieving glycemic goals with diet alone is difficult, and for patients with DM who are also obese, it may be even more challenging.
Medical nutrition therapy, a term coined by the American Dietetic Association, describes an approach to treating medical conditions using specific diets. As developed and monitored by a physician and registered dietitian, diet can result in beneficial outcomes and is a front-line approach for patients with noninsulin-dependent diabetes.5 Medical nutrition therapy for patients with type 2 DM is most effective when used within 1 year of diagnosis and is associated with a 0.5% to 2% decrease in hemoglobin A1c (HbA1c) levels.6 This article reviews the role of diet in managing patients with both type 2 DM and obesity. Several diets are presented including what is known about their effect on weight loss, glycemic control, and cardiovascular risk prevention in patients with diabetes and obesity.
WEIGHT LOSS AND DIET FOR PATIENTS WITH OBESITY AND DIABETES
A person is overweight or obese if he or she weighs more than the ideal weight for their height as calculated by the body mass index (BMI; weight in kg/height in meters squared). A BMI of 25 to 30 is overweight and a BMI of 30 or greater is obese.7 The recommended daily caloric intake for adults is based on sex, age, and daily activity level and ranges from 1,600 to 2,000 calories per day for women and 2,000 to 2,600 calories per day for men. The lower end of the range is for sedentary adults, and the higher end is for active adults (walking 1.5 to 3 miles per day at 3 to 4 miles per hour, in addition to independent living).8
According to the American Diabetes Association (ADA), weight loss requires reducing dietary intake by 500 to 750 calories per day, or roughly 1,200 to 1,500 kcal/day for women and 1,500 to 1,800 kcal/day for men.3 For patients with obesity and type 2 DM, sustained, modest weight loss of 5% of initial body weight improves glycemic control and reduces the need for diabetes medications.9 Weight loss of greater than 5% body weight also improves lipid and blood pressure status in patients with obesity and diabetes, though ideally, patients are encouraged to achieve weight reduction of 7% or greater.10
Evidence of benefits from lifestyle and dietary modifications
The fact that patients with obesity and type 2 DM have increased risk of cardiovascular morbidity and mortality is well established.11 Multiple studies considered the effects of weight loss on cardiovascular morbidity and mortality. Our article focuses on dietary modifications, though most large, multicenter trials used both diet and increased physical activity to achieve weight loss. It is difficult to determine if diet or physical activity had the most effect on outcomes; however, results show that weight loss from dietary and other lifestyle interventions leads to change in outcomes.
Look AHEAD (Action for Health in Diabetes) trial. This large, multicenter, randomized controlled trial evaluated the effect of weight loss on cardiovascular morbidity and mortality in overweight or obese adults with type 2 DM. The 5,145 participants were assigned either to a long-term weight reduction intensive lifestyle intervention of diet, physical activity, and behavior modification or to usual care of support and education. At 1 year, the lifestyle intervention group had greater weight loss, improved fitness, decreased number of diabetes medications, decreased blood pressure, and improved biomarkers of glucose and lipid control compared with the usual care group.12 No significant reductions in cardiovascular morbidity and mortality were found, though an observational post hoc analysis of the Look AHEAD data suggested an association between the magnitude of weight loss and the incidence of cardiovascular disease.13
The diet portion of the intensive lifestyle intervention consisted of self-selected, conventional foods while recording dietary intake during week 1. In week 2, patients weighing less than 114 kg (250 lbs) restricted their intake to 1,200 to 1,500 kcal/day, and patients weighing 114 kg or more restricted their intake to 1,500 to 1,800 kcal/day. Fewer than 30% of calories were from fat, with less than 10% from saturated fat. During week 3 through week 9, meal replacement options and conventional foods were used to reach caloric goals. Participants then decreased the use of meal replacement and increased the use of conventional foods during week 20 through week 22.14
The mean weight loss for participants in the intensive lifestyle intervention group was 8.6% compared with 0.7% in the support and education group (P < .001). HbA1c decreased by 0.7% in the intervention group compared with 0.1% the support and education group (P < .001).12
Finnish Diabetes Prevention Study. This study evaluated lifestyle changes in diet and physical activity in the prevention of type 2 DM in participants with impaired glucose intolerance. Participants (N = 552) were randomly assigned to the control group or the intervention group where detailed instruction was provided to achieve weight loss of greater than 5%.15 The dietary goals included fewer than 30% of total calories from fat, with fewer than 10% from saturated fat, increased fiber consumption (15 g per 1,000 kcal), and physical activity of 30 minutes daily.15 During the trial (mean duration of follow-up 3.2 years), the risk of type 2 DM was reduced by 58% in the intervention group compared with the control group.15
Diabetes Prevention Program Research Group. A landmark study by the Diabetes Prevention Program Research Group randomized 3,234 participates with elevated plasma glucose levels to placebo, metformin, and lifestyle intervention arms.4 Those in the lifestyle intervention arm were educated about ways to achieve and maintain a 7% or greater reduction in body weight using a low-calorie, low-fat diet and moderate physical activity. Results based on a mean follow-up of 2.8 years found a 58% reduction in the incidence of diabetes for those in the lifestyle intervention arm.4
DIETS AND THEIR EFFECTS ON OBESITY, DIABETES, AND CARDIOVASCULAR RISK
When patients seek consultation about diet, they frequently ask about specific types of popular diets, not the very controlled diets employed in research studies. Dietary preferences are personal, so patients may have researched a particular diet or feel that they will be more adherent if only 1 or 2 components of their meals are changed. There is no single optimal dietary strategy for patients with both obesity and type 2 DM. In general, diets are categorized based on the 3 basic macronutrients: carbohydrate, fat, and protein. We will review several popular diets, delineating content, effects on weight loss, glycemic control, and cardiovascular factors.
LOW-CARBOHYDRATE DIET

In practice, the median intake of carbohydrates for US adults is much higher, at 220 to 330 g per day for men and 180 to 230 g per day for women.16 The ADA recommends that all Americans consume fewer refined carbohydrates and added sugars in favor of whole grains, legumes, vegetables, and fruit.18
Low-carbohydrate diets focus on reducing carbohydrate intake with the thought that fewer carbohydrates are better. However, the definition of a low-carbohydrate diet varies. In most studies, carbohydrate intake was limited to less than 20 g to 120 g daily or fewer than 4% to 45% of the total calories consumed.17,19 Intake of fat and total calories is unlimited, though unsaturated fats are preferred over saturated or trans fats.
Limiting the intake of disaccharide sugar in the form of sucrose and high-fructose corn syrup is endorsed because of concerns that these sugars are rapidly digested, absorbed, and fully metabolized. However, several randomized trials showed that substituting sucrose for equal amounts of other types of carbohydrates in individuals with type 2 DM showed no difference in glycemic response.20 The resulting conclusion is that the postprandial glycemic response is mainly driven by the amount rather than the type of carbohydrates. The consumption of sugar-sweetened beverages is associated with obesity and an increased risk of diabetes, attributed to the high caloric intake and decreased insulin sensitivity associated with these beverages.21
Of the 2 monosaccharides, glucose and fructose, that make up sucrose, fructose is metabolized in the liver. The rapid metabolism of fructose may lead to alterations in lipid metabolism and affect insulin sensitivity.22 While the ADA does not advise against consuming fructose, it does advise limiting its use due to the caloric density of many foods containing fructose.
Multiple studies have investigated the effect of a low-carbohydrate diet on weight loss, glucose control, and cardiovascular risk, but comparing the results is difficult due to the varying definitions of a low-carbohydrate diet.
Low-carbohydrate diets are associated with rapid weight loss. A 6-month study of 31 patients with obesity and type 2 DM found a mean weight change of −11.4 kg (± 4 kg) in the low-carbohydrate group compared with −1.8 kg (± 3.8 kg) in the high-carbohydrate control group, a loss maintained up to 1 year.23 Another study of 88 patients with type 2 DM who consumed less than 40 g/day of carbohydrate had a weight loss of 7.2 kg over 12 months.24 Samaha et al25 compared a low-carbohydrate diet with a low-fat diet in 132 participants with obesity (mean BMI 43), of which 39% had diabetes and 43% had metabolic syndrome. Those in the low-carbohydrate diet group had significantly more weight loss over a period of 6 months (−5.8 kg mean, ± 8.6 kg standard deviation [SD] vs −1.9 kg mean ± 4.2 kg SD, P = .002). However, at 1 year, there was no significant difference in weight loss between groups. At 36 months, weight regain was 2.2 kg (SD 12.3 kg) less than baseline in the low-carbohydrate group compared with 4.3 kg (SD 12.2 kg) less than baseline in the low-fat group
(P = .071).25,26 On the other hand, a meta-analysis of 23 randomized trials involving 2,788 participants found no difference in weight loss at 6 months between those on a low-carbohydrate diet and those on a low-fat diet.19
With respect to glucose control, low-carbohydrate diets have been associated with a 1.4% (SD ± 1.1%)decrease in HbA1c during a 6-month period in 31 patients with obesity and type 2 DM.23 Another 6-month study of 206 patients with obesity and diabetes comparing a low-carbohydrate diet with a low-calorie diet found no significant difference in HbA1c (−0.48% vs −0.24%, respectively) and a weight loss of 1.34 kg vs 3.77 kg, respectively (P < .001).27 The change in glycemic control did not persist over time, perhaps due to the weight regain associated with this diet. A meta-analysis concluded that HbA1c was reduced more in patients with type 2 DM randomized to a lower-carbohydrate diet compared with a higher-carbohydrate diet (mean change from baseline 0% to −2.2%).17
No studies of the effects of a low-carbohydrate diet on overall cardiovascular morbidity or mortality exist. However, Kirk et al17 reported results of a low-carbohydrate diet on cardiovascular risk factors such as lipid profiles and showed a significant reduction in triglyceride levels but no effect on total cholesterol, high-density lipoprotein cholesterol (HDL-C), or low-density lipoprotein cholesterol (LDL-C) levels.
The ADA has reported that low-carbohydrate diets may be effective in the management of type 2 DM in the short term. Caution is warranted because they could eliminate important sources of energy, fiber, vitamins, and minerals. It is also important to monitor lipid profile, renal function, and protein intake in certain patients, especially those with renal dysfunction.6
LOW-GLYCEMIC DIET

Various factors affect the GI including the type of carbohydrate, fat content, protein content, and acidity of the food consumed, as well as the rate of intestinal reaction to the food. The faster the digestion of a food, the higher the GI. High-GI foods (> 70), such as those highly processed and with high starch content, produce higher peak glucose levels when compared with low-GI foods (< 55). Low-GI foods include lentils, beans, oats, and nonstarchy vegetables.
Low-GI foods curb the large and rapid rise of blood glucose, insulin response, and glucagon inhibition that occur with high-GI foods. Many low-GI foods have high amounts of fiber, which prolongs distention of the gastrointestinal tract, increases secretion of cholecystokinin and incretins, and extends statiety.28
In a meta-analysis of 19 randomized trials of overweight or obese patients (BMI > 25), a low-glycemic diet did not show weight loss when compared with an isocaloric control diet (mean difference −0.32 kg; 95% confidence interval [CI] −0.86 kg, 0.23 kg).29 On the other hand, the effect on glycemic control is more pronounced. Another meta-analysis that included 11 studies of patients with DM who followed a low-glycemic diet for less than 3 months to over 6 months showed that those who followed a low-glycemic diet had a significant reduction of HbA1c (6 studies had HbA1c as the primary outcome, HbA1c weighted mean difference −0.5%; 95% CI, −0.8 to −0.2; P = .001). Five studies reported on parameters related to insulin action, and 1 showed increased sensitivity measured by euglycemic-hyperinsulinemic clamp in a low-glycemic diet (glucose disposal 7.0 ± 1.3 mg glucose/kg/min) vs a high-glycemic diet (4.8 mg glucose/kg/min ± 0.9, P < .001).28
There are no large trials of cardiovascular mortality or morbidity of low-glycemic diets, but some studies have included cardiovascular parameters. A randomized study of 210 patients with type 2 DM evaluated cardiovascular risk factors after 6 months of a low-glycemic diet and high-glycemic diet. The low-glycemic diet group had an increase in HDL-C compared with the high-glycemic diet group (1.7 mg/dL; 95% CI, 0.8 to 2.6 mg/dL vs −0.2 mg/dL; 95% CI, −0.9 to –0.5 mg/dL, P = .005).30 Another crossover study of 20 patients with type 2 DM on a low-glycemic diet over 2 consecutive 24-day periods revealed a 53% reduction of the activity of plasminogen activator inhibitor-1, a thrombolytic factor that increases plaque formation.31 Most studies were of short duration; thus, weight regain was not clearly established.
The GI of low-GI foods differs based on the cooking method, presence of other macronutrients, and metabolic variations among individuals. Low-glycemic diets can reduce the intake of important dietary nutrients. The ADA notes that low-glycemic diets may provide only modest benefit in controlling postprandial hyperglycemia.32
LOW-FAT DIET

Different types of fats have different effects on metabolism. LDL-C is mostly derived from saturated fats.34 Consuming 2% of energy intake from trans fat substantially increases the risk of coronary heart disease.35 Though the ideal total amount of fat for people with diabetes is unknown, the amount consumed still has important consequences, especially since patients with type 2 DM are at risk for coronary artery disease. The Institute of Medicine states that fat intake of 20% to 35% of energy is acceptable for all adults.16
Low-fat diets along with reduced caloric intake induce weight loss, but this cannot compete with the rapid weight loss that patients experience with the low-carbohydrate diet. This was shown in multiple studies including a meta-analysis of 5 randomized clinical trials of 447 patients with obesity who lost less weight in the low-fat diet group compared with low-carbohydrate diet group (weighted mean difference −3.3 kg; 95% CI, −5.3 to −1.4 kg) at 6 months.36 Interestingly, the difference between diets was nonexistent after 12 months (weighted mean difference −1.0 kg; 95% CI, −3.5 to 1.5 kg), which may be due to weight regain in the low-carbohydrate diet group.36
Foster et al37 studied 307 participants with obesity assigned to a low-fat or low-carbohydrate diet. Both groups lost 11% in 1 year, and with regain, lost 7% from baseline at 2 years. There was no statistically significant difference between groups during the 2 years, but there was a trend for more weight loss in the low-carbohydrate group in the first 3 months (P = .019).37
The low-fat diet has no to minimal improvement in glycemic control in patients with diabetes and obesity, regardless of the weight loss achieved. However, a low-fat diet is associated with some beneficial effects on cardiovascular risks. Nordmann et al36 found no difference in blood pressure between low-carbohydrate and low-fat diets. The low-fat diet was associated with lower total cholesterol and LDL-C levels (weighted mean difference 5.4 mg/dL [0.14 mmol/L]; 95% CI, 1.2 mg/dL to 10.1 mg/dL [0.03–0.26 mmol/L]).36 Triglyceride and HDL-C levels were more favorably changed in the low-carbohydrate diet (for triglycerides, weighted mean difference −22.1 mg/dL [−0.25 mmol/L]; 95% CI, −38.1 to −5.3 mg/dL [−0.43 to −0.06 mmol/L]; and for HDL-C, weighted mean difference 4.6 mg/dL [0.12 mmol/L]; 95% CI, 1.5 mg/dL to 8.1 mg/dL [0.04–0.21 mmol/L]).36
VERY-LOW-CALORIE DIET

Saris et al38 reported results from 8 randomized clinical trials ranging from 10 to 32 patients with obesity comparing very-low-calorie diets with a low-calorie diet of 800 to 1,200 calories a day. Over the first 4 to 6 weeks, weight loss was between 1.4 kg and 2.5 kg per week and was higher with the very-low-calorie diet when compared with the low-calorie diet though not statistically significant. Interestingly, when followed for 16 to 26 weeks, the difference in weight loss was again not statistically significant with no trend for more weight loss in the very-low-calorie diet group. Another meta-analysis looking at 6 randomized clinical trials in patients with obesity showed that weight loss with very-low-calorie diets was statistically significant when compared with low-calorie diets (16.1% ± 1.6% vs 9.7% ± 2.4% weight loss over a period of 12.7 ± 6.4 weeks).39
In general, it is believed that when individuals lose a large amount of weight in a short period, a larger weight regain will occur, resulting in a higher weight than before the initial loss. This was refuted by Tsai et al,39 who found that long-term data (1 to 5 years) showed the percentage of weight regained is higher with a very-low-calorie diet (62%) vs a low-calorie diet (41%) but the overall weight lost remains superior with the very-low-calorie diet, though not statistically significant (6.3% ± 3.2% and 5.0% ± 4.0% loss of initial weight, respectively).
Toubro et al40 looked at 43 obese individuals who followed the very-low-calorie diet for 8 weeks compared with 17 weeks of a conventional diet (1,200 kcal/day) followed by a year of unrestricted calories, low-fat, high-carbohydrate diet or fixed calorie group (1,800 kcal/day). The very-low-calorie diet group lost weight at a more rapid rate, but the rate had no effect on weight maintenance after 6 or 12 months. Interestingly, the group that followed the “unrestricted calories, low-fat, high-carbohydrate diet” for a year maintained 13.2 kg (8.1 kg to 18.3 kg) of the initial 13.8 kg (11.8 kg to 15.7 kg) weight loss, while the fixed-calorie group maintained less weight loss (9.7 kg [6.1 kg to 13.3 kg]). Saris38 concluded that the rapid weight loss by very-low-calorie diet has better long-term results when followed up with a program that includes nutritional education, behavioral therapy, and increased physical activity.
Very-low-calorie diets achieve glycemic control by reducing hepatic glucose output, increasing insulin action in the liver and peripheral tissues, and enhancing insulin secretion. These benefits occur soon after starting the diet, which suggests that caloric restriction plays a critical role. A study at the University of Michigan showed that the use of very-low-calorie diets in addition to moderate-intensity exercise resulted in a reduction of HbA1c from 7.4% (± 1.3%) to 6.5% (± 1.2%) in 66 patients with established type 2 DM.41 HbA1c of less than 7% occurred in 76% of patients with established diabetes and 100% of patients with newly diagnosed diabetes.41 Improvement in HbA1c over 12 weeks was associated with higher baseline HbA1c and greater reduction in BMI.41
Long-term cardiovascular risk reduction of very-low-calorie diets is small. One study showed that serum total cholesterol decreased at 2 weeks but did not differ at 3 months from baseline.42 A large reduction was observed in serum triglycerides at 3 months (4.57 mmol/L ± 1.0 mmol/L vs 2.18 mmol/L ± .26 mmol/L, P = .012) while HDL-C increased (0.96 mmol/L ± .06 mmol/L vs 1.11 mmol/L ± .05 mmol/L, P = .009).42 Blood pressure was also reduced in both systolic pressure (152 mm Hg ± 6 mm Hg vs 133 mm Hg ± 3 mm Hg, P = .004) and diastolic pressure (92 mm Hg ± 3 mm Hg vs 81 mm Hg ± 3 mm Hg, P = .007).42
Challenges with this diet include significant weight regain and safety concerns for patients with obesity and type 2 DM, especially those who are taking insulin, since this diet will lead to significant rapid lowering of insulin levels.38 Finally, very-low-calorie diets require a multidisciplinary approach with frequent health professional visits.
MEDITERRANEAN DIET

This diet also has a positive impact on glycemic control and has been shown to reduce the incidence of diabetes. Estruch et al45 conducted a randomized controlled trial on 772 adults at high risk for cardiovascular disease, of which 421 had type 2 DM, assigned to Mediterranean diet supplemented either with extra-virgin olive oil or mixed nuts compared with a control group receiving advice on a low-fat diet. Their primary prevention trial, PREDIMED, looked mainly at the rate of total cardiovascular events (stroke, myocardial infarction, cardiovascular death); however, a subgroup analysis showed that the incidence of new-onset diabetes was reduced by 52% with the Mediterranean diet compared with the control group after 4 years of follow-up. Multivariate-adjusted hazard ratios of diabetes were 0.49 (0.25–0.97) and 0.48 (0.24–0.96) in the Mediterranean diet supplemented with olive oil and nuts groups, respectively, compared with the control group. Intuitively, they also showed that the higher the adherence, the lower the incidence rate.46 This occurred despite no difference in weight loss between the groups and may indicate that the components of the diet itself could have anti-inflammatory and antioxidative effects. Esposito et al47 showed that after 1 year of intervention in 215 patients with type 2 DM, HbA1c was lower in those assigned to the Mediterranean diet vs those assigned to a low-fat diet (difference: −0.6%; 95% CI, −0.9 to −0.3). Similarly, in a 12-month trial, Elhayany et al43 found a significant difference in the reduction in HbA1c in those on the Mediterranean diet compared with a low-fat diet (0.4%, P = .02).
Many studies have shown a beneficial effect of the Mediterranean diet on cardiovascular health. Estruch et al45 showed that 772 patients (143 with type 2 DM) at high risk of cardiovascular disease who followed a Mediterranean diet with nuts for 3 months had a reduced systolic blood pressure of −7.1 mm Hg (CI, −10.0 mm Hg to −4.1 mm Hg) and reduced HDL-C ratio of −0.26 (CI, −0.42 to −0.10) compared with a low-fat diet. There was also a reduction in fasting plasma glucose of −0.30 mmol/L (CI, −0.58 mmol/L to −0.01 mmol/L).45
PROTEIN-SPARING MODIFIED FAST

One of the earlier studies on protein-sparing modified fast showed that weight loss was as high as 21 kg ± 13 kg during the initial phase and 19 kg ± 13 kg during the refeeding phase.49 Weight regain is high: in the protein-sparing modified fast, most patients return to their baseline weight in 5 years.50
A study comparing 6 patients who were put on a protein-sparing modified fast diet with 6 patients who underwent gastric bypass surgery showed that the mean steady-state plasma glucose fell from 377 mg/dL to 208 mg/dL (P < .008) and mean fasting insulin values fell from 31.0 to 17.0 µU/mL (P < .004).51 There were also changes in cardiovascular risk factors: mean HDL-C values increased from 33.8 mg/dL to 40.5 mg/dL (P < .008), and factor VIII coagulant activity decreased from 194% to 140% (P < .005).51 Total cholesterol and LDL-C levels were also improved, but these changes were not always maintained at follow-up visits.52
VEGETARIAN AND VEGAN DIETS

In 2013, Mishra et al53 conducted a randomized clinical trial of employees with obesity and type 2 DM (N = 291) assigned to a low-fat vegan diet or no intervention for 18 weeks. Weight decreased in the low-fat vegan diet group compared with the control group (2.9 kg vs 0.06 kg, respectively, P < .001). Statistically significant reductions in total cholesterol (8 mg/dL vs 0.01 mg/dL, P < .01), LDL-C (8.1 mg/dL vs 0.9 mg/dL, P < .01), and HbA1c (0.6% vs 0.08%, P < .01) occurred in the intervention group compared with the control group.53
Many studies of vegetarian and vegan diets have been of short duration and used a combination of low-fat and vegetarian or vegan diets on people that were not all considered obese. Research is limited for vegan and vegetarian diets, and not enough information exists about the effects on glycemic control and cardiovascular risk. Vegan and vegetarian diets may reduce the intake of many essential nutrients. Vegans who exclude dairy products, for example, have low bone mineral density and higher risk of fractures due to inadequate intake of calcium.
HIGH-PROTEIN DIET

Parker et al54 reported a weight loss of 5.2 kg ± 1.8 kg in 12 weeks in 54 patients with obesity and type 2 DM irrespective of a diet with high or low protein content. Women on a high-protein diet lost more total fat and abdominal fat compared with women on a low-protein diet. Total lean mass decreased in all patients irrespective of diet.
Studies have shown that high-protein diets can improve glucose control. Ajala et al55 reviewed 20 clinical trials of patients with type 2 DM randomized to various diets for more than 6 months. In the trials that used a high-protein diet as an intervention, HbA1c levels decreased as much as 0.28% compared with the control diets (P < .001). A small study of 8 men with untreated type 2 DM compared a high-protein low-carbohydrate diet (nonketogenic, protein 30%, carbohydrate content 20%, fat 50%) with a control diet (protein 15%, carbohydrate 55%, fat 30%).56 The high-protein low-carbohydrate diet group had lower HbA1c levels (7.6 mg/dL ± 0.3 mg/dL vs 9.8 mg/dL ± 0.5 mg/dL) and mean 24-hour integrated serum glucose (126 mg/dL vs 198 mg/dL) compared with the control diet. Most of the studies of high-protein diets have been small and of short duration, and have used a combination of macronutrients (high protein and low carbohydrate), limiting the ability to identify the dietary component that had the most effect.
There are no studies evaluating cardiovascular outcomes, but some studies have included cardiovascular risk factors such as LDL-C levels and body fat composition. Parker et al54 showed that women on a high-protein diet lost more total fat (5.3 kg vs 2.8 kg, P = .009) and abdominal fat (1.3 kg vs 0.7 kg, P = .006) compared with a low-protein diet. Interestingly, no difference in total fat and abdominal fat was found in men. LDL-C reduction was greater in a high-protein diet compared with a low-protein diet (5.7% vs 2.7%, P < .01).54 In a review by Ajala et al,55 the high-protein diet was the only diet that did not show a rise in HDL-C levels after interventions of more than 6 months.
The ADA does not recommend high-protein diets as a method for weight loss because the long-term effects are unknown. ADA recommendations include an individualized approach based on a patient’s cardiometabolic risk and renal profiles. Protein content should be 0.8 g/kg to 1.0 g/kg of weight per day in patients with early chronic kidney disease, and 0.8 g/kg of weight per day in patients with advanced kidney disease.6
COMPARISONS AMONG DIETS
Studies comparing diets have reached varying conclusions and have been limited by inconsistent diet definitions, small sample sizes, and high participant dropout rates. A meta-analysis conducted by Ajala et al55 included 20 randomized controlled trials that lasted 6 months or more with 3,073 individuals in the analysis. Low-carbohydrate, vegetarian, vegan, low-glycemic, high-fiber, Mediterranean, and high-protein diets were compared with low-fat, high-glycemic, ADA, European Association for the Study of Diabetes, and low-protein diets as controls. The greatest weight loss occurred with the low-carbohydrate (−0.69 kg, P = .21) and Mediterranean diets (−1.84 kg, P < .001). Compared with the control diets, the greatest reductions in HbA1c were with the low-carbohydrate (−0.12%, P = .04), low-glycemic (−0.14%, P = .008), Mediterranean (−0.47%, P < .001), and high-protein diets (−0.28%, P < .001). HDL-C levels increased in all the diets except the high-protein diet.55
CONCLUSION
The optimal macronutrient intake for patients with obesity and type 2 DM is unknown. Diets with equivalent caloric intakes result in similar weight loss and glucose control regardless of the macronutrient contents. It is important that total caloric intake be appropriate for weight management and glucose control goals. The metabolic status of the patient as determined by lipid profiles, and renal and liver function is the main driver for the macronutrient composition of the diet.
Current trends favor the low-carbohydrate, low-glycemic, Mediterranean, and low-caloric intake diets, though there is no evidence that one is best for weight loss and optimal glycemic control in patients with obesity and type 2 DM. Studies are limited by varying definitions, high dropout rates, and poor adherence. In addition, for many patients, weight regain often follows successful short-term weight loss, indicative of a low durability of results with many diet interventions. Medical nutrition therapy and a multidisciplinary lifestyle approach remain essential components in managing weight and type 2 DM. The ideal diet is one that achieves the best adherence when tailored to a patient’s preferences, energy needs, and health status.
- Kramer H, Cao G, Dugas L, Luke A, Cooper R, Durazo-Arvizu R. Increasing BMI and waist circumference and prevalence of obesity among adults with type 2 diabetes: The National Health and Nutrition Examination Surveys. J Diabetes Complications 2010; 24:368–374.
- Centers for Disease Control and Prevention. Diabetes Report Card 2014. Atlanta, GA: Centers for Disease Control and Prevention, US Dept of Health and Human Services; 2015.
- American Diabetes Association. Obesity management for the treatment of type 2 diabetes. Sec. 6. In: Standards of Medical Care in Diabetes—2016. Diabetes Care 2016; 39(suppl 1):S47–S51.
- Knowler WC, Barrett-Connor E, Fowler SE; Diabetes Prevention Program Research Group. Reduction in the incidence of type 2 diabetes with lifestyle intervention or metformin. N Engl J Med 2002; 346:393–403.
- Franz MJ, Powers MA, Leontos C, et al. The evidence for medical nutrition therapy for type 1 and type 2 diabetes in adults. J Am Diet Assoc 2010; 110:1852–1889.
- American Diabetes Association. Introduction. In: Standards of Medical Care in Diabetes—2017. Diabetes Care 2017; 40(suppl 1):S1–S2.
- Defining adult overweight and obesity. Centers for Disease Control and Prevention website. https://www.cdc.gov/obesity/adult/defining.html. Updated June 16, 2016. Accessed June 26, 2017.
- Institute of Medicine. Dietary Reference Intakes for Energy, Carbohydrate, Fiber, Fat, Fatty acids, Cholesterol, Protein, and Amino Acids. Washington, DC: National Academy Press; 2002.
- American Diabetes Association. Lifestyle management. Sec. 4. In: Standards of Medical Care in Diabetes—2017. Diabetes Care 2017; 40(suppl 1):S33–S43.
- American Diabetes Association. Obesity management for treatment of type 2 diabetes. Sec. 7. In: Standards of Medical Care in Diabetes—2017. Diabetes Care 2017; 40(suppl 1):S57–S63.
- National Institutes of Health. Clinical guidelines on the identification, evaluation, and treatment of overweight and obesity in adults—the evidence report. Obes Res 1998; 6(suppl 2):51S–209S.
- Look AHEAD Research Group; Pi-Sunyer X, Blackburn G, Brancati FL, et al. Reduction in weight and cardiovascular disease risk factors in individuals with type 2 diabetes: one-year results of the look AHEAD trial. Diabetes Care 2007; 30:1374–1383.
- Look AHEAD Research Group; Gregg EW, Jakicic JM, Blackburn G, et al. Association of the magnitude of weight loss and changes in physical fitness with long-term cardiovascular disease outcomes in overweight or obese people with type 2 diabetes: a post-hoc analysis of the look AHEAD randomised clinical trial. Lancet Diabetes Endocrinol 2016; 4:913–921.
- Look AHEAD Research Group; Wadden TA, West DS, Delahanty L, et al. The Look AHEAD Study: a description of the lifestyle intervention and the evidence supporting it. Obesity (Silver Spring) 2006; 14:737–752.
- Tuomilehto J, Lindstrom J, Eriksson JG, et al; Finnish Diabetes Prevention Study Group. Prevention of type 2 diabetes mellitus by changes in lifestyle among subjects with impaired glucose tolerance. N Engl J Med 2001; 344:1343–1350.
- Institute of Medicine. Dietary Reference Intakes for Energy, Carbohydrate, Fiber, Fat, Fatty Acids, Cholesterol, Protein, and Amino Acids (Macronutrients). Washington, DC: The National Academies Press; 2005. doi:https://doi.org/10.17226/10490.
- Kirk JK, Graves DE, Craven TE, Lipkin EW, Austin M, Margolis KL. Restricted-carbohydrate diets in patients with type 2 diabetes: a meta-analysis. J Am Diet Assoc 2008; 108:91–100.
- Franz MJ, Monk A, Barry B, et al. Effectiveness of medical nutrition therapy provided by dietitians in the management of non-insulin-dependent diabetes mellitus: a randomized, controlled clinical trial. J Am Diet Assoc 1995; 95:1009–1017.
- Hu T, Mills KT, Yao L, et al. Effects of low-carbohydrate diets versus low-fat diets on metabolic risk factors: a meta-analysis of randomized controlled clinical trials. Am J Epidemiol 2012; 176(suppl 7):S44–S54.
- Bantle JP, Swanson JE, Thomas W, Laine DC. Metabolic effects of dietary sucrose in type II diabetic subjects. Diabetes Care 1993; 16:1301–1305.
- Malik VS, Popkin BM, Bray GA, Despres JP, Willett WC, Hu FB. Sugar-sweetened beverages and risk of metabolic syndrome and type 2 diabetes: a meta-analysis. Diabetes Care 2010; 33:2477–2483.
- Stanhope KL, Schwarz JM, Havel PJ. Adverse metabolic effects of dietary fructose: results from the recent epidemiological, clinical, and mechanistic studies. Curr Opin Lipidol 2013; 24:198–206.
- Nielsen JV, Jonsson E, Nilsson AK. Lasting improvement of hyperglycaemia and bodyweight: low-carbohydrate diet in type 2 diabetes. A brief report. Ups J Med Sci 2005; 110:69–73; 179–183.
- Robertson AM, Broom J, McRobbie LJ, MacLennan GS. Low carbohydrate diets in the treatment of resistant overweight patients with type 2 diabetes. Diabet Med 2002; 19(suppl 2):24 [Abstract 94].
- Samaha FF, Iqbal N, Seshadri P, et al. A low-carbohydrate as compared with a low-fat diet in severe obesity. N Engl J Med 2003; 348:2074–2081.
- Vetter ML, Iqbal N, Dalton-Bakes C, Volger S, Wadden TA. Long-term effects of low-carbohydrate versus low-fat diets in obese persons. Ann Intern Med 2010; 152:334–335.
- Daly ME, Piper J, Paisey R, et al. Efficacy of carbohydrate restriction in obese type 2 diabetes patients. Diabet Med 2006; 23(suppl 2):26–27 [Abstract 98].
- Thomas D, Elliott EJ. Low glycaemic index, or low glycaemic load, diets for diabetes mellitus. Cochrane Database Syst Rev 2009; (1):CD006296.
- Braunstein CR, Mejia SB, Stoiko E, et al. Effect of low-glycemic index/load diets on body weight: a systematic review and meta-analysis. FASEB 2016; 30:906.9.
- Jenkins DJ, Kendall CW, McKeown-Eyssen G, et al. Effect of a low-glycemic index or a high-cereal fiber diet on type 2 diabetes: a randomized trial. JAMA 2008; 300:2742–2753.
- Järvi AE, Karlstrom BE, Granfeldt YE, Bjorck IE, Asp NG, Vessby BO. Improved glycaemic control and lipid profile and normalized fibrinolytic activity on a low-glycaemic index diet in type 2 diabetes patients. Diabetes Care 1999; 22:10–18.
- Evert AB, Boucher JL, Cypress M, et al. Nutrition therapy recommendations for the management of adults with diabetes. Diabetes Care 2014; 37(suppl 1):S120–S143.
- Savage DB, Petersen KF, Shulman GI. Disordered lipid metabolism and the pathogenesis of insulin resistance. Physiol Rev 2007; 87:507–520.
- Risérus U. Fatty acids and insulin sensitivity. Curr Opin Clin Nutr Metab Care 2008; 11:100–105.
- Oomen CM, Ocke MC, Feskens EJ, van Erp-Baart MA, Kok FJ, Kromhout D. Association between trans fatty acid intake and 10-year risk of coronary heart disease in the Zutphen Elderly Study: a prospective population-based study. Lancet 2001; 357:746–751.
- Nordmann AJ, Nordmann A, Briel M, et al. Effects of low-carbohydrate vs low-fat diets on weight loss and cardiovascular risk factors: a meta-analysis of randomized controlled trials. Arch Intern Med 2006; 166:285–293.
- Foster GD, Wyatt HR, Hill JO, et al. Weight and metabolic outcomes after 2 years on a low-carbohydrate versus low-fat diet: a randomized trial. Ann Intern Med 2010; 153:147–157.
- Saris WH. Very-low-calorie diets and sustained weight loss. Obes Res 2001; 9(suppl 4):295S–301S.
- Tsai A, Wadden TA. The evolution of very-low-calorie diets: an update and meta-analysis. Obesity 2006; 14:1283–1293.
- Toubro S, Astrup A. Randomised comparison of diets for maintaining obese subjects’ weight after major weight loss: ad lib, low fat, high carbohydrate diet v fixed energy intake. BMJ 1997; 314:29–34.
- Rothberg AE, McEwen LN, Kraftson AT, Fowler CE, Herman WH. Very-low-energy diet for type 2 diabetes: an underutilized therapy? J Diabetes Complications 2014; 28:506–510.
- Uusitupa MI, Laakso M, Sarlund H, Majander H, Takala J, Penttilä I. Effects of a very-low-calorie diet on metabolic control and cardiovascular risk factors in the treatment of obese non-insulin-dependent diabetics. Am J Clin Nutr 1990; 51:768–773.
- Elhayany A, Lustman A, Abel R, Attal-Singer J, Vinker S. A low carbohydrate Mediterranean diet improves cardiovascular risk factors and diabetes control among overweight patients with type 2 diabetes mellitus: a 1-year prospective randomized intervention study. Diabetes Obes Metab 2010; 12:204–209.
- Mancini JG, Filion KB, Atallah R, Eisenberg MJ. Systematic review of the Mediterranean diet for long-term weight loss. Am J Med 2016; 129:407–415.e4.
- Estruch R, Martinez-González MA, Corella D, et al; PREDIMED Study Investigators. Effects of a Mediterranean-style diet on cardiovascular risk factors: a randomized trial. Ann Intern Med 2006; 145:1–11.
- Salas-Salvadó J, Bulló M, Babio N, et al; PREDIMED Study Investigators. Reduction in the incidence of type 2 diabetes with the Mediterranean diet: results of the PREDIMED-Reus nutrition intervention randomized trial. Diabetes Care 2011; 34:14–19.
- Esposito K, Maiorino MI, Ciotola M, et al. Effects of a Mediterranean-style diet on the need for antihyperglycemic drug therapy in patients with newly diagnosed type 2 diabetes: a randomized trial. Ann Intern Med 2009; 151:306–314.
- Chang J, Kashyap SR. The protein-sparing modified fast for obese patients with type 2 diabetes: what to expect. Cleve Clin J Med 2014; 81:557–565.
- Palgi A, Read JL, Greenberg I, Hoefer MA, Bistrian BR, Blackburn GL. Multidisciplinary treatment of obesity with a protein-sparing modified fast: results in 668 outpatients. Am J Public Health 1985; 75:1190–1194.
- Paisey RB, Frost J, Harvey P, et al. Five year results of a prospective very low calorie diet or conventional weight loss programme in type 2 diabetes. J Hum Nutr Diet 2002; 15:121–127.
- Hughes TA, Gwynne JT, Switzer BR, Herbst C, White G. Effects of caloric restriction and weight loss on glycemic control, insulin release and resistance, and atherosclerotic risk in obese patients with type II diabetes mellitus. Am J Med 1984; 77:7–17.
- Li Z, Tseng CH, Li Q, Deng ML, Wang M, Heber D. Clinical efficacy of a medically supervised outpatient high-protein, low-calorie diet program is equivalent in prediabetic, diabetic and normoglycemic obese patients. Nutr Diabetes 2014; 4:e105.
- Mishra S, Xu J, Agarwal U, Gonzales J, Levin S, Barnard ND. A multicenter randomized controlled trial of a plant-based nutrition program to reduce body weight and cardiovascular risk in the corporate setting: the GEICO study. Eur J Clin Nutr 2013; 67:718–724.
- Parker B, Noakes M, Luscombe N, Clifton P. Effect of a high-protein, high-monounsaturated fat weight loss diet on glycemic control and lipid levels in type 2 diabetes. Diabetes Care 2002; 25:425–430.
- Ajala O, English P, Pinkney J. Systematic review and meta-analysis of different dietary approaches to the management of type 2 diabetes. Am J Clin Nutr 2013; 97:505–516.
- Gannon MC, Nuttall FQ. Effect of a high-protein, low-carbohydrate diet on blood glucose control in people with type 2 diabetes. Diabetes 2004; 53:2375–2382.
According to National Health and Nutrition Examination Survey data, more than one-third of adults in the United States are obese and more than two-thirds of adults with type 2 diabetes mellitus (DM) are obese.1 In light of overall increased life expectancy, the Centers for Disease Control and Prevention estimates that adults in the United States have a 40% lifetime risk of developing diabetes, as diabetes and obesity remain at epidemic levels.2
Weight loss in individuals who are overweight or obese is effective in preventing type 2 DM and improving management of the disease.3,4 Dietary changes play a central role in achieving weight loss, as do other important lifestyle interventions such as exercise, behavior modification, and pharmacotherapy. Achieving glycemic goals with diet alone is difficult, and for patients with DM who are also obese, it may be even more challenging.
Medical nutrition therapy, a term coined by the American Dietetic Association, describes an approach to treating medical conditions using specific diets. As developed and monitored by a physician and registered dietitian, diet can result in beneficial outcomes and is a front-line approach for patients with noninsulin-dependent diabetes.5 Medical nutrition therapy for patients with type 2 DM is most effective when used within 1 year of diagnosis and is associated with a 0.5% to 2% decrease in hemoglobin A1c (HbA1c) levels.6 This article reviews the role of diet in managing patients with both type 2 DM and obesity. Several diets are presented including what is known about their effect on weight loss, glycemic control, and cardiovascular risk prevention in patients with diabetes and obesity.
WEIGHT LOSS AND DIET FOR PATIENTS WITH OBESITY AND DIABETES
A person is overweight or obese if he or she weighs more than the ideal weight for their height as calculated by the body mass index (BMI; weight in kg/height in meters squared). A BMI of 25 to 30 is overweight and a BMI of 30 or greater is obese.7 The recommended daily caloric intake for adults is based on sex, age, and daily activity level and ranges from 1,600 to 2,000 calories per day for women and 2,000 to 2,600 calories per day for men. The lower end of the range is for sedentary adults, and the higher end is for active adults (walking 1.5 to 3 miles per day at 3 to 4 miles per hour, in addition to independent living).8
According to the American Diabetes Association (ADA), weight loss requires reducing dietary intake by 500 to 750 calories per day, or roughly 1,200 to 1,500 kcal/day for women and 1,500 to 1,800 kcal/day for men.3 For patients with obesity and type 2 DM, sustained, modest weight loss of 5% of initial body weight improves glycemic control and reduces the need for diabetes medications.9 Weight loss of greater than 5% body weight also improves lipid and blood pressure status in patients with obesity and diabetes, though ideally, patients are encouraged to achieve weight reduction of 7% or greater.10
Evidence of benefits from lifestyle and dietary modifications
The fact that patients with obesity and type 2 DM have increased risk of cardiovascular morbidity and mortality is well established.11 Multiple studies considered the effects of weight loss on cardiovascular morbidity and mortality. Our article focuses on dietary modifications, though most large, multicenter trials used both diet and increased physical activity to achieve weight loss. It is difficult to determine if diet or physical activity had the most effect on outcomes; however, results show that weight loss from dietary and other lifestyle interventions leads to change in outcomes.
Look AHEAD (Action for Health in Diabetes) trial. This large, multicenter, randomized controlled trial evaluated the effect of weight loss on cardiovascular morbidity and mortality in overweight or obese adults with type 2 DM. The 5,145 participants were assigned either to a long-term weight reduction intensive lifestyle intervention of diet, physical activity, and behavior modification or to usual care of support and education. At 1 year, the lifestyle intervention group had greater weight loss, improved fitness, decreased number of diabetes medications, decreased blood pressure, and improved biomarkers of glucose and lipid control compared with the usual care group.12 No significant reductions in cardiovascular morbidity and mortality were found, though an observational post hoc analysis of the Look AHEAD data suggested an association between the magnitude of weight loss and the incidence of cardiovascular disease.13
The diet portion of the intensive lifestyle intervention consisted of self-selected, conventional foods while recording dietary intake during week 1. In week 2, patients weighing less than 114 kg (250 lbs) restricted their intake to 1,200 to 1,500 kcal/day, and patients weighing 114 kg or more restricted their intake to 1,500 to 1,800 kcal/day. Fewer than 30% of calories were from fat, with less than 10% from saturated fat. During week 3 through week 9, meal replacement options and conventional foods were used to reach caloric goals. Participants then decreased the use of meal replacement and increased the use of conventional foods during week 20 through week 22.14
The mean weight loss for participants in the intensive lifestyle intervention group was 8.6% compared with 0.7% in the support and education group (P < .001). HbA1c decreased by 0.7% in the intervention group compared with 0.1% the support and education group (P < .001).12
Finnish Diabetes Prevention Study. This study evaluated lifestyle changes in diet and physical activity in the prevention of type 2 DM in participants with impaired glucose intolerance. Participants (N = 552) were randomly assigned to the control group or the intervention group where detailed instruction was provided to achieve weight loss of greater than 5%.15 The dietary goals included fewer than 30% of total calories from fat, with fewer than 10% from saturated fat, increased fiber consumption (15 g per 1,000 kcal), and physical activity of 30 minutes daily.15 During the trial (mean duration of follow-up 3.2 years), the risk of type 2 DM was reduced by 58% in the intervention group compared with the control group.15
Diabetes Prevention Program Research Group. A landmark study by the Diabetes Prevention Program Research Group randomized 3,234 participates with elevated plasma glucose levels to placebo, metformin, and lifestyle intervention arms.4 Those in the lifestyle intervention arm were educated about ways to achieve and maintain a 7% or greater reduction in body weight using a low-calorie, low-fat diet and moderate physical activity. Results based on a mean follow-up of 2.8 years found a 58% reduction in the incidence of diabetes for those in the lifestyle intervention arm.4
DIETS AND THEIR EFFECTS ON OBESITY, DIABETES, AND CARDIOVASCULAR RISK
When patients seek consultation about diet, they frequently ask about specific types of popular diets, not the very controlled diets employed in research studies. Dietary preferences are personal, so patients may have researched a particular diet or feel that they will be more adherent if only 1 or 2 components of their meals are changed. There is no single optimal dietary strategy for patients with both obesity and type 2 DM. In general, diets are categorized based on the 3 basic macronutrients: carbohydrate, fat, and protein. We will review several popular diets, delineating content, effects on weight loss, glycemic control, and cardiovascular factors.
LOW-CARBOHYDRATE DIET
In practice, the median intake of carbohydrates for US adults is much higher, at 220 to 330 g per day for men and 180 to 230 g per day for women.16 The ADA recommends that all Americans consume fewer refined carbohydrates and added sugars in favor of whole grains, legumes, vegetables, and fruit.18
Low-carbohydrate diets focus on reducing carbohydrate intake with the thought that fewer carbohydrates are better. However, the definition of a low-carbohydrate diet varies. In most studies, carbohydrate intake was limited to less than 20 g to 120 g daily or fewer than 4% to 45% of the total calories consumed.17,19 Intake of fat and total calories is unlimited, though unsaturated fats are preferred over saturated or trans fats.
Limiting the intake of disaccharide sugar in the form of sucrose and high-fructose corn syrup is endorsed because of concerns that these sugars are rapidly digested, absorbed, and fully metabolized. However, several randomized trials showed that substituting sucrose for equal amounts of other types of carbohydrates in individuals with type 2 DM showed no difference in glycemic response.20 The resulting conclusion is that the postprandial glycemic response is mainly driven by the amount rather than the type of carbohydrates. The consumption of sugar-sweetened beverages is associated with obesity and an increased risk of diabetes, attributed to the high caloric intake and decreased insulin sensitivity associated with these beverages.21
Of the 2 monosaccharides, glucose and fructose, that make up sucrose, fructose is metabolized in the liver. The rapid metabolism of fructose may lead to alterations in lipid metabolism and affect insulin sensitivity.22 While the ADA does not advise against consuming fructose, it does advise limiting its use due to the caloric density of many foods containing fructose.
Multiple studies have investigated the effect of a low-carbohydrate diet on weight loss, glucose control, and cardiovascular risk, but comparing the results is difficult due to the varying definitions of a low-carbohydrate diet.
Low-carbohydrate diets are associated with rapid weight loss. A 6-month study of 31 patients with obesity and type 2 DM found a mean weight change of −11.4 kg (± 4 kg) in the low-carbohydrate group compared with −1.8 kg (± 3.8 kg) in the high-carbohydrate control group, a loss maintained up to 1 year.23 Another study of 88 patients with type 2 DM who consumed less than 40 g/day of carbohydrate had a weight loss of 7.2 kg over 12 months.24 Samaha et al25 compared a low-carbohydrate diet with a low-fat diet in 132 participants with obesity (mean BMI 43), of which 39% had diabetes and 43% had metabolic syndrome. Those in the low-carbohydrate diet group had significantly more weight loss over a period of 6 months (−5.8 kg mean, ± 8.6 kg standard deviation [SD] vs −1.9 kg mean ± 4.2 kg SD, P = .002). However, at 1 year, there was no significant difference in weight loss between groups. At 36 months, weight regain was 2.2 kg (SD 12.3 kg) less than baseline in the low-carbohydrate group compared with 4.3 kg (SD 12.2 kg) less than baseline in the low-fat group
(P = .071).25,26 On the other hand, a meta-analysis of 23 randomized trials involving 2,788 participants found no difference in weight loss at 6 months between those on a low-carbohydrate diet and those on a low-fat diet.19
With respect to glucose control, low-carbohydrate diets have been associated with a 1.4% (SD ± 1.1%)decrease in HbA1c during a 6-month period in 31 patients with obesity and type 2 DM.23 Another 6-month study of 206 patients with obesity and diabetes comparing a low-carbohydrate diet with a low-calorie diet found no significant difference in HbA1c (−0.48% vs −0.24%, respectively) and a weight loss of 1.34 kg vs 3.77 kg, respectively (P < .001).27 The change in glycemic control did not persist over time, perhaps due to the weight regain associated with this diet. A meta-analysis concluded that HbA1c was reduced more in patients with type 2 DM randomized to a lower-carbohydrate diet compared with a higher-carbohydrate diet (mean change from baseline 0% to −2.2%).17
No studies of the effects of a low-carbohydrate diet on overall cardiovascular morbidity or mortality exist. However, Kirk et al17 reported results of a low-carbohydrate diet on cardiovascular risk factors such as lipid profiles and showed a significant reduction in triglyceride levels but no effect on total cholesterol, high-density lipoprotein cholesterol (HDL-C), or low-density lipoprotein cholesterol (LDL-C) levels.
The ADA has reported that low-carbohydrate diets may be effective in the management of type 2 DM in the short term. Caution is warranted because they could eliminate important sources of energy, fiber, vitamins, and minerals. It is also important to monitor lipid profile, renal function, and protein intake in certain patients, especially those with renal dysfunction.6
LOW-GLYCEMIC DIET
Various factors affect the GI including the type of carbohydrate, fat content, protein content, and acidity of the food consumed, as well as the rate of intestinal reaction to the food. The faster the digestion of a food, the higher the GI. High-GI foods (> 70), such as those highly processed and with high starch content, produce higher peak glucose levels when compared with low-GI foods (< 55). Low-GI foods include lentils, beans, oats, and nonstarchy vegetables.
Low-GI foods curb the large and rapid rise of blood glucose, insulin response, and glucagon inhibition that occur with high-GI foods. Many low-GI foods have high amounts of fiber, which prolongs distention of the gastrointestinal tract, increases secretion of cholecystokinin and incretins, and extends statiety.28
In a meta-analysis of 19 randomized trials of overweight or obese patients (BMI > 25), a low-glycemic diet did not show weight loss when compared with an isocaloric control diet (mean difference −0.32 kg; 95% confidence interval [CI] −0.86 kg, 0.23 kg).29 On the other hand, the effect on glycemic control is more pronounced. Another meta-analysis that included 11 studies of patients with DM who followed a low-glycemic diet for less than 3 months to over 6 months showed that those who followed a low-glycemic diet had a significant reduction of HbA1c (6 studies had HbA1c as the primary outcome, HbA1c weighted mean difference −0.5%; 95% CI, −0.8 to −0.2; P = .001). Five studies reported on parameters related to insulin action, and 1 showed increased sensitivity measured by euglycemic-hyperinsulinemic clamp in a low-glycemic diet (glucose disposal 7.0 ± 1.3 mg glucose/kg/min) vs a high-glycemic diet (4.8 mg glucose/kg/min ± 0.9, P < .001).28
There are no large trials of cardiovascular mortality or morbidity of low-glycemic diets, but some studies have included cardiovascular parameters. A randomized study of 210 patients with type 2 DM evaluated cardiovascular risk factors after 6 months of a low-glycemic diet and high-glycemic diet. The low-glycemic diet group had an increase in HDL-C compared with the high-glycemic diet group (1.7 mg/dL; 95% CI, 0.8 to 2.6 mg/dL vs −0.2 mg/dL; 95% CI, −0.9 to –0.5 mg/dL, P = .005).30 Another crossover study of 20 patients with type 2 DM on a low-glycemic diet over 2 consecutive 24-day periods revealed a 53% reduction of the activity of plasminogen activator inhibitor-1, a thrombolytic factor that increases plaque formation.31 Most studies were of short duration; thus, weight regain was not clearly established.
The GI of low-GI foods differs based on the cooking method, presence of other macronutrients, and metabolic variations among individuals. Low-glycemic diets can reduce the intake of important dietary nutrients. The ADA notes that low-glycemic diets may provide only modest benefit in controlling postprandial hyperglycemia.32
LOW-FAT DIET
Different types of fats have different effects on metabolism. LDL-C is mostly derived from saturated fats.34 Consuming 2% of energy intake from trans fat substantially increases the risk of coronary heart disease.35 Though the ideal total amount of fat for people with diabetes is unknown, the amount consumed still has important consequences, especially since patients with type 2 DM are at risk for coronary artery disease. The Institute of Medicine states that fat intake of 20% to 35% of energy is acceptable for all adults.16
Low-fat diets along with reduced caloric intake induce weight loss, but this cannot compete with the rapid weight loss that patients experience with the low-carbohydrate diet. This was shown in multiple studies including a meta-analysis of 5 randomized clinical trials of 447 patients with obesity who lost less weight in the low-fat diet group compared with low-carbohydrate diet group (weighted mean difference −3.3 kg; 95% CI, −5.3 to −1.4 kg) at 6 months.36 Interestingly, the difference between diets was nonexistent after 12 months (weighted mean difference −1.0 kg; 95% CI, −3.5 to 1.5 kg), which may be due to weight regain in the low-carbohydrate diet group.36
Foster et al37 studied 307 participants with obesity assigned to a low-fat or low-carbohydrate diet. Both groups lost 11% in 1 year, and with regain, lost 7% from baseline at 2 years. There was no statistically significant difference between groups during the 2 years, but there was a trend for more weight loss in the low-carbohydrate group in the first 3 months (P = .019).37
The low-fat diet has no to minimal improvement in glycemic control in patients with diabetes and obesity, regardless of the weight loss achieved. However, a low-fat diet is associated with some beneficial effects on cardiovascular risks. Nordmann et al36 found no difference in blood pressure between low-carbohydrate and low-fat diets. The low-fat diet was associated with lower total cholesterol and LDL-C levels (weighted mean difference 5.4 mg/dL [0.14 mmol/L]; 95% CI, 1.2 mg/dL to 10.1 mg/dL [0.03–0.26 mmol/L]).36 Triglyceride and HDL-C levels were more favorably changed in the low-carbohydrate diet (for triglycerides, weighted mean difference −22.1 mg/dL [−0.25 mmol/L]; 95% CI, −38.1 to −5.3 mg/dL [−0.43 to −0.06 mmol/L]; and for HDL-C, weighted mean difference 4.6 mg/dL [0.12 mmol/L]; 95% CI, 1.5 mg/dL to 8.1 mg/dL [0.04–0.21 mmol/L]).36
VERY-LOW-CALORIE DIET
Saris et al38 reported results from 8 randomized clinical trials ranging from 10 to 32 patients with obesity comparing very-low-calorie diets with a low-calorie diet of 800 to 1,200 calories a day. Over the first 4 to 6 weeks, weight loss was between 1.4 kg and 2.5 kg per week and was higher with the very-low-calorie diet when compared with the low-calorie diet though not statistically significant. Interestingly, when followed for 16 to 26 weeks, the difference in weight loss was again not statistically significant with no trend for more weight loss in the very-low-calorie diet group. Another meta-analysis looking at 6 randomized clinical trials in patients with obesity showed that weight loss with very-low-calorie diets was statistically significant when compared with low-calorie diets (16.1% ± 1.6% vs 9.7% ± 2.4% weight loss over a period of 12.7 ± 6.4 weeks).39
In general, it is believed that when individuals lose a large amount of weight in a short period, a larger weight regain will occur, resulting in a higher weight than before the initial loss. This was refuted by Tsai et al,39 who found that long-term data (1 to 5 years) showed the percentage of weight regained is higher with a very-low-calorie diet (62%) vs a low-calorie diet (41%) but the overall weight lost remains superior with the very-low-calorie diet, though not statistically significant (6.3% ± 3.2% and 5.0% ± 4.0% loss of initial weight, respectively).
Toubro et al40 looked at 43 obese individuals who followed the very-low-calorie diet for 8 weeks compared with 17 weeks of a conventional diet (1,200 kcal/day) followed by a year of unrestricted calories, low-fat, high-carbohydrate diet or fixed calorie group (1,800 kcal/day). The very-low-calorie diet group lost weight at a more rapid rate, but the rate had no effect on weight maintenance after 6 or 12 months. Interestingly, the group that followed the “unrestricted calories, low-fat, high-carbohydrate diet” for a year maintained 13.2 kg (8.1 kg to 18.3 kg) of the initial 13.8 kg (11.8 kg to 15.7 kg) weight loss, while the fixed-calorie group maintained less weight loss (9.7 kg [6.1 kg to 13.3 kg]). Saris38 concluded that the rapid weight loss by very-low-calorie diet has better long-term results when followed up with a program that includes nutritional education, behavioral therapy, and increased physical activity.
Very-low-calorie diets achieve glycemic control by reducing hepatic glucose output, increasing insulin action in the liver and peripheral tissues, and enhancing insulin secretion. These benefits occur soon after starting the diet, which suggests that caloric restriction plays a critical role. A study at the University of Michigan showed that the use of very-low-calorie diets in addition to moderate-intensity exercise resulted in a reduction of HbA1c from 7.4% (± 1.3%) to 6.5% (± 1.2%) in 66 patients with established type 2 DM.41 HbA1c of less than 7% occurred in 76% of patients with established diabetes and 100% of patients with newly diagnosed diabetes.41 Improvement in HbA1c over 12 weeks was associated with higher baseline HbA1c and greater reduction in BMI.41
Long-term cardiovascular risk reduction of very-low-calorie diets is small. One study showed that serum total cholesterol decreased at 2 weeks but did not differ at 3 months from baseline.42 A large reduction was observed in serum triglycerides at 3 months (4.57 mmol/L ± 1.0 mmol/L vs 2.18 mmol/L ± .26 mmol/L, P = .012) while HDL-C increased (0.96 mmol/L ± .06 mmol/L vs 1.11 mmol/L ± .05 mmol/L, P = .009).42 Blood pressure was also reduced in both systolic pressure (152 mm Hg ± 6 mm Hg vs 133 mm Hg ± 3 mm Hg, P = .004) and diastolic pressure (92 mm Hg ± 3 mm Hg vs 81 mm Hg ± 3 mm Hg, P = .007).42
Challenges with this diet include significant weight regain and safety concerns for patients with obesity and type 2 DM, especially those who are taking insulin, since this diet will lead to significant rapid lowering of insulin levels.38 Finally, very-low-calorie diets require a multidisciplinary approach with frequent health professional visits.
MEDITERRANEAN DIET
This diet also has a positive impact on glycemic control and has been shown to reduce the incidence of diabetes. Estruch et al45 conducted a randomized controlled trial on 772 adults at high risk for cardiovascular disease, of which 421 had type 2 DM, assigned to Mediterranean diet supplemented either with extra-virgin olive oil or mixed nuts compared with a control group receiving advice on a low-fat diet. Their primary prevention trial, PREDIMED, looked mainly at the rate of total cardiovascular events (stroke, myocardial infarction, cardiovascular death); however, a subgroup analysis showed that the incidence of new-onset diabetes was reduced by 52% with the Mediterranean diet compared with the control group after 4 years of follow-up. Multivariate-adjusted hazard ratios of diabetes were 0.49 (0.25–0.97) and 0.48 (0.24–0.96) in the Mediterranean diet supplemented with olive oil and nuts groups, respectively, compared with the control group. Intuitively, they also showed that the higher the adherence, the lower the incidence rate.46 This occurred despite no difference in weight loss between the groups and may indicate that the components of the diet itself could have anti-inflammatory and antioxidative effects. Esposito et al47 showed that after 1 year of intervention in 215 patients with type 2 DM, HbA1c was lower in those assigned to the Mediterranean diet vs those assigned to a low-fat diet (difference: −0.6%; 95% CI, −0.9 to −0.3). Similarly, in a 12-month trial, Elhayany et al43 found a significant difference in the reduction in HbA1c in those on the Mediterranean diet compared with a low-fat diet (0.4%, P = .02).
Many studies have shown a beneficial effect of the Mediterranean diet on cardiovascular health. Estruch et al45 showed that 772 patients (143 with type 2 DM) at high risk of cardiovascular disease who followed a Mediterranean diet with nuts for 3 months had a reduced systolic blood pressure of −7.1 mm Hg (CI, −10.0 mm Hg to −4.1 mm Hg) and reduced HDL-C ratio of −0.26 (CI, −0.42 to −0.10) compared with a low-fat diet. There was also a reduction in fasting plasma glucose of −0.30 mmol/L (CI, −0.58 mmol/L to −0.01 mmol/L).45
PROTEIN-SPARING MODIFIED FAST
One of the earlier studies on protein-sparing modified fast showed that weight loss was as high as 21 kg ± 13 kg during the initial phase and 19 kg ± 13 kg during the refeeding phase.49 Weight regain is high: in the protein-sparing modified fast, most patients return to their baseline weight in 5 years.50
A study comparing 6 patients who were put on a protein-sparing modified fast diet with 6 patients who underwent gastric bypass surgery showed that the mean steady-state plasma glucose fell from 377 mg/dL to 208 mg/dL (P < .008) and mean fasting insulin values fell from 31.0 to 17.0 µU/mL (P < .004).51 There were also changes in cardiovascular risk factors: mean HDL-C values increased from 33.8 mg/dL to 40.5 mg/dL (P < .008), and factor VIII coagulant activity decreased from 194% to 140% (P < .005).51 Total cholesterol and LDL-C levels were also improved, but these changes were not always maintained at follow-up visits.52
VEGETARIAN AND VEGAN DIETS
In 2013, Mishra et al53 conducted a randomized clinical trial of employees with obesity and type 2 DM (N = 291) assigned to a low-fat vegan diet or no intervention for 18 weeks. Weight decreased in the low-fat vegan diet group compared with the control group (2.9 kg vs 0.06 kg, respectively, P < .001). Statistically significant reductions in total cholesterol (8 mg/dL vs 0.01 mg/dL, P < .01), LDL-C (8.1 mg/dL vs 0.9 mg/dL, P < .01), and HbA1c (0.6% vs 0.08%, P < .01) occurred in the intervention group compared with the control group.53
Many studies of vegetarian and vegan diets have been of short duration and used a combination of low-fat and vegetarian or vegan diets on people that were not all considered obese. Research is limited for vegan and vegetarian diets, and not enough information exists about the effects on glycemic control and cardiovascular risk. Vegan and vegetarian diets may reduce the intake of many essential nutrients. Vegans who exclude dairy products, for example, have low bone mineral density and higher risk of fractures due to inadequate intake of calcium.
HIGH-PROTEIN DIET
Parker et al54 reported a weight loss of 5.2 kg ± 1.8 kg in 12 weeks in 54 patients with obesity and type 2 DM irrespective of a diet with high or low protein content. Women on a high-protein diet lost more total fat and abdominal fat compared with women on a low-protein diet. Total lean mass decreased in all patients irrespective of diet.
Studies have shown that high-protein diets can improve glucose control. Ajala et al55 reviewed 20 clinical trials of patients with type 2 DM randomized to various diets for more than 6 months. In the trials that used a high-protein diet as an intervention, HbA1c levels decreased as much as 0.28% compared with the control diets (P < .001). A small study of 8 men with untreated type 2 DM compared a high-protein low-carbohydrate diet (nonketogenic, protein 30%, carbohydrate content 20%, fat 50%) with a control diet (protein 15%, carbohydrate 55%, fat 30%).56 The high-protein low-carbohydrate diet group had lower HbA1c levels (7.6 mg/dL ± 0.3 mg/dL vs 9.8 mg/dL ± 0.5 mg/dL) and mean 24-hour integrated serum glucose (126 mg/dL vs 198 mg/dL) compared with the control diet. Most of the studies of high-protein diets have been small and of short duration, and have used a combination of macronutrients (high protein and low carbohydrate), limiting the ability to identify the dietary component that had the most effect.
There are no studies evaluating cardiovascular outcomes, but some studies have included cardiovascular risk factors such as LDL-C levels and body fat composition. Parker et al54 showed that women on a high-protein diet lost more total fat (5.3 kg vs 2.8 kg, P = .009) and abdominal fat (1.3 kg vs 0.7 kg, P = .006) compared with a low-protein diet. Interestingly, no difference in total fat and abdominal fat was found in men. LDL-C reduction was greater in a high-protein diet compared with a low-protein diet (5.7% vs 2.7%, P < .01).54 In a review by Ajala et al,55 the high-protein diet was the only diet that did not show a rise in HDL-C levels after interventions of more than 6 months.
The ADA does not recommend high-protein diets as a method for weight loss because the long-term effects are unknown. ADA recommendations include an individualized approach based on a patient’s cardiometabolic risk and renal profiles. Protein content should be 0.8 g/kg to 1.0 g/kg of weight per day in patients with early chronic kidney disease, and 0.8 g/kg of weight per day in patients with advanced kidney disease.6
COMPARISONS AMONG DIETS
Studies comparing diets have reached varying conclusions and have been limited by inconsistent diet definitions, small sample sizes, and high participant dropout rates. A meta-analysis conducted by Ajala et al55 included 20 randomized controlled trials that lasted 6 months or more with 3,073 individuals in the analysis. Low-carbohydrate, vegetarian, vegan, low-glycemic, high-fiber, Mediterranean, and high-protein diets were compared with low-fat, high-glycemic, ADA, European Association for the Study of Diabetes, and low-protein diets as controls. The greatest weight loss occurred with the low-carbohydrate (−0.69 kg, P = .21) and Mediterranean diets (−1.84 kg, P < .001). Compared with the control diets, the greatest reductions in HbA1c were with the low-carbohydrate (−0.12%, P = .04), low-glycemic (−0.14%, P = .008), Mediterranean (−0.47%, P < .001), and high-protein diets (−0.28%, P < .001). HDL-C levels increased in all the diets except the high-protein diet.55
CONCLUSION
The optimal macronutrient intake for patients with obesity and type 2 DM is unknown. Diets with equivalent caloric intakes result in similar weight loss and glucose control regardless of the macronutrient contents. It is important that total caloric intake be appropriate for weight management and glucose control goals. The metabolic status of the patient as determined by lipid profiles, and renal and liver function is the main driver for the macronutrient composition of the diet.
Current trends favor the low-carbohydrate, low-glycemic, Mediterranean, and low-caloric intake diets, though there is no evidence that one is best for weight loss and optimal glycemic control in patients with obesity and type 2 DM. Studies are limited by varying definitions, high dropout rates, and poor adherence. In addition, for many patients, weight regain often follows successful short-term weight loss, indicative of a low durability of results with many diet interventions. Medical nutrition therapy and a multidisciplinary lifestyle approach remain essential components in managing weight and type 2 DM. The ideal diet is one that achieves the best adherence when tailored to a patient’s preferences, energy needs, and health status.
- Kramer H, Cao G, Dugas L, Luke A, Cooper R, Durazo-Arvizu R. Increasing BMI and waist circumference and prevalence of obesity among adults with type 2 diabetes: The National Health and Nutrition Examination Surveys. J Diabetes Complications 2010; 24:368–374.
- Centers for Disease Control and Prevention. Diabetes Report Card 2014. Atlanta, GA: Centers for Disease Control and Prevention, US Dept of Health and Human Services; 2015.
- American Diabetes Association. Obesity management for the treatment of type 2 diabetes. Sec. 6. In: Standards of Medical Care in Diabetes—2016. Diabetes Care 2016; 39(suppl 1):S47–S51.
- Knowler WC, Barrett-Connor E, Fowler SE; Diabetes Prevention Program Research Group. Reduction in the incidence of type 2 diabetes with lifestyle intervention or metformin. N Engl J Med 2002; 346:393–403.
- Franz MJ, Powers MA, Leontos C, et al. The evidence for medical nutrition therapy for type 1 and type 2 diabetes in adults. J Am Diet Assoc 2010; 110:1852–1889.
- American Diabetes Association. Introduction. In: Standards of Medical Care in Diabetes—2017. Diabetes Care 2017; 40(suppl 1):S1–S2.
- Defining adult overweight and obesity. Centers for Disease Control and Prevention website. https://www.cdc.gov/obesity/adult/defining.html. Updated June 16, 2016. Accessed June 26, 2017.
- Institute of Medicine. Dietary Reference Intakes for Energy, Carbohydrate, Fiber, Fat, Fatty acids, Cholesterol, Protein, and Amino Acids. Washington, DC: National Academy Press; 2002.
- American Diabetes Association. Lifestyle management. Sec. 4. In: Standards of Medical Care in Diabetes—2017. Diabetes Care 2017; 40(suppl 1):S33–S43.
- American Diabetes Association. Obesity management for treatment of type 2 diabetes. Sec. 7. In: Standards of Medical Care in Diabetes—2017. Diabetes Care 2017; 40(suppl 1):S57–S63.
- National Institutes of Health. Clinical guidelines on the identification, evaluation, and treatment of overweight and obesity in adults—the evidence report. Obes Res 1998; 6(suppl 2):51S–209S.
- Look AHEAD Research Group; Pi-Sunyer X, Blackburn G, Brancati FL, et al. Reduction in weight and cardiovascular disease risk factors in individuals with type 2 diabetes: one-year results of the look AHEAD trial. Diabetes Care 2007; 30:1374–1383.
- Look AHEAD Research Group; Gregg EW, Jakicic JM, Blackburn G, et al. Association of the magnitude of weight loss and changes in physical fitness with long-term cardiovascular disease outcomes in overweight or obese people with type 2 diabetes: a post-hoc analysis of the look AHEAD randomised clinical trial. Lancet Diabetes Endocrinol 2016; 4:913–921.
- Look AHEAD Research Group; Wadden TA, West DS, Delahanty L, et al. The Look AHEAD Study: a description of the lifestyle intervention and the evidence supporting it. Obesity (Silver Spring) 2006; 14:737–752.
- Tuomilehto J, Lindstrom J, Eriksson JG, et al; Finnish Diabetes Prevention Study Group. Prevention of type 2 diabetes mellitus by changes in lifestyle among subjects with impaired glucose tolerance. N Engl J Med 2001; 344:1343–1350.
- Institute of Medicine. Dietary Reference Intakes for Energy, Carbohydrate, Fiber, Fat, Fatty Acids, Cholesterol, Protein, and Amino Acids (Macronutrients). Washington, DC: The National Academies Press; 2005. doi:https://doi.org/10.17226/10490.
- Kirk JK, Graves DE, Craven TE, Lipkin EW, Austin M, Margolis KL. Restricted-carbohydrate diets in patients with type 2 diabetes: a meta-analysis. J Am Diet Assoc 2008; 108:91–100.
- Franz MJ, Monk A, Barry B, et al. Effectiveness of medical nutrition therapy provided by dietitians in the management of non-insulin-dependent diabetes mellitus: a randomized, controlled clinical trial. J Am Diet Assoc 1995; 95:1009–1017.
- Hu T, Mills KT, Yao L, et al. Effects of low-carbohydrate diets versus low-fat diets on metabolic risk factors: a meta-analysis of randomized controlled clinical trials. Am J Epidemiol 2012; 176(suppl 7):S44–S54.
- Bantle JP, Swanson JE, Thomas W, Laine DC. Metabolic effects of dietary sucrose in type II diabetic subjects. Diabetes Care 1993; 16:1301–1305.
- Malik VS, Popkin BM, Bray GA, Despres JP, Willett WC, Hu FB. Sugar-sweetened beverages and risk of metabolic syndrome and type 2 diabetes: a meta-analysis. Diabetes Care 2010; 33:2477–2483.
- Stanhope KL, Schwarz JM, Havel PJ. Adverse metabolic effects of dietary fructose: results from the recent epidemiological, clinical, and mechanistic studies. Curr Opin Lipidol 2013; 24:198–206.
- Nielsen JV, Jonsson E, Nilsson AK. Lasting improvement of hyperglycaemia and bodyweight: low-carbohydrate diet in type 2 diabetes. A brief report. Ups J Med Sci 2005; 110:69–73; 179–183.
- Robertson AM, Broom J, McRobbie LJ, MacLennan GS. Low carbohydrate diets in the treatment of resistant overweight patients with type 2 diabetes. Diabet Med 2002; 19(suppl 2):24 [Abstract 94].
- Samaha FF, Iqbal N, Seshadri P, et al. A low-carbohydrate as compared with a low-fat diet in severe obesity. N Engl J Med 2003; 348:2074–2081.
- Vetter ML, Iqbal N, Dalton-Bakes C, Volger S, Wadden TA. Long-term effects of low-carbohydrate versus low-fat diets in obese persons. Ann Intern Med 2010; 152:334–335.
- Daly ME, Piper J, Paisey R, et al. Efficacy of carbohydrate restriction in obese type 2 diabetes patients. Diabet Med 2006; 23(suppl 2):26–27 [Abstract 98].
- Thomas D, Elliott EJ. Low glycaemic index, or low glycaemic load, diets for diabetes mellitus. Cochrane Database Syst Rev 2009; (1):CD006296.
- Braunstein CR, Mejia SB, Stoiko E, et al. Effect of low-glycemic index/load diets on body weight: a systematic review and meta-analysis. FASEB 2016; 30:906.9.
- Jenkins DJ, Kendall CW, McKeown-Eyssen G, et al. Effect of a low-glycemic index or a high-cereal fiber diet on type 2 diabetes: a randomized trial. JAMA 2008; 300:2742–2753.
- Järvi AE, Karlstrom BE, Granfeldt YE, Bjorck IE, Asp NG, Vessby BO. Improved glycaemic control and lipid profile and normalized fibrinolytic activity on a low-glycaemic index diet in type 2 diabetes patients. Diabetes Care 1999; 22:10–18.
- Evert AB, Boucher JL, Cypress M, et al. Nutrition therapy recommendations for the management of adults with diabetes. Diabetes Care 2014; 37(suppl 1):S120–S143.
- Savage DB, Petersen KF, Shulman GI. Disordered lipid metabolism and the pathogenesis of insulin resistance. Physiol Rev 2007; 87:507–520.
- Risérus U. Fatty acids and insulin sensitivity. Curr Opin Clin Nutr Metab Care 2008; 11:100–105.
- Oomen CM, Ocke MC, Feskens EJ, van Erp-Baart MA, Kok FJ, Kromhout D. Association between trans fatty acid intake and 10-year risk of coronary heart disease in the Zutphen Elderly Study: a prospective population-based study. Lancet 2001; 357:746–751.
- Nordmann AJ, Nordmann A, Briel M, et al. Effects of low-carbohydrate vs low-fat diets on weight loss and cardiovascular risk factors: a meta-analysis of randomized controlled trials. Arch Intern Med 2006; 166:285–293.
- Foster GD, Wyatt HR, Hill JO, et al. Weight and metabolic outcomes after 2 years on a low-carbohydrate versus low-fat diet: a randomized trial. Ann Intern Med 2010; 153:147–157.
- Saris WH. Very-low-calorie diets and sustained weight loss. Obes Res 2001; 9(suppl 4):295S–301S.
- Tsai A, Wadden TA. The evolution of very-low-calorie diets: an update and meta-analysis. Obesity 2006; 14:1283–1293.
- Toubro S, Astrup A. Randomised comparison of diets for maintaining obese subjects’ weight after major weight loss: ad lib, low fat, high carbohydrate diet v fixed energy intake. BMJ 1997; 314:29–34.
- Rothberg AE, McEwen LN, Kraftson AT, Fowler CE, Herman WH. Very-low-energy diet for type 2 diabetes: an underutilized therapy? J Diabetes Complications 2014; 28:506–510.
- Uusitupa MI, Laakso M, Sarlund H, Majander H, Takala J, Penttilä I. Effects of a very-low-calorie diet on metabolic control and cardiovascular risk factors in the treatment of obese non-insulin-dependent diabetics. Am J Clin Nutr 1990; 51:768–773.
- Elhayany A, Lustman A, Abel R, Attal-Singer J, Vinker S. A low carbohydrate Mediterranean diet improves cardiovascular risk factors and diabetes control among overweight patients with type 2 diabetes mellitus: a 1-year prospective randomized intervention study. Diabetes Obes Metab 2010; 12:204–209.
- Mancini JG, Filion KB, Atallah R, Eisenberg MJ. Systematic review of the Mediterranean diet for long-term weight loss. Am J Med 2016; 129:407–415.e4.
- Estruch R, Martinez-González MA, Corella D, et al; PREDIMED Study Investigators. Effects of a Mediterranean-style diet on cardiovascular risk factors: a randomized trial. Ann Intern Med 2006; 145:1–11.
- Salas-Salvadó J, Bulló M, Babio N, et al; PREDIMED Study Investigators. Reduction in the incidence of type 2 diabetes with the Mediterranean diet: results of the PREDIMED-Reus nutrition intervention randomized trial. Diabetes Care 2011; 34:14–19.
- Esposito K, Maiorino MI, Ciotola M, et al. Effects of a Mediterranean-style diet on the need for antihyperglycemic drug therapy in patients with newly diagnosed type 2 diabetes: a randomized trial. Ann Intern Med 2009; 151:306–314.
- Chang J, Kashyap SR. The protein-sparing modified fast for obese patients with type 2 diabetes: what to expect. Cleve Clin J Med 2014; 81:557–565.
- Palgi A, Read JL, Greenberg I, Hoefer MA, Bistrian BR, Blackburn GL. Multidisciplinary treatment of obesity with a protein-sparing modified fast: results in 668 outpatients. Am J Public Health 1985; 75:1190–1194.
- Paisey RB, Frost J, Harvey P, et al. Five year results of a prospective very low calorie diet or conventional weight loss programme in type 2 diabetes. J Hum Nutr Diet 2002; 15:121–127.
- Hughes TA, Gwynne JT, Switzer BR, Herbst C, White G. Effects of caloric restriction and weight loss on glycemic control, insulin release and resistance, and atherosclerotic risk in obese patients with type II diabetes mellitus. Am J Med 1984; 77:7–17.
- Li Z, Tseng CH, Li Q, Deng ML, Wang M, Heber D. Clinical efficacy of a medically supervised outpatient high-protein, low-calorie diet program is equivalent in prediabetic, diabetic and normoglycemic obese patients. Nutr Diabetes 2014; 4:e105.
- Mishra S, Xu J, Agarwal U, Gonzales J, Levin S, Barnard ND. A multicenter randomized controlled trial of a plant-based nutrition program to reduce body weight and cardiovascular risk in the corporate setting: the GEICO study. Eur J Clin Nutr 2013; 67:718–724.
- Parker B, Noakes M, Luscombe N, Clifton P. Effect of a high-protein, high-monounsaturated fat weight loss diet on glycemic control and lipid levels in type 2 diabetes. Diabetes Care 2002; 25:425–430.
- Ajala O, English P, Pinkney J. Systematic review and meta-analysis of different dietary approaches to the management of type 2 diabetes. Am J Clin Nutr 2013; 97:505–516.
- Gannon MC, Nuttall FQ. Effect of a high-protein, low-carbohydrate diet on blood glucose control in people with type 2 diabetes. Diabetes 2004; 53:2375–2382.
KEY POINTS
- Weight loss in individuals who are obese has been shown to be effective in the prevention and management of type 2 diabetes.
- Diets vary based on the type and amount of carbohydrate, fat, and protein consumed to meet daily caloric intake goals.
- Diets of equal caloric intake result in similar weight loss and glucose control regardless of the macronutrient content.
- The metabolic status of the patient based on lipid profiles and renal and liver function is the main determinant for the macronutient composition of the diet.

Optimizing diabetes treatment in the presence of obesity
Diabesity was a term coined by Sims et al1 in the 1970s to describe diabetes occurring in the setting of obesity. Today, the link between type 2 diabetes mellitus (DM), obesity, and insulin resistance is well recognized, and 80% of people with type 2 DM are overweight or obese.2,3 Unfortunately, weight gain is a known side effect of most agents used to treat type 2 DM (eg, insulin, sulfonylureas, thiazolidinediones), and this often leads to nonadherence, poor glycemic control, and further weight gain.
During the past several years, evidence has emerged of a neurophysiologic mechanism that involves hormones from adipocytes, pancreatic islet cells, and the gastrointestinal tract implicated in both obesity and diabetes.2 This has led to research for drugs that not only either target obesity and diabetes or reduce hemoglobin A1c (HbA1c), but also have weight loss as a potential side effect.
In this paper, we review medications approved for the treatment of type 2 DM (including pramlintide, also approved for type 1 DM) that also have weight loss as a side effect. Drugs we will discuss include glucagon-like peptide-1 (GLP-1) receptor agonists, sodium-glucose cotransporter-2 (SGLT-2) inhibitors, neuroendocrine peptide hormones, alpha-glucosidase inhibitors, and metformin. Where appropriate, we also comment on the effects of the drugs on cardiovascular outcomes.
GLP-1 RECEPTOR AGONISTS
Mechanism of action
GLP-1 is a hormone produced from the proglucagon gene in the alpha cells of the pancreas, in the L cells of intestinal mucosa (predominantly in the ileum and distal colon), and in structures of the nervous system including the brainstem, hypothalamus, and vagal afferent nerves.4 Food in the gastrointestinal tract, especially if high in fats and carbohydrates, stimulates secretion of GLP-1 in the L cells, which in turn amplifies insulin secretion in a glucose-dependent manner (the incretin effect).4 Glucagon secretion is inhibited by GLP-1 during times of hyperglycemia but not hypoglycemia, thereby preventing inappropriately high levels of the hormone.5 Peripheral GLP-1 activates a cascade of centrally mediated signals that ultimately result in secretion of insulin by the pancreas and slowing of gastrointestinal motility.5 Lastly, GLP-1 exerts an anorexic effect by acting on central pathways that mediate satiation.6

Bioactive forms of GLP-1 are rapidly degraded in the circulation by the dipeptidyl peptidase-4 enzyme. GLP-1 receptor agonists have slightly altered molecular structure and longer duration of action than native GLP-1. Short-acting GLP-1 agonists (eg, exenatide, lixisenatide) have more effect on gastric emptying and lower postprandial blood glucose levels, whereas long-acting GLP-1 agonists (eg, liraglutide, albiglutide, dulaglutide, semaglutide, exenatide) have a greater effect on fasting glucose levels.4
Effects on HbA1c and weight loss

Of the current GLP-1 agonists, exenatide and liraglutide have been on the market the longest, thus studied more in terms of weight reduction.
Exenatide. Exenatide BID was the first GLP-1 agonist, approved by the US Food and Drug Administration (FDA) in 2005 for the treatment of type 2 DM. In a 30-week triple-blind, placebo-controlled study of 336 patients already on background therapy with metformin, progressive weight loss was noted with exenatide 5 μg (−1.6 ± 0.4 kg) and exenatide 10 μg (−2.8 ± 0.5 kg) compared with placebo (−0.3 ± 0.3 kg; P < .001).15 A meta-analysis of 14 trials with 2,583 patients showed significant weight reduction with both exenatide 5 μg twice daily (a difference of −0.56 kg, 95% confidence interval [CI] −1.07 to −0.06, P = .0002) in 8 trials and exenatide 10 μg twice daily (a difference of −1.24 kg, 95% CI −1.69 to −0.78, P < .001) in 12 trials, after treatment for more than 16 weeks.16
Liraglutide. Liraglutide has a longer half-life than exenatide and is administered once daily. It is not a first-line therapy for type 2 DM and is recommended as an add-on. Approved daily doses for type 2 DM are 1.2 mg and 1.8 mg.
Multiple studies of glycemic control and weight loss with liraglutide have been conducted since its introduction to the US market in 2010. In the Liraglutide Effect and Action in Diabetes (LEAD) series of trials, liraglutide use as monotherapy or in combination with oral agents was associated with significant dose-dependent weight loss.17 Liraglutide monotherapy (at 1.2 mg and 1.8 mg) compared with glimepiride in the LEAD-3 trial led to significant weight reduction (2.1 kg and 2.5 kg, respectively, P < .001) after 16 weeks, and was sustained up to 52 weeks.18 Addition of liraglutide (at 1.2 mg and 1.8 mg) to metformin plus rosiglitazone resulted in significant weight loss (1.02 kg and 2.02 kg, respectively) whereas the addition of placebo caused a 0.6-kg weight gain (P < .001).19 The SCALE study randomized 846 adults with type 2 DM who were overweight to obese (body mass index [BMI] ≥ 27 kg/m2), were taking 0 to 3 oral antihyperglycemic agents (metformin, thiazolidinedione, and a sulfonylurea), and had stable body weight and an HbA1c of 7% to 10% to liraglutide 1.8 mg, liraglutide 3.0 mg, or placebo. Mean weight loss after 56 weeks was 6.0% (6.4 kg) with liraglutide 1.8 mg, 4.7% (5.0 kg) with liraglutide 3.0 mg, and 2.0% (2.2 kg) with placebo.20
In 2016, high-dose once-daily liraglutide 3.0 mg (Saxenda) was approved by the FDA for weight loss. In a double-blind randomized trial of liraglutide 3.0 mg vs placebo in patients who had a BMI of at least 30 or who had a BMI of at least 27 plus treated or untreated dyslipidemia or hypertension, Pi-Sunyer et al21 reported a mean weight reduction of 8.4 ± 7.3 kg with liraglutide vs 2.8 ± 6.5 kg with placebo (a difference of −5.6 kg, 95% CI −6.0 to −5.1, P < .001) after 56 weeks. Furthermore, 63.2% of patients in the liraglutide group lost at least 5% of body weight vs 27.1% with placebo, and 33.1% in the liraglutide group lost 10% or more of body weight vs 10.6% in the placebo group (P < .001).21 Of note, liraglutide 3.0 mg is not indicated for type 2 DM per se.
In a 2012 meta-analysis of randomized controlled trials of adults with and without type 2 DM, with a BMI of 25 or greater, and who received GLP-1 receptor agonists at clinically relevant doses (exenatide ≥ 10 μg/day, exenatide ≥ 2 mg/week, or liraglutide ≥ 1.2 mg/day), those taking GLP-1 receptor agonists had more weight loss than those on a control intervention (oral antihyperglycemic, insulin, or placebo) at a minimum of 20 weeks, with a weighted mean difference −2.9 kg (95% CI −3.6 to −2.2) in 21 trials and 6,411 participants.22
GLP-1 agonists currently being investigated for obesity treatment are lixisenatide, albiglutide, taspoglutide, and oxyntomodulin.23
Cardiovascular outcomes
The presence of GLP-1 receptors in blood vessels and myocardium has led to the hypothesis that GLP-1 receptor agonists can improve cardiovascular disease outcomes.24 In the pivotal Liraglutide Effect and Action in Diabetes: Evaluation of Cardiovascular Outcome Results (LEADER) trial, 9,340 patients with type 2 DM and increased cardiovascular disease risk were randomized to liraglutide vs placebo.25 The hazard ratio (HR) for time to the primary end point of cardiovascular death, nonfatal myocardial infarction, or nonfatal stroke was 0.87 (P = .01 for superiority, P < .001 for noninferiority) for liraglutide compared with placebo after 3.8 years. The incidence of death from any cause or cardiovascular cause was also lower with liraglutide.25
Adverse effects
Tolerable transient nausea and vomiting are reported adverse effects; these symptoms occur early in therapy, usually resolve in 4 to 8 weeks, and appear to be associated with greater weight loss.26 Although no causal relationship between GLP-1 receptor agonist use and pancreatitis or pancreatic cancer has been established to date, several cases of acute pancreatitis have been reported.25 Alternative therapies should be considered in patients with a history of or risk factors for pancreatitis.
Combined with insulin
A product that combines insulin glargine and lixisenatide (Soliqua) is FDA-approved for patients with type 2 DM. In a 30-week randomized controlled trial of the combination product vs insulin glargine alone in patients with type 2 DM not controlled on basal insulin with or without up to 2 oral agents, the combination product resulted in an HbA1c reduction from baseline of 1.1% vs 0.6% for insulin glargine alone (P < .001).27 Mean body weight decreased by 0.7 kg with the combination product and increased by 0.7 kg with insulin glargine (P < .001).27 In a 24-week study of a lixisenatide-insulin glargine combination vs insulin glargine in insulin-naïve patients taking metformin, there was a reduction in HbA1c of about −1.7% from baseline in both groups, while the combination group had a 1-kg weight reduction compared with a 0.5-kg weight increase in the insulin glargine group (P < .001).28
SGLT-2 INHIBITORS
Mechanism of action
In a healthy normoglycemic person, about 180 g of glucose per day is filtered into the glomerular filtrate and reabsorbed into the circulation.29 SGLT-2 facilitates the reabsorption of glucose in the proximal convoluted tubule of the kidneys. Approximately 90% of glucose reabsorption is mediated by SGLT-2 found in the S1 and S2 segments of the proximal convoluted tubule, and the remaining 10% by SGLT-1 in the S3 segment. At serum glucose levels above 180 g, the reabsorptive capacity of the nephron is overwhelmed, resulting in glycosuria.30 SGLT-2 expression is also increased in patients with diabetes, thus leading to increased glucose reabsorption into the circulation, further contributing to hyperglycemia.30 Inhibition of SGLT-2 alleviates hyperglycemia by decreasing glucose reabsorption (30% to 50% of filtered glucose) in the kidneys and by increasing excretion (50 mg to 80 mg of glucose) in the urine.31 SGLT-2 inhibitors currently FDA-approved are canagliflozin (Invokana), dapagliflozin (Farxiga), and empagliflozin (Jardiance).
HbA1c
SGLT-2 inhibitors have relatively weak glycemic efficacy. A meta-analysis of SGLT-2 inhibitors vs other antidiabetic medications or placebo found that SGLT-2 inhibitors appeared to have a “favorable effect” on HbA1c, with a mean difference vs placebo of −0.66% (95% CI −0.73% to −0.58%) and a mean difference vs other antihyperglycemic medications of −0.06% (95% CI 0.18% to 0.05%).32
Weight loss
The same meta-analysis found that SGLT-2 inhibitors reduced body weight (mean difference −1.8 kg, 95% CI −3.50 kg to −0.11 kg).32 And in a randomized controlled trial, monotherapy with canagliflozin 100 mg/day and 300 mg/day resulted in body weight reduction of 2.2% (1.9 kg) and 3.3% (−2.9 kg), respectively, after 26 weeks.33 A Japanese study showed a dose-related total body weight loss with empagliflozin vs placebo ranging from 2.5 ± 0.2 kg (5-mg dose) to 3.1 ± 0.2 kg (50-mg dose) after 12 weeks.34 Bolinder et al35 reported that adding dapagliflozin 10 mg to metformin in patients with type 2 DM reduced total body weight by −2.96 kg (95% CI −3.51 to −2.41, P < .001) at week 24. Whole-body dual-energy x-ray absorptiometry and magnetic resonance imaging findings in this study revealed a decrease in fat mass and visceral and subcutaneous adipose tissue after treatment with dapagliflozin, thus suggesting urinary loss of glucose (and hence caloric loss) contributing to weight reduction in addition to initial weight loss from fluid loss due to osmotic diuresis.35 A continuous decline in total body weight was observed in a 78-week extension study resulting in −4.54 kg (95% CI −5.43 to −3.66 kg) at week 102, along with further reduction in total body fat mass as measured by dual-energy x-ray absorptiometry.36
Cardiovascular outcomes
The landmark study Empagliflozin, Cardiovascular Outcomes and Mortality in Type 2 Diabetes (EMPA-REG) involving 7,020 patients was the first large cardiovascular outcomes trial in patients with type 2 DM and overt cardiovascular disease. A relative risk reduction of 14% (12.1% to 10.5%, HR 0.86, 95% CI 0.74 to 0.99) in major adverse cardiovascular events (cardiovascular death, nonfatal myocardial infarction, and nonfatal stroke) was observed with empagliflozin.37 Rates of all-cause mortality and hospitalization for heart failure relative risk reductions were 32% (8.3% to 5.7%; HR 0.68 [0.57, 0.8]) and 35% (4.1% to 2.7%; HR 0.65 [0.50, 0.85]), respectively, with empagliflozin. The mechanism behind this cardiovascular benefit is unknown but is currently being explored.37
Adverse effects
Increased risk of urinary tract and genital infections are known adverse effects of SGLT-2s. Other effects noted include postural hypotension from volume depletion and a transient increase in serum creatinine and decrease in glomerular filtration.29
NEUROENDOCRINE PEPTIDE HORMONE: AMYLIN ANALOGUES
Mechanism of action
Amylin is a 37-amino-acid neuroendocrine peptide hormone secreted primarily by pancreatic beta cells. It promotes early satiety, and its anorexigenic effects are mediated by its action on the neurons of the area postrema in the brain.38 After a meal, amylin decreases gastric acid secretion and slows gastric emptying. It is co-secreted with insulin in a 1:20 amylin-to-insulin ratio and inhibits glucagon secretion via a centrally mediated mechanism.39
Pramlintide (Symlin) is an amylin analogue administered subcutaneously immediately before major meals. It decreases postprandial glucose levels and has been approved by the FDA as an adjunct to prandial insulin in patients with type 1 and type 2 DM.40
HbA1c
Amylin secretion is impaired in type 1 and type 2 DM, and small but significant reductions in HbA1c have been observed with addition of pramlintide to usual insulin regimens. In patients with type 1 DM, HbA1c levels were reduced by 0.4% to 0.6% after 26 weeks on 30 μg 3 times daily to 60 μg 4 times daily of pramlintide added to insulin.41,42 And pramlintide 120 μg added to usual antihyperglycemic therapy in patients with type 2 DM has been reported to decrease HbA1c by 0.7% at week 16 or 26.43,44
Weight loss
A meta-analysis of 8 randomized controlled trials assessed the effects of pramlintide on glycemic control and weight in patients with type 2 DM treated with insulin and in obese patients without diabetes.45 In these trials, patients took at least 120 μg of pramlintide before 2 to 3 meals for at least 12 weeks; a total of 1,616 participants were included. In the type 2 DM group, pramlintide reduced body weight by 2.57 kg (95% CI −3.44 to −1.70 kg, P < .001) vs control, over 16 to 52 weeks.45 The nondiabetic obese group had a weight loss of −2.27 kg (95%CI −2.88 to −1.66 kg, P < .001) vs control.45
Pramlintide and a pramlintide-phentermine combination are currently under investigation for treatment of obesity.23
Cardiovascular outcomes
Cardiovascular outcomes in patients treated with pramlintide have not been studied to date, but reductions have been observed in markers of cardiovascular risk including high-sensitivity C-reactive protein and triglycerides.46
Adverse effects
Transient mild-to-moderate nausea is the most common adverse effect of pramlintide. Hypoglycemia has also been reported, more frequently in patients with type 1 DM, which is possibly associated with inadequate reduction in insulin.
ALPHA-GLUCOSIDASE INHIBITORS
Mechanism of action
Alpha-glucosidase inhibitors competitively inhibit the alpha-glucosidase enzymes at the brush border of the small intestine. Taken orally before meals, these drugs mitigate postprandial hyperglycemia by preventing the breakdown of complex carbohydrates into simpler monosaccharides, thus delaying their absorption.47 These agents may be used as monotherapy or in combination with other antihyperglycemic agents. They work independently from insulin, although they have been shown to potentiate GLP-1 secretion.48 Acarbose and miglitol are currently approved in the United States. Acarbose has been more extensively studied worldwide.
HbA1c
Alpha-glucosidase inhibitors have been reported to reduce mean HbA1c by 0.8% (95% CI −0.9% to −0.7%), as well as fasting and postprandial glucose, and postprandial insulin levels.49
Weight loss
There is conflicting evidence on whether alpha-glucosidase inhibitor therapy has a neutral or beneficial effect on body weight. A Cochrane meta-analysis observed significant BMI reduction with acarbose, although no effect on body weight was noted,49 whereas in another meta-analysis, body weight was significantly reduced by 0.96 kg (95% CI −1.80 to −0.12 kg) when acarbose was added to metformin.50 A review of pooled data from worldwide post-marketing studies for acarbose reported a weight reduction after 3 months of 0.98 ± 2.11 kg in overweight patients and 1.67 ± 3.02 kg in obese patients.51
Cardiovascular outcomes
In the Study to Prevent Non-Insulin-Dependent Diabetes Mellitus (STOP-NIDDM), when compared with placebo, treatment of patients with impaired glucose tolerance with acarbose significantly reduced the incidence of cardiovascular events (HR 0.51, 95% CI 0.28 to 0.95, P = .03), myocardial infarction (HR 0.09, 95% CI 0.01 to 0.72, P = .02), and newly diagnosed hypertension (HR 0.66, 95% CI 0.49 to 0.89, P = .006).52
Adverse effects
Although mild, gastrointestinal effects of flatulence and diarrhea can be bothersome and result in discontinuation of the drug in most patients.
METFORMIN
Mechanism of action
Metformin is the first-line antihyperglycemic agent for type 2 DM recommended by the American Diabetes Association and European Association for the Study of Diabetes.53,54 The main action of metformin is to decrease glucose production in the liver. In the small intestine, metformin stimulates the L cells to produce GLP-1, and in skeletal muscle, it increases glucose uptake and disposal.55
HbA1c
As monotherapy, metformin has resulted in HbA1c reductions of 0.88% to 1.2%.55
Weight loss
Reduced food intake56,57 and gastrointestinal intolerance58 occurring early in therapy have been noted to account for weight loss in short-term studies of non-diabetic obese patients treated with metformin.59 Long-term trials of patients with and without diabetes have yielded mixed results on weight reduction from metformin as monotherapy or adjunct therapy. In the United Kingdom Prospective Diabetes Study (UKPDS), metformin had resulted in approximately 1.5 kg of weight gain (slightly less than the 4-kg weight gain in the glibenclamide group).60 Improved antihyperglycemic efficacy of other antihyperglycemic agents (insulin, sulfonylureas, and thiazolidinediones) with addition of metformin led to dose-lowering of the antihyperglycemic agents, ultimately resulting in amelioration of weight gain; this has also led to small weight reductions in some studies.59 In the Diabetes Prevention Program study of patients with impaired glucose tolerance, metformin treatment resulted in an average weight loss of 2.1 kg compared with placebo (−0.1 kg) and lifestyle intervention (−5.6 kg; P <.001).61
Cardiovascular outcomes
Metformin has been observed to decrease micro- and macrovascular complications. Compared with diet alone, metformin was associated with a 39% reduction in the risk of myocardial infarction, and a 30% lower risk of a composite of macrovascular diseases (myocardial infarction, sudden death, angina, stroke, and peripheral disease).60
Adverse effects
The most common adverse effect of metformin is gastrointestinal intolerance from abdominal pain, flatulence, and diarrhea.62 Metformin-associated lactic acidosis is a serious and potentially life-threatening effect; and vitamin B12 deficiency may occur with long-term treatment.62
TAKE-HOME POINTS
As more medications and interventions are being developed to counter obesity, it also makes sense to select diabetes medications that do not contribute to weight gain in patients who are already overweight or obese. The effects of available medications can be maximized and treatment regimens individualized (based on patients’ needs and preferences, within the limitations of drug costs and side effects), along with lifestyle modification, to target diabesity.
- Sims EAH, Danforth E Jr, Horton ES, Bray GA, Glennon JA, Salans LB. Endocrine and metabolic effects of experimental obesity in man. Recent Prog Horm Res 1973; 29:457–496.
- Scheen AJ, Van Gaal LF. Combating the dual burden: therapeutic targeting of common pathways in obesity and type 2 diabetes. Lancet Diabetes Endocrinol 2014; 2:911–922.
- Kahn SE, Hull RL, Utzschneider KM. Mechanisms linking obesity to insulin resistance and type 2 diabetes. Nature 2006; 444:840–846.
- Iepsen EW, Torekov SS, Holst JJ. Therapies for inter-relating diabetes and obesity—GLP-1 and obesity. Expert Opin Pharmacother 2014; 15:2487–2500.
- Meier JJ, Nauck MA. Glucagon-like peptide 1(GLP-1) in biology and pathology. Diabetes Metab Res Rev 2005; 21:91–117.
- Turton MD, O’Shea D, Gunn I, et al. A role for glucagon-like peptide-1 in the central regulation of feeding. Nature 1996; 379:69–72.
- Drucker DJ. Glucagon-like peptides: regulators of cell proliferation, differentiation, and apoptosis. Mol Endocrinol 2003; 17:161–171.
- Shyangdan DS, Royle P, Clar C, Sharma P, Waugh N, Snaith A. Glucagon-like peptide analogues for type 2 diabetes mellitus. Cochrane Database Syst Rev 2011; 10:CD006423. doi:10.1002/14651858.CD006423.pub2.
- Byetta [package insert]. Wilmington, DE: AstraZeneca Pharmaceuticals LP; 2015. Available at http://www.azpicentral.com/byetta/pi_byetta.pdf. Accessed June 22, 2017.
- Victoza [package insert]. Bagsvaerd, Denmark: Novo Nordisk A/S; 2016. Available at http://www.novo-pi.com/victoza.pdf. Accessed June 22, 2017.
- Bydureon [package insert]. Wilmington, DE: AstraZeneca Pharmaceuticals LP; 2015. Available at http://www.azpicentral.com/bydureon/pi_bydureon.pdf. Accessed June 22, 2017.
- Tanzeum [package insert]. Wilmington, DE: GlaxoSmithKline; 2016. Available at https://www.gsksource.com/pharma/content/dam/GlaxoSmithKline/US/en/Prescribing_Information/Tanzeum/pdf/TANZEUM-PI-MG-IFU-COMBINED.PDF. Accessed June 22, 2017.
- Trulicity [package insert]. Indianapolis, IN: Eli Lilly and Company 2014. Available at http://pi.lilly.com/us/trulicity-uspi.pdf. Accessed June 22, 2017.
- Adlyxin [package insert]. Bridgewater, NJ: Sanofi-Aventis U.S. LLC; 2016. Available at http://products.sanofi.us/adlyxin/adlyxin.pdf. Accessed June 22, 2017.
- DeFronzo RA, Ratner RE, Han J, Kim DD, Fineman MS, Baron AD. Effects of exenatide (exendin-4) on glycemic control and weight over 30 weeks in metformin-treated patients with type 2 diabetes. Diabetes Care 2005; 28:1092–1100.
- Nikfar S, Abdollahi M, Salari P. The efficacy and tolerability of exenatide in comparison to placebo; a systematic review and meta-analysis of randomized clinical trials. J Pharm Pharm Sci 2012; 15:1–30.
- Blonde L, Russell-Jones D. The safety and efficacy of liraglutide with or without oral antidiabetic drug therapy in type 2 diabetes: an overview of the LEAD 1-5 studies. Diabetes Obes Metab 2009; 11(suppl 3):26–34.
- Garber A, Henry R, Ratner R, et al; LEAD-3 (Mono) Study Group. Liraglutide versus glimepiride monotherapy for type 2 diabetes (LEAD-3 Mono): a randomised, 52-week, phase III, double-blind, parallel-treatment trial. Lancet 2009; 373:473–481.
- Zinman B, Gerich J, Buse JB, et al; LEAD-4 Study Investigators. Efficacy and safety of the human glucagon-like peptide-1 analog liraglutide in combination with metformin and thiazolidinedione in patients with type 2 diabetes (LEAD-4 Met+TZD). Diabetes Care 2009; 32:1224–1230.
- Davies MJ, Bergenstal R, Bode B, et al. Efficacy of liraglutide for weight loss among patients with type 2 diabetes: the SCALE Diabetes Randomized Clinical Trial. JAMA 2015; 314:687–699.
- Pi-Sunyer X, Astrup A, Fujioka K, et al; SCALE Obesity and Prediabetes NN8022-1839 Study Group. A randomized, controlled trial of 3.0 mg of liraglutide in weight management. N Engl J Med 2015; 373:11–22.
- Vilsboll T, Christensen M, Junker AE, Knop FK, Gluud LL. Effects of glucagon-like peptide-1 receptor agonists on weight loss: systematic review and meta-analyses of randomised controlled trials. BMJ 2012; 344:d7771.
- Valsamakis G, Konstantakou P, Mastorakos G. New targets for drug treatment of obesity. Annu Rev Pharmacol Toxicol 2017; 57:585–605.
- Sivertsen J, Rosenmeier J, Holst JJ, Vilsboll T. The effect of glucagon-like peptide 1 on cardiovascular risk. Nat Rev Cardiol 2012; 9:209–222.
- Marso SP, Daniels GH, Brown-Frandsen K, et al; LEADER Steering Committee; LEADER Trial Investigators. Liraglutide and cardiovascular outcomes in type 2 diabetes. N Engl J Med 2016; 375:311–322.
- Lean ME, Carraro R, Finer N, et al; NN8022-1807 Investigators. Tolerability of nausea and vomiting and associations with weight loss in a randomized trial of liraglutide in obese, non-diabetic adults. Int J Obes (Lond) 2014; 38:689–697.
- Aroda VR, Rosenstock J, Wysham C, et al; LixiLan-L Trial Investigators. Efficacy and safety of lixilan, a titratable fixed-ratio combination of insulin glargine plus lixisenatide in type 2 diabetes inadequately controlled on basal insulin and metformin: the LixiLan-L Randomized Trial. Diabetes Care 2016; 39:1972–1980.
- Rosenstock J, Diamant M, Aroda VR, et al; LixiLan PoC Study Group. Efficacy and safety of LixiLan, a titratable fixed-ratio combination of lixisenatide and insulin glargine, versus insulin glargine in type 2 diabetes inadequately controlled on metformin monotherapy: the LixiLan Proof-of-Concept Randomized Trial. Diabetes Care 2016; 39:1579–1586.
- Monica Reddy RP, Inzucchi SE. SGLT2 inhibitors in the management of type 2 diabetes. Endocrine 2016; 53:364–372.
- DeFronzo RA, Davidson JA, Del Prato S. The role of the kidneys in glucose homeostasis: a new path towards normalizing glycaemia. Diabetes Obes Metab 2012; 14:5–14.
- Liu JJ, Lee T, DeFronzo RA. Why do SGLT2 inhibitors inhibit only 30-50% of renal glucose reabsorption in humans? Diabetes 2012; 61:2199–2204.
- Vasilakou D, Karagiannis T, Athanasiadou E, et al. Sodium-glucose cotransporter 2 inhibitors for type 2 diabetes: a systematic review and meta-analysis. Ann Intern Med 2013; 159:262–274.
- Stenlof K, Cefalu WT, Kim KA, et al. Efficacy and safety of canagliflozin monotherapy in subjects with type 2 diabetes mellitus inadequately controlled with diet and exercise. Diabetes Obes Metab 2013; 15:372–382.
- Kadowaki T, Haneda M, Inagaki N, et al. Empagliflozin monotherapy in Japanese patients with type 2 diabetes mellitus: a randomized, 12-week, double-blind, placebo-controlled, phase II trial. Adv Ther 2014; 31:621–638.
- Bolinder J, Ljunggren O, Kullberg J, et al. Effects of dapagliflozin on body weight, total fat mass, and regional adipose tissue distribution in patients with type 2 diabetes mellitus with inadequate glycemic control on metformin. J Clin Endocrinol Metab 2012; 97:1020–1031.
- Bolinder J, Ljunggren O, Johansson L, et al. Dapagliflozin maintains glycaemic control while reducing weight and body fat mass over 2 years in patients with type 2 diabetes mellitus inadequately controlled on metformin. Diabetes Obes Metab 2014; 16:159–169.
- Zinman B, Wanner C, Lachin JM, et al; EMPA-REG OUTCOME Investigators. Empagliflozin, cardiovascular outcomes, and mortality in type 2 diabetes. N Engl J Med 2015; 373:2117–2128.
- Lutz TA. Effects of amylin on eating and adiposity. Handb Exp Pharmacol 2012; (209):231–250.
- Hieronymus L, Griffin S. Role of amylin in type 1 and type 2 diabetes. Diabetes Educ 2015; 41(suppl 1):47S–56S.
- Aronoff SL. Rationale for treatment options for mealtime glucose control in patients with type 2 diabetes. Postgrad Med 2017; 129:231–241.
- Ratner RE, Dickey R, Fineman M, et al. Amylin replacement with pramlintide as an adjunct to insulin therapy improves long-term glycaemic and weight control in type 1 diabetes mellitus: a 1-year, randomized controlled trial. Diabet Med 2004; 21:1204–1212.
- Edelman S, Garg S, Frias J, et al. A double-blind, placebo-controlled trial assessing pramlintide treatment in the setting of intensive insulin therapy in type 1 diabetes. Diabetes Care 2006; 29:2189–2195.
- Riddle M, Frias J, Zhang B, et al. Pramlintide improved glycemic control and reduced weight in patients with type 2 diabetes using basal insulin. Diabetes Care 2007; 30:2794–2799.
- Hollander PA, Levy P, Fineman MS, et al. Pramlintide as an adjunct to insulin therapy improves long-term glycemic and weight control in patients with type 2 diabetes: a 1-year randomized controlled trial. Diabetes Care 2003; 26:784–790.
- Singh-Franco D, Perez A, Harrington C. The effect of pramlintide acetate on glycemic control and weight in patients with type 2 diabetes mellitus and in obese patients without diabetes: a systematic review and meta-analysis. Diabetes Obes Metab 2011; 13:169–180.
- Wysham C, Lush C, Zhang B, Maier H, Wilhelm K. Effect of pramlintide as an adjunct to basal insulin on markers of cardiovascular risk in patients with type 2 diabetes. Curr Med Res Opin 2008; 24:79–85.
- Bischoff H. Pharmacology of alpha-glucosidase inhibition. Eur J Clin Invest 1994; 24(suppl 3):3–10.
- Lee A, Patrick P, Wishart J, Horowitz M, Morley JE. The effects of miglitol on glucagon-like peptide-1 secretion and appetite sensations in obese type 2 diabetics. Diabetes Obes Metab 2002; 4:329–335.
- van de Laar FA, Lucassen PL, Akkermans RP, van de Lisdonk EH, Rutten GE, van Weel C. Alpha-glucosidase inhibitors for patients with type 2 diabetes: results from a Cochrane systematic review and meta-analysis. Diabetes Care 2005; 28:154–163.
- Gross JL, Kramer CK, Leitao CB, et al; Diabetes and Endocrinology Meta-analysis Group (DEMA). Effect of antihyperglycemic agents added to metformin and a sulfonylurea on glycemic control and weight gain in type 2 diabetes: a network meta-analysis. Ann Intern Med 2011; 154:672–679.
- Schnell O, Weng J, Sheu WH, et al. Acarbose reduces body weight irrespective of glycemic control in patients with diabetes: results of a worldwide, non-interventional, observational study data pool. J Diabetes Complications 2016; 30:628–637.
- Chiasson JL, Josse RG, Gomis R, Hanefeld M, Karasik A, Laakso M; STOP-NIDDM Trial Research Group. Acarbose treatment and the risk of cardiovascular disease and hypertension in patients with impaired glucose tolerance: the STOP-NIDDM trial. JAMA 2003; 290:486–494.
- Inzucchi SE, Bergenstal RM, Buse JB, et al. Management of hyperglycemia in type 2 diabetes, 2015: a patient-centered approach: update to a position statement of the American Diabetes Association and the European Association for the Study of Diabetes. Diabetes Care 2015; 38:140–149.
- American Diabetes Association. Pharmacologic approaches to glycemic treatment. Diabetes Care 2017; 40:S64–S74.
- Tan MH, Alquraini H, Mizokami-Stout K, MacEachern M. Metformin: From research to clinical practice. Endocrinol Metab Clin North Am 2016; 45:819–843.
- Paolisso G, Amato L, Eccellente R, et al. Effect of metformin on food intake in obese subjects. Eur J Clin Invest 1998; 28: 441–446.
- Lee A, Morley JE. Metformin decreases food consumption and induces weight loss in subjects with obesity with type II noninsulin-dependent diabetes. Obes Res 1998; 6: 47–53.
- Scarpello JH. Optimal dosing strategies for maximising the clinical response to metformin in type 2 diabetes. Br J Diabetes Vasc Dis 2001; 1: 28–36.
- Golay A. Metformin and body weight. Int J Obes (Lond) 2008; 32:61–72.
- UK Prospective Diabetes Study (UKPDS) Group. Effect of intensive blood-glucose control with metformin on complications in overweight patients with type 2 diabetes (UKPDS 34). Lancet 1998; 352:854–865.
- Knowler WC, Barrett-Connor E, Fowler SE, et al; Diabetes Prevention Program Research Group. Reduction in the incidence of type 2 diabetes with lifestyle intervention or metformin. N Engl J Med 2002; 346:393–403.
- Fujita Y, Inagaki N. Metformin: new preparations and nonglycemic benefits. Curr Diab Rep 2017; 17:5.
Diabesity was a term coined by Sims et al1 in the 1970s to describe diabetes occurring in the setting of obesity. Today, the link between type 2 diabetes mellitus (DM), obesity, and insulin resistance is well recognized, and 80% of people with type 2 DM are overweight or obese.2,3 Unfortunately, weight gain is a known side effect of most agents used to treat type 2 DM (eg, insulin, sulfonylureas, thiazolidinediones), and this often leads to nonadherence, poor glycemic control, and further weight gain.
During the past several years, evidence has emerged of a neurophysiologic mechanism that involves hormones from adipocytes, pancreatic islet cells, and the gastrointestinal tract implicated in both obesity and diabetes.2 This has led to research for drugs that not only either target obesity and diabetes or reduce hemoglobin A1c (HbA1c), but also have weight loss as a potential side effect.
In this paper, we review medications approved for the treatment of type 2 DM (including pramlintide, also approved for type 1 DM) that also have weight loss as a side effect. Drugs we will discuss include glucagon-like peptide-1 (GLP-1) receptor agonists, sodium-glucose cotransporter-2 (SGLT-2) inhibitors, neuroendocrine peptide hormones, alpha-glucosidase inhibitors, and metformin. Where appropriate, we also comment on the effects of the drugs on cardiovascular outcomes.
GLP-1 RECEPTOR AGONISTS
Mechanism of action
GLP-1 is a hormone produced from the proglucagon gene in the alpha cells of the pancreas, in the L cells of intestinal mucosa (predominantly in the ileum and distal colon), and in structures of the nervous system including the brainstem, hypothalamus, and vagal afferent nerves.4 Food in the gastrointestinal tract, especially if high in fats and carbohydrates, stimulates secretion of GLP-1 in the L cells, which in turn amplifies insulin secretion in a glucose-dependent manner (the incretin effect).4 Glucagon secretion is inhibited by GLP-1 during times of hyperglycemia but not hypoglycemia, thereby preventing inappropriately high levels of the hormone.5 Peripheral GLP-1 activates a cascade of centrally mediated signals that ultimately result in secretion of insulin by the pancreas and slowing of gastrointestinal motility.5 Lastly, GLP-1 exerts an anorexic effect by acting on central pathways that mediate satiation.6
Bioactive forms of GLP-1 are rapidly degraded in the circulation by the dipeptidyl peptidase-4 enzyme. GLP-1 receptor agonists have slightly altered molecular structure and longer duration of action than native GLP-1. Short-acting GLP-1 agonists (eg, exenatide, lixisenatide) have more effect on gastric emptying and lower postprandial blood glucose levels, whereas long-acting GLP-1 agonists (eg, liraglutide, albiglutide, dulaglutide, semaglutide, exenatide) have a greater effect on fasting glucose levels.4
Effects on HbA1c and weight loss
Of the current GLP-1 agonists, exenatide and liraglutide have been on the market the longest, thus studied more in terms of weight reduction.
Exenatide. Exenatide BID was the first GLP-1 agonist, approved by the US Food and Drug Administration (FDA) in 2005 for the treatment of type 2 DM. In a 30-week triple-blind, placebo-controlled study of 336 patients already on background therapy with metformin, progressive weight loss was noted with exenatide 5 μg (−1.6 ± 0.4 kg) and exenatide 10 μg (−2.8 ± 0.5 kg) compared with placebo (−0.3 ± 0.3 kg; P < .001).15 A meta-analysis of 14 trials with 2,583 patients showed significant weight reduction with both exenatide 5 μg twice daily (a difference of −0.56 kg, 95% confidence interval [CI] −1.07 to −0.06, P = .0002) in 8 trials and exenatide 10 μg twice daily (a difference of −1.24 kg, 95% CI −1.69 to −0.78, P < .001) in 12 trials, after treatment for more than 16 weeks.16
Liraglutide. Liraglutide has a longer half-life than exenatide and is administered once daily. It is not a first-line therapy for type 2 DM and is recommended as an add-on. Approved daily doses for type 2 DM are 1.2 mg and 1.8 mg.
Multiple studies of glycemic control and weight loss with liraglutide have been conducted since its introduction to the US market in 2010. In the Liraglutide Effect and Action in Diabetes (LEAD) series of trials, liraglutide use as monotherapy or in combination with oral agents was associated with significant dose-dependent weight loss.17 Liraglutide monotherapy (at 1.2 mg and 1.8 mg) compared with glimepiride in the LEAD-3 trial led to significant weight reduction (2.1 kg and 2.5 kg, respectively, P < .001) after 16 weeks, and was sustained up to 52 weeks.18 Addition of liraglutide (at 1.2 mg and 1.8 mg) to metformin plus rosiglitazone resulted in significant weight loss (1.02 kg and 2.02 kg, respectively) whereas the addition of placebo caused a 0.6-kg weight gain (P < .001).19 The SCALE study randomized 846 adults with type 2 DM who were overweight to obese (body mass index [BMI] ≥ 27 kg/m2), were taking 0 to 3 oral antihyperglycemic agents (metformin, thiazolidinedione, and a sulfonylurea), and had stable body weight and an HbA1c of 7% to 10% to liraglutide 1.8 mg, liraglutide 3.0 mg, or placebo. Mean weight loss after 56 weeks was 6.0% (6.4 kg) with liraglutide 1.8 mg, 4.7% (5.0 kg) with liraglutide 3.0 mg, and 2.0% (2.2 kg) with placebo.20
In 2016, high-dose once-daily liraglutide 3.0 mg (Saxenda) was approved by the FDA for weight loss. In a double-blind randomized trial of liraglutide 3.0 mg vs placebo in patients who had a BMI of at least 30 or who had a BMI of at least 27 plus treated or untreated dyslipidemia or hypertension, Pi-Sunyer et al21 reported a mean weight reduction of 8.4 ± 7.3 kg with liraglutide vs 2.8 ± 6.5 kg with placebo (a difference of −5.6 kg, 95% CI −6.0 to −5.1, P < .001) after 56 weeks. Furthermore, 63.2% of patients in the liraglutide group lost at least 5% of body weight vs 27.1% with placebo, and 33.1% in the liraglutide group lost 10% or more of body weight vs 10.6% in the placebo group (P < .001).21 Of note, liraglutide 3.0 mg is not indicated for type 2 DM per se.
In a 2012 meta-analysis of randomized controlled trials of adults with and without type 2 DM, with a BMI of 25 or greater, and who received GLP-1 receptor agonists at clinically relevant doses (exenatide ≥ 10 μg/day, exenatide ≥ 2 mg/week, or liraglutide ≥ 1.2 mg/day), those taking GLP-1 receptor agonists had more weight loss than those on a control intervention (oral antihyperglycemic, insulin, or placebo) at a minimum of 20 weeks, with a weighted mean difference −2.9 kg (95% CI −3.6 to −2.2) in 21 trials and 6,411 participants.22
GLP-1 agonists currently being investigated for obesity treatment are lixisenatide, albiglutide, taspoglutide, and oxyntomodulin.23
Cardiovascular outcomes
The presence of GLP-1 receptors in blood vessels and myocardium has led to the hypothesis that GLP-1 receptor agonists can improve cardiovascular disease outcomes.24 In the pivotal Liraglutide Effect and Action in Diabetes: Evaluation of Cardiovascular Outcome Results (LEADER) trial, 9,340 patients with type 2 DM and increased cardiovascular disease risk were randomized to liraglutide vs placebo.25 The hazard ratio (HR) for time to the primary end point of cardiovascular death, nonfatal myocardial infarction, or nonfatal stroke was 0.87 (P = .01 for superiority, P < .001 for noninferiority) for liraglutide compared with placebo after 3.8 years. The incidence of death from any cause or cardiovascular cause was also lower with liraglutide.25
Adverse effects
Tolerable transient nausea and vomiting are reported adverse effects; these symptoms occur early in therapy, usually resolve in 4 to 8 weeks, and appear to be associated with greater weight loss.26 Although no causal relationship between GLP-1 receptor agonist use and pancreatitis or pancreatic cancer has been established to date, several cases of acute pancreatitis have been reported.25 Alternative therapies should be considered in patients with a history of or risk factors for pancreatitis.
Combined with insulin
A product that combines insulin glargine and lixisenatide (Soliqua) is FDA-approved for patients with type 2 DM. In a 30-week randomized controlled trial of the combination product vs insulin glargine alone in patients with type 2 DM not controlled on basal insulin with or without up to 2 oral agents, the combination product resulted in an HbA1c reduction from baseline of 1.1% vs 0.6% for insulin glargine alone (P < .001).27 Mean body weight decreased by 0.7 kg with the combination product and increased by 0.7 kg with insulin glargine (P < .001).27 In a 24-week study of a lixisenatide-insulin glargine combination vs insulin glargine in insulin-naïve patients taking metformin, there was a reduction in HbA1c of about −1.7% from baseline in both groups, while the combination group had a 1-kg weight reduction compared with a 0.5-kg weight increase in the insulin glargine group (P < .001).28
SGLT-2 INHIBITORS
Mechanism of action
In a healthy normoglycemic person, about 180 g of glucose per day is filtered into the glomerular filtrate and reabsorbed into the circulation.29 SGLT-2 facilitates the reabsorption of glucose in the proximal convoluted tubule of the kidneys. Approximately 90% of glucose reabsorption is mediated by SGLT-2 found in the S1 and S2 segments of the proximal convoluted tubule, and the remaining 10% by SGLT-1 in the S3 segment. At serum glucose levels above 180 g, the reabsorptive capacity of the nephron is overwhelmed, resulting in glycosuria.30 SGLT-2 expression is also increased in patients with diabetes, thus leading to increased glucose reabsorption into the circulation, further contributing to hyperglycemia.30 Inhibition of SGLT-2 alleviates hyperglycemia by decreasing glucose reabsorption (30% to 50% of filtered glucose) in the kidneys and by increasing excretion (50 mg to 80 mg of glucose) in the urine.31 SGLT-2 inhibitors currently FDA-approved are canagliflozin (Invokana), dapagliflozin (Farxiga), and empagliflozin (Jardiance).
HbA1c
SGLT-2 inhibitors have relatively weak glycemic efficacy. A meta-analysis of SGLT-2 inhibitors vs other antidiabetic medications or placebo found that SGLT-2 inhibitors appeared to have a “favorable effect” on HbA1c, with a mean difference vs placebo of −0.66% (95% CI −0.73% to −0.58%) and a mean difference vs other antihyperglycemic medications of −0.06% (95% CI 0.18% to 0.05%).32
Weight loss
The same meta-analysis found that SGLT-2 inhibitors reduced body weight (mean difference −1.8 kg, 95% CI −3.50 kg to −0.11 kg).32 And in a randomized controlled trial, monotherapy with canagliflozin 100 mg/day and 300 mg/day resulted in body weight reduction of 2.2% (1.9 kg) and 3.3% (−2.9 kg), respectively, after 26 weeks.33 A Japanese study showed a dose-related total body weight loss with empagliflozin vs placebo ranging from 2.5 ± 0.2 kg (5-mg dose) to 3.1 ± 0.2 kg (50-mg dose) after 12 weeks.34 Bolinder et al35 reported that adding dapagliflozin 10 mg to metformin in patients with type 2 DM reduced total body weight by −2.96 kg (95% CI −3.51 to −2.41, P < .001) at week 24. Whole-body dual-energy x-ray absorptiometry and magnetic resonance imaging findings in this study revealed a decrease in fat mass and visceral and subcutaneous adipose tissue after treatment with dapagliflozin, thus suggesting urinary loss of glucose (and hence caloric loss) contributing to weight reduction in addition to initial weight loss from fluid loss due to osmotic diuresis.35 A continuous decline in total body weight was observed in a 78-week extension study resulting in −4.54 kg (95% CI −5.43 to −3.66 kg) at week 102, along with further reduction in total body fat mass as measured by dual-energy x-ray absorptiometry.36
Cardiovascular outcomes
The landmark study Empagliflozin, Cardiovascular Outcomes and Mortality in Type 2 Diabetes (EMPA-REG) involving 7,020 patients was the first large cardiovascular outcomes trial in patients with type 2 DM and overt cardiovascular disease. A relative risk reduction of 14% (12.1% to 10.5%, HR 0.86, 95% CI 0.74 to 0.99) in major adverse cardiovascular events (cardiovascular death, nonfatal myocardial infarction, and nonfatal stroke) was observed with empagliflozin.37 Rates of all-cause mortality and hospitalization for heart failure relative risk reductions were 32% (8.3% to 5.7%; HR 0.68 [0.57, 0.8]) and 35% (4.1% to 2.7%; HR 0.65 [0.50, 0.85]), respectively, with empagliflozin. The mechanism behind this cardiovascular benefit is unknown but is currently being explored.37
Adverse effects
Increased risk of urinary tract and genital infections are known adverse effects of SGLT-2s. Other effects noted include postural hypotension from volume depletion and a transient increase in serum creatinine and decrease in glomerular filtration.29
NEUROENDOCRINE PEPTIDE HORMONE: AMYLIN ANALOGUES
Mechanism of action
Amylin is a 37-amino-acid neuroendocrine peptide hormone secreted primarily by pancreatic beta cells. It promotes early satiety, and its anorexigenic effects are mediated by its action on the neurons of the area postrema in the brain.38 After a meal, amylin decreases gastric acid secretion and slows gastric emptying. It is co-secreted with insulin in a 1:20 amylin-to-insulin ratio and inhibits glucagon secretion via a centrally mediated mechanism.39
Pramlintide (Symlin) is an amylin analogue administered subcutaneously immediately before major meals. It decreases postprandial glucose levels and has been approved by the FDA as an adjunct to prandial insulin in patients with type 1 and type 2 DM.40
HbA1c
Amylin secretion is impaired in type 1 and type 2 DM, and small but significant reductions in HbA1c have been observed with addition of pramlintide to usual insulin regimens. In patients with type 1 DM, HbA1c levels were reduced by 0.4% to 0.6% after 26 weeks on 30 μg 3 times daily to 60 μg 4 times daily of pramlintide added to insulin.41,42 And pramlintide 120 μg added to usual antihyperglycemic therapy in patients with type 2 DM has been reported to decrease HbA1c by 0.7% at week 16 or 26.43,44
Weight loss
A meta-analysis of 8 randomized controlled trials assessed the effects of pramlintide on glycemic control and weight in patients with type 2 DM treated with insulin and in obese patients without diabetes.45 In these trials, patients took at least 120 μg of pramlintide before 2 to 3 meals for at least 12 weeks; a total of 1,616 participants were included. In the type 2 DM group, pramlintide reduced body weight by 2.57 kg (95% CI −3.44 to −1.70 kg, P < .001) vs control, over 16 to 52 weeks.45 The nondiabetic obese group had a weight loss of −2.27 kg (95%CI −2.88 to −1.66 kg, P < .001) vs control.45
Pramlintide and a pramlintide-phentermine combination are currently under investigation for treatment of obesity.23
Cardiovascular outcomes
Cardiovascular outcomes in patients treated with pramlintide have not been studied to date, but reductions have been observed in markers of cardiovascular risk including high-sensitivity C-reactive protein and triglycerides.46
Adverse effects
Transient mild-to-moderate nausea is the most common adverse effect of pramlintide. Hypoglycemia has also been reported, more frequently in patients with type 1 DM, which is possibly associated with inadequate reduction in insulin.
ALPHA-GLUCOSIDASE INHIBITORS
Mechanism of action
Alpha-glucosidase inhibitors competitively inhibit the alpha-glucosidase enzymes at the brush border of the small intestine. Taken orally before meals, these drugs mitigate postprandial hyperglycemia by preventing the breakdown of complex carbohydrates into simpler monosaccharides, thus delaying their absorption.47 These agents may be used as monotherapy or in combination with other antihyperglycemic agents. They work independently from insulin, although they have been shown to potentiate GLP-1 secretion.48 Acarbose and miglitol are currently approved in the United States. Acarbose has been more extensively studied worldwide.
HbA1c
Alpha-glucosidase inhibitors have been reported to reduce mean HbA1c by 0.8% (95% CI −0.9% to −0.7%), as well as fasting and postprandial glucose, and postprandial insulin levels.49
Weight loss
There is conflicting evidence on whether alpha-glucosidase inhibitor therapy has a neutral or beneficial effect on body weight. A Cochrane meta-analysis observed significant BMI reduction with acarbose, although no effect on body weight was noted,49 whereas in another meta-analysis, body weight was significantly reduced by 0.96 kg (95% CI −1.80 to −0.12 kg) when acarbose was added to metformin.50 A review of pooled data from worldwide post-marketing studies for acarbose reported a weight reduction after 3 months of 0.98 ± 2.11 kg in overweight patients and 1.67 ± 3.02 kg in obese patients.51
Cardiovascular outcomes
In the Study to Prevent Non-Insulin-Dependent Diabetes Mellitus (STOP-NIDDM), when compared with placebo, treatment of patients with impaired glucose tolerance with acarbose significantly reduced the incidence of cardiovascular events (HR 0.51, 95% CI 0.28 to 0.95, P = .03), myocardial infarction (HR 0.09, 95% CI 0.01 to 0.72, P = .02), and newly diagnosed hypertension (HR 0.66, 95% CI 0.49 to 0.89, P = .006).52
Adverse effects
Although mild, gastrointestinal effects of flatulence and diarrhea can be bothersome and result in discontinuation of the drug in most patients.
METFORMIN
Mechanism of action
Metformin is the first-line antihyperglycemic agent for type 2 DM recommended by the American Diabetes Association and European Association for the Study of Diabetes.53,54 The main action of metformin is to decrease glucose production in the liver. In the small intestine, metformin stimulates the L cells to produce GLP-1, and in skeletal muscle, it increases glucose uptake and disposal.55
HbA1c
As monotherapy, metformin has resulted in HbA1c reductions of 0.88% to 1.2%.55
Weight loss
Reduced food intake56,57 and gastrointestinal intolerance58 occurring early in therapy have been noted to account for weight loss in short-term studies of non-diabetic obese patients treated with metformin.59 Long-term trials of patients with and without diabetes have yielded mixed results on weight reduction from metformin as monotherapy or adjunct therapy. In the United Kingdom Prospective Diabetes Study (UKPDS), metformin had resulted in approximately 1.5 kg of weight gain (slightly less than the 4-kg weight gain in the glibenclamide group).60 Improved antihyperglycemic efficacy of other antihyperglycemic agents (insulin, sulfonylureas, and thiazolidinediones) with addition of metformin led to dose-lowering of the antihyperglycemic agents, ultimately resulting in amelioration of weight gain; this has also led to small weight reductions in some studies.59 In the Diabetes Prevention Program study of patients with impaired glucose tolerance, metformin treatment resulted in an average weight loss of 2.1 kg compared with placebo (−0.1 kg) and lifestyle intervention (−5.6 kg; P <.001).61
Cardiovascular outcomes
Metformin has been observed to decrease micro- and macrovascular complications. Compared with diet alone, metformin was associated with a 39% reduction in the risk of myocardial infarction, and a 30% lower risk of a composite of macrovascular diseases (myocardial infarction, sudden death, angina, stroke, and peripheral disease).60
Adverse effects
The most common adverse effect of metformin is gastrointestinal intolerance from abdominal pain, flatulence, and diarrhea.62 Metformin-associated lactic acidosis is a serious and potentially life-threatening effect; and vitamin B12 deficiency may occur with long-term treatment.62
TAKE-HOME POINTS
As more medications and interventions are being developed to counter obesity, it also makes sense to select diabetes medications that do not contribute to weight gain in patients who are already overweight or obese. The effects of available medications can be maximized and treatment regimens individualized (based on patients’ needs and preferences, within the limitations of drug costs and side effects), along with lifestyle modification, to target diabesity.
- Sims EAH, Danforth E Jr, Horton ES, Bray GA, Glennon JA, Salans LB. Endocrine and metabolic effects of experimental obesity in man. Recent Prog Horm Res 1973; 29:457–496.
- Scheen AJ, Van Gaal LF. Combating the dual burden: therapeutic targeting of common pathways in obesity and type 2 diabetes. Lancet Diabetes Endocrinol 2014; 2:911–922.
- Kahn SE, Hull RL, Utzschneider KM. Mechanisms linking obesity to insulin resistance and type 2 diabetes. Nature 2006; 444:840–846.
- Iepsen EW, Torekov SS, Holst JJ. Therapies for inter-relating diabetes and obesity—GLP-1 and obesity. Expert Opin Pharmacother 2014; 15:2487–2500.
- Meier JJ, Nauck MA. Glucagon-like peptide 1(GLP-1) in biology and pathology. Diabetes Metab Res Rev 2005; 21:91–117.
- Turton MD, O’Shea D, Gunn I, et al. A role for glucagon-like peptide-1 in the central regulation of feeding. Nature 1996; 379:69–72.
- Drucker DJ. Glucagon-like peptides: regulators of cell proliferation, differentiation, and apoptosis. Mol Endocrinol 2003; 17:161–171.
- Shyangdan DS, Royle P, Clar C, Sharma P, Waugh N, Snaith A. Glucagon-like peptide analogues for type 2 diabetes mellitus. Cochrane Database Syst Rev 2011; 10:CD006423. doi:10.1002/14651858.CD006423.pub2.
- Byetta [package insert]. Wilmington, DE: AstraZeneca Pharmaceuticals LP; 2015. Available at http://www.azpicentral.com/byetta/pi_byetta.pdf. Accessed June 22, 2017.
- Victoza [package insert]. Bagsvaerd, Denmark: Novo Nordisk A/S; 2016. Available at http://www.novo-pi.com/victoza.pdf. Accessed June 22, 2017.
- Bydureon [package insert]. Wilmington, DE: AstraZeneca Pharmaceuticals LP; 2015. Available at http://www.azpicentral.com/bydureon/pi_bydureon.pdf. Accessed June 22, 2017.
- Tanzeum [package insert]. Wilmington, DE: GlaxoSmithKline; 2016. Available at https://www.gsksource.com/pharma/content/dam/GlaxoSmithKline/US/en/Prescribing_Information/Tanzeum/pdf/TANZEUM-PI-MG-IFU-COMBINED.PDF. Accessed June 22, 2017.
- Trulicity [package insert]. Indianapolis, IN: Eli Lilly and Company 2014. Available at http://pi.lilly.com/us/trulicity-uspi.pdf. Accessed June 22, 2017.
- Adlyxin [package insert]. Bridgewater, NJ: Sanofi-Aventis U.S. LLC; 2016. Available at http://products.sanofi.us/adlyxin/adlyxin.pdf. Accessed June 22, 2017.
- DeFronzo RA, Ratner RE, Han J, Kim DD, Fineman MS, Baron AD. Effects of exenatide (exendin-4) on glycemic control and weight over 30 weeks in metformin-treated patients with type 2 diabetes. Diabetes Care 2005; 28:1092–1100.
- Nikfar S, Abdollahi M, Salari P. The efficacy and tolerability of exenatide in comparison to placebo; a systematic review and meta-analysis of randomized clinical trials. J Pharm Pharm Sci 2012; 15:1–30.
- Blonde L, Russell-Jones D. The safety and efficacy of liraglutide with or without oral antidiabetic drug therapy in type 2 diabetes: an overview of the LEAD 1-5 studies. Diabetes Obes Metab 2009; 11(suppl 3):26–34.
- Garber A, Henry R, Ratner R, et al; LEAD-3 (Mono) Study Group. Liraglutide versus glimepiride monotherapy for type 2 diabetes (LEAD-3 Mono): a randomised, 52-week, phase III, double-blind, parallel-treatment trial. Lancet 2009; 373:473–481.
- Zinman B, Gerich J, Buse JB, et al; LEAD-4 Study Investigators. Efficacy and safety of the human glucagon-like peptide-1 analog liraglutide in combination with metformin and thiazolidinedione in patients with type 2 diabetes (LEAD-4 Met+TZD). Diabetes Care 2009; 32:1224–1230.
- Davies MJ, Bergenstal R, Bode B, et al. Efficacy of liraglutide for weight loss among patients with type 2 diabetes: the SCALE Diabetes Randomized Clinical Trial. JAMA 2015; 314:687–699.
- Pi-Sunyer X, Astrup A, Fujioka K, et al; SCALE Obesity and Prediabetes NN8022-1839 Study Group. A randomized, controlled trial of 3.0 mg of liraglutide in weight management. N Engl J Med 2015; 373:11–22.
- Vilsboll T, Christensen M, Junker AE, Knop FK, Gluud LL. Effects of glucagon-like peptide-1 receptor agonists on weight loss: systematic review and meta-analyses of randomised controlled trials. BMJ 2012; 344:d7771.
- Valsamakis G, Konstantakou P, Mastorakos G. New targets for drug treatment of obesity. Annu Rev Pharmacol Toxicol 2017; 57:585–605.
- Sivertsen J, Rosenmeier J, Holst JJ, Vilsboll T. The effect of glucagon-like peptide 1 on cardiovascular risk. Nat Rev Cardiol 2012; 9:209–222.
- Marso SP, Daniels GH, Brown-Frandsen K, et al; LEADER Steering Committee; LEADER Trial Investigators. Liraglutide and cardiovascular outcomes in type 2 diabetes. N Engl J Med 2016; 375:311–322.
- Lean ME, Carraro R, Finer N, et al; NN8022-1807 Investigators. Tolerability of nausea and vomiting and associations with weight loss in a randomized trial of liraglutide in obese, non-diabetic adults. Int J Obes (Lond) 2014; 38:689–697.
- Aroda VR, Rosenstock J, Wysham C, et al; LixiLan-L Trial Investigators. Efficacy and safety of lixilan, a titratable fixed-ratio combination of insulin glargine plus lixisenatide in type 2 diabetes inadequately controlled on basal insulin and metformin: the LixiLan-L Randomized Trial. Diabetes Care 2016; 39:1972–1980.
- Rosenstock J, Diamant M, Aroda VR, et al; LixiLan PoC Study Group. Efficacy and safety of LixiLan, a titratable fixed-ratio combination of lixisenatide and insulin glargine, versus insulin glargine in type 2 diabetes inadequately controlled on metformin monotherapy: the LixiLan Proof-of-Concept Randomized Trial. Diabetes Care 2016; 39:1579–1586.
- Monica Reddy RP, Inzucchi SE. SGLT2 inhibitors in the management of type 2 diabetes. Endocrine 2016; 53:364–372.
- DeFronzo RA, Davidson JA, Del Prato S. The role of the kidneys in glucose homeostasis: a new path towards normalizing glycaemia. Diabetes Obes Metab 2012; 14:5–14.
- Liu JJ, Lee T, DeFronzo RA. Why do SGLT2 inhibitors inhibit only 30-50% of renal glucose reabsorption in humans? Diabetes 2012; 61:2199–2204.
- Vasilakou D, Karagiannis T, Athanasiadou E, et al. Sodium-glucose cotransporter 2 inhibitors for type 2 diabetes: a systematic review and meta-analysis. Ann Intern Med 2013; 159:262–274.
- Stenlof K, Cefalu WT, Kim KA, et al. Efficacy and safety of canagliflozin monotherapy in subjects with type 2 diabetes mellitus inadequately controlled with diet and exercise. Diabetes Obes Metab 2013; 15:372–382.
- Kadowaki T, Haneda M, Inagaki N, et al. Empagliflozin monotherapy in Japanese patients with type 2 diabetes mellitus: a randomized, 12-week, double-blind, placebo-controlled, phase II trial. Adv Ther 2014; 31:621–638.
- Bolinder J, Ljunggren O, Kullberg J, et al. Effects of dapagliflozin on body weight, total fat mass, and regional adipose tissue distribution in patients with type 2 diabetes mellitus with inadequate glycemic control on metformin. J Clin Endocrinol Metab 2012; 97:1020–1031.
- Bolinder J, Ljunggren O, Johansson L, et al. Dapagliflozin maintains glycaemic control while reducing weight and body fat mass over 2 years in patients with type 2 diabetes mellitus inadequately controlled on metformin. Diabetes Obes Metab 2014; 16:159–169.
- Zinman B, Wanner C, Lachin JM, et al; EMPA-REG OUTCOME Investigators. Empagliflozin, cardiovascular outcomes, and mortality in type 2 diabetes. N Engl J Med 2015; 373:2117–2128.
- Lutz TA. Effects of amylin on eating and adiposity. Handb Exp Pharmacol 2012; (209):231–250.
- Hieronymus L, Griffin S. Role of amylin in type 1 and type 2 diabetes. Diabetes Educ 2015; 41(suppl 1):47S–56S.
- Aronoff SL. Rationale for treatment options for mealtime glucose control in patients with type 2 diabetes. Postgrad Med 2017; 129:231–241.
- Ratner RE, Dickey R, Fineman M, et al. Amylin replacement with pramlintide as an adjunct to insulin therapy improves long-term glycaemic and weight control in type 1 diabetes mellitus: a 1-year, randomized controlled trial. Diabet Med 2004; 21:1204–1212.
- Edelman S, Garg S, Frias J, et al. A double-blind, placebo-controlled trial assessing pramlintide treatment in the setting of intensive insulin therapy in type 1 diabetes. Diabetes Care 2006; 29:2189–2195.
- Riddle M, Frias J, Zhang B, et al. Pramlintide improved glycemic control and reduced weight in patients with type 2 diabetes using basal insulin. Diabetes Care 2007; 30:2794–2799.
- Hollander PA, Levy P, Fineman MS, et al. Pramlintide as an adjunct to insulin therapy improves long-term glycemic and weight control in patients with type 2 diabetes: a 1-year randomized controlled trial. Diabetes Care 2003; 26:784–790.
- Singh-Franco D, Perez A, Harrington C. The effect of pramlintide acetate on glycemic control and weight in patients with type 2 diabetes mellitus and in obese patients without diabetes: a systematic review and meta-analysis. Diabetes Obes Metab 2011; 13:169–180.
- Wysham C, Lush C, Zhang B, Maier H, Wilhelm K. Effect of pramlintide as an adjunct to basal insulin on markers of cardiovascular risk in patients with type 2 diabetes. Curr Med Res Opin 2008; 24:79–85.
- Bischoff H. Pharmacology of alpha-glucosidase inhibition. Eur J Clin Invest 1994; 24(suppl 3):3–10.
- Lee A, Patrick P, Wishart J, Horowitz M, Morley JE. The effects of miglitol on glucagon-like peptide-1 secretion and appetite sensations in obese type 2 diabetics. Diabetes Obes Metab 2002; 4:329–335.
- van de Laar FA, Lucassen PL, Akkermans RP, van de Lisdonk EH, Rutten GE, van Weel C. Alpha-glucosidase inhibitors for patients with type 2 diabetes: results from a Cochrane systematic review and meta-analysis. Diabetes Care 2005; 28:154–163.
- Gross JL, Kramer CK, Leitao CB, et al; Diabetes and Endocrinology Meta-analysis Group (DEMA). Effect of antihyperglycemic agents added to metformin and a sulfonylurea on glycemic control and weight gain in type 2 diabetes: a network meta-analysis. Ann Intern Med 2011; 154:672–679.
- Schnell O, Weng J, Sheu WH, et al. Acarbose reduces body weight irrespective of glycemic control in patients with diabetes: results of a worldwide, non-interventional, observational study data pool. J Diabetes Complications 2016; 30:628–637.
- Chiasson JL, Josse RG, Gomis R, Hanefeld M, Karasik A, Laakso M; STOP-NIDDM Trial Research Group. Acarbose treatment and the risk of cardiovascular disease and hypertension in patients with impaired glucose tolerance: the STOP-NIDDM trial. JAMA 2003; 290:486–494.
- Inzucchi SE, Bergenstal RM, Buse JB, et al. Management of hyperglycemia in type 2 diabetes, 2015: a patient-centered approach: update to a position statement of the American Diabetes Association and the European Association for the Study of Diabetes. Diabetes Care 2015; 38:140–149.
- American Diabetes Association. Pharmacologic approaches to glycemic treatment. Diabetes Care 2017; 40:S64–S74.
- Tan MH, Alquraini H, Mizokami-Stout K, MacEachern M. Metformin: From research to clinical practice. Endocrinol Metab Clin North Am 2016; 45:819–843.
- Paolisso G, Amato L, Eccellente R, et al. Effect of metformin on food intake in obese subjects. Eur J Clin Invest 1998; 28: 441–446.
- Lee A, Morley JE. Metformin decreases food consumption and induces weight loss in subjects with obesity with type II noninsulin-dependent diabetes. Obes Res 1998; 6: 47–53.
- Scarpello JH. Optimal dosing strategies for maximising the clinical response to metformin in type 2 diabetes. Br J Diabetes Vasc Dis 2001; 1: 28–36.
- Golay A. Metformin and body weight. Int J Obes (Lond) 2008; 32:61–72.
- UK Prospective Diabetes Study (UKPDS) Group. Effect of intensive blood-glucose control with metformin on complications in overweight patients with type 2 diabetes (UKPDS 34). Lancet 1998; 352:854–865.
- Knowler WC, Barrett-Connor E, Fowler SE, et al; Diabetes Prevention Program Research Group. Reduction in the incidence of type 2 diabetes with lifestyle intervention or metformin. N Engl J Med 2002; 346:393–403.
- Fujita Y, Inagaki N. Metformin: new preparations and nonglycemic benefits. Curr Diab Rep 2017; 17:5.
KEY POINTS
- The rationale for GLP-1 receptor agonists is that peripheral GLP-1 activates a cascade of centrally mediated signals that ultimately result in secretion of insulin by the pancreas and slowing of gastrointestinal motility. It also exerts an anorexic effect by acting on central pathways that mediate satiation.
- SGLT-2 inhibitors have relatively weak glycemic efficacy. Inhibition of SGLT-2 alleviates hyperglycemia by decreasing glucose reabsorption in the kidneys and by increasing excretion in the urine, suggesting urinary loss of glucose (and hence caloric loss). This is thought to contribute to weight reduction in addition to initial weight loss from fluid loss due to osmotic diuresis.
- Meta-analyses so far have shown that alpha-glucosidase inhibitors have either a neutral or a beneficial effect on body weight.

Diabetes management today: Issues in achieving glycemic goals

In 2001, it was projected that nearly 20 million Americans would have diabetes by 2025.1 But in 2015, 29 million Americans had been diagnosed with diabetes, exceeding the 2001 projection by 9 million. Newer projections are sobering—the prevalence of diabetes is estimated to increase from 9.3% of the population in 2012 to between 21% and 30% by 2050.2
As a result, most healthcare providers will face patients with diabetes or at risk for diabetes. Patients with diabetes today differ from those in the past in that increasing numbers of them are insulin resistant with impaired insulin secretion. Elements of metabolic syndrome including obesity, hypertension, high triglyceride levels, and low high-density lipoprotein levels increase the risk of diabetes and cardiovascular disease.
With the medications and treatments available today, how well are we practitioners doing in managing hyperglycemia? National Health and Nutrition Examination Survey data from 2005 to 2010 show that among patients taking diabetes medication, only 55% had controlled hemoglobin A1c (HbA1c) levels.3 The role of HbA1c in the assessment and management of patients with diabetes is discussed in this supplement by Marie E. McDonnell, MD, and Courtney Nagel Sandler, MD. Though an essential tool in blood glucose control, appropriate HbA1c target levels and reliability vary among patients. Interpretation of HbA1c may be difficult in some patients, and HbA1c levels should be tailored by balancing risks and benefits.
Diabetes management is complicated by the existence of comorbid cardiovascular disease. While a number of studies link intense glycemic control to improved cardiovascular outcomes in patients with diabetes, other studies have demonstrated higher morbidity and mortality associated with antihyperglycemic drugs. Om P. Ganda, MD, reviews the sometimes perplexing and confusing research on the effect of glucose-lowering drugs on cardiovascular outcomes, including results from a recently completed trial evaluating empagliflozin.
Further reflecting the complexity of the biologic mechanisms associated with treating diabetes, today we have 12 classes of drugs approved by the US Food and Drug Administration (FDA) for diabetes compared with the two classes (insulin and sulfonylureas) available in the 1980s. In the last decade, the FDA approved 14 noninsulin drugs in 5 classes. In this supplement, Kathie L. Hermayer, MD, MS, and Andrew Dake, MD, discuss the various noninsulin therapies and their use in achieving the balance of blood glucose control and reduced adverse events and hypoglycemia in patients with type 2 diabetes.
For patients with profound insulin deficiency, insulin remains the most important therapeutic option. Insulin is available in four general classes: rapid-, short-, intermediate-, and long-acting (and in premixed variations). The latest in insulin formulations include ultra-long-acting insulin, new concentrated insulin (glargine U-300 and lispro U-200), and inhaled insulin. A primer on these new insulin preparations and how they fit into clinical practice is provided by Luigi Meneghini, MD, MBA.
Finally, despite the availability of new medications for outpatient management of patients with diabetes, inpatient care represents the largest proportion of healthcare dollars spent on these patients. In inpatients, hyperglycemia is associated with a higher risk of complications, higher utilization of healthcare resources, and increased mortality rates. Guillermo E. Umpierrez, MD, CDE, and I outline best practices to achieve glycemic control and avoid hypoglycemia in critically and noncritically ill inpatients.
The growing number of patients with diabetes and the variety of therapeutic options available present physicians with many considerations in achieving glycemic goals. With great enthusiasm, I invite you to read this supplement on diabetes and hope you find it worthwhile and useful in elucidating issues in the management of diabetes today.
- Boyle JP, Honeycutt AA, Narayan KM, et al. Projection of diabetes burden through 2050: impact of changing demography and disease prevalence in the U.S. Diabetes Care 2001; 24:1936–1940.
- Boyle JP, Thompson TJ, Gregg EW, Baker LE, Williamson DF. Projection of the year 2050 burden of diabetes in the US adult population: dynamic modeling of incidence, mortality, and prediabetes prevalence. Popul Health Metr 2010; 8:29.
- Selvin E, Parrinello CM, Sacks DB, Coresh J. Trends in prevalence and control of diabetes in the United States, 1988-1994 and 1999-2010. Ann Intern Med 2014; 160:517–525.
In 2001, it was projected that nearly 20 million Americans would have diabetes by 2025.1 But in 2015, 29 million Americans had been diagnosed with diabetes, exceeding the 2001 projection by 9 million. Newer projections are sobering—the prevalence of diabetes is estimated to increase from 9.3% of the population in 2012 to between 21% and 30% by 2050.2
As a result, most healthcare providers will face patients with diabetes or at risk for diabetes. Patients with diabetes today differ from those in the past in that increasing numbers of them are insulin resistant with impaired insulin secretion. Elements of metabolic syndrome including obesity, hypertension, high triglyceride levels, and low high-density lipoprotein levels increase the risk of diabetes and cardiovascular disease.
With the medications and treatments available today, how well are we practitioners doing in managing hyperglycemia? National Health and Nutrition Examination Survey data from 2005 to 2010 show that among patients taking diabetes medication, only 55% had controlled hemoglobin A1c (HbA1c) levels.3 The role of HbA1c in the assessment and management of patients with diabetes is discussed in this supplement by Marie E. McDonnell, MD, and Courtney Nagel Sandler, MD. Though an essential tool in blood glucose control, appropriate HbA1c target levels and reliability vary among patients. Interpretation of HbA1c may be difficult in some patients, and HbA1c levels should be tailored by balancing risks and benefits.
Diabetes management is complicated by the existence of comorbid cardiovascular disease. While a number of studies link intense glycemic control to improved cardiovascular outcomes in patients with diabetes, other studies have demonstrated higher morbidity and mortality associated with antihyperglycemic drugs. Om P. Ganda, MD, reviews the sometimes perplexing and confusing research on the effect of glucose-lowering drugs on cardiovascular outcomes, including results from a recently completed trial evaluating empagliflozin.
Further reflecting the complexity of the biologic mechanisms associated with treating diabetes, today we have 12 classes of drugs approved by the US Food and Drug Administration (FDA) for diabetes compared with the two classes (insulin and sulfonylureas) available in the 1980s. In the last decade, the FDA approved 14 noninsulin drugs in 5 classes. In this supplement, Kathie L. Hermayer, MD, MS, and Andrew Dake, MD, discuss the various noninsulin therapies and their use in achieving the balance of blood glucose control and reduced adverse events and hypoglycemia in patients with type 2 diabetes.
For patients with profound insulin deficiency, insulin remains the most important therapeutic option. Insulin is available in four general classes: rapid-, short-, intermediate-, and long-acting (and in premixed variations). The latest in insulin formulations include ultra-long-acting insulin, new concentrated insulin (glargine U-300 and lispro U-200), and inhaled insulin. A primer on these new insulin preparations and how they fit into clinical practice is provided by Luigi Meneghini, MD, MBA.
Finally, despite the availability of new medications for outpatient management of patients with diabetes, inpatient care represents the largest proportion of healthcare dollars spent on these patients. In inpatients, hyperglycemia is associated with a higher risk of complications, higher utilization of healthcare resources, and increased mortality rates. Guillermo E. Umpierrez, MD, CDE, and I outline best practices to achieve glycemic control and avoid hypoglycemia in critically and noncritically ill inpatients.
The growing number of patients with diabetes and the variety of therapeutic options available present physicians with many considerations in achieving glycemic goals. With great enthusiasm, I invite you to read this supplement on diabetes and hope you find it worthwhile and useful in elucidating issues in the management of diabetes today.
- Boyle JP, Honeycutt AA, Narayan KM, et al. Projection of diabetes burden through 2050: impact of changing demography and disease prevalence in the U.S. Diabetes Care 2001; 24:1936–1940.
- Boyle JP, Thompson TJ, Gregg EW, Baker LE, Williamson DF. Projection of the year 2050 burden of diabetes in the US adult population: dynamic modeling of incidence, mortality, and prediabetes prevalence. Popul Health Metr 2010; 8:29.
- Selvin E, Parrinello CM, Sacks DB, Coresh J. Trends in prevalence and control of diabetes in the United States, 1988-1994 and 1999-2010. Ann Intern Med 2014; 160:517–525.

Inpatient hyperglycemia management: A practical review for primary medical and surgical teams
Hyperglycemia in hospitalized patients, with or without diabetes, is associated with adverse outcomes including increased rates of infection and mortality and longer hospital length of stay.1–3 The rates of complications and mortality are even higher in hyperglycemic patients without a history of diabetes than in those with diabetes.1,2 Randomized clinical trials in critically ill and noncritically ill hyperglycemic patients demonstrate that improved glycemic control can reduce hospital complications, systemic infections, and hospitalization cost.4–6 However, intensive glycemic therapy is associated with increased risk of hypoglycemia, which is independently associated with increased morbidity and mortality in hospitalized patients. The concern about hypoglycemia has led to revised blood glucose target recommendations from professional organizations and a search for alternative treatment options.
This manuscript provides a review of updated recommendations for the management of inpatients with hyperglycemia in the critical care and general medical and surgical settings.
HYPERGLYCEMIA IN CRITICAL CARE SETTINGS
A substantial body of evidence links hyperglycemia in critically ill patients to higher rates of hospital complications, longer hospital stay, higher healthcare resource utilization, and greater hospital mortality.7,8 Although evidence from several cohort studies and randomized clinical trials suggests that tight glucose control can reduce hospital complications and mortality,9,10 this target has been difficult to achieve without increasing the risk of severe hypoglycemia. In addition, data from trials using intense glycemic control in patients in the intensive care unit (ICU) have failed to show a significant improvement in mortality and, in some instances, showed increased mortality risk associated with the therapy.11,12
The recommended target glucose levels are 140 to 180 mg/dL for most ICU patients.13 In agreement with this, the recent GLUCO-CABG trial reported no significant differences in the composite end points of complications and death between an intensive glucose target of 100 to 140 mg/dL and a conservative target of 141 to 180 mg/dL after cardiac surgery.14
HYPERGLYCEMIA IN NONCRITICAL CARE SETTINGS
In general medical and surgical patients, a strong association has been reported between hyperglycemia and prolonged hospital stay, infection, and disability after hospital discharge.1,15,16 For example, the risk of postoperative infections in patients undergoing general surgery was estimated to increase by 30% for every 40 mg/dL rise in glucose over normoglycemia (< 110 mg/dL).16 In general, appropriate glycemic control to maintain recommended glycemic levels in noncritically ill patients can reduce the risks and improve outcomes.
HYPOGLYCEMIA INCIDENCE
Hypoglycemia, defined as glucose less than 70 mg/dL, is a common complication of hyperglycemia treatment.17 Severe hypoglycemia is defined as glucose less than 40 mg/dL.18 The incidence of hypoglycemia in ICU trials ranged between 5% and 28%, depending on the intensity of glycemic control,19 and between 1% and 33% in non-ICU trials using subcutaneous (SC) insulin therapy.20 The most important hypoglycemia risk factors include older age, kidney failure, change in nutritional intake, interruption of glucose monitoring, previous insulin therapy, and failure to adjust therapy when glucose is trending down or steroid therapy is being tapered.21,22
In hospitalized patients with diabetes, hypoglycemia has been associated with poor outcomes, including a 66% increased risk of death within 1 year and 2.8 days longer hospital stay compared with patients without hypoglycemia.23 Hypoglycemia also has been associated with prolonged QT interval, ischemic electrocardiogram changes, angina, arrhythmias, and sudden death in patients with type 1 diabetes.24 Despite these observations, other studies have reported that the increased in-hospital mortality rate is limited to patients with spontaneous hypoglycemia rather than drug-associated hypoglycemia,25 raising the possibility that hypoglycemia may represent a marker of disease burden rather than be a direct cause of death.
INPATIENT ASSESSMENT OF HYPERGLYCEMIA
Clinical guidelines recommend glucose measurement in all patients admitted to the hospital.13,26 Patients with hyperglycemia (glucose > 140 mg/dL) and patients with a history of diabetes should undergo bedside point-of-care glucose testing before meals and at bedtime. Premeal testing should be done close to the time of the meal tray delivery and no longer than 1 hour before meals. For patients taking nothing by mouth or receiving continuous enteral nutrition, point-of-care testing is recommended every 4 to 6 hours.
Hemoglobin A1c (HbA1c) should be measured in patients with hyperglycemia and in those with diabetes if it has not been performed in the preceding 2 to 3 months. In hyperglycemic patients without a history of diabetes, an HbA1c of 6.5% or greater suggests that diabetes preceded hospitalization. In patients with diabetes, the HbA1c can help assess glycemic control prior to admission and tailor the treatment regimen at discharge.13,26
TARGET GLUCOSE LEVELS

Glycemic targets recommended by several organizations are shown in Table 1. For critically ill patients, most societies recommend glucose targets below 180 mg/dL, with the lower limit being anywhere from 110 to less than 150 mg/dL.
For patients in non-ICU settings, the Endocrine Society26 and the American Diabetes Association/American Association of Endocrinologists13 practice guidelines recommend premeal glucose levels below 140 mg/dL, and below 180 mg/dL if checked randomly. Higher glucose ranges (< 200 mg/dL) may be acceptable in terminally ill patients or in patients with severe comorbidities.26 Guidelines from the Joint British Diabetes Societies recommend targeting glucose levels between 108 and 180 mg/dL with an acceptable range of between 72 and 216 mg/dL.27
INPATIENT MANAGEMENT OF HYPERGLYCEMIA AND DIABETES
Insulin regimens in critical care settings
Insulin administration is the preferred way to control hyperglycemia in hospitalized patients. In critically ill patients, such as those with hypotension requiring pressor support, hyperglycemic crises, sepsis, or shock, insulin is best given via continuous intravenous (IV) infusion. The short half-life of IV insulin (< 15 minutes) allows flexibility in adjusting the infusion rate in the event of unpredicted changes in nutrition or the patient’s health. If the glucose level rises above 180 mg/dL, IV insulin infusion should be started to maintain levels below 180 mg/dL.13,26,28,29
A variety of infusion protocols have been shown to be effective in achieving glycemic control with a low rate of hypoglycemia. The ideal protocol should allow flexible rate adjustment taking into account current and previous glucose values as well as changes in infusion rate. Hourly glucose measurements until stable glycemic control is established, followed by point-of-care testing every 1 to 2 hours, is needed to assess response to therapy and prevent hypoglycemia.
Insulin regimens in noncritical care settings
For most patients in a general, non-ICU setting, SC insulin therapy with basal insulin administered once or twice daily, alone or in combination with prandial insulin, is effective and safe.13 Inhaled insulin is approved by the US Food and Drug Administration, but its use in the hospital has not been studied. The use of sliding-scale insulin is not acceptable as the single regimen in patients with diabetes, as it results in undesirable hypoglycemia and hyperglycemia.30Figure 1 presents an algorithm for selecting initial insulin treatment for patients with type 2 diabetes in the non-ICU setting.

Basal insulin prevents hyperglycemia during fasting states. Basal insulin is usually given as a once- or twice-daily long-acting insulin, such as glargine and detemir insulin. On occasion, twice-daily intermediate-acting insulin (neutral protamine Hagedorn; NPH) is used as a basal insulin.
Prandial insulin, also referred to as nutritional or bolus insulin, is given before meals as rapid-acting insulin (aspart, lispro, or glulisine) or short-acting insulin (regular) to prevent postmeal hyperglycemia. Rapid-acting insulin is preferred to regular insulin because of the faster onset and shorter duration of action, which may reduce the risk of hypoglycemia.
Correction or supplemental insulin is given to correct hyperglycemia when the glucose is above the goal. The same formulation is given together with prandial insulin.
Total daily dose of insulin is a measure that comprises basal and prandial insulin Figure 1 lists the recommended total daily dose for different clinical situations and patient populations.
Basal-bolus insulin usually refers to a regimen of long-acting basal insulin plus prandial insulin. In patients with adequate oral intake, the basal-bolus approach is preferred. The RABBIT 2 trial reported that basal-bolus regimens resulted in greater improvement in glucose control than sliding-scale regimens (correction insulin alone without basal or prandial components) in general medicine patients with type 2 diabetes.32 In general surgery patients, basal-bolus regimens significantly improved glucose control and reduced the numbers of postoperative complications, primarily wound infections compared with sliding-scale regimens.4
Multiple doses of NPH and regular insulin were compared with basal-bolus treatment with long-acting and rapid-acting insulin in two controlled trials in medical patients with type 2 diabetes.20,33 Both studies reported that treatment with NPH and regular insulin resulted in similar improvements in glycemic control and no difference in the rate of hypoglycemic events or in hospital length of stay, compared with basal-bolus insulin. Because NPH has a peak of action approximately 8 to 12 hours after injection, there is a risk of hypoglycemia in patients with poor oral intake.
In hospitalized patients who have reduced total caloric intake due to lack of appetite, acute illness, medical procedures, or surgical interventions, the Basal Plus trial34 reported that a single daily dose of glargine plus correction doses of rapid-acting insulin resulted in similar improvement in glycemic control and no difference in the frequency of hypoglycemia compared with a standard basal-bolus regimen. These results indicate that the basal-plus-correction regimen may be preferred for patients with poor or no oral intake, whereas an insulin regimen with basal, nutritional (basal-bolus), and correction components is preferred for patients with good nutritional intake.35
SC insulin dosing refers to insulin doses administered subcutaneously calculated based either on weight or on home insulin doses. For insulin-naive patients, the starting total daily dose of insulin can usually be computed as 0.4 to 0.5 U/kg/day. Higher starting doses are associated with greater odds of hypoglycemia than doses lower than 0.2 U/kg/day.36 In elderly patients and those with impaired renal function, lower initial daily doses (≤ 0.3 U/kg) may reduce the risk of hypoglycemia.26
In patients treated with insulin prior to admission, the total daily insulin dose at home can be given as half long-acting basal insulin and half prandial insulin. The dose can be reduced by 20% to 25% to prevent hypoglycemia, particularly in those with poor or uncertain caloric intake.31
Noninsulin therapies

The use of oral antidiabetic agents is generally not recommended in hospitalized patients due to the limited data available on their safety and efficacy, frequent contraindications, risk of hypoglycemia, and slow onset of action that may preclude achieving rapid glycemic control and daily dose adjustments. Table 3 lists the pros and cons of these agents in hospitalized patients.
The safety and efficacy of sitagliptin, a dipeptidyl peptidase-4 inhibitor, for the management of inpatient hyperglycemia was evaluated in a randomized pilot study in patients with type 2 diabetes treated at home with diet, oral antidiabetic agents, or a low daily insulin dose (≤ 0.4 U/kg/day).37 Patients were randomized to one of two treatments:
- Sitagliptin alone or with low-dose glargine insulin
- Basal-bolus insulin regimen plus supplemental doses of insulin lispro.
Both treatment regimens resulted in similar improvement in mean daily glucose concentrations. However, patients admitted to the hospital with glucose levels above 180 mg/dL in the sitagliptin group had higher mean daily glucose levels than patients treated with basal-bolus or sitagliptin plus glargine.
Transitioning from IV to SC insulin
When patients in critical care units are ready to be transferred to a general medical floor, appropriate transition from IV insulin to scheduled SC insulin is needed to prevent rebound hyperglycemia. This is imperative in patients with type 1 diabetes in whom just a few hours without insulin can result in diabetic ketoacidosis.
There are three general ways to calculate the SC insulin dose during the transition period. The first two methods are weight-based and based on the home dose, as previously discussed. The third method is to extrapolate from the IV insulin. A common way is to sum up the total IV insulin dose in the past 6 or 8 hours and multiply by 3 or 4, and then reduce by 20% to achieve the basal insulin dose, presuming the patient had no oral intake on the IV insulin infusion. This last method is preferred in hemodynamically stable patients with stable insulin requirements.
If long-acting insulin is chosen as basal insulin, it should be given 2 to 4 hours before discontinuation of the IV insulin infusion. Intermediate-acting insulin should be given 1 to 2 hours before IV insulin discontinuation.
SPECIFIC SITUATIONS AND POPULATIONS
Type 1 diabetes
Patients with type 1 diabetes have minimal to absent pancreatic beta cell function and rely on the exogenous administration of insulin to maintain glucose homeostasis. They have worse glycemic control and higher rates of acute kidney injury than patients with type 2 diabetes; however, the impact of inpatient glycemic control on clinical outcomes has not been determined in patients with type 1 diabetes. Insulin therapy must provide both basal and nutritional components to achieve the target goals. It is important to ask the patient directly to determine the times and doses of prescribed insulin, medication adherence, recent dietary habits (including changes in appetite), and level of physical activity. This information will be used to guide insulin therapy.
A systematic review of 16 clinical studies reported that patients who possess excellent self-management skills can be suitable for successful inpatient diabetes self-management.38 The American Diabetes Association supports patient self-management of diabetes in the hospital.39 However, the competence and readiness of each patient with type 1 diabetes need to be carefully determined in an individualized manner. Potential candidates for inpatient self-management are those with unaltered mental status, proven proficient outpatient skills (eg, carbohydrate counting, frequent glucose monitoring, strong knowledge related to the management of insulin pump or injection techniques), and who are tolerating oral intake.
Enteral nutrition and tube feeding
Accidental dislodgement of feeding tubes, temporary discontinuation of nutrition due to nausea or for diagnostic testing, and cycling of enteral nutrition with oral intake in patients with an inconsistent appetite pose unique challenges in the hospital. Although it may be tempting to give basal and nutritional requirements to these patients as a single dose of long-acting insulin, this is not recommended. Low-dose basal insulin plus scheduled doses of short-acting (regular) insulin (every 6 hours) or rapid-acting insulin (every 4 hours) with correction insulin is often used. Some providers prefer giving intermediate-acting (NPH) plus short-acting (regular) insulin every 8 hours or every 12 hours.
It is generally accepted that diabetic enteral formulas that are low in carbohydrate and high in monounsaturated fatty acids are preferable to standard high-carbohydrate formulas in hospitalized patients with diabetes. In a meta-analysis, the postprandial rise in glucose was reduced by 20 to 30 mg/dL with the low-carbohydrate high-fat formulations compared with standard formulations.40
Parenteral nutrition
The use of parenteral nutrition has been linked to aggravation of hyperglycemia independent of a history of diabetes as well as a higher risk of complications, infections, sepsis, and death.41 Regular insulin can be added to the parenteral solution at a starting dose of 0.1 U/g of dextrose in nondiabetic patients and at 0.15 U/g of dextrose in patients with diabetes.42
Alternatively, insulin can be given as a continuous IV infusion. Hemodynamically stable patients with mild to moderate hyperglycemia can be managed with basal insulin plus scheduled or as-needed doses of short-acting (regular) insulin every 6 hours. To prevent waste, it is better to underestimate the insulin added to parenteral nutrition so as to avoid having to discontinue it prematurely or add additional glucose.
Glucocorticoids
Glucocorticoids typically raise glucose starting 4 to 6 hours after administration. Low doses of glucocorticoids given in the morning tend to raise the late morning to evening glucose levels without affecting the fasting glucose. In this situation, the patient may be managed on prandial insulin without long-acting basal insulin or with intermediate-acting insulin given in the morning. Higher glucocorticoid doses may raise fasting glucose levels, in which case basal-bolus insulin would be appropriate, with the basal component comprising about 30% and the bolus about 70% of the daily dose.26
Insulin pump
Approximately 400,000 US patients with diabetes use an insulin pump.43 Successful management of inpatient diabetes with the continuation of insulin pump therapy has been previously demonstrated in select patients. Clear hospital policies, procedures, and physicians’ orders with specifics on the type of diet, frequency of point-of-care glucose testing, and insulin doses (ie, basal rates, carbohydrate ratios, and correction formulas) should be in place. An inpatient diabetes specialist should assist with the assessment and management of a patient with an insulin pump.

If pump use is contraindicated (Table 4)44 or if inpatient diabetes resources are not available, discontinuation of insulin pump and transition to a basal-bolus insulin regimen (“pump holiday”) may be the safest and most appropriate step. Most patients knowledgeable in insulin pump therapy are able to display in their pump screen the average total daily insulin used for the past few days. Based on this, safe estimations of basal, bolus, and supplemental insulin can be calculated. To avoid severe hyperglycemia or ketoacidosis from lack of basal insulin, it is important to administer the basal insulin component at least 2 hours before disconnecting the insulin pump.
Concentrated insulins
U-500 regular insulin is concentrated insulin that delivers the same amount of units in one-fifth the volume of conventional insulins, which are U-100. Whereas there are 100 units of insulin in 1 mL for conventional insulins, there are 500 units of U-500 regular insulin in 1 mL. Its onset of action is similar to that of regular insulin, and the peak and duration are similar to that of NPH insulin. Concentrated insulin is often administered in the outpatient setting to patients who are insulin resistant and require close to 200 units a day. The U-500 pen device was approved in January 2016 and was projected to be available in April 2016. For now, it can only be procured in the vial form. This causes confusion in its dosing since it is given either with the usual insulin syringes, which are designed for U-100 insulin administration, or a tuberculin syringe, which is not marked in units but in milliliters.
Because of its unique nature and providers’ lack of familiarity with U-500, certain institutions have a policy for its use. In many institutions, the doses are confirmed by pharmacy staff and delivered by pharmacy to the patient’s medication bin predrawn in a tuberculin syringe.45 In addition, a study reported that many patients on U-500 at home required significantly lower doses of insulin (average dose of 100 U/day) while hospitalized patients could be managed with conventional insulin formulations.45
There are newer concentrated insulins in the market, such as insulin glargine 300 U/mL (Toujeo) and insulin lispro 200 U/mL (Humalog). These insulins, so far, come only in the pen device form and not in vials, obviating the need for dose calculations using a U-100 insulin syringe or tuberculin syringe. The efficacy and safety of these insulin formulations have not been determined in the hospital setting.
Transitioning from home to hospital
Transition to an outpatient setting requires planning and coordination. Although insulin is used in the hospital for most patients with diabetes, many patients do not require insulin after discharge. On the other hand, diabetes regimens sometimes need intensification in other patients. One study showed that patients with acceptable diabetes control (HbA1c < 7.5%) near or on admission could be discharged on their prehospitalization treatment regimen, while those with HbA1c between 7.5% and 9% could be discharged on oral agents plus basal insulin at 50% of the hospital basal dose.46 Additionally, patients with an HbA1c of 9% to 10% should be discharged on a basal-bolus regimen or on a combination of oral agents plus basal insulin at 80% of hospital dose, with a reduction in HbA1c seen 12 weeks after discharge.
SUMMARY
Inpatient hyperglycemia is common and is associated with increased risk of hospital complications, higher healthcare resource utilization, and higher rates of in-hospital mortality. In the critically ill, IV insulin is most appropriate, with a starting threshold no higher than 180 mg/dL. Once IV insulin is started, the glucose level should be maintained between 140 and 180 mg/dL.
In noncritically ill patients, a basal-bolus regimen with basal, prandial, and correction components is preferred for patients with good nutritional intake. In contrast, a single dose of long-acting insulin plus correction insulin is preferred for patients with poor or no oral intake. Preliminary data indicate that incretin therapy has the potential to improve glycemic control in patients with mild to moderate hyperglycemia and a low risk of hypoglycemia.
Transition to an outpatient setting requires planning and coordination. Measuring HbA1c at admission is important to assess preadmission glycemic control and to tailor the treatment regimen at discharge. Patients with acceptable diabetes control could be discharged on their prehospitalization treatment regimen. Patients with suboptimal control should have more intensified therapy.
Dr. Umpierrez is supported in part by research grants from the American Diabetes Association (1-14-LLY-36), PHS grant UL1 RR025008 from the Clinical Translational Science Award Program (M01 RR-00039), and grants from the National Institutes of Health and the National Center for Research Resources. He has received unrestricted research support for inpatient studies (at Emory University) from Sanofi, Merck, Novo Nordisk, and Boehringer Ingelheim, and has received consulting fees and/or honoraria for membership on advisory boards from Novo Nordisk, Sanofi, Merck, Boehringer Ingelheim, and Regeneron.
- Umpierrez GE, Isaacs SD, Bazargan N, You X, Thaler LM, Kitabchi AE. Hyperglycemia: an independent marker of in-hospital mortality in patients with undiagnosed diabetes. J Clin Endocrinol Metab 2002; 87:978–982.
- Falciglia M, Freyberg RW, Almenoff PL, D’Alessio DA, Render ML. Hyperglycemia-related mortality in critically ill patients varies with admission diagnosis. Crit Care Med 2009; 37:3001–3009.
- Kotagal M, Symons RG, Hirsch IB, et al. Perioperative hyperglycemia and risk of adverse events among patients with and without diabetes. Ann Surg 2015; 261:97–103.
- Umpierrez GE, Smiley D, Jacobs S, et al. Randomized study of basal-bolus insulin therapy in the inpatient management of patients with type 2 diabetes undergoing general surgery (RABBIT 2 surgery). Diabetes Care 2011; 34:256–261.
- Murad MH, Coburn JA, Coto-Yglesias F, et al. Glycemic control in non-critically ill hospitalized patients: a systematic review and meta-analysis. J Clin Endocrinol Metab 2012; 97:49–58.
- Schroeder JE, Liebergall M, Raz I, et al. Benefits of a simple glycaemic protocol in an orthopaedic surgery ward: a randomized prospective study. Diabetes Metab Res Rev 2012; 28:71–75.
- Clement S, Braithwaite SS, Magee MF, et al; American Diabetes Association in Hospitals Writing Committee. Management of diabetes and hyperglycemia in hospitals. Diabetes Care 2004; 27:553–591.
- Inzucchi SE. Clinical practice: Management of hyperglycemia in the hospital setting. N Engl J Med 2006; 355:1903–1911.
- van den Berghe G, Wouters P, Weekers F, et al. Intensive insulin therapy in the critically ill patients. N Engl J Med 2001; 345:1359–1367.
- van den Berghe G, Wilmer A, Hermans G, et al. Intensive insulin therapy in the medical ICU. N Engl J Med 2006; 354:449–461.
- NICE-SUGAR Study Investigators; Finfer S, Chittock DR, Su SY, et al. Intensive versus conventional glucose control in critically ill patients. N Engl J Med 2009; 360:1283–1297.
- Griesdale DE, de Souza RJ, van Dam RM, et al. Intensive insulin therapy and mortality among critically ill patients: a meta-analysis including NICE-SUGAR study data. CMAJ 2009; 180:821–827.
- Moghissi ES, Korytkowski MT, DiNardo M, et al. American Association of Clinical Endocrinologists and American Diabetes Association consensus statement on inpatient glycemic control. Diabetes Care 2009; 32:1119–1131.
- Umpierrez G, Cardona S, Pasquel F, et al. Randomized controlled trial of intensive versus conservative glucose control in patients undergoing coronary artery bypass graft surgery: GLUCO-CABG Trial. Diabetes Care 2015; 38:1665–1672.
- Montori VM, Bistrian BR, McMahon MM. Hyperglycemia in acutely ill patients. JAMA 2002; 288:2167–2169.
- Ramos M, Khalpey Z, Lipsitz S, et al. Relationship of perioperative hyperglycemia and postoperative infections in patients who undergo general and vascular surgery. Ann Surg 2008; 248:585–591.
- American Diabetes Association. Standards of medical care in diabetes—2010. Diabetes Care 2010; 33(suppl 1):S11–S61.
- Cryer PE, Axelrod L, Grossman AB, et al. Evaluation and management of adult hypoglycemic disorders: an Endocrine Society Clinical Practice Guideline. J Clin Endocrinol Metab 2009; 94:709–728.
- Krikorian A, Ismail-Beigi F, Moghissi ES. Comparisons of different insulin infusion protocols: a review of recent literature. Current Opin Clin Nutr Metab Care 2010; 13:198–204.
- Umpierrez GE, Hor T, Smiley D, et al. Comparison of inpatient insulin regimens with detemir plus aspart versus neutral protamine hagedorn plus regular in medical patients with type 2 diabetes. J Clin Endocrinol Metab 2009; 94:564–569.
- Smith WD, Winterstein AG, Johns T, Rosenberg E, Sauer BC. Causes of hyperglycemia and hypoglycemia in adult inpatients. Am J Health Syst Pharm 2005; 62:714–719.
- Maynard G, Lee J, Phillips G, Fink E, Renvall M. Improved inpatient use of basal insulin, reduced hypoglycemia, and improved glycemic control: effect of structured subcutaneous insulin orders and an insulin management algorithm. J Hosp Med 2009; 4:3–15.
- Turchin A, Matheny ME, Shubina M, Scanlon JV, Greenwood B, Pendergrass ML. Hypoglycemia and clinical outcomes in patients with diabetes hospitalized in the general ward. Diabetes Care 2009; 32:1153–1157.
- Gill GV, Woodward A, Casson IF, Weston PJ. Cardiac arrhythmia and nocturnal hypoglycaemia in type 1 diabetes--the ‘dead in bed’ syndrome revisited. Diabetologia 2009; 52:42–45.
- Boucai L, Southern WN, Zonszein J. Hypoglycemia-associated mortality is not drug-associated but linked to comorbidities. Am J Med 2011; 124:1028–1035.
- Umpierrez GE, Hellman R, Korytkowski MT, et al. Management of hyperglycemia in hospitalized patients in non-critical care setting: an endocrine society clinical practice guideline. J Clin Endocrinol Metab 2012; 97:16–38.
- Dhatariya K, Levy N, Kilvert A, et al; Joint British Diabetes Societies. NHS diabetes guideline for the perioperative management of the adult patient with diabetes. Diabet Med 2012; 29:420–433.
- Lazar HL, McDonnell M, Chipkin SR, et al; Society of Thoracic Surgeons Blood Glucose Guideline Task Force. The Society of Thoracic Surgeons practice guideline series: blood glucose management during adult cardiac surgery. Ann Thorac Surg 2009; 87:663–669.
- Jacobi J, Bircher N, Krinsley J, et al. Guidelines for the use of an insulin infusion for the management of hyperglycemia in critically ill patients. Crit Care Med 2012; 40:3251–3276.
- Hirsch IB. Sliding scale insulin—time to stop sliding. JAMA 2009; 301:213–214.
- Dobri GA, Lansang MC. How should we manage insulin therapy before surgery? Cleve Clin J Med 2013; 80:702–704.
- Umpierrez GE, Smiley D, Zisman A, et al. Randomized study of basal-bolus insulin therapy in the inpatient management of patients with type 2 diabetes (RABBIT 2 trial). Diabetes Care 2007; 30:2181–2186.
- Bueno E, Benitez A, Rufinelli JV, et al. Basal-bolus regimen with insulin analogs versus human insulin in medical patients with type 2 diabetes: a randomized controlled trial in Latin America. Endocr Pract 2015; 21:807–813.
- Umpierrez GE, Smiley D, Hermayer K, et al. Randomized study comparing a basal-bolus with a basal plus correction insulin regimen for the hospital management of medical and surgical patients with type 2 diabetes: basal plus trial. Diabetes Care 2013; 36:2169–2174.
- American Diabetes Association. Standards of medical care in diabetes-2015 abridged for primary care providers. Clin Diabetes 2015; 33:97–111.
- Rubin DJ, Rybin D, Doros G, McDonnell ME. Weight-based, insulin dose-related hypoglycemia in hospitalized patients with diabetes. Diabetes Care 2011; 34:1723–1728.
- Umpierrez GE, Gianchandani R, Smiley D, et al. Safety and efficacy of sitagliptin therapy for the inpatient management of general medicine and surgery patients with type 2 diabetes: a pilot, randomized, controlled study. Diabetes Care 2013; 36:3430–3435.
- Munt R, Hutton A. Type 1 diabetes mellitus (T1DM) self management in hospital; is it possible? A literature review. Contemp Nurse 2012; 40:179–193.
- American Diabetes Association. Diabetes care in the hospital, nursing home, and skilled nursing facility. Diabetes Care 2015; 38(suppl):S80–S85.
- Elia M, Ceriello A, Laube H, Sinclair AJ, Engfer M, Stratton RJ. Enteral nutritional support and use of diabetes-specific formulas for patients with diabetes: a systematic review and meta-analysis. Diabetes Care 2005; 28:2267–2279.
- Pasquel FJ, Spiegelman R, McCauley M, et al. Hyperglycemia during total parenteral nutrition: an important marker of poor outcome and mortality in hospitalized patients. Diabetes Care 2010; 33:739–741.
- Umpierrez GE, Spiegelman R, Zhao V, et al. A double-blind, randomized clinical trial comparing soybean oil-based versus olive oil-based lipid emulsions in adult medical-surgical intensive care unit patients requiring parenteral nutrition. Crit Care Med 2012; 40:1792–1798.
- RNCOS Industry Research Solutions. US to dominate the global insulin pump market—April 28, 2011. www.rncos.com/Press_Releases/US-to-Dominate-the-Global-Insulin-Pump-Market.htm. Accessed March 16, 2016.
- Lansang MC, Modic MB, Sauvey R, et al. Approach to the adult hospitalized patient on an insulin pump. J Hosp Med 2013; 8:721–727.
- Tripathy PR, Lansang MC. U-500 regular insulin use in hospitalized patients. Endocr Pract 2015; 21:54–58.
- Umpierrez GE, Reyes D, Smiley D, et al. Hospital discharge algorithm based on admission HbA1c for the management of patients with type 2 diabetes. Diabetes Care 2014; 37:2934–2939.
- Qaseem A, Humphrey LL, Chou R, Snow V, Shekelle P; Clinical Guidelines Committee of the American College of Physicians. Use of intensive insulin therapy for the management of glycemic control in hospitalized patients: a clinical practice guideline from the American College of Physicians. Ann Intern Med 2011; 154:260–267.
Hyperglycemia in hospitalized patients, with or without diabetes, is associated with adverse outcomes including increased rates of infection and mortality and longer hospital length of stay.1–3 The rates of complications and mortality are even higher in hyperglycemic patients without a history of diabetes than in those with diabetes.1,2 Randomized clinical trials in critically ill and noncritically ill hyperglycemic patients demonstrate that improved glycemic control can reduce hospital complications, systemic infections, and hospitalization cost.4–6 However, intensive glycemic therapy is associated with increased risk of hypoglycemia, which is independently associated with increased morbidity and mortality in hospitalized patients. The concern about hypoglycemia has led to revised blood glucose target recommendations from professional organizations and a search for alternative treatment options.
This manuscript provides a review of updated recommendations for the management of inpatients with hyperglycemia in the critical care and general medical and surgical settings.
HYPERGLYCEMIA IN CRITICAL CARE SETTINGS
A substantial body of evidence links hyperglycemia in critically ill patients to higher rates of hospital complications, longer hospital stay, higher healthcare resource utilization, and greater hospital mortality.7,8 Although evidence from several cohort studies and randomized clinical trials suggests that tight glucose control can reduce hospital complications and mortality,9,10 this target has been difficult to achieve without increasing the risk of severe hypoglycemia. In addition, data from trials using intense glycemic control in patients in the intensive care unit (ICU) have failed to show a significant improvement in mortality and, in some instances, showed increased mortality risk associated with the therapy.11,12
The recommended target glucose levels are 140 to 180 mg/dL for most ICU patients.13 In agreement with this, the recent GLUCO-CABG trial reported no significant differences in the composite end points of complications and death between an intensive glucose target of 100 to 140 mg/dL and a conservative target of 141 to 180 mg/dL after cardiac surgery.14
HYPERGLYCEMIA IN NONCRITICAL CARE SETTINGS
In general medical and surgical patients, a strong association has been reported between hyperglycemia and prolonged hospital stay, infection, and disability after hospital discharge.1,15,16 For example, the risk of postoperative infections in patients undergoing general surgery was estimated to increase by 30% for every 40 mg/dL rise in glucose over normoglycemia (< 110 mg/dL).16 In general, appropriate glycemic control to maintain recommended glycemic levels in noncritically ill patients can reduce the risks and improve outcomes.
HYPOGLYCEMIA INCIDENCE
Hypoglycemia, defined as glucose less than 70 mg/dL, is a common complication of hyperglycemia treatment.17 Severe hypoglycemia is defined as glucose less than 40 mg/dL.18 The incidence of hypoglycemia in ICU trials ranged between 5% and 28%, depending on the intensity of glycemic control,19 and between 1% and 33% in non-ICU trials using subcutaneous (SC) insulin therapy.20 The most important hypoglycemia risk factors include older age, kidney failure, change in nutritional intake, interruption of glucose monitoring, previous insulin therapy, and failure to adjust therapy when glucose is trending down or steroid therapy is being tapered.21,22
In hospitalized patients with diabetes, hypoglycemia has been associated with poor outcomes, including a 66% increased risk of death within 1 year and 2.8 days longer hospital stay compared with patients without hypoglycemia.23 Hypoglycemia also has been associated with prolonged QT interval, ischemic electrocardiogram changes, angina, arrhythmias, and sudden death in patients with type 1 diabetes.24 Despite these observations, other studies have reported that the increased in-hospital mortality rate is limited to patients with spontaneous hypoglycemia rather than drug-associated hypoglycemia,25 raising the possibility that hypoglycemia may represent a marker of disease burden rather than be a direct cause of death.
INPATIENT ASSESSMENT OF HYPERGLYCEMIA
Clinical guidelines recommend glucose measurement in all patients admitted to the hospital.13,26 Patients with hyperglycemia (glucose > 140 mg/dL) and patients with a history of diabetes should undergo bedside point-of-care glucose testing before meals and at bedtime. Premeal testing should be done close to the time of the meal tray delivery and no longer than 1 hour before meals. For patients taking nothing by mouth or receiving continuous enteral nutrition, point-of-care testing is recommended every 4 to 6 hours.
Hemoglobin A1c (HbA1c) should be measured in patients with hyperglycemia and in those with diabetes if it has not been performed in the preceding 2 to 3 months. In hyperglycemic patients without a history of diabetes, an HbA1c of 6.5% or greater suggests that diabetes preceded hospitalization. In patients with diabetes, the HbA1c can help assess glycemic control prior to admission and tailor the treatment regimen at discharge.13,26
TARGET GLUCOSE LEVELS
Glycemic targets recommended by several organizations are shown in Table 1. For critically ill patients, most societies recommend glucose targets below 180 mg/dL, with the lower limit being anywhere from 110 to less than 150 mg/dL.
For patients in non-ICU settings, the Endocrine Society26 and the American Diabetes Association/American Association of Endocrinologists13 practice guidelines recommend premeal glucose levels below 140 mg/dL, and below 180 mg/dL if checked randomly. Higher glucose ranges (< 200 mg/dL) may be acceptable in terminally ill patients or in patients with severe comorbidities.26 Guidelines from the Joint British Diabetes Societies recommend targeting glucose levels between 108 and 180 mg/dL with an acceptable range of between 72 and 216 mg/dL.27
INPATIENT MANAGEMENT OF HYPERGLYCEMIA AND DIABETES
Insulin regimens in critical care settings
Insulin administration is the preferred way to control hyperglycemia in hospitalized patients. In critically ill patients, such as those with hypotension requiring pressor support, hyperglycemic crises, sepsis, or shock, insulin is best given via continuous intravenous (IV) infusion. The short half-life of IV insulin (< 15 minutes) allows flexibility in adjusting the infusion rate in the event of unpredicted changes in nutrition or the patient’s health. If the glucose level rises above 180 mg/dL, IV insulin infusion should be started to maintain levels below 180 mg/dL.13,26,28,29
A variety of infusion protocols have been shown to be effective in achieving glycemic control with a low rate of hypoglycemia. The ideal protocol should allow flexible rate adjustment taking into account current and previous glucose values as well as changes in infusion rate. Hourly glucose measurements until stable glycemic control is established, followed by point-of-care testing every 1 to 2 hours, is needed to assess response to therapy and prevent hypoglycemia.
Insulin regimens in noncritical care settings
For most patients in a general, non-ICU setting, SC insulin therapy with basal insulin administered once or twice daily, alone or in combination with prandial insulin, is effective and safe.13 Inhaled insulin is approved by the US Food and Drug Administration, but its use in the hospital has not been studied. The use of sliding-scale insulin is not acceptable as the single regimen in patients with diabetes, as it results in undesirable hypoglycemia and hyperglycemia.30Figure 1 presents an algorithm for selecting initial insulin treatment for patients with type 2 diabetes in the non-ICU setting.
Basal insulin prevents hyperglycemia during fasting states. Basal insulin is usually given as a once- or twice-daily long-acting insulin, such as glargine and detemir insulin. On occasion, twice-daily intermediate-acting insulin (neutral protamine Hagedorn; NPH) is used as a basal insulin.
Prandial insulin, also referred to as nutritional or bolus insulin, is given before meals as rapid-acting insulin (aspart, lispro, or glulisine) or short-acting insulin (regular) to prevent postmeal hyperglycemia. Rapid-acting insulin is preferred to regular insulin because of the faster onset and shorter duration of action, which may reduce the risk of hypoglycemia.
Correction or supplemental insulin is given to correct hyperglycemia when the glucose is above the goal. The same formulation is given together with prandial insulin.
Total daily dose of insulin is a measure that comprises basal and prandial insulin Figure 1 lists the recommended total daily dose for different clinical situations and patient populations.
Basal-bolus insulin usually refers to a regimen of long-acting basal insulin plus prandial insulin. In patients with adequate oral intake, the basal-bolus approach is preferred. The RABBIT 2 trial reported that basal-bolus regimens resulted in greater improvement in glucose control than sliding-scale regimens (correction insulin alone without basal or prandial components) in general medicine patients with type 2 diabetes.32 In general surgery patients, basal-bolus regimens significantly improved glucose control and reduced the numbers of postoperative complications, primarily wound infections compared with sliding-scale regimens.4
Multiple doses of NPH and regular insulin were compared with basal-bolus treatment with long-acting and rapid-acting insulin in two controlled trials in medical patients with type 2 diabetes.20,33 Both studies reported that treatment with NPH and regular insulin resulted in similar improvements in glycemic control and no difference in the rate of hypoglycemic events or in hospital length of stay, compared with basal-bolus insulin. Because NPH has a peak of action approximately 8 to 12 hours after injection, there is a risk of hypoglycemia in patients with poor oral intake.
In hospitalized patients who have reduced total caloric intake due to lack of appetite, acute illness, medical procedures, or surgical interventions, the Basal Plus trial34 reported that a single daily dose of glargine plus correction doses of rapid-acting insulin resulted in similar improvement in glycemic control and no difference in the frequency of hypoglycemia compared with a standard basal-bolus regimen. These results indicate that the basal-plus-correction regimen may be preferred for patients with poor or no oral intake, whereas an insulin regimen with basal, nutritional (basal-bolus), and correction components is preferred for patients with good nutritional intake.35
SC insulin dosing refers to insulin doses administered subcutaneously calculated based either on weight or on home insulin doses. For insulin-naive patients, the starting total daily dose of insulin can usually be computed as 0.4 to 0.5 U/kg/day. Higher starting doses are associated with greater odds of hypoglycemia than doses lower than 0.2 U/kg/day.36 In elderly patients and those with impaired renal function, lower initial daily doses (≤ 0.3 U/kg) may reduce the risk of hypoglycemia.26
In patients treated with insulin prior to admission, the total daily insulin dose at home can be given as half long-acting basal insulin and half prandial insulin. The dose can be reduced by 20% to 25% to prevent hypoglycemia, particularly in those with poor or uncertain caloric intake.31
Noninsulin therapies
The use of oral antidiabetic agents is generally not recommended in hospitalized patients due to the limited data available on their safety and efficacy, frequent contraindications, risk of hypoglycemia, and slow onset of action that may preclude achieving rapid glycemic control and daily dose adjustments. Table 3 lists the pros and cons of these agents in hospitalized patients.
The safety and efficacy of sitagliptin, a dipeptidyl peptidase-4 inhibitor, for the management of inpatient hyperglycemia was evaluated in a randomized pilot study in patients with type 2 diabetes treated at home with diet, oral antidiabetic agents, or a low daily insulin dose (≤ 0.4 U/kg/day).37 Patients were randomized to one of two treatments:
- Sitagliptin alone or with low-dose glargine insulin
- Basal-bolus insulin regimen plus supplemental doses of insulin lispro.
Both treatment regimens resulted in similar improvement in mean daily glucose concentrations. However, patients admitted to the hospital with glucose levels above 180 mg/dL in the sitagliptin group had higher mean daily glucose levels than patients treated with basal-bolus or sitagliptin plus glargine.
Transitioning from IV to SC insulin
When patients in critical care units are ready to be transferred to a general medical floor, appropriate transition from IV insulin to scheduled SC insulin is needed to prevent rebound hyperglycemia. This is imperative in patients with type 1 diabetes in whom just a few hours without insulin can result in diabetic ketoacidosis.
There are three general ways to calculate the SC insulin dose during the transition period. The first two methods are weight-based and based on the home dose, as previously discussed. The third method is to extrapolate from the IV insulin. A common way is to sum up the total IV insulin dose in the past 6 or 8 hours and multiply by 3 or 4, and then reduce by 20% to achieve the basal insulin dose, presuming the patient had no oral intake on the IV insulin infusion. This last method is preferred in hemodynamically stable patients with stable insulin requirements.
If long-acting insulin is chosen as basal insulin, it should be given 2 to 4 hours before discontinuation of the IV insulin infusion. Intermediate-acting insulin should be given 1 to 2 hours before IV insulin discontinuation.
SPECIFIC SITUATIONS AND POPULATIONS
Type 1 diabetes
Patients with type 1 diabetes have minimal to absent pancreatic beta cell function and rely on the exogenous administration of insulin to maintain glucose homeostasis. They have worse glycemic control and higher rates of acute kidney injury than patients with type 2 diabetes; however, the impact of inpatient glycemic control on clinical outcomes has not been determined in patients with type 1 diabetes. Insulin therapy must provide both basal and nutritional components to achieve the target goals. It is important to ask the patient directly to determine the times and doses of prescribed insulin, medication adherence, recent dietary habits (including changes in appetite), and level of physical activity. This information will be used to guide insulin therapy.
A systematic review of 16 clinical studies reported that patients who possess excellent self-management skills can be suitable for successful inpatient diabetes self-management.38 The American Diabetes Association supports patient self-management of diabetes in the hospital.39 However, the competence and readiness of each patient with type 1 diabetes need to be carefully determined in an individualized manner. Potential candidates for inpatient self-management are those with unaltered mental status, proven proficient outpatient skills (eg, carbohydrate counting, frequent glucose monitoring, strong knowledge related to the management of insulin pump or injection techniques), and who are tolerating oral intake.
Enteral nutrition and tube feeding
Accidental dislodgement of feeding tubes, temporary discontinuation of nutrition due to nausea or for diagnostic testing, and cycling of enteral nutrition with oral intake in patients with an inconsistent appetite pose unique challenges in the hospital. Although it may be tempting to give basal and nutritional requirements to these patients as a single dose of long-acting insulin, this is not recommended. Low-dose basal insulin plus scheduled doses of short-acting (regular) insulin (every 6 hours) or rapid-acting insulin (every 4 hours) with correction insulin is often used. Some providers prefer giving intermediate-acting (NPH) plus short-acting (regular) insulin every 8 hours or every 12 hours.
It is generally accepted that diabetic enteral formulas that are low in carbohydrate and high in monounsaturated fatty acids are preferable to standard high-carbohydrate formulas in hospitalized patients with diabetes. In a meta-analysis, the postprandial rise in glucose was reduced by 20 to 30 mg/dL with the low-carbohydrate high-fat formulations compared with standard formulations.40
Parenteral nutrition
The use of parenteral nutrition has been linked to aggravation of hyperglycemia independent of a history of diabetes as well as a higher risk of complications, infections, sepsis, and death.41 Regular insulin can be added to the parenteral solution at a starting dose of 0.1 U/g of dextrose in nondiabetic patients and at 0.15 U/g of dextrose in patients with diabetes.42
Alternatively, insulin can be given as a continuous IV infusion. Hemodynamically stable patients with mild to moderate hyperglycemia can be managed with basal insulin plus scheduled or as-needed doses of short-acting (regular) insulin every 6 hours. To prevent waste, it is better to underestimate the insulin added to parenteral nutrition so as to avoid having to discontinue it prematurely or add additional glucose.
Glucocorticoids
Glucocorticoids typically raise glucose starting 4 to 6 hours after administration. Low doses of glucocorticoids given in the morning tend to raise the late morning to evening glucose levels without affecting the fasting glucose. In this situation, the patient may be managed on prandial insulin without long-acting basal insulin or with intermediate-acting insulin given in the morning. Higher glucocorticoid doses may raise fasting glucose levels, in which case basal-bolus insulin would be appropriate, with the basal component comprising about 30% and the bolus about 70% of the daily dose.26
Insulin pump
Approximately 400,000 US patients with diabetes use an insulin pump.43 Successful management of inpatient diabetes with the continuation of insulin pump therapy has been previously demonstrated in select patients. Clear hospital policies, procedures, and physicians’ orders with specifics on the type of diet, frequency of point-of-care glucose testing, and insulin doses (ie, basal rates, carbohydrate ratios, and correction formulas) should be in place. An inpatient diabetes specialist should assist with the assessment and management of a patient with an insulin pump.
If pump use is contraindicated (Table 4)44 or if inpatient diabetes resources are not available, discontinuation of insulin pump and transition to a basal-bolus insulin regimen (“pump holiday”) may be the safest and most appropriate step. Most patients knowledgeable in insulin pump therapy are able to display in their pump screen the average total daily insulin used for the past few days. Based on this, safe estimations of basal, bolus, and supplemental insulin can be calculated. To avoid severe hyperglycemia or ketoacidosis from lack of basal insulin, it is important to administer the basal insulin component at least 2 hours before disconnecting the insulin pump.
Concentrated insulins
U-500 regular insulin is concentrated insulin that delivers the same amount of units in one-fifth the volume of conventional insulins, which are U-100. Whereas there are 100 units of insulin in 1 mL for conventional insulins, there are 500 units of U-500 regular insulin in 1 mL. Its onset of action is similar to that of regular insulin, and the peak and duration are similar to that of NPH insulin. Concentrated insulin is often administered in the outpatient setting to patients who are insulin resistant and require close to 200 units a day. The U-500 pen device was approved in January 2016 and was projected to be available in April 2016. For now, it can only be procured in the vial form. This causes confusion in its dosing since it is given either with the usual insulin syringes, which are designed for U-100 insulin administration, or a tuberculin syringe, which is not marked in units but in milliliters.
Because of its unique nature and providers’ lack of familiarity with U-500, certain institutions have a policy for its use. In many institutions, the doses are confirmed by pharmacy staff and delivered by pharmacy to the patient’s medication bin predrawn in a tuberculin syringe.45 In addition, a study reported that many patients on U-500 at home required significantly lower doses of insulin (average dose of 100 U/day) while hospitalized patients could be managed with conventional insulin formulations.45
There are newer concentrated insulins in the market, such as insulin glargine 300 U/mL (Toujeo) and insulin lispro 200 U/mL (Humalog). These insulins, so far, come only in the pen device form and not in vials, obviating the need for dose calculations using a U-100 insulin syringe or tuberculin syringe. The efficacy and safety of these insulin formulations have not been determined in the hospital setting.
Transitioning from home to hospital
Transition to an outpatient setting requires planning and coordination. Although insulin is used in the hospital for most patients with diabetes, many patients do not require insulin after discharge. On the other hand, diabetes regimens sometimes need intensification in other patients. One study showed that patients with acceptable diabetes control (HbA1c < 7.5%) near or on admission could be discharged on their prehospitalization treatment regimen, while those with HbA1c between 7.5% and 9% could be discharged on oral agents plus basal insulin at 50% of the hospital basal dose.46 Additionally, patients with an HbA1c of 9% to 10% should be discharged on a basal-bolus regimen or on a combination of oral agents plus basal insulin at 80% of hospital dose, with a reduction in HbA1c seen 12 weeks after discharge.
SUMMARY
Inpatient hyperglycemia is common and is associated with increased risk of hospital complications, higher healthcare resource utilization, and higher rates of in-hospital mortality. In the critically ill, IV insulin is most appropriate, with a starting threshold no higher than 180 mg/dL. Once IV insulin is started, the glucose level should be maintained between 140 and 180 mg/dL.
In noncritically ill patients, a basal-bolus regimen with basal, prandial, and correction components is preferred for patients with good nutritional intake. In contrast, a single dose of long-acting insulin plus correction insulin is preferred for patients with poor or no oral intake. Preliminary data indicate that incretin therapy has the potential to improve glycemic control in patients with mild to moderate hyperglycemia and a low risk of hypoglycemia.
Transition to an outpatient setting requires planning and coordination. Measuring HbA1c at admission is important to assess preadmission glycemic control and to tailor the treatment regimen at discharge. Patients with acceptable diabetes control could be discharged on their prehospitalization treatment regimen. Patients with suboptimal control should have more intensified therapy.
Dr. Umpierrez is supported in part by research grants from the American Diabetes Association (1-14-LLY-36), PHS grant UL1 RR025008 from the Clinical Translational Science Award Program (M01 RR-00039), and grants from the National Institutes of Health and the National Center for Research Resources. He has received unrestricted research support for inpatient studies (at Emory University) from Sanofi, Merck, Novo Nordisk, and Boehringer Ingelheim, and has received consulting fees and/or honoraria for membership on advisory boards from Novo Nordisk, Sanofi, Merck, Boehringer Ingelheim, and Regeneron.
- Umpierrez GE, Isaacs SD, Bazargan N, You X, Thaler LM, Kitabchi AE. Hyperglycemia: an independent marker of in-hospital mortality in patients with undiagnosed diabetes. J Clin Endocrinol Metab 2002; 87:978–982.
- Falciglia M, Freyberg RW, Almenoff PL, D’Alessio DA, Render ML. Hyperglycemia-related mortality in critically ill patients varies with admission diagnosis. Crit Care Med 2009; 37:3001–3009.
- Kotagal M, Symons RG, Hirsch IB, et al. Perioperative hyperglycemia and risk of adverse events among patients with and without diabetes. Ann Surg 2015; 261:97–103.
- Umpierrez GE, Smiley D, Jacobs S, et al. Randomized study of basal-bolus insulin therapy in the inpatient management of patients with type 2 diabetes undergoing general surgery (RABBIT 2 surgery). Diabetes Care 2011; 34:256–261.
- Murad MH, Coburn JA, Coto-Yglesias F, et al. Glycemic control in non-critically ill hospitalized patients: a systematic review and meta-analysis. J Clin Endocrinol Metab 2012; 97:49–58.
- Schroeder JE, Liebergall M, Raz I, et al. Benefits of a simple glycaemic protocol in an orthopaedic surgery ward: a randomized prospective study. Diabetes Metab Res Rev 2012; 28:71–75.
- Clement S, Braithwaite SS, Magee MF, et al; American Diabetes Association in Hospitals Writing Committee. Management of diabetes and hyperglycemia in hospitals. Diabetes Care 2004; 27:553–591.
- Inzucchi SE. Clinical practice: Management of hyperglycemia in the hospital setting. N Engl J Med 2006; 355:1903–1911.
- van den Berghe G, Wouters P, Weekers F, et al. Intensive insulin therapy in the critically ill patients. N Engl J Med 2001; 345:1359–1367.
- van den Berghe G, Wilmer A, Hermans G, et al. Intensive insulin therapy in the medical ICU. N Engl J Med 2006; 354:449–461.
- NICE-SUGAR Study Investigators; Finfer S, Chittock DR, Su SY, et al. Intensive versus conventional glucose control in critically ill patients. N Engl J Med 2009; 360:1283–1297.
- Griesdale DE, de Souza RJ, van Dam RM, et al. Intensive insulin therapy and mortality among critically ill patients: a meta-analysis including NICE-SUGAR study data. CMAJ 2009; 180:821–827.
- Moghissi ES, Korytkowski MT, DiNardo M, et al. American Association of Clinical Endocrinologists and American Diabetes Association consensus statement on inpatient glycemic control. Diabetes Care 2009; 32:1119–1131.
- Umpierrez G, Cardona S, Pasquel F, et al. Randomized controlled trial of intensive versus conservative glucose control in patients undergoing coronary artery bypass graft surgery: GLUCO-CABG Trial. Diabetes Care 2015; 38:1665–1672.
- Montori VM, Bistrian BR, McMahon MM. Hyperglycemia in acutely ill patients. JAMA 2002; 288:2167–2169.
- Ramos M, Khalpey Z, Lipsitz S, et al. Relationship of perioperative hyperglycemia and postoperative infections in patients who undergo general and vascular surgery. Ann Surg 2008; 248:585–591.
- American Diabetes Association. Standards of medical care in diabetes—2010. Diabetes Care 2010; 33(suppl 1):S11–S61.
- Cryer PE, Axelrod L, Grossman AB, et al. Evaluation and management of adult hypoglycemic disorders: an Endocrine Society Clinical Practice Guideline. J Clin Endocrinol Metab 2009; 94:709–728.
- Krikorian A, Ismail-Beigi F, Moghissi ES. Comparisons of different insulin infusion protocols: a review of recent literature. Current Opin Clin Nutr Metab Care 2010; 13:198–204.
- Umpierrez GE, Hor T, Smiley D, et al. Comparison of inpatient insulin regimens with detemir plus aspart versus neutral protamine hagedorn plus regular in medical patients with type 2 diabetes. J Clin Endocrinol Metab 2009; 94:564–569.
- Smith WD, Winterstein AG, Johns T, Rosenberg E, Sauer BC. Causes of hyperglycemia and hypoglycemia in adult inpatients. Am J Health Syst Pharm 2005; 62:714–719.
- Maynard G, Lee J, Phillips G, Fink E, Renvall M. Improved inpatient use of basal insulin, reduced hypoglycemia, and improved glycemic control: effect of structured subcutaneous insulin orders and an insulin management algorithm. J Hosp Med 2009; 4:3–15.
- Turchin A, Matheny ME, Shubina M, Scanlon JV, Greenwood B, Pendergrass ML. Hypoglycemia and clinical outcomes in patients with diabetes hospitalized in the general ward. Diabetes Care 2009; 32:1153–1157.
- Gill GV, Woodward A, Casson IF, Weston PJ. Cardiac arrhythmia and nocturnal hypoglycaemia in type 1 diabetes--the ‘dead in bed’ syndrome revisited. Diabetologia 2009; 52:42–45.
- Boucai L, Southern WN, Zonszein J. Hypoglycemia-associated mortality is not drug-associated but linked to comorbidities. Am J Med 2011; 124:1028–1035.
- Umpierrez GE, Hellman R, Korytkowski MT, et al. Management of hyperglycemia in hospitalized patients in non-critical care setting: an endocrine society clinical practice guideline. J Clin Endocrinol Metab 2012; 97:16–38.
- Dhatariya K, Levy N, Kilvert A, et al; Joint British Diabetes Societies. NHS diabetes guideline for the perioperative management of the adult patient with diabetes. Diabet Med 2012; 29:420–433.
- Lazar HL, McDonnell M, Chipkin SR, et al; Society of Thoracic Surgeons Blood Glucose Guideline Task Force. The Society of Thoracic Surgeons practice guideline series: blood glucose management during adult cardiac surgery. Ann Thorac Surg 2009; 87:663–669.
- Jacobi J, Bircher N, Krinsley J, et al. Guidelines for the use of an insulin infusion for the management of hyperglycemia in critically ill patients. Crit Care Med 2012; 40:3251–3276.
- Hirsch IB. Sliding scale insulin—time to stop sliding. JAMA 2009; 301:213–214.
- Dobri GA, Lansang MC. How should we manage insulin therapy before surgery? Cleve Clin J Med 2013; 80:702–704.
- Umpierrez GE, Smiley D, Zisman A, et al. Randomized study of basal-bolus insulin therapy in the inpatient management of patients with type 2 diabetes (RABBIT 2 trial). Diabetes Care 2007; 30:2181–2186.
- Bueno E, Benitez A, Rufinelli JV, et al. Basal-bolus regimen with insulin analogs versus human insulin in medical patients with type 2 diabetes: a randomized controlled trial in Latin America. Endocr Pract 2015; 21:807–813.
- Umpierrez GE, Smiley D, Hermayer K, et al. Randomized study comparing a basal-bolus with a basal plus correction insulin regimen for the hospital management of medical and surgical patients with type 2 diabetes: basal plus trial. Diabetes Care 2013; 36:2169–2174.
- American Diabetes Association. Standards of medical care in diabetes-2015 abridged for primary care providers. Clin Diabetes 2015; 33:97–111.
- Rubin DJ, Rybin D, Doros G, McDonnell ME. Weight-based, insulin dose-related hypoglycemia in hospitalized patients with diabetes. Diabetes Care 2011; 34:1723–1728.
- Umpierrez GE, Gianchandani R, Smiley D, et al. Safety and efficacy of sitagliptin therapy for the inpatient management of general medicine and surgery patients with type 2 diabetes: a pilot, randomized, controlled study. Diabetes Care 2013; 36:3430–3435.
- Munt R, Hutton A. Type 1 diabetes mellitus (T1DM) self management in hospital; is it possible? A literature review. Contemp Nurse 2012; 40:179–193.
- American Diabetes Association. Diabetes care in the hospital, nursing home, and skilled nursing facility. Diabetes Care 2015; 38(suppl):S80–S85.
- Elia M, Ceriello A, Laube H, Sinclair AJ, Engfer M, Stratton RJ. Enteral nutritional support and use of diabetes-specific formulas for patients with diabetes: a systematic review and meta-analysis. Diabetes Care 2005; 28:2267–2279.
- Pasquel FJ, Spiegelman R, McCauley M, et al. Hyperglycemia during total parenteral nutrition: an important marker of poor outcome and mortality in hospitalized patients. Diabetes Care 2010; 33:739–741.
- Umpierrez GE, Spiegelman R, Zhao V, et al. A double-blind, randomized clinical trial comparing soybean oil-based versus olive oil-based lipid emulsions in adult medical-surgical intensive care unit patients requiring parenteral nutrition. Crit Care Med 2012; 40:1792–1798.
- RNCOS Industry Research Solutions. US to dominate the global insulin pump market—April 28, 2011. www.rncos.com/Press_Releases/US-to-Dominate-the-Global-Insulin-Pump-Market.htm. Accessed March 16, 2016.
- Lansang MC, Modic MB, Sauvey R, et al. Approach to the adult hospitalized patient on an insulin pump. J Hosp Med 2013; 8:721–727.
- Tripathy PR, Lansang MC. U-500 regular insulin use in hospitalized patients. Endocr Pract 2015; 21:54–58.
- Umpierrez GE, Reyes D, Smiley D, et al. Hospital discharge algorithm based on admission HbA1c for the management of patients with type 2 diabetes. Diabetes Care 2014; 37:2934–2939.
- Qaseem A, Humphrey LL, Chou R, Snow V, Shekelle P; Clinical Guidelines Committee of the American College of Physicians. Use of intensive insulin therapy for the management of glycemic control in hospitalized patients: a clinical practice guideline from the American College of Physicians. Ann Intern Med 2011; 154:260–267.
KEY POINTS
- Hyperglycemia in hospitalized patients, with or without diabetes, is associated with adverse outcomes.
- Measurement of hemoglobin A1c is recommended in all patients at hospital admission.
- Insulin administration is the preferred way to control hyperglycemia in hospitalized patients, with a starting threshold below 180 mg/dL then maintaining a level between 140 and 180 mg/dL.

In reply: Insulin before surgery
In Reply: We appreciate the kind words of Drs. Ditch and Moore, as well as their opinion.
Our article was intentionally brief—a 1-Minute Consult—and so could not cover all specific situations we encounter in clinical practice. We meant only to provide a general approach in this matter.
Quite often before surgery, patients receive less basal insulin than needed, or none at all, rather than too much. It has to be borne in mind that perioperative hyperglycemia—not just hypoglycemia—is linked with poor outcomes in cardiac1 and noncardiac surgery.2,3
Through our scenarios and suggestions, we have taken steps to err on the side of preventing hypoglycemia while averting hyperglycemia, at the same time making it easy to calculate the dose. In a scenario in which the basal insulin dose is about the same as the total of the prandial boluses, we have not yet seen evidence that raises concern for hypoglycemia, maybe because many of the patients with type 2 diabetes seen in our institution for surgery take, in addition to insulin, oral agents or noninsulin injections (which are appropriately withheld before surgery), and have suboptimal glycemic control on their home regimen. But if a physician has concerns for hypoglycemia, a dose reduction should be made.
There were some differences between the RABBIT 2 trial in medical patients4 and the RABBIT 2 Surgery trial5 that would make the results not completely comparable. In RABBIT 2, the medical patients included were on diet alone or any combination of oral antidiabetic agents (not on insulin), and they were started on a total daily dose of insulin of either 0.4 or 0.5 U/kg/day, depending on the glucose level. In RABBIT 2 Surgery, patients who were on insulin at home with a total daily dose of 0.4 U/kg or less were also included, and the starting daily dose of insulin was 0.5 U/kg (unless they were older or had a high serum creatinine).
In view of all the above, we agree with Drs. Ditch and Moore that if there is concern for hypoglycemia, the clinician should reduce the insulin dose in the manner that evidence from the local practice suggests, without causing undue hyperglycemia and postsurgical complications.
- Furnary AP, Gao G, Grunkemeier GL, et al. Continuous insulin infusion reduces mortality in patients with diabetes undergoing coronary artery bypass grafting. J Thorac Cardiovasc Surg 2003; 125:1007–1021.
- King JT, Goulet JL, Perkal MF, Rosenthal RA. Glycemic control and infections in patients with diabetes undergoing noncardiac surgery. Ann Surg 2011; 253:158–165.
- Frisch A, Chandra P, Smiley D, et al. Prevalence and clinical outcome of hyperglycemia in the perioperative period in noncardiac surgery. Diabetes Care 2010; 33:1783–1788.
- Umpierrez GE, Smiley D, Zisman A, et al. Randomized study of basal-bolus insulin therapy in the inpatient management of patients with type 2 diabetes (RABBIT 2 trial). Diabetes Care 2007; 30:2181–2186.
- Umpierrez GE, Smiley D, Jacobs S, Peng L, et al. Randomized study of basal-bolus insulin therapy in the inpatient management of patients with type 2 diabetes undergoing general surgery (RABBIT 2 surgery). Diabetes Care 2011; 34:256–261.
In Reply: We appreciate the kind words of Drs. Ditch and Moore, as well as their opinion.
Our article was intentionally brief—a 1-Minute Consult—and so could not cover all specific situations we encounter in clinical practice. We meant only to provide a general approach in this matter.
Quite often before surgery, patients receive less basal insulin than needed, or none at all, rather than too much. It has to be borne in mind that perioperative hyperglycemia—not just hypoglycemia—is linked with poor outcomes in cardiac1 and noncardiac surgery.2,3
Through our scenarios and suggestions, we have taken steps to err on the side of preventing hypoglycemia while averting hyperglycemia, at the same time making it easy to calculate the dose. In a scenario in which the basal insulin dose is about the same as the total of the prandial boluses, we have not yet seen evidence that raises concern for hypoglycemia, maybe because many of the patients with type 2 diabetes seen in our institution for surgery take, in addition to insulin, oral agents or noninsulin injections (which are appropriately withheld before surgery), and have suboptimal glycemic control on their home regimen. But if a physician has concerns for hypoglycemia, a dose reduction should be made.
There were some differences between the RABBIT 2 trial in medical patients4 and the RABBIT 2 Surgery trial5 that would make the results not completely comparable. In RABBIT 2, the medical patients included were on diet alone or any combination of oral antidiabetic agents (not on insulin), and they were started on a total daily dose of insulin of either 0.4 or 0.5 U/kg/day, depending on the glucose level. In RABBIT 2 Surgery, patients who were on insulin at home with a total daily dose of 0.4 U/kg or less were also included, and the starting daily dose of insulin was 0.5 U/kg (unless they were older or had a high serum creatinine).
In view of all the above, we agree with Drs. Ditch and Moore that if there is concern for hypoglycemia, the clinician should reduce the insulin dose in the manner that evidence from the local practice suggests, without causing undue hyperglycemia and postsurgical complications.
- Furnary AP, Gao G, Grunkemeier GL, et al. Continuous insulin infusion reduces mortality in patients with diabetes undergoing coronary artery bypass grafting. J Thorac Cardiovasc Surg 2003; 125:1007–1021.
- King JT, Goulet JL, Perkal MF, Rosenthal RA. Glycemic control and infections in patients with diabetes undergoing noncardiac surgery. Ann Surg 2011; 253:158–165.
- Frisch A, Chandra P, Smiley D, et al. Prevalence and clinical outcome of hyperglycemia in the perioperative period in noncardiac surgery. Diabetes Care 2010; 33:1783–1788.
- Umpierrez GE, Smiley D, Zisman A, et al. Randomized study of basal-bolus insulin therapy in the inpatient management of patients with type 2 diabetes (RABBIT 2 trial). Diabetes Care 2007; 30:2181–2186.
- Umpierrez GE, Smiley D, Jacobs S, Peng L, et al. Randomized study of basal-bolus insulin therapy in the inpatient management of patients with type 2 diabetes undergoing general surgery (RABBIT 2 surgery). Diabetes Care 2011; 34:256–261.
How should we manage insulin therapy before surgery?
Continuing at least part of the basal insulin is the reasonable, physiologic approach to controlling glucose levels before surgery in patients with diabetes. The process involves three basic steps:
- Ascertaining the type of diabetes
- Adjusting the basal insulin dosage
- Stopping the prandial insulin.
The steps are the same whether the surgery is major or minor. These recommendations are based on general principles of insulin action, data from large databases of surgical inpatients, and expert clinical experience translated into standardized protocols.1,2
WHY CONTINUE THE INSULIN?
Stopping or decreasing insulin because of a fear of hypoglycemia is not appropriate, as the resulting hyperglycemia can lead to delayed wound healing, wound infection, fluid and electrolyte shifts, diabetic ketoacidosis, and hyperosmolar states.
Insulin inhibits both gluconeogenesis and conversion of glycogen to glucose, processes that occur regardless of food intake. It also inhibits degradation of fats to fatty acids and of fatty acids to ketones. This is why inadequate insulin dosing can lead to uncontrolled hyperglycemia and even ketoacidosis, and thus why long-acting insulin is needed in a fasting state.
STEP 1: ASCERTAIN THE TYPE OF DIABETES
Does the patient have type 1 or type 2 diabetes, and does that even matter?
The type of diabetes should not matter, since ideally the insulin should be dosed the same for both types. However, the consequences of inappropriate insulin management may be different.
Usually, the type of diabetes can be ascertained by the history. If the patient was diagnosed at age 40 or later and was on oral medication for years before insulin was started, then he or she most likely has type 2. If the patient was younger than 40 at the time of diagnosis, was lean, and was started on insulin within a year of diagnosis, then he or she likely has type 1.
If this information is not available or is unreliable and the patient has been on insulin for many years, we recommend viewing the patient as being insulinopenic, ie, not producing enough insulin endogenously and thus requiring insulin at all times.
Though checking for antibody markers of type 1 diabetes might give a more definitive answer, it is not practical before surgery.
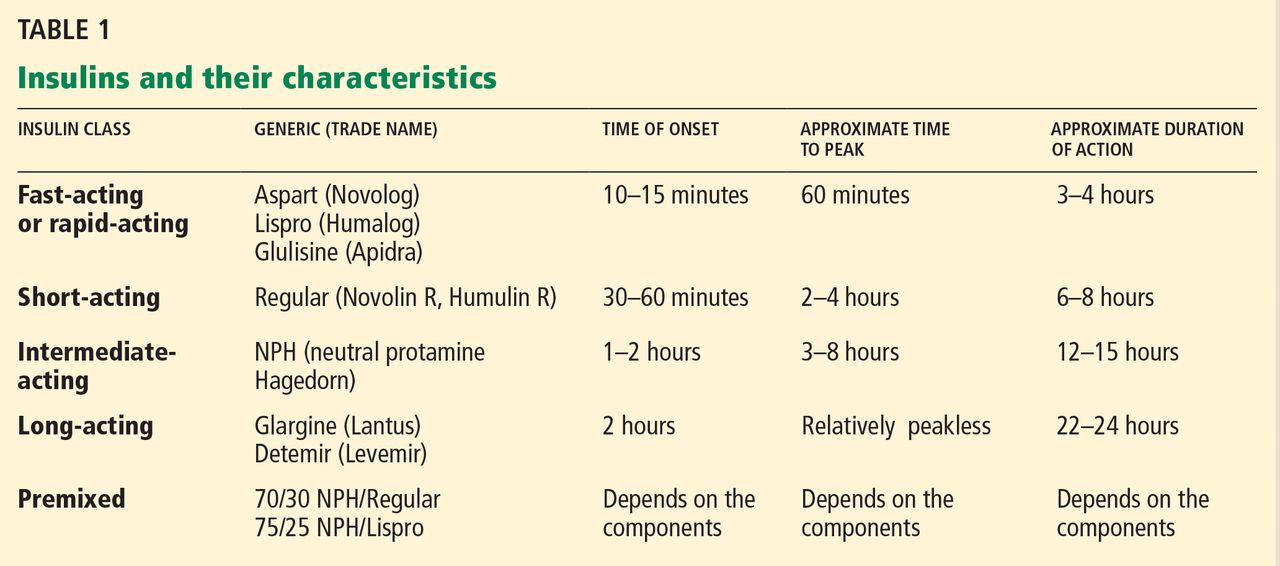
In the setting of surgical stress, withholding the basal insulin preoperatively and just giving a small dose of fast-acting (see Table 1 for the different classes of insulin) or shortacting insulin as part of a sliding scale (ie, insulin given only when the blood glucose reaches a certain high level) can send a patient with type 1 diabetes into diabetic ketoacidosis by the end of the day. This is less likely to occur in a patient with type 2 diabetes with some endogenous insulin secretion.
STEP 2: ADJUST THE BASAL INSULIN
Basal insulin is the insulin that the healthy person’s body produces when fasting. For a diabetic patient already on insulin, basal insulin is insulin injected to prevent ketogenesis, glycogenolysis, and gluconeogenesis in the fasting state.
If the basal insulin is long-acting
Long-acting insulins have a relatively peakless profile and, when properly dosed, should not result in hypoglycemia when a patient is fasting.
Preoperatively, the patient should take it as close as possible to the usual time of injection. This could be at home either at bedtime the night before surgery or the morning of surgery. If there is concern for hypoglycemia, the injection can be given when the patient is at the hospital.
- If the patient does not tend to have hypoglycemic episodes and the total daily basal insulin dose is roughly the same as the total daily mealtime (prandial) dose (eg, 50% basal, 50% prandial ratio), the full dose of basal insulin can be given.3
Example: If the patient is on insulin glargine 30 U at bedtime and insulin lispro 10 U with each meal and does not have hypoglycemic episodes, then insulin glargine 30 U should be taken at bedtime.
- If the patient has hypoglycemic episodes at home, then the basal insulin can be reduced by 25%.3
Example: If the patient is on insulin glargine 30 U at bedtime and insulin glulisine 10 U with each meal (appropriate proportion of doses, similar to the example above) but has hypoglycemic episodes at home on this regimen, then only 22 U of insulin glargine should be taken at bedtime.
- If the patient’s regimen has disproportionately more basal insulin than mealtime insulin, then the total daily doses can be added and half can be given as the basal insulin.
Example: If the patient is on insulin detemir 30 U every morning at 6 am and insulin aspart 6 U with each meal and has no hypoglycemic episodes, then 24 U of insulin detemir should be taken in the morning (ie, half of the total of 30 + 6 + 6 + 6).
- In the less common scenario of diabetes managed only with basal insulin (no other diabetes injections or oral agents), then half of the dose can be given.
- If the patient is on twice-daily long-acting basal insulin, then both the dose the night before surgery and the dose the morning of surgery should be adjusted.
If the basal insulin is intermediate-acting
The intermediate-acting insulin neutral protamine Hagedorn (NPH) is usually given twice a day because of its profile (Table 1).
- On the night before surgery, the full dose of NPH insulin should be taken, unless the patient will now skip a nighttime meal because of taking nothing by mouth, in which case the dose can be decreased by 25%.1
- On the morning of surgery, since the patient will be skipping breakfast and probably also lunch, the dose should be reduced by 50%.3,4
Special situation: Premixed insulins
Premixed insulins (70/30, 75/25) are a combination of intermediate-acting insulin and either fast-acting or short-acting insulin. In other words, they are combinations of basal and prandial insulin. Their use is thus not ideal in the preoperative period. There are two options in these situations.
One option is to switch to a regimen that includes long-acting insulin. If the patient is admitted for surgery, then the hospital staff can change the insulin regimen to long-acting basal insulin. A quick formula for conversion is to add all the premixed insulin doses and give half as basal insulin on the morning of surgery, similar to the scenario above for the patient with long-acting basal insulin that was out of proportion to the prandial insulin injections.
For example, if the usual regimen is insulin 70/30 NPH/Regular, 60 U with breakfast, 30 U with dinner, then the patient can take 45 U of insulin glargine (which is half of 60 + 30) in the morning or evening before surgery.
Another option is to adjust the dose of pre-mixed insulin. Sometimes it is not feasible or economical to change the patient’s premixed insulin just before surgery. In these situations, the patient can take half of the morning dose, followed by dextrose-containing intravenous fluids and blood glucose checks.
We recommend preoperatively giving at least part of the patient’s previous basal insulin, regardless of the type of diabetes, the type of surgery, or the fasting period.
STEP 3: STOP THE PRANDIAL INSULIN
Prandial insulin—given before each meal to cover the carbohydrates to be consumed—should be stopped the morning of surgery.3,4
WHAT ABOUT SLIDING SCALE INSULIN?
Using a sliding scale alone has no known benefit. Although it can be a quick fix to correct a high glucose level, it should be added to the basal insulin and not used as the sole insulin therapy. If a sliding scale is used, fast-acting insulin (aspart, glulisine, lispro) is preferred over regular insulin because of the more rapid onset and shorter duration of action.
Patients already using a supplemental insulin scale can apply it to correct a blood glucose above 200 mg/dL on the morning of surgery.
MAINTENANCE FLUIDS
As long as glucose levels are not very elevated (ie, > 200 mg/dL), after 12 hours on a nothing-by-mouth regimen, provide dextrose in the IV fluid to prevent hypoglycemia (eg, the patient received long-acting insulin and the glucose levels are running low) or to prevent starvation ketosis, which may result in ketones in the blood or urine. We recommend 5% dextrose in half-normal (0.45%) saline at 50 to 75 mL/hour as maintenance fluid; the infusion rate should be lower if fluid overload is a concern.
POSTOPERATIVE INSULIN MANAGEMENT
Once patients are discharged and can go back to their previous routine, they can restart their usual insulin regimen the same evening. The prandial insulin will be resumed when the regular diet is reintroduced, and the doses will be adjusted according to food intake.
- Joshi GP, Chung F, Vann MA, et al; Society for Ambulatory Anesthesia. Society for Ambulatory Anesthesia consensus statement on perioperative blood glucose management in diabetic patients undergoing ambulatory surgery. Anesth Analg 2010; 111:1378–1387.
- DiNardo M, Donihi AC, Forte P, Gieraltowski L, Korytkowski M. Standardized glycemic management and perioperative glycemic outcomes in patients with diabetes mellitus who undergo same-day surgery. Endocr Pract 2011; 17:404–411.
- Vann MA. Perioperative management of ambulatory surgical patients with diabetes mellitus. Curr Opin Anaesthesiol 2009; 22:718–724.
- Meneghini LF. Perioperative management of diabetes: translating evidence into practice. Cleve Clin J Med 2009; 76(suppl 4):S53–S59.
Continuing at least part of the basal insulin is the reasonable, physiologic approach to controlling glucose levels before surgery in patients with diabetes. The process involves three basic steps:
- Ascertaining the type of diabetes
- Adjusting the basal insulin dosage
- Stopping the prandial insulin.
The steps are the same whether the surgery is major or minor. These recommendations are based on general principles of insulin action, data from large databases of surgical inpatients, and expert clinical experience translated into standardized protocols.1,2
WHY CONTINUE THE INSULIN?
Stopping or decreasing insulin because of a fear of hypoglycemia is not appropriate, as the resulting hyperglycemia can lead to delayed wound healing, wound infection, fluid and electrolyte shifts, diabetic ketoacidosis, and hyperosmolar states.
Insulin inhibits both gluconeogenesis and conversion of glycogen to glucose, processes that occur regardless of food intake. It also inhibits degradation of fats to fatty acids and of fatty acids to ketones. This is why inadequate insulin dosing can lead to uncontrolled hyperglycemia and even ketoacidosis, and thus why long-acting insulin is needed in a fasting state.
STEP 1: ASCERTAIN THE TYPE OF DIABETES
Does the patient have type 1 or type 2 diabetes, and does that even matter?
The type of diabetes should not matter, since ideally the insulin should be dosed the same for both types. However, the consequences of inappropriate insulin management may be different.
Usually, the type of diabetes can be ascertained by the history. If the patient was diagnosed at age 40 or later and was on oral medication for years before insulin was started, then he or she most likely has type 2. If the patient was younger than 40 at the time of diagnosis, was lean, and was started on insulin within a year of diagnosis, then he or she likely has type 1.
If this information is not available or is unreliable and the patient has been on insulin for many years, we recommend viewing the patient as being insulinopenic, ie, not producing enough insulin endogenously and thus requiring insulin at all times.
Though checking for antibody markers of type 1 diabetes might give a more definitive answer, it is not practical before surgery.
In the setting of surgical stress, withholding the basal insulin preoperatively and just giving a small dose of fast-acting (see Table 1 for the different classes of insulin) or shortacting insulin as part of a sliding scale (ie, insulin given only when the blood glucose reaches a certain high level) can send a patient with type 1 diabetes into diabetic ketoacidosis by the end of the day. This is less likely to occur in a patient with type 2 diabetes with some endogenous insulin secretion.
STEP 2: ADJUST THE BASAL INSULIN
Basal insulin is the insulin that the healthy person’s body produces when fasting. For a diabetic patient already on insulin, basal insulin is insulin injected to prevent ketogenesis, glycogenolysis, and gluconeogenesis in the fasting state.
If the basal insulin is long-acting
Long-acting insulins have a relatively peakless profile and, when properly dosed, should not result in hypoglycemia when a patient is fasting.
Preoperatively, the patient should take it as close as possible to the usual time of injection. This could be at home either at bedtime the night before surgery or the morning of surgery. If there is concern for hypoglycemia, the injection can be given when the patient is at the hospital.
- If the patient does not tend to have hypoglycemic episodes and the total daily basal insulin dose is roughly the same as the total daily mealtime (prandial) dose (eg, 50% basal, 50% prandial ratio), the full dose of basal insulin can be given.3
Example: If the patient is on insulin glargine 30 U at bedtime and insulin lispro 10 U with each meal and does not have hypoglycemic episodes, then insulin glargine 30 U should be taken at bedtime.
- If the patient has hypoglycemic episodes at home, then the basal insulin can be reduced by 25%.3
Example: If the patient is on insulin glargine 30 U at bedtime and insulin glulisine 10 U with each meal (appropriate proportion of doses, similar to the example above) but has hypoglycemic episodes at home on this regimen, then only 22 U of insulin glargine should be taken at bedtime.
- If the patient’s regimen has disproportionately more basal insulin than mealtime insulin, then the total daily doses can be added and half can be given as the basal insulin.
Example: If the patient is on insulin detemir 30 U every morning at 6 am and insulin aspart 6 U with each meal and has no hypoglycemic episodes, then 24 U of insulin detemir should be taken in the morning (ie, half of the total of 30 + 6 + 6 + 6).
- In the less common scenario of diabetes managed only with basal insulin (no other diabetes injections or oral agents), then half of the dose can be given.
- If the patient is on twice-daily long-acting basal insulin, then both the dose the night before surgery and the dose the morning of surgery should be adjusted.
If the basal insulin is intermediate-acting
The intermediate-acting insulin neutral protamine Hagedorn (NPH) is usually given twice a day because of its profile (Table 1).
- On the night before surgery, the full dose of NPH insulin should be taken, unless the patient will now skip a nighttime meal because of taking nothing by mouth, in which case the dose can be decreased by 25%.1
- On the morning of surgery, since the patient will be skipping breakfast and probably also lunch, the dose should be reduced by 50%.3,4
Special situation: Premixed insulins
Premixed insulins (70/30, 75/25) are a combination of intermediate-acting insulin and either fast-acting or short-acting insulin. In other words, they are combinations of basal and prandial insulin. Their use is thus not ideal in the preoperative period. There are two options in these situations.
One option is to switch to a regimen that includes long-acting insulin. If the patient is admitted for surgery, then the hospital staff can change the insulin regimen to long-acting basal insulin. A quick formula for conversion is to add all the premixed insulin doses and give half as basal insulin on the morning of surgery, similar to the scenario above for the patient with long-acting basal insulin that was out of proportion to the prandial insulin injections.
For example, if the usual regimen is insulin 70/30 NPH/Regular, 60 U with breakfast, 30 U with dinner, then the patient can take 45 U of insulin glargine (which is half of 60 + 30) in the morning or evening before surgery.
Another option is to adjust the dose of pre-mixed insulin. Sometimes it is not feasible or economical to change the patient’s premixed insulin just before surgery. In these situations, the patient can take half of the morning dose, followed by dextrose-containing intravenous fluids and blood glucose checks.
We recommend preoperatively giving at least part of the patient’s previous basal insulin, regardless of the type of diabetes, the type of surgery, or the fasting period.
STEP 3: STOP THE PRANDIAL INSULIN
Prandial insulin—given before each meal to cover the carbohydrates to be consumed—should be stopped the morning of surgery.3,4
WHAT ABOUT SLIDING SCALE INSULIN?
Using a sliding scale alone has no known benefit. Although it can be a quick fix to correct a high glucose level, it should be added to the basal insulin and not used as the sole insulin therapy. If a sliding scale is used, fast-acting insulin (aspart, glulisine, lispro) is preferred over regular insulin because of the more rapid onset and shorter duration of action.
Patients already using a supplemental insulin scale can apply it to correct a blood glucose above 200 mg/dL on the morning of surgery.
MAINTENANCE FLUIDS
As long as glucose levels are not very elevated (ie, > 200 mg/dL), after 12 hours on a nothing-by-mouth regimen, provide dextrose in the IV fluid to prevent hypoglycemia (eg, the patient received long-acting insulin and the glucose levels are running low) or to prevent starvation ketosis, which may result in ketones in the blood or urine. We recommend 5% dextrose in half-normal (0.45%) saline at 50 to 75 mL/hour as maintenance fluid; the infusion rate should be lower if fluid overload is a concern.
POSTOPERATIVE INSULIN MANAGEMENT
Once patients are discharged and can go back to their previous routine, they can restart their usual insulin regimen the same evening. The prandial insulin will be resumed when the regular diet is reintroduced, and the doses will be adjusted according to food intake.
- Joshi GP, Chung F, Vann MA, et al; Society for Ambulatory Anesthesia. Society for Ambulatory Anesthesia consensus statement on perioperative blood glucose management in diabetic patients undergoing ambulatory surgery. Anesth Analg 2010; 111:1378–1387.
- DiNardo M, Donihi AC, Forte P, Gieraltowski L, Korytkowski M. Standardized glycemic management and perioperative glycemic outcomes in patients with diabetes mellitus who undergo same-day surgery. Endocr Pract 2011; 17:404–411.
- Vann MA. Perioperative management of ambulatory surgical patients with diabetes mellitus. Curr Opin Anaesthesiol 2009; 22:718–724.
- Meneghini LF. Perioperative management of diabetes: translating evidence into practice. Cleve Clin J Med 2009; 76(suppl 4):S53–S59.