User login
Promoting Professionalism
Unprofessional behavior in the inpatient setting has the potential to impact care delivery and the quality of trainee's educational experience. These behaviors, from disparaging colleagues to blocking admissions, can negatively impact the learning environment. The learning environment or conditions created by the patient care team's actions play a critical role in the development of trainees.[1, 2] The rising presence of hospitalists in the inpatient setting raises the question of how their actions impact the learning environment. Professional behavior has been defined as a core competency for hospitalists by the Society of Hospital Medicine.[3] Professional behavior of all team members, from faculty to trainee, can impact the learning environment and patient safety.[4, 5] However, few educational materials exist to train faculty and housestaff on recognizing and ameliorating unprofessional behaviors.
A prior assessment regarding hospitalists' lapses in professionalism identified scenarios that demonstrated increased participation by hospitalists at 3 institutions.[6] Participants reported observation or participation in specific unprofessional behaviors and rated their perception of these behaviors. Additional work within those residency environments demonstrated that residents' perceptions of and participation in these behaviors increased throughout training, with environmental characteristics, specifically faculty behavior, influencing trainee professional development and acclimation of these behaviors.[7, 8]
Although overall participation in egregious behavior was low, resident participation in 3 categories of unprofessional behavior increased during internship. Those scenarios included disparaging the emergency room or primary care physician for missed findings or management decisions, blocking or not taking admissions appropriate for the service in question, and misrepresenting a test as urgent to expedite obtaining the test. We developed our intervention focused on these areas to address professionalism lapses that occur during internship. Our earlier work showed faculty role models influenced trainee behavior. For this reason, we provided education to both residents and hospitalists to maximize the impact of the intervention.
We present here a novel, interactive, video‐based workshop curriculum for faculty and trainees that aims to illustrate unprofessional behaviors and outlines the role faculty may play in promoting such behaviors. In addition, we review the result of postworkshop evaluation on intent to change behavior and satisfaction.
METHODS
A grant from the American Board of Internal Medicine Foundation supported this project. The working group that resulted, the Chicago Professional Practice Project and Outcomes, included faculty representation from 3 Chicago‐area hospitals: the University of Chicago, Northwestern University, and NorthShore University HealthSystem. Academic hospitalists at these sites were invited to participate. Each site also has an internal medicine residency program in which hospitalists were expected to attend the teaching service. Given this, resident trainees at all participating sites, and 1 community teaching affiliate program (Mercy Hospital and Medical Center) where academic hospitalists at the University of Chicago rotate, were recruited for participation. Faculty champions were identified for each site, and 1 internal and external faculty representative from the working group served to debrief and facilitate. Trainee workshops were administered by 1 internal and external collaborator, and for the community site, 2 external faculty members. Workshops were held during established educational conference times, and lunch was provided.
Scripts highlighting each of the behaviors identified in the prior survey were developed and peer reviewed for clarity and face validity across the 3 sites. Medical student and resident actors were trained utilizing the finalized scripts, and a performance artist affiliated with the Screen Actors Guild assisted in their preparation for filming. All videos were filmed at the University of Chicago Pritzker School of Medicine Clinical Performance Center. The final videos ranged in length from 4 to 7 minutes and included title, cast, and funding source. As an example, 1 video highlighted the unprofessional behavior of misrepresenting a test as urgent to prioritize one's patient in the queue. This video included a resident, intern, and attending on inpatient rounds during which the resident encouraged the intern to misrepresent the patient's status to expedite obtaining the study and facilitate the patient's discharge. The resident stressed that he would be in the clinic and had many patients to see, highlighting the impact of workload on unprofessional behavior, and aggressively persuaded the intern to sell her test to have it performed the same day. When this occurred, the attending applauded the intern for her strong work.
A moderator guide and debriefing tools were developed to facilitate discussion. The duration of each of the workshops was approximately 60 minutes. After welcoming remarks, participants were provided tools to utilize during the viewing of each video. These checklists noted the roles of those depicted in the video, asked to identify positive or negative behaviors displayed, and included questions regarding how behaviors could be detrimental and how the situation could have been prevented. After viewing the videos, participants divided into small groups to discuss the individual exhibiting the unprofessional behavior, their perceived motivation for said behavior, and its impact on the team culture and patient care. Following a small‐group discussion, large‐group debriefing was performed, addressing the barriers and facilitators to professional behavior. Two videos were shown at each workshop, and participants completed a postworkshop evaluation. Videos chosen for viewing were based upon preworkshop survey results that highlighted areas of concern at that specific site.
Postworkshop paper‐based evaluations assessed participants' perception of displayed behaviors on a Likert‐type scale (1=unprofessional to 5=professional) utilizing items validated in prior work,[6, 7, 8] their level of agreement regarding the impact of video‐based exercises, and intent to change behavior using a Likert‐type scale (1=strongly disagree to 5=strongly agree). A constructed‐response section for comments regarding their experience was included. Descriptive statistics and Wilcoxon rank sum analyses were performed.
RESULTS
Forty‐four academic hospitalist faculty members (44/83; 53%) and 244 resident trainees (244/356; 68%) participated. When queried regarding their perception of the displayed behaviors in the videos, nearly 100% of faculty and trainees felt disparaging the emergency department or primary care physician for missed findings or clinical decisions was somewhat unprofessional or unprofessional. Ninety percent of hospitalists and 93% of trainees rated celebrating a blocked admission as somewhat unprofessional or unprofessional (Table 1).
| Behavior | Faculty Rated as Unprofessional or Somewhat Unprofessional (n = 44) | Housestaff Rated as Unprofessional or Somewhat Unprofessional (n=244) |
|---|---|---|
| ||
| Disparaging the ED/PCP to colleagues for findings later discovered on the floor or patient care management decisions | 95.6% | 97.5% |
| Refusing an admission that could be considered appropriate for your service (eg, blocking) | 86.4% | 95.1% |
| Celebrating a blocked admission | 90.1% | 93.0% |
| Ordering a routine test as urgent to get it expedited | 77.2% | 80.3% |
The scenarios portrayed were well received, with more than 85% of faculty and trainees agreeing that the behaviors displayed were realistic. Those who perceived videos as very realistic were more likely to report intent to change behavior (93% vs 53%, P=0.01). Nearly two‐thirds of faculty and 67% of housestaff expressed agreement that they intended to change behavior based upon the experience (Table 2).
| Evaluation Item | Faculty Level of Agreement (StronglyAgree or Agree) (n=44) | Housestaff Level of Agreement (Strongly Agree or Agree) (n=244) |
|---|---|---|
| The scenarios portrayed in the videos were realistic | 86.4% | 86.9% |
| I will change my behavior as a result of this exercise | 65.9% | 67.2% |
| I feel that this was a useful and effective exercise | 65.9% | 77.1% |
Qualitative comments in the constructed‐response portion of the evaluation noted the effectiveness of the interactive materials. In addition, the need for focused faculty development was identified by 1 respondent who stated: If unprofessional behavior is the unwritten curriculum, there needs to be an explicit, written curriculum to address it. Finally, the aim of facilitating self‐reflection is echoed in this faculty respondent's comment: Always good to be reminded of our behaviors and the influence they have on others and from this resident physician It helps to re‐evaluate how you talk to people.
CONCLUSIONS
Faculty can be a large determinant of the learning environment and impact trainees' professional development.[9] Hospitalists should be encouraged to embrace faculty role‐modeling of effective professional behaviors, especially given their increased presence in the inpatient learning environment. In addition, resident trainees and their behaviors contribute to the learning environment and influence the further professional development of more junior trainees.[10] Targeting professionalism education toward previously identified and prevalent unprofessional behaviors in the inpatient care of patients may serve to affect the most change among providers who practice in this setting. Individualized assessment of the learning environment may aid in identifying common scenarios that may plague a specific learning culture, allowing for relevant and targeted discussion of factors that promote and perpetuate such behaviors.[11]
Interactive, video‐based modules provided an effective way to promote interactive reflection and robust discussion. This model of experiential learning is an effective form of professional development as it engages the learner and stimulates ongoing incorporation of the topics addressed.[12, 13] Creating a shared concrete experience among targeted learners, using the video‐based scenarios, stimulates reflective observation, and ultimately experimentation, or incorporation into practice.[14]
There are several limitations to our evaluation including that we focused solely on academic hospitalist programs, and our sample size for faculty and residents was small. Also, we only addressed a small, though representative, sample of unprofessional behaviors and have not yet linked intervention to actual behavior change. Finally, the script scenarios that we used in this study were not previously published as they were created specifically for this intervention. Validity evidence for these scenarios include that they were based upon the results of earlier work from our institutions and underwent thorough peer review for content and clarity. Further studies will be required to do this. However, we do believe that these are positive findings for utilizing this type of interactive curriculum for professionalism education to promote self‐reflection and behavior change.
Video‐based professionalism education is a feasible, interactive mechanism to encourage self‐reflection and intent to change behavior among faculty and resident physicians. Future study is underway to conduct longitudinal assessments of the learning environments at the participating institutions to assess culture change, perceptions of behaviors, and sustainability of this type of intervention.
Disclosures: The authors acknowledge funding from the American Board of Internal Medicine. The funders had no role in the design of the study; the collection, analysis, and interpretation of the data; or the decision to approve publication of the finished manuscript. Results from this work have been presented at the Midwest Society of General Internal Medicine Regional Meeting, Chicago, Illinois, September 2011; Midwest Society of Hospital Medicine Regional Meeting, Chicago, Illinois, October 2011, and Society of Hospital Medicine Annual Meeting, San Diego, California, April 2012. The authors declare that they do not have any conflicts of interest to disclose.
- Liaison Committee on Medical Education. Functions and structure of a medical school. Available at: http://www.lcme.org/functions.pdf. Accessed October 10, 2012.
- , , , , . Residents' perceptions of their own professionalism and the professionalism of their learning environment. J Grad Med Educ. 2009;1:208–215.
- Society of Hospital Medicine. The core competencies in hospital medicine. http://www.hospitalmedicine.org/Content/NavigationMenu/Education/CoreCurriculum/Core_Competencies.htm. Accessed October 10, 2012.
- The Joint Commission. Behaviors that undermine a culture of safety. Sentinel Event Alert. 2008;(40):1–3. http://www.jointcommission.org/assets/1/18/SEA_40.pdf. Accessed October 10, 2012.
- , . A survey of the impact of disruptive behaviors and communication defects on patient safety. Jt Comm J Qual Patient Saf. 2008;34:464–471.
- , , , et al. Participation in unprofessional behaviors among hospitalists: a multicenter study. J Hosp Med. 2012;7(7):543–550.
- , , et al. Participation in and perceptions of unprofessional behaviors among incoming internal medicine interns. JAMA. 2008;300:1132–1134.
- , , , et al., Changes in perception of and participation in unprofessional behaviors during internship. Acad Med. 2010;85:S76–S80.
- , , , et al. Perspective: beyond counting hours: the importance of supervision, professionalism, transitions of care, and workload in residency training. Acad Med. 2012;87(7):883–888.
- , . The role of the student‐teacher relationship in the formation of physicians: the hidden curriculum as process. J Gen Intern Med. 2006;21:S16–S20.
- , , , et al. Evidence for validity of a survey to measure the learning environment for professionalism. Med Teach. 2011;33(12):e683–e688.
- . Experiential Learning: Experience as the Source of Learning and Development. Englewood Cliffs, NJ: Prentice Hall; 1984.
- , . How can physicians' learning style drive educational planning? Acad Med. 2005;80:680–84.
- , . Twenty years of experience using trigger films as a teaching tool. Acad Med. 2001;76:656–658.
Unprofessional behavior in the inpatient setting has the potential to impact care delivery and the quality of trainee's educational experience. These behaviors, from disparaging colleagues to blocking admissions, can negatively impact the learning environment. The learning environment or conditions created by the patient care team's actions play a critical role in the development of trainees.[1, 2] The rising presence of hospitalists in the inpatient setting raises the question of how their actions impact the learning environment. Professional behavior has been defined as a core competency for hospitalists by the Society of Hospital Medicine.[3] Professional behavior of all team members, from faculty to trainee, can impact the learning environment and patient safety.[4, 5] However, few educational materials exist to train faculty and housestaff on recognizing and ameliorating unprofessional behaviors.
A prior assessment regarding hospitalists' lapses in professionalism identified scenarios that demonstrated increased participation by hospitalists at 3 institutions.[6] Participants reported observation or participation in specific unprofessional behaviors and rated their perception of these behaviors. Additional work within those residency environments demonstrated that residents' perceptions of and participation in these behaviors increased throughout training, with environmental characteristics, specifically faculty behavior, influencing trainee professional development and acclimation of these behaviors.[7, 8]
Although overall participation in egregious behavior was low, resident participation in 3 categories of unprofessional behavior increased during internship. Those scenarios included disparaging the emergency room or primary care physician for missed findings or management decisions, blocking or not taking admissions appropriate for the service in question, and misrepresenting a test as urgent to expedite obtaining the test. We developed our intervention focused on these areas to address professionalism lapses that occur during internship. Our earlier work showed faculty role models influenced trainee behavior. For this reason, we provided education to both residents and hospitalists to maximize the impact of the intervention.
We present here a novel, interactive, video‐based workshop curriculum for faculty and trainees that aims to illustrate unprofessional behaviors and outlines the role faculty may play in promoting such behaviors. In addition, we review the result of postworkshop evaluation on intent to change behavior and satisfaction.
METHODS
A grant from the American Board of Internal Medicine Foundation supported this project. The working group that resulted, the Chicago Professional Practice Project and Outcomes, included faculty representation from 3 Chicago‐area hospitals: the University of Chicago, Northwestern University, and NorthShore University HealthSystem. Academic hospitalists at these sites were invited to participate. Each site also has an internal medicine residency program in which hospitalists were expected to attend the teaching service. Given this, resident trainees at all participating sites, and 1 community teaching affiliate program (Mercy Hospital and Medical Center) where academic hospitalists at the University of Chicago rotate, were recruited for participation. Faculty champions were identified for each site, and 1 internal and external faculty representative from the working group served to debrief and facilitate. Trainee workshops were administered by 1 internal and external collaborator, and for the community site, 2 external faculty members. Workshops were held during established educational conference times, and lunch was provided.
Scripts highlighting each of the behaviors identified in the prior survey were developed and peer reviewed for clarity and face validity across the 3 sites. Medical student and resident actors were trained utilizing the finalized scripts, and a performance artist affiliated with the Screen Actors Guild assisted in their preparation for filming. All videos were filmed at the University of Chicago Pritzker School of Medicine Clinical Performance Center. The final videos ranged in length from 4 to 7 minutes and included title, cast, and funding source. As an example, 1 video highlighted the unprofessional behavior of misrepresenting a test as urgent to prioritize one's patient in the queue. This video included a resident, intern, and attending on inpatient rounds during which the resident encouraged the intern to misrepresent the patient's status to expedite obtaining the study and facilitate the patient's discharge. The resident stressed that he would be in the clinic and had many patients to see, highlighting the impact of workload on unprofessional behavior, and aggressively persuaded the intern to sell her test to have it performed the same day. When this occurred, the attending applauded the intern for her strong work.
A moderator guide and debriefing tools were developed to facilitate discussion. The duration of each of the workshops was approximately 60 minutes. After welcoming remarks, participants were provided tools to utilize during the viewing of each video. These checklists noted the roles of those depicted in the video, asked to identify positive or negative behaviors displayed, and included questions regarding how behaviors could be detrimental and how the situation could have been prevented. After viewing the videos, participants divided into small groups to discuss the individual exhibiting the unprofessional behavior, their perceived motivation for said behavior, and its impact on the team culture and patient care. Following a small‐group discussion, large‐group debriefing was performed, addressing the barriers and facilitators to professional behavior. Two videos were shown at each workshop, and participants completed a postworkshop evaluation. Videos chosen for viewing were based upon preworkshop survey results that highlighted areas of concern at that specific site.
Postworkshop paper‐based evaluations assessed participants' perception of displayed behaviors on a Likert‐type scale (1=unprofessional to 5=professional) utilizing items validated in prior work,[6, 7, 8] their level of agreement regarding the impact of video‐based exercises, and intent to change behavior using a Likert‐type scale (1=strongly disagree to 5=strongly agree). A constructed‐response section for comments regarding their experience was included. Descriptive statistics and Wilcoxon rank sum analyses were performed.
RESULTS
Forty‐four academic hospitalist faculty members (44/83; 53%) and 244 resident trainees (244/356; 68%) participated. When queried regarding their perception of the displayed behaviors in the videos, nearly 100% of faculty and trainees felt disparaging the emergency department or primary care physician for missed findings or clinical decisions was somewhat unprofessional or unprofessional. Ninety percent of hospitalists and 93% of trainees rated celebrating a blocked admission as somewhat unprofessional or unprofessional (Table 1).
| Behavior | Faculty Rated as Unprofessional or Somewhat Unprofessional (n = 44) | Housestaff Rated as Unprofessional or Somewhat Unprofessional (n=244) |
|---|---|---|
| ||
| Disparaging the ED/PCP to colleagues for findings later discovered on the floor or patient care management decisions | 95.6% | 97.5% |
| Refusing an admission that could be considered appropriate for your service (eg, blocking) | 86.4% | 95.1% |
| Celebrating a blocked admission | 90.1% | 93.0% |
| Ordering a routine test as urgent to get it expedited | 77.2% | 80.3% |
The scenarios portrayed were well received, with more than 85% of faculty and trainees agreeing that the behaviors displayed were realistic. Those who perceived videos as very realistic were more likely to report intent to change behavior (93% vs 53%, P=0.01). Nearly two‐thirds of faculty and 67% of housestaff expressed agreement that they intended to change behavior based upon the experience (Table 2).
| Evaluation Item | Faculty Level of Agreement (StronglyAgree or Agree) (n=44) | Housestaff Level of Agreement (Strongly Agree or Agree) (n=244) |
|---|---|---|
| The scenarios portrayed in the videos were realistic | 86.4% | 86.9% |
| I will change my behavior as a result of this exercise | 65.9% | 67.2% |
| I feel that this was a useful and effective exercise | 65.9% | 77.1% |
Qualitative comments in the constructed‐response portion of the evaluation noted the effectiveness of the interactive materials. In addition, the need for focused faculty development was identified by 1 respondent who stated: If unprofessional behavior is the unwritten curriculum, there needs to be an explicit, written curriculum to address it. Finally, the aim of facilitating self‐reflection is echoed in this faculty respondent's comment: Always good to be reminded of our behaviors and the influence they have on others and from this resident physician It helps to re‐evaluate how you talk to people.
CONCLUSIONS
Faculty can be a large determinant of the learning environment and impact trainees' professional development.[9] Hospitalists should be encouraged to embrace faculty role‐modeling of effective professional behaviors, especially given their increased presence in the inpatient learning environment. In addition, resident trainees and their behaviors contribute to the learning environment and influence the further professional development of more junior trainees.[10] Targeting professionalism education toward previously identified and prevalent unprofessional behaviors in the inpatient care of patients may serve to affect the most change among providers who practice in this setting. Individualized assessment of the learning environment may aid in identifying common scenarios that may plague a specific learning culture, allowing for relevant and targeted discussion of factors that promote and perpetuate such behaviors.[11]
Interactive, video‐based modules provided an effective way to promote interactive reflection and robust discussion. This model of experiential learning is an effective form of professional development as it engages the learner and stimulates ongoing incorporation of the topics addressed.[12, 13] Creating a shared concrete experience among targeted learners, using the video‐based scenarios, stimulates reflective observation, and ultimately experimentation, or incorporation into practice.[14]
There are several limitations to our evaluation including that we focused solely on academic hospitalist programs, and our sample size for faculty and residents was small. Also, we only addressed a small, though representative, sample of unprofessional behaviors and have not yet linked intervention to actual behavior change. Finally, the script scenarios that we used in this study were not previously published as they were created specifically for this intervention. Validity evidence for these scenarios include that they were based upon the results of earlier work from our institutions and underwent thorough peer review for content and clarity. Further studies will be required to do this. However, we do believe that these are positive findings for utilizing this type of interactive curriculum for professionalism education to promote self‐reflection and behavior change.
Video‐based professionalism education is a feasible, interactive mechanism to encourage self‐reflection and intent to change behavior among faculty and resident physicians. Future study is underway to conduct longitudinal assessments of the learning environments at the participating institutions to assess culture change, perceptions of behaviors, and sustainability of this type of intervention.
Disclosures: The authors acknowledge funding from the American Board of Internal Medicine. The funders had no role in the design of the study; the collection, analysis, and interpretation of the data; or the decision to approve publication of the finished manuscript. Results from this work have been presented at the Midwest Society of General Internal Medicine Regional Meeting, Chicago, Illinois, September 2011; Midwest Society of Hospital Medicine Regional Meeting, Chicago, Illinois, October 2011, and Society of Hospital Medicine Annual Meeting, San Diego, California, April 2012. The authors declare that they do not have any conflicts of interest to disclose.
- Liaison Committee on Medical Education. Functions and structure of a medical school. Available at: http://www.lcme.org/functions.pdf. Accessed October 10, 2012.
- , , , , . Residents' perceptions of their own professionalism and the professionalism of their learning environment. J Grad Med Educ. 2009;1:208–215.
- Society of Hospital Medicine. The core competencies in hospital medicine. http://www.hospitalmedicine.org/Content/NavigationMenu/Education/CoreCurriculum/Core_Competencies.htm. Accessed October 10, 2012.
- The Joint Commission. Behaviors that undermine a culture of safety. Sentinel Event Alert. 2008;(40):1–3. http://www.jointcommission.org/assets/1/18/SEA_40.pdf. Accessed October 10, 2012.
- , . A survey of the impact of disruptive behaviors and communication defects on patient safety. Jt Comm J Qual Patient Saf. 2008;34:464–471.
- , , , et al. Participation in unprofessional behaviors among hospitalists: a multicenter study. J Hosp Med. 2012;7(7):543–550.
- , , et al. Participation in and perceptions of unprofessional behaviors among incoming internal medicine interns. JAMA. 2008;300:1132–1134.
- , , , et al., Changes in perception of and participation in unprofessional behaviors during internship. Acad Med. 2010;85:S76–S80.
- , , , et al. Perspective: beyond counting hours: the importance of supervision, professionalism, transitions of care, and workload in residency training. Acad Med. 2012;87(7):883–888.
- , . The role of the student‐teacher relationship in the formation of physicians: the hidden curriculum as process. J Gen Intern Med. 2006;21:S16–S20.
- , , , et al. Evidence for validity of a survey to measure the learning environment for professionalism. Med Teach. 2011;33(12):e683–e688.
- . Experiential Learning: Experience as the Source of Learning and Development. Englewood Cliffs, NJ: Prentice Hall; 1984.
- , . How can physicians' learning style drive educational planning? Acad Med. 2005;80:680–84.
- , . Twenty years of experience using trigger films as a teaching tool. Acad Med. 2001;76:656–658.
Acute Vertebral Fracture
An 89‐year‐old female presents to the Emergency Department with lower back pain for the past 5 days. The patient has a past medical history of polymyalgia rheumatica and hypothyroidism. Her medications include prednisone 10 mg daily and levothyroxine 50 g daily. Aside from tenderness over the third lumbar vertebra, her physical exam is unremarkable. An x‐ray shows a fracture of the third lumbar vertebra. Basic laboratory studies, including calcium and creatinine are normal.
The Clinical Problem and Impact
Vertebral fractures (often termed vertebral compression fractures) affect approximately 25% of all postmenopausal women.1, 2 Only one‐third of vertebral fractures are brought to medical attention.3, 4 In the remaining two‐thirds, patients are either asymptomatic or do not seek medical attention. The lifetime risk of a clinical vertebral fracture is approximately 16% and 5% in white women and men, respectively.1 The risk of vertebral fracture increases with age, lower bone mineral density (BMD), and prior vertebral fracture.1, 5 Women with a preexisting vertebral fracture have a 5‐fold increased risk for a new vertebral fracture relative to those without a history of vertebral fracture.5, 6 Approximately 20% of women who sustain a vertebral fracture will have a new vertebral fracture in the subsequent year.5, 6 Vertebral fractures are frequently overlooked on chest x‐rays and hence there is a need for increased awareness and improved recognition of radiographically‐demonstrated fractures.7 Hospitalists must appreciate that a vertebral fracture is often the first clue to underlying osteoporosis. At least 90% of vertebral and hip fractures are attributable to osteoporosis.5
Typically, the pain related to an acute vertebral fracture improves over 4 to 6 weeks.8, 9 However, pain can persist, resulting in functional impairment, and a decline in the quality of life.1013 Vertebral fractures may lead to kyphosis and reduced lung function. This, in turn, may increase the risk for pneumonia, the most common cause of death in patients with osteoporosis.4 Both clinical and subclinical vertebral fractures are, in fact, independently associated with increased mortality,4, 14, 15 particularly in the period immediately following the event.16 The economic impact of osteoporosis and its related fractures is substantial.1719 In 1995, the annual direct medical cost for the inpatient care of vertebral fractures was estimated to be $575 million.19
Evidence‐Based Approach to the Hospitalized Patient
Evaluation
Vertebral fractures most commonly occur between T7 and L4. Acute vertebral fracture pain is typically sudden in onset and located in the mid to lower back. The pain may occur while performing an ordinary task such as lifting an object or bending over, although in many cases there is no preceding trauma. Physical activity exacerbates the pain and patients' movements may be limited due to pain. Spinal tenderness is usually present. A history of weight loss, prior malignancy, or fever should serve as red flags to the hospitalist and prompt evaluation for underlying malignancy or infection.
For a suspected fracture, frontal and lateral radiographs of the thoracolumbar spine are the initial imaging of choice. Magnetic resonance imaging (MRI) is useful when infection, malignancy, or spinal cord compression is suspected. The presence of neurological deficits should always prompt imaging with MRI or computed tomography (CT).
Patients with vertebral fractures should be evaluated with bone density testing, as osteoporosis is usually the underlying etiology. Because a number of medical conditions commonly contribute to bone loss (Table 1), laboratory testing is indicated for most patients. Although debate exists as to the optimal testing strategy,20 the National Osteoporosis Foundation guidelines recommend the evaluation of blood count, chemistry, and thyroid‐stimulating hormone (TSH) in patients with osteoporosis.21 Because vitamin D deficiency is common in patients who sustain osteoporotic fractures, 25‐hydroxyvitamin D levels should be checked in most patients.2225 Depending on the clinical scenario, additional testing may include the following: serum testosterone, serum intact parathyroid hormone (PTH), 24‐hour calcium excretion, serum protein electrophoresis, urine protein electrophoresis, erythrocyte sedimentation rate, and celiac sprue antibodies.26
| Endocrine disease or metabolic causes | Hypogonadism |
| Cushing's syndrome | |
| Hyperthyroidism | |
| Anorexia nervosa | |
| Hyperparathyroidism | |
| Nutritional conditions | Vitamin D deficiency |
| Calcium deficiency | |
| Malabsorption | |
| Drugs | Glucocorticoids |
| Antiepileptic drugs | |
| Excessive thyroid medication | |
| Long‐term heparin or low molecular weight heparin therapy (eg, >1 month) | |
| Other | Multiple myeloma |
| Rheumatoid arthritis | |
| Organ transplantation |
Management
Short Term
Short‐term management goals include the relief of pain and recovery of mobility. Nonsteroidal antiinflammatory drugs (NSAIDs) and low‐dose opioid medications should be used first in an effort to relieve pain. Beyond its potential effect on bone density, calcitonin (Miacalcin, Fortical) has long been used in acute vertebral fractures for analgesia. A systematic review of 5 randomized controlled trials concluded that calcitonin significantly reduced the pain from acute vertebral fractures.27 Calcitonin improved pain as early as 1 week into treatment and the benefit was persistent at 4 weeks. The analgesic mechanism of action for calcitonin is not entirely clear. Proposed mechanisms include increased ‐endorphin release, an antiinflammatory effect, and a direct effect on specific receptors in the central nervous system.27, 28
Pamidronate (Aredia) also has shown efficacy at reducing acute fracture pain. In a double‐blinded trial, Armigeat et al.29 evaluated pamidronate 30 mg daily for 3 days as compared to placebo in 32 patients. Pain scores were improved at 7 and 30 days with pamidronate. The mechanism of analgesia is unclear. Bisphosphonates are known to inhibit osteoclast activity, but may also work by blocking the effect of inflammatory cytokines.29
Early pain relief is critical in order to encourage physical activity. Bed rest should be avoided, as immobility may increase the risk for pressure ulcers, venous thromboembolism, and pneumonia.3033 Although bracing is frequently used in acute vertebral fracture, the modality has not been formally studied. Although also not well studied in the acute setting, physical therapy has been shown to reduce pain and improve functioning for patients with chronic pain from vertebral fracture,34 and is generally recommended.35
Percutaneous vertebral augmentation procedures include vertebroplasty and kyphoplasty. In vertebroplasty, polymethylmethacrylate cement is injected through a needle under fluoroscopic guidance into the collapsed vertebral body. With kyphoplasty, balloon tamps are used to elevate vertebral endplates prior to injection of cement (Figure 1).36 The proposed mechanism of action for both procedures is stabilization of the fracture by the hardened polymethylmethacrylate cement. These procedures are commonly performed by interventional radiologists without the need for general anesthesia; however, depending on the institution, they may be done by orthopedic surgeons, neurosurgeons, or anesthesiologists. The procedure can be performed as an outpatient, if indicated. Although the volume of these procedures has grown dramatically in recent years,37, 38 the quality of evidence supporting their use is relatively weak.3941 Only 1 randomized controlled trial has been published evaluating the potential benefit of vertebroplasty over conservative management.42 Voormolen et al.42 evaluated patients with vertebral fractures and pain refractive to 6 weeks of optimal medical therapy. Patients were treated with vertebroplasty or continuation of medical therapy. Vertebroplasty significantly improved pain initially, but not after 2 weeks. Like the study by Voormolen et al.,42 most studies evaluating percutaneous vertebral augmentation procedures have been conducted on patients with long‐term pain refractory to medical management. One notable exception is a nonrandomized trial published by Diamond et al.6 In that study, 55 patients were treated with vertebroplasty while 24 were treated conservatively. Pain at 24 hours was significantly improved in patients treated with vertebroplasty. At 6 weeks, however, there was no difference among the 2 groups.

The risk of short‐term complications from vertebral augmentation procedures is difficult to assess in light of the small sample sizes and methodological limitations of existing studies. Cement leakage occurs in 40% to 41% of patients treated with vertebroplasty, as compared with 8% to 9% with kyphoplasty.39, 41 Pulmonary emboli occur in 0.6% and 0.01% of patients treated with vertebroplasty and kyphoplasty, respectively, while neurologic complications occur in 0.6% and 0.03% of patients.41 Concern exists about whether percutaneous vertebral augmentation procedures might increase the risk for subsequent fractures,43, 44 as the incidence of new fractures appears to be elevated in the period immediately following the procedure and approximately two‐thirds of new fractures occur in vertebrae adjacent to the augmented vertebra.39, 41, 44 However, the 20% incidence of new vertebral fractures in the year following vertebral augmentation is similar to the fracture rate seen in patients not treated with osteoporosis therapy.44
Assessment of the impact of vertebral augmentation procedures on the cost of care is limited by the lack of high‐quality clinical studies.45, 46 Randomized controlled trials evaluating the benefit and risk of these procedures compared to conservative management are underway.4749 Pending further evidence, these procedures are best reserved for patients who fail to benefit from other measures to control pain and improve mobility.
Long Term
A comprehensive discussion of the long‐term management of osteoporosis is beyond the scope of this work. However, the inpatient setting presents an opportune time to initiate long‐term medical therapy. Studies show that the majority of patients who sustain osteoporotic fractures do not receive pharmacologic treatment for osteoporosis.5053 Hospitalists have the opportunity to start medications that can reduce the risk for subsequent fracture by nearly 50%.5458 A total calcium intake of 1200 to 1500 mg per day and vitamin D of 400 to 800 IU per day are recommended for all postmenopausal women. Patients who smoke should receive smoking cessation counseling and be considered for pharmacologic treatment for tobacco dependence. All patients should be assessed for fall risk, including a review of medications and assessment of alcohol intake.
Before considering pharmacologic treatment for osteoporosis, secondary causes of low bone mass must be excluded. Bisphosphonates are generally considered first‐line pharmacologic therapy for osteoporosis. Alendronate (Fosamax), risedronate (Actonel), and ibandronate (Boniva) have been shown in randomized trials to increase bone density and reduce the risk of osteoporotic fractures.55, 56, 59 Daily, weekly, and monthly preparations of bisphosphonates now exist. Pill‐induced esophagitis is a potential adverse effect of bisphosphonate therapy, but is extremely rare if proper precautions are taken. Patients should take oral bisphosphonates on an empty stomach, with a full glass of water, sitting upright, and have nothing to eat or drink for at least one half hour. If compliance with oral bisphosphonates is not possible, or esophageal abnormalities preclude oral bisphosphonate use, one may consider the use of intravenous ibandronate or zoledronic acid (Reclast). A 3‐year randomized controlled trial of yearly zoledronic acid improved bone density and reduced the incidence of osteoporotic fractures.60 Bisphosphonates are generally not recommended when creatinine clearance is less than 30 mL/minute. Other pharmacologic options for the treatment of osteoporosis include selective estrogen receptor modulators and anabolic agents. The reader is referred to an excellent review by Rosen61 for additional discussion of these therapies. The American College of Rheumatology clinical guidelines for the management of glucocorticoid induced osteoporosis are also worthy of review.62
Hospitalists are naturally suited to improve the quality of care for patients hospitalized with vertebral fractures. Most patients who currently sustain osteoporotic fractures do not receive appropriate evaluation and treatment. One study used an interdisciplinary team to identify, assess, and begin treatment for appropriate patients hospitalized with osteoporotic fractures.63 The intervention resulted in significantly more patients taking osteoporosis treatment medications 6 months after the incident fracture.
Conclusions
Acute vertebral fracture is a common clinical problem associated with significant morbidity and increased risk of mortality. Treatment of vertebral fracture should include analgesics and physical therapy. Percutaneous augmentation procedures may be considered in patients who fail optimal medical therapy. Because most vertebral fractures are due to osteoporosis and the healthcare system currently fails to appropriately assess and treat most patients who have sustained osteoporotic fractures, hospitalists are in an optimal position to initiate long‐term preventative treatment for these patients.
- .Epidemiology of spinal osteoporosis.Spine.1997;22(24 suppl):2S–11S.
- ,,,,,.Prevalence and incidence of vertebral deformities.Osteoporos Int.1993;3(3):113–119.
- ,,.The epidemiology of vertebral fractures. European Vertebral Osteoporosis Study Group.Bone.1993;14(suppl 1):S89–S97.
- ,,,,,.Vertebral fractures and mortality in older women: a prospective study. Study of Osteoporotic Fractures Research Group.Arch Intern Med.1999;159(11):1215–1220.
- ,,,.Pre‐existing fractures and bone mass predict vertebral fracture incidence in women.Ann Intern Med.1991;114(11):919–923.
- ,,, et al.Risk of new vertebral fracture in the year following a fracture.JAMA.2001;285(3):320–323.
- ,,,,,.Recognition of vertebral fracture in a clinical setting.Osteoporos Int.2000;11(7):577–582.
- ,,.Management of acute osteoporotic vertebral fractures: a nonrandomized trial comparing percutaneous vertebroplasty with conservative therapy.Am J Med.2003;114(4):257–265.
- .The clinical consequences of vertebral compression fracture.Bone.1992;13(suppl 2):S27–S31.
- ,,,.A case‐control study of quality of life and functional impairment in women with long‐standing vertebral osteoporotic fracture.Osteoporos Int.1999;9(6):508–515.
- ,,, et al.The burden of prevalent fractures on health‐related quality of life in postmenopausal women with osteoporosis: the IMOF study.J Rheumatol.2007;34(7):1551–1560.
- ,,,,.The relationship of health‐related quality of life to prevalent and incident vertebral fractures in postmenopausal women with osteoporosis: results from the Multiple Outcomes of Raloxifene Evaluation Study.Arthritis Rheum2001;44(11):2611–2619.
- ,,, et al.The association of radiographically detected vertebral fractures with back pain and function: a prospective study.Ann Int Med.1998;128:793–800.
- ,,,,.Mortality after all major types of osteoporotic fracture in men and women: an observational study.Lancet. 131999;353(9156):878–882.
- ,,,,.Population‐based study of survival after osteoporotic fractures.Am J Epidemiol.1993;137(9):1001–1005.
- ,,,,.Excess mortality after hospitalisation for vertebral fracture.Osteoporos Int.2004;15(2):108–112.
- ,.The cost of treating osteoporotic fractures in the United Kingdom female population.Osteoporos Int.1998;8(6):611–617.
- ,,, et al.Direct medical costs attributable to osteoporotic fractures.Osteoporos Int.2002;13(4):323–330.
- ,,,.Medical expenditures for the treatment of osteoporotic fractures in the United States in 1995: report from the National Osteoporosis Foundation.J Bone Miner Res.1997;12(1):24–35.
- .Laboratory workup for osteoporosis. Which tests are most cost‐effective?Postgrad Med.2003;114(3):35–38,41–34.
- National Osteoporosis Foundation. Clinician's Guide to Prevention and Treatment of Osteoporosis. Available at: http://www.nof.org/professionals/Clinicians_Guide.htm. Accessed February2009.
- ,,, et al.Prevalence of vitamin D inadequacy among postmenopausal North American women receiving osteoporosis therapy.J Clin Endocr Metab.2005;90:3215–3224.
- ,,,,.Prevalence of vitamin D inadequacy in a minimal trauma fracture population.Curr Med Res Opin.2005;21:1069–1074.
- ,,,,,.Occult vitamin D deficiency in postmenopausal US women with acute hip fracture.JAMA.1999;281:1505–1511.
- ,,,,.Secondary contributors for bone loss in osteoporotic hip fractures.Osteoporos Int.2008;19(7):991–999.
- .Evaluation of the patient with osteoporosis or at risk for osteoporosis. In: Marcus R, Feldman D, Kelsey J, eds.Osteoporosis. Vol.2.San Diego:Academic Press;2001:403–408.
- ,,,,.Calcitonin for treating acute pain of osteoporotic vertebral compression fractures: a systematic review of randomized, controlled trials.Osteoporos Int.2005;16(10):1281–1290.
- .Possible mechanisms of the analgesic action of calcitonin.Bone.2002;30(5 suppl):80S–83S.
- ,,,,.Intravenous pamidronate for pain relief in recent osteoporotic vertebral compression fracture: a randomized double‐blind controlled study.Osteoporos Int.2006;17(11):1659–1665.
- ,,,,.Pressure ulcer risk factors among hospitalized patients with activity limitation.JAMA.1995;273(11):865–870.
- ,.Risk factors for venous thromboembolism.Circulation. 172003;107(23 suppl 1):I9–I16.
- ,,.Infectious diseases and mortality among US nursing home residents.Am J Public Health.1993;83(12):1739–1742.
- ,,,,.Risk factors for pneumonia and other lower respiratory tract infections in elderly residents of long‐term care facilities.Arch Intern Med. 271999;159(17):2058–2064.
- ,,,.Positive effects of physiotherapy on chronic pain and performance in osteoporosis.Osteoporos Int.1998;8(3):215–221.
- ,,, et al.Health professional's guide to rehabilitation of the patient with osteoporosis.Osteoporos Int.2003;14(suppl 2):S1–S22.
- ,,,.Vertebral compression fractures: manage aggressively to prevent sequelae.Cleve Clin J Med.2003;70(2):147–156. Reprinted with permission. Copyright (c) 2003 Cleveland Clinic Foundation. All rights reserved.
- ,,,.Vertebroplasty in the United States: guidance method and provider distribution, 2001–2003.Radiology.2007;243(1):166–170.
- ,,,,.Thoracic and lumbar vertebroplasties performed in US Medicare enrollees, 2001–2005.JAMA.2007;298(15):1760–1762.
- ,,.Balloon kyphoplasty and vertebroplasty for vertebral compression fractures: a comparative systematic review of efficacy and safety.Spine.2006;31(23):2747–2755.
- ,,,,.Efficacy and safety of balloon kyphoplasty in the treatment of vertebral compression fractures: a systematic review.Eur Spine J.2006;15(7):1050–1067.
- ,,,.Vertebroplasty and kyphoplasty: a systematic review of 69 clinical studies.Spine.2006;31(17):1983–2001.
- ,,, et al.Percutaneous vertebroplasty compared with optimal pain medication treatment: short‐term clinical outcome of patients with subacute or chronic painful osteoporotic vertebral compression fractures. The VERTOS study.AJNR Am J Neuroradiol.2007;28(3):555–560.
- ,.Recurrent fracture after vertebral kyphoplasty.Spine J.2006;6(5):488–493.
- ,.Does vertebroplasty cause incident vertebral fractures? A review of available data.AJNR Am J Neuroradiol.2006;27(7):1397–1403.
- Centers for Medicare and Medicaid Services. Agency for Healthcare Research and Quality (AHRQ). Technology Assessment. Percutaneous Kyphoplasty for Vertebral Fractures Caused by Osteoporosis and Malignancy, 2005. Available at: http://www.cms.hhs.gov/mcd/viewtechassess.asp?from2=viewtechassess.asp13(5):550–555.
- .Randomized vertebroplasty trials: current status and challenges.Acad Radiol.2006;13(5):546–549.
- ,,, et al.VERTOS II: percutaneous vertebroplasty versus conservative therapy in patients with painful osteoporotic vertebral compression fractures; rationale, objectives and design of a multicenter randomized controlled trial.Trials.2007;8(1):33.
- ,.Vertebroplasty: a promising but as yet unproven intervention for painful osteoporotic spinal fractures.Med J Aust.2006;185(7):351–352.
- ,,, et al.Low frequency of treatment of osteoporosis among postmenopausal women following a fracture.Arch Intern Med.2003;163(17):2052–2057.
- ,,,,.Failure to diagnose and treat osteoporosis in elderly patients hospitalized with hip fracture.Am J Med.2000;109(4):326–328.
- ,,.Missing a therapeutic window of opportunity: an audit of patients attending a tertiary teaching hospital with potentially osteoporotic hip and wrist fractures.J Rheumatol.2001;28(11):2504–2508.
- ,,,,.Underuse of osteoporosis medications in elderly patients with fractures.Am J Med.2003;115(5):398–400.
- ,,, et al.Randomised trial of effect of alendronate on risk of fracture in women with existing vertebral fractures. Fracture Intervention Trial Research Group.Lancet.1996;348(9041):1535–1541.
- ,,,,,.Meta‐analyses of therapies for postmenopausal osteoporosis. IX: Summary of meta‐analyses of therapies for postmenopausal osteoporosis.Endocr Rev.2002;23(4):570–578.
- ,,, et al.Summary of meta‐analyses of therapies for postmenopausal osteoporosis and the relationship between bone density and fractures.Endocrinol Metab Clin North Am.2002;31(3):659–679, xii.
- ,,, et al.Effects of risedronate treatment on vertebral and nonvertebral fractures in women with postmenopausal osteoporosis: a randomized controlled trial. Vertebral Efficacy With Risedronate Therapy (VERT) Study Group.JAMA.1999;282(14):1344–1352.
- ,,, et al.Effect of risedronate on the risk of hip fracture in elderly women. Hip Intervention Program Study Group.N Engl J Med.2001;344(5):333–340.
- ,,, et al.Effects of oral ibandronate administered daily or intermittently on fracture risk in postmenopausal osteoporosis.J Bone Miner Res.2004;19(8):1241–1249.
- ,,, et al.Once‐yearly zoledronic acid for treatment of postmenopausal osteoporosis.N Engl J Med. 32007;356(18):1809–1822.
- .Clinical practice. Postmenopausal osteoporosis.N Engl J Med.2005;353(6):595–603.
- American College of Rheumatology Ad Hoc Committee on Glucocorticoid‐Induced Osteoporosis.Recommendations for the prevention and treatment of glucocorticoid‐induced osteoporosis: 2001 update. [Review].Arthritis Rheum.2001;44(7):1496–1503.
- ,,, et al.An osteoporosis and fracture intervention program increases the diagnosis and treatment for osteoporosis for patients with minimal trauma fractures.Jt Comm J Qual Patient Saf.2005;31(5):267–274.
An 89‐year‐old female presents to the Emergency Department with lower back pain for the past 5 days. The patient has a past medical history of polymyalgia rheumatica and hypothyroidism. Her medications include prednisone 10 mg daily and levothyroxine 50 g daily. Aside from tenderness over the third lumbar vertebra, her physical exam is unremarkable. An x‐ray shows a fracture of the third lumbar vertebra. Basic laboratory studies, including calcium and creatinine are normal.
The Clinical Problem and Impact
Vertebral fractures (often termed vertebral compression fractures) affect approximately 25% of all postmenopausal women.1, 2 Only one‐third of vertebral fractures are brought to medical attention.3, 4 In the remaining two‐thirds, patients are either asymptomatic or do not seek medical attention. The lifetime risk of a clinical vertebral fracture is approximately 16% and 5% in white women and men, respectively.1 The risk of vertebral fracture increases with age, lower bone mineral density (BMD), and prior vertebral fracture.1, 5 Women with a preexisting vertebral fracture have a 5‐fold increased risk for a new vertebral fracture relative to those without a history of vertebral fracture.5, 6 Approximately 20% of women who sustain a vertebral fracture will have a new vertebral fracture in the subsequent year.5, 6 Vertebral fractures are frequently overlooked on chest x‐rays and hence there is a need for increased awareness and improved recognition of radiographically‐demonstrated fractures.7 Hospitalists must appreciate that a vertebral fracture is often the first clue to underlying osteoporosis. At least 90% of vertebral and hip fractures are attributable to osteoporosis.5
Typically, the pain related to an acute vertebral fracture improves over 4 to 6 weeks.8, 9 However, pain can persist, resulting in functional impairment, and a decline in the quality of life.1013 Vertebral fractures may lead to kyphosis and reduced lung function. This, in turn, may increase the risk for pneumonia, the most common cause of death in patients with osteoporosis.4 Both clinical and subclinical vertebral fractures are, in fact, independently associated with increased mortality,4, 14, 15 particularly in the period immediately following the event.16 The economic impact of osteoporosis and its related fractures is substantial.1719 In 1995, the annual direct medical cost for the inpatient care of vertebral fractures was estimated to be $575 million.19
Evidence‐Based Approach to the Hospitalized Patient
Evaluation
Vertebral fractures most commonly occur between T7 and L4. Acute vertebral fracture pain is typically sudden in onset and located in the mid to lower back. The pain may occur while performing an ordinary task such as lifting an object or bending over, although in many cases there is no preceding trauma. Physical activity exacerbates the pain and patients' movements may be limited due to pain. Spinal tenderness is usually present. A history of weight loss, prior malignancy, or fever should serve as red flags to the hospitalist and prompt evaluation for underlying malignancy or infection.
For a suspected fracture, frontal and lateral radiographs of the thoracolumbar spine are the initial imaging of choice. Magnetic resonance imaging (MRI) is useful when infection, malignancy, or spinal cord compression is suspected. The presence of neurological deficits should always prompt imaging with MRI or computed tomography (CT).
Patients with vertebral fractures should be evaluated with bone density testing, as osteoporosis is usually the underlying etiology. Because a number of medical conditions commonly contribute to bone loss (Table 1), laboratory testing is indicated for most patients. Although debate exists as to the optimal testing strategy,20 the National Osteoporosis Foundation guidelines recommend the evaluation of blood count, chemistry, and thyroid‐stimulating hormone (TSH) in patients with osteoporosis.21 Because vitamin D deficiency is common in patients who sustain osteoporotic fractures, 25‐hydroxyvitamin D levels should be checked in most patients.2225 Depending on the clinical scenario, additional testing may include the following: serum testosterone, serum intact parathyroid hormone (PTH), 24‐hour calcium excretion, serum protein electrophoresis, urine protein electrophoresis, erythrocyte sedimentation rate, and celiac sprue antibodies.26
| Endocrine disease or metabolic causes | Hypogonadism |
| Cushing's syndrome | |
| Hyperthyroidism | |
| Anorexia nervosa | |
| Hyperparathyroidism | |
| Nutritional conditions | Vitamin D deficiency |
| Calcium deficiency | |
| Malabsorption | |
| Drugs | Glucocorticoids |
| Antiepileptic drugs | |
| Excessive thyroid medication | |
| Long‐term heparin or low molecular weight heparin therapy (eg, >1 month) | |
| Other | Multiple myeloma |
| Rheumatoid arthritis | |
| Organ transplantation |
Management
Short Term
Short‐term management goals include the relief of pain and recovery of mobility. Nonsteroidal antiinflammatory drugs (NSAIDs) and low‐dose opioid medications should be used first in an effort to relieve pain. Beyond its potential effect on bone density, calcitonin (Miacalcin, Fortical) has long been used in acute vertebral fractures for analgesia. A systematic review of 5 randomized controlled trials concluded that calcitonin significantly reduced the pain from acute vertebral fractures.27 Calcitonin improved pain as early as 1 week into treatment and the benefit was persistent at 4 weeks. The analgesic mechanism of action for calcitonin is not entirely clear. Proposed mechanisms include increased ‐endorphin release, an antiinflammatory effect, and a direct effect on specific receptors in the central nervous system.27, 28
Pamidronate (Aredia) also has shown efficacy at reducing acute fracture pain. In a double‐blinded trial, Armigeat et al.29 evaluated pamidronate 30 mg daily for 3 days as compared to placebo in 32 patients. Pain scores were improved at 7 and 30 days with pamidronate. The mechanism of analgesia is unclear. Bisphosphonates are known to inhibit osteoclast activity, but may also work by blocking the effect of inflammatory cytokines.29
Early pain relief is critical in order to encourage physical activity. Bed rest should be avoided, as immobility may increase the risk for pressure ulcers, venous thromboembolism, and pneumonia.3033 Although bracing is frequently used in acute vertebral fracture, the modality has not been formally studied. Although also not well studied in the acute setting, physical therapy has been shown to reduce pain and improve functioning for patients with chronic pain from vertebral fracture,34 and is generally recommended.35
Percutaneous vertebral augmentation procedures include vertebroplasty and kyphoplasty. In vertebroplasty, polymethylmethacrylate cement is injected through a needle under fluoroscopic guidance into the collapsed vertebral body. With kyphoplasty, balloon tamps are used to elevate vertebral endplates prior to injection of cement (Figure 1).36 The proposed mechanism of action for both procedures is stabilization of the fracture by the hardened polymethylmethacrylate cement. These procedures are commonly performed by interventional radiologists without the need for general anesthesia; however, depending on the institution, they may be done by orthopedic surgeons, neurosurgeons, or anesthesiologists. The procedure can be performed as an outpatient, if indicated. Although the volume of these procedures has grown dramatically in recent years,37, 38 the quality of evidence supporting their use is relatively weak.3941 Only 1 randomized controlled trial has been published evaluating the potential benefit of vertebroplasty over conservative management.42 Voormolen et al.42 evaluated patients with vertebral fractures and pain refractive to 6 weeks of optimal medical therapy. Patients were treated with vertebroplasty or continuation of medical therapy. Vertebroplasty significantly improved pain initially, but not after 2 weeks. Like the study by Voormolen et al.,42 most studies evaluating percutaneous vertebral augmentation procedures have been conducted on patients with long‐term pain refractory to medical management. One notable exception is a nonrandomized trial published by Diamond et al.6 In that study, 55 patients were treated with vertebroplasty while 24 were treated conservatively. Pain at 24 hours was significantly improved in patients treated with vertebroplasty. At 6 weeks, however, there was no difference among the 2 groups.
The risk of short‐term complications from vertebral augmentation procedures is difficult to assess in light of the small sample sizes and methodological limitations of existing studies. Cement leakage occurs in 40% to 41% of patients treated with vertebroplasty, as compared with 8% to 9% with kyphoplasty.39, 41 Pulmonary emboli occur in 0.6% and 0.01% of patients treated with vertebroplasty and kyphoplasty, respectively, while neurologic complications occur in 0.6% and 0.03% of patients.41 Concern exists about whether percutaneous vertebral augmentation procedures might increase the risk for subsequent fractures,43, 44 as the incidence of new fractures appears to be elevated in the period immediately following the procedure and approximately two‐thirds of new fractures occur in vertebrae adjacent to the augmented vertebra.39, 41, 44 However, the 20% incidence of new vertebral fractures in the year following vertebral augmentation is similar to the fracture rate seen in patients not treated with osteoporosis therapy.44
Assessment of the impact of vertebral augmentation procedures on the cost of care is limited by the lack of high‐quality clinical studies.45, 46 Randomized controlled trials evaluating the benefit and risk of these procedures compared to conservative management are underway.4749 Pending further evidence, these procedures are best reserved for patients who fail to benefit from other measures to control pain and improve mobility.
Long Term
A comprehensive discussion of the long‐term management of osteoporosis is beyond the scope of this work. However, the inpatient setting presents an opportune time to initiate long‐term medical therapy. Studies show that the majority of patients who sustain osteoporotic fractures do not receive pharmacologic treatment for osteoporosis.5053 Hospitalists have the opportunity to start medications that can reduce the risk for subsequent fracture by nearly 50%.5458 A total calcium intake of 1200 to 1500 mg per day and vitamin D of 400 to 800 IU per day are recommended for all postmenopausal women. Patients who smoke should receive smoking cessation counseling and be considered for pharmacologic treatment for tobacco dependence. All patients should be assessed for fall risk, including a review of medications and assessment of alcohol intake.
Before considering pharmacologic treatment for osteoporosis, secondary causes of low bone mass must be excluded. Bisphosphonates are generally considered first‐line pharmacologic therapy for osteoporosis. Alendronate (Fosamax), risedronate (Actonel), and ibandronate (Boniva) have been shown in randomized trials to increase bone density and reduce the risk of osteoporotic fractures.55, 56, 59 Daily, weekly, and monthly preparations of bisphosphonates now exist. Pill‐induced esophagitis is a potential adverse effect of bisphosphonate therapy, but is extremely rare if proper precautions are taken. Patients should take oral bisphosphonates on an empty stomach, with a full glass of water, sitting upright, and have nothing to eat or drink for at least one half hour. If compliance with oral bisphosphonates is not possible, or esophageal abnormalities preclude oral bisphosphonate use, one may consider the use of intravenous ibandronate or zoledronic acid (Reclast). A 3‐year randomized controlled trial of yearly zoledronic acid improved bone density and reduced the incidence of osteoporotic fractures.60 Bisphosphonates are generally not recommended when creatinine clearance is less than 30 mL/minute. Other pharmacologic options for the treatment of osteoporosis include selective estrogen receptor modulators and anabolic agents. The reader is referred to an excellent review by Rosen61 for additional discussion of these therapies. The American College of Rheumatology clinical guidelines for the management of glucocorticoid induced osteoporosis are also worthy of review.62
Hospitalists are naturally suited to improve the quality of care for patients hospitalized with vertebral fractures. Most patients who currently sustain osteoporotic fractures do not receive appropriate evaluation and treatment. One study used an interdisciplinary team to identify, assess, and begin treatment for appropriate patients hospitalized with osteoporotic fractures.63 The intervention resulted in significantly more patients taking osteoporosis treatment medications 6 months after the incident fracture.
Conclusions
Acute vertebral fracture is a common clinical problem associated with significant morbidity and increased risk of mortality. Treatment of vertebral fracture should include analgesics and physical therapy. Percutaneous augmentation procedures may be considered in patients who fail optimal medical therapy. Because most vertebral fractures are due to osteoporosis and the healthcare system currently fails to appropriately assess and treat most patients who have sustained osteoporotic fractures, hospitalists are in an optimal position to initiate long‐term preventative treatment for these patients.
- .Epidemiology of spinal osteoporosis.Spine.1997;22(24 suppl):2S–11S.
- ,,,,,.Prevalence and incidence of vertebral deformities.Osteoporos Int.1993;3(3):113–119.
- ,,.The epidemiology of vertebral fractures. European Vertebral Osteoporosis Study Group.Bone.1993;14(suppl 1):S89–S97.
- ,,,,,.Vertebral fractures and mortality in older women: a prospective study. Study of Osteoporotic Fractures Research Group.Arch Intern Med.1999;159(11):1215–1220.
- ,,,.Pre‐existing fractures and bone mass predict vertebral fracture incidence in women.Ann Intern Med.1991;114(11):919–923.
- ,,, et al.Risk of new vertebral fracture in the year following a fracture.JAMA.2001;285(3):320–323.
- ,,,,,.Recognition of vertebral fracture in a clinical setting.Osteoporos Int.2000;11(7):577–582.
- ,,.Management of acute osteoporotic vertebral fractures: a nonrandomized trial comparing percutaneous vertebroplasty with conservative therapy.Am J Med.2003;114(4):257–265.
- .The clinical consequences of vertebral compression fracture.Bone.1992;13(suppl 2):S27–S31.
- ,,,.A case‐control study of quality of life and functional impairment in women with long‐standing vertebral osteoporotic fracture.Osteoporos Int.1999;9(6):508–515.
- ,,, et al.The burden of prevalent fractures on health‐related quality of life in postmenopausal women with osteoporosis: the IMOF study.J Rheumatol.2007;34(7):1551–1560.
- ,,,,.The relationship of health‐related quality of life to prevalent and incident vertebral fractures in postmenopausal women with osteoporosis: results from the Multiple Outcomes of Raloxifene Evaluation Study.Arthritis Rheum2001;44(11):2611–2619.
- ,,, et al.The association of radiographically detected vertebral fractures with back pain and function: a prospective study.Ann Int Med.1998;128:793–800.
- ,,,,.Mortality after all major types of osteoporotic fracture in men and women: an observational study.Lancet. 131999;353(9156):878–882.
- ,,,,.Population‐based study of survival after osteoporotic fractures.Am J Epidemiol.1993;137(9):1001–1005.
- ,,,,.Excess mortality after hospitalisation for vertebral fracture.Osteoporos Int.2004;15(2):108–112.
- ,.The cost of treating osteoporotic fractures in the United Kingdom female population.Osteoporos Int.1998;8(6):611–617.
- ,,, et al.Direct medical costs attributable to osteoporotic fractures.Osteoporos Int.2002;13(4):323–330.
- ,,,.Medical expenditures for the treatment of osteoporotic fractures in the United States in 1995: report from the National Osteoporosis Foundation.J Bone Miner Res.1997;12(1):24–35.
- .Laboratory workup for osteoporosis. Which tests are most cost‐effective?Postgrad Med.2003;114(3):35–38,41–34.
- National Osteoporosis Foundation. Clinician's Guide to Prevention and Treatment of Osteoporosis. Available at: http://www.nof.org/professionals/Clinicians_Guide.htm. Accessed February2009.
- ,,, et al.Prevalence of vitamin D inadequacy among postmenopausal North American women receiving osteoporosis therapy.J Clin Endocr Metab.2005;90:3215–3224.
- ,,,,.Prevalence of vitamin D inadequacy in a minimal trauma fracture population.Curr Med Res Opin.2005;21:1069–1074.
- ,,,,,.Occult vitamin D deficiency in postmenopausal US women with acute hip fracture.JAMA.1999;281:1505–1511.
- ,,,,.Secondary contributors for bone loss in osteoporotic hip fractures.Osteoporos Int.2008;19(7):991–999.
- .Evaluation of the patient with osteoporosis or at risk for osteoporosis. In: Marcus R, Feldman D, Kelsey J, eds.Osteoporosis. Vol.2.San Diego:Academic Press;2001:403–408.
- ,,,,.Calcitonin for treating acute pain of osteoporotic vertebral compression fractures: a systematic review of randomized, controlled trials.Osteoporos Int.2005;16(10):1281–1290.
- .Possible mechanisms of the analgesic action of calcitonin.Bone.2002;30(5 suppl):80S–83S.
- ,,,,.Intravenous pamidronate for pain relief in recent osteoporotic vertebral compression fracture: a randomized double‐blind controlled study.Osteoporos Int.2006;17(11):1659–1665.
- ,,,,.Pressure ulcer risk factors among hospitalized patients with activity limitation.JAMA.1995;273(11):865–870.
- ,.Risk factors for venous thromboembolism.Circulation. 172003;107(23 suppl 1):I9–I16.
- ,,.Infectious diseases and mortality among US nursing home residents.Am J Public Health.1993;83(12):1739–1742.
- ,,,,.Risk factors for pneumonia and other lower respiratory tract infections in elderly residents of long‐term care facilities.Arch Intern Med. 271999;159(17):2058–2064.
- ,,,.Positive effects of physiotherapy on chronic pain and performance in osteoporosis.Osteoporos Int.1998;8(3):215–221.
- ,,, et al.Health professional's guide to rehabilitation of the patient with osteoporosis.Osteoporos Int.2003;14(suppl 2):S1–S22.
- ,,,.Vertebral compression fractures: manage aggressively to prevent sequelae.Cleve Clin J Med.2003;70(2):147–156. Reprinted with permission. Copyright (c) 2003 Cleveland Clinic Foundation. All rights reserved.
- ,,,.Vertebroplasty in the United States: guidance method and provider distribution, 2001–2003.Radiology.2007;243(1):166–170.
- ,,,,.Thoracic and lumbar vertebroplasties performed in US Medicare enrollees, 2001–2005.JAMA.2007;298(15):1760–1762.
- ,,.Balloon kyphoplasty and vertebroplasty for vertebral compression fractures: a comparative systematic review of efficacy and safety.Spine.2006;31(23):2747–2755.
- ,,,,.Efficacy and safety of balloon kyphoplasty in the treatment of vertebral compression fractures: a systematic review.Eur Spine J.2006;15(7):1050–1067.
- ,,,.Vertebroplasty and kyphoplasty: a systematic review of 69 clinical studies.Spine.2006;31(17):1983–2001.
- ,,, et al.Percutaneous vertebroplasty compared with optimal pain medication treatment: short‐term clinical outcome of patients with subacute or chronic painful osteoporotic vertebral compression fractures. The VERTOS study.AJNR Am J Neuroradiol.2007;28(3):555–560.
- ,.Recurrent fracture after vertebral kyphoplasty.Spine J.2006;6(5):488–493.
- ,.Does vertebroplasty cause incident vertebral fractures? A review of available data.AJNR Am J Neuroradiol.2006;27(7):1397–1403.
- Centers for Medicare and Medicaid Services. Agency for Healthcare Research and Quality (AHRQ). Technology Assessment. Percutaneous Kyphoplasty for Vertebral Fractures Caused by Osteoporosis and Malignancy, 2005. Available at: http://www.cms.hhs.gov/mcd/viewtechassess.asp?from2=viewtechassess.asp13(5):550–555.
- .Randomized vertebroplasty trials: current status and challenges.Acad Radiol.2006;13(5):546–549.
- ,,, et al.VERTOS II: percutaneous vertebroplasty versus conservative therapy in patients with painful osteoporotic vertebral compression fractures; rationale, objectives and design of a multicenter randomized controlled trial.Trials.2007;8(1):33.
- ,.Vertebroplasty: a promising but as yet unproven intervention for painful osteoporotic spinal fractures.Med J Aust.2006;185(7):351–352.
- ,,, et al.Low frequency of treatment of osteoporosis among postmenopausal women following a fracture.Arch Intern Med.2003;163(17):2052–2057.
- ,,,,.Failure to diagnose and treat osteoporosis in elderly patients hospitalized with hip fracture.Am J Med.2000;109(4):326–328.
- ,,.Missing a therapeutic window of opportunity: an audit of patients attending a tertiary teaching hospital with potentially osteoporotic hip and wrist fractures.J Rheumatol.2001;28(11):2504–2508.
- ,,,,.Underuse of osteoporosis medications in elderly patients with fractures.Am J Med.2003;115(5):398–400.
- ,,, et al.Randomised trial of effect of alendronate on risk of fracture in women with existing vertebral fractures. Fracture Intervention Trial Research Group.Lancet.1996;348(9041):1535–1541.
- ,,,,,.Meta‐analyses of therapies for postmenopausal osteoporosis. IX: Summary of meta‐analyses of therapies for postmenopausal osteoporosis.Endocr Rev.2002;23(4):570–578.
- ,,, et al.Summary of meta‐analyses of therapies for postmenopausal osteoporosis and the relationship between bone density and fractures.Endocrinol Metab Clin North Am.2002;31(3):659–679, xii.
- ,,, et al.Effects of risedronate treatment on vertebral and nonvertebral fractures in women with postmenopausal osteoporosis: a randomized controlled trial. Vertebral Efficacy With Risedronate Therapy (VERT) Study Group.JAMA.1999;282(14):1344–1352.
- ,,, et al.Effect of risedronate on the risk of hip fracture in elderly women. Hip Intervention Program Study Group.N Engl J Med.2001;344(5):333–340.
- ,,, et al.Effects of oral ibandronate administered daily or intermittently on fracture risk in postmenopausal osteoporosis.J Bone Miner Res.2004;19(8):1241–1249.
- ,,, et al.Once‐yearly zoledronic acid for treatment of postmenopausal osteoporosis.N Engl J Med. 32007;356(18):1809–1822.
- .Clinical practice. Postmenopausal osteoporosis.N Engl J Med.2005;353(6):595–603.
- American College of Rheumatology Ad Hoc Committee on Glucocorticoid‐Induced Osteoporosis.Recommendations for the prevention and treatment of glucocorticoid‐induced osteoporosis: 2001 update. [Review].Arthritis Rheum.2001;44(7):1496–1503.
- ,,, et al.An osteoporosis and fracture intervention program increases the diagnosis and treatment for osteoporosis for patients with minimal trauma fractures.Jt Comm J Qual Patient Saf.2005;31(5):267–274.
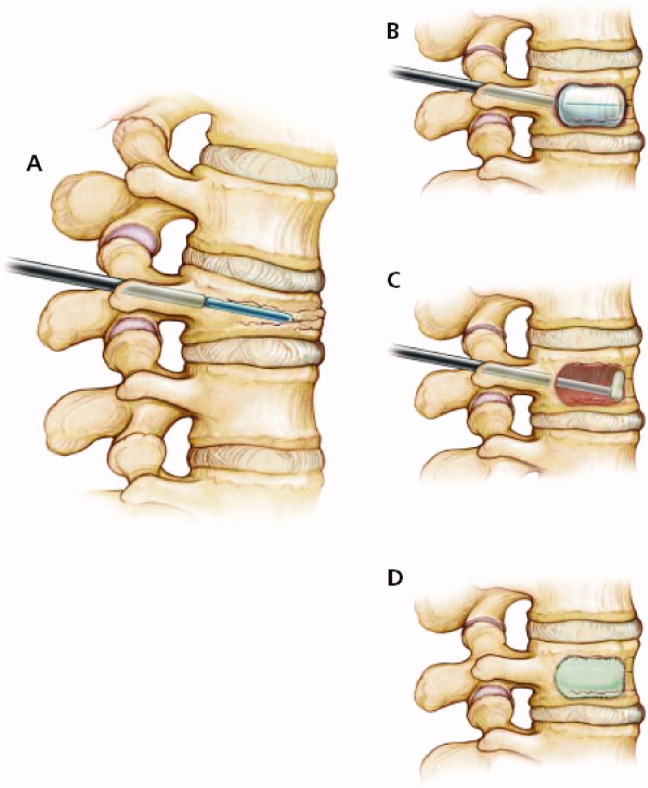
Discharge Summary Improvement
Preventable or ameliorable adverse events have been reported to occur in 12% of patients in the period immediately following hospital discharge.1, 2 A potential contributor to this is the inadequate transfer of clinical information at hospital discharge. The discharge summary comprises a vital component of the information transfer between the inpatient and outpatient settings. Unfortunately, discharge summaries are often unavailable at the time of follow‐up care and often lack important content.37
A growing number of hospitals are implementing electronic medical records (EMR). This creates the opportunity to standardize the content of clinical documentation and creates the potential to assemble, immediately at the time of hospital discharge, major components of a discharge summary. With enhanced communication systems, this information can be delivered in a variety of ways with minimal delay. Previously, we reported the results of a survey of medicine faculty at an urban academic medical center evaluating the timeliness and quality of discharge summaries, the perceived incidence of preventable adverse events related to suboptimal information transfer at discharge, and a needs assessment for an electronically generated discharge summary that we planned to design.8 We now report the results of the follow‐up survey of outpatient physicians and an evaluation of the quality and timeliness of the electronic discharge summary we created.
Materials and Methods
Design
We conducted a pre‐post evaluation of the quality and timeliness of discharge summaries. In the initial phase of the study, we convened an advisory board comprised of 16 Department of Medicine physicians. The advisory board gave input on needs assessment and helped to create a survey to be administered to all medicine faculty with an outpatient practice. All respondents who had at least 1 patient admitted to the hospital within the 6 months prior to the survey were eligible. The results of the initial survey were reviewed with the advisory board and an electronic discharge summary was created with their input. To evaluate its impact, we conducted a repeat survey of all medicine faculty with an outpatient practice approximately 1 year after implementation of the electronic discharge summary.
To complement data received from the outpatient physician survey, a randomly selected sample of discharge summaries from general medical services during the same 3 month period before and after implementation of the electronic discharge summary were rated by 1 of 3 board‐certified internists (D.B.E., N.K., or M.P.L.).
Setting and Participants
The study was conducted at Northwestern Memorial Hospital, a 753‐bed hospital in Chicago, IL. The study was approved by the Institutional Review Board of the Northwestern University Feinberg School of Medicine. General medical patients were admitted to 1 of 2 primary physician services during the study period: a teaching service or a nonteaching hospitalist service. Discharge summaries had traditionally been dictated by inpatient physicians and delivered to outpatient physicians by both mail and facsimile via the medical record department. A recommended template for dictated discharge summaries was provided in the paper paging directory distributed yearly to inpatient physicians.
The hospital implemented an EMR and computerized physician order entry (CPOE) system (PowerChart Millennium; Cerner Corporation, Kansas City, MO) in August 2004. Although all history and physicals and progress notes were documented in the EMR, the system did not provide a method for delivering discharge summaries performed within the EMR to outpatient physician offices. Because of this, inpatient physicians were instructed to continue to dictate discharge summaries during the initial phase of the study.
Approximately 65% of outpatient physicians at the study site used an EMR in their offices during the study. Approximately 10% of outpatient physicians used the same EMR the hospital uses, while approximately 55% used a different EMR (EPIC Hyperspace; EPIC Systems Corporation, Verona, WI). The remaining physicians did not use an EMR in their offices.
Intervention: The Electronic Discharge Summary
A draft electronic discharge summary template was created by including elements ranked as highly important by outpatient physicians in our initial survey8 and elements required by The Joint Commission.9 The draft electronic discharge summary template was reviewed by the advisory board and modifications were made with their input. We automated the insertion of specific patient data elements, such as listed allergies and home medications, into the discharge summary template. We also created an electronic reminder system to inpatient physicians for summaries not completed 24 hours after discharge.
Because the majority of physicians in our initial survey preferred discharge summaries to be delivered either by facsimile or via an EMR, we concentrated our efforts on creating reliable systems for delivery by those routes. We created logic that queried the primary care physician field within the EMR at the time the discharge summary was electronically signed. An automated process then sent the discharge summary via electronic fax to the physician listed in the primary care physician field. Because a large number of outpatient physicians used an EMR different from the hospital's, we also created a process that sent discharge summaries from the hospital EMR into patient charts within this separate EMR.
The draft electronic discharge summary template was available for use in the EMR beginning in July 2005. The final electronic discharge summary, including automated content, physician reminder for incomplete summaries, and delivery systems as described above was implemented in June 2006. Upon implementation, inpatient physicians were instructed via email announcements and group meetings to begin completing electronic discharge summaries using the EMR. Beyond these announcements, inpatient physicians did not receive any specific training with regard to the new discharge summary process. An example of the final electronic discharge summary product is available in the Appendix.
Outpatient Physician Survey
Satisfaction with timeliness and quality of discharge summaries was assessed using a 5‐point Likert scale, where 5 represented very satisfied and 1 represented very dissatisfied. We also asked respondents to estimate the number of their patients who had sustained a preventable adverse event or near miss related to suboptimal transfer of information at discharge. We defined a preventable adverse event as a preventable medical problem or worsening of an existing problem and near miss as an error that did not result in patient harm but easily could have.
The preimplementation survey, accompanied by a cover letter signed by the hospital's chief of staff, was sent out in March 2005. A postcard reminder was sent approximately 2 weeks after the initial mail survey. A second survey was sent to nonresponders 6 weeks after the initial survey. Simultaneously, the survey was also sent in web‐based format to nonresponders via email. The postimplementation survey was sent out in February 2007 using a similar survey process.
Discharge Summary Review
A random sample of discharge summaries completed before and after the implementation of the electronic discharge summary was selected for review. The sample universe consisted of all general medicine service discharges between August and November 2005, before the electronic discharge summary was implemented, and August to November 2006, after implementation. To provide a balanced comparison, the sample was further limited to only the first chronological (index) discharge of a unique patient to home self‐care or home health nursing, with length of stay between 3 and 14 days. A total of 2232 discharges in 2005 and 2570 discharges in 2006 met these criteria. The discharge summary review sample was designed to randomly select approximately 100 discharge summaries meeting the criteria above within each study year, to produce an approximate 200‐record analysis sample. Each of the 3 physician reviewers was assigned to complete an approximately equal number of the 200 primary reviews.
Physician reviewers recorded whether the discharge summary was dictated versus done electronically, the length of the discharge summary (in words), the number of days from discharge to discharge summary completion, the type of service the patient was discharged from, and the author type (medical student, intern, resident, or attending). Physicians reviewers also assessed the overall clarity of discharge summaries using a 5‐point ordinal scale (1 = unintelligible; 2 = hard to read; 3 = neutral; 4 = understandable; and 5 = lucid).
Prior studies have evaluated the quality of discharge summaries using scoring tools created by the investigators.10, 11 We created our own discharge summary scoring tool based on these prior studies, recommendations from the literature,12 and the findings from our initial survey.8 We pilot‐tested the scoring tool and made minor revisions prior to the study. The final scoring tool consisted of 16 essential elements. Reviewers assessed whether each of the 16 essential elements was present, absent, or not applicable. A Discharge Summary Completeness Score was calculated by the number of the 16 essential elements that were rated as present divided by the number of applicable elements for each discharge summary, multiplied by 100 to produce a completeness percentage.
To assess interrater reliability, reviewers were assigned to independently complete second, duplicate reviews of approximately 90 summaries (30 per reviewer). The duplicate review sample was designed to produce approximately 45 paired re‐reviews in each year for reliability assessment. A final sample of 196 available summaries was completed for the main analysis and 174 primary and duplicate reviews were used to establish interrater reliability across 87 reviewer pairs.
Data Analysis
Physician characteristics, including specialty, faculty appointment type, and year of medical school graduation were provided by the hospital's medical staff office. Physician characteristics from before and after the implementation of the electronic discharge summary were compared using chi‐square tests. Likert scale ratings of physician satisfaction with the timeliness and quality of discharge summaries were compared using t‐tests. The proportion of physicians reporting 1 or more preventable adverse event or near miss before the implementation of the electronic discharge summary was compared to postimplementation proportions using chi‐square tests. In addition, we performed multivariate logistic regression to examine the likelihood of physicians reporting any preventable adverse event or near miss related to suboptimal information transfer. The regression models tested the likelihood of 1 or more preventable adverse event or near miss before versus after the implementation of the electronic discharge summary, controlling for physician characteristics and their number of hospitalized patients in the previous 6 months.
The proportions of discharge summary elements found to be present, the proportion of discharge summaries completed within 3 days, and discharge summary readability ratings before and after the implementation of the electronic discharge summary were compared using chi‐square tests; length in words was compared using t‐tests. Preimplementation and postimplementation Discharge Summary Completeness Scores were compared using the Mann‐Whitney U test. Discharge summary score interrater reliability was assessed using the Brennan‐Prediger Kappa for individual elements.13
Results
Outpatient Physician Survey
Physician Characteristics
Two hundred and twenty‐six of 416 (54%) eligible outpatient physicians completed the baseline survey and 256 of 397 (64%) completed the postimplementation survey. As shown in Table 1, there were no significant differences in specialty, faculty appointment type, or number of patients hospitalized between respondents to the survey before compared to respondents after the implementation of the electronic discharge summary. The number of respondents graduating medical school in 1990 or later was higher after implementation of the electronic discharge summary; however, this result was of borderline statistical significance.
| Preelectronic Discharge Summary (n = 226) | Postelectronic Discharge Summary (n = 256) | P Value | |
|---|---|---|---|
| |||
| Practice Type | 0.23 | ||
| Generalist, n (%) | 127 (56.2) | 130 (50.8) | |
| Specialist, n (%) | 99 (43.8) | 126 (49.2) | |
| Faculty Appointment | 0.38 | ||
| Full‐time, n (%) | 104 (46.0) | 128 (50.0) | |
| Affiliated, n (%) | 122 (54.0) | 128 (50.0) | |
| Year of medical school graduation* | 0.06 | ||
| Before 1990, n (%) | 128 (57.4) | 124 (48.8) | |
| 1990 or later, n (%) | 95 (42.6) | 130 (51.2) | |
| Number of patients hospitalized (last 6 months) | 0.56 | ||
| 1‐4, n (%) | 15 (7.9) | 24 (12.0) | |
| 5‐10, n (%) | 62 (32.5) | 66 (33.0) | |
| 11‐19, n (%) | 35 (18.3) | 33 (16.5) | |
| 20 or more, n (%) | 79 (41.4) | 77 (38.5) | |
Timeliness and Content
Changes in outpatient physician satisfaction with the timeliness and quality of discharge summaries are summarized in Table 2. Satisfaction with the timeliness and quality of discharge summarizes improved significantly after the implementation of the electronic discharge summary (mean standard deviation [SD] timeliness rating, 2.59 1.02 versus 3.34 1.09; P < 0.001, mean quality rating 3.04 0.93 versus 3.64 0.99; P < 0.001).
| Likert Scale Mean Score (SD)* | |||
|---|---|---|---|
| Preelectronic Discharge Summary | Postelectronic Discharge Summary | P Value | |
| |||
| Timeliness of the discharge summary | 2.59 (1.02) | 3.34 (1.09) | <0.001 |
| Quality of the discharge summary | 3.04 (0.93) | 3.64 (0.99) | <0.001 |
Medical Error
The effect of the electronic discharge summary on perceived near misses and preventable adverse events is summarized in Table 3. Fewer outpatient physicians felt that 1 or more of their patients hospitalized in the preceding 6 months sustained a near miss due to suboptimal transfer of information after the implementation of the electronic discharge summary (65.7% vs. 52.9%, P = 0.008). Similarly, fewer outpatient physicians felt that 1 or more of their patients hospitalized in the preceding 6 months sustained a preventable adverse event due to suboptimal transfer of information after the implementation of the electronic discharge summary (40.7% vs. 30.2%, P = 0.02). In multivariate logistic regression analyses controlling for physician characteristics and their number of hospitalized patients in the previous 6 months, there was a statistically significant 40% reduction in the odds of a reported near miss (adjusted odds ratio [OR] = 0.60, P = 0.02). Although not quite statistically significant, there was a 33% reduction in the odds of a reported preventable adverse event (OR = 0.67, P = 0.08) after the implementation of the electronic discharge summary.
| Preelectronic Discharge Summary | Postelectronic Discharge Summary | P Value | |
|---|---|---|---|
| |||
| Near miss* | |||
| Number (%) reporting 1 | 142 (65.7) | 108 (52.9) | |
| Crude odds ratio | Ref. | 0.57 | 0.008 |
| Adjusted odds ratio | Ref. | 0.60 | 0.02 |
| Preventable adverse event | |||
| Number (%) reporting 1 | 88 (40.7) | 62 (30.2) | |
| Crude odds ratio | Ref. | 0.63 | 0.03 |
| Adjusted odds ratio | Ref. | 0.67 | 0.08 |
Discharge Summary Review
Discharge Summary Characteristics
One hundred and one discharge summaries before implementation of the electronic discharge summary were compared to 95 discharge summaries produced the following year. Characteristics of discharge summaries before and after the implementation of the electronic discharge summary are summarized in Table 4. A large number of discharge summaries (52.5%) were already being typed into the EMR in 2005, prior to the implementation of our final electronic discharge summary product. The number of dictated discharge summaries decreased from 47.5% to 10.5% after implementation of the final electronic discharge summary product (P < 0.001). Discharge summaries were similar in length before and after the implementation of the electronic discharge summary. A higher percentage of discharge summaries were completed within 3 days of discharge after implementation of the electronic discharge summary; however, this result was of borderline statistical significance (59.4% vs. 72.6%; P = 0.05). The type of service from which patients were discharged and the distribution of author types were similar after the implementation of the electronic discharge summary.
| Number (%) or MeanSD | P Value | ||
|---|---|---|---|
| Preelectronic Discharge Summary (n = 101) | Postelectronic Discharge Summary (n = 95) | ||
| Dictated, n (%) | 48 (47.5) | 10 (10.5) | <0.001 |
| Length in words, mean SD | 785 407 | 830 389 | 0.43 |
| Completed within 3 days, n (%) | 60 (59.4) | 69 (72.6) | 0.05 |
| Type of service, n (%) | 0.29 | ||
| Teaching service | 63 (62.4) | 66 (69.5) | |
| Nonteaching hospitalist service | 38 (37.6) | 29 (30.5) | |
| Author type, n (%) | 0.62 | ||
| Fourth year medical student | 13 (12.9) | 13 (13.7) | |
| Intern | 31 (30.7) | 37 (38.9) | |
| Resident | 19 (18.8) | 15 (15.8) | |
| Attending | 38 (37.6) | 30 (31.6) | |
Because a large percentage of discharge summaries were already being done electronically in 2005, we evaluated the timeliness of dictated discharge summaries compared to electronic discharge summaries across both periods combined (preimplementation and postimplementation of the electronic discharge summary). A higher percentage of electronic discharge summaries were completed within 3 days of discharge as compared to dictated discharge summaries (44.8% versus 74.1%; P < 0.001).
Discharge Summary Completeness Score
The presence or absence of discharge summary elements before and after the implementation of the electronic discharge summary is shown in Table 5. Several elements of the discharge summary were present more often after the implementation of the electronic discharge summary. Specific improvements included discussion of follow‐up issues (52.0% versus 75.8%; P = 0.001, = 0.78), pending test results (13.9% vs. 46.3%; P < 0.001, = 0.92), and information provided to the patient and/or family (85.1% vs. 95.8%; P = 0.01, = 0.91). Significant laboratory findings were present less often after implementation of the electronic discharge summary (66.0% versus 51.1%; P = 0.04, = 0.84). The Discharge Summary Completeness Score was higher after the implementation of the electronic discharge summary (mean 74.1 versus 80.3, P = 0.007). Dictated discharge summaries had a significantly lower Discharge Summary Completeness Score compared to discharge summaries done electronically (71.3 vs. 79.6, P = 0.002) across both periods combined.
| Number (%) of Content Items Present* | P Value | Brennan‐Prediger Kappa | ||
|---|---|---|---|---|
| Preelectronic Discharge Summary (n = 101) | Postelectronic Discharge Summary (n = 95) | |||
| ||||
| Dates of admission and discharge | 96 (95.0) | 94 (98.9) | 0.11 | 1.0 |
| Reason for hospitalization | 100 (99.0) | 94 (100) | 0.33 | 1.0 |
| Significant findings from history and exam | 78 (77.2) | 65 (68.4) | 0.16 | 0.26 |
| Significant laboratory findings | 64 (66.0) | 47 (51.1) | 0.04 | 0.84 |
| Significant radiological findings | 67 (75.3) | 71 (81.6) | 0.31 | 0.89 |
| Significant findings from other tests | 41 (63.1) | 40 (71.4) | 0.33 | 0.88 |
| List of procedures performed | 45 (81.8) | 35 (77.8) | 0.77 | 0.99 |
| Procedure report findings | 49 (80.3) | 43 (78.2) | 0.61 | 0.92 |
| Stress test report findings | 7 (100) | 3 (100) | N/A | 1.0 |
| Pathology report findings | 11 (39.3) | 3 (30.0) | 0.60 | 0.91 |
| Discharge diagnosis | 89 (88.1) | 86 (93.5) | 0.20 | 0.86 |
| Condition at discharge | 81 (81.0) | 80 (85.1) | 0.45 | 0.76 |
| Discharge medications | 88 (87.1) | 88 (93.6) | 0.13 | 0.79 |
| Follow‐up issues | 52 (52.0) | 72 (75.8) | 0.001 | 0.78 |
| Pending test results | 14 (13.9) | 44 (46.3) | <0.001 | 0.92 |
| Information provided to patient and/or family, as appropriate | 86 (85.1) | 91 (95.8) | 0.01 | 0.91 |
| Discharge Summary Completeness Score (percent present all applicable items) | 74.1 | 80.3 | 0.007 | |
Significantly more discharge summaries were rated as understandable or lucid after the implementation of the electronic discharge summary (41.6% vs. 59.0%; P = 0.02). In both periods combined, dictated discharge summaries were rated as understandable or lucid less often than electronic discharge summaries (34.5% vs. 56.5%; P < 0.001).
Discussion
Our study found that an electronic discharge summary was well accepted by inpatient physicians and significantly improved the quality and timeliness of discharge summaries. Prior studies have shown that the use of electronically entered discharge summaries improved the timeliness of discharge summaries.1416 However, the discharge summaries used in these studies required manual input of data into a computer system separate from the patient's medical record. To our knowledge, this is the first study to report the impact of discharge summaries generated from an EMR. Leveraging the EMR, we were able to automate the insertion of specific patient data elements, streamline delivery, and create an electronic reminder system to inpatient physicians for summaries not completed 24 hours after discharge.
Prior research has shown that the quality of discharges summaries is improved with the use of standardized content.10, 17 Using a standardized template for the electronic discharge summary, we likewise demonstrated improved quality of discharge summaries. Key discharge summary elements, specifically discussion of follow‐up issues, pending test results, and information provided to the patient and/or family, were present more reliably after the implementation of the electronic discharge summary. The importance of identifying pending test results is underscored by a recent study showing that many patients are discharged from hospitals with test results still pending, and that physicians are often unaware when results are abnormal.18 One discharge summary element, significant laboratory findings, was present less often after the implementation of the electronic discharge summary. Our template did not designate significant laboratory findings under a separate heading. Instead, we used a heading entitled Key Results (labs, imaging, pathology). Physicians completing the discharge summaries may have prioritized the report of imaging and pathology results in this section. A simple revision of our discharge summary template to include a separate heading for significant laboratory findings may result in improvement in this regard.
Timeliness of discharge summaries was improved in our study, but remained less than optimal. Although nearly three‐quarters of electronic discharge summaries were completed within 3 days of discharge, our ultimate goal is to have 100% of discharge summaries completed within 3 days. This is especially important for complicated patients requiring outpatient follow‐up soon after discharge. We are currently in the process of designing further modifications to the electronic discharge summary completion process. One modification that may be beneficial is the automation of additional patient specific data elements into the discharge summary. We also plan to link performance of medication reconciliation, completion of patient discharge instructions, and completion of the discharge summary into an integrated set of activities performed in the EMR prior to patient discharge.
We found that fewer outpatient physicians reported 1 or more of their patients having a preventable adverse event or near miss as a result of suboptimal transfer of information at discharge after the implementation of the electronic discharge summary. Although we did not measure preventable adverse events directly in our study, this is an important finding in light of the large number of patients who sustain preventable adverse events after hospital discharge1, 2 and prior research showing that the absence of discharge summaries at postdischarge follow‐up visits increased the risk for hospital readmission.19
We had wondered what effect the electronic discharge summary would have on the length and clarity of discharge summaries. A published commentary suggested that notes performed in EMRs were inordinately long and often difficult to read.20 We were pleased to discover that electronic discharge summaries were similar in length to previous discharge summaries and were rated higher with regard to clarity.
Our study has several limitations. First, many inpatient physicians began to use electronic discharge summaries prior to our creation of the final electronic discharge summary product. We had explicitly instructed physicians to continue to dictate discharge summaries in the first phase of our study. The fact that physicians quickly adopted the practice of completing discharge summaries electronically suggests that they preferred this method for completion and may help to explain the improvement in timeliness. A second limitation, as previously mentioned, is that our study did not measure adverse events directly. Instead, we asked outpatient physicians to estimate the number of their patients discharged in the last 6 months who had sustained a preventable adverse event or near miss related to suboptimal information transfer at discharge. We had limited space in the survey to define the meaning of a preventable adverse event; therefore, the description in the survey does not exactly match previous definitions.1, 2 Finally, the ordinal scale used to assess clarity of discharge summaries has not been previously validated.
In conclusion, the use of an electronic discharge summary significantly improved the quality and timeliness of discharge summaries. The discharge summary comprises a vital component of the information transfer between the inpatient and outpatient settings during the vulnerable period following hospital discharge. As hospitals expand their use of EMRs, they should take advantage of opportunities to leverage functionality to improve quality and timeliness of discharge summaries.
- ,,, et al.Adverse events among medical patient after hospital discharge.CMAJ.2004;170:345–349.
- ,,,,.The incidence and severity of adverse events affecting patients after discharge from the hospital.Ann Intern Med.2003;138:161–167.
- ,,.Dissemination of discharge summaries. Not reaching follow‐up physicians.Can Fam Physician.2002;48:737–742.
- ,,,.Effect of discharge summary availability during post‐discharge visits on hospital readmission.J Gen Intern Med.2002;17:186–192.
- ,,,.General practitioner‐hospital communications: a review of discharge summaries.J Qual Clin Practice.2001;21:104–108.
- ,,,,.Quality assessment of discharge letters in a French university hospital.Int J Health Care Qual Assur.1998;11:90–95.
- ,,,,,.Deficits in communication and information transfer between hospital‐based and primary care physicians: implications for patient safety and continuity of care.JAMA.2007;297:831–841.
- ,,,,.Outpatient physicians' satisfaction with discharge summaries and perceived need for an electronic discharge summary.J Hosp Med.2006;1:317–320.
- Standard IM.6.10: Hospital accreditation standards.Oakbrook Terrace, IL:Joint Commission on Accreditation of Healthcare Organizations;2006:338–340.
- ,,,,.Assessing quality and efficiency of discharge summaries.Am J Med Qual.2005;20:337–343.
- ,,,,,.Are discharge summaries teachable? The effects of a discharge summary curriculum on the quality of discharge summaries in an internal medicine residency program.Acad Med.2006;81(10 Suppl):S5–S8.
- ,,, et al.Transition of care for hospitalized elderly patients–development of a discharge checklist for hospitalists.J Hosp Med.2006;1:354–360.
- ,.Coefficient kappa: some uses, misuses, and alternatives.Educ Psychol Meas.1981;41:687–699.
- ,,,.Dictated versus database‐generated discharge summaries: a randomized clinical trial.CMAJ.1999;160:319–326.
- ,,,.Evaluation of computer generated neonatal discharge summaries.Arch Dis Child.1991;66:433–436.
- ,,,,,.Evaluation of a computer‐generated discharge summary for patients with acute coronary syndromes.Br J Gen Pract.1998;48:1163–1164.
- ,,,.Standardized or narrative discharge summaries: Which do family physicians prefer?Can Fam Phys.1998;44:62–69.
- ,,, et al.Patient safety concerns arising from test results that return after hospital discharge.Ann Intern Med.2005;143:121–128.
- ,,,Effect of discharge summary availability during post‐discharge visits on hospital readmission.J Gen Intern Med.2002:17;186–192.
- .A piece of my mind. Copy‐and‐paste.JAMA.2006;295:2335–2336.
Preventable or ameliorable adverse events have been reported to occur in 12% of patients in the period immediately following hospital discharge.1, 2 A potential contributor to this is the inadequate transfer of clinical information at hospital discharge. The discharge summary comprises a vital component of the information transfer between the inpatient and outpatient settings. Unfortunately, discharge summaries are often unavailable at the time of follow‐up care and often lack important content.37
A growing number of hospitals are implementing electronic medical records (EMR). This creates the opportunity to standardize the content of clinical documentation and creates the potential to assemble, immediately at the time of hospital discharge, major components of a discharge summary. With enhanced communication systems, this information can be delivered in a variety of ways with minimal delay. Previously, we reported the results of a survey of medicine faculty at an urban academic medical center evaluating the timeliness and quality of discharge summaries, the perceived incidence of preventable adverse events related to suboptimal information transfer at discharge, and a needs assessment for an electronically generated discharge summary that we planned to design.8 We now report the results of the follow‐up survey of outpatient physicians and an evaluation of the quality and timeliness of the electronic discharge summary we created.
Materials and Methods
Design
We conducted a pre‐post evaluation of the quality and timeliness of discharge summaries. In the initial phase of the study, we convened an advisory board comprised of 16 Department of Medicine physicians. The advisory board gave input on needs assessment and helped to create a survey to be administered to all medicine faculty with an outpatient practice. All respondents who had at least 1 patient admitted to the hospital within the 6 months prior to the survey were eligible. The results of the initial survey were reviewed with the advisory board and an electronic discharge summary was created with their input. To evaluate its impact, we conducted a repeat survey of all medicine faculty with an outpatient practice approximately 1 year after implementation of the electronic discharge summary.
To complement data received from the outpatient physician survey, a randomly selected sample of discharge summaries from general medical services during the same 3 month period before and after implementation of the electronic discharge summary were rated by 1 of 3 board‐certified internists (D.B.E., N.K., or M.P.L.).
Setting and Participants
The study was conducted at Northwestern Memorial Hospital, a 753‐bed hospital in Chicago, IL. The study was approved by the Institutional Review Board of the Northwestern University Feinberg School of Medicine. General medical patients were admitted to 1 of 2 primary physician services during the study period: a teaching service or a nonteaching hospitalist service. Discharge summaries had traditionally been dictated by inpatient physicians and delivered to outpatient physicians by both mail and facsimile via the medical record department. A recommended template for dictated discharge summaries was provided in the paper paging directory distributed yearly to inpatient physicians.
The hospital implemented an EMR and computerized physician order entry (CPOE) system (PowerChart Millennium; Cerner Corporation, Kansas City, MO) in August 2004. Although all history and physicals and progress notes were documented in the EMR, the system did not provide a method for delivering discharge summaries performed within the EMR to outpatient physician offices. Because of this, inpatient physicians were instructed to continue to dictate discharge summaries during the initial phase of the study.
Approximately 65% of outpatient physicians at the study site used an EMR in their offices during the study. Approximately 10% of outpatient physicians used the same EMR the hospital uses, while approximately 55% used a different EMR (EPIC Hyperspace; EPIC Systems Corporation, Verona, WI). The remaining physicians did not use an EMR in their offices.
Intervention: The Electronic Discharge Summary
A draft electronic discharge summary template was created by including elements ranked as highly important by outpatient physicians in our initial survey8 and elements required by The Joint Commission.9 The draft electronic discharge summary template was reviewed by the advisory board and modifications were made with their input. We automated the insertion of specific patient data elements, such as listed allergies and home medications, into the discharge summary template. We also created an electronic reminder system to inpatient physicians for summaries not completed 24 hours after discharge.
Because the majority of physicians in our initial survey preferred discharge summaries to be delivered either by facsimile or via an EMR, we concentrated our efforts on creating reliable systems for delivery by those routes. We created logic that queried the primary care physician field within the EMR at the time the discharge summary was electronically signed. An automated process then sent the discharge summary via electronic fax to the physician listed in the primary care physician field. Because a large number of outpatient physicians used an EMR different from the hospital's, we also created a process that sent discharge summaries from the hospital EMR into patient charts within this separate EMR.
The draft electronic discharge summary template was available for use in the EMR beginning in July 2005. The final electronic discharge summary, including automated content, physician reminder for incomplete summaries, and delivery systems as described above was implemented in June 2006. Upon implementation, inpatient physicians were instructed via email announcements and group meetings to begin completing electronic discharge summaries using the EMR. Beyond these announcements, inpatient physicians did not receive any specific training with regard to the new discharge summary process. An example of the final electronic discharge summary product is available in the Appendix.
Outpatient Physician Survey
Satisfaction with timeliness and quality of discharge summaries was assessed using a 5‐point Likert scale, where 5 represented very satisfied and 1 represented very dissatisfied. We also asked respondents to estimate the number of their patients who had sustained a preventable adverse event or near miss related to suboptimal transfer of information at discharge. We defined a preventable adverse event as a preventable medical problem or worsening of an existing problem and near miss as an error that did not result in patient harm but easily could have.
The preimplementation survey, accompanied by a cover letter signed by the hospital's chief of staff, was sent out in March 2005. A postcard reminder was sent approximately 2 weeks after the initial mail survey. A second survey was sent to nonresponders 6 weeks after the initial survey. Simultaneously, the survey was also sent in web‐based format to nonresponders via email. The postimplementation survey was sent out in February 2007 using a similar survey process.
Discharge Summary Review
A random sample of discharge summaries completed before and after the implementation of the electronic discharge summary was selected for review. The sample universe consisted of all general medicine service discharges between August and November 2005, before the electronic discharge summary was implemented, and August to November 2006, after implementation. To provide a balanced comparison, the sample was further limited to only the first chronological (index) discharge of a unique patient to home self‐care or home health nursing, with length of stay between 3 and 14 days. A total of 2232 discharges in 2005 and 2570 discharges in 2006 met these criteria. The discharge summary review sample was designed to randomly select approximately 100 discharge summaries meeting the criteria above within each study year, to produce an approximate 200‐record analysis sample. Each of the 3 physician reviewers was assigned to complete an approximately equal number of the 200 primary reviews.
Physician reviewers recorded whether the discharge summary was dictated versus done electronically, the length of the discharge summary (in words), the number of days from discharge to discharge summary completion, the type of service the patient was discharged from, and the author type (medical student, intern, resident, or attending). Physicians reviewers also assessed the overall clarity of discharge summaries using a 5‐point ordinal scale (1 = unintelligible; 2 = hard to read; 3 = neutral; 4 = understandable; and 5 = lucid).
Prior studies have evaluated the quality of discharge summaries using scoring tools created by the investigators.10, 11 We created our own discharge summary scoring tool based on these prior studies, recommendations from the literature,12 and the findings from our initial survey.8 We pilot‐tested the scoring tool and made minor revisions prior to the study. The final scoring tool consisted of 16 essential elements. Reviewers assessed whether each of the 16 essential elements was present, absent, or not applicable. A Discharge Summary Completeness Score was calculated by the number of the 16 essential elements that were rated as present divided by the number of applicable elements for each discharge summary, multiplied by 100 to produce a completeness percentage.
To assess interrater reliability, reviewers were assigned to independently complete second, duplicate reviews of approximately 90 summaries (30 per reviewer). The duplicate review sample was designed to produce approximately 45 paired re‐reviews in each year for reliability assessment. A final sample of 196 available summaries was completed for the main analysis and 174 primary and duplicate reviews were used to establish interrater reliability across 87 reviewer pairs.
Data Analysis
Physician characteristics, including specialty, faculty appointment type, and year of medical school graduation were provided by the hospital's medical staff office. Physician characteristics from before and after the implementation of the electronic discharge summary were compared using chi‐square tests. Likert scale ratings of physician satisfaction with the timeliness and quality of discharge summaries were compared using t‐tests. The proportion of physicians reporting 1 or more preventable adverse event or near miss before the implementation of the electronic discharge summary was compared to postimplementation proportions using chi‐square tests. In addition, we performed multivariate logistic regression to examine the likelihood of physicians reporting any preventable adverse event or near miss related to suboptimal information transfer. The regression models tested the likelihood of 1 or more preventable adverse event or near miss before versus after the implementation of the electronic discharge summary, controlling for physician characteristics and their number of hospitalized patients in the previous 6 months.
The proportions of discharge summary elements found to be present, the proportion of discharge summaries completed within 3 days, and discharge summary readability ratings before and after the implementation of the electronic discharge summary were compared using chi‐square tests; length in words was compared using t‐tests. Preimplementation and postimplementation Discharge Summary Completeness Scores were compared using the Mann‐Whitney U test. Discharge summary score interrater reliability was assessed using the Brennan‐Prediger Kappa for individual elements.13
Results
Outpatient Physician Survey
Physician Characteristics
Two hundred and twenty‐six of 416 (54%) eligible outpatient physicians completed the baseline survey and 256 of 397 (64%) completed the postimplementation survey. As shown in Table 1, there were no significant differences in specialty, faculty appointment type, or number of patients hospitalized between respondents to the survey before compared to respondents after the implementation of the electronic discharge summary. The number of respondents graduating medical school in 1990 or later was higher after implementation of the electronic discharge summary; however, this result was of borderline statistical significance.
| Preelectronic Discharge Summary (n = 226) | Postelectronic Discharge Summary (n = 256) | P Value | |
|---|---|---|---|
| |||
| Practice Type | 0.23 | ||
| Generalist, n (%) | 127 (56.2) | 130 (50.8) | |
| Specialist, n (%) | 99 (43.8) | 126 (49.2) | |
| Faculty Appointment | 0.38 | ||
| Full‐time, n (%) | 104 (46.0) | 128 (50.0) | |
| Affiliated, n (%) | 122 (54.0) | 128 (50.0) | |
| Year of medical school graduation* | 0.06 | ||
| Before 1990, n (%) | 128 (57.4) | 124 (48.8) | |
| 1990 or later, n (%) | 95 (42.6) | 130 (51.2) | |
| Number of patients hospitalized (last 6 months) | 0.56 | ||
| 1‐4, n (%) | 15 (7.9) | 24 (12.0) | |
| 5‐10, n (%) | 62 (32.5) | 66 (33.0) | |
| 11‐19, n (%) | 35 (18.3) | 33 (16.5) | |
| 20 or more, n (%) | 79 (41.4) | 77 (38.5) | |
Timeliness and Content
Changes in outpatient physician satisfaction with the timeliness and quality of discharge summaries are summarized in Table 2. Satisfaction with the timeliness and quality of discharge summarizes improved significantly after the implementation of the electronic discharge summary (mean standard deviation [SD] timeliness rating, 2.59 1.02 versus 3.34 1.09; P < 0.001, mean quality rating 3.04 0.93 versus 3.64 0.99; P < 0.001).
| Likert Scale Mean Score (SD)* | |||
|---|---|---|---|
| Preelectronic Discharge Summary | Postelectronic Discharge Summary | P Value | |
| |||
| Timeliness of the discharge summary | 2.59 (1.02) | 3.34 (1.09) | <0.001 |
| Quality of the discharge summary | 3.04 (0.93) | 3.64 (0.99) | <0.001 |
Medical Error
The effect of the electronic discharge summary on perceived near misses and preventable adverse events is summarized in Table 3. Fewer outpatient physicians felt that 1 or more of their patients hospitalized in the preceding 6 months sustained a near miss due to suboptimal transfer of information after the implementation of the electronic discharge summary (65.7% vs. 52.9%, P = 0.008). Similarly, fewer outpatient physicians felt that 1 or more of their patients hospitalized in the preceding 6 months sustained a preventable adverse event due to suboptimal transfer of information after the implementation of the electronic discharge summary (40.7% vs. 30.2%, P = 0.02). In multivariate logistic regression analyses controlling for physician characteristics and their number of hospitalized patients in the previous 6 months, there was a statistically significant 40% reduction in the odds of a reported near miss (adjusted odds ratio [OR] = 0.60, P = 0.02). Although not quite statistically significant, there was a 33% reduction in the odds of a reported preventable adverse event (OR = 0.67, P = 0.08) after the implementation of the electronic discharge summary.
| Preelectronic Discharge Summary | Postelectronic Discharge Summary | P Value | |
|---|---|---|---|
| |||
| Near miss* | |||
| Number (%) reporting 1 | 142 (65.7) | 108 (52.9) | |
| Crude odds ratio | Ref. | 0.57 | 0.008 |
| Adjusted odds ratio | Ref. | 0.60 | 0.02 |
| Preventable adverse event | |||
| Number (%) reporting 1 | 88 (40.7) | 62 (30.2) | |
| Crude odds ratio | Ref. | 0.63 | 0.03 |
| Adjusted odds ratio | Ref. | 0.67 | 0.08 |
Discharge Summary Review
Discharge Summary Characteristics
One hundred and one discharge summaries before implementation of the electronic discharge summary were compared to 95 discharge summaries produced the following year. Characteristics of discharge summaries before and after the implementation of the electronic discharge summary are summarized in Table 4. A large number of discharge summaries (52.5%) were already being typed into the EMR in 2005, prior to the implementation of our final electronic discharge summary product. The number of dictated discharge summaries decreased from 47.5% to 10.5% after implementation of the final electronic discharge summary product (P < 0.001). Discharge summaries were similar in length before and after the implementation of the electronic discharge summary. A higher percentage of discharge summaries were completed within 3 days of discharge after implementation of the electronic discharge summary; however, this result was of borderline statistical significance (59.4% vs. 72.6%; P = 0.05). The type of service from which patients were discharged and the distribution of author types were similar after the implementation of the electronic discharge summary.
| Number (%) or MeanSD | P Value | ||
|---|---|---|---|
| Preelectronic Discharge Summary (n = 101) | Postelectronic Discharge Summary (n = 95) | ||
| Dictated, n (%) | 48 (47.5) | 10 (10.5) | <0.001 |
| Length in words, mean SD | 785 407 | 830 389 | 0.43 |
| Completed within 3 days, n (%) | 60 (59.4) | 69 (72.6) | 0.05 |
| Type of service, n (%) | 0.29 | ||
| Teaching service | 63 (62.4) | 66 (69.5) | |
| Nonteaching hospitalist service | 38 (37.6) | 29 (30.5) | |
| Author type, n (%) | 0.62 | ||
| Fourth year medical student | 13 (12.9) | 13 (13.7) | |
| Intern | 31 (30.7) | 37 (38.9) | |
| Resident | 19 (18.8) | 15 (15.8) | |
| Attending | 38 (37.6) | 30 (31.6) | |
Because a large percentage of discharge summaries were already being done electronically in 2005, we evaluated the timeliness of dictated discharge summaries compared to electronic discharge summaries across both periods combined (preimplementation and postimplementation of the electronic discharge summary). A higher percentage of electronic discharge summaries were completed within 3 days of discharge as compared to dictated discharge summaries (44.8% versus 74.1%; P < 0.001).
Discharge Summary Completeness Score
The presence or absence of discharge summary elements before and after the implementation of the electronic discharge summary is shown in Table 5. Several elements of the discharge summary were present more often after the implementation of the electronic discharge summary. Specific improvements included discussion of follow‐up issues (52.0% versus 75.8%; P = 0.001, = 0.78), pending test results (13.9% vs. 46.3%; P < 0.001, = 0.92), and information provided to the patient and/or family (85.1% vs. 95.8%; P = 0.01, = 0.91). Significant laboratory findings were present less often after implementation of the electronic discharge summary (66.0% versus 51.1%; P = 0.04, = 0.84). The Discharge Summary Completeness Score was higher after the implementation of the electronic discharge summary (mean 74.1 versus 80.3, P = 0.007). Dictated discharge summaries had a significantly lower Discharge Summary Completeness Score compared to discharge summaries done electronically (71.3 vs. 79.6, P = 0.002) across both periods combined.
| Number (%) of Content Items Present* | P Value | Brennan‐Prediger Kappa | ||
|---|---|---|---|---|
| Preelectronic Discharge Summary (n = 101) | Postelectronic Discharge Summary (n = 95) | |||
| ||||
| Dates of admission and discharge | 96 (95.0) | 94 (98.9) | 0.11 | 1.0 |
| Reason for hospitalization | 100 (99.0) | 94 (100) | 0.33 | 1.0 |
| Significant findings from history and exam | 78 (77.2) | 65 (68.4) | 0.16 | 0.26 |
| Significant laboratory findings | 64 (66.0) | 47 (51.1) | 0.04 | 0.84 |
| Significant radiological findings | 67 (75.3) | 71 (81.6) | 0.31 | 0.89 |
| Significant findings from other tests | 41 (63.1) | 40 (71.4) | 0.33 | 0.88 |
| List of procedures performed | 45 (81.8) | 35 (77.8) | 0.77 | 0.99 |
| Procedure report findings | 49 (80.3) | 43 (78.2) | 0.61 | 0.92 |
| Stress test report findings | 7 (100) | 3 (100) | N/A | 1.0 |
| Pathology report findings | 11 (39.3) | 3 (30.0) | 0.60 | 0.91 |
| Discharge diagnosis | 89 (88.1) | 86 (93.5) | 0.20 | 0.86 |
| Condition at discharge | 81 (81.0) | 80 (85.1) | 0.45 | 0.76 |
| Discharge medications | 88 (87.1) | 88 (93.6) | 0.13 | 0.79 |
| Follow‐up issues | 52 (52.0) | 72 (75.8) | 0.001 | 0.78 |
| Pending test results | 14 (13.9) | 44 (46.3) | <0.001 | 0.92 |
| Information provided to patient and/or family, as appropriate | 86 (85.1) | 91 (95.8) | 0.01 | 0.91 |
| Discharge Summary Completeness Score (percent present all applicable items) | 74.1 | 80.3 | 0.007 | |
Significantly more discharge summaries were rated as understandable or lucid after the implementation of the electronic discharge summary (41.6% vs. 59.0%; P = 0.02). In both periods combined, dictated discharge summaries were rated as understandable or lucid less often than electronic discharge summaries (34.5% vs. 56.5%; P < 0.001).
Discussion
Our study found that an electronic discharge summary was well accepted by inpatient physicians and significantly improved the quality and timeliness of discharge summaries. Prior studies have shown that the use of electronically entered discharge summaries improved the timeliness of discharge summaries.1416 However, the discharge summaries used in these studies required manual input of data into a computer system separate from the patient's medical record. To our knowledge, this is the first study to report the impact of discharge summaries generated from an EMR. Leveraging the EMR, we were able to automate the insertion of specific patient data elements, streamline delivery, and create an electronic reminder system to inpatient physicians for summaries not completed 24 hours after discharge.
Prior research has shown that the quality of discharges summaries is improved with the use of standardized content.10, 17 Using a standardized template for the electronic discharge summary, we likewise demonstrated improved quality of discharge summaries. Key discharge summary elements, specifically discussion of follow‐up issues, pending test results, and information provided to the patient and/or family, were present more reliably after the implementation of the electronic discharge summary. The importance of identifying pending test results is underscored by a recent study showing that many patients are discharged from hospitals with test results still pending, and that physicians are often unaware when results are abnormal.18 One discharge summary element, significant laboratory findings, was present less often after the implementation of the electronic discharge summary. Our template did not designate significant laboratory findings under a separate heading. Instead, we used a heading entitled Key Results (labs, imaging, pathology). Physicians completing the discharge summaries may have prioritized the report of imaging and pathology results in this section. A simple revision of our discharge summary template to include a separate heading for significant laboratory findings may result in improvement in this regard.
Timeliness of discharge summaries was improved in our study, but remained less than optimal. Although nearly three‐quarters of electronic discharge summaries were completed within 3 days of discharge, our ultimate goal is to have 100% of discharge summaries completed within 3 days. This is especially important for complicated patients requiring outpatient follow‐up soon after discharge. We are currently in the process of designing further modifications to the electronic discharge summary completion process. One modification that may be beneficial is the automation of additional patient specific data elements into the discharge summary. We also plan to link performance of medication reconciliation, completion of patient discharge instructions, and completion of the discharge summary into an integrated set of activities performed in the EMR prior to patient discharge.
We found that fewer outpatient physicians reported 1 or more of their patients having a preventable adverse event or near miss as a result of suboptimal transfer of information at discharge after the implementation of the electronic discharge summary. Although we did not measure preventable adverse events directly in our study, this is an important finding in light of the large number of patients who sustain preventable adverse events after hospital discharge1, 2 and prior research showing that the absence of discharge summaries at postdischarge follow‐up visits increased the risk for hospital readmission.19
We had wondered what effect the electronic discharge summary would have on the length and clarity of discharge summaries. A published commentary suggested that notes performed in EMRs were inordinately long and often difficult to read.20 We were pleased to discover that electronic discharge summaries were similar in length to previous discharge summaries and were rated higher with regard to clarity.
Our study has several limitations. First, many inpatient physicians began to use electronic discharge summaries prior to our creation of the final electronic discharge summary product. We had explicitly instructed physicians to continue to dictate discharge summaries in the first phase of our study. The fact that physicians quickly adopted the practice of completing discharge summaries electronically suggests that they preferred this method for completion and may help to explain the improvement in timeliness. A second limitation, as previously mentioned, is that our study did not measure adverse events directly. Instead, we asked outpatient physicians to estimate the number of their patients discharged in the last 6 months who had sustained a preventable adverse event or near miss related to suboptimal information transfer at discharge. We had limited space in the survey to define the meaning of a preventable adverse event; therefore, the description in the survey does not exactly match previous definitions.1, 2 Finally, the ordinal scale used to assess clarity of discharge summaries has not been previously validated.
In conclusion, the use of an electronic discharge summary significantly improved the quality and timeliness of discharge summaries. The discharge summary comprises a vital component of the information transfer between the inpatient and outpatient settings during the vulnerable period following hospital discharge. As hospitals expand their use of EMRs, they should take advantage of opportunities to leverage functionality to improve quality and timeliness of discharge summaries.
- ,,, et al.Adverse events among medical patient after hospital discharge.CMAJ.2004;170:345–349.
- ,,,,.The incidence and severity of adverse events affecting patients after discharge from the hospital.Ann Intern Med.2003;138:161–167.
- ,,.Dissemination of discharge summaries. Not reaching follow‐up physicians.Can Fam Physician.2002;48:737–742.
- ,,,.Effect of discharge summary availability during post‐discharge visits on hospital readmission.J Gen Intern Med.2002;17:186–192.
- ,,,.General practitioner‐hospital communications: a review of discharge summaries.J Qual Clin Practice.2001;21:104–108.
- ,,,,.Quality assessment of discharge letters in a French university hospital.Int J Health Care Qual Assur.1998;11:90–95.
- ,,,,,.Deficits in communication and information transfer between hospital‐based and primary care physicians: implications for patient safety and continuity of care.JAMA.2007;297:831–841.
- ,,,,.Outpatient physicians' satisfaction with discharge summaries and perceived need for an electronic discharge summary.J Hosp Med.2006;1:317–320.
- Standard IM.6.10: Hospital accreditation standards.Oakbrook Terrace, IL:Joint Commission on Accreditation of Healthcare Organizations;2006:338–340.
- ,,,,.Assessing quality and efficiency of discharge summaries.Am J Med Qual.2005;20:337–343.
- ,,,,,.Are discharge summaries teachable? The effects of a discharge summary curriculum on the quality of discharge summaries in an internal medicine residency program.Acad Med.2006;81(10 Suppl):S5–S8.
- ,,, et al.Transition of care for hospitalized elderly patients–development of a discharge checklist for hospitalists.J Hosp Med.2006;1:354–360.
- ,.Coefficient kappa: some uses, misuses, and alternatives.Educ Psychol Meas.1981;41:687–699.
- ,,,.Dictated versus database‐generated discharge summaries: a randomized clinical trial.CMAJ.1999;160:319–326.
- ,,,.Evaluation of computer generated neonatal discharge summaries.Arch Dis Child.1991;66:433–436.
- ,,,,,.Evaluation of a computer‐generated discharge summary for patients with acute coronary syndromes.Br J Gen Pract.1998;48:1163–1164.
- ,,,.Standardized or narrative discharge summaries: Which do family physicians prefer?Can Fam Phys.1998;44:62–69.
- ,,, et al.Patient safety concerns arising from test results that return after hospital discharge.Ann Intern Med.2005;143:121–128.
- ,,,Effect of discharge summary availability during post‐discharge visits on hospital readmission.J Gen Intern Med.2002:17;186–192.
- .A piece of my mind. Copy‐and‐paste.JAMA.2006;295:2335–2336.
Copyright © 2009 Society of Hospital Medicine
Hospitalist–Care Coordinator Team
Many hospitalists work with clinical coordinators and case managers.13 The descriptions of these roles often overlap4 and commonly include activities such as obtaining medical records, expediting tests and procedures, coordinating the plan of care with other health care providers, assessing postdischarge needs, completing discharge paperwork, and arranging follow‐up visits.2, 5, 6 Despite the potential to improve patient care and hospital efficiency, few studies have formally evaluated the impact of these roles. Moher et al. found that adding a clinical coordinator to a general medical team decreased length of stay (LOS) and improved patient satisfaction.5 However, this study was conducted at a time when the LOS was routinely longer than it is today. Forster et al. found that adding a clinical coordinator to a general medical team resulted in improved patient satisfaction but did not reduce length of stay or risk of adverse events occurring following hospital discharge.6 Both these studies evaluated the impact of adding a clinical coordinator to resident‐covered medical teams. Yet many hospitalists deliver care without residents, limiting the generalizability of the findings from these studies.
To date, no studies have evaluated the impact of clinical coordinators, case managers, or other nonphysician providers on the hospitalist work experience. This is surprising, as hospital medicine group leaders list daily workload and work hours among their top concerns.7 Clinical coordinators have the potential to improve patient care and hospital efficiency while simultaneously improving the experience of the hospitalists with whom they work. We conducted this study to evaluate the impact of a hospitalistcare coordinator team on hospitalist work experience, patient satisfaction, and hospital efficiency.
METHODS
Setting
The study was conducted on the hospitalist service at Northwestern Memorial Hospital (NMH), a 753‐bed hospital in Chicago, Illinois. The hospitalist service is staffed by 5 hospitalists on duty at a time. Hospitalists work without residents and are on service for 7 consecutive days, usually followed by 7 consecutive days off. Daytime admissions are distributed among all hospitalists on duty in a consecutive fashion. A night float hospitalist performs admissions and all cross‐cover activities from 7:00 PM until 7:00 AM. Nighttime admissions are distributed to day hospitalists based on each hospitalist's daily census.
Study Design
Funding was provided by the hospital for a 12‐week study, and hospital administrative leaders collaborated as part of the research team. During each of the 12 weeks from September 2006 through November 2006, half the hospitalists on duty each week were randomly assigned to work with a hospitalist care coordinator (HCC) in a team approach. Hospitalists not assigned to work with a hospitalist care coordinator continued to work in their usual fashion, which included working with unit‐based care coordinators (UCCs). UCCs follow all patients on a 30‐bed medicine unit but generally do not round with physicians. HCCs performed all the activities that UCCs perform but also performed additional key activities (see Table 1) and worked in a team approach with their hospitalist. Unit‐based social workers and discharge planners were available for all hospitalists during the study. During each day patients were admitted consecutively to one of the hospitalists on service, regardless of their assignment to work with or without an HCC. Similarly, night admissions were distributed to hospitalists without regard to their assignment to work with or without an HCC.
| Activity type | Activities performed by both UCCs and HCCs | Additional activities performed by HCCs only |
|---|---|---|
| Care coordination | Document the interdisciplinary plan of care | Ensure collaboration in formulating the plan of care |
| Obtain outside medical records | ||
| Inform staff nurse of stat orders during rounds | ||
| Obtain certain test results (eg, preliminary echo reports) | ||
| Patient and family needs | Address patient and family concerns | Proactively identify and address patient and family concerns |
| Schedule family meetings | ||
| Efficiency of care delivery | Remediate barriers that impede plan of care and/or discharge | Identify barriers that impede plan of care |
| Identify and document avoidable days | Ensure tests are scheduled | |
| Discharge process | Coordinate discharge plans with social work and discharge planner | Schedule and confirm follow‐up appointments |
| Initiate discharge instructions | ||
| Write discharge prescriptionsverified and signed by physician | ||
| Review discharge instructions with patient and/or family |
HospitalistCare Coordinator Team
Four HCCs were used in this study. All 4 were registered nurses with specialized training in case management. Prior to the start of the study, the investigators held meetings with hospitalists and the HCCs to describe this new role, the work flow for the hospitalistcare coordinator team, and work activities appropriate for the HCC. Activities related to the discharge process were emphasized as a key feature of the HCC role. Hospitalists and HCCs were instructed to round together as a team each morning. They were advised to collaborate on the daily plan of care and assign specific activities for each to accomplish. During the study weekly meetings were held with the HCCs, the hospitalists with whom they were finishing the week, and the hospitalists with whom they were scheduled to work during the upcoming week. The purpose of these meetings was to ensure that the work flow and work activities were optimal.
Outcome Measures
At the completion of each week, all hospitalists on service were given an anonymous Web‐based survey designed to assess their satisfaction and perceived work efficiency. Hospitalists were asked to rate the efficiency of various work activities during the preceding week on a 5 point Likert scale (1 = very inefficient, 2 = somewhat inefficient, 3 = neutral, 4 = somewhat efficient, 5 = very efficient). Hospitalists who had worked with an HCC were also asked whether they thought working with an HCC improved their efficiency and increased their job satisfaction. We postulated that patient satisfaction with the discharge process might improve with use of the hospitalistHCC team. Therefore, patient satisfaction was assessed by telephone interviews conducted 714 days after discharge. Because of resource limitations, we were only able to interview patient during the second half of the study. Patients were asked to rate their satisfaction with the clarity of verbal and written discharge instructions as well as their overall satisfaction with hospital discharge using a 10‐point Likert scale (from 1 = least satisfied to 10 = most satisfied). Hospital databases provided information on patient demographics, LOS, and cost.
Data Analysis
All analyses were conducted using Stata version 9.0 (StataCorp LP, College Station, TX). Patient characteristics were compared using chi‐square and t tests. Responses to the hospitalist survey for the weeks when they worked independently and the weeks when they worked as a hospitalistHCC team were compared using the Wilcoxon rank sum test. To adjust for the clustering of responses by physicians (ie, individual physicians completed more than 1 survey), we used linear regression and the cluster option. The results were very similar, and only the P values from the Wilcoxon rank sum test are presented. Unadjusted LOS and cost were compared using the Wilcoxon rank sum test. We also conducted multivariate linear regressions using log‐transformed LOS and log‐transformed cost as dependent variables. The independent variable was the team type (whether patients were cared for by a hospitalistHCC team or a hospitalist working independently); age, sex, ethnicity, payer type, and diagnosis‐related group (DRG) weight were included as covariates, and P values were adjusted for physician clustering. We hypothesized a priori that the HCC would have no effect on the LOS of or cost for patients whose hospitalizations were very short. We therefore conducted secondary analyses in which we eliminated patients with an LOS of 1 day or less.
RESULTS
There were 356 patients cared for by hospitalistHCC teams and 337 patients cared for by control hospitalists. Of the 60 weeks of hospitalist service of the study, hospitalistHCC teams accounted for 31 weeks (52%) and control hospitalists for 29 weeks (48%). Patients cared for by the hospitalistHCC teams were similar in age, sex, ethnicity, payer type, and DRG weight to those cared for by control hospitalists (see Table 2).
| HospitalistHCC team | Control | P value | |
|---|---|---|---|
| n (%) or mean SD | |||
| Patients, n (%) | 356 (51.4%) | 337 (48.6%) | |
| Age (years) | 59.3 18.6 | 59.0 20.1 | .86 |
| Women (%) | 190 (53.4%) | 192 (57.0%) | .34 |
| Ethnicity | .74 | ||
| White | 182 (51.1%) | 174 (51.6%) | |
| Black | 111 (31.2%) | 114 (33.8%) | |
| Hispanic | 23 (6.5%) | 21 (6.2%) | |
| Asian | 5 (1.4%) | 4 (1.2%) | |
| Other | 35 (9.8%) | 24 (7.1%) | |
| Payer | .47 | ||
| Medicare | 177 (49.7%) | 168 (49.9%) | |
| Private | 76 (21.4%) | 69 (20.5%) | |
| Medicaid | 43 (12.1%) | 44 (13.1%) | |
| Capitated | 43 (12.1%) | 31 (9.2%) | |
| Other | 17 (4.8%) | 25 (7.4%) | |
| Diagnosis‐related group weight | 1.1 0.8 | 1.2 0.8 | .31 |
Sixty surveys were completed by hospitalists at the end of their week on service (response rate 100%). Of the 31 responses from hospitalists completing a hospitalistHCC team week, 28 (90%) reported that working with an HCC improved their efficiency and 28 (90%) that working with an HCC improved their job satisfaction. The hospitalists indicated that working with an HCC significantly improved the efficiency of most of their activities (see Table 3). Specifically, activities related to communication with nurses and patients and activities involving discharge planning and execution were improved with the use of an HCC. As would be expected, certain other activities did not improve. For example, there were no differences between the groups in the perceived efficiency of performing histories and physicals or placing admission orders. For activities that were significantly different, the Wilcoxon rank sum test and linear regression analysis adjusting for physician clustering showed identical results.
| HospitalistHCC Team | Control | P value | |
|---|---|---|---|
| Mean score SD* | |||
| |||
| Performing histories and physicals | 3.94 0.77 | 3.93 0.84 | .98 |
| Performing medication reconciliation | 3.35 1.08 | 2.03 1.18 | < .001 |
| Placing admission orders | 3.94 0.73 | 4.00 0.87 | .57 |
| Communicating with nurses | 4.45 0.68 | 3.14 1.09 | < .001 |
| Communicating with consultants | 3.65 0.75 | 3.34 1.04 | .25 |
| Communicating with patients | 4.42 0.62 | 3.62 1.01 | < .001 |
| Communicating with families | 4.32 0.70 | 2.89 1.14 | < .001 |
| Coordinating discharge plans | 4.74 0.51 | 2.76 1.18 | < .001 |
| Making/updating sign‐out | 3.55 0.72 | 3.49 0.83 | .55 |
| Making discharge instructions | 4.29 0.74 | 3.10 1.01 | < .001 |
| Going over discharge instructions | 4.48 0.57 | 2.76 1.15 | < .001 |
| Writing discharge prescriptions | 3.87 0.67 | 2.52 1.21 | < .001 |
| Arranging follow‐up appointments | 4.19 0.75 | 2.03 1.09 | < .001 |
Seventy‐one of 196 eligible patients (36%) completed the discharge satisfaction interview. Of the 71 patients interviewed, 44 (62%) were cared for by hospitalistHCC teams and 27 (38%) were cared for by control hospitalists. Patient satisfaction with the clarity of the verbal and written discharge instructions and overall satisfaction with hospital discharge was similar between the 2 groups (see Table 4).
| HospitalistHCC Team (n = 44) | Control (n = 27) | P value | |
|---|---|---|---|
| Mean score (SD)* | |||
| |||
| Clarity of verbal discharge instructions | 8.86 ( 2.31) | 8.44 ( 2.63) | 0.52 |
| Clarity of written discharge instructions | 8.95 ( 2.30) | 8.93 ( 2.54) | 0.78 |
| Overall satisfaction with hospital discharge | 8.57 ( 2.42) | 8.37 ( 2.90) | 0.94 |
The unadjusted mean LOS for patients cared for by hospitalistHCC teams was 4.70 4.15 days compared with 5.07 3.99 days for patients cared for by control hospitalists (P = .005; see Table 5). The unadjusted mean cost for patients cared for by hospitalistHCC teams was $10,052.96 $11,708.73 compared with $11,703.19 $20,455.78 for patients cared for by control hospitalists (P = .008). In multivariate analysis using age, sex, ethnicity, payer type, and DRG weight as independent variables and adjusting for physician clustering, LOS remained lower for patients cared for by hospitalistHCC teams; however, this result was not statistically significant (0.28 days, P = .17). Similar multivariate regression analysis showed a trend toward lower cost for patients cared for by the hospitalistHCC teams (585.62, P = .15).
| Unadjusted mean (SD) | P value for unadjusted difference* | Adjusted difference with hospitalistHCC team | P value for adjusted difference | |
|---|---|---|---|---|
| ||||
| Length of stay | ||||
| HospitalistHCC teams | 4.70 (4.15) | .005 | 0.28 | .17 |
| Control hospitalists | 5.07 (3.99) | |||
| Cost | ||||
| HospitalistHCC teams | 10,052.96 (11,708.73) | .008 | 585.62 | .15 |
| Control hospitalists | 11,703.19 (20,455.78) | |||
DISCUSSION
Our study found that hospitalists working in a team approach with an HCC rated the efficiency of their daily work and their job satisfaction significantly higher than did control hospitalists. Specific areas of improved efficiency included communication activities and activities related to hospital discharge. A prior study conducted by our group found that hospitalists spend a lot of time on indirect patient care activities such as communication and activities related to the discharge process, while spending relatively little time on direct patient care.8 Improving the efficiency of indirect patient care activities of hospitalists is likely to improve their job satisfaction. The importance of improving hospitalist workload and job satisfaction is underscored by the relatively high number of hospitalists at risk for burnout9 and the growing concern about daily workload among hospital medicine group leaders.7
Patient satisfaction was not significantly affected by the use of the hospitalistHCC team in our study. A priori, we postulated that patient satisfaction with the discharge process might improve with the use of the hospitalistHCC team. We therefore limited survey questions to assessing only satisfaction with hospital discharge rather than other aspects of patient hospital care. A recent study reported that patients rated the quality of discharge instructions significantly lower than they rated the overall quality of their hospital stay.10 However, the patients in our study gave high ratings to both discharge instructions and overall satisfaction with hospital discharge. This may explain why we were unable to detect a difference. Our study was limited by the relatively small number of patients we were able to contact to assess satisfaction. Previous studies evaluating the impact of care coordinators either did not assess patient satisfaction with discharge5 or found no difference in satisfaction with hospital discharge.6
Although our study did not find a difference in patient satisfaction with the discharge process, we believe the hospitalistHCC model has the potential to complement efforts to reduce the risk of adverse events as patients transition out of the hospital. It has been reported that 12% of patients have a preventable or ameliorable adverse event in the period immediately following hospital discharge.11, 12 Although Forster et al. did not find a reduction in the risk of adverse events with the addition of a clinical coordinator to a general medical team, they noted incongruence between the coordinator's role and the outcomes measured.6 Similarly, we would need to modify the role of the HCC from a position designed mainly to improve efficiency to one that complements efforts to improve the quality of the discharge process. Possible ways to enhance the HCC role in this regard include increasing the emphasis on and training in patient education skills. Several recently published articles have emphasized the need to redesign the discharge process in an effort to reduce the risk of adverse events following hospital discharge.1315 A modified HCC role might be an essential feature of a redesigned multidisciplinary discharge process.
We were unable to demonstrate improved efficiency for the hospital. Although LOS and cost were lower for patients cared for by the hospitalistHCC teams, the difference was not statistically significant. One possible explanation for why we did not observe a larger reduction in LOS is that our hospitalist service had a lower‐than‐average patient volume during the study period. The lower volume mirrored an unanticipated dip in hospital volume during the same period. Specifically, our service normally discharges an average of 338 patients per month, but during the study period we discharged an average of 235 patients per month. A potential LOS and cost benefit may have been attenuated by the relatively low volume, as hospitalists had ample time to dedicate to communication and coordination of discharge plans.
Our study had several limitations. It was conducted on a nonteaching hospitalist service at a single site. Hospitalist practices vary widely in their staffing and scheduling models. As previously mentioned, we were only able to perform patient satisfaction surveys during the second half of the study period. In addition, hospitalistHCC team patients made up a larger percentage of the patient survey responses (62%) than did control hospitalist patients (38%). This may have affected our ability to detect differences in satisfaction with the hospital discharge process. As also previously noted, our patient volume was lower than normal during the study period. We believe that a higher volume would have magnified differences in hospitalists' perceived efficiency and perhaps resulted in significant improvements in LOS and cost. Finally, the hospital provided funding for only a 12‐week study. This limited our sample size and the power of the study to detect important differences. It is possible that a larger sample size and/or longer study period may have been able to demonstrate a statistically significant improvement in LOS and cost.
Our findings are of particular importance in light of the persistent concerns about hospitalist workload and job satisfaction. Although many hospitalists work with clinical coordinators and case managers, we believe that having the formal structure of a hospitalistcare coordinator team was the key element to improving hospitalist efficiency and satisfaction. We hope that our study is a precursor to research evaluating models of delivering hospital care and their impact on hospitalist work experience, hospital efficiency, and patient outcomes.
- .Innovations in the management of hospitalized patients.Nurse Pract.2006;Suppl:2–3.
- ,.Hospitalists and case managers: the perfect partnership.Lippincotts Case Manag.2004;9:280–286.
- ,.Productive interdisciplinary team relationships: the hospitalist and the case manager.Lippincotts Case Manag.2006;11:160–164.
- ,,.Care coordinator—blending roles to improve patient outcomes.J Nurs Manage.1997;28:49–52.
- ,,,.Effects of a medical team coordinator on length of hospital stay.Can Med Assoc J.1992;146:511–515.
- ,,, et al.Effect of a nurse team coordinator on outcomes for hospitalized medicine patients.Am J Med.2005;118:1148–1153.
- Society of Hospital Medicine. Available at: http://www.hospitalmedicine.org/Content/NavigationMenu/ResourceCenter/Surveys/Surveys1.htm. Accessed April 2,2007.
- ,,.How hospitalists spend their time: insights on efficiency and safety.J Hosp Med.2006;1:88–93.
- ,,,,.Characteristics and work experiences of hospitalists in the United States.Arch Intern Med.2001;161:851–858.
- ,,,,,.Patient perception of quality in discharge instruction.Patient Educ Couns.2005;59:56–68.
- ,,, et al.Adverse events among medical patient after hospital discharge.Can Med Assoc J.2004;170:345–349.
- ,,,,.The incidence and severity of adverse events affecting patients after discharge from the hospital.Ann Intern Med.2003;138:161–167.
- ,.Lost in transition: challenges and opportunities for improving the quality of transitional care.Ann Intern Med.2004;141:533–536.
- ,,, et al.Transition of care for hospitalized elderly patients—development of a discharge checklist for hospitalists.J Hosp Med.2006;1:354–360.
- ,,, et al. Re‐engineering the hospital discharge—an example of a multifaceted process evaluation. Advances in Patient Safety: From Research to Implementation. Vol.2,Concepts and Methodology. AHRQ publication 05‐0021‐2.Rockville, MD:AHRQ;2005. p379–394.
Many hospitalists work with clinical coordinators and case managers.13 The descriptions of these roles often overlap4 and commonly include activities such as obtaining medical records, expediting tests and procedures, coordinating the plan of care with other health care providers, assessing postdischarge needs, completing discharge paperwork, and arranging follow‐up visits.2, 5, 6 Despite the potential to improve patient care and hospital efficiency, few studies have formally evaluated the impact of these roles. Moher et al. found that adding a clinical coordinator to a general medical team decreased length of stay (LOS) and improved patient satisfaction.5 However, this study was conducted at a time when the LOS was routinely longer than it is today. Forster et al. found that adding a clinical coordinator to a general medical team resulted in improved patient satisfaction but did not reduce length of stay or risk of adverse events occurring following hospital discharge.6 Both these studies evaluated the impact of adding a clinical coordinator to resident‐covered medical teams. Yet many hospitalists deliver care without residents, limiting the generalizability of the findings from these studies.
To date, no studies have evaluated the impact of clinical coordinators, case managers, or other nonphysician providers on the hospitalist work experience. This is surprising, as hospital medicine group leaders list daily workload and work hours among their top concerns.7 Clinical coordinators have the potential to improve patient care and hospital efficiency while simultaneously improving the experience of the hospitalists with whom they work. We conducted this study to evaluate the impact of a hospitalistcare coordinator team on hospitalist work experience, patient satisfaction, and hospital efficiency.
METHODS
Setting
The study was conducted on the hospitalist service at Northwestern Memorial Hospital (NMH), a 753‐bed hospital in Chicago, Illinois. The hospitalist service is staffed by 5 hospitalists on duty at a time. Hospitalists work without residents and are on service for 7 consecutive days, usually followed by 7 consecutive days off. Daytime admissions are distributed among all hospitalists on duty in a consecutive fashion. A night float hospitalist performs admissions and all cross‐cover activities from 7:00 PM until 7:00 AM. Nighttime admissions are distributed to day hospitalists based on each hospitalist's daily census.
Study Design
Funding was provided by the hospital for a 12‐week study, and hospital administrative leaders collaborated as part of the research team. During each of the 12 weeks from September 2006 through November 2006, half the hospitalists on duty each week were randomly assigned to work with a hospitalist care coordinator (HCC) in a team approach. Hospitalists not assigned to work with a hospitalist care coordinator continued to work in their usual fashion, which included working with unit‐based care coordinators (UCCs). UCCs follow all patients on a 30‐bed medicine unit but generally do not round with physicians. HCCs performed all the activities that UCCs perform but also performed additional key activities (see Table 1) and worked in a team approach with their hospitalist. Unit‐based social workers and discharge planners were available for all hospitalists during the study. During each day patients were admitted consecutively to one of the hospitalists on service, regardless of their assignment to work with or without an HCC. Similarly, night admissions were distributed to hospitalists without regard to their assignment to work with or without an HCC.
| Activity type | Activities performed by both UCCs and HCCs | Additional activities performed by HCCs only |
|---|---|---|
| Care coordination | Document the interdisciplinary plan of care | Ensure collaboration in formulating the plan of care |
| Obtain outside medical records | ||
| Inform staff nurse of stat orders during rounds | ||
| Obtain certain test results (eg, preliminary echo reports) | ||
| Patient and family needs | Address patient and family concerns | Proactively identify and address patient and family concerns |
| Schedule family meetings | ||
| Efficiency of care delivery | Remediate barriers that impede plan of care and/or discharge | Identify barriers that impede plan of care |
| Identify and document avoidable days | Ensure tests are scheduled | |
| Discharge process | Coordinate discharge plans with social work and discharge planner | Schedule and confirm follow‐up appointments |
| Initiate discharge instructions | ||
| Write discharge prescriptionsverified and signed by physician | ||
| Review discharge instructions with patient and/or family |
HospitalistCare Coordinator Team
Four HCCs were used in this study. All 4 were registered nurses with specialized training in case management. Prior to the start of the study, the investigators held meetings with hospitalists and the HCCs to describe this new role, the work flow for the hospitalistcare coordinator team, and work activities appropriate for the HCC. Activities related to the discharge process were emphasized as a key feature of the HCC role. Hospitalists and HCCs were instructed to round together as a team each morning. They were advised to collaborate on the daily plan of care and assign specific activities for each to accomplish. During the study weekly meetings were held with the HCCs, the hospitalists with whom they were finishing the week, and the hospitalists with whom they were scheduled to work during the upcoming week. The purpose of these meetings was to ensure that the work flow and work activities were optimal.
Outcome Measures
At the completion of each week, all hospitalists on service were given an anonymous Web‐based survey designed to assess their satisfaction and perceived work efficiency. Hospitalists were asked to rate the efficiency of various work activities during the preceding week on a 5 point Likert scale (1 = very inefficient, 2 = somewhat inefficient, 3 = neutral, 4 = somewhat efficient, 5 = very efficient). Hospitalists who had worked with an HCC were also asked whether they thought working with an HCC improved their efficiency and increased their job satisfaction. We postulated that patient satisfaction with the discharge process might improve with use of the hospitalistHCC team. Therefore, patient satisfaction was assessed by telephone interviews conducted 714 days after discharge. Because of resource limitations, we were only able to interview patient during the second half of the study. Patients were asked to rate their satisfaction with the clarity of verbal and written discharge instructions as well as their overall satisfaction with hospital discharge using a 10‐point Likert scale (from 1 = least satisfied to 10 = most satisfied). Hospital databases provided information on patient demographics, LOS, and cost.
Data Analysis
All analyses were conducted using Stata version 9.0 (StataCorp LP, College Station, TX). Patient characteristics were compared using chi‐square and t tests. Responses to the hospitalist survey for the weeks when they worked independently and the weeks when they worked as a hospitalistHCC team were compared using the Wilcoxon rank sum test. To adjust for the clustering of responses by physicians (ie, individual physicians completed more than 1 survey), we used linear regression and the cluster option. The results were very similar, and only the P values from the Wilcoxon rank sum test are presented. Unadjusted LOS and cost were compared using the Wilcoxon rank sum test. We also conducted multivariate linear regressions using log‐transformed LOS and log‐transformed cost as dependent variables. The independent variable was the team type (whether patients were cared for by a hospitalistHCC team or a hospitalist working independently); age, sex, ethnicity, payer type, and diagnosis‐related group (DRG) weight were included as covariates, and P values were adjusted for physician clustering. We hypothesized a priori that the HCC would have no effect on the LOS of or cost for patients whose hospitalizations were very short. We therefore conducted secondary analyses in which we eliminated patients with an LOS of 1 day or less.
RESULTS
There were 356 patients cared for by hospitalistHCC teams and 337 patients cared for by control hospitalists. Of the 60 weeks of hospitalist service of the study, hospitalistHCC teams accounted for 31 weeks (52%) and control hospitalists for 29 weeks (48%). Patients cared for by the hospitalistHCC teams were similar in age, sex, ethnicity, payer type, and DRG weight to those cared for by control hospitalists (see Table 2).
| HospitalistHCC team | Control | P value | |
|---|---|---|---|
| n (%) or mean SD | |||
| Patients, n (%) | 356 (51.4%) | 337 (48.6%) | |
| Age (years) | 59.3 18.6 | 59.0 20.1 | .86 |
| Women (%) | 190 (53.4%) | 192 (57.0%) | .34 |
| Ethnicity | .74 | ||
| White | 182 (51.1%) | 174 (51.6%) | |
| Black | 111 (31.2%) | 114 (33.8%) | |
| Hispanic | 23 (6.5%) | 21 (6.2%) | |
| Asian | 5 (1.4%) | 4 (1.2%) | |
| Other | 35 (9.8%) | 24 (7.1%) | |
| Payer | .47 | ||
| Medicare | 177 (49.7%) | 168 (49.9%) | |
| Private | 76 (21.4%) | 69 (20.5%) | |
| Medicaid | 43 (12.1%) | 44 (13.1%) | |
| Capitated | 43 (12.1%) | 31 (9.2%) | |
| Other | 17 (4.8%) | 25 (7.4%) | |
| Diagnosis‐related group weight | 1.1 0.8 | 1.2 0.8 | .31 |
Sixty surveys were completed by hospitalists at the end of their week on service (response rate 100%). Of the 31 responses from hospitalists completing a hospitalistHCC team week, 28 (90%) reported that working with an HCC improved their efficiency and 28 (90%) that working with an HCC improved their job satisfaction. The hospitalists indicated that working with an HCC significantly improved the efficiency of most of their activities (see Table 3). Specifically, activities related to communication with nurses and patients and activities involving discharge planning and execution were improved with the use of an HCC. As would be expected, certain other activities did not improve. For example, there were no differences between the groups in the perceived efficiency of performing histories and physicals or placing admission orders. For activities that were significantly different, the Wilcoxon rank sum test and linear regression analysis adjusting for physician clustering showed identical results.
| HospitalistHCC Team | Control | P value | |
|---|---|---|---|
| Mean score SD* | |||
| |||
| Performing histories and physicals | 3.94 0.77 | 3.93 0.84 | .98 |
| Performing medication reconciliation | 3.35 1.08 | 2.03 1.18 | < .001 |
| Placing admission orders | 3.94 0.73 | 4.00 0.87 | .57 |
| Communicating with nurses | 4.45 0.68 | 3.14 1.09 | < .001 |
| Communicating with consultants | 3.65 0.75 | 3.34 1.04 | .25 |
| Communicating with patients | 4.42 0.62 | 3.62 1.01 | < .001 |
| Communicating with families | 4.32 0.70 | 2.89 1.14 | < .001 |
| Coordinating discharge plans | 4.74 0.51 | 2.76 1.18 | < .001 |
| Making/updating sign‐out | 3.55 0.72 | 3.49 0.83 | .55 |
| Making discharge instructions | 4.29 0.74 | 3.10 1.01 | < .001 |
| Going over discharge instructions | 4.48 0.57 | 2.76 1.15 | < .001 |
| Writing discharge prescriptions | 3.87 0.67 | 2.52 1.21 | < .001 |
| Arranging follow‐up appointments | 4.19 0.75 | 2.03 1.09 | < .001 |
Seventy‐one of 196 eligible patients (36%) completed the discharge satisfaction interview. Of the 71 patients interviewed, 44 (62%) were cared for by hospitalistHCC teams and 27 (38%) were cared for by control hospitalists. Patient satisfaction with the clarity of the verbal and written discharge instructions and overall satisfaction with hospital discharge was similar between the 2 groups (see Table 4).
| HospitalistHCC Team (n = 44) | Control (n = 27) | P value | |
|---|---|---|---|
| Mean score (SD)* | |||
| |||
| Clarity of verbal discharge instructions | 8.86 ( 2.31) | 8.44 ( 2.63) | 0.52 |
| Clarity of written discharge instructions | 8.95 ( 2.30) | 8.93 ( 2.54) | 0.78 |
| Overall satisfaction with hospital discharge | 8.57 ( 2.42) | 8.37 ( 2.90) | 0.94 |
The unadjusted mean LOS for patients cared for by hospitalistHCC teams was 4.70 4.15 days compared with 5.07 3.99 days for patients cared for by control hospitalists (P = .005; see Table 5). The unadjusted mean cost for patients cared for by hospitalistHCC teams was $10,052.96 $11,708.73 compared with $11,703.19 $20,455.78 for patients cared for by control hospitalists (P = .008). In multivariate analysis using age, sex, ethnicity, payer type, and DRG weight as independent variables and adjusting for physician clustering, LOS remained lower for patients cared for by hospitalistHCC teams; however, this result was not statistically significant (0.28 days, P = .17). Similar multivariate regression analysis showed a trend toward lower cost for patients cared for by the hospitalistHCC teams (585.62, P = .15).
| Unadjusted mean (SD) | P value for unadjusted difference* | Adjusted difference with hospitalistHCC team | P value for adjusted difference | |
|---|---|---|---|---|
| ||||
| Length of stay | ||||
| HospitalistHCC teams | 4.70 (4.15) | .005 | 0.28 | .17 |
| Control hospitalists | 5.07 (3.99) | |||
| Cost | ||||
| HospitalistHCC teams | 10,052.96 (11,708.73) | .008 | 585.62 | .15 |
| Control hospitalists | 11,703.19 (20,455.78) | |||
DISCUSSION
Our study found that hospitalists working in a team approach with an HCC rated the efficiency of their daily work and their job satisfaction significantly higher than did control hospitalists. Specific areas of improved efficiency included communication activities and activities related to hospital discharge. A prior study conducted by our group found that hospitalists spend a lot of time on indirect patient care activities such as communication and activities related to the discharge process, while spending relatively little time on direct patient care.8 Improving the efficiency of indirect patient care activities of hospitalists is likely to improve their job satisfaction. The importance of improving hospitalist workload and job satisfaction is underscored by the relatively high number of hospitalists at risk for burnout9 and the growing concern about daily workload among hospital medicine group leaders.7
Patient satisfaction was not significantly affected by the use of the hospitalistHCC team in our study. A priori, we postulated that patient satisfaction with the discharge process might improve with the use of the hospitalistHCC team. We therefore limited survey questions to assessing only satisfaction with hospital discharge rather than other aspects of patient hospital care. A recent study reported that patients rated the quality of discharge instructions significantly lower than they rated the overall quality of their hospital stay.10 However, the patients in our study gave high ratings to both discharge instructions and overall satisfaction with hospital discharge. This may explain why we were unable to detect a difference. Our study was limited by the relatively small number of patients we were able to contact to assess satisfaction. Previous studies evaluating the impact of care coordinators either did not assess patient satisfaction with discharge5 or found no difference in satisfaction with hospital discharge.6
Although our study did not find a difference in patient satisfaction with the discharge process, we believe the hospitalistHCC model has the potential to complement efforts to reduce the risk of adverse events as patients transition out of the hospital. It has been reported that 12% of patients have a preventable or ameliorable adverse event in the period immediately following hospital discharge.11, 12 Although Forster et al. did not find a reduction in the risk of adverse events with the addition of a clinical coordinator to a general medical team, they noted incongruence between the coordinator's role and the outcomes measured.6 Similarly, we would need to modify the role of the HCC from a position designed mainly to improve efficiency to one that complements efforts to improve the quality of the discharge process. Possible ways to enhance the HCC role in this regard include increasing the emphasis on and training in patient education skills. Several recently published articles have emphasized the need to redesign the discharge process in an effort to reduce the risk of adverse events following hospital discharge.1315 A modified HCC role might be an essential feature of a redesigned multidisciplinary discharge process.
We were unable to demonstrate improved efficiency for the hospital. Although LOS and cost were lower for patients cared for by the hospitalistHCC teams, the difference was not statistically significant. One possible explanation for why we did not observe a larger reduction in LOS is that our hospitalist service had a lower‐than‐average patient volume during the study period. The lower volume mirrored an unanticipated dip in hospital volume during the same period. Specifically, our service normally discharges an average of 338 patients per month, but during the study period we discharged an average of 235 patients per month. A potential LOS and cost benefit may have been attenuated by the relatively low volume, as hospitalists had ample time to dedicate to communication and coordination of discharge plans.
Our study had several limitations. It was conducted on a nonteaching hospitalist service at a single site. Hospitalist practices vary widely in their staffing and scheduling models. As previously mentioned, we were only able to perform patient satisfaction surveys during the second half of the study period. In addition, hospitalistHCC team patients made up a larger percentage of the patient survey responses (62%) than did control hospitalist patients (38%). This may have affected our ability to detect differences in satisfaction with the hospital discharge process. As also previously noted, our patient volume was lower than normal during the study period. We believe that a higher volume would have magnified differences in hospitalists' perceived efficiency and perhaps resulted in significant improvements in LOS and cost. Finally, the hospital provided funding for only a 12‐week study. This limited our sample size and the power of the study to detect important differences. It is possible that a larger sample size and/or longer study period may have been able to demonstrate a statistically significant improvement in LOS and cost.
Our findings are of particular importance in light of the persistent concerns about hospitalist workload and job satisfaction. Although many hospitalists work with clinical coordinators and case managers, we believe that having the formal structure of a hospitalistcare coordinator team was the key element to improving hospitalist efficiency and satisfaction. We hope that our study is a precursor to research evaluating models of delivering hospital care and their impact on hospitalist work experience, hospital efficiency, and patient outcomes.
- .Innovations in the management of hospitalized patients.Nurse Pract.2006;Suppl:2–3.
- ,.Hospitalists and case managers: the perfect partnership.Lippincotts Case Manag.2004;9:280–286.
- ,.Productive interdisciplinary team relationships: the hospitalist and the case manager.Lippincotts Case Manag.2006;11:160–164.
- ,,.Care coordinator—blending roles to improve patient outcomes.J Nurs Manage.1997;28:49–52.
- ,,,.Effects of a medical team coordinator on length of hospital stay.Can Med Assoc J.1992;146:511–515.
- ,,, et al.Effect of a nurse team coordinator on outcomes for hospitalized medicine patients.Am J Med.2005;118:1148–1153.
- Society of Hospital Medicine. Available at: http://www.hospitalmedicine.org/Content/NavigationMenu/ResourceCenter/Surveys/Surveys1.htm. Accessed April 2,2007.
- ,,.How hospitalists spend their time: insights on efficiency and safety.J Hosp Med.2006;1:88–93.
- ,,,,.Characteristics and work experiences of hospitalists in the United States.Arch Intern Med.2001;161:851–858.
- ,,,,,.Patient perception of quality in discharge instruction.Patient Educ Couns.2005;59:56–68.
- ,,, et al.Adverse events among medical patient after hospital discharge.Can Med Assoc J.2004;170:345–349.
- ,,,,.The incidence and severity of adverse events affecting patients after discharge from the hospital.Ann Intern Med.2003;138:161–167.
- ,.Lost in transition: challenges and opportunities for improving the quality of transitional care.Ann Intern Med.2004;141:533–536.
- ,,, et al.Transition of care for hospitalized elderly patients—development of a discharge checklist for hospitalists.J Hosp Med.2006;1:354–360.
- ,,, et al. Re‐engineering the hospital discharge—an example of a multifaceted process evaluation. Advances in Patient Safety: From Research to Implementation. Vol.2,Concepts and Methodology. AHRQ publication 05‐0021‐2.Rockville, MD:AHRQ;2005. p379–394.
Copyright © 2008 Society of Hospital Medicine
Mastery Learning of Procedural Skills
In a supplement to its inaugural issue, the Journal of Hospital Medicine published core competencies for hospitalists covering 3 areas: clinical conditions, systems in health care, and procedures.1 Completion of a traditional internal medicine residency may not provide hospitalists with the skills necessary to safely perform necessary procedures such as thoracentesis. A recent article reported that most internal medicine residents surveyed were uncomfortable performing common procedures, and their discomfort was higher for thoracentesis than for central line insertion, lumbar puncture, or paracentesis.2 This confirmed a previous report that family practice residents had low confidence in performing thoracenteses.3 Thoracentesis also carries the risk of the potentially life‐threatening complication of pneumothorax, which may be increased when performed by physicians‐in‐training.4
One method for improving training and assessment is the use of simulation technology. Simulation has been used to increase knowledge, provide opportunities for deliberate and safe practice, and shape the development of clinical skills.5, 6 Simulation has also been advocated for assessing competence in procedures including carotid angiography,7 emergency airway management,8 basic bronchoscopy,9 and advanced cardiac life support (ACLS).10, 11
Recently, we used simulation technology to help residents reach mastery learning standards for ACLS.11 Mastery learning,12 an extreme form of competency‐based education,13 implies that learners have acquired the clinical knowledge and skill measured against rigorous achievement standards. In mastery learning, educational results are equivalent, whereas educational practice time differs. To demonstrate mastery learning, we first documented a 38% improvement in skill after a simulation‐based educational intervention10 and used a multidisciplinary panel to determine mastery achievement standards for ACLS skills in 6 clinical scenarios.14 These standards were used in a study in which the amount of time needed to achieve skill mastery was allowed to vary while the skill outcomes of the residents were identical clinically.11
The present study had 4 aims. The first was to assess the baseline skill and knowledge of third‐year residents in thoracentesis. The second was to compare the thoracentesis‐related knowledge and skills of residents before and after an educational intervention. The third was to assess the correlation of medical knowledge and clinical experience with performance on a clinical skills examination after simulation training. The last was to document the feasibility of incorporating simulation‐based education into a training program.
METHODS
Objectives and Design
The study, which had a pretestposttest design without a control group,15 was of a simulation‐based, mastery learning educational intervention in thoracentesis. Primary measurements were obtained at baseline (pretest) and after the educational intervention (posttest).
Participants
Study participants were all 40 third‐year residents in the internal medicine residency program at Northwestern University's Chicago campus from January to May 2006. The Northwestern University Institutional Review Board approved the study. Participants provided informed consent before baseline assessment.
This residency program is based at Northwestern Memorial Hospital (NMH) and the Jesse Brown Veteran's Affairs Medical Center. Residents perform thoracenteses under the supervision of second‐ or third‐year residents or faculty members who are credentialed to perform the procedure. A didactic lecture on thoracentesis is part of the annual lecture series.
Procedure
The residents were kept as an intact group during the study period. The research procedure had 2 phases. First, the knowledge and clinical skills of participants at baseline were measured. Second, residents received two 2‐hour education sessions featuring didactic content and deliberate practice using a thoracentesis model. Between 4 and 6 weeks after the pretest, all residents were retested and were expected to meet or exceed a minimum passing score (MPS) on the clinical skills exam. Those who scored below the MPS engaged in more clinical skills practice until the mastery standard was reached. The amount of extra time needed to achieve the MPS was documented.
Educational Intervention
The intervention was designed to help residents acquire the knowledge and skills needed to perform a competent thoracentesis. The necessary components for mastery skill development were contained in the intervention. These included deliberate practice, rigorous skills assessment, and the provision of feedback in a supportive environment.16
The study was conducted in the Northwestern University Center for Advanced Surgical Education (N‐CASE) using the thoracentesis simulator developed by MediSim Inc. (Alton, Ontario) (
Teaching and testing sessions were standardized. In teaching sessions, groups of 2‐4 residents had 4 hours to practice and ask questions, and to receive structured education and feedback from 1 of 2 hospitalist faculty instructors (J.H.B., K.J.O.). One of the 4 hours was devoted to the presentation of didactic material on indications, complications, and interpretation of results and a step‐by‐step demonstration of a thoracentesis. This presentation was videotaped to ensure standardization of content. The remaining 3 hours were devoted to clinical skills exam education, deliberate practice, and feedback.
One resident was present at each pretest and posttest session with 1 of the 2 faculty instructors who gave standardized instructions. The resident was expected to obtain a relevant history; perform a limited physical examination; review PA, lateral, and decubitus chest radiographs; perform a simulated thoracentesis; and order appropriate diagnostic tests. Written examinations were completed at the pretest and posttest sessions.
Measurements
A 25‐item checklist was developed for the thoracentesis procedure using relevant sources17, 18 and rigorous step‐by‐step procedures.19 Each skill or other action was listed in order and given equal weight. Each skill or action was scored dichotomouslyeither 0 = done correctly or 1 = done incorrectly. Checklists were reviewed for completeness and accuracy by 2 authors who frequently perform and supervise thoracenteses (J.H.B., K.J.O.), 2 authors with expertise in checklist design (D.B.W., W.C.M.), and the physician director of the medical intensive care unit at NMH. The checklist was used in a pilot clinical skills examination of 4 chief medical residents to estimate checklist reliability and face validity.
The MPS for the thoracentesis clinical skills examination was determined by 10 clinical experts using the Angoff and Hofstee standard setting methods. The panel was composed of clinical pulmonary critical care medicine faculty (n = 7) and senior fellows (n = 3). Each panel member was given instruction on standard setting and asked to use the Angoff and Hofstee methods to assign pass/fail standards. The Angoff method asks expert judges to estimate the percentage of borderline examinees who would answer each test item correctly. The Hofstee method requires judges to estimate 4 properties of an evaluation's passing scores and failure rates. The panel was asked to repeat their judgments 6 weeks later to assure stability of the MPS. Details about the use of a standard setting exercise to set an MPS for clinical skills examinations have been published previously.14, 20
Evaluation of each resident's skill was recorded on the checklist by 1 of the 2 faculty raters at the pretest and posttest sessions. A random sample of 50% of the pretest sessions was rescored by a third rater with expertise in scoring clinical skills examinations (D.B.W.) to assess interrater reliability. The rescorer was blinded to the results of the first evaluation.
A multiple choice written examination was prepared according to examination development guidelines21 using appropriate reference articles and texts.17, 18, 22 The examination was prepared by 1 author (J.H.B.) and reviewed for accuracy and clarity by 2 others (K.J.O., D.B.W.) and by the director of the medical intensive care unit at NMH. The examination had questions on knowledge and comprehension of the procedure as well as data interpretation and application. It was administered to 9 fourth‐year medical students and 5 pulmonary/critical care fellows to obtain pilot data. Results of the pilot allowed creation of a pretest and a posttest that were equivalent in content and difficulty.23 The Kuder Richardson Formula 20 (KR‐20) reliability coefficients for the 20‐item pretest and the 20‐item posttest were .72 and .74, respectively.
Demographic data were obtained from the participants including age, gender, ethnicity, medical school, and scores on the United States Medical Licensing Examination (USMLE) Steps 1 and 2. Each resident's experience performing the procedure was also collected at pretest.
Primary outcome measures were performance on the posttest written and clinical examinations. Secondary outcome measures were the total training time needed to reach the MPS (minimum = 240 minutes) and a course evaluation questionnaire.
Data Analysis
Checklist score reliability was estimated by calculating interrater reliability, the preferred method for assessments that depend on human judges,24 using the kappa () coefficient25 adjusted using the formula of Brennan and Prediger.26 Within‐group differences from pretest (baseline) to posttest (outcome) were analyzed using paired t tests. Multiple regression analysis was used to assess the correlation of posttest performance on thoracentesis skills with (1) performance on pretest thoracentesis skills, (2) medical knowledge measured by the thoracentesis pretest and posttest and USMLE Steps 1 and 2, (3) clinical experience in performing thoracentesis, (4) clinical self‐confidence about performing thoracentesis, and (5) whether additional training was needed to master the procedure.
RESULTS
All residents consented to participate and completed the entire training protocol. Table 1 presents demographic data about the residents. Most had limited experience performing and supervising thoracenteses.
| Characteristic | PGY‐3 Resident |
|---|---|
| Age (years), mean (SD) | 28.88 (1.57) |
| Male | 23 (57.5%) |
| Female | 17 (42.5%) |
| African American | 1 (2.5%) |
| White | 21 (52.5%) |
| Asian | 14 (35.0%) |
| Other | 4 (10.0%) |
| U.S. medical school graduate | 39 (97.5%) |
| Foreign medical school graduate | 1 (2.5%) |
| Number of thoracentesis procedures | |
| Performed as an intern | |
| 0‐1 | 27.5% |
| 2‐4 | 60.0% |
| 5 | 12.5% |
| Performed as a PGY‐2 and PGY‐3 resident | |
| 0‐1 | 25.0% |
| 2‐4 | 55.0% |
| 5 | 20.0% |
| Supervised others as a PGY‐2 and PGY‐3 resident | |
| 0‐1 | 27.5% |
| 2‐4 | 57.5% |
| 5 | 15.0% |
Interrater reliability for the thoracentesis checklist data was calculated at pretest. Across the 25 checklist items, the mean kappa coefficient was very high (n = .94). The MPS used as the mastery achievement standard was 80% (eg, 20 of 25 checklist items). This was the mean of the Angoff and Hofstee ratings obtained from the first judgment of the expert panel and is displayed in Figure 1.
No resident achieved mastery at pretest. However, 37 of the 40 medicine residents (93%) achieved mastery within the standard 4‐hour thoracentesis curriculum. The remaining 3 residents (7%) needed extra time ranging from 20 to 90 minutes to reach mastery.
Figure 1 is a graphic portrait with descriptive statistics of the residents' pretest and posttest performance on the thoracentesis written and clinical skills exams. For the written exam, the mean score rose from 57.63% to 89.75%, a statistically significant improvement of 56% from pretest to posttest (t[39] = 17.0, P < .0001). The clinical skills exam also showed a highly significant 71% pretest‐to‐posttest gain, as the mean score rose from 51.70% to 88.3% (t[39] = 15.6, P < .0001).
Results from the regression analysis indicate that neither pretest performance, medical knowledge measured by local or USMLE examinations, nor thoracentesis clinical experience was correlated with the posttest measure of thoracentesis clinical skills. However, the need for additional practice to reach the mastery standard on the posttest was a powerful negative predictor of posttest performance: b = .27 (95% CI = .46 to .09; P < .006; r2 = .28). For those residents who required extra practice time, the initial clinical skills posttest score was 20% lower than that of their peers. Although the need for extra deliberate practice was associated with relatively lower initial posttest scores, all residents ultimately met or exceeded the rigorous thoracentesis MPS.
The responses of the 40 residents on a course evaluation questionnaire were uniformly positive. Responses were recorded on a Likert scale where 1 = strongly disagree, 2 = disagree, 3 = uncertain, 4 = agree, and 5 = strongly agree (Table 2). The data show that residents strongly agreed that practice with the medical simulator boosts clinical skills and self‐confidence, that they received useful feedback from the training sessions, and that deliberate practice using the simulator is a valuable educational experience. Residents were uncertain whether practice with the medical simulator has more educational value than patient care.
| Mean | SD | |
|---|---|---|
| Practice with the thoracentesis model boosts my skills to perform this procedure. | 4.3 | 0.8 |
| I receive useful educational feedback from the training sessions. | 4.0 | 0.6 |
| Practice with the thoracentesis model boosts my clinical self‐confidence. | 4.1 | 0.9 |
| Practice with the thoracentesis model has more educational value than patient care experience. | 2.3 | 1.0 |
| The Skills Center staff are competent. | 4.3 | 0.6 |
| Practice sessions in the Skills Center are a good use of my time. | 3.7 | 1.0 |
| Practice sessions using procedural models should be a required component of residency education. | 3.8 | 0.8 |
| Deliberate practice using models is a valuable educational experience. | 4.0 | 0.9 |
| Practice sessions using models are hard work. | 2.1 | 0.7 |
| Increasing the difficulty of simulated clinical problems helps me become a better doctor. | 3.9 | 0.7 |
| The controlled environment in the Skills Center helps me focus on clinical education problems. | 3.9 | 0.8 |
| Practice with the thoracentesis model has helped to prepare me to perform the procedure better than clinical experience alone. | 4.0 | 1.0 |
DISCUSSION
This study demonstrates the use of a mastery learning model to develop the thoracentesis skills of internal medicine residents to a high level. Use of a thoracentesis model in a structured educational program offering an opportunity for deliberate practice with feedback produced large and consistent improvements in residents' skills. An important finding of our study is that despite having completed most of their internal medicine training, residents displayed poor knowledge and clinical skill in thoracentesis procedures at baseline. This is similar to previous studies showing that the procedural skills and knowledge of physicians at all stages of training are often poor. Examples of areas in which significant gaps were found include basic skills such as chest radiography,27 emergency airway management,8 and pulmonary auscultation.28 In contrast, after the mastery learning program, all the residents met or exceeded the MPS for the thoracentesis clinical procedure and scored much higher on the posttest written examination.
Our data also demonstrate that medical knowledge measured by procedure‐specific pretests and posttests and USMLE Steps 1 and 2 scores were not correlated with thoracentesis skill acquisition. This reinforces findings from our previous studies of ACLS skill acquisition10, 11 and supports the difference between professional and academic achievement. Pretest skill performance and clinical experience also were not correlated with posttest outcomes. However, the amount of deliberate practice needed to reach the mastery standard was a powerful negative predictor of posttest thoracentesis skill scores, replicating our research on ACLS.11 We believe that clinical experience was not correlated with posttest outcomes because residents infrequently performed thoracenteses procedures during their training.
This project demonstrates a practical model for outcomes‐based education, certification, and program accreditation. Given the need to move procedural training in internal medicine beyond such historical methods as see one, do one, teach one,29 extension of the mastery model to other invasive procedures deserves further study. At our institution we have been encouraged by the ability of simulation‐based education in ACLS to promote long‐term skill retention30 and improvement in the quality of actual patient care.31 In addition to studying these outcomes for thoracentesis, we plan to incorporate the use of ultrasound when training residents to perform procedures such as thoracentesis and central venous catheter insertion.
Given concerns about the quality of resident preparation to perform invasive procedures, programs such as this should be considered as part of the procedural certification process. As shown by our experience with several classes of residents (n = 158), use of simulation technology to reach high procedural skill levels is effective and feasible in internal medicine residency training. In addition, our residents have consistently enjoyed participating in the simulated training programs. Postcourse questionnaires show that residents agree that deliberate practice with simulation technology complements but does not replace patient care in graduate medical education.5, 10
An important question needing more research is whether performance in a simulated environment transfers to actual clinical settings. Several small studies have demonstrated such a relationship,8, 9, 31, 32 yet the transfer of simulated training to clinical practice requires further study. More work should also be done to assess long‐term retention of skills30 and to determine the utility and benefit of simulation‐based training in procedural certification and credentialing.
This study had several limitations. It was conducted in 1 training program at a single medical center. The sample size (n = 40) was relatively small. The thoracentesis model was used for both education and testing, potentially confounding the events. However, these limitations do not diminish the pronounced impact that the simulation‐based training had on the skills and knowledge of our residents.
In conclusion, this study has demonstrated the ability of deliberate practice using a thoracentesis model to produce high‐level performance of simulated thoracenteses. The project received high ratings from learners and provides reliable assessments of procedural competence. Although internists are performing fewer invasive procedures now than in years past, procedural training is still an important component of internal medicine training.29, 33 Attainment of high procedural skill levels may be especially important for residents who plan to practice hospital medicine. We believe that simulation‐based training using deliberate practice should be a key contributor to future internal medicine residency education, certification, and accreditation.
Acknowledgements
The authors thank Charles Watts, MD, and J. Larry Jameson, MD, PhD, for their support of this work. We recognize and appreciate the Northwestern University internal medicine residents for their dedication to patient care and education.
- ,,,,.Core competencies in hospital medicine: development and methodology.J Hosp Med.2006;1:48–56.
- ,,, et al.Beyond the comfort zone: residents assess their comfort performing inpatient medical procedures.Am J Med.2006;119:71.e17–71.e24.
- ,,.Perception of competency to perform procedures and future practice intent: a national survey of family practice residents.Acad Med.2003;78:926–932.
- ,,,,,.Lower risk and higher yield for thoracentesis when performed by experienced operators.Chest.1993;103:1873–1876.
- ,,, et al.Simulation technology for health care professional skills training and assessment.JAMA.1999;282:861–866.
- ,,, et al.Reliability and validity of a simulation‐based acute care skills assessment for medical students and residents.Anesthesiology.2003;99:1270–1280.
- ,,,.Learning curves and reliability measures for virtual reality simulation in the performance assessment of carotid angiography.J Am Coll Cardiol.2006;47:1796–1802.
- ,,,,.Achieving house staff competence in emergency airway management: results of a teaching program using a computerized patient simulator.Crit Care Med.2004;32:2422–2427.
- ,,.Bronchoscopy simulator effectively prepares junior residents to competently perform basic clinical bronchoscopy.Ann Thorac Surg.2004;78:287–291.
- ,,, et al.Simulation‐based training of internal medicine residents in advanced cardiac life support protocols: a randomized trial.Teach Learn Med.2005;17:210–216.
- ,,, et al.Mastery learning of advanced cardiac life support skills by internal medicine residents using simulation technology and deliberate practice.J Gen Intern Med.2006;21:251–256.
- Block JH, ed.Mastery Learning: Theory and Practice.New York:Holt, Rinehart and Winston;1971.
- ,,,.Competency‐Based Curriculum Development in Medical Education. Public Health Paper No. 68.Geneva, Switzerland:World Health Organization;1978.
- ,,, et al.Comparison of two standard‐setting methods for advanced cardiac life support training.Acad Med.2005;80(10 Suppl):S63–S66.
- ,,.Experimental and Quasi‐Experimental Designs for Generalized Causal Inference.Boston:Houghton Mifflin;2002.
- .Deliberate practice and the acquisition and maintenance of expert performance in medicine and related domains.Acad Med.2004;79(10 Suppl):S70–S81.
- ,,,,.Guidelines for thoracentesis and needle biopsy of the pleura. This position paper of the American Thoracic Society was adopted by the ATS Board of Directors June 1988.Am Rev Resp Dis.1989;140:257–258.
- .Clinical practice. Pleural effusion.N Engl J Med2002;346:1971–1977.
- . The Checklists Development Checklist. Western Michigan University Evaluation Center, July 2000. Available at: http://www.wmich.edu/evalctr/checklists/cdc.htm. Accessed December 15,2005.
- ,,.Procedures for establishing defensible absolute passing scores on performance examinations in health professions education.Teach Learn Med2006;18:50–57.
- ,.Measurement and Assessment in Teaching.8th ed.Upper Saddle River, NJ:Prentice Hall;2000.
- .Pleural Diseases.4th ed.Philadelphia, PA:Lippincott Williams 2000:821–829.
- .Reliability: on the reproducibility of assessment data.Med Educ.2004;38:1006–1012.
- ,,.Statistical Methods for Rates and Proportions.3rd ed.New York:John Wiley 2003.
- ,.Coefficient kappa: some uses, misuses, and alternatives.Educ Psychol Meas.1981;41:687–699.
- ,,,.Competency in chest radiography: a comparison of medical students, residents and fellows.J Gen Intern Med.2006;21:460–465.
- ,.Pulmonary auscultatory skills during training in internal medicine and family practice.Am J Resp Crit Care Med.1999;159:1119–1124.
- ,.What procedures should internists do?Ann Intern Med.2007;146:392–3.
- ,,, et al.A longitudinal study of internal medicine residents' retention of advanced cardiac life support (ACLS) skills.Acad Med.2006;81(10 Suppl):S9–S12.
- ,,,,,.Simulation‐based education improves quality of care during cardiac arrest team responses at an academic teaching hospital: a case‐control study.Chest.2008;[Epub ahead of print].
- ,,, et al.Virtual reality training improves operating room performance: results of a randomized, double‐blinded study.Ann Surg.2002;236:458–464.
- ,.The declining number and variety of procedures done by general internists: a resurvey of members of the American College of Physicians.Ann Intern Med.2007;146:355–360.
In a supplement to its inaugural issue, the Journal of Hospital Medicine published core competencies for hospitalists covering 3 areas: clinical conditions, systems in health care, and procedures.1 Completion of a traditional internal medicine residency may not provide hospitalists with the skills necessary to safely perform necessary procedures such as thoracentesis. A recent article reported that most internal medicine residents surveyed were uncomfortable performing common procedures, and their discomfort was higher for thoracentesis than for central line insertion, lumbar puncture, or paracentesis.2 This confirmed a previous report that family practice residents had low confidence in performing thoracenteses.3 Thoracentesis also carries the risk of the potentially life‐threatening complication of pneumothorax, which may be increased when performed by physicians‐in‐training.4
One method for improving training and assessment is the use of simulation technology. Simulation has been used to increase knowledge, provide opportunities for deliberate and safe practice, and shape the development of clinical skills.5, 6 Simulation has also been advocated for assessing competence in procedures including carotid angiography,7 emergency airway management,8 basic bronchoscopy,9 and advanced cardiac life support (ACLS).10, 11
Recently, we used simulation technology to help residents reach mastery learning standards for ACLS.11 Mastery learning,12 an extreme form of competency‐based education,13 implies that learners have acquired the clinical knowledge and skill measured against rigorous achievement standards. In mastery learning, educational results are equivalent, whereas educational practice time differs. To demonstrate mastery learning, we first documented a 38% improvement in skill after a simulation‐based educational intervention10 and used a multidisciplinary panel to determine mastery achievement standards for ACLS skills in 6 clinical scenarios.14 These standards were used in a study in which the amount of time needed to achieve skill mastery was allowed to vary while the skill outcomes of the residents were identical clinically.11
The present study had 4 aims. The first was to assess the baseline skill and knowledge of third‐year residents in thoracentesis. The second was to compare the thoracentesis‐related knowledge and skills of residents before and after an educational intervention. The third was to assess the correlation of medical knowledge and clinical experience with performance on a clinical skills examination after simulation training. The last was to document the feasibility of incorporating simulation‐based education into a training program.
METHODS
Objectives and Design
The study, which had a pretestposttest design without a control group,15 was of a simulation‐based, mastery learning educational intervention in thoracentesis. Primary measurements were obtained at baseline (pretest) and after the educational intervention (posttest).
Participants
Study participants were all 40 third‐year residents in the internal medicine residency program at Northwestern University's Chicago campus from January to May 2006. The Northwestern University Institutional Review Board approved the study. Participants provided informed consent before baseline assessment.
This residency program is based at Northwestern Memorial Hospital (NMH) and the Jesse Brown Veteran's Affairs Medical Center. Residents perform thoracenteses under the supervision of second‐ or third‐year residents or faculty members who are credentialed to perform the procedure. A didactic lecture on thoracentesis is part of the annual lecture series.
Procedure
The residents were kept as an intact group during the study period. The research procedure had 2 phases. First, the knowledge and clinical skills of participants at baseline were measured. Second, residents received two 2‐hour education sessions featuring didactic content and deliberate practice using a thoracentesis model. Between 4 and 6 weeks after the pretest, all residents were retested and were expected to meet or exceed a minimum passing score (MPS) on the clinical skills exam. Those who scored below the MPS engaged in more clinical skills practice until the mastery standard was reached. The amount of extra time needed to achieve the MPS was documented.
Educational Intervention
The intervention was designed to help residents acquire the knowledge and skills needed to perform a competent thoracentesis. The necessary components for mastery skill development were contained in the intervention. These included deliberate practice, rigorous skills assessment, and the provision of feedback in a supportive environment.16
The study was conducted in the Northwestern University Center for Advanced Surgical Education (N‐CASE) using the thoracentesis simulator developed by MediSim Inc. (Alton, Ontario) (
Teaching and testing sessions were standardized. In teaching sessions, groups of 2‐4 residents had 4 hours to practice and ask questions, and to receive structured education and feedback from 1 of 2 hospitalist faculty instructors (J.H.B., K.J.O.). One of the 4 hours was devoted to the presentation of didactic material on indications, complications, and interpretation of results and a step‐by‐step demonstration of a thoracentesis. This presentation was videotaped to ensure standardization of content. The remaining 3 hours were devoted to clinical skills exam education, deliberate practice, and feedback.
One resident was present at each pretest and posttest session with 1 of the 2 faculty instructors who gave standardized instructions. The resident was expected to obtain a relevant history; perform a limited physical examination; review PA, lateral, and decubitus chest radiographs; perform a simulated thoracentesis; and order appropriate diagnostic tests. Written examinations were completed at the pretest and posttest sessions.
Measurements
A 25‐item checklist was developed for the thoracentesis procedure using relevant sources17, 18 and rigorous step‐by‐step procedures.19 Each skill or other action was listed in order and given equal weight. Each skill or action was scored dichotomouslyeither 0 = done correctly or 1 = done incorrectly. Checklists were reviewed for completeness and accuracy by 2 authors who frequently perform and supervise thoracenteses (J.H.B., K.J.O.), 2 authors with expertise in checklist design (D.B.W., W.C.M.), and the physician director of the medical intensive care unit at NMH. The checklist was used in a pilot clinical skills examination of 4 chief medical residents to estimate checklist reliability and face validity.
The MPS for the thoracentesis clinical skills examination was determined by 10 clinical experts using the Angoff and Hofstee standard setting methods. The panel was composed of clinical pulmonary critical care medicine faculty (n = 7) and senior fellows (n = 3). Each panel member was given instruction on standard setting and asked to use the Angoff and Hofstee methods to assign pass/fail standards. The Angoff method asks expert judges to estimate the percentage of borderline examinees who would answer each test item correctly. The Hofstee method requires judges to estimate 4 properties of an evaluation's passing scores and failure rates. The panel was asked to repeat their judgments 6 weeks later to assure stability of the MPS. Details about the use of a standard setting exercise to set an MPS for clinical skills examinations have been published previously.14, 20
Evaluation of each resident's skill was recorded on the checklist by 1 of the 2 faculty raters at the pretest and posttest sessions. A random sample of 50% of the pretest sessions was rescored by a third rater with expertise in scoring clinical skills examinations (D.B.W.) to assess interrater reliability. The rescorer was blinded to the results of the first evaluation.
A multiple choice written examination was prepared according to examination development guidelines21 using appropriate reference articles and texts.17, 18, 22 The examination was prepared by 1 author (J.H.B.) and reviewed for accuracy and clarity by 2 others (K.J.O., D.B.W.) and by the director of the medical intensive care unit at NMH. The examination had questions on knowledge and comprehension of the procedure as well as data interpretation and application. It was administered to 9 fourth‐year medical students and 5 pulmonary/critical care fellows to obtain pilot data. Results of the pilot allowed creation of a pretest and a posttest that were equivalent in content and difficulty.23 The Kuder Richardson Formula 20 (KR‐20) reliability coefficients for the 20‐item pretest and the 20‐item posttest were .72 and .74, respectively.
Demographic data were obtained from the participants including age, gender, ethnicity, medical school, and scores on the United States Medical Licensing Examination (USMLE) Steps 1 and 2. Each resident's experience performing the procedure was also collected at pretest.
Primary outcome measures were performance on the posttest written and clinical examinations. Secondary outcome measures were the total training time needed to reach the MPS (minimum = 240 minutes) and a course evaluation questionnaire.
Data Analysis
Checklist score reliability was estimated by calculating interrater reliability, the preferred method for assessments that depend on human judges,24 using the kappa () coefficient25 adjusted using the formula of Brennan and Prediger.26 Within‐group differences from pretest (baseline) to posttest (outcome) were analyzed using paired t tests. Multiple regression analysis was used to assess the correlation of posttest performance on thoracentesis skills with (1) performance on pretest thoracentesis skills, (2) medical knowledge measured by the thoracentesis pretest and posttest and USMLE Steps 1 and 2, (3) clinical experience in performing thoracentesis, (4) clinical self‐confidence about performing thoracentesis, and (5) whether additional training was needed to master the procedure.
RESULTS
All residents consented to participate and completed the entire training protocol. Table 1 presents demographic data about the residents. Most had limited experience performing and supervising thoracenteses.
| Characteristic | PGY‐3 Resident |
|---|---|
| Age (years), mean (SD) | 28.88 (1.57) |
| Male | 23 (57.5%) |
| Female | 17 (42.5%) |
| African American | 1 (2.5%) |
| White | 21 (52.5%) |
| Asian | 14 (35.0%) |
| Other | 4 (10.0%) |
| U.S. medical school graduate | 39 (97.5%) |
| Foreign medical school graduate | 1 (2.5%) |
| Number of thoracentesis procedures | |
| Performed as an intern | |
| 0‐1 | 27.5% |
| 2‐4 | 60.0% |
| 5 | 12.5% |
| Performed as a PGY‐2 and PGY‐3 resident | |
| 0‐1 | 25.0% |
| 2‐4 | 55.0% |
| 5 | 20.0% |
| Supervised others as a PGY‐2 and PGY‐3 resident | |
| 0‐1 | 27.5% |
| 2‐4 | 57.5% |
| 5 | 15.0% |
Interrater reliability for the thoracentesis checklist data was calculated at pretest. Across the 25 checklist items, the mean kappa coefficient was very high (n = .94). The MPS used as the mastery achievement standard was 80% (eg, 20 of 25 checklist items). This was the mean of the Angoff and Hofstee ratings obtained from the first judgment of the expert panel and is displayed in Figure 1.
No resident achieved mastery at pretest. However, 37 of the 40 medicine residents (93%) achieved mastery within the standard 4‐hour thoracentesis curriculum. The remaining 3 residents (7%) needed extra time ranging from 20 to 90 minutes to reach mastery.
Figure 1 is a graphic portrait with descriptive statistics of the residents' pretest and posttest performance on the thoracentesis written and clinical skills exams. For the written exam, the mean score rose from 57.63% to 89.75%, a statistically significant improvement of 56% from pretest to posttest (t[39] = 17.0, P < .0001). The clinical skills exam also showed a highly significant 71% pretest‐to‐posttest gain, as the mean score rose from 51.70% to 88.3% (t[39] = 15.6, P < .0001).
Results from the regression analysis indicate that neither pretest performance, medical knowledge measured by local or USMLE examinations, nor thoracentesis clinical experience was correlated with the posttest measure of thoracentesis clinical skills. However, the need for additional practice to reach the mastery standard on the posttest was a powerful negative predictor of posttest performance: b = .27 (95% CI = .46 to .09; P < .006; r2 = .28). For those residents who required extra practice time, the initial clinical skills posttest score was 20% lower than that of their peers. Although the need for extra deliberate practice was associated with relatively lower initial posttest scores, all residents ultimately met or exceeded the rigorous thoracentesis MPS.
The responses of the 40 residents on a course evaluation questionnaire were uniformly positive. Responses were recorded on a Likert scale where 1 = strongly disagree, 2 = disagree, 3 = uncertain, 4 = agree, and 5 = strongly agree (Table 2). The data show that residents strongly agreed that practice with the medical simulator boosts clinical skills and self‐confidence, that they received useful feedback from the training sessions, and that deliberate practice using the simulator is a valuable educational experience. Residents were uncertain whether practice with the medical simulator has more educational value than patient care.
| Mean | SD | |
|---|---|---|
| Practice with the thoracentesis model boosts my skills to perform this procedure. | 4.3 | 0.8 |
| I receive useful educational feedback from the training sessions. | 4.0 | 0.6 |
| Practice with the thoracentesis model boosts my clinical self‐confidence. | 4.1 | 0.9 |
| Practice with the thoracentesis model has more educational value than patient care experience. | 2.3 | 1.0 |
| The Skills Center staff are competent. | 4.3 | 0.6 |
| Practice sessions in the Skills Center are a good use of my time. | 3.7 | 1.0 |
| Practice sessions using procedural models should be a required component of residency education. | 3.8 | 0.8 |
| Deliberate practice using models is a valuable educational experience. | 4.0 | 0.9 |
| Practice sessions using models are hard work. | 2.1 | 0.7 |
| Increasing the difficulty of simulated clinical problems helps me become a better doctor. | 3.9 | 0.7 |
| The controlled environment in the Skills Center helps me focus on clinical education problems. | 3.9 | 0.8 |
| Practice with the thoracentesis model has helped to prepare me to perform the procedure better than clinical experience alone. | 4.0 | 1.0 |
DISCUSSION
This study demonstrates the use of a mastery learning model to develop the thoracentesis skills of internal medicine residents to a high level. Use of a thoracentesis model in a structured educational program offering an opportunity for deliberate practice with feedback produced large and consistent improvements in residents' skills. An important finding of our study is that despite having completed most of their internal medicine training, residents displayed poor knowledge and clinical skill in thoracentesis procedures at baseline. This is similar to previous studies showing that the procedural skills and knowledge of physicians at all stages of training are often poor. Examples of areas in which significant gaps were found include basic skills such as chest radiography,27 emergency airway management,8 and pulmonary auscultation.28 In contrast, after the mastery learning program, all the residents met or exceeded the MPS for the thoracentesis clinical procedure and scored much higher on the posttest written examination.
Our data also demonstrate that medical knowledge measured by procedure‐specific pretests and posttests and USMLE Steps 1 and 2 scores were not correlated with thoracentesis skill acquisition. This reinforces findings from our previous studies of ACLS skill acquisition10, 11 and supports the difference between professional and academic achievement. Pretest skill performance and clinical experience also were not correlated with posttest outcomes. However, the amount of deliberate practice needed to reach the mastery standard was a powerful negative predictor of posttest thoracentesis skill scores, replicating our research on ACLS.11 We believe that clinical experience was not correlated with posttest outcomes because residents infrequently performed thoracenteses procedures during their training.
This project demonstrates a practical model for outcomes‐based education, certification, and program accreditation. Given the need to move procedural training in internal medicine beyond such historical methods as see one, do one, teach one,29 extension of the mastery model to other invasive procedures deserves further study. At our institution we have been encouraged by the ability of simulation‐based education in ACLS to promote long‐term skill retention30 and improvement in the quality of actual patient care.31 In addition to studying these outcomes for thoracentesis, we plan to incorporate the use of ultrasound when training residents to perform procedures such as thoracentesis and central venous catheter insertion.
Given concerns about the quality of resident preparation to perform invasive procedures, programs such as this should be considered as part of the procedural certification process. As shown by our experience with several classes of residents (n = 158), use of simulation technology to reach high procedural skill levels is effective and feasible in internal medicine residency training. In addition, our residents have consistently enjoyed participating in the simulated training programs. Postcourse questionnaires show that residents agree that deliberate practice with simulation technology complements but does not replace patient care in graduate medical education.5, 10
An important question needing more research is whether performance in a simulated environment transfers to actual clinical settings. Several small studies have demonstrated such a relationship,8, 9, 31, 32 yet the transfer of simulated training to clinical practice requires further study. More work should also be done to assess long‐term retention of skills30 and to determine the utility and benefit of simulation‐based training in procedural certification and credentialing.
This study had several limitations. It was conducted in 1 training program at a single medical center. The sample size (n = 40) was relatively small. The thoracentesis model was used for both education and testing, potentially confounding the events. However, these limitations do not diminish the pronounced impact that the simulation‐based training had on the skills and knowledge of our residents.
In conclusion, this study has demonstrated the ability of deliberate practice using a thoracentesis model to produce high‐level performance of simulated thoracenteses. The project received high ratings from learners and provides reliable assessments of procedural competence. Although internists are performing fewer invasive procedures now than in years past, procedural training is still an important component of internal medicine training.29, 33 Attainment of high procedural skill levels may be especially important for residents who plan to practice hospital medicine. We believe that simulation‐based training using deliberate practice should be a key contributor to future internal medicine residency education, certification, and accreditation.
Acknowledgements
The authors thank Charles Watts, MD, and J. Larry Jameson, MD, PhD, for their support of this work. We recognize and appreciate the Northwestern University internal medicine residents for their dedication to patient care and education.
- ,,,,.Core competencies in hospital medicine: development and methodology.J Hosp Med.2006;1:48–56.
- ,,, et al.Beyond the comfort zone: residents assess their comfort performing inpatient medical procedures.Am J Med.2006;119:71.e17–71.e24.
- ,,.Perception of competency to perform procedures and future practice intent: a national survey of family practice residents.Acad Med.2003;78:926–932.
- ,,,,,.Lower risk and higher yield for thoracentesis when performed by experienced operators.Chest.1993;103:1873–1876.
- ,,, et al.Simulation technology for health care professional skills training and assessment.JAMA.1999;282:861–866.
- ,,, et al.Reliability and validity of a simulation‐based acute care skills assessment for medical students and residents.Anesthesiology.2003;99:1270–1280.
- ,,,.Learning curves and reliability measures for virtual reality simulation in the performance assessment of carotid angiography.J Am Coll Cardiol.2006;47:1796–1802.
- ,,,,.Achieving house staff competence in emergency airway management: results of a teaching program using a computerized patient simulator.Crit Care Med.2004;32:2422–2427.
- ,,.Bronchoscopy simulator effectively prepares junior residents to competently perform basic clinical bronchoscopy.Ann Thorac Surg.2004;78:287–291.
- ,,, et al.Simulation‐based training of internal medicine residents in advanced cardiac life support protocols: a randomized trial.Teach Learn Med.2005;17:210–216.
- ,,, et al.Mastery learning of advanced cardiac life support skills by internal medicine residents using simulation technology and deliberate practice.J Gen Intern Med.2006;21:251–256.
- Block JH, ed.Mastery Learning: Theory and Practice.New York:Holt, Rinehart and Winston;1971.
- ,,,.Competency‐Based Curriculum Development in Medical Education. Public Health Paper No. 68.Geneva, Switzerland:World Health Organization;1978.
- ,,, et al.Comparison of two standard‐setting methods for advanced cardiac life support training.Acad Med.2005;80(10 Suppl):S63–S66.
- ,,.Experimental and Quasi‐Experimental Designs for Generalized Causal Inference.Boston:Houghton Mifflin;2002.
- .Deliberate practice and the acquisition and maintenance of expert performance in medicine and related domains.Acad Med.2004;79(10 Suppl):S70–S81.
- ,,,,.Guidelines for thoracentesis and needle biopsy of the pleura. This position paper of the American Thoracic Society was adopted by the ATS Board of Directors June 1988.Am Rev Resp Dis.1989;140:257–258.
- .Clinical practice. Pleural effusion.N Engl J Med2002;346:1971–1977.
- . The Checklists Development Checklist. Western Michigan University Evaluation Center, July 2000. Available at: http://www.wmich.edu/evalctr/checklists/cdc.htm. Accessed December 15,2005.
- ,,.Procedures for establishing defensible absolute passing scores on performance examinations in health professions education.Teach Learn Med2006;18:50–57.
- ,.Measurement and Assessment in Teaching.8th ed.Upper Saddle River, NJ:Prentice Hall;2000.
- .Pleural Diseases.4th ed.Philadelphia, PA:Lippincott Williams 2000:821–829.
- .Reliability: on the reproducibility of assessment data.Med Educ.2004;38:1006–1012.
- ,,.Statistical Methods for Rates and Proportions.3rd ed.New York:John Wiley 2003.
- ,.Coefficient kappa: some uses, misuses, and alternatives.Educ Psychol Meas.1981;41:687–699.
- ,,,.Competency in chest radiography: a comparison of medical students, residents and fellows.J Gen Intern Med.2006;21:460–465.
- ,.Pulmonary auscultatory skills during training in internal medicine and family practice.Am J Resp Crit Care Med.1999;159:1119–1124.
- ,.What procedures should internists do?Ann Intern Med.2007;146:392–3.
- ,,, et al.A longitudinal study of internal medicine residents' retention of advanced cardiac life support (ACLS) skills.Acad Med.2006;81(10 Suppl):S9–S12.
- ,,,,,.Simulation‐based education improves quality of care during cardiac arrest team responses at an academic teaching hospital: a case‐control study.Chest.2008;[Epub ahead of print].
- ,,, et al.Virtual reality training improves operating room performance: results of a randomized, double‐blinded study.Ann Surg.2002;236:458–464.
- ,.The declining number and variety of procedures done by general internists: a resurvey of members of the American College of Physicians.Ann Intern Med.2007;146:355–360.
Copyright © 2008 Society of Hospital Medicine

Editorial
Why measure hospital quality? One popular premise is that measurement and transparency will inform consumer decision making and drive volume to high‐quality programs, providing incentives for improvement and raising the bar nationally. In this issue of the Journal of Hospital Medicine, Halasyamani and Davis report that there is relatively poor correlation between the Hospital Compare scores of the Centers for Medicare and Medicaid Services (CMS) and U.S. News and World Report's Best Hospitals rankings.1 The authors note that this is not necessarily surprising, as the methodologies of these rating systems are quite different, although their purposes are functionally similar.
Clearly, these 2 popular quality evaluation systems reflect different underlying constructs (which may or may not actually describe quality). And therein lies a central dilemma for health care professionals and academics: we haven't agreed among ourselves on reliable and meaningful quality metrics; so how can we, or even should we, expect the public to use available data to make health care decisions?
The 2 constructs in this particular comparison are certainly divergent in design. For the Hospital Compare ratings, the CMS used detailed process‐of‐care measures, expensively abstracted from the medical record, for just 3 medical conditions: acute myocardial infarction, congestive heart failure, and community‐acquired pneumonia. The U.S. News Best Hospitals rankings used reputation (based on a survey of physicians), severity‐adjusted mortality rate, staffing ratio, and key technologies offered by hospitals. Halasyamani and Davis conclude that consumers may be left to wonder how to reconcile these discordant rating systems. At the same time, they acknowledge that it is not yet clear whether public reporting will affect consumers' health care choices. Available evidence suggests that when making choices about health care, patients are much more likely to consult family and friends than an Internet site that posts quality information.2 There is as yet no conclusive evidence that quality data drive consumer decision making. Furthermore, acute myocardial infarction patients rarely have the opportunity to choose a hospital, even if they had access to the data.
The assessment of hospital quality is not only a challenge for patients, it's still perplexing for those of us immersed in health care. The scope of measures of quality is both broad and incomplete. At the microsystem and individual clinical syndrome level, we have a plethora of process measures that are evidence based (such as the CMS Hospital Compare measures) but appear to move meaningful outcomes only slightly, if at all. The evidence linking the pneumonia measures, for instance, to significant outcomes such as lower mortality or (rarely studied) better functional outcomes is extremely limited or nonexistent.3, 4
At the other end of the continuum are sweeping metrics such as risk‐adjusted in‐hospital mortality, which may be important and yet has 2 significant limitations. First, mortality rates in acute care are generally so low that this is not a useful outcome of interest for most clinical conditions. Its utility is really limited to well‐studied procedures such as cardiac surgery. Second, mortality rate reduction is extraordinarily difficult to link meaningfully to specific process interventions with available information and tools. For high‐volume complex medical conditions, such as pneumonia, nonsurgically‐managed cardiac disease, and oncology, we cannot as yet reliably use in‐hospital mortality rate as a descriptor for quality of care because the populations are so diverse and the statistical tools so crude. The public reporting of these data is even more complex because it often lags behind current data by years and may be significantly affected by sample size.
Even when we settle on a few, well‐defined process metrics, we have problems with complete and accurate reporting of data. In Halasyamani and Davis's study, only 2.9% of hospitals reported all 14 Hospital Compare core performance measures used in their analysis.1 Evidence suggests that poor performance is a strong disincentive to voluntarily report quality measures to the public.5 And because there is no evidence that this type of transparency initiative will drive volume to higher‐quality programs, publicly reporting quality measures may not provide a strong enough incentive for hospitals to allocate resources to the improvement of the quality of care they deliver in these specific areas.
The CMS has introduced financial incentives to encourage hospitals to report performance measures (regardless of the actual level of performance which is reported), providing financial rewards to top‐performing hospitals and/or to hospitals that actually demonstrate that strong performance may have a greater impact. The results of early studies suggested that that pay‐for‐performance did improve the quality of health care.6 Lindenauer et al. recently published the results of a large study evaluating adherence to quality measures in hospitals that voluntarily reported measures compared with those participating in a pay‐for‐performance demonstration project funded by the CMS. Hospitals engaged in both public reporting and pay‐for‐performance achieved modestly greater improvements in quality compared with those that only did public reporting.7 It is notable that this demonstration project generally produced modest financial rewards to those hospitals that improved performance.8 The optimal model to reward performance remains to be determined.7, 9, 10
There are a number of potentially harmful unintended consequences of poorly designed quality measures and associated transparency and incentive programs. The most obvious is opportunity cost. As the incentives become more tangible and meaningful, hospital quality leaders will be expected to step up efforts to improve performance in the specific process of care measures for which they are rewarded. Without caution, however, hospital quality leaders may develop a narrow focus in deciding where to apply their limited resources and may become distracted from other areas in dire need of improvement. Their boards of directors might appropriately argue that it is their fiduciary responsibility to focus on improving those aspects of quality that the payer community has highlighted as most important. If the metrics are excellent and the underlying constructs are in fact the right ones to advance quality in American acute care, this is a direction to be applauded. If the metrics are flawed and limited, which is the case today, then the risk is that resources will be wasted and diverted from more important priorities.
Even worse, an overly narrow focus may have unintended adverse clinical consequences. Recently, Wachter discussed several real‐world examples of unintended consequences of quality improvement efforts, including giving patients multiple doses of pneumococcal vaccines and inappropriately treating patients with symptoms that might indicate community‐acquired pneumonia with antibiotics.11 As hospitals attempt to improve their report cards, a significant risk exists that patients will receive excessive or unnecessary care in an attempt to meet specified timeliness goals.
The most important issue that has still not been completely addressed is whether improvements in process‐of‐care measures will actually improve patient outcomes. In a recent issue of this journal, Seymann concluded that there is strong evidence for influenza vaccination and the use of appropriate antibiotics for community‐acquired pneumonia12 but that other pneumonia quality measures were of less obvious clinical benefit. Controversy continues over whether the optimal timing of the initial treatment of community‐acquired pneumonia with antibiotics is 4 hours, as it currently stands, or 8 hours. Patients hospitalized with pneumonia may be motivated to quit smoking, but CMS requirements for smoking cessation advice/counseling can be satisfied with a simple pamphlet or a video, rather than interventions that involve counseling by specifically trained professionals and the use of pharmacotherapy, which are more likely to succeed. Although smoking cessation is an admirable goal, whether this is performed will not affect the quality of care that a patient with pneumonia receives during the index admission. In fact, it would be more important to counsel all patients about the hazards of smoking in an attempt to prevent pneumonia and acute myocardial infarction as well as a host of other smoking‐related illnesses.
In another example, Fonarow and colleagues examined the association between heart failure clinical outcomes and performance measures in a large observational cohort.13 The study found that current heart failure performance measures, aside from prescribing angiotensin‐converting inhibitor or angiotensin receptor blocker at discharge, had little relationship to mortality in the first 60‐90 days following discharge. On the other hand, the team found that being discharged on a beta blocker was associated with a significant reduction in mortality; however, beta blocker use is not part of the current CMS core measures. In addition, many patients hospitalized for heart failure may benefit from implantable cardioverter‐defibrillator therapy and/or cardiac resynchronization therapy,14 yet referral to a cardiologist to evaluate patients who may be suitable for these therapies is not a CMS core measure.
A similar, more comprehensive study recently evaluated whether performance on CMS quality measures for acute myocardial infarction, heart failure, and pneumonia correlated with condition‐specific inpatient, 30‐day, and 1‐year risk‐adjusted mortality rates.15 The study found that the best hospitals, those performing at the 75th percentile on quality measures, did have lower mortality rates than did hospitals performing at the 25th percentile, but the absolute risk reduction was small. Specifically, the absolute risk reduction for 30‐day mortality was 0.6%, 0.1%, and 0.1% for acute myocardial infarction, heart failure, and pneumonia, respectively. In attempting to explain their findings, the authors noted that current quality measures include only a subset of activities involved in the care of hospitalized patients. In addition, mortality rates are likely influenced by factors not included in current quality measures, such as the use of electronic health records, staffing levels, and other activities of quality oversight committees.
The era of measurement and accountability for providing high‐quality health care is upon us. Public reporting may lead to improvement in quality measures, but it is incumbent on the academic and provider communities as well as the payer community to ensure that the metrics are meaningful, reliable, and reproducible and, equally important, that they make a difference in essential clinical outcomes such as mortality, return to function, and avoidance of adverse events.10 Emerging evidence suggests the measures may need to be linked to meaningful financial incentives to the provider in order to accelerate change. Incentives directed at patients appear to be ineffective, clumsy, and slow to produce results.16
The time is right to revisit the quality measures currently used for transparency and incentives. We need a tighter, more reliable set of metrics that actually correlate with meaningful outcomes. Some evidence‐based measures appear to be missing from the current leading lists and some remain inadequately defined with regard to compliance. As a system, the measurement program contains poorly understood risks of unintended consequences. Above all else, local and national quality leaders need to be mindful that improving patient outcomes must be the central goal in our efforts to improve performance on process‐of‐care measures.
- ,.Conflicting measures of hospital quality: ratings from “Hospital Compare” versus “Best Hospitals.”J Hosp Med.2007;2:128–134.
- Kaiser Family Foundation and Agency for Health Care Research and Quality.National Survey on Consumers' Experiences with Patient Safety and Quality Information.Washington, DC:Kaiser Family Foundation;2004.
- ,, et al.Quality of care, process, and outcomes in elderly patients with pneumonia.JAMA.1997;278:2080–2084.
- ,,,,.Process of care, illness severity, and outcomes in the management of community acquired pneumonia at academic hospitals.Arch Intern Med.2001;161:2099–2104.
- ,,,,.Relationship between low quality‐of‐care scores and HMOs' subsequent public disclosure of quality‐of‐care scores.JAMA.2002;288:1484–1490.
- ,,,,.Does pay‐for‐performance improve the quality of health care?Ann Intern Med.2006;145:265–272.
- ,,, et al.Public Reporting and pay for performance in hospital quality improvement.N Engl J Med.2007;356:486–496.
- The CMS demonstration project methodology provides a 2% incremental payment for the best 10 percent of hospitals and 1% for the second decile. See CMS press release, available at: http://www.cms.hhs.gov/apps/media/. Accessed January 26,2007.
- .Pay for performance and accountability: related themes in improving health care.Ann Intern Med.2006;145:695–699.
- Institute of Medicine Committee on Redesigning Health Insurance Performance Measures, Payment, and Performance Improvement Programs.Rewarding Provider Performance: Aligning Incentives in Medicare (Pathways to Quality Health Care Series).Washington, DC:National Academies Press;2007.
- .Expected and unanticipated consequences of the quality and information technology revolutions.JAMA.2006;295:2780–2783.
- .Community‐acquired pneumonia: defining quality care.J Hosp Med.2006;1:344–353.
- ,,, et al.Association between performance measures and clinical outcomes for patients hospitalized with heart failure.JAMA.2007;297:61–70.
- ,, et al.ACC/AHA 2005 Guideline update for the diagnosis and management of chronic heart failure in the adult: a report of the American College of Cardiology/American Heart Association Task Force on Practice Guidelines.Circulation.2005;112:e154–e235.
- ,.Relationship between Medicare's Hospital Compare performance measures and mortality rates.JAMA.2006;296:2694–2702.
- Employee Benefit Research Institute. 2nd Annual EBRI/Commonwealth Fund Consumerism in Health Care Survey, 2006: early experience with high‐deductible and consumer‐driven health plans. December 2006. Available at: http://www.ebri.org/pdf/briefspdf/EBRI_IB_12‐20061.pdf.. Accessed February 23,2007.
Why measure hospital quality? One popular premise is that measurement and transparency will inform consumer decision making and drive volume to high‐quality programs, providing incentives for improvement and raising the bar nationally. In this issue of the Journal of Hospital Medicine, Halasyamani and Davis report that there is relatively poor correlation between the Hospital Compare scores of the Centers for Medicare and Medicaid Services (CMS) and U.S. News and World Report's Best Hospitals rankings.1 The authors note that this is not necessarily surprising, as the methodologies of these rating systems are quite different, although their purposes are functionally similar.
Clearly, these 2 popular quality evaluation systems reflect different underlying constructs (which may or may not actually describe quality). And therein lies a central dilemma for health care professionals and academics: we haven't agreed among ourselves on reliable and meaningful quality metrics; so how can we, or even should we, expect the public to use available data to make health care decisions?
The 2 constructs in this particular comparison are certainly divergent in design. For the Hospital Compare ratings, the CMS used detailed process‐of‐care measures, expensively abstracted from the medical record, for just 3 medical conditions: acute myocardial infarction, congestive heart failure, and community‐acquired pneumonia. The U.S. News Best Hospitals rankings used reputation (based on a survey of physicians), severity‐adjusted mortality rate, staffing ratio, and key technologies offered by hospitals. Halasyamani and Davis conclude that consumers may be left to wonder how to reconcile these discordant rating systems. At the same time, they acknowledge that it is not yet clear whether public reporting will affect consumers' health care choices. Available evidence suggests that when making choices about health care, patients are much more likely to consult family and friends than an Internet site that posts quality information.2 There is as yet no conclusive evidence that quality data drive consumer decision making. Furthermore, acute myocardial infarction patients rarely have the opportunity to choose a hospital, even if they had access to the data.
The assessment of hospital quality is not only a challenge for patients, it's still perplexing for those of us immersed in health care. The scope of measures of quality is both broad and incomplete. At the microsystem and individual clinical syndrome level, we have a plethora of process measures that are evidence based (such as the CMS Hospital Compare measures) but appear to move meaningful outcomes only slightly, if at all. The evidence linking the pneumonia measures, for instance, to significant outcomes such as lower mortality or (rarely studied) better functional outcomes is extremely limited or nonexistent.3, 4
At the other end of the continuum are sweeping metrics such as risk‐adjusted in‐hospital mortality, which may be important and yet has 2 significant limitations. First, mortality rates in acute care are generally so low that this is not a useful outcome of interest for most clinical conditions. Its utility is really limited to well‐studied procedures such as cardiac surgery. Second, mortality rate reduction is extraordinarily difficult to link meaningfully to specific process interventions with available information and tools. For high‐volume complex medical conditions, such as pneumonia, nonsurgically‐managed cardiac disease, and oncology, we cannot as yet reliably use in‐hospital mortality rate as a descriptor for quality of care because the populations are so diverse and the statistical tools so crude. The public reporting of these data is even more complex because it often lags behind current data by years and may be significantly affected by sample size.
Even when we settle on a few, well‐defined process metrics, we have problems with complete and accurate reporting of data. In Halasyamani and Davis's study, only 2.9% of hospitals reported all 14 Hospital Compare core performance measures used in their analysis.1 Evidence suggests that poor performance is a strong disincentive to voluntarily report quality measures to the public.5 And because there is no evidence that this type of transparency initiative will drive volume to higher‐quality programs, publicly reporting quality measures may not provide a strong enough incentive for hospitals to allocate resources to the improvement of the quality of care they deliver in these specific areas.
The CMS has introduced financial incentives to encourage hospitals to report performance measures (regardless of the actual level of performance which is reported), providing financial rewards to top‐performing hospitals and/or to hospitals that actually demonstrate that strong performance may have a greater impact. The results of early studies suggested that that pay‐for‐performance did improve the quality of health care.6 Lindenauer et al. recently published the results of a large study evaluating adherence to quality measures in hospitals that voluntarily reported measures compared with those participating in a pay‐for‐performance demonstration project funded by the CMS. Hospitals engaged in both public reporting and pay‐for‐performance achieved modestly greater improvements in quality compared with those that only did public reporting.7 It is notable that this demonstration project generally produced modest financial rewards to those hospitals that improved performance.8 The optimal model to reward performance remains to be determined.7, 9, 10
There are a number of potentially harmful unintended consequences of poorly designed quality measures and associated transparency and incentive programs. The most obvious is opportunity cost. As the incentives become more tangible and meaningful, hospital quality leaders will be expected to step up efforts to improve performance in the specific process of care measures for which they are rewarded. Without caution, however, hospital quality leaders may develop a narrow focus in deciding where to apply their limited resources and may become distracted from other areas in dire need of improvement. Their boards of directors might appropriately argue that it is their fiduciary responsibility to focus on improving those aspects of quality that the payer community has highlighted as most important. If the metrics are excellent and the underlying constructs are in fact the right ones to advance quality in American acute care, this is a direction to be applauded. If the metrics are flawed and limited, which is the case today, then the risk is that resources will be wasted and diverted from more important priorities.
Even worse, an overly narrow focus may have unintended adverse clinical consequences. Recently, Wachter discussed several real‐world examples of unintended consequences of quality improvement efforts, including giving patients multiple doses of pneumococcal vaccines and inappropriately treating patients with symptoms that might indicate community‐acquired pneumonia with antibiotics.11 As hospitals attempt to improve their report cards, a significant risk exists that patients will receive excessive or unnecessary care in an attempt to meet specified timeliness goals.
The most important issue that has still not been completely addressed is whether improvements in process‐of‐care measures will actually improve patient outcomes. In a recent issue of this journal, Seymann concluded that there is strong evidence for influenza vaccination and the use of appropriate antibiotics for community‐acquired pneumonia12 but that other pneumonia quality measures were of less obvious clinical benefit. Controversy continues over whether the optimal timing of the initial treatment of community‐acquired pneumonia with antibiotics is 4 hours, as it currently stands, or 8 hours. Patients hospitalized with pneumonia may be motivated to quit smoking, but CMS requirements for smoking cessation advice/counseling can be satisfied with a simple pamphlet or a video, rather than interventions that involve counseling by specifically trained professionals and the use of pharmacotherapy, which are more likely to succeed. Although smoking cessation is an admirable goal, whether this is performed will not affect the quality of care that a patient with pneumonia receives during the index admission. In fact, it would be more important to counsel all patients about the hazards of smoking in an attempt to prevent pneumonia and acute myocardial infarction as well as a host of other smoking‐related illnesses.
In another example, Fonarow and colleagues examined the association between heart failure clinical outcomes and performance measures in a large observational cohort.13 The study found that current heart failure performance measures, aside from prescribing angiotensin‐converting inhibitor or angiotensin receptor blocker at discharge, had little relationship to mortality in the first 60‐90 days following discharge. On the other hand, the team found that being discharged on a beta blocker was associated with a significant reduction in mortality; however, beta blocker use is not part of the current CMS core measures. In addition, many patients hospitalized for heart failure may benefit from implantable cardioverter‐defibrillator therapy and/or cardiac resynchronization therapy,14 yet referral to a cardiologist to evaluate patients who may be suitable for these therapies is not a CMS core measure.
A similar, more comprehensive study recently evaluated whether performance on CMS quality measures for acute myocardial infarction, heart failure, and pneumonia correlated with condition‐specific inpatient, 30‐day, and 1‐year risk‐adjusted mortality rates.15 The study found that the best hospitals, those performing at the 75th percentile on quality measures, did have lower mortality rates than did hospitals performing at the 25th percentile, but the absolute risk reduction was small. Specifically, the absolute risk reduction for 30‐day mortality was 0.6%, 0.1%, and 0.1% for acute myocardial infarction, heart failure, and pneumonia, respectively. In attempting to explain their findings, the authors noted that current quality measures include only a subset of activities involved in the care of hospitalized patients. In addition, mortality rates are likely influenced by factors not included in current quality measures, such as the use of electronic health records, staffing levels, and other activities of quality oversight committees.
The era of measurement and accountability for providing high‐quality health care is upon us. Public reporting may lead to improvement in quality measures, but it is incumbent on the academic and provider communities as well as the payer community to ensure that the metrics are meaningful, reliable, and reproducible and, equally important, that they make a difference in essential clinical outcomes such as mortality, return to function, and avoidance of adverse events.10 Emerging evidence suggests the measures may need to be linked to meaningful financial incentives to the provider in order to accelerate change. Incentives directed at patients appear to be ineffective, clumsy, and slow to produce results.16
The time is right to revisit the quality measures currently used for transparency and incentives. We need a tighter, more reliable set of metrics that actually correlate with meaningful outcomes. Some evidence‐based measures appear to be missing from the current leading lists and some remain inadequately defined with regard to compliance. As a system, the measurement program contains poorly understood risks of unintended consequences. Above all else, local and national quality leaders need to be mindful that improving patient outcomes must be the central goal in our efforts to improve performance on process‐of‐care measures.
- ,.Conflicting measures of hospital quality: ratings from “Hospital Compare” versus “Best Hospitals.”J Hosp Med.2007;2:128–134.
- Kaiser Family Foundation and Agency for Health Care Research and Quality.National Survey on Consumers' Experiences with Patient Safety and Quality Information.Washington, DC:Kaiser Family Foundation;2004.
- ,, et al.Quality of care, process, and outcomes in elderly patients with pneumonia.JAMA.1997;278:2080–2084.
- ,,,,.Process of care, illness severity, and outcomes in the management of community acquired pneumonia at academic hospitals.Arch Intern Med.2001;161:2099–2104.
- ,,,,.Relationship between low quality‐of‐care scores and HMOs' subsequent public disclosure of quality‐of‐care scores.JAMA.2002;288:1484–1490.
- ,,,,.Does pay‐for‐performance improve the quality of health care?Ann Intern Med.2006;145:265–272.
- ,,, et al.Public Reporting and pay for performance in hospital quality improvement.N Engl J Med.2007;356:486–496.
- The CMS demonstration project methodology provides a 2% incremental payment for the best 10 percent of hospitals and 1% for the second decile. See CMS press release, available at: http://www.cms.hhs.gov/apps/media/. Accessed January 26,2007.
- .Pay for performance and accountability: related themes in improving health care.Ann Intern Med.2006;145:695–699.
- Institute of Medicine Committee on Redesigning Health Insurance Performance Measures, Payment, and Performance Improvement Programs.Rewarding Provider Performance: Aligning Incentives in Medicare (Pathways to Quality Health Care Series).Washington, DC:National Academies Press;2007.
- .Expected and unanticipated consequences of the quality and information technology revolutions.JAMA.2006;295:2780–2783.
- .Community‐acquired pneumonia: defining quality care.J Hosp Med.2006;1:344–353.
- ,,, et al.Association between performance measures and clinical outcomes for patients hospitalized with heart failure.JAMA.2007;297:61–70.
- ,, et al.ACC/AHA 2005 Guideline update for the diagnosis and management of chronic heart failure in the adult: a report of the American College of Cardiology/American Heart Association Task Force on Practice Guidelines.Circulation.2005;112:e154–e235.
- ,.Relationship between Medicare's Hospital Compare performance measures and mortality rates.JAMA.2006;296:2694–2702.
- Employee Benefit Research Institute. 2nd Annual EBRI/Commonwealth Fund Consumerism in Health Care Survey, 2006: early experience with high‐deductible and consumer‐driven health plans. December 2006. Available at: http://www.ebri.org/pdf/briefspdf/EBRI_IB_12‐20061.pdf.. Accessed February 23,2007.
Discharge Summary Survey
Twelve percent of patients have been reported to have preventable or ameliorable adverse events in the period immediately following hospital discharge.1, 2 A potential contributor to the number of adverse events is inadequate transfer of clinical information at hospital discharge. The discharge summary is a vital component of the transfer of information from the inpatient to the outpatient setting. Unfortunately, discharge summaries are often unavailable when follow‐up care occurs and often lack important content.36
Many hospitals are implementing an electronic medical record systems. This creates the opportunity at hospital discharge to immediately assemble the major components of a discharge summary. With enhanced communication systems, this information can be delivered in a variety of ways with minimal delay. We report the results and evaluation of a survey of medicine faculty at an urban academic medical center about the timeliness and quality of discharge summaries, the perceived incidence of adverse events related to suboptimal information transfer at discharge, and the need for the electronically generated discharge summary we plan to design.
METHODS
Study Site
The study was conducted at a 753‐bed academic hospital in Chicago, Illinois. Discharge summaries have traditionally been dictated by inpatient physicians and delivered to outpatient physicians by both mail and facsimile via the medical records department. The hospital has used an electronic medical record and computerized physician order entry system (PowerChart Millennium from Cerner Corporation) since August 2004. Although all history and physicals and progress notes were documented in the electronic medical record, the system did not provide a method for delivering the discharge summaries contained in the electronic medical record to outpatient physician offices. Because of this, inpatient physicians continued to dictate discharge summaries during this study.
Participants
An advisory board consisting of 16 physicians from the Department of Medicine was convened. The advisory board gave input on needs assessment and helped to create a survey to be administered to all 425 medicine faculty who have an outpatient practice. All respondents who had at least 1 patient admitted to the hospital within the 6 months prior to the survey were eligible.
Survey Content
Our survey consisted of 2 parts. In the first part, we asked respondents to estimate how many of their patients had been discharged from the hospital in the past 6 months and to reflect on these patients as they completed the survey. Satisfaction with the timeliness and quality of discharge summaries was assessed using a 5‐point Likert scale, from 5, very satisfied, to 1, very unsatisfied. The frequency of hospital follow‐up of a patient occurring prior to arrival of the discharge summary was assessed as the percentage of times this occurred in 20% increments (0%‐19%, 20%‐39%, 40%‐59%, 60%‐79%, and 80%‐100%). The number of discharge summaries missing critical information and the number of summaries containing unnecessary information were similarly assessed using 20% increments. We then asked respondents to estimate the number of patients who had sustained a preventable adverse event related to suboptimal transfer of information at discharge. We defined a preventable adverse event as a preventable medical problem or worsening of an existing problem.
In the second part of the survey, we elicited preferences for discharge summary content and method of delivery. We assessed preferences for discharge summary content by asking respondents to rank items on a scale from 1 to 10, from 10, most important, to 1, least important. Preferences for delivery of discharge summaries were assessed by asking respondents to indicate one or more delivery methods, including facsimile, mail, the electronic medical record, and E‐mail.
Survey Process
The survey was sent out in March 2005. A postcard reminder was sent out approximately 2 weeks after the initial survey was mailed. A second survey was sent to nonresponders 6 weeks after the initial survey. Simultaneously, the survey was also sent in Web‐based format to nonresponders via email.
Data Analysis
Physician characteristics, including practice type, faculty appointment type, and year of medical school graduation, were provided by the hospital's medical staff office. Physician respondents and nonrespondents were compared using the chi‐square test and logistic regression to determine potential response biases. We calculated means and standard deviations and percentages for categorical variables. Logistic regression was used to examine the likelihood of participants reporting any preventable adverse event related to suboptimal transfer of information. The regression model tested the likelihood of one or more preventable adverse events reported with the frequency of seeing patients for follow‐up prior to the arrival of discharge summaries, controlling for participant characteristics and the number of hospitalized patients each physician had in the previous 6 months.
RESULTS
Physician Characteristics
The survey was sent to 425 physicians, 9 of whom were excluded because they had had no patients admitted within the past 6 months. Of the 416 eligible respondents, 2 returned a survey that was incomplete and not usable, and 226 returned a completed survey (response rate of 54%). The characteristics of responders and nonresponders are shown in Table 1. General medicine physicians completed the survey more often than specialist physicians (56% vs. 44%, P < .001). Affiliated faculty were also more likely to complete the survey than full‐time faculty; multivariate logistic regression revealed this was purely a function of the larger number of specialists among the full‐time faculty.
| Responders (N = 226) | Nonresponders (N = 188) | P value | |
|---|---|---|---|
| |||
| Practice type | |||
| Generalist, N (%) | 127 (56.2) | 65 (34.6) | < .001 |
| Specialist, N (%) | 99 (43.8) | 123 (65.4) | |
| Faculty appointment | |||
| Full‐time, N (%) | 104 (46.0 | 106 (56.4) | .04 |
| Affiliated, N (%) | 122 (54.0) | 82 (43.6) | |
| Year of medical school graduation | |||
| Before 1990, N (%) | 131 (58.0) | 127 (67.6) | .04 |
| 1990 or later, N (%) | 95 (42.0) | 61 (32.4) | |
| Number of patients hospitalized in last 6 monthsa | |||
| 1‐4, N (%) | 15 (7.9) | ||
| 5‐10, N (%) | 62 (32.5) | ||
| 11‐19, N (%) | 35 (18.3) | ||
| 20 or more, N (%) | 79 (41.4) | ||
Timeliness and Content
Only 19% of the participants were satisfied or very satisfied with the timeliness of discharge summaries. Among all participants, 33% indicated that 60% or more of their patients were seen for their follow‐up outpatient visit prior to the arrival of the discharge summary, and 22% indicated that for 60% or more of their patients they never received a discharge summary at all.
Only 32% of the participants were satisfied or very satisfied with the quality of discharge summaries. Among all participants, 17% believed that 60% or more of discharge summaries missed critical information. Unnecessary information in the discharge summary was less problematic; only 9% of participants indicated that 60% or more of discharge summaries contained unnecessary information.
Preventable Adverse Events
Overall, 41% of participants believed that in the previous 6 months at least one of their patients had sustained a preventable adverse event related to poor transfer of information at hospital discharge. Reporting one or more preventable adverse events was positively associated with physicians' reports of how often they saw patients for a first postdischarge follow‐up without having a discharge summary available. After adjusting for participant characteristics and the number of patients hospitalized by each physician, logistic regression results indicated that each 20% increase in the frequency of discharge summaries not arriving prior to patient follow‐up appointments was associated with a 28% increase in the odds of a reported preventable adverse event (adjusted OR = 1.28, P = .04).
Preferences for Content and Delivery
The mean rating for importance of discharge summary elements is shown in Table 2. No discharge summary element had a mean rating of less than 5. Participants preferred discharge summaries be delivered via the following methods: facsimile, 48%; mail, 30%; electronic medical record, 41%; and E‐mail, 30%.
| Mean rating (scale of 1‐10) | |
|---|---|
| Medications at discharge | 9.69 |
| Follow‐up issues | 9.09 |
| Discharge diagnosis | 9.02 |
| List of procedures performed | 8.79 |
| Pathology reports | 8.78 |
| Pending test results | 8.68 |
| Procedure reports | 8.16 |
| Stress test reports | 8.07 |
| Dates of admission and discharge | 8.01 |
| Problem list | 7.99 |
| List of radiology tests performed | 7.84 |
| Echocardiogram reports | 7.79 |
| Follow‐up appointments | 7.79 |
| Radiology reports | 7.76 |
| Names of consulting attendings | 7.64 |
| Name of inpatient attending | 7.28 |
| Labs from last hospital day | 7.08 |
| Medications at admission | 6.91 |
| Allergies | 6.56 |
| All lab results | 6.22 |
| Code status | 6.09 |
| Names of inpatient house officers | 5.64 |
DISCUSSION
Our study found that outpatient physicians were not satisfied with the timeliness or the quality of current discharge summaries. Our findings are in agreement with previous studies demonstrating that discharge summaries were often not available to outpatient physicians3,4 and were often of poor quality.5, 6
Preventable or ameliorable adverse events have been reported to occur in 12% of patients in the period immediately following hospital discharge.1, 2 No studies have evaluated the relationship between discharge summaries and preventable adverse events following discharge. Our study found that 41% of outpatient physicians believed that at least one of their patients in the 6 months prior to the survey had sustained a preventable adverse event related to the suboptimal transfer of information at hospital discharge. In addition, the likelihood of physicians reporting one or more preventable adverse events increased with the frequency of seeing patients for follow‐up prior to discharge summary arrival.
In preparation for revising the discharge summary, we asked outpatient physicians to rate the importance of discharge summary content and their preference for method of delivery of discharge summaries. As in previous studies, the outpatient physicians rated discharge medications, discharge diagnosis, test results, and follow‐up plans as highly important.7, 8 Much of this clinical data is now available in the electronic medical record. Therefore, it is possible to electronically assemble much, if not all, of discharge summary content. One recent study demonstrated that database‐generated discharge summaries significantly increased the likelihood that a discharge summary was generated within 4 weeks of hospital discharge.9 The database used in that study required manual data input from a handwritten form. To our knowledge, no study has reported the experience of discharge summaries generated from an electronic medical record.
Our study had several limitations. First, our study used physician survey to assess the timeliness of receiving discharge summaries. Measuring the time to actual receipt of discharge summaries by physicians was beyond the scope of our study. Second, our study did not measure adverse events directly. Instead, we asked outpatient physicians to estimate how many of their patients discharged in the last 6 months had sustained a preventable adverse event related to suboptimal information transfer at discharge. We had limited space in the questionnaire to define the meaning of a preventable adverse event; therefore, the description in the survey does not exactly match previous definitions.1, 2 Our study had a response rate of 54%. It is possible that nonresponders may have been more satisfied with the quality and timeliness of discharge summaries and may have believed fewer patients experienced preventable adverse events related to suboptimal information transfer at discharge.
The results of our study suggest that the use of systems to improve the quality and delivery of discharge summaries has the potential to improve outpatient physician satisfaction and to reduce the number of preventable adverse events that occur during the vulnerable period following hospital discharge. With the use of electronic medical records, we now have the potential to automate the process of assembling and delivering clinical information with minimal delay. We are now using the information from this study to design a partially automated, high‐quality discharge summary that can be delivered to outpatient physicians immediately on discharge.
- ,,, et al.Adverse events among medical patient after hospital discharge.CMAJ.2004;170:345–349.
- ,,,,.The incidence and severity of adverse events affecting patients after discharge from the hospital.Ann Intern Med.2003;138:161–167.
- ,,.Dissemination of discharge summaries. Not reaching follow‐up physicians.Can Fam Physician.2002;48:737–742.
- ,,,.Effect of discharge summary availability during post‐discharge visits on hospital readmission.J Gen Intern Med.2002;17:186–192.
- ,,,.General practitioner‐hospital communications: a review of discharge summaries.J Qual Clin Pract.2001;21:104–108.
- ,,,,.Quality assessment of discharge letters in a French university hospital.Int J Health Care Qual Assur.1998;11:90–95.
- ,,.Content of a discharge summary from a medical ward: views of general practitioners and hospital doctors.J R Coll Physicians Lond.1995;29:307–310.
- ,.What is necessary for high‐quality discharge summaries?Am J Med Qual.1999;14:160–169.
- ,,,.Dictated versus database‐generated discharge summaries: a randomized clinical trial.CMAJ.1999;160:319–326.
Twelve percent of patients have been reported to have preventable or ameliorable adverse events in the period immediately following hospital discharge.1, 2 A potential contributor to the number of adverse events is inadequate transfer of clinical information at hospital discharge. The discharge summary is a vital component of the transfer of information from the inpatient to the outpatient setting. Unfortunately, discharge summaries are often unavailable when follow‐up care occurs and often lack important content.36
Many hospitals are implementing an electronic medical record systems. This creates the opportunity at hospital discharge to immediately assemble the major components of a discharge summary. With enhanced communication systems, this information can be delivered in a variety of ways with minimal delay. We report the results and evaluation of a survey of medicine faculty at an urban academic medical center about the timeliness and quality of discharge summaries, the perceived incidence of adverse events related to suboptimal information transfer at discharge, and the need for the electronically generated discharge summary we plan to design.
METHODS
Study Site
The study was conducted at a 753‐bed academic hospital in Chicago, Illinois. Discharge summaries have traditionally been dictated by inpatient physicians and delivered to outpatient physicians by both mail and facsimile via the medical records department. The hospital has used an electronic medical record and computerized physician order entry system (PowerChart Millennium from Cerner Corporation) since August 2004. Although all history and physicals and progress notes were documented in the electronic medical record, the system did not provide a method for delivering the discharge summaries contained in the electronic medical record to outpatient physician offices. Because of this, inpatient physicians continued to dictate discharge summaries during this study.
Participants
An advisory board consisting of 16 physicians from the Department of Medicine was convened. The advisory board gave input on needs assessment and helped to create a survey to be administered to all 425 medicine faculty who have an outpatient practice. All respondents who had at least 1 patient admitted to the hospital within the 6 months prior to the survey were eligible.
Survey Content
Our survey consisted of 2 parts. In the first part, we asked respondents to estimate how many of their patients had been discharged from the hospital in the past 6 months and to reflect on these patients as they completed the survey. Satisfaction with the timeliness and quality of discharge summaries was assessed using a 5‐point Likert scale, from 5, very satisfied, to 1, very unsatisfied. The frequency of hospital follow‐up of a patient occurring prior to arrival of the discharge summary was assessed as the percentage of times this occurred in 20% increments (0%‐19%, 20%‐39%, 40%‐59%, 60%‐79%, and 80%‐100%). The number of discharge summaries missing critical information and the number of summaries containing unnecessary information were similarly assessed using 20% increments. We then asked respondents to estimate the number of patients who had sustained a preventable adverse event related to suboptimal transfer of information at discharge. We defined a preventable adverse event as a preventable medical problem or worsening of an existing problem.
In the second part of the survey, we elicited preferences for discharge summary content and method of delivery. We assessed preferences for discharge summary content by asking respondents to rank items on a scale from 1 to 10, from 10, most important, to 1, least important. Preferences for delivery of discharge summaries were assessed by asking respondents to indicate one or more delivery methods, including facsimile, mail, the electronic medical record, and E‐mail.
Survey Process
The survey was sent out in March 2005. A postcard reminder was sent out approximately 2 weeks after the initial survey was mailed. A second survey was sent to nonresponders 6 weeks after the initial survey. Simultaneously, the survey was also sent in Web‐based format to nonresponders via email.
Data Analysis
Physician characteristics, including practice type, faculty appointment type, and year of medical school graduation, were provided by the hospital's medical staff office. Physician respondents and nonrespondents were compared using the chi‐square test and logistic regression to determine potential response biases. We calculated means and standard deviations and percentages for categorical variables. Logistic regression was used to examine the likelihood of participants reporting any preventable adverse event related to suboptimal transfer of information. The regression model tested the likelihood of one or more preventable adverse events reported with the frequency of seeing patients for follow‐up prior to the arrival of discharge summaries, controlling for participant characteristics and the number of hospitalized patients each physician had in the previous 6 months.
RESULTS
Physician Characteristics
The survey was sent to 425 physicians, 9 of whom were excluded because they had had no patients admitted within the past 6 months. Of the 416 eligible respondents, 2 returned a survey that was incomplete and not usable, and 226 returned a completed survey (response rate of 54%). The characteristics of responders and nonresponders are shown in Table 1. General medicine physicians completed the survey more often than specialist physicians (56% vs. 44%, P < .001). Affiliated faculty were also more likely to complete the survey than full‐time faculty; multivariate logistic regression revealed this was purely a function of the larger number of specialists among the full‐time faculty.
| Responders (N = 226) | Nonresponders (N = 188) | P value | |
|---|---|---|---|
| |||
| Practice type | |||
| Generalist, N (%) | 127 (56.2) | 65 (34.6) | < .001 |
| Specialist, N (%) | 99 (43.8) | 123 (65.4) | |
| Faculty appointment | |||
| Full‐time, N (%) | 104 (46.0 | 106 (56.4) | .04 |
| Affiliated, N (%) | 122 (54.0) | 82 (43.6) | |
| Year of medical school graduation | |||
| Before 1990, N (%) | 131 (58.0) | 127 (67.6) | .04 |
| 1990 or later, N (%) | 95 (42.0) | 61 (32.4) | |
| Number of patients hospitalized in last 6 monthsa | |||
| 1‐4, N (%) | 15 (7.9) | ||
| 5‐10, N (%) | 62 (32.5) | ||
| 11‐19, N (%) | 35 (18.3) | ||
| 20 or more, N (%) | 79 (41.4) | ||
Timeliness and Content
Only 19% of the participants were satisfied or very satisfied with the timeliness of discharge summaries. Among all participants, 33% indicated that 60% or more of their patients were seen for their follow‐up outpatient visit prior to the arrival of the discharge summary, and 22% indicated that for 60% or more of their patients they never received a discharge summary at all.
Only 32% of the participants were satisfied or very satisfied with the quality of discharge summaries. Among all participants, 17% believed that 60% or more of discharge summaries missed critical information. Unnecessary information in the discharge summary was less problematic; only 9% of participants indicated that 60% or more of discharge summaries contained unnecessary information.
Preventable Adverse Events
Overall, 41% of participants believed that in the previous 6 months at least one of their patients had sustained a preventable adverse event related to poor transfer of information at hospital discharge. Reporting one or more preventable adverse events was positively associated with physicians' reports of how often they saw patients for a first postdischarge follow‐up without having a discharge summary available. After adjusting for participant characteristics and the number of patients hospitalized by each physician, logistic regression results indicated that each 20% increase in the frequency of discharge summaries not arriving prior to patient follow‐up appointments was associated with a 28% increase in the odds of a reported preventable adverse event (adjusted OR = 1.28, P = .04).
Preferences for Content and Delivery
The mean rating for importance of discharge summary elements is shown in Table 2. No discharge summary element had a mean rating of less than 5. Participants preferred discharge summaries be delivered via the following methods: facsimile, 48%; mail, 30%; electronic medical record, 41%; and E‐mail, 30%.
| Mean rating (scale of 1‐10) | |
|---|---|
| Medications at discharge | 9.69 |
| Follow‐up issues | 9.09 |
| Discharge diagnosis | 9.02 |
| List of procedures performed | 8.79 |
| Pathology reports | 8.78 |
| Pending test results | 8.68 |
| Procedure reports | 8.16 |
| Stress test reports | 8.07 |
| Dates of admission and discharge | 8.01 |
| Problem list | 7.99 |
| List of radiology tests performed | 7.84 |
| Echocardiogram reports | 7.79 |
| Follow‐up appointments | 7.79 |
| Radiology reports | 7.76 |
| Names of consulting attendings | 7.64 |
| Name of inpatient attending | 7.28 |
| Labs from last hospital day | 7.08 |
| Medications at admission | 6.91 |
| Allergies | 6.56 |
| All lab results | 6.22 |
| Code status | 6.09 |
| Names of inpatient house officers | 5.64 |
DISCUSSION
Our study found that outpatient physicians were not satisfied with the timeliness or the quality of current discharge summaries. Our findings are in agreement with previous studies demonstrating that discharge summaries were often not available to outpatient physicians3,4 and were often of poor quality.5, 6
Preventable or ameliorable adverse events have been reported to occur in 12% of patients in the period immediately following hospital discharge.1, 2 No studies have evaluated the relationship between discharge summaries and preventable adverse events following discharge. Our study found that 41% of outpatient physicians believed that at least one of their patients in the 6 months prior to the survey had sustained a preventable adverse event related to the suboptimal transfer of information at hospital discharge. In addition, the likelihood of physicians reporting one or more preventable adverse events increased with the frequency of seeing patients for follow‐up prior to discharge summary arrival.
In preparation for revising the discharge summary, we asked outpatient physicians to rate the importance of discharge summary content and their preference for method of delivery of discharge summaries. As in previous studies, the outpatient physicians rated discharge medications, discharge diagnosis, test results, and follow‐up plans as highly important.7, 8 Much of this clinical data is now available in the electronic medical record. Therefore, it is possible to electronically assemble much, if not all, of discharge summary content. One recent study demonstrated that database‐generated discharge summaries significantly increased the likelihood that a discharge summary was generated within 4 weeks of hospital discharge.9 The database used in that study required manual data input from a handwritten form. To our knowledge, no study has reported the experience of discharge summaries generated from an electronic medical record.
Our study had several limitations. First, our study used physician survey to assess the timeliness of receiving discharge summaries. Measuring the time to actual receipt of discharge summaries by physicians was beyond the scope of our study. Second, our study did not measure adverse events directly. Instead, we asked outpatient physicians to estimate how many of their patients discharged in the last 6 months had sustained a preventable adverse event related to suboptimal information transfer at discharge. We had limited space in the questionnaire to define the meaning of a preventable adverse event; therefore, the description in the survey does not exactly match previous definitions.1, 2 Our study had a response rate of 54%. It is possible that nonresponders may have been more satisfied with the quality and timeliness of discharge summaries and may have believed fewer patients experienced preventable adverse events related to suboptimal information transfer at discharge.
The results of our study suggest that the use of systems to improve the quality and delivery of discharge summaries has the potential to improve outpatient physician satisfaction and to reduce the number of preventable adverse events that occur during the vulnerable period following hospital discharge. With the use of electronic medical records, we now have the potential to automate the process of assembling and delivering clinical information with minimal delay. We are now using the information from this study to design a partially automated, high‐quality discharge summary that can be delivered to outpatient physicians immediately on discharge.
- ,,, et al.Adverse events among medical patient after hospital discharge.CMAJ.2004;170:345–349.
- ,,,,.The incidence and severity of adverse events affecting patients after discharge from the hospital.Ann Intern Med.2003;138:161–167.
- ,,.Dissemination of discharge summaries. Not reaching follow‐up physicians.Can Fam Physician.2002;48:737–742.
- ,,,.Effect of discharge summary availability during post‐discharge visits on hospital readmission.J Gen Intern Med.2002;17:186–192.
- ,,,.General practitioner‐hospital communications: a review of discharge summaries.J Qual Clin Pract.2001;21:104–108.
- ,,,,.Quality assessment of discharge letters in a French university hospital.Int J Health Care Qual Assur.1998;11:90–95.
- ,,.Content of a discharge summary from a medical ward: views of general practitioners and hospital doctors.J R Coll Physicians Lond.1995;29:307–310.
- ,.What is necessary for high‐quality discharge summaries?Am J Med Qual.1999;14:160–169.
- ,,,.Dictated versus database‐generated discharge summaries: a randomized clinical trial.CMAJ.1999;160:319–326.
Hospitalist Time‐Motion
The hospitalist model of care has experienced dramatic growth. In 2003 it was estimated that there were 8000 US hospitalists, a number projected to ultimately reach more than 19 000.1, 2 This rapid growth has largely been driven by improvements in clinical efficiency as a result of hospitalist programs. There is a substantial body of evidence showing that hospitalists reduce length of stay and inpatient costs.3 Despite the rapid growth and proven benefit to clinical efficiency, no studies have evaluated the type and frequency of activities that hospitalists perform during routine work. Although the use of hospitalists improves clinical efficiency for the hospital, relatively little is known about how the hospital can improve efficiency for the hospitalist.
Our institution greatly expanded our hospitalist program in June 2003 to create a resident‐uncovered hospitalist service. The impetus for this change was the need to comply with newly revised Accreditation Council for Graduate Medicine Education (ACGME) program requirements regarding resident duty hours. Many teaching hospitals have implemented similar resident‐uncovered hospitalist services.4 Inefficiencies in their work activities quickly became apparent to our hospitalists. Furthermore, our hospitalists believed that they frequently performed simultaneous activities and that they were excessively interrupted by pages.
To evaluate the type and frequency of activities that the hospitalists performed during routine work, we performed a time‐motion study of hospitalist physicians on the resident‐uncovered hospitalist service. Our goal was to identify areas for systems improvements and activities that were better suited for nonphysician providers and to quantify the time spent multitasking and the frequency of paging interruptions.
METHODS
Northwestern Memorial Hospital (NMH) is a 753‐bed hospital in Chicago, Illinois. NMH is the primary teaching hospital affiliated with the Feinberg School of Medicine of Northwestern University. There are 2 general medicine services at NMH: a traditional resident‐covered ward service and the resident‐uncovered hospitalist service. Patients are admitted to one of these 2 services on the basis of, in order of importance, capacity of the services, preference of the outpatient physician, and potential educational value of the admission. Patients admitted to the hospitalist service are preferentially given beds on specific wards intended for hospitalist service patients. Fourth‐year medical students are frequently paired with hospitalists during their medicine subinternship.
The resident‐uncovered hospitalist service comprises 5 daytime hospitalists on duty at a time. The hospitalists are on service for 7 consecutive days, usually followed by 7 consecutive days off. Hospitalists pick up new patients from the night float hospitalist each morning. Daytime admitting duties rotate on a daily basis. One hospitalist accepts new admissions each morning from 7:00 AM until noon. Two hospitalists accept admissions from noon until 5:00 PM. One hospitalist accepts admissions from 5:00 PM until 9:00 PM. One hospitalist is free from accepting new admissions each day. All daytime hospitalists begin the workday at 7:00 AM and leave when their duties are completed for the day. One night float hospitalist is on duty each night of the week. The night float hospitalist performs admissions and all cross cover activities from 7:00 PM until 7:00 AM.
We first conducted a pilot study to help identify specific activities that our hospitalists routinely perform. Broad categories and subcategories of activities were created based on the results of our pilot study, and a published time‐motion study performed on emergency medicine physicians5 (Table 1). Once activities were defined and codes established, our research assistant unobtrusively shadowed hospitalist physicians for periods lasting 3‐5 hours. The observation periods were distributed in order to sample all activities that a daytime hospitalist would perform throughout a typical week. Observation periods included 2 morning admitting periods, 4 morning nonadmitting periods, 4 afternoon admitting periods, 4 afternoon nonadmitting periods, and 2 admitting periods from 5:00 PM to 9:00 PM. Activities were recorded on a standardized data collection form in 1‐minute intervals. When multiple activities were performed at the same time, all activities were recorded in the same 1‐minute interval. Incoming pages were recorded as well. To minimize the possibility that observation would affect hospitalist behavior, the research assistant was instructed not to initiate conversation with the hospitalists.
| Direct patient care |
| Taking initial history and physical exam |
| Seeing patient in follow‐up visit |
| Going over discharge instructions |
| Family meetings |
| Indirect patient care |
| Reviewing test results and medical records |
| Documentation |
| Documenting history and physical, daily notes, filling out discharge instructions, writing out prescriptions |
| Communication |
| Taking report from night float, taking admission report, face‐to‐face discussion, initiating and returning pages |
| Orders |
| Writing/emnputting orders, calling radiology |
| Professional development |
| Going to conferences, grand rounds, etc |
| Reading articles, textbooks, online references |
| Education |
| Teaching during work rounds |
| Didactic sessions with subintern |
| Travel |
| Walking, taking elevator, etc |
| Personal |
| Lunch, washroom break, etc. |
The data collection forms were manually abstracted and minutes tallied for each category and subcategory, for which summary statistics were converted to percentage of total minutes.
RESULTS
Ten hospitalists were shadowed by a single research assistant for a total of 4467 minutes. Seven hospitalists were male and 3 were female. The hospitalists were a mean age of 31 1.6 years of age and had been practicing as a hospitalist for a mean of 2.1 1.0 years. The hospitalists saw an average of 9.4 4.0 patients on the days they were shadowed by the research assistant. Because simultaneous activities were recorded, a total of 5557 minutes of activities were recorded.
The distribution of total minutes recorded in each activity category is shown in Figure 1. Hospitalists spent 18% of their time doing direct patient care, 69% on indirect patient care, 4% on personal activities, and 3% each on professional development, education, and travel.
Of the time hospitalists directly cared for patients, 18% was spent obtaining histories and performing physical examinations on new patients, 53% seeing patients in follow‐up visits, 16% going over discharge instructions, and 13% in family meetings (Figure 2). Of the time hospitalists spent doing indirect patient care, 37% was taken up by documentation, 21% by reviewing results, 7% by orders, and 35% by communication (Figure 2).
As just explained, communication accounted for 35% of indirect patient care activities; it also accounted for 24% of the total activity minutes. The time spent by hospitalists on communication was further broken down as 23% paging other physicians, 31% returning pages, 34% in face‐to‐face communication, 5% taking report on new admissions, 4% on sign‐out to the night float hospitalist, and 3% receiving sign‐out from the night float hospitalist.
Multitasking, performing more than 1 activity at the same time, was done 21% of the time. Hospitalists received an average of 3.4 1.5 pages per hour, and 7% of total activity time was spent returning pages. Other forms of interruption were not evaluated.
DISCUSSION
Our study had several important findings. First, hospitalists spent most of their time on indirect patient care activities and relatively little time on direct patient care. Time‐motion studies of nonhospitalist physicians have reported similar findings.5, 6 A considerable amount of hospitalist time was spent on documentation. This finding also has been reported in studies of nonhospitalist physicians.5, 7
A unique finding in our study was the large amount of time, 24% of total minutes, spent on communication. A study of emergency medicine physicians by Hollingsworth found that 13% of their time was spent on communication activities.5 The large amount of time spent on communication in our study underscores the need for hospitalists to have outstanding communication skills and systems that support efficient communication. Hospitalists spent 6% of their total time paging other physicians and 7% returning pages. Improvements in the efficiency of paging communication could greatly reduce the amount of time communicating by page. Our paging system provides unidirectional alphanumeric paging. In an effort to improve the efficiency of paging, we have asked nurses and consultants to include FYI and callback in the text of the page so it is clear whether the person who has paged the hospitalist needs to be called back. This simple solution to help reduce the number of unnecessary callbacks has previously been proposed by others.8
Another part of solving this problem is adopting the use of 2‐way pagers instead of alphanumeric pagers. Two‐way paging can increase the efficiency of communication even further. For example, a nurse sends a hospitalist a page that asks if the previous diet orders for a patient just returned from a procedure can be resumed. This hospitalist is on another floor in another patient's room. Rather than spending time leaving the other patient's room, finding a phone, calling the floor, waiting for an answer, and then waiting on hold, the hospitalist simply texts a 1‐word answer, Yes, in the 2‐way paging system. In addition to the time occupied by paging activities, hospitalists spent a large amount of time in face‐to‐face communication (8% of total activity time). On the one hand, having hospitalists discuss patient care with consultants and nurses in person on an ongoing basis throughout the day may improve clinical efficiency. On the other hand, the constant potential for interruption may be problematic. Similarly, 2‐way paging could facilitate communication to such a degree that it could actually increase the frequency of interruptions. Research on improvements in communications systems, interventions to improve communication skills, and team‐based care is warranted in order to evaluate the impact on hospitalist workflow.
An important finding in our study was that multitasking and paging interruptions were common. Although this may come as no surprise to practicing hospitalists, the distraction caused by interruptions and multitasking is an important potential cause of medical errors.911 A thorough examination of the types of activities performed simultaneously and whether they contributed to medical error was beyond the scope of our study. Some activities, such as documenting a note on a patient while reviewing the patient's lab results, are concordant (ie, conducted for the same patient) and therefore may be unlikely to contribute to medical error. Other combinations of activities, such as returning a page about one patient while documenting a note on a different patient or having face‐to‐face communication about one patient while entering an order on another patient, are discordant. Discordant activities may contribute to medical error. Further research of the effect of hospitalist multitasking and interruption on medical error is warranted and should be conducted within the framework of concordant versus discordant activities.
We had hoped to find activities that could be performed by non‐physician providers. No high impact activities were discovered that would be better suited for a non‐physician provider in this study. Clerical tasks, such as calling for radiology orders or obtaining medical records, amounted to a small percentage of hospitalist time (less than 1% combined). We did identify several activities in which automation or process improvement would be helpful. Hospitalists spent 5% of time on the combined activity of documenting discharge instructions and writing out prescriptions. Our institution is in the process of implementing an electronic medical record and computerized physician order entry. We are currently working on an automated process to generate printed discharge instructions and prescriptions. This has the potential not only to improve efficiency, but also to eliminate medication errors, as care is transitioned to the outpatient setting.
Our study had several limitations. First, our findings reflect the experience at one institution. Hospitalist practices vary widely in their staffing and scheduling models as well as in their organizational support. The amount of time that hospitalists spend on activities may differ between practices and between individual hospitalists in the same practice. Another limitation to our study pertains to the workflow of our hospitalists and the locations of their patients. As discussed earlier, patients were assigned to a hospitalist according to time of admission, not location of admission. Because of this, the hospitalists were caring for patients on as many as 5 wards. Although travel time amounted to only 3% of total minutes, it is possible that communication time could have been reduced if patients were distributed to hospitalists on the basis of patient location rather than time of admission of patient. For example, physicians and nurses might spend less time communicating in person compared to communicating via unidirectional paging, which frequently requires waiting for a callback. Finally, our study only observed activities performed by the daytime hospitalists at our hospital. The distribution and types of activities performed by nighttime hospitalists may be somewhat different.
Our study may serve as a model for hospitalist time‐motion studies in other settings. Our findings are of particular importance to resident‐uncovered hospitalist programs in academic hospitals, a setting in which operational inefficiencies may be abundant as house staff members have been poorly positioned in the hospital organization to lobby for process change. We hope that our study is a precursor to research evaluating modifications to the environments and systems in which hospitalists work. Such modifications have the potential to improve productivity and work conditions and promote career satisfaction.
Acknowledgements
We thank Patricia Georgas for shadowing the hospitalists and collecting the data in this study.
- Society of Hospital Medicine. Available at http://www.hospitalmedicine.org/AM/Template.cfm?Section=FAQs106:441–445.
- ,.The hospitalist movement 5 years later.JAMA.2002;287:487–494.
- ,.Hospitalists in teaching hospitals: opportunities but not without danger.J Gen Intern Med.2004;4:392–393.
- ,,,,.How do physicians and nurses spend their time in the Emergency Department?Ann Emerg Med.1998;31:97–91.
- ,,,,.A time‐motion study of the activities of attending physicians in an Internal Medicine and Internal Medicine‐Pediatrics resident continuity clinic.Acad Med.2000;75:1138–1143.
- ,,,.Work interrupted: a comparison of workplace interruptions in emergency departments and primary care offices.Ann Emerg Med.2001;38:146–151.
- ,.Residents' suggestions for reducing errors in teaching hospitals.N Engl J Med.2003;348:851–855.
- ,,,.Emergency department workplace interruptions: are emergency physicians “interrupt‐driven” and “multitasking”?Acad Emerg Med.2000;7:1239–243.
- ,,.Understanding medical error and improving patient safety in the inpatient setting.Med Clin N Am.2002;86:847–867.
- ,,,.Sharps‐related injuries in health care workers: a case‐crossover study.Am J Med.2003;114:687–694.
The hospitalist model of care has experienced dramatic growth. In 2003 it was estimated that there were 8000 US hospitalists, a number projected to ultimately reach more than 19 000.1, 2 This rapid growth has largely been driven by improvements in clinical efficiency as a result of hospitalist programs. There is a substantial body of evidence showing that hospitalists reduce length of stay and inpatient costs.3 Despite the rapid growth and proven benefit to clinical efficiency, no studies have evaluated the type and frequency of activities that hospitalists perform during routine work. Although the use of hospitalists improves clinical efficiency for the hospital, relatively little is known about how the hospital can improve efficiency for the hospitalist.
Our institution greatly expanded our hospitalist program in June 2003 to create a resident‐uncovered hospitalist service. The impetus for this change was the need to comply with newly revised Accreditation Council for Graduate Medicine Education (ACGME) program requirements regarding resident duty hours. Many teaching hospitals have implemented similar resident‐uncovered hospitalist services.4 Inefficiencies in their work activities quickly became apparent to our hospitalists. Furthermore, our hospitalists believed that they frequently performed simultaneous activities and that they were excessively interrupted by pages.
To evaluate the type and frequency of activities that the hospitalists performed during routine work, we performed a time‐motion study of hospitalist physicians on the resident‐uncovered hospitalist service. Our goal was to identify areas for systems improvements and activities that were better suited for nonphysician providers and to quantify the time spent multitasking and the frequency of paging interruptions.
METHODS
Northwestern Memorial Hospital (NMH) is a 753‐bed hospital in Chicago, Illinois. NMH is the primary teaching hospital affiliated with the Feinberg School of Medicine of Northwestern University. There are 2 general medicine services at NMH: a traditional resident‐covered ward service and the resident‐uncovered hospitalist service. Patients are admitted to one of these 2 services on the basis of, in order of importance, capacity of the services, preference of the outpatient physician, and potential educational value of the admission. Patients admitted to the hospitalist service are preferentially given beds on specific wards intended for hospitalist service patients. Fourth‐year medical students are frequently paired with hospitalists during their medicine subinternship.
The resident‐uncovered hospitalist service comprises 5 daytime hospitalists on duty at a time. The hospitalists are on service for 7 consecutive days, usually followed by 7 consecutive days off. Hospitalists pick up new patients from the night float hospitalist each morning. Daytime admitting duties rotate on a daily basis. One hospitalist accepts new admissions each morning from 7:00 AM until noon. Two hospitalists accept admissions from noon until 5:00 PM. One hospitalist accepts admissions from 5:00 PM until 9:00 PM. One hospitalist is free from accepting new admissions each day. All daytime hospitalists begin the workday at 7:00 AM and leave when their duties are completed for the day. One night float hospitalist is on duty each night of the week. The night float hospitalist performs admissions and all cross cover activities from 7:00 PM until 7:00 AM.
We first conducted a pilot study to help identify specific activities that our hospitalists routinely perform. Broad categories and subcategories of activities were created based on the results of our pilot study, and a published time‐motion study performed on emergency medicine physicians5 (Table 1). Once activities were defined and codes established, our research assistant unobtrusively shadowed hospitalist physicians for periods lasting 3‐5 hours. The observation periods were distributed in order to sample all activities that a daytime hospitalist would perform throughout a typical week. Observation periods included 2 morning admitting periods, 4 morning nonadmitting periods, 4 afternoon admitting periods, 4 afternoon nonadmitting periods, and 2 admitting periods from 5:00 PM to 9:00 PM. Activities were recorded on a standardized data collection form in 1‐minute intervals. When multiple activities were performed at the same time, all activities were recorded in the same 1‐minute interval. Incoming pages were recorded as well. To minimize the possibility that observation would affect hospitalist behavior, the research assistant was instructed not to initiate conversation with the hospitalists.
| Direct patient care |
| Taking initial history and physical exam |
| Seeing patient in follow‐up visit |
| Going over discharge instructions |
| Family meetings |
| Indirect patient care |
| Reviewing test results and medical records |
| Documentation |
| Documenting history and physical, daily notes, filling out discharge instructions, writing out prescriptions |
| Communication |
| Taking report from night float, taking admission report, face‐to‐face discussion, initiating and returning pages |
| Orders |
| Writing/emnputting orders, calling radiology |
| Professional development |
| Going to conferences, grand rounds, etc |
| Reading articles, textbooks, online references |
| Education |
| Teaching during work rounds |
| Didactic sessions with subintern |
| Travel |
| Walking, taking elevator, etc |
| Personal |
| Lunch, washroom break, etc. |
The data collection forms were manually abstracted and minutes tallied for each category and subcategory, for which summary statistics were converted to percentage of total minutes.
RESULTS
Ten hospitalists were shadowed by a single research assistant for a total of 4467 minutes. Seven hospitalists were male and 3 were female. The hospitalists were a mean age of 31 1.6 years of age and had been practicing as a hospitalist for a mean of 2.1 1.0 years. The hospitalists saw an average of 9.4 4.0 patients on the days they were shadowed by the research assistant. Because simultaneous activities were recorded, a total of 5557 minutes of activities were recorded.
The distribution of total minutes recorded in each activity category is shown in Figure 1. Hospitalists spent 18% of their time doing direct patient care, 69% on indirect patient care, 4% on personal activities, and 3% each on professional development, education, and travel.
Of the time hospitalists directly cared for patients, 18% was spent obtaining histories and performing physical examinations on new patients, 53% seeing patients in follow‐up visits, 16% going over discharge instructions, and 13% in family meetings (Figure 2). Of the time hospitalists spent doing indirect patient care, 37% was taken up by documentation, 21% by reviewing results, 7% by orders, and 35% by communication (Figure 2).
As just explained, communication accounted for 35% of indirect patient care activities; it also accounted for 24% of the total activity minutes. The time spent by hospitalists on communication was further broken down as 23% paging other physicians, 31% returning pages, 34% in face‐to‐face communication, 5% taking report on new admissions, 4% on sign‐out to the night float hospitalist, and 3% receiving sign‐out from the night float hospitalist.
Multitasking, performing more than 1 activity at the same time, was done 21% of the time. Hospitalists received an average of 3.4 1.5 pages per hour, and 7% of total activity time was spent returning pages. Other forms of interruption were not evaluated.
DISCUSSION
Our study had several important findings. First, hospitalists spent most of their time on indirect patient care activities and relatively little time on direct patient care. Time‐motion studies of nonhospitalist physicians have reported similar findings.5, 6 A considerable amount of hospitalist time was spent on documentation. This finding also has been reported in studies of nonhospitalist physicians.5, 7
A unique finding in our study was the large amount of time, 24% of total minutes, spent on communication. A study of emergency medicine physicians by Hollingsworth found that 13% of their time was spent on communication activities.5 The large amount of time spent on communication in our study underscores the need for hospitalists to have outstanding communication skills and systems that support efficient communication. Hospitalists spent 6% of their total time paging other physicians and 7% returning pages. Improvements in the efficiency of paging communication could greatly reduce the amount of time communicating by page. Our paging system provides unidirectional alphanumeric paging. In an effort to improve the efficiency of paging, we have asked nurses and consultants to include FYI and callback in the text of the page so it is clear whether the person who has paged the hospitalist needs to be called back. This simple solution to help reduce the number of unnecessary callbacks has previously been proposed by others.8
Another part of solving this problem is adopting the use of 2‐way pagers instead of alphanumeric pagers. Two‐way paging can increase the efficiency of communication even further. For example, a nurse sends a hospitalist a page that asks if the previous diet orders for a patient just returned from a procedure can be resumed. This hospitalist is on another floor in another patient's room. Rather than spending time leaving the other patient's room, finding a phone, calling the floor, waiting for an answer, and then waiting on hold, the hospitalist simply texts a 1‐word answer, Yes, in the 2‐way paging system. In addition to the time occupied by paging activities, hospitalists spent a large amount of time in face‐to‐face communication (8% of total activity time). On the one hand, having hospitalists discuss patient care with consultants and nurses in person on an ongoing basis throughout the day may improve clinical efficiency. On the other hand, the constant potential for interruption may be problematic. Similarly, 2‐way paging could facilitate communication to such a degree that it could actually increase the frequency of interruptions. Research on improvements in communications systems, interventions to improve communication skills, and team‐based care is warranted in order to evaluate the impact on hospitalist workflow.
An important finding in our study was that multitasking and paging interruptions were common. Although this may come as no surprise to practicing hospitalists, the distraction caused by interruptions and multitasking is an important potential cause of medical errors.911 A thorough examination of the types of activities performed simultaneously and whether they contributed to medical error was beyond the scope of our study. Some activities, such as documenting a note on a patient while reviewing the patient's lab results, are concordant (ie, conducted for the same patient) and therefore may be unlikely to contribute to medical error. Other combinations of activities, such as returning a page about one patient while documenting a note on a different patient or having face‐to‐face communication about one patient while entering an order on another patient, are discordant. Discordant activities may contribute to medical error. Further research of the effect of hospitalist multitasking and interruption on medical error is warranted and should be conducted within the framework of concordant versus discordant activities.
We had hoped to find activities that could be performed by non‐physician providers. No high impact activities were discovered that would be better suited for a non‐physician provider in this study. Clerical tasks, such as calling for radiology orders or obtaining medical records, amounted to a small percentage of hospitalist time (less than 1% combined). We did identify several activities in which automation or process improvement would be helpful. Hospitalists spent 5% of time on the combined activity of documenting discharge instructions and writing out prescriptions. Our institution is in the process of implementing an electronic medical record and computerized physician order entry. We are currently working on an automated process to generate printed discharge instructions and prescriptions. This has the potential not only to improve efficiency, but also to eliminate medication errors, as care is transitioned to the outpatient setting.
Our study had several limitations. First, our findings reflect the experience at one institution. Hospitalist practices vary widely in their staffing and scheduling models as well as in their organizational support. The amount of time that hospitalists spend on activities may differ between practices and between individual hospitalists in the same practice. Another limitation to our study pertains to the workflow of our hospitalists and the locations of their patients. As discussed earlier, patients were assigned to a hospitalist according to time of admission, not location of admission. Because of this, the hospitalists were caring for patients on as many as 5 wards. Although travel time amounted to only 3% of total minutes, it is possible that communication time could have been reduced if patients were distributed to hospitalists on the basis of patient location rather than time of admission of patient. For example, physicians and nurses might spend less time communicating in person compared to communicating via unidirectional paging, which frequently requires waiting for a callback. Finally, our study only observed activities performed by the daytime hospitalists at our hospital. The distribution and types of activities performed by nighttime hospitalists may be somewhat different.
Our study may serve as a model for hospitalist time‐motion studies in other settings. Our findings are of particular importance to resident‐uncovered hospitalist programs in academic hospitals, a setting in which operational inefficiencies may be abundant as house staff members have been poorly positioned in the hospital organization to lobby for process change. We hope that our study is a precursor to research evaluating modifications to the environments and systems in which hospitalists work. Such modifications have the potential to improve productivity and work conditions and promote career satisfaction.
Acknowledgements
We thank Patricia Georgas for shadowing the hospitalists and collecting the data in this study.
- Society of Hospital Medicine. Available at http://www.hospitalmedicine.org/AM/Template.cfm?Section=FAQs106:441–445.
- ,.The hospitalist movement 5 years later.JAMA.2002;287:487–494.
- ,.Hospitalists in teaching hospitals: opportunities but not without danger.J Gen Intern Med.2004;4:392–393.
- ,,,,.How do physicians and nurses spend their time in the Emergency Department?Ann Emerg Med.1998;31:97–91.
- ,,,,.A time‐motion study of the activities of attending physicians in an Internal Medicine and Internal Medicine‐Pediatrics resident continuity clinic.Acad Med.2000;75:1138–1143.
- ,,,.Work interrupted: a comparison of workplace interruptions in emergency departments and primary care offices.Ann Emerg Med.2001;38:146–151.
- ,.Residents' suggestions for reducing errors in teaching hospitals.N Engl J Med.2003;348:851–855.
- ,,,.Emergency department workplace interruptions: are emergency physicians “interrupt‐driven” and “multitasking”?Acad Emerg Med.2000;7:1239–243.
- ,,.Understanding medical error and improving patient safety in the inpatient setting.Med Clin N Am.2002;86:847–867.
- ,,,.Sharps‐related injuries in health care workers: a case‐crossover study.Am J Med.2003;114:687–694.
Copyright © 2006 Society of Hospital Medicine
