User login
Understanding Hospital Readmissions
Hospital readmissions pose a major problem both to the patient and the fiscal stability of our health care system.1 Many interventions have attempted to tackle this problem. Interventions exist that utilize transition coaches working intensively with hospitalized patients or nurses performing postdischarge home visits or phoning patients.2, 3 Although beneficial, these strategies are costly and require additional, highly trained personnel. Consequently, they have been difficult to sustain financially in a fee‐for‐service environment, and difficult to generalize at other locales. Recent policies to decrease hospital payments for readmissions will incentivize hospitals to implement discharge programs.4 However, all hospital systems will still want to do this in the most efficient manner possible.
One important way to maximize benefits and minimize costs is to target the most intensive, expensive interventions to the highest risk patients who are most likely to be rehospitalized. By targeting the highest risk patients, we could significantly reduce costs. However, models predicting rehospitalization have had limited accuracy, even for condition‐specific models such as heart failure. Two studies in this issue work to better identify high‐risk patients. Mudge and colleagues5 prospectively examined risk factors for recurrent readmissions in an Australian hospital and found that chronic disease, depression, and underweight were independent risk factors for repeat readmission. Allaudeen6 examined risk factors for readmission to their own institution among general medicine patients. In a retrospective analysis of administrative data, they found that several variables predicted hospital readmission, including black race, insurance coverage through Medicaid, prescription of steroids or narcotics, and diagnoses of heart failure, renal disease, cancer, anemia, and weight loss.
These studies raise two questions that are critical if we are to develop better predictive modeling of who will benefit most from intensive interventions to reduce readmissions. First, what are the risk factors for preventable hospitalizations? People with multiple readmissions seem an obvious target on which to focus. However, it may be that these individuals are just very sick with multiple comorbidities, and many of their readmissions may not be preventable. Rich and colleagues reported that a multidisciplinary discharge intervention reduced readmissions for heart failure by 56%.7 What is often forgotten is that in their pilot study they were not able to reduce admissions for the most severely ill, and their final study population excluded the sickest patients. By targeting moderate‐risk patients, they were able to reduce readmissions significantly.8 In the studies by Mudge et al.5 and Allaudeen,6 the fact that chronic diseases predicted rehospitalization is only moderately helpful. It is possible, perhaps likely, that many of the readmissions for heart failure were preventable while many of the readmissions for cancer were not. The challenge for researchers is to develop methods for classifying admissions/readmissions as preventable.9 Using a defined set of diagnostic categories to classify readmissions (eg, ambulatory care sensitive conditions) may misclassify many cases.10 Determining preventable hospitalizations through detailed chart review is expensive and may have limited interobserver reliability. Nevertheless, physician review and classification may be necessary for future research to advance the field.
Second, what predictor variables are causally related to preventable hospitalizations (and presumably actionable), and which are merely markers of true causal factors and therefore harder to interpret and more difficult to act upon? In addition to chronic disease, Mudge et al.5 found that depression and low body mass index were independent risk factors for readmission. These conditions often go hand in hand. Patients who are burdened with chronic disease may be depressed and not eat. Conversely, patients who are depressed may not eat and allow their chronic disease to worsen. But it seems that depression is the more likely of the two to be causal. Depression is an important predictor of medication nonadherence and worsening illness.11, 12 Screening hospitalized patients for depression could provide valuable information on which patients may need treatment or more rigorous postdischarge follow‐up. In contrast, being underweight may not truly cause readmissions, but could be a marker of frailty and difficulty in meeting activities of daily living.
Similarly, Allaudeen6 found that black race, Medicaid use, steroid use, and narcotic use were independently associated with hospital readmission (in addition to chronic diseases and weight loss). Can being on steroids or narcotics cause readmissions? Does enrollment in Medicaid or being of black race cause one to be readmitted? While these may be markers which are statistically significant, they are unlikely to be true causes of rehospitalization. It is more likely that these variables are markers for true causal factors, such as financial barriers to medications or access barriers to primary care. Many other studies have used administrative databases to examine variables linked to readmission. We need to drill deeper to determine what is actually causing readmissions. Did the patient misinterpret how to take their steroid taper or were they so sick that they needed to return to the hospital? Perhaps they decided to wait on taking the steroids until they spoke with their primary care physician. This deeper level of understanding cannot be ascertained through third party administrative data sets. Primary data collection is needed to correctly determine who to target and the specific foci of interventions.
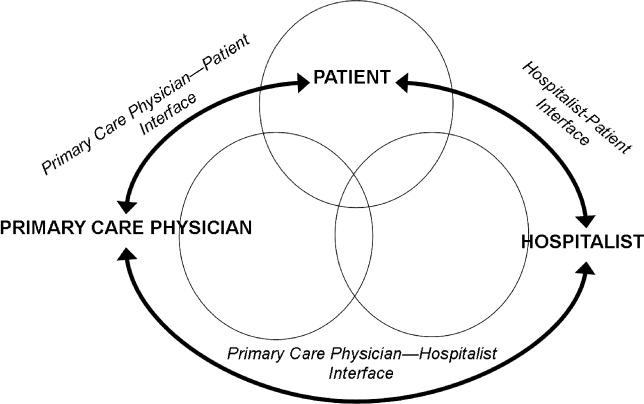
Future research on risk factors for readmissions (and interventions to decrease readmissions) should begin with a theoretical framework that addresses the patient, the hospital, and the receiving outpatient primary care physician or specialist, and the interfaces between each pair that could lead to preventable readmissions (see Figure 1).

With every potential variable affecting readmission, we need to systematically evaluate whether they are causal and preventable. When a variable is both causal and modifiable, we can then develop interventions to target these variables. We designed Table 1 as a framework to consider when moving forward in creating and implementing interventions.
| Factor | Potential Intervention |
|---|---|
| |
| Patient | |
| Cognition | Screening for cognition at discharge. Increase support at home. Inclusion of surrogate or caregiver in explaining discharge instructions. Additional use of a surrogate in explaining discharge instructions. |
| Depression | Screening for depression during the hospitalization and at discharge. Treatment of depression. Increased outpatient support to monitor depression. |
| Health literacy | Screening for health literacy. Involvement of hospital staff, social support network, and outpatient primary care physician to reinforce discharge instructions. |
| Support at home | Assess home support for patient. Increase phone call and home aid support following discharge for those with inadequate support. |
| Functional ability | Assess physical function throughout hospitalization and at discharge. Involve physical therapy early in the hospitalization and postdischarge. |
| Financial assets | Assess ability to pay for medications and transportation to follow‐up appointments. Work with social work on improving access. |
| Chronic disease (ie, congestive heart failure) | Improve patient education of disease and medications. Increase home support to monitor health status. Increase frequency of outpatient visits as needed. |
| Primary care physician | |
| PatientPCP interface | Via phone call to patient at discharge, reinforce so the patient understands disease process (eg, heart failure exacerbation triggers), will take medications started during hospitalization, and recognizes early precipitants of hospitalization. |
| PCPHospitalist interface | Encourage adequate communication about past medical problems and individualized issues pertinent to care plans. |
| Quality of outpatient primary care | Adhere to guidelines of care recommended by advisory standards. Ensure patients receive optimal outpatient care. |
| Medication reconciliation | Ensure that admission and discharge medication reconciliation is perfect. Update outpatient medication list with inpatient medication changes. |
| Follow‐up of pending tests | Create trigger system of pending tests for recently discharged patients. |
| Access to rapid follow‐up appointments | Incentivize physicians of recently discharged patients to offer follow‐up appointments in 1 week or less. |
| Hospitalist | |
| PatientHospitalist interface | Improve communication with patient on how to access physicians if residual postdischarge questions. |
| HospitalistPCP interface | Encourage adequate communication of hospital course and postdischarge plan. |
| Quality of inpatient hospital care | Ensure patients receive optimal inpatient care. Assess patient clinical stability and determine optimal time for discharge. |
| Written discharge instructions | Create easily understandable discharge instructions. Install checks to limit human errors. Ensure patient has copy on discharge. |
| Verbal discharge instructions | Learn to use teach‐back methodology to assess patient understanding of discharge instructions. Work to eliminate multiple sources (eg, consulting physicians, nurses, therapists) giving conflicting verbal discharge information. |
| Medication reconciliation | Utilize outpatient physician notes and pharmacy records to corroborate patient lists. Ensure that admission and discharge medication reconciliation is perfect. |
| Pending tests | Ensure discharge summary includes information and is communicated to PCP for follow‐up in timely manner. |
| Home services | Arrange for home support and nursing services to assist with patients needs postdischarge. Assess whether the patient knows of pending home services and means of contacting services if they do not occur. |
To advance this area, we need to be stringent about how we perform research and interpret findings. Studies that examine risk factors for readmission to a single hospital may be biased; for example, in the study by Allaudeen,6 it is possible that patients with Medicaid may have been equally likely to be readmitted to any hospital but more likely to be readmitted to the hospital that was the sole source of admission data. Even if findings from a single site are valid, they may not be generalizable. Ideally, studies of risk factors (and interventions to reduce readmissions) should be conducted in multiple sites that can track all hospitalizations and examine differences in risk factors for rehospitalization across hospitals. We have learned a tremendous amount over the last few years about risk markers for all‐cause readmission, and interventions to improve safety and quality of transitions in care. To advance further, multicenter studies are needed that focus on plausible causal variables of preventable readmissions and risk factors beyond the walls of the hospital (eg, access and quality of outpatient care for newly discharged patients). Only then will we better understand which patients can have their readmissions prevented and how to improve upon current strategies to improve outcomes.
- ,,. Nationwide Frequency and Costs of Potentially Preventable Hospitalizations,2006. April 2009. Available at: http://www.hcup‐us.ahrq.gov/reports/statbriefs/sb72.jsp. Accessed December 8, 2010.
- ,,,,,.Preparing patients and caregivers to participate in care delivered across settings: the care transitions intervention.J Am Geriatr Soc.2004;52(11):1817–1825.
- ,,, et al.A reengineered hospital discharge program to decrease rehospitalization: a randomized trial.Ann Int Med.2009;150(3):178–187.
- Sec. 3025.Hospital readmissions reduction program. The Patient Protection and Affordable Care Act. HR 3590. Acts of Congress, 111th second session. January 5,2010.
- ,,,,,,.Recurrent readmissions in medical patients: a prospective study.J Hosp Med.2011;6 (this issue).
- ,,,.Redefining identifiable readmission risk factors for general medicine patients.J Hosp Med.2011;6 (this issue).
- ,,,,,.A multidisciplinary intervention to prevent the readmission of elderly patients with congestive heart failure.N Engl J Med.1995;333(18):1190–1195.
- ,,, et al.Prevention of readmission in elderly patients with congestive heart failure: results of a prospective, randomized pilot study.J Gen Intern Med.1993;8(11):585–590.
- ,,,,,.Hospital readmissions and quality of care.Med Care.1999;37(5):490–501.
- ,,,.Ambulatory care sensitive conditions: terminology and disease coding need to be more specific to aid policy makers and clinicians.Public Health.2009;123(2):169–173.
- ,,,,.Depression is an important contributor to low medication adherence in hemodialyzed patients and transplant recipients.Kidney Int.2009;75(11):1223–1229.
- ,,, et al.Depression, medication adherence, and service utilization in systemic lupus erythematosus.Arthritis Rheum.2009;61(2):240–246.
Hospital readmissions pose a major problem both to the patient and the fiscal stability of our health care system.1 Many interventions have attempted to tackle this problem. Interventions exist that utilize transition coaches working intensively with hospitalized patients or nurses performing postdischarge home visits or phoning patients.2, 3 Although beneficial, these strategies are costly and require additional, highly trained personnel. Consequently, they have been difficult to sustain financially in a fee‐for‐service environment, and difficult to generalize at other locales. Recent policies to decrease hospital payments for readmissions will incentivize hospitals to implement discharge programs.4 However, all hospital systems will still want to do this in the most efficient manner possible.
One important way to maximize benefits and minimize costs is to target the most intensive, expensive interventions to the highest risk patients who are most likely to be rehospitalized. By targeting the highest risk patients, we could significantly reduce costs. However, models predicting rehospitalization have had limited accuracy, even for condition‐specific models such as heart failure. Two studies in this issue work to better identify high‐risk patients. Mudge and colleagues5 prospectively examined risk factors for recurrent readmissions in an Australian hospital and found that chronic disease, depression, and underweight were independent risk factors for repeat readmission. Allaudeen6 examined risk factors for readmission to their own institution among general medicine patients. In a retrospective analysis of administrative data, they found that several variables predicted hospital readmission, including black race, insurance coverage through Medicaid, prescription of steroids or narcotics, and diagnoses of heart failure, renal disease, cancer, anemia, and weight loss.
These studies raise two questions that are critical if we are to develop better predictive modeling of who will benefit most from intensive interventions to reduce readmissions. First, what are the risk factors for preventable hospitalizations? People with multiple readmissions seem an obvious target on which to focus. However, it may be that these individuals are just very sick with multiple comorbidities, and many of their readmissions may not be preventable. Rich and colleagues reported that a multidisciplinary discharge intervention reduced readmissions for heart failure by 56%.7 What is often forgotten is that in their pilot study they were not able to reduce admissions for the most severely ill, and their final study population excluded the sickest patients. By targeting moderate‐risk patients, they were able to reduce readmissions significantly.8 In the studies by Mudge et al.5 and Allaudeen,6 the fact that chronic diseases predicted rehospitalization is only moderately helpful. It is possible, perhaps likely, that many of the readmissions for heart failure were preventable while many of the readmissions for cancer were not. The challenge for researchers is to develop methods for classifying admissions/readmissions as preventable.9 Using a defined set of diagnostic categories to classify readmissions (eg, ambulatory care sensitive conditions) may misclassify many cases.10 Determining preventable hospitalizations through detailed chart review is expensive and may have limited interobserver reliability. Nevertheless, physician review and classification may be necessary for future research to advance the field.
Second, what predictor variables are causally related to preventable hospitalizations (and presumably actionable), and which are merely markers of true causal factors and therefore harder to interpret and more difficult to act upon? In addition to chronic disease, Mudge et al.5 found that depression and low body mass index were independent risk factors for readmission. These conditions often go hand in hand. Patients who are burdened with chronic disease may be depressed and not eat. Conversely, patients who are depressed may not eat and allow their chronic disease to worsen. But it seems that depression is the more likely of the two to be causal. Depression is an important predictor of medication nonadherence and worsening illness.11, 12 Screening hospitalized patients for depression could provide valuable information on which patients may need treatment or more rigorous postdischarge follow‐up. In contrast, being underweight may not truly cause readmissions, but could be a marker of frailty and difficulty in meeting activities of daily living.
Similarly, Allaudeen6 found that black race, Medicaid use, steroid use, and narcotic use were independently associated with hospital readmission (in addition to chronic diseases and weight loss). Can being on steroids or narcotics cause readmissions? Does enrollment in Medicaid or being of black race cause one to be readmitted? While these may be markers which are statistically significant, they are unlikely to be true causes of rehospitalization. It is more likely that these variables are markers for true causal factors, such as financial barriers to medications or access barriers to primary care. Many other studies have used administrative databases to examine variables linked to readmission. We need to drill deeper to determine what is actually causing readmissions. Did the patient misinterpret how to take their steroid taper or were they so sick that they needed to return to the hospital? Perhaps they decided to wait on taking the steroids until they spoke with their primary care physician. This deeper level of understanding cannot be ascertained through third party administrative data sets. Primary data collection is needed to correctly determine who to target and the specific foci of interventions.
Future research on risk factors for readmissions (and interventions to decrease readmissions) should begin with a theoretical framework that addresses the patient, the hospital, and the receiving outpatient primary care physician or specialist, and the interfaces between each pair that could lead to preventable readmissions (see Figure 1).
With every potential variable affecting readmission, we need to systematically evaluate whether they are causal and preventable. When a variable is both causal and modifiable, we can then develop interventions to target these variables. We designed Table 1 as a framework to consider when moving forward in creating and implementing interventions.
| Factor | Potential Intervention |
|---|---|
| |
| Patient | |
| Cognition | Screening for cognition at discharge. Increase support at home. Inclusion of surrogate or caregiver in explaining discharge instructions. Additional use of a surrogate in explaining discharge instructions. |
| Depression | Screening for depression during the hospitalization and at discharge. Treatment of depression. Increased outpatient support to monitor depression. |
| Health literacy | Screening for health literacy. Involvement of hospital staff, social support network, and outpatient primary care physician to reinforce discharge instructions. |
| Support at home | Assess home support for patient. Increase phone call and home aid support following discharge for those with inadequate support. |
| Functional ability | Assess physical function throughout hospitalization and at discharge. Involve physical therapy early in the hospitalization and postdischarge. |
| Financial assets | Assess ability to pay for medications and transportation to follow‐up appointments. Work with social work on improving access. |
| Chronic disease (ie, congestive heart failure) | Improve patient education of disease and medications. Increase home support to monitor health status. Increase frequency of outpatient visits as needed. |
| Primary care physician | |
| PatientPCP interface | Via phone call to patient at discharge, reinforce so the patient understands disease process (eg, heart failure exacerbation triggers), will take medications started during hospitalization, and recognizes early precipitants of hospitalization. |
| PCPHospitalist interface | Encourage adequate communication about past medical problems and individualized issues pertinent to care plans. |
| Quality of outpatient primary care | Adhere to guidelines of care recommended by advisory standards. Ensure patients receive optimal outpatient care. |
| Medication reconciliation | Ensure that admission and discharge medication reconciliation is perfect. Update outpatient medication list with inpatient medication changes. |
| Follow‐up of pending tests | Create trigger system of pending tests for recently discharged patients. |
| Access to rapid follow‐up appointments | Incentivize physicians of recently discharged patients to offer follow‐up appointments in 1 week or less. |
| Hospitalist | |
| PatientHospitalist interface | Improve communication with patient on how to access physicians if residual postdischarge questions. |
| HospitalistPCP interface | Encourage adequate communication of hospital course and postdischarge plan. |
| Quality of inpatient hospital care | Ensure patients receive optimal inpatient care. Assess patient clinical stability and determine optimal time for discharge. |
| Written discharge instructions | Create easily understandable discharge instructions. Install checks to limit human errors. Ensure patient has copy on discharge. |
| Verbal discharge instructions | Learn to use teach‐back methodology to assess patient understanding of discharge instructions. Work to eliminate multiple sources (eg, consulting physicians, nurses, therapists) giving conflicting verbal discharge information. |
| Medication reconciliation | Utilize outpatient physician notes and pharmacy records to corroborate patient lists. Ensure that admission and discharge medication reconciliation is perfect. |
| Pending tests | Ensure discharge summary includes information and is communicated to PCP for follow‐up in timely manner. |
| Home services | Arrange for home support and nursing services to assist with patients needs postdischarge. Assess whether the patient knows of pending home services and means of contacting services if they do not occur. |
To advance this area, we need to be stringent about how we perform research and interpret findings. Studies that examine risk factors for readmission to a single hospital may be biased; for example, in the study by Allaudeen,6 it is possible that patients with Medicaid may have been equally likely to be readmitted to any hospital but more likely to be readmitted to the hospital that was the sole source of admission data. Even if findings from a single site are valid, they may not be generalizable. Ideally, studies of risk factors (and interventions to reduce readmissions) should be conducted in multiple sites that can track all hospitalizations and examine differences in risk factors for rehospitalization across hospitals. We have learned a tremendous amount over the last few years about risk markers for all‐cause readmission, and interventions to improve safety and quality of transitions in care. To advance further, multicenter studies are needed that focus on plausible causal variables of preventable readmissions and risk factors beyond the walls of the hospital (eg, access and quality of outpatient care for newly discharged patients). Only then will we better understand which patients can have their readmissions prevented and how to improve upon current strategies to improve outcomes.
- ,,. Nationwide Frequency and Costs of Potentially Preventable Hospitalizations,2006. April 2009. Available at: http://www.hcup‐us.ahrq.gov/reports/statbriefs/sb72.jsp. Accessed December 8, 2010.
- ,,,,,.Preparing patients and caregivers to participate in care delivered across settings: the care transitions intervention.J Am Geriatr Soc.2004;52(11):1817–1825.
- ,,, et al.A reengineered hospital discharge program to decrease rehospitalization: a randomized trial.Ann Int Med.2009;150(3):178–187.
- Sec. 3025.Hospital readmissions reduction program. The Patient Protection and Affordable Care Act. HR 3590. Acts of Congress, 111th second session. January 5,2010.
- ,,,,,,.Recurrent readmissions in medical patients: a prospective study.J Hosp Med.2011;6 (this issue).
- ,,,.Redefining identifiable readmission risk factors for general medicine patients.J Hosp Med.2011;6 (this issue).
- ,,,,,.A multidisciplinary intervention to prevent the readmission of elderly patients with congestive heart failure.N Engl J Med.1995;333(18):1190–1195.
- ,,, et al.Prevention of readmission in elderly patients with congestive heart failure: results of a prospective, randomized pilot study.J Gen Intern Med.1993;8(11):585–590.
- ,,,,,.Hospital readmissions and quality of care.Med Care.1999;37(5):490–501.
- ,,,.Ambulatory care sensitive conditions: terminology and disease coding need to be more specific to aid policy makers and clinicians.Public Health.2009;123(2):169–173.
- ,,,,.Depression is an important contributor to low medication adherence in hemodialyzed patients and transplant recipients.Kidney Int.2009;75(11):1223–1229.
- ,,, et al.Depression, medication adherence, and service utilization in systemic lupus erythematosus.Arthritis Rheum.2009;61(2):240–246.
Discharge Summary Improvement
Preventable or ameliorable adverse events have been reported to occur in 12% of patients in the period immediately following hospital discharge.1, 2 A potential contributor to this is the inadequate transfer of clinical information at hospital discharge. The discharge summary comprises a vital component of the information transfer between the inpatient and outpatient settings. Unfortunately, discharge summaries are often unavailable at the time of follow‐up care and often lack important content.37
A growing number of hospitals are implementing electronic medical records (EMR). This creates the opportunity to standardize the content of clinical documentation and creates the potential to assemble, immediately at the time of hospital discharge, major components of a discharge summary. With enhanced communication systems, this information can be delivered in a variety of ways with minimal delay. Previously, we reported the results of a survey of medicine faculty at an urban academic medical center evaluating the timeliness and quality of discharge summaries, the perceived incidence of preventable adverse events related to suboptimal information transfer at discharge, and a needs assessment for an electronically generated discharge summary that we planned to design.8 We now report the results of the follow‐up survey of outpatient physicians and an evaluation of the quality and timeliness of the electronic discharge summary we created.
Materials and Methods
Design
We conducted a pre‐post evaluation of the quality and timeliness of discharge summaries. In the initial phase of the study, we convened an advisory board comprised of 16 Department of Medicine physicians. The advisory board gave input on needs assessment and helped to create a survey to be administered to all medicine faculty with an outpatient practice. All respondents who had at least 1 patient admitted to the hospital within the 6 months prior to the survey were eligible. The results of the initial survey were reviewed with the advisory board and an electronic discharge summary was created with their input. To evaluate its impact, we conducted a repeat survey of all medicine faculty with an outpatient practice approximately 1 year after implementation of the electronic discharge summary.
To complement data received from the outpatient physician survey, a randomly selected sample of discharge summaries from general medical services during the same 3 month period before and after implementation of the electronic discharge summary were rated by 1 of 3 board‐certified internists (D.B.E., N.K., or M.P.L.).
Setting and Participants
The study was conducted at Northwestern Memorial Hospital, a 753‐bed hospital in Chicago, IL. The study was approved by the Institutional Review Board of the Northwestern University Feinberg School of Medicine. General medical patients were admitted to 1 of 2 primary physician services during the study period: a teaching service or a nonteaching hospitalist service. Discharge summaries had traditionally been dictated by inpatient physicians and delivered to outpatient physicians by both mail and facsimile via the medical record department. A recommended template for dictated discharge summaries was provided in the paper paging directory distributed yearly to inpatient physicians.
The hospital implemented an EMR and computerized physician order entry (CPOE) system (PowerChart Millennium; Cerner Corporation, Kansas City, MO) in August 2004. Although all history and physicals and progress notes were documented in the EMR, the system did not provide a method for delivering discharge summaries performed within the EMR to outpatient physician offices. Because of this, inpatient physicians were instructed to continue to dictate discharge summaries during the initial phase of the study.
Approximately 65% of outpatient physicians at the study site used an EMR in their offices during the study. Approximately 10% of outpatient physicians used the same EMR the hospital uses, while approximately 55% used a different EMR (EPIC Hyperspace; EPIC Systems Corporation, Verona, WI). The remaining physicians did not use an EMR in their offices.
Intervention: The Electronic Discharge Summary
A draft electronic discharge summary template was created by including elements ranked as highly important by outpatient physicians in our initial survey8 and elements required by The Joint Commission.9 The draft electronic discharge summary template was reviewed by the advisory board and modifications were made with their input. We automated the insertion of specific patient data elements, such as listed allergies and home medications, into the discharge summary template. We also created an electronic reminder system to inpatient physicians for summaries not completed 24 hours after discharge.
Because the majority of physicians in our initial survey preferred discharge summaries to be delivered either by facsimile or via an EMR, we concentrated our efforts on creating reliable systems for delivery by those routes. We created logic that queried the primary care physician field within the EMR at the time the discharge summary was electronically signed. An automated process then sent the discharge summary via electronic fax to the physician listed in the primary care physician field. Because a large number of outpatient physicians used an EMR different from the hospital's, we also created a process that sent discharge summaries from the hospital EMR into patient charts within this separate EMR.
The draft electronic discharge summary template was available for use in the EMR beginning in July 2005. The final electronic discharge summary, including automated content, physician reminder for incomplete summaries, and delivery systems as described above was implemented in June 2006. Upon implementation, inpatient physicians were instructed via email announcements and group meetings to begin completing electronic discharge summaries using the EMR. Beyond these announcements, inpatient physicians did not receive any specific training with regard to the new discharge summary process. An example of the final electronic discharge summary product is available in the Appendix.
Outpatient Physician Survey
Satisfaction with timeliness and quality of discharge summaries was assessed using a 5‐point Likert scale, where 5 represented very satisfied and 1 represented very dissatisfied. We also asked respondents to estimate the number of their patients who had sustained a preventable adverse event or near miss related to suboptimal transfer of information at discharge. We defined a preventable adverse event as a preventable medical problem or worsening of an existing problem and near miss as an error that did not result in patient harm but easily could have.
The preimplementation survey, accompanied by a cover letter signed by the hospital's chief of staff, was sent out in March 2005. A postcard reminder was sent approximately 2 weeks after the initial mail survey. A second survey was sent to nonresponders 6 weeks after the initial survey. Simultaneously, the survey was also sent in web‐based format to nonresponders via email. The postimplementation survey was sent out in February 2007 using a similar survey process.
Discharge Summary Review
A random sample of discharge summaries completed before and after the implementation of the electronic discharge summary was selected for review. The sample universe consisted of all general medicine service discharges between August and November 2005, before the electronic discharge summary was implemented, and August to November 2006, after implementation. To provide a balanced comparison, the sample was further limited to only the first chronological (index) discharge of a unique patient to home self‐care or home health nursing, with length of stay between 3 and 14 days. A total of 2232 discharges in 2005 and 2570 discharges in 2006 met these criteria. The discharge summary review sample was designed to randomly select approximately 100 discharge summaries meeting the criteria above within each study year, to produce an approximate 200‐record analysis sample. Each of the 3 physician reviewers was assigned to complete an approximately equal number of the 200 primary reviews.
Physician reviewers recorded whether the discharge summary was dictated versus done electronically, the length of the discharge summary (in words), the number of days from discharge to discharge summary completion, the type of service the patient was discharged from, and the author type (medical student, intern, resident, or attending). Physicians reviewers also assessed the overall clarity of discharge summaries using a 5‐point ordinal scale (1 = unintelligible; 2 = hard to read; 3 = neutral; 4 = understandable; and 5 = lucid).
Prior studies have evaluated the quality of discharge summaries using scoring tools created by the investigators.10, 11 We created our own discharge summary scoring tool based on these prior studies, recommendations from the literature,12 and the findings from our initial survey.8 We pilot‐tested the scoring tool and made minor revisions prior to the study. The final scoring tool consisted of 16 essential elements. Reviewers assessed whether each of the 16 essential elements was present, absent, or not applicable. A Discharge Summary Completeness Score was calculated by the number of the 16 essential elements that were rated as present divided by the number of applicable elements for each discharge summary, multiplied by 100 to produce a completeness percentage.
To assess interrater reliability, reviewers were assigned to independently complete second, duplicate reviews of approximately 90 summaries (30 per reviewer). The duplicate review sample was designed to produce approximately 45 paired re‐reviews in each year for reliability assessment. A final sample of 196 available summaries was completed for the main analysis and 174 primary and duplicate reviews were used to establish interrater reliability across 87 reviewer pairs.
Data Analysis
Physician characteristics, including specialty, faculty appointment type, and year of medical school graduation were provided by the hospital's medical staff office. Physician characteristics from before and after the implementation of the electronic discharge summary were compared using chi‐square tests. Likert scale ratings of physician satisfaction with the timeliness and quality of discharge summaries were compared using t‐tests. The proportion of physicians reporting 1 or more preventable adverse event or near miss before the implementation of the electronic discharge summary was compared to postimplementation proportions using chi‐square tests. In addition, we performed multivariate logistic regression to examine the likelihood of physicians reporting any preventable adverse event or near miss related to suboptimal information transfer. The regression models tested the likelihood of 1 or more preventable adverse event or near miss before versus after the implementation of the electronic discharge summary, controlling for physician characteristics and their number of hospitalized patients in the previous 6 months.
The proportions of discharge summary elements found to be present, the proportion of discharge summaries completed within 3 days, and discharge summary readability ratings before and after the implementation of the electronic discharge summary were compared using chi‐square tests; length in words was compared using t‐tests. Preimplementation and postimplementation Discharge Summary Completeness Scores were compared using the Mann‐Whitney U test. Discharge summary score interrater reliability was assessed using the Brennan‐Prediger Kappa for individual elements.13
Results
Outpatient Physician Survey
Physician Characteristics
Two hundred and twenty‐six of 416 (54%) eligible outpatient physicians completed the baseline survey and 256 of 397 (64%) completed the postimplementation survey. As shown in Table 1, there were no significant differences in specialty, faculty appointment type, or number of patients hospitalized between respondents to the survey before compared to respondents after the implementation of the electronic discharge summary. The number of respondents graduating medical school in 1990 or later was higher after implementation of the electronic discharge summary; however, this result was of borderline statistical significance.
| Preelectronic Discharge Summary (n = 226) | Postelectronic Discharge Summary (n = 256) | P Value | |
|---|---|---|---|
| |||
| Practice Type | 0.23 | ||
| Generalist, n (%) | 127 (56.2) | 130 (50.8) | |
| Specialist, n (%) | 99 (43.8) | 126 (49.2) | |
| Faculty Appointment | 0.38 | ||
| Full‐time, n (%) | 104 (46.0) | 128 (50.0) | |
| Affiliated, n (%) | 122 (54.0) | 128 (50.0) | |
| Year of medical school graduation* | 0.06 | ||
| Before 1990, n (%) | 128 (57.4) | 124 (48.8) | |
| 1990 or later, n (%) | 95 (42.6) | 130 (51.2) | |
| Number of patients hospitalized (last 6 months) | 0.56 | ||
| 1‐4, n (%) | 15 (7.9) | 24 (12.0) | |
| 5‐10, n (%) | 62 (32.5) | 66 (33.0) | |
| 11‐19, n (%) | 35 (18.3) | 33 (16.5) | |
| 20 or more, n (%) | 79 (41.4) | 77 (38.5) | |
Timeliness and Content
Changes in outpatient physician satisfaction with the timeliness and quality of discharge summaries are summarized in Table 2. Satisfaction with the timeliness and quality of discharge summarizes improved significantly after the implementation of the electronic discharge summary (mean standard deviation [SD] timeliness rating, 2.59 1.02 versus 3.34 1.09; P < 0.001, mean quality rating 3.04 0.93 versus 3.64 0.99; P < 0.001).
| Likert Scale Mean Score (SD)* | |||
|---|---|---|---|
| Preelectronic Discharge Summary | Postelectronic Discharge Summary | P Value | |
| |||
| Timeliness of the discharge summary | 2.59 (1.02) | 3.34 (1.09) | <0.001 |
| Quality of the discharge summary | 3.04 (0.93) | 3.64 (0.99) | <0.001 |
Medical Error
The effect of the electronic discharge summary on perceived near misses and preventable adverse events is summarized in Table 3. Fewer outpatient physicians felt that 1 or more of their patients hospitalized in the preceding 6 months sustained a near miss due to suboptimal transfer of information after the implementation of the electronic discharge summary (65.7% vs. 52.9%, P = 0.008). Similarly, fewer outpatient physicians felt that 1 or more of their patients hospitalized in the preceding 6 months sustained a preventable adverse event due to suboptimal transfer of information after the implementation of the electronic discharge summary (40.7% vs. 30.2%, P = 0.02). In multivariate logistic regression analyses controlling for physician characteristics and their number of hospitalized patients in the previous 6 months, there was a statistically significant 40% reduction in the odds of a reported near miss (adjusted odds ratio [OR] = 0.60, P = 0.02). Although not quite statistically significant, there was a 33% reduction in the odds of a reported preventable adverse event (OR = 0.67, P = 0.08) after the implementation of the electronic discharge summary.
| Preelectronic Discharge Summary | Postelectronic Discharge Summary | P Value | |
|---|---|---|---|
| |||
| Near miss* | |||
| Number (%) reporting 1 | 142 (65.7) | 108 (52.9) | |
| Crude odds ratio | Ref. | 0.57 | 0.008 |
| Adjusted odds ratio | Ref. | 0.60 | 0.02 |
| Preventable adverse event | |||
| Number (%) reporting 1 | 88 (40.7) | 62 (30.2) | |
| Crude odds ratio | Ref. | 0.63 | 0.03 |
| Adjusted odds ratio | Ref. | 0.67 | 0.08 |
Discharge Summary Review
Discharge Summary Characteristics
One hundred and one discharge summaries before implementation of the electronic discharge summary were compared to 95 discharge summaries produced the following year. Characteristics of discharge summaries before and after the implementation of the electronic discharge summary are summarized in Table 4. A large number of discharge summaries (52.5%) were already being typed into the EMR in 2005, prior to the implementation of our final electronic discharge summary product. The number of dictated discharge summaries decreased from 47.5% to 10.5% after implementation of the final electronic discharge summary product (P < 0.001). Discharge summaries were similar in length before and after the implementation of the electronic discharge summary. A higher percentage of discharge summaries were completed within 3 days of discharge after implementation of the electronic discharge summary; however, this result was of borderline statistical significance (59.4% vs. 72.6%; P = 0.05). The type of service from which patients were discharged and the distribution of author types were similar after the implementation of the electronic discharge summary.
| Number (%) or MeanSD | P Value | ||
|---|---|---|---|
| Preelectronic Discharge Summary (n = 101) | Postelectronic Discharge Summary (n = 95) | ||
| Dictated, n (%) | 48 (47.5) | 10 (10.5) | <0.001 |
| Length in words, mean SD | 785 407 | 830 389 | 0.43 |
| Completed within 3 days, n (%) | 60 (59.4) | 69 (72.6) | 0.05 |
| Type of service, n (%) | 0.29 | ||
| Teaching service | 63 (62.4) | 66 (69.5) | |
| Nonteaching hospitalist service | 38 (37.6) | 29 (30.5) | |
| Author type, n (%) | 0.62 | ||
| Fourth year medical student | 13 (12.9) | 13 (13.7) | |
| Intern | 31 (30.7) | 37 (38.9) | |
| Resident | 19 (18.8) | 15 (15.8) | |
| Attending | 38 (37.6) | 30 (31.6) | |
Because a large percentage of discharge summaries were already being done electronically in 2005, we evaluated the timeliness of dictated discharge summaries compared to electronic discharge summaries across both periods combined (preimplementation and postimplementation of the electronic discharge summary). A higher percentage of electronic discharge summaries were completed within 3 days of discharge as compared to dictated discharge summaries (44.8% versus 74.1%; P < 0.001).
Discharge Summary Completeness Score
The presence or absence of discharge summary elements before and after the implementation of the electronic discharge summary is shown in Table 5. Several elements of the discharge summary were present more often after the implementation of the electronic discharge summary. Specific improvements included discussion of follow‐up issues (52.0% versus 75.8%; P = 0.001, = 0.78), pending test results (13.9% vs. 46.3%; P < 0.001, = 0.92), and information provided to the patient and/or family (85.1% vs. 95.8%; P = 0.01, = 0.91). Significant laboratory findings were present less often after implementation of the electronic discharge summary (66.0% versus 51.1%; P = 0.04, = 0.84). The Discharge Summary Completeness Score was higher after the implementation of the electronic discharge summary (mean 74.1 versus 80.3, P = 0.007). Dictated discharge summaries had a significantly lower Discharge Summary Completeness Score compared to discharge summaries done electronically (71.3 vs. 79.6, P = 0.002) across both periods combined.
| Number (%) of Content Items Present* | P Value | Brennan‐Prediger Kappa | ||
|---|---|---|---|---|
| Preelectronic Discharge Summary (n = 101) | Postelectronic Discharge Summary (n = 95) | |||
| ||||
| Dates of admission and discharge | 96 (95.0) | 94 (98.9) | 0.11 | 1.0 |
| Reason for hospitalization | 100 (99.0) | 94 (100) | 0.33 | 1.0 |
| Significant findings from history and exam | 78 (77.2) | 65 (68.4) | 0.16 | 0.26 |
| Significant laboratory findings | 64 (66.0) | 47 (51.1) | 0.04 | 0.84 |
| Significant radiological findings | 67 (75.3) | 71 (81.6) | 0.31 | 0.89 |
| Significant findings from other tests | 41 (63.1) | 40 (71.4) | 0.33 | 0.88 |
| List of procedures performed | 45 (81.8) | 35 (77.8) | 0.77 | 0.99 |
| Procedure report findings | 49 (80.3) | 43 (78.2) | 0.61 | 0.92 |
| Stress test report findings | 7 (100) | 3 (100) | N/A | 1.0 |
| Pathology report findings | 11 (39.3) | 3 (30.0) | 0.60 | 0.91 |
| Discharge diagnosis | 89 (88.1) | 86 (93.5) | 0.20 | 0.86 |
| Condition at discharge | 81 (81.0) | 80 (85.1) | 0.45 | 0.76 |
| Discharge medications | 88 (87.1) | 88 (93.6) | 0.13 | 0.79 |
| Follow‐up issues | 52 (52.0) | 72 (75.8) | 0.001 | 0.78 |
| Pending test results | 14 (13.9) | 44 (46.3) | <0.001 | 0.92 |
| Information provided to patient and/or family, as appropriate | 86 (85.1) | 91 (95.8) | 0.01 | 0.91 |
| Discharge Summary Completeness Score (percent present all applicable items) | 74.1 | 80.3 | 0.007 | |
Significantly more discharge summaries were rated as understandable or lucid after the implementation of the electronic discharge summary (41.6% vs. 59.0%; P = 0.02). In both periods combined, dictated discharge summaries were rated as understandable or lucid less often than electronic discharge summaries (34.5% vs. 56.5%; P < 0.001).
Discussion
Our study found that an electronic discharge summary was well accepted by inpatient physicians and significantly improved the quality and timeliness of discharge summaries. Prior studies have shown that the use of electronically entered discharge summaries improved the timeliness of discharge summaries.1416 However, the discharge summaries used in these studies required manual input of data into a computer system separate from the patient's medical record. To our knowledge, this is the first study to report the impact of discharge summaries generated from an EMR. Leveraging the EMR, we were able to automate the insertion of specific patient data elements, streamline delivery, and create an electronic reminder system to inpatient physicians for summaries not completed 24 hours after discharge.
Prior research has shown that the quality of discharges summaries is improved with the use of standardized content.10, 17 Using a standardized template for the electronic discharge summary, we likewise demonstrated improved quality of discharge summaries. Key discharge summary elements, specifically discussion of follow‐up issues, pending test results, and information provided to the patient and/or family, were present more reliably after the implementation of the electronic discharge summary. The importance of identifying pending test results is underscored by a recent study showing that many patients are discharged from hospitals with test results still pending, and that physicians are often unaware when results are abnormal.18 One discharge summary element, significant laboratory findings, was present less often after the implementation of the electronic discharge summary. Our template did not designate significant laboratory findings under a separate heading. Instead, we used a heading entitled Key Results (labs, imaging, pathology). Physicians completing the discharge summaries may have prioritized the report of imaging and pathology results in this section. A simple revision of our discharge summary template to include a separate heading for significant laboratory findings may result in improvement in this regard.
Timeliness of discharge summaries was improved in our study, but remained less than optimal. Although nearly three‐quarters of electronic discharge summaries were completed within 3 days of discharge, our ultimate goal is to have 100% of discharge summaries completed within 3 days. This is especially important for complicated patients requiring outpatient follow‐up soon after discharge. We are currently in the process of designing further modifications to the electronic discharge summary completion process. One modification that may be beneficial is the automation of additional patient specific data elements into the discharge summary. We also plan to link performance of medication reconciliation, completion of patient discharge instructions, and completion of the discharge summary into an integrated set of activities performed in the EMR prior to patient discharge.
We found that fewer outpatient physicians reported 1 or more of their patients having a preventable adverse event or near miss as a result of suboptimal transfer of information at discharge after the implementation of the electronic discharge summary. Although we did not measure preventable adverse events directly in our study, this is an important finding in light of the large number of patients who sustain preventable adverse events after hospital discharge1, 2 and prior research showing that the absence of discharge summaries at postdischarge follow‐up visits increased the risk for hospital readmission.19
We had wondered what effect the electronic discharge summary would have on the length and clarity of discharge summaries. A published commentary suggested that notes performed in EMRs were inordinately long and often difficult to read.20 We were pleased to discover that electronic discharge summaries were similar in length to previous discharge summaries and were rated higher with regard to clarity.
Our study has several limitations. First, many inpatient physicians began to use electronic discharge summaries prior to our creation of the final electronic discharge summary product. We had explicitly instructed physicians to continue to dictate discharge summaries in the first phase of our study. The fact that physicians quickly adopted the practice of completing discharge summaries electronically suggests that they preferred this method for completion and may help to explain the improvement in timeliness. A second limitation, as previously mentioned, is that our study did not measure adverse events directly. Instead, we asked outpatient physicians to estimate the number of their patients discharged in the last 6 months who had sustained a preventable adverse event or near miss related to suboptimal information transfer at discharge. We had limited space in the survey to define the meaning of a preventable adverse event; therefore, the description in the survey does not exactly match previous definitions.1, 2 Finally, the ordinal scale used to assess clarity of discharge summaries has not been previously validated.
In conclusion, the use of an electronic discharge summary significantly improved the quality and timeliness of discharge summaries. The discharge summary comprises a vital component of the information transfer between the inpatient and outpatient settings during the vulnerable period following hospital discharge. As hospitals expand their use of EMRs, they should take advantage of opportunities to leverage functionality to improve quality and timeliness of discharge summaries.
- ,,, et al.Adverse events among medical patient after hospital discharge.CMAJ.2004;170:345–349.
- ,,,,.The incidence and severity of adverse events affecting patients after discharge from the hospital.Ann Intern Med.2003;138:161–167.
- ,,.Dissemination of discharge summaries. Not reaching follow‐up physicians.Can Fam Physician.2002;48:737–742.
- ,,,.Effect of discharge summary availability during post‐discharge visits on hospital readmission.J Gen Intern Med.2002;17:186–192.
- ,,,.General practitioner‐hospital communications: a review of discharge summaries.J Qual Clin Practice.2001;21:104–108.
- ,,,,.Quality assessment of discharge letters in a French university hospital.Int J Health Care Qual Assur.1998;11:90–95.
- ,,,,,.Deficits in communication and information transfer between hospital‐based and primary care physicians: implications for patient safety and continuity of care.JAMA.2007;297:831–841.
- ,,,,.Outpatient physicians' satisfaction with discharge summaries and perceived need for an electronic discharge summary.J Hosp Med.2006;1:317–320.
- Standard IM.6.10: Hospital accreditation standards.Oakbrook Terrace, IL:Joint Commission on Accreditation of Healthcare Organizations;2006:338–340.
- ,,,,.Assessing quality and efficiency of discharge summaries.Am J Med Qual.2005;20:337–343.
- ,,,,,.Are discharge summaries teachable? The effects of a discharge summary curriculum on the quality of discharge summaries in an internal medicine residency program.Acad Med.2006;81(10 Suppl):S5–S8.
- ,,, et al.Transition of care for hospitalized elderly patients–development of a discharge checklist for hospitalists.J Hosp Med.2006;1:354–360.
- ,.Coefficient kappa: some uses, misuses, and alternatives.Educ Psychol Meas.1981;41:687–699.
- ,,,.Dictated versus database‐generated discharge summaries: a randomized clinical trial.CMAJ.1999;160:319–326.
- ,,,.Evaluation of computer generated neonatal discharge summaries.Arch Dis Child.1991;66:433–436.
- ,,,,,.Evaluation of a computer‐generated discharge summary for patients with acute coronary syndromes.Br J Gen Pract.1998;48:1163–1164.
- ,,,.Standardized or narrative discharge summaries: Which do family physicians prefer?Can Fam Phys.1998;44:62–69.
- ,,, et al.Patient safety concerns arising from test results that return after hospital discharge.Ann Intern Med.2005;143:121–128.
- ,,,Effect of discharge summary availability during post‐discharge visits on hospital readmission.J Gen Intern Med.2002:17;186–192.
- .A piece of my mind. Copy‐and‐paste.JAMA.2006;295:2335–2336.
Preventable or ameliorable adverse events have been reported to occur in 12% of patients in the period immediately following hospital discharge.1, 2 A potential contributor to this is the inadequate transfer of clinical information at hospital discharge. The discharge summary comprises a vital component of the information transfer between the inpatient and outpatient settings. Unfortunately, discharge summaries are often unavailable at the time of follow‐up care and often lack important content.37
A growing number of hospitals are implementing electronic medical records (EMR). This creates the opportunity to standardize the content of clinical documentation and creates the potential to assemble, immediately at the time of hospital discharge, major components of a discharge summary. With enhanced communication systems, this information can be delivered in a variety of ways with minimal delay. Previously, we reported the results of a survey of medicine faculty at an urban academic medical center evaluating the timeliness and quality of discharge summaries, the perceived incidence of preventable adverse events related to suboptimal information transfer at discharge, and a needs assessment for an electronically generated discharge summary that we planned to design.8 We now report the results of the follow‐up survey of outpatient physicians and an evaluation of the quality and timeliness of the electronic discharge summary we created.
Materials and Methods
Design
We conducted a pre‐post evaluation of the quality and timeliness of discharge summaries. In the initial phase of the study, we convened an advisory board comprised of 16 Department of Medicine physicians. The advisory board gave input on needs assessment and helped to create a survey to be administered to all medicine faculty with an outpatient practice. All respondents who had at least 1 patient admitted to the hospital within the 6 months prior to the survey were eligible. The results of the initial survey were reviewed with the advisory board and an electronic discharge summary was created with their input. To evaluate its impact, we conducted a repeat survey of all medicine faculty with an outpatient practice approximately 1 year after implementation of the electronic discharge summary.
To complement data received from the outpatient physician survey, a randomly selected sample of discharge summaries from general medical services during the same 3 month period before and after implementation of the electronic discharge summary were rated by 1 of 3 board‐certified internists (D.B.E., N.K., or M.P.L.).
Setting and Participants
The study was conducted at Northwestern Memorial Hospital, a 753‐bed hospital in Chicago, IL. The study was approved by the Institutional Review Board of the Northwestern University Feinberg School of Medicine. General medical patients were admitted to 1 of 2 primary physician services during the study period: a teaching service or a nonteaching hospitalist service. Discharge summaries had traditionally been dictated by inpatient physicians and delivered to outpatient physicians by both mail and facsimile via the medical record department. A recommended template for dictated discharge summaries was provided in the paper paging directory distributed yearly to inpatient physicians.
The hospital implemented an EMR and computerized physician order entry (CPOE) system (PowerChart Millennium; Cerner Corporation, Kansas City, MO) in August 2004. Although all history and physicals and progress notes were documented in the EMR, the system did not provide a method for delivering discharge summaries performed within the EMR to outpatient physician offices. Because of this, inpatient physicians were instructed to continue to dictate discharge summaries during the initial phase of the study.
Approximately 65% of outpatient physicians at the study site used an EMR in their offices during the study. Approximately 10% of outpatient physicians used the same EMR the hospital uses, while approximately 55% used a different EMR (EPIC Hyperspace; EPIC Systems Corporation, Verona, WI). The remaining physicians did not use an EMR in their offices.
Intervention: The Electronic Discharge Summary
A draft electronic discharge summary template was created by including elements ranked as highly important by outpatient physicians in our initial survey8 and elements required by The Joint Commission.9 The draft electronic discharge summary template was reviewed by the advisory board and modifications were made with their input. We automated the insertion of specific patient data elements, such as listed allergies and home medications, into the discharge summary template. We also created an electronic reminder system to inpatient physicians for summaries not completed 24 hours after discharge.
Because the majority of physicians in our initial survey preferred discharge summaries to be delivered either by facsimile or via an EMR, we concentrated our efforts on creating reliable systems for delivery by those routes. We created logic that queried the primary care physician field within the EMR at the time the discharge summary was electronically signed. An automated process then sent the discharge summary via electronic fax to the physician listed in the primary care physician field. Because a large number of outpatient physicians used an EMR different from the hospital's, we also created a process that sent discharge summaries from the hospital EMR into patient charts within this separate EMR.
The draft electronic discharge summary template was available for use in the EMR beginning in July 2005. The final electronic discharge summary, including automated content, physician reminder for incomplete summaries, and delivery systems as described above was implemented in June 2006. Upon implementation, inpatient physicians were instructed via email announcements and group meetings to begin completing electronic discharge summaries using the EMR. Beyond these announcements, inpatient physicians did not receive any specific training with regard to the new discharge summary process. An example of the final electronic discharge summary product is available in the Appendix.
Outpatient Physician Survey
Satisfaction with timeliness and quality of discharge summaries was assessed using a 5‐point Likert scale, where 5 represented very satisfied and 1 represented very dissatisfied. We also asked respondents to estimate the number of their patients who had sustained a preventable adverse event or near miss related to suboptimal transfer of information at discharge. We defined a preventable adverse event as a preventable medical problem or worsening of an existing problem and near miss as an error that did not result in patient harm but easily could have.
The preimplementation survey, accompanied by a cover letter signed by the hospital's chief of staff, was sent out in March 2005. A postcard reminder was sent approximately 2 weeks after the initial mail survey. A second survey was sent to nonresponders 6 weeks after the initial survey. Simultaneously, the survey was also sent in web‐based format to nonresponders via email. The postimplementation survey was sent out in February 2007 using a similar survey process.
Discharge Summary Review
A random sample of discharge summaries completed before and after the implementation of the electronic discharge summary was selected for review. The sample universe consisted of all general medicine service discharges between August and November 2005, before the electronic discharge summary was implemented, and August to November 2006, after implementation. To provide a balanced comparison, the sample was further limited to only the first chronological (index) discharge of a unique patient to home self‐care or home health nursing, with length of stay between 3 and 14 days. A total of 2232 discharges in 2005 and 2570 discharges in 2006 met these criteria. The discharge summary review sample was designed to randomly select approximately 100 discharge summaries meeting the criteria above within each study year, to produce an approximate 200‐record analysis sample. Each of the 3 physician reviewers was assigned to complete an approximately equal number of the 200 primary reviews.
Physician reviewers recorded whether the discharge summary was dictated versus done electronically, the length of the discharge summary (in words), the number of days from discharge to discharge summary completion, the type of service the patient was discharged from, and the author type (medical student, intern, resident, or attending). Physicians reviewers also assessed the overall clarity of discharge summaries using a 5‐point ordinal scale (1 = unintelligible; 2 = hard to read; 3 = neutral; 4 = understandable; and 5 = lucid).
Prior studies have evaluated the quality of discharge summaries using scoring tools created by the investigators.10, 11 We created our own discharge summary scoring tool based on these prior studies, recommendations from the literature,12 and the findings from our initial survey.8 We pilot‐tested the scoring tool and made minor revisions prior to the study. The final scoring tool consisted of 16 essential elements. Reviewers assessed whether each of the 16 essential elements was present, absent, or not applicable. A Discharge Summary Completeness Score was calculated by the number of the 16 essential elements that were rated as present divided by the number of applicable elements for each discharge summary, multiplied by 100 to produce a completeness percentage.
To assess interrater reliability, reviewers were assigned to independently complete second, duplicate reviews of approximately 90 summaries (30 per reviewer). The duplicate review sample was designed to produce approximately 45 paired re‐reviews in each year for reliability assessment. A final sample of 196 available summaries was completed for the main analysis and 174 primary and duplicate reviews were used to establish interrater reliability across 87 reviewer pairs.
Data Analysis
Physician characteristics, including specialty, faculty appointment type, and year of medical school graduation were provided by the hospital's medical staff office. Physician characteristics from before and after the implementation of the electronic discharge summary were compared using chi‐square tests. Likert scale ratings of physician satisfaction with the timeliness and quality of discharge summaries were compared using t‐tests. The proportion of physicians reporting 1 or more preventable adverse event or near miss before the implementation of the electronic discharge summary was compared to postimplementation proportions using chi‐square tests. In addition, we performed multivariate logistic regression to examine the likelihood of physicians reporting any preventable adverse event or near miss related to suboptimal information transfer. The regression models tested the likelihood of 1 or more preventable adverse event or near miss before versus after the implementation of the electronic discharge summary, controlling for physician characteristics and their number of hospitalized patients in the previous 6 months.
The proportions of discharge summary elements found to be present, the proportion of discharge summaries completed within 3 days, and discharge summary readability ratings before and after the implementation of the electronic discharge summary were compared using chi‐square tests; length in words was compared using t‐tests. Preimplementation and postimplementation Discharge Summary Completeness Scores were compared using the Mann‐Whitney U test. Discharge summary score interrater reliability was assessed using the Brennan‐Prediger Kappa for individual elements.13
Results
Outpatient Physician Survey
Physician Characteristics
Two hundred and twenty‐six of 416 (54%) eligible outpatient physicians completed the baseline survey and 256 of 397 (64%) completed the postimplementation survey. As shown in Table 1, there were no significant differences in specialty, faculty appointment type, or number of patients hospitalized between respondents to the survey before compared to respondents after the implementation of the electronic discharge summary. The number of respondents graduating medical school in 1990 or later was higher after implementation of the electronic discharge summary; however, this result was of borderline statistical significance.
| Preelectronic Discharge Summary (n = 226) | Postelectronic Discharge Summary (n = 256) | P Value | |
|---|---|---|---|
| |||
| Practice Type | 0.23 | ||
| Generalist, n (%) | 127 (56.2) | 130 (50.8) | |
| Specialist, n (%) | 99 (43.8) | 126 (49.2) | |
| Faculty Appointment | 0.38 | ||
| Full‐time, n (%) | 104 (46.0) | 128 (50.0) | |
| Affiliated, n (%) | 122 (54.0) | 128 (50.0) | |
| Year of medical school graduation* | 0.06 | ||
| Before 1990, n (%) | 128 (57.4) | 124 (48.8) | |
| 1990 or later, n (%) | 95 (42.6) | 130 (51.2) | |
| Number of patients hospitalized (last 6 months) | 0.56 | ||
| 1‐4, n (%) | 15 (7.9) | 24 (12.0) | |
| 5‐10, n (%) | 62 (32.5) | 66 (33.0) | |
| 11‐19, n (%) | 35 (18.3) | 33 (16.5) | |
| 20 or more, n (%) | 79 (41.4) | 77 (38.5) | |
Timeliness and Content
Changes in outpatient physician satisfaction with the timeliness and quality of discharge summaries are summarized in Table 2. Satisfaction with the timeliness and quality of discharge summarizes improved significantly after the implementation of the electronic discharge summary (mean standard deviation [SD] timeliness rating, 2.59 1.02 versus 3.34 1.09; P < 0.001, mean quality rating 3.04 0.93 versus 3.64 0.99; P < 0.001).
| Likert Scale Mean Score (SD)* | |||
|---|---|---|---|
| Preelectronic Discharge Summary | Postelectronic Discharge Summary | P Value | |
| |||
| Timeliness of the discharge summary | 2.59 (1.02) | 3.34 (1.09) | <0.001 |
| Quality of the discharge summary | 3.04 (0.93) | 3.64 (0.99) | <0.001 |
Medical Error
The effect of the electronic discharge summary on perceived near misses and preventable adverse events is summarized in Table 3. Fewer outpatient physicians felt that 1 or more of their patients hospitalized in the preceding 6 months sustained a near miss due to suboptimal transfer of information after the implementation of the electronic discharge summary (65.7% vs. 52.9%, P = 0.008). Similarly, fewer outpatient physicians felt that 1 or more of their patients hospitalized in the preceding 6 months sustained a preventable adverse event due to suboptimal transfer of information after the implementation of the electronic discharge summary (40.7% vs. 30.2%, P = 0.02). In multivariate logistic regression analyses controlling for physician characteristics and their number of hospitalized patients in the previous 6 months, there was a statistically significant 40% reduction in the odds of a reported near miss (adjusted odds ratio [OR] = 0.60, P = 0.02). Although not quite statistically significant, there was a 33% reduction in the odds of a reported preventable adverse event (OR = 0.67, P = 0.08) after the implementation of the electronic discharge summary.
| Preelectronic Discharge Summary | Postelectronic Discharge Summary | P Value | |
|---|---|---|---|
| |||
| Near miss* | |||
| Number (%) reporting 1 | 142 (65.7) | 108 (52.9) | |
| Crude odds ratio | Ref. | 0.57 | 0.008 |
| Adjusted odds ratio | Ref. | 0.60 | 0.02 |
| Preventable adverse event | |||
| Number (%) reporting 1 | 88 (40.7) | 62 (30.2) | |
| Crude odds ratio | Ref. | 0.63 | 0.03 |
| Adjusted odds ratio | Ref. | 0.67 | 0.08 |
Discharge Summary Review
Discharge Summary Characteristics
One hundred and one discharge summaries before implementation of the electronic discharge summary were compared to 95 discharge summaries produced the following year. Characteristics of discharge summaries before and after the implementation of the electronic discharge summary are summarized in Table 4. A large number of discharge summaries (52.5%) were already being typed into the EMR in 2005, prior to the implementation of our final electronic discharge summary product. The number of dictated discharge summaries decreased from 47.5% to 10.5% after implementation of the final electronic discharge summary product (P < 0.001). Discharge summaries were similar in length before and after the implementation of the electronic discharge summary. A higher percentage of discharge summaries were completed within 3 days of discharge after implementation of the electronic discharge summary; however, this result was of borderline statistical significance (59.4% vs. 72.6%; P = 0.05). The type of service from which patients were discharged and the distribution of author types were similar after the implementation of the electronic discharge summary.
| Number (%) or MeanSD | P Value | ||
|---|---|---|---|
| Preelectronic Discharge Summary (n = 101) | Postelectronic Discharge Summary (n = 95) | ||
| Dictated, n (%) | 48 (47.5) | 10 (10.5) | <0.001 |
| Length in words, mean SD | 785 407 | 830 389 | 0.43 |
| Completed within 3 days, n (%) | 60 (59.4) | 69 (72.6) | 0.05 |
| Type of service, n (%) | 0.29 | ||
| Teaching service | 63 (62.4) | 66 (69.5) | |
| Nonteaching hospitalist service | 38 (37.6) | 29 (30.5) | |
| Author type, n (%) | 0.62 | ||
| Fourth year medical student | 13 (12.9) | 13 (13.7) | |
| Intern | 31 (30.7) | 37 (38.9) | |
| Resident | 19 (18.8) | 15 (15.8) | |
| Attending | 38 (37.6) | 30 (31.6) | |
Because a large percentage of discharge summaries were already being done electronically in 2005, we evaluated the timeliness of dictated discharge summaries compared to electronic discharge summaries across both periods combined (preimplementation and postimplementation of the electronic discharge summary). A higher percentage of electronic discharge summaries were completed within 3 days of discharge as compared to dictated discharge summaries (44.8% versus 74.1%; P < 0.001).
Discharge Summary Completeness Score
The presence or absence of discharge summary elements before and after the implementation of the electronic discharge summary is shown in Table 5. Several elements of the discharge summary were present more often after the implementation of the electronic discharge summary. Specific improvements included discussion of follow‐up issues (52.0% versus 75.8%; P = 0.001, = 0.78), pending test results (13.9% vs. 46.3%; P < 0.001, = 0.92), and information provided to the patient and/or family (85.1% vs. 95.8%; P = 0.01, = 0.91). Significant laboratory findings were present less often after implementation of the electronic discharge summary (66.0% versus 51.1%; P = 0.04, = 0.84). The Discharge Summary Completeness Score was higher after the implementation of the electronic discharge summary (mean 74.1 versus 80.3, P = 0.007). Dictated discharge summaries had a significantly lower Discharge Summary Completeness Score compared to discharge summaries done electronically (71.3 vs. 79.6, P = 0.002) across both periods combined.
| Number (%) of Content Items Present* | P Value | Brennan‐Prediger Kappa | ||
|---|---|---|---|---|
| Preelectronic Discharge Summary (n = 101) | Postelectronic Discharge Summary (n = 95) | |||
| ||||
| Dates of admission and discharge | 96 (95.0) | 94 (98.9) | 0.11 | 1.0 |
| Reason for hospitalization | 100 (99.0) | 94 (100) | 0.33 | 1.0 |
| Significant findings from history and exam | 78 (77.2) | 65 (68.4) | 0.16 | 0.26 |
| Significant laboratory findings | 64 (66.0) | 47 (51.1) | 0.04 | 0.84 |
| Significant radiological findings | 67 (75.3) | 71 (81.6) | 0.31 | 0.89 |
| Significant findings from other tests | 41 (63.1) | 40 (71.4) | 0.33 | 0.88 |
| List of procedures performed | 45 (81.8) | 35 (77.8) | 0.77 | 0.99 |
| Procedure report findings | 49 (80.3) | 43 (78.2) | 0.61 | 0.92 |
| Stress test report findings | 7 (100) | 3 (100) | N/A | 1.0 |
| Pathology report findings | 11 (39.3) | 3 (30.0) | 0.60 | 0.91 |
| Discharge diagnosis | 89 (88.1) | 86 (93.5) | 0.20 | 0.86 |
| Condition at discharge | 81 (81.0) | 80 (85.1) | 0.45 | 0.76 |
| Discharge medications | 88 (87.1) | 88 (93.6) | 0.13 | 0.79 |
| Follow‐up issues | 52 (52.0) | 72 (75.8) | 0.001 | 0.78 |
| Pending test results | 14 (13.9) | 44 (46.3) | <0.001 | 0.92 |
| Information provided to patient and/or family, as appropriate | 86 (85.1) | 91 (95.8) | 0.01 | 0.91 |
| Discharge Summary Completeness Score (percent present all applicable items) | 74.1 | 80.3 | 0.007 | |
Significantly more discharge summaries were rated as understandable or lucid after the implementation of the electronic discharge summary (41.6% vs. 59.0%; P = 0.02). In both periods combined, dictated discharge summaries were rated as understandable or lucid less often than electronic discharge summaries (34.5% vs. 56.5%; P < 0.001).
Discussion
Our study found that an electronic discharge summary was well accepted by inpatient physicians and significantly improved the quality and timeliness of discharge summaries. Prior studies have shown that the use of electronically entered discharge summaries improved the timeliness of discharge summaries.1416 However, the discharge summaries used in these studies required manual input of data into a computer system separate from the patient's medical record. To our knowledge, this is the first study to report the impact of discharge summaries generated from an EMR. Leveraging the EMR, we were able to automate the insertion of specific patient data elements, streamline delivery, and create an electronic reminder system to inpatient physicians for summaries not completed 24 hours after discharge.
Prior research has shown that the quality of discharges summaries is improved with the use of standardized content.10, 17 Using a standardized template for the electronic discharge summary, we likewise demonstrated improved quality of discharge summaries. Key discharge summary elements, specifically discussion of follow‐up issues, pending test results, and information provided to the patient and/or family, were present more reliably after the implementation of the electronic discharge summary. The importance of identifying pending test results is underscored by a recent study showing that many patients are discharged from hospitals with test results still pending, and that physicians are often unaware when results are abnormal.18 One discharge summary element, significant laboratory findings, was present less often after the implementation of the electronic discharge summary. Our template did not designate significant laboratory findings under a separate heading. Instead, we used a heading entitled Key Results (labs, imaging, pathology). Physicians completing the discharge summaries may have prioritized the report of imaging and pathology results in this section. A simple revision of our discharge summary template to include a separate heading for significant laboratory findings may result in improvement in this regard.
Timeliness of discharge summaries was improved in our study, but remained less than optimal. Although nearly three‐quarters of electronic discharge summaries were completed within 3 days of discharge, our ultimate goal is to have 100% of discharge summaries completed within 3 days. This is especially important for complicated patients requiring outpatient follow‐up soon after discharge. We are currently in the process of designing further modifications to the electronic discharge summary completion process. One modification that may be beneficial is the automation of additional patient specific data elements into the discharge summary. We also plan to link performance of medication reconciliation, completion of patient discharge instructions, and completion of the discharge summary into an integrated set of activities performed in the EMR prior to patient discharge.
We found that fewer outpatient physicians reported 1 or more of their patients having a preventable adverse event or near miss as a result of suboptimal transfer of information at discharge after the implementation of the electronic discharge summary. Although we did not measure preventable adverse events directly in our study, this is an important finding in light of the large number of patients who sustain preventable adverse events after hospital discharge1, 2 and prior research showing that the absence of discharge summaries at postdischarge follow‐up visits increased the risk for hospital readmission.19
We had wondered what effect the electronic discharge summary would have on the length and clarity of discharge summaries. A published commentary suggested that notes performed in EMRs were inordinately long and often difficult to read.20 We were pleased to discover that electronic discharge summaries were similar in length to previous discharge summaries and were rated higher with regard to clarity.
Our study has several limitations. First, many inpatient physicians began to use electronic discharge summaries prior to our creation of the final electronic discharge summary product. We had explicitly instructed physicians to continue to dictate discharge summaries in the first phase of our study. The fact that physicians quickly adopted the practice of completing discharge summaries electronically suggests that they preferred this method for completion and may help to explain the improvement in timeliness. A second limitation, as previously mentioned, is that our study did not measure adverse events directly. Instead, we asked outpatient physicians to estimate the number of their patients discharged in the last 6 months who had sustained a preventable adverse event or near miss related to suboptimal information transfer at discharge. We had limited space in the survey to define the meaning of a preventable adverse event; therefore, the description in the survey does not exactly match previous definitions.1, 2 Finally, the ordinal scale used to assess clarity of discharge summaries has not been previously validated.
In conclusion, the use of an electronic discharge summary significantly improved the quality and timeliness of discharge summaries. The discharge summary comprises a vital component of the information transfer between the inpatient and outpatient settings during the vulnerable period following hospital discharge. As hospitals expand their use of EMRs, they should take advantage of opportunities to leverage functionality to improve quality and timeliness of discharge summaries.
- ,,, et al.Adverse events among medical patient after hospital discharge.CMAJ.2004;170:345–349.
- ,,,,.The incidence and severity of adverse events affecting patients after discharge from the hospital.Ann Intern Med.2003;138:161–167.
- ,,.Dissemination of discharge summaries. Not reaching follow‐up physicians.Can Fam Physician.2002;48:737–742.
- ,,,.Effect of discharge summary availability during post‐discharge visits on hospital readmission.J Gen Intern Med.2002;17:186–192.
- ,,,.General practitioner‐hospital communications: a review of discharge summaries.J Qual Clin Practice.2001;21:104–108.
- ,,,,.Quality assessment of discharge letters in a French university hospital.Int J Health Care Qual Assur.1998;11:90–95.
- ,,,,,.Deficits in communication and information transfer between hospital‐based and primary care physicians: implications for patient safety and continuity of care.JAMA.2007;297:831–841.
- ,,,,.Outpatient physicians' satisfaction with discharge summaries and perceived need for an electronic discharge summary.J Hosp Med.2006;1:317–320.
- Standard IM.6.10: Hospital accreditation standards.Oakbrook Terrace, IL:Joint Commission on Accreditation of Healthcare Organizations;2006:338–340.
- ,,,,.Assessing quality and efficiency of discharge summaries.Am J Med Qual.2005;20:337–343.
- ,,,,,.Are discharge summaries teachable? The effects of a discharge summary curriculum on the quality of discharge summaries in an internal medicine residency program.Acad Med.2006;81(10 Suppl):S5–S8.
- ,,, et al.Transition of care for hospitalized elderly patients–development of a discharge checklist for hospitalists.J Hosp Med.2006;1:354–360.
- ,.Coefficient kappa: some uses, misuses, and alternatives.Educ Psychol Meas.1981;41:687–699.
- ,,,.Dictated versus database‐generated discharge summaries: a randomized clinical trial.CMAJ.1999;160:319–326.
- ,,,.Evaluation of computer generated neonatal discharge summaries.Arch Dis Child.1991;66:433–436.
- ,,,,,.Evaluation of a computer‐generated discharge summary for patients with acute coronary syndromes.Br J Gen Pract.1998;48:1163–1164.
- ,,,.Standardized or narrative discharge summaries: Which do family physicians prefer?Can Fam Phys.1998;44:62–69.
- ,,, et al.Patient safety concerns arising from test results that return after hospital discharge.Ann Intern Med.2005;143:121–128.
- ,,,Effect of discharge summary availability during post‐discharge visits on hospital readmission.J Gen Intern Med.2002:17;186–192.
- .A piece of my mind. Copy‐and‐paste.JAMA.2006;295:2335–2336.
Copyright © 2009 Society of Hospital Medicine
Hospitalist–Care Coordinator Team
Many hospitalists work with clinical coordinators and case managers.13 The descriptions of these roles often overlap4 and commonly include activities such as obtaining medical records, expediting tests and procedures, coordinating the plan of care with other health care providers, assessing postdischarge needs, completing discharge paperwork, and arranging follow‐up visits.2, 5, 6 Despite the potential to improve patient care and hospital efficiency, few studies have formally evaluated the impact of these roles. Moher et al. found that adding a clinical coordinator to a general medical team decreased length of stay (LOS) and improved patient satisfaction.5 However, this study was conducted at a time when the LOS was routinely longer than it is today. Forster et al. found that adding a clinical coordinator to a general medical team resulted in improved patient satisfaction but did not reduce length of stay or risk of adverse events occurring following hospital discharge.6 Both these studies evaluated the impact of adding a clinical coordinator to resident‐covered medical teams. Yet many hospitalists deliver care without residents, limiting the generalizability of the findings from these studies.
To date, no studies have evaluated the impact of clinical coordinators, case managers, or other nonphysician providers on the hospitalist work experience. This is surprising, as hospital medicine group leaders list daily workload and work hours among their top concerns.7 Clinical coordinators have the potential to improve patient care and hospital efficiency while simultaneously improving the experience of the hospitalists with whom they work. We conducted this study to evaluate the impact of a hospitalistcare coordinator team on hospitalist work experience, patient satisfaction, and hospital efficiency.
METHODS
Setting
The study was conducted on the hospitalist service at Northwestern Memorial Hospital (NMH), a 753‐bed hospital in Chicago, Illinois. The hospitalist service is staffed by 5 hospitalists on duty at a time. Hospitalists work without residents and are on service for 7 consecutive days, usually followed by 7 consecutive days off. Daytime admissions are distributed among all hospitalists on duty in a consecutive fashion. A night float hospitalist performs admissions and all cross‐cover activities from 7:00 PM until 7:00 AM. Nighttime admissions are distributed to day hospitalists based on each hospitalist's daily census.
Study Design
Funding was provided by the hospital for a 12‐week study, and hospital administrative leaders collaborated as part of the research team. During each of the 12 weeks from September 2006 through November 2006, half the hospitalists on duty each week were randomly assigned to work with a hospitalist care coordinator (HCC) in a team approach. Hospitalists not assigned to work with a hospitalist care coordinator continued to work in their usual fashion, which included working with unit‐based care coordinators (UCCs). UCCs follow all patients on a 30‐bed medicine unit but generally do not round with physicians. HCCs performed all the activities that UCCs perform but also performed additional key activities (see Table 1) and worked in a team approach with their hospitalist. Unit‐based social workers and discharge planners were available for all hospitalists during the study. During each day patients were admitted consecutively to one of the hospitalists on service, regardless of their assignment to work with or without an HCC. Similarly, night admissions were distributed to hospitalists without regard to their assignment to work with or without an HCC.
| Activity type | Activities performed by both UCCs and HCCs | Additional activities performed by HCCs only |
|---|---|---|
| Care coordination | Document the interdisciplinary plan of care | Ensure collaboration in formulating the plan of care |
| Obtain outside medical records | ||
| Inform staff nurse of stat orders during rounds | ||
| Obtain certain test results (eg, preliminary echo reports) | ||
| Patient and family needs | Address patient and family concerns | Proactively identify and address patient and family concerns |
| Schedule family meetings | ||
| Efficiency of care delivery | Remediate barriers that impede plan of care and/or discharge | Identify barriers that impede plan of care |
| Identify and document avoidable days | Ensure tests are scheduled | |
| Discharge process | Coordinate discharge plans with social work and discharge planner | Schedule and confirm follow‐up appointments |
| Initiate discharge instructions | ||
| Write discharge prescriptionsverified and signed by physician | ||
| Review discharge instructions with patient and/or family |
HospitalistCare Coordinator Team
Four HCCs were used in this study. All 4 were registered nurses with specialized training in case management. Prior to the start of the study, the investigators held meetings with hospitalists and the HCCs to describe this new role, the work flow for the hospitalistcare coordinator team, and work activities appropriate for the HCC. Activities related to the discharge process were emphasized as a key feature of the HCC role. Hospitalists and HCCs were instructed to round together as a team each morning. They were advised to collaborate on the daily plan of care and assign specific activities for each to accomplish. During the study weekly meetings were held with the HCCs, the hospitalists with whom they were finishing the week, and the hospitalists with whom they were scheduled to work during the upcoming week. The purpose of these meetings was to ensure that the work flow and work activities were optimal.
Outcome Measures
At the completion of each week, all hospitalists on service were given an anonymous Web‐based survey designed to assess their satisfaction and perceived work efficiency. Hospitalists were asked to rate the efficiency of various work activities during the preceding week on a 5 point Likert scale (1 = very inefficient, 2 = somewhat inefficient, 3 = neutral, 4 = somewhat efficient, 5 = very efficient). Hospitalists who had worked with an HCC were also asked whether they thought working with an HCC improved their efficiency and increased their job satisfaction. We postulated that patient satisfaction with the discharge process might improve with use of the hospitalistHCC team. Therefore, patient satisfaction was assessed by telephone interviews conducted 714 days after discharge. Because of resource limitations, we were only able to interview patient during the second half of the study. Patients were asked to rate their satisfaction with the clarity of verbal and written discharge instructions as well as their overall satisfaction with hospital discharge using a 10‐point Likert scale (from 1 = least satisfied to 10 = most satisfied). Hospital databases provided information on patient demographics, LOS, and cost.
Data Analysis
All analyses were conducted using Stata version 9.0 (StataCorp LP, College Station, TX). Patient characteristics were compared using chi‐square and t tests. Responses to the hospitalist survey for the weeks when they worked independently and the weeks when they worked as a hospitalistHCC team were compared using the Wilcoxon rank sum test. To adjust for the clustering of responses by physicians (ie, individual physicians completed more than 1 survey), we used linear regression and the cluster option. The results were very similar, and only the P values from the Wilcoxon rank sum test are presented. Unadjusted LOS and cost were compared using the Wilcoxon rank sum test. We also conducted multivariate linear regressions using log‐transformed LOS and log‐transformed cost as dependent variables. The independent variable was the team type (whether patients were cared for by a hospitalistHCC team or a hospitalist working independently); age, sex, ethnicity, payer type, and diagnosis‐related group (DRG) weight were included as covariates, and P values were adjusted for physician clustering. We hypothesized a priori that the HCC would have no effect on the LOS of or cost for patients whose hospitalizations were very short. We therefore conducted secondary analyses in which we eliminated patients with an LOS of 1 day or less.
RESULTS
There were 356 patients cared for by hospitalistHCC teams and 337 patients cared for by control hospitalists. Of the 60 weeks of hospitalist service of the study, hospitalistHCC teams accounted for 31 weeks (52%) and control hospitalists for 29 weeks (48%). Patients cared for by the hospitalistHCC teams were similar in age, sex, ethnicity, payer type, and DRG weight to those cared for by control hospitalists (see Table 2).
| HospitalistHCC team | Control | P value | |
|---|---|---|---|
| n (%) or mean SD | |||
| Patients, n (%) | 356 (51.4%) | 337 (48.6%) | |
| Age (years) | 59.3 18.6 | 59.0 20.1 | .86 |
| Women (%) | 190 (53.4%) | 192 (57.0%) | .34 |
| Ethnicity | .74 | ||
| White | 182 (51.1%) | 174 (51.6%) | |
| Black | 111 (31.2%) | 114 (33.8%) | |
| Hispanic | 23 (6.5%) | 21 (6.2%) | |
| Asian | 5 (1.4%) | 4 (1.2%) | |
| Other | 35 (9.8%) | 24 (7.1%) | |
| Payer | .47 | ||
| Medicare | 177 (49.7%) | 168 (49.9%) | |
| Private | 76 (21.4%) | 69 (20.5%) | |
| Medicaid | 43 (12.1%) | 44 (13.1%) | |
| Capitated | 43 (12.1%) | 31 (9.2%) | |
| Other | 17 (4.8%) | 25 (7.4%) | |
| Diagnosis‐related group weight | 1.1 0.8 | 1.2 0.8 | .31 |
Sixty surveys were completed by hospitalists at the end of their week on service (response rate 100%). Of the 31 responses from hospitalists completing a hospitalistHCC team week, 28 (90%) reported that working with an HCC improved their efficiency and 28 (90%) that working with an HCC improved their job satisfaction. The hospitalists indicated that working with an HCC significantly improved the efficiency of most of their activities (see Table 3). Specifically, activities related to communication with nurses and patients and activities involving discharge planning and execution were improved with the use of an HCC. As would be expected, certain other activities did not improve. For example, there were no differences between the groups in the perceived efficiency of performing histories and physicals or placing admission orders. For activities that were significantly different, the Wilcoxon rank sum test and linear regression analysis adjusting for physician clustering showed identical results.
| HospitalistHCC Team | Control | P value | |
|---|---|---|---|
| Mean score SD* | |||
| |||
| Performing histories and physicals | 3.94 0.77 | 3.93 0.84 | .98 |
| Performing medication reconciliation | 3.35 1.08 | 2.03 1.18 | < .001 |
| Placing admission orders | 3.94 0.73 | 4.00 0.87 | .57 |
| Communicating with nurses | 4.45 0.68 | 3.14 1.09 | < .001 |
| Communicating with consultants | 3.65 0.75 | 3.34 1.04 | .25 |
| Communicating with patients | 4.42 0.62 | 3.62 1.01 | < .001 |
| Communicating with families | 4.32 0.70 | 2.89 1.14 | < .001 |
| Coordinating discharge plans | 4.74 0.51 | 2.76 1.18 | < .001 |
| Making/updating sign‐out | 3.55 0.72 | 3.49 0.83 | .55 |
| Making discharge instructions | 4.29 0.74 | 3.10 1.01 | < .001 |
| Going over discharge instructions | 4.48 0.57 | 2.76 1.15 | < .001 |
| Writing discharge prescriptions | 3.87 0.67 | 2.52 1.21 | < .001 |
| Arranging follow‐up appointments | 4.19 0.75 | 2.03 1.09 | < .001 |
Seventy‐one of 196 eligible patients (36%) completed the discharge satisfaction interview. Of the 71 patients interviewed, 44 (62%) were cared for by hospitalistHCC teams and 27 (38%) were cared for by control hospitalists. Patient satisfaction with the clarity of the verbal and written discharge instructions and overall satisfaction with hospital discharge was similar between the 2 groups (see Table 4).
| HospitalistHCC Team (n = 44) | Control (n = 27) | P value | |
|---|---|---|---|
| Mean score (SD)* | |||
| |||
| Clarity of verbal discharge instructions | 8.86 ( 2.31) | 8.44 ( 2.63) | 0.52 |
| Clarity of written discharge instructions | 8.95 ( 2.30) | 8.93 ( 2.54) | 0.78 |
| Overall satisfaction with hospital discharge | 8.57 ( 2.42) | 8.37 ( 2.90) | 0.94 |
The unadjusted mean LOS for patients cared for by hospitalistHCC teams was 4.70 4.15 days compared with 5.07 3.99 days for patients cared for by control hospitalists (P = .005; see Table 5). The unadjusted mean cost for patients cared for by hospitalistHCC teams was $10,052.96 $11,708.73 compared with $11,703.19 $20,455.78 for patients cared for by control hospitalists (P = .008). In multivariate analysis using age, sex, ethnicity, payer type, and DRG weight as independent variables and adjusting for physician clustering, LOS remained lower for patients cared for by hospitalistHCC teams; however, this result was not statistically significant (0.28 days, P = .17). Similar multivariate regression analysis showed a trend toward lower cost for patients cared for by the hospitalistHCC teams (585.62, P = .15).
| Unadjusted mean (SD) | P value for unadjusted difference* | Adjusted difference with hospitalistHCC team | P value for adjusted difference | |
|---|---|---|---|---|
| ||||
| Length of stay | ||||
| HospitalistHCC teams | 4.70 (4.15) | .005 | 0.28 | .17 |
| Control hospitalists | 5.07 (3.99) | |||
| Cost | ||||
| HospitalistHCC teams | 10,052.96 (11,708.73) | .008 | 585.62 | .15 |
| Control hospitalists | 11,703.19 (20,455.78) | |||
DISCUSSION
Our study found that hospitalists working in a team approach with an HCC rated the efficiency of their daily work and their job satisfaction significantly higher than did control hospitalists. Specific areas of improved efficiency included communication activities and activities related to hospital discharge. A prior study conducted by our group found that hospitalists spend a lot of time on indirect patient care activities such as communication and activities related to the discharge process, while spending relatively little time on direct patient care.8 Improving the efficiency of indirect patient care activities of hospitalists is likely to improve their job satisfaction. The importance of improving hospitalist workload and job satisfaction is underscored by the relatively high number of hospitalists at risk for burnout9 and the growing concern about daily workload among hospital medicine group leaders.7
Patient satisfaction was not significantly affected by the use of the hospitalistHCC team in our study. A priori, we postulated that patient satisfaction with the discharge process might improve with the use of the hospitalistHCC team. We therefore limited survey questions to assessing only satisfaction with hospital discharge rather than other aspects of patient hospital care. A recent study reported that patients rated the quality of discharge instructions significantly lower than they rated the overall quality of their hospital stay.10 However, the patients in our study gave high ratings to both discharge instructions and overall satisfaction with hospital discharge. This may explain why we were unable to detect a difference. Our study was limited by the relatively small number of patients we were able to contact to assess satisfaction. Previous studies evaluating the impact of care coordinators either did not assess patient satisfaction with discharge5 or found no difference in satisfaction with hospital discharge.6
Although our study did not find a difference in patient satisfaction with the discharge process, we believe the hospitalistHCC model has the potential to complement efforts to reduce the risk of adverse events as patients transition out of the hospital. It has been reported that 12% of patients have a preventable or ameliorable adverse event in the period immediately following hospital discharge.11, 12 Although Forster et al. did not find a reduction in the risk of adverse events with the addition of a clinical coordinator to a general medical team, they noted incongruence between the coordinator's role and the outcomes measured.6 Similarly, we would need to modify the role of the HCC from a position designed mainly to improve efficiency to one that complements efforts to improve the quality of the discharge process. Possible ways to enhance the HCC role in this regard include increasing the emphasis on and training in patient education skills. Several recently published articles have emphasized the need to redesign the discharge process in an effort to reduce the risk of adverse events following hospital discharge.1315 A modified HCC role might be an essential feature of a redesigned multidisciplinary discharge process.
We were unable to demonstrate improved efficiency for the hospital. Although LOS and cost were lower for patients cared for by the hospitalistHCC teams, the difference was not statistically significant. One possible explanation for why we did not observe a larger reduction in LOS is that our hospitalist service had a lower‐than‐average patient volume during the study period. The lower volume mirrored an unanticipated dip in hospital volume during the same period. Specifically, our service normally discharges an average of 338 patients per month, but during the study period we discharged an average of 235 patients per month. A potential LOS and cost benefit may have been attenuated by the relatively low volume, as hospitalists had ample time to dedicate to communication and coordination of discharge plans.
Our study had several limitations. It was conducted on a nonteaching hospitalist service at a single site. Hospitalist practices vary widely in their staffing and scheduling models. As previously mentioned, we were only able to perform patient satisfaction surveys during the second half of the study period. In addition, hospitalistHCC team patients made up a larger percentage of the patient survey responses (62%) than did control hospitalist patients (38%). This may have affected our ability to detect differences in satisfaction with the hospital discharge process. As also previously noted, our patient volume was lower than normal during the study period. We believe that a higher volume would have magnified differences in hospitalists' perceived efficiency and perhaps resulted in significant improvements in LOS and cost. Finally, the hospital provided funding for only a 12‐week study. This limited our sample size and the power of the study to detect important differences. It is possible that a larger sample size and/or longer study period may have been able to demonstrate a statistically significant improvement in LOS and cost.
Our findings are of particular importance in light of the persistent concerns about hospitalist workload and job satisfaction. Although many hospitalists work with clinical coordinators and case managers, we believe that having the formal structure of a hospitalistcare coordinator team was the key element to improving hospitalist efficiency and satisfaction. We hope that our study is a precursor to research evaluating models of delivering hospital care and their impact on hospitalist work experience, hospital efficiency, and patient outcomes.
- .Innovations in the management of hospitalized patients.Nurse Pract.2006;Suppl:2–3.
- ,.Hospitalists and case managers: the perfect partnership.Lippincotts Case Manag.2004;9:280–286.
- ,.Productive interdisciplinary team relationships: the hospitalist and the case manager.Lippincotts Case Manag.2006;11:160–164.
- ,,.Care coordinator—blending roles to improve patient outcomes.J Nurs Manage.1997;28:49–52.
- ,,,.Effects of a medical team coordinator on length of hospital stay.Can Med Assoc J.1992;146:511–515.
- ,,, et al.Effect of a nurse team coordinator on outcomes for hospitalized medicine patients.Am J Med.2005;118:1148–1153.
- Society of Hospital Medicine. Available at: http://www.hospitalmedicine.org/Content/NavigationMenu/ResourceCenter/Surveys/Surveys1.htm. Accessed April 2,2007.
- ,,.How hospitalists spend their time: insights on efficiency and safety.J Hosp Med.2006;1:88–93.
- ,,,,.Characteristics and work experiences of hospitalists in the United States.Arch Intern Med.2001;161:851–858.
- ,,,,,.Patient perception of quality in discharge instruction.Patient Educ Couns.2005;59:56–68.
- ,,, et al.Adverse events among medical patient after hospital discharge.Can Med Assoc J.2004;170:345–349.
- ,,,,.The incidence and severity of adverse events affecting patients after discharge from the hospital.Ann Intern Med.2003;138:161–167.
- ,.Lost in transition: challenges and opportunities for improving the quality of transitional care.Ann Intern Med.2004;141:533–536.
- ,,, et al.Transition of care for hospitalized elderly patients—development of a discharge checklist for hospitalists.J Hosp Med.2006;1:354–360.
- ,,, et al. Re‐engineering the hospital discharge—an example of a multifaceted process evaluation. Advances in Patient Safety: From Research to Implementation. Vol.2,Concepts and Methodology. AHRQ publication 05‐0021‐2.Rockville, MD:AHRQ;2005. p379–394.
Many hospitalists work with clinical coordinators and case managers.13 The descriptions of these roles often overlap4 and commonly include activities such as obtaining medical records, expediting tests and procedures, coordinating the plan of care with other health care providers, assessing postdischarge needs, completing discharge paperwork, and arranging follow‐up visits.2, 5, 6 Despite the potential to improve patient care and hospital efficiency, few studies have formally evaluated the impact of these roles. Moher et al. found that adding a clinical coordinator to a general medical team decreased length of stay (LOS) and improved patient satisfaction.5 However, this study was conducted at a time when the LOS was routinely longer than it is today. Forster et al. found that adding a clinical coordinator to a general medical team resulted in improved patient satisfaction but did not reduce length of stay or risk of adverse events occurring following hospital discharge.6 Both these studies evaluated the impact of adding a clinical coordinator to resident‐covered medical teams. Yet many hospitalists deliver care without residents, limiting the generalizability of the findings from these studies.
To date, no studies have evaluated the impact of clinical coordinators, case managers, or other nonphysician providers on the hospitalist work experience. This is surprising, as hospital medicine group leaders list daily workload and work hours among their top concerns.7 Clinical coordinators have the potential to improve patient care and hospital efficiency while simultaneously improving the experience of the hospitalists with whom they work. We conducted this study to evaluate the impact of a hospitalistcare coordinator team on hospitalist work experience, patient satisfaction, and hospital efficiency.
METHODS
Setting
The study was conducted on the hospitalist service at Northwestern Memorial Hospital (NMH), a 753‐bed hospital in Chicago, Illinois. The hospitalist service is staffed by 5 hospitalists on duty at a time. Hospitalists work without residents and are on service for 7 consecutive days, usually followed by 7 consecutive days off. Daytime admissions are distributed among all hospitalists on duty in a consecutive fashion. A night float hospitalist performs admissions and all cross‐cover activities from 7:00 PM until 7:00 AM. Nighttime admissions are distributed to day hospitalists based on each hospitalist's daily census.
Study Design
Funding was provided by the hospital for a 12‐week study, and hospital administrative leaders collaborated as part of the research team. During each of the 12 weeks from September 2006 through November 2006, half the hospitalists on duty each week were randomly assigned to work with a hospitalist care coordinator (HCC) in a team approach. Hospitalists not assigned to work with a hospitalist care coordinator continued to work in their usual fashion, which included working with unit‐based care coordinators (UCCs). UCCs follow all patients on a 30‐bed medicine unit but generally do not round with physicians. HCCs performed all the activities that UCCs perform but also performed additional key activities (see Table 1) and worked in a team approach with their hospitalist. Unit‐based social workers and discharge planners were available for all hospitalists during the study. During each day patients were admitted consecutively to one of the hospitalists on service, regardless of their assignment to work with or without an HCC. Similarly, night admissions were distributed to hospitalists without regard to their assignment to work with or without an HCC.
| Activity type | Activities performed by both UCCs and HCCs | Additional activities performed by HCCs only |
|---|---|---|
| Care coordination | Document the interdisciplinary plan of care | Ensure collaboration in formulating the plan of care |
| Obtain outside medical records | ||
| Inform staff nurse of stat orders during rounds | ||
| Obtain certain test results (eg, preliminary echo reports) | ||
| Patient and family needs | Address patient and family concerns | Proactively identify and address patient and family concerns |
| Schedule family meetings | ||
| Efficiency of care delivery | Remediate barriers that impede plan of care and/or discharge | Identify barriers that impede plan of care |
| Identify and document avoidable days | Ensure tests are scheduled | |
| Discharge process | Coordinate discharge plans with social work and discharge planner | Schedule and confirm follow‐up appointments |
| Initiate discharge instructions | ||
| Write discharge prescriptionsverified and signed by physician | ||
| Review discharge instructions with patient and/or family |
HospitalistCare Coordinator Team
Four HCCs were used in this study. All 4 were registered nurses with specialized training in case management. Prior to the start of the study, the investigators held meetings with hospitalists and the HCCs to describe this new role, the work flow for the hospitalistcare coordinator team, and work activities appropriate for the HCC. Activities related to the discharge process were emphasized as a key feature of the HCC role. Hospitalists and HCCs were instructed to round together as a team each morning. They were advised to collaborate on the daily plan of care and assign specific activities for each to accomplish. During the study weekly meetings were held with the HCCs, the hospitalists with whom they were finishing the week, and the hospitalists with whom they were scheduled to work during the upcoming week. The purpose of these meetings was to ensure that the work flow and work activities were optimal.
Outcome Measures
At the completion of each week, all hospitalists on service were given an anonymous Web‐based survey designed to assess their satisfaction and perceived work efficiency. Hospitalists were asked to rate the efficiency of various work activities during the preceding week on a 5 point Likert scale (1 = very inefficient, 2 = somewhat inefficient, 3 = neutral, 4 = somewhat efficient, 5 = very efficient). Hospitalists who had worked with an HCC were also asked whether they thought working with an HCC improved their efficiency and increased their job satisfaction. We postulated that patient satisfaction with the discharge process might improve with use of the hospitalistHCC team. Therefore, patient satisfaction was assessed by telephone interviews conducted 714 days after discharge. Because of resource limitations, we were only able to interview patient during the second half of the study. Patients were asked to rate their satisfaction with the clarity of verbal and written discharge instructions as well as their overall satisfaction with hospital discharge using a 10‐point Likert scale (from 1 = least satisfied to 10 = most satisfied). Hospital databases provided information on patient demographics, LOS, and cost.
Data Analysis
All analyses were conducted using Stata version 9.0 (StataCorp LP, College Station, TX). Patient characteristics were compared using chi‐square and t tests. Responses to the hospitalist survey for the weeks when they worked independently and the weeks when they worked as a hospitalistHCC team were compared using the Wilcoxon rank sum test. To adjust for the clustering of responses by physicians (ie, individual physicians completed more than 1 survey), we used linear regression and the cluster option. The results were very similar, and only the P values from the Wilcoxon rank sum test are presented. Unadjusted LOS and cost were compared using the Wilcoxon rank sum test. We also conducted multivariate linear regressions using log‐transformed LOS and log‐transformed cost as dependent variables. The independent variable was the team type (whether patients were cared for by a hospitalistHCC team or a hospitalist working independently); age, sex, ethnicity, payer type, and diagnosis‐related group (DRG) weight were included as covariates, and P values were adjusted for physician clustering. We hypothesized a priori that the HCC would have no effect on the LOS of or cost for patients whose hospitalizations were very short. We therefore conducted secondary analyses in which we eliminated patients with an LOS of 1 day or less.
RESULTS
There were 356 patients cared for by hospitalistHCC teams and 337 patients cared for by control hospitalists. Of the 60 weeks of hospitalist service of the study, hospitalistHCC teams accounted for 31 weeks (52%) and control hospitalists for 29 weeks (48%). Patients cared for by the hospitalistHCC teams were similar in age, sex, ethnicity, payer type, and DRG weight to those cared for by control hospitalists (see Table 2).
| HospitalistHCC team | Control | P value | |
|---|---|---|---|
| n (%) or mean SD | |||
| Patients, n (%) | 356 (51.4%) | 337 (48.6%) | |
| Age (years) | 59.3 18.6 | 59.0 20.1 | .86 |
| Women (%) | 190 (53.4%) | 192 (57.0%) | .34 |
| Ethnicity | .74 | ||
| White | 182 (51.1%) | 174 (51.6%) | |
| Black | 111 (31.2%) | 114 (33.8%) | |
| Hispanic | 23 (6.5%) | 21 (6.2%) | |
| Asian | 5 (1.4%) | 4 (1.2%) | |
| Other | 35 (9.8%) | 24 (7.1%) | |
| Payer | .47 | ||
| Medicare | 177 (49.7%) | 168 (49.9%) | |
| Private | 76 (21.4%) | 69 (20.5%) | |
| Medicaid | 43 (12.1%) | 44 (13.1%) | |
| Capitated | 43 (12.1%) | 31 (9.2%) | |
| Other | 17 (4.8%) | 25 (7.4%) | |
| Diagnosis‐related group weight | 1.1 0.8 | 1.2 0.8 | .31 |
Sixty surveys were completed by hospitalists at the end of their week on service (response rate 100%). Of the 31 responses from hospitalists completing a hospitalistHCC team week, 28 (90%) reported that working with an HCC improved their efficiency and 28 (90%) that working with an HCC improved their job satisfaction. The hospitalists indicated that working with an HCC significantly improved the efficiency of most of their activities (see Table 3). Specifically, activities related to communication with nurses and patients and activities involving discharge planning and execution were improved with the use of an HCC. As would be expected, certain other activities did not improve. For example, there were no differences between the groups in the perceived efficiency of performing histories and physicals or placing admission orders. For activities that were significantly different, the Wilcoxon rank sum test and linear regression analysis adjusting for physician clustering showed identical results.
| HospitalistHCC Team | Control | P value | |
|---|---|---|---|
| Mean score SD* | |||
| |||
| Performing histories and physicals | 3.94 0.77 | 3.93 0.84 | .98 |
| Performing medication reconciliation | 3.35 1.08 | 2.03 1.18 | < .001 |
| Placing admission orders | 3.94 0.73 | 4.00 0.87 | .57 |
| Communicating with nurses | 4.45 0.68 | 3.14 1.09 | < .001 |
| Communicating with consultants | 3.65 0.75 | 3.34 1.04 | .25 |
| Communicating with patients | 4.42 0.62 | 3.62 1.01 | < .001 |
| Communicating with families | 4.32 0.70 | 2.89 1.14 | < .001 |
| Coordinating discharge plans | 4.74 0.51 | 2.76 1.18 | < .001 |
| Making/updating sign‐out | 3.55 0.72 | 3.49 0.83 | .55 |
| Making discharge instructions | 4.29 0.74 | 3.10 1.01 | < .001 |
| Going over discharge instructions | 4.48 0.57 | 2.76 1.15 | < .001 |
| Writing discharge prescriptions | 3.87 0.67 | 2.52 1.21 | < .001 |
| Arranging follow‐up appointments | 4.19 0.75 | 2.03 1.09 | < .001 |
Seventy‐one of 196 eligible patients (36%) completed the discharge satisfaction interview. Of the 71 patients interviewed, 44 (62%) were cared for by hospitalistHCC teams and 27 (38%) were cared for by control hospitalists. Patient satisfaction with the clarity of the verbal and written discharge instructions and overall satisfaction with hospital discharge was similar between the 2 groups (see Table 4).
| HospitalistHCC Team (n = 44) | Control (n = 27) | P value | |
|---|---|---|---|
| Mean score (SD)* | |||
| |||
| Clarity of verbal discharge instructions | 8.86 ( 2.31) | 8.44 ( 2.63) | 0.52 |
| Clarity of written discharge instructions | 8.95 ( 2.30) | 8.93 ( 2.54) | 0.78 |
| Overall satisfaction with hospital discharge | 8.57 ( 2.42) | 8.37 ( 2.90) | 0.94 |
The unadjusted mean LOS for patients cared for by hospitalistHCC teams was 4.70 4.15 days compared with 5.07 3.99 days for patients cared for by control hospitalists (P = .005; see Table 5). The unadjusted mean cost for patients cared for by hospitalistHCC teams was $10,052.96 $11,708.73 compared with $11,703.19 $20,455.78 for patients cared for by control hospitalists (P = .008). In multivariate analysis using age, sex, ethnicity, payer type, and DRG weight as independent variables and adjusting for physician clustering, LOS remained lower for patients cared for by hospitalistHCC teams; however, this result was not statistically significant (0.28 days, P = .17). Similar multivariate regression analysis showed a trend toward lower cost for patients cared for by the hospitalistHCC teams (585.62, P = .15).
| Unadjusted mean (SD) | P value for unadjusted difference* | Adjusted difference with hospitalistHCC team | P value for adjusted difference | |
|---|---|---|---|---|
| ||||
| Length of stay | ||||
| HospitalistHCC teams | 4.70 (4.15) | .005 | 0.28 | .17 |
| Control hospitalists | 5.07 (3.99) | |||
| Cost | ||||
| HospitalistHCC teams | 10,052.96 (11,708.73) | .008 | 585.62 | .15 |
| Control hospitalists | 11,703.19 (20,455.78) | |||
DISCUSSION
Our study found that hospitalists working in a team approach with an HCC rated the efficiency of their daily work and their job satisfaction significantly higher than did control hospitalists. Specific areas of improved efficiency included communication activities and activities related to hospital discharge. A prior study conducted by our group found that hospitalists spend a lot of time on indirect patient care activities such as communication and activities related to the discharge process, while spending relatively little time on direct patient care.8 Improving the efficiency of indirect patient care activities of hospitalists is likely to improve their job satisfaction. The importance of improving hospitalist workload and job satisfaction is underscored by the relatively high number of hospitalists at risk for burnout9 and the growing concern about daily workload among hospital medicine group leaders.7
Patient satisfaction was not significantly affected by the use of the hospitalistHCC team in our study. A priori, we postulated that patient satisfaction with the discharge process might improve with the use of the hospitalistHCC team. We therefore limited survey questions to assessing only satisfaction with hospital discharge rather than other aspects of patient hospital care. A recent study reported that patients rated the quality of discharge instructions significantly lower than they rated the overall quality of their hospital stay.10 However, the patients in our study gave high ratings to both discharge instructions and overall satisfaction with hospital discharge. This may explain why we were unable to detect a difference. Our study was limited by the relatively small number of patients we were able to contact to assess satisfaction. Previous studies evaluating the impact of care coordinators either did not assess patient satisfaction with discharge5 or found no difference in satisfaction with hospital discharge.6
Although our study did not find a difference in patient satisfaction with the discharge process, we believe the hospitalistHCC model has the potential to complement efforts to reduce the risk of adverse events as patients transition out of the hospital. It has been reported that 12% of patients have a preventable or ameliorable adverse event in the period immediately following hospital discharge.11, 12 Although Forster et al. did not find a reduction in the risk of adverse events with the addition of a clinical coordinator to a general medical team, they noted incongruence between the coordinator's role and the outcomes measured.6 Similarly, we would need to modify the role of the HCC from a position designed mainly to improve efficiency to one that complements efforts to improve the quality of the discharge process. Possible ways to enhance the HCC role in this regard include increasing the emphasis on and training in patient education skills. Several recently published articles have emphasized the need to redesign the discharge process in an effort to reduce the risk of adverse events following hospital discharge.1315 A modified HCC role might be an essential feature of a redesigned multidisciplinary discharge process.
We were unable to demonstrate improved efficiency for the hospital. Although LOS and cost were lower for patients cared for by the hospitalistHCC teams, the difference was not statistically significant. One possible explanation for why we did not observe a larger reduction in LOS is that our hospitalist service had a lower‐than‐average patient volume during the study period. The lower volume mirrored an unanticipated dip in hospital volume during the same period. Specifically, our service normally discharges an average of 338 patients per month, but during the study period we discharged an average of 235 patients per month. A potential LOS and cost benefit may have been attenuated by the relatively low volume, as hospitalists had ample time to dedicate to communication and coordination of discharge plans.
Our study had several limitations. It was conducted on a nonteaching hospitalist service at a single site. Hospitalist practices vary widely in their staffing and scheduling models. As previously mentioned, we were only able to perform patient satisfaction surveys during the second half of the study period. In addition, hospitalistHCC team patients made up a larger percentage of the patient survey responses (62%) than did control hospitalist patients (38%). This may have affected our ability to detect differences in satisfaction with the hospital discharge process. As also previously noted, our patient volume was lower than normal during the study period. We believe that a higher volume would have magnified differences in hospitalists' perceived efficiency and perhaps resulted in significant improvements in LOS and cost. Finally, the hospital provided funding for only a 12‐week study. This limited our sample size and the power of the study to detect important differences. It is possible that a larger sample size and/or longer study period may have been able to demonstrate a statistically significant improvement in LOS and cost.
Our findings are of particular importance in light of the persistent concerns about hospitalist workload and job satisfaction. Although many hospitalists work with clinical coordinators and case managers, we believe that having the formal structure of a hospitalistcare coordinator team was the key element to improving hospitalist efficiency and satisfaction. We hope that our study is a precursor to research evaluating models of delivering hospital care and their impact on hospitalist work experience, hospital efficiency, and patient outcomes.
- .Innovations in the management of hospitalized patients.Nurse Pract.2006;Suppl:2–3.
- ,.Hospitalists and case managers: the perfect partnership.Lippincotts Case Manag.2004;9:280–286.
- ,.Productive interdisciplinary team relationships: the hospitalist and the case manager.Lippincotts Case Manag.2006;11:160–164.
- ,,.Care coordinator—blending roles to improve patient outcomes.J Nurs Manage.1997;28:49–52.
- ,,,.Effects of a medical team coordinator on length of hospital stay.Can Med Assoc J.1992;146:511–515.
- ,,, et al.Effect of a nurse team coordinator on outcomes for hospitalized medicine patients.Am J Med.2005;118:1148–1153.
- Society of Hospital Medicine. Available at: http://www.hospitalmedicine.org/Content/NavigationMenu/ResourceCenter/Surveys/Surveys1.htm. Accessed April 2,2007.
- ,,.How hospitalists spend their time: insights on efficiency and safety.J Hosp Med.2006;1:88–93.
- ,,,,.Characteristics and work experiences of hospitalists in the United States.Arch Intern Med.2001;161:851–858.
- ,,,,,.Patient perception of quality in discharge instruction.Patient Educ Couns.2005;59:56–68.
- ,,, et al.Adverse events among medical patient after hospital discharge.Can Med Assoc J.2004;170:345–349.
- ,,,,.The incidence and severity of adverse events affecting patients after discharge from the hospital.Ann Intern Med.2003;138:161–167.
- ,.Lost in transition: challenges and opportunities for improving the quality of transitional care.Ann Intern Med.2004;141:533–536.
- ,,, et al.Transition of care for hospitalized elderly patients—development of a discharge checklist for hospitalists.J Hosp Med.2006;1:354–360.
- ,,, et al. Re‐engineering the hospital discharge—an example of a multifaceted process evaluation. Advances in Patient Safety: From Research to Implementation. Vol.2,Concepts and Methodology. AHRQ publication 05‐0021‐2.Rockville, MD:AHRQ;2005. p379–394.
Copyright © 2008 Society of Hospital Medicine
Discharge Summary Survey
Twelve percent of patients have been reported to have preventable or ameliorable adverse events in the period immediately following hospital discharge.1, 2 A potential contributor to the number of adverse events is inadequate transfer of clinical information at hospital discharge. The discharge summary is a vital component of the transfer of information from the inpatient to the outpatient setting. Unfortunately, discharge summaries are often unavailable when follow‐up care occurs and often lack important content.36
Many hospitals are implementing an electronic medical record systems. This creates the opportunity at hospital discharge to immediately assemble the major components of a discharge summary. With enhanced communication systems, this information can be delivered in a variety of ways with minimal delay. We report the results and evaluation of a survey of medicine faculty at an urban academic medical center about the timeliness and quality of discharge summaries, the perceived incidence of adverse events related to suboptimal information transfer at discharge, and the need for the electronically generated discharge summary we plan to design.
METHODS
Study Site
The study was conducted at a 753‐bed academic hospital in Chicago, Illinois. Discharge summaries have traditionally been dictated by inpatient physicians and delivered to outpatient physicians by both mail and facsimile via the medical records department. The hospital has used an electronic medical record and computerized physician order entry system (PowerChart Millennium from Cerner Corporation) since August 2004. Although all history and physicals and progress notes were documented in the electronic medical record, the system did not provide a method for delivering the discharge summaries contained in the electronic medical record to outpatient physician offices. Because of this, inpatient physicians continued to dictate discharge summaries during this study.
Participants
An advisory board consisting of 16 physicians from the Department of Medicine was convened. The advisory board gave input on needs assessment and helped to create a survey to be administered to all 425 medicine faculty who have an outpatient practice. All respondents who had at least 1 patient admitted to the hospital within the 6 months prior to the survey were eligible.
Survey Content
Our survey consisted of 2 parts. In the first part, we asked respondents to estimate how many of their patients had been discharged from the hospital in the past 6 months and to reflect on these patients as they completed the survey. Satisfaction with the timeliness and quality of discharge summaries was assessed using a 5‐point Likert scale, from 5, very satisfied, to 1, very unsatisfied. The frequency of hospital follow‐up of a patient occurring prior to arrival of the discharge summary was assessed as the percentage of times this occurred in 20% increments (0%‐19%, 20%‐39%, 40%‐59%, 60%‐79%, and 80%‐100%). The number of discharge summaries missing critical information and the number of summaries containing unnecessary information were similarly assessed using 20% increments. We then asked respondents to estimate the number of patients who had sustained a preventable adverse event related to suboptimal transfer of information at discharge. We defined a preventable adverse event as a preventable medical problem or worsening of an existing problem.
In the second part of the survey, we elicited preferences for discharge summary content and method of delivery. We assessed preferences for discharge summary content by asking respondents to rank items on a scale from 1 to 10, from 10, most important, to 1, least important. Preferences for delivery of discharge summaries were assessed by asking respondents to indicate one or more delivery methods, including facsimile, mail, the electronic medical record, and E‐mail.
Survey Process
The survey was sent out in March 2005. A postcard reminder was sent out approximately 2 weeks after the initial survey was mailed. A second survey was sent to nonresponders 6 weeks after the initial survey. Simultaneously, the survey was also sent in Web‐based format to nonresponders via email.
Data Analysis
Physician characteristics, including practice type, faculty appointment type, and year of medical school graduation, were provided by the hospital's medical staff office. Physician respondents and nonrespondents were compared using the chi‐square test and logistic regression to determine potential response biases. We calculated means and standard deviations and percentages for categorical variables. Logistic regression was used to examine the likelihood of participants reporting any preventable adverse event related to suboptimal transfer of information. The regression model tested the likelihood of one or more preventable adverse events reported with the frequency of seeing patients for follow‐up prior to the arrival of discharge summaries, controlling for participant characteristics and the number of hospitalized patients each physician had in the previous 6 months.
RESULTS
Physician Characteristics
The survey was sent to 425 physicians, 9 of whom were excluded because they had had no patients admitted within the past 6 months. Of the 416 eligible respondents, 2 returned a survey that was incomplete and not usable, and 226 returned a completed survey (response rate of 54%). The characteristics of responders and nonresponders are shown in Table 1. General medicine physicians completed the survey more often than specialist physicians (56% vs. 44%, P < .001). Affiliated faculty were also more likely to complete the survey than full‐time faculty; multivariate logistic regression revealed this was purely a function of the larger number of specialists among the full‐time faculty.
| Responders (N = 226) | Nonresponders (N = 188) | P value | |
|---|---|---|---|
| |||
| Practice type | |||
| Generalist, N (%) | 127 (56.2) | 65 (34.6) | < .001 |
| Specialist, N (%) | 99 (43.8) | 123 (65.4) | |
| Faculty appointment | |||
| Full‐time, N (%) | 104 (46.0 | 106 (56.4) | .04 |
| Affiliated, N (%) | 122 (54.0) | 82 (43.6) | |
| Year of medical school graduation | |||
| Before 1990, N (%) | 131 (58.0) | 127 (67.6) | .04 |
| 1990 or later, N (%) | 95 (42.0) | 61 (32.4) | |
| Number of patients hospitalized in last 6 monthsa | |||
| 1‐4, N (%) | 15 (7.9) | ||
| 5‐10, N (%) | 62 (32.5) | ||
| 11‐19, N (%) | 35 (18.3) | ||
| 20 or more, N (%) | 79 (41.4) | ||
Timeliness and Content
Only 19% of the participants were satisfied or very satisfied with the timeliness of discharge summaries. Among all participants, 33% indicated that 60% or more of their patients were seen for their follow‐up outpatient visit prior to the arrival of the discharge summary, and 22% indicated that for 60% or more of their patients they never received a discharge summary at all.
Only 32% of the participants were satisfied or very satisfied with the quality of discharge summaries. Among all participants, 17% believed that 60% or more of discharge summaries missed critical information. Unnecessary information in the discharge summary was less problematic; only 9% of participants indicated that 60% or more of discharge summaries contained unnecessary information.
Preventable Adverse Events
Overall, 41% of participants believed that in the previous 6 months at least one of their patients had sustained a preventable adverse event related to poor transfer of information at hospital discharge. Reporting one or more preventable adverse events was positively associated with physicians' reports of how often they saw patients for a first postdischarge follow‐up without having a discharge summary available. After adjusting for participant characteristics and the number of patients hospitalized by each physician, logistic regression results indicated that each 20% increase in the frequency of discharge summaries not arriving prior to patient follow‐up appointments was associated with a 28% increase in the odds of a reported preventable adverse event (adjusted OR = 1.28, P = .04).
Preferences for Content and Delivery
The mean rating for importance of discharge summary elements is shown in Table 2. No discharge summary element had a mean rating of less than 5. Participants preferred discharge summaries be delivered via the following methods: facsimile, 48%; mail, 30%; electronic medical record, 41%; and E‐mail, 30%.
| Mean rating (scale of 1‐10) | |
|---|---|
| Medications at discharge | 9.69 |
| Follow‐up issues | 9.09 |
| Discharge diagnosis | 9.02 |
| List of procedures performed | 8.79 |
| Pathology reports | 8.78 |
| Pending test results | 8.68 |
| Procedure reports | 8.16 |
| Stress test reports | 8.07 |
| Dates of admission and discharge | 8.01 |
| Problem list | 7.99 |
| List of radiology tests performed | 7.84 |
| Echocardiogram reports | 7.79 |
| Follow‐up appointments | 7.79 |
| Radiology reports | 7.76 |
| Names of consulting attendings | 7.64 |
| Name of inpatient attending | 7.28 |
| Labs from last hospital day | 7.08 |
| Medications at admission | 6.91 |
| Allergies | 6.56 |
| All lab results | 6.22 |
| Code status | 6.09 |
| Names of inpatient house officers | 5.64 |
DISCUSSION
Our study found that outpatient physicians were not satisfied with the timeliness or the quality of current discharge summaries. Our findings are in agreement with previous studies demonstrating that discharge summaries were often not available to outpatient physicians3,4 and were often of poor quality.5, 6
Preventable or ameliorable adverse events have been reported to occur in 12% of patients in the period immediately following hospital discharge.1, 2 No studies have evaluated the relationship between discharge summaries and preventable adverse events following discharge. Our study found that 41% of outpatient physicians believed that at least one of their patients in the 6 months prior to the survey had sustained a preventable adverse event related to the suboptimal transfer of information at hospital discharge. In addition, the likelihood of physicians reporting one or more preventable adverse events increased with the frequency of seeing patients for follow‐up prior to discharge summary arrival.
In preparation for revising the discharge summary, we asked outpatient physicians to rate the importance of discharge summary content and their preference for method of delivery of discharge summaries. As in previous studies, the outpatient physicians rated discharge medications, discharge diagnosis, test results, and follow‐up plans as highly important.7, 8 Much of this clinical data is now available in the electronic medical record. Therefore, it is possible to electronically assemble much, if not all, of discharge summary content. One recent study demonstrated that database‐generated discharge summaries significantly increased the likelihood that a discharge summary was generated within 4 weeks of hospital discharge.9 The database used in that study required manual data input from a handwritten form. To our knowledge, no study has reported the experience of discharge summaries generated from an electronic medical record.
Our study had several limitations. First, our study used physician survey to assess the timeliness of receiving discharge summaries. Measuring the time to actual receipt of discharge summaries by physicians was beyond the scope of our study. Second, our study did not measure adverse events directly. Instead, we asked outpatient physicians to estimate how many of their patients discharged in the last 6 months had sustained a preventable adverse event related to suboptimal information transfer at discharge. We had limited space in the questionnaire to define the meaning of a preventable adverse event; therefore, the description in the survey does not exactly match previous definitions.1, 2 Our study had a response rate of 54%. It is possible that nonresponders may have been more satisfied with the quality and timeliness of discharge summaries and may have believed fewer patients experienced preventable adverse events related to suboptimal information transfer at discharge.
The results of our study suggest that the use of systems to improve the quality and delivery of discharge summaries has the potential to improve outpatient physician satisfaction and to reduce the number of preventable adverse events that occur during the vulnerable period following hospital discharge. With the use of electronic medical records, we now have the potential to automate the process of assembling and delivering clinical information with minimal delay. We are now using the information from this study to design a partially automated, high‐quality discharge summary that can be delivered to outpatient physicians immediately on discharge.
- ,,, et al.Adverse events among medical patient after hospital discharge.CMAJ.2004;170:345–349.
- ,,,,.The incidence and severity of adverse events affecting patients after discharge from the hospital.Ann Intern Med.2003;138:161–167.
- ,,.Dissemination of discharge summaries. Not reaching follow‐up physicians.Can Fam Physician.2002;48:737–742.
- ,,,.Effect of discharge summary availability during post‐discharge visits on hospital readmission.J Gen Intern Med.2002;17:186–192.
- ,,,.General practitioner‐hospital communications: a review of discharge summaries.J Qual Clin Pract.2001;21:104–108.
- ,,,,.Quality assessment of discharge letters in a French university hospital.Int J Health Care Qual Assur.1998;11:90–95.
- ,,.Content of a discharge summary from a medical ward: views of general practitioners and hospital doctors.J R Coll Physicians Lond.1995;29:307–310.
- ,.What is necessary for high‐quality discharge summaries?Am J Med Qual.1999;14:160–169.
- ,,,.Dictated versus database‐generated discharge summaries: a randomized clinical trial.CMAJ.1999;160:319–326.
Twelve percent of patients have been reported to have preventable or ameliorable adverse events in the period immediately following hospital discharge.1, 2 A potential contributor to the number of adverse events is inadequate transfer of clinical information at hospital discharge. The discharge summary is a vital component of the transfer of information from the inpatient to the outpatient setting. Unfortunately, discharge summaries are often unavailable when follow‐up care occurs and often lack important content.36
Many hospitals are implementing an electronic medical record systems. This creates the opportunity at hospital discharge to immediately assemble the major components of a discharge summary. With enhanced communication systems, this information can be delivered in a variety of ways with minimal delay. We report the results and evaluation of a survey of medicine faculty at an urban academic medical center about the timeliness and quality of discharge summaries, the perceived incidence of adverse events related to suboptimal information transfer at discharge, and the need for the electronically generated discharge summary we plan to design.
METHODS
Study Site
The study was conducted at a 753‐bed academic hospital in Chicago, Illinois. Discharge summaries have traditionally been dictated by inpatient physicians and delivered to outpatient physicians by both mail and facsimile via the medical records department. The hospital has used an electronic medical record and computerized physician order entry system (PowerChart Millennium from Cerner Corporation) since August 2004. Although all history and physicals and progress notes were documented in the electronic medical record, the system did not provide a method for delivering the discharge summaries contained in the electronic medical record to outpatient physician offices. Because of this, inpatient physicians continued to dictate discharge summaries during this study.
Participants
An advisory board consisting of 16 physicians from the Department of Medicine was convened. The advisory board gave input on needs assessment and helped to create a survey to be administered to all 425 medicine faculty who have an outpatient practice. All respondents who had at least 1 patient admitted to the hospital within the 6 months prior to the survey were eligible.
Survey Content
Our survey consisted of 2 parts. In the first part, we asked respondents to estimate how many of their patients had been discharged from the hospital in the past 6 months and to reflect on these patients as they completed the survey. Satisfaction with the timeliness and quality of discharge summaries was assessed using a 5‐point Likert scale, from 5, very satisfied, to 1, very unsatisfied. The frequency of hospital follow‐up of a patient occurring prior to arrival of the discharge summary was assessed as the percentage of times this occurred in 20% increments (0%‐19%, 20%‐39%, 40%‐59%, 60%‐79%, and 80%‐100%). The number of discharge summaries missing critical information and the number of summaries containing unnecessary information were similarly assessed using 20% increments. We then asked respondents to estimate the number of patients who had sustained a preventable adverse event related to suboptimal transfer of information at discharge. We defined a preventable adverse event as a preventable medical problem or worsening of an existing problem.
In the second part of the survey, we elicited preferences for discharge summary content and method of delivery. We assessed preferences for discharge summary content by asking respondents to rank items on a scale from 1 to 10, from 10, most important, to 1, least important. Preferences for delivery of discharge summaries were assessed by asking respondents to indicate one or more delivery methods, including facsimile, mail, the electronic medical record, and E‐mail.
Survey Process
The survey was sent out in March 2005. A postcard reminder was sent out approximately 2 weeks after the initial survey was mailed. A second survey was sent to nonresponders 6 weeks after the initial survey. Simultaneously, the survey was also sent in Web‐based format to nonresponders via email.
Data Analysis
Physician characteristics, including practice type, faculty appointment type, and year of medical school graduation, were provided by the hospital's medical staff office. Physician respondents and nonrespondents were compared using the chi‐square test and logistic regression to determine potential response biases. We calculated means and standard deviations and percentages for categorical variables. Logistic regression was used to examine the likelihood of participants reporting any preventable adverse event related to suboptimal transfer of information. The regression model tested the likelihood of one or more preventable adverse events reported with the frequency of seeing patients for follow‐up prior to the arrival of discharge summaries, controlling for participant characteristics and the number of hospitalized patients each physician had in the previous 6 months.
RESULTS
Physician Characteristics
The survey was sent to 425 physicians, 9 of whom were excluded because they had had no patients admitted within the past 6 months. Of the 416 eligible respondents, 2 returned a survey that was incomplete and not usable, and 226 returned a completed survey (response rate of 54%). The characteristics of responders and nonresponders are shown in Table 1. General medicine physicians completed the survey more often than specialist physicians (56% vs. 44%, P < .001). Affiliated faculty were also more likely to complete the survey than full‐time faculty; multivariate logistic regression revealed this was purely a function of the larger number of specialists among the full‐time faculty.
| Responders (N = 226) | Nonresponders (N = 188) | P value | |
|---|---|---|---|
| |||
| Practice type | |||
| Generalist, N (%) | 127 (56.2) | 65 (34.6) | < .001 |
| Specialist, N (%) | 99 (43.8) | 123 (65.4) | |
| Faculty appointment | |||
| Full‐time, N (%) | 104 (46.0 | 106 (56.4) | .04 |
| Affiliated, N (%) | 122 (54.0) | 82 (43.6) | |
| Year of medical school graduation | |||
| Before 1990, N (%) | 131 (58.0) | 127 (67.6) | .04 |
| 1990 or later, N (%) | 95 (42.0) | 61 (32.4) | |
| Number of patients hospitalized in last 6 monthsa | |||
| 1‐4, N (%) | 15 (7.9) | ||
| 5‐10, N (%) | 62 (32.5) | ||
| 11‐19, N (%) | 35 (18.3) | ||
| 20 or more, N (%) | 79 (41.4) | ||
Timeliness and Content
Only 19% of the participants were satisfied or very satisfied with the timeliness of discharge summaries. Among all participants, 33% indicated that 60% or more of their patients were seen for their follow‐up outpatient visit prior to the arrival of the discharge summary, and 22% indicated that for 60% or more of their patients they never received a discharge summary at all.
Only 32% of the participants were satisfied or very satisfied with the quality of discharge summaries. Among all participants, 17% believed that 60% or more of discharge summaries missed critical information. Unnecessary information in the discharge summary was less problematic; only 9% of participants indicated that 60% or more of discharge summaries contained unnecessary information.
Preventable Adverse Events
Overall, 41% of participants believed that in the previous 6 months at least one of their patients had sustained a preventable adverse event related to poor transfer of information at hospital discharge. Reporting one or more preventable adverse events was positively associated with physicians' reports of how often they saw patients for a first postdischarge follow‐up without having a discharge summary available. After adjusting for participant characteristics and the number of patients hospitalized by each physician, logistic regression results indicated that each 20% increase in the frequency of discharge summaries not arriving prior to patient follow‐up appointments was associated with a 28% increase in the odds of a reported preventable adverse event (adjusted OR = 1.28, P = .04).
Preferences for Content and Delivery
The mean rating for importance of discharge summary elements is shown in Table 2. No discharge summary element had a mean rating of less than 5. Participants preferred discharge summaries be delivered via the following methods: facsimile, 48%; mail, 30%; electronic medical record, 41%; and E‐mail, 30%.
| Mean rating (scale of 1‐10) | |
|---|---|
| Medications at discharge | 9.69 |
| Follow‐up issues | 9.09 |
| Discharge diagnosis | 9.02 |
| List of procedures performed | 8.79 |
| Pathology reports | 8.78 |
| Pending test results | 8.68 |
| Procedure reports | 8.16 |
| Stress test reports | 8.07 |
| Dates of admission and discharge | 8.01 |
| Problem list | 7.99 |
| List of radiology tests performed | 7.84 |
| Echocardiogram reports | 7.79 |
| Follow‐up appointments | 7.79 |
| Radiology reports | 7.76 |
| Names of consulting attendings | 7.64 |
| Name of inpatient attending | 7.28 |
| Labs from last hospital day | 7.08 |
| Medications at admission | 6.91 |
| Allergies | 6.56 |
| All lab results | 6.22 |
| Code status | 6.09 |
| Names of inpatient house officers | 5.64 |
DISCUSSION
Our study found that outpatient physicians were not satisfied with the timeliness or the quality of current discharge summaries. Our findings are in agreement with previous studies demonstrating that discharge summaries were often not available to outpatient physicians3,4 and were often of poor quality.5, 6
Preventable or ameliorable adverse events have been reported to occur in 12% of patients in the period immediately following hospital discharge.1, 2 No studies have evaluated the relationship between discharge summaries and preventable adverse events following discharge. Our study found that 41% of outpatient physicians believed that at least one of their patients in the 6 months prior to the survey had sustained a preventable adverse event related to the suboptimal transfer of information at hospital discharge. In addition, the likelihood of physicians reporting one or more preventable adverse events increased with the frequency of seeing patients for follow‐up prior to discharge summary arrival.
In preparation for revising the discharge summary, we asked outpatient physicians to rate the importance of discharge summary content and their preference for method of delivery of discharge summaries. As in previous studies, the outpatient physicians rated discharge medications, discharge diagnosis, test results, and follow‐up plans as highly important.7, 8 Much of this clinical data is now available in the electronic medical record. Therefore, it is possible to electronically assemble much, if not all, of discharge summary content. One recent study demonstrated that database‐generated discharge summaries significantly increased the likelihood that a discharge summary was generated within 4 weeks of hospital discharge.9 The database used in that study required manual data input from a handwritten form. To our knowledge, no study has reported the experience of discharge summaries generated from an electronic medical record.
Our study had several limitations. First, our study used physician survey to assess the timeliness of receiving discharge summaries. Measuring the time to actual receipt of discharge summaries by physicians was beyond the scope of our study. Second, our study did not measure adverse events directly. Instead, we asked outpatient physicians to estimate how many of their patients discharged in the last 6 months had sustained a preventable adverse event related to suboptimal information transfer at discharge. We had limited space in the questionnaire to define the meaning of a preventable adverse event; therefore, the description in the survey does not exactly match previous definitions.1, 2 Our study had a response rate of 54%. It is possible that nonresponders may have been more satisfied with the quality and timeliness of discharge summaries and may have believed fewer patients experienced preventable adverse events related to suboptimal information transfer at discharge.
The results of our study suggest that the use of systems to improve the quality and delivery of discharge summaries has the potential to improve outpatient physician satisfaction and to reduce the number of preventable adverse events that occur during the vulnerable period following hospital discharge. With the use of electronic medical records, we now have the potential to automate the process of assembling and delivering clinical information with minimal delay. We are now using the information from this study to design a partially automated, high‐quality discharge summary that can be delivered to outpatient physicians immediately on discharge.
- ,,, et al.Adverse events among medical patient after hospital discharge.CMAJ.2004;170:345–349.
- ,,,,.The incidence and severity of adverse events affecting patients after discharge from the hospital.Ann Intern Med.2003;138:161–167.
- ,,.Dissemination of discharge summaries. Not reaching follow‐up physicians.Can Fam Physician.2002;48:737–742.
- ,,,.Effect of discharge summary availability during post‐discharge visits on hospital readmission.J Gen Intern Med.2002;17:186–192.
- ,,,.General practitioner‐hospital communications: a review of discharge summaries.J Qual Clin Pract.2001;21:104–108.
- ,,,,.Quality assessment of discharge letters in a French university hospital.Int J Health Care Qual Assur.1998;11:90–95.
- ,,.Content of a discharge summary from a medical ward: views of general practitioners and hospital doctors.J R Coll Physicians Lond.1995;29:307–310.
- ,.What is necessary for high‐quality discharge summaries?Am J Med Qual.1999;14:160–169.
- ,,,.Dictated versus database‐generated discharge summaries: a randomized clinical trial.CMAJ.1999;160:319–326.
Hospitalist Time‐Motion
The hospitalist model of care has experienced dramatic growth. In 2003 it was estimated that there were 8000 US hospitalists, a number projected to ultimately reach more than 19 000.1, 2 This rapid growth has largely been driven by improvements in clinical efficiency as a result of hospitalist programs. There is a substantial body of evidence showing that hospitalists reduce length of stay and inpatient costs.3 Despite the rapid growth and proven benefit to clinical efficiency, no studies have evaluated the type and frequency of activities that hospitalists perform during routine work. Although the use of hospitalists improves clinical efficiency for the hospital, relatively little is known about how the hospital can improve efficiency for the hospitalist.
Our institution greatly expanded our hospitalist program in June 2003 to create a resident‐uncovered hospitalist service. The impetus for this change was the need to comply with newly revised Accreditation Council for Graduate Medicine Education (ACGME) program requirements regarding resident duty hours. Many teaching hospitals have implemented similar resident‐uncovered hospitalist services.4 Inefficiencies in their work activities quickly became apparent to our hospitalists. Furthermore, our hospitalists believed that they frequently performed simultaneous activities and that they were excessively interrupted by pages.
To evaluate the type and frequency of activities that the hospitalists performed during routine work, we performed a time‐motion study of hospitalist physicians on the resident‐uncovered hospitalist service. Our goal was to identify areas for systems improvements and activities that were better suited for nonphysician providers and to quantify the time spent multitasking and the frequency of paging interruptions.
METHODS
Northwestern Memorial Hospital (NMH) is a 753‐bed hospital in Chicago, Illinois. NMH is the primary teaching hospital affiliated with the Feinberg School of Medicine of Northwestern University. There are 2 general medicine services at NMH: a traditional resident‐covered ward service and the resident‐uncovered hospitalist service. Patients are admitted to one of these 2 services on the basis of, in order of importance, capacity of the services, preference of the outpatient physician, and potential educational value of the admission. Patients admitted to the hospitalist service are preferentially given beds on specific wards intended for hospitalist service patients. Fourth‐year medical students are frequently paired with hospitalists during their medicine subinternship.
The resident‐uncovered hospitalist service comprises 5 daytime hospitalists on duty at a time. The hospitalists are on service for 7 consecutive days, usually followed by 7 consecutive days off. Hospitalists pick up new patients from the night float hospitalist each morning. Daytime admitting duties rotate on a daily basis. One hospitalist accepts new admissions each morning from 7:00 AM until noon. Two hospitalists accept admissions from noon until 5:00 PM. One hospitalist accepts admissions from 5:00 PM until 9:00 PM. One hospitalist is free from accepting new admissions each day. All daytime hospitalists begin the workday at 7:00 AM and leave when their duties are completed for the day. One night float hospitalist is on duty each night of the week. The night float hospitalist performs admissions and all cross cover activities from 7:00 PM until 7:00 AM.
We first conducted a pilot study to help identify specific activities that our hospitalists routinely perform. Broad categories and subcategories of activities were created based on the results of our pilot study, and a published time‐motion study performed on emergency medicine physicians5 (Table 1). Once activities were defined and codes established, our research assistant unobtrusively shadowed hospitalist physicians for periods lasting 3‐5 hours. The observation periods were distributed in order to sample all activities that a daytime hospitalist would perform throughout a typical week. Observation periods included 2 morning admitting periods, 4 morning nonadmitting periods, 4 afternoon admitting periods, 4 afternoon nonadmitting periods, and 2 admitting periods from 5:00 PM to 9:00 PM. Activities were recorded on a standardized data collection form in 1‐minute intervals. When multiple activities were performed at the same time, all activities were recorded in the same 1‐minute interval. Incoming pages were recorded as well. To minimize the possibility that observation would affect hospitalist behavior, the research assistant was instructed not to initiate conversation with the hospitalists.
| Direct patient care |
| Taking initial history and physical exam |
| Seeing patient in follow‐up visit |
| Going over discharge instructions |
| Family meetings |
| Indirect patient care |
| Reviewing test results and medical records |
| Documentation |
| Documenting history and physical, daily notes, filling out discharge instructions, writing out prescriptions |
| Communication |
| Taking report from night float, taking admission report, face‐to‐face discussion, initiating and returning pages |
| Orders |
| Writing/emnputting orders, calling radiology |
| Professional development |
| Going to conferences, grand rounds, etc |
| Reading articles, textbooks, online references |
| Education |
| Teaching during work rounds |
| Didactic sessions with subintern |
| Travel |
| Walking, taking elevator, etc |
| Personal |
| Lunch, washroom break, etc. |
The data collection forms were manually abstracted and minutes tallied for each category and subcategory, for which summary statistics were converted to percentage of total minutes.
RESULTS
Ten hospitalists were shadowed by a single research assistant for a total of 4467 minutes. Seven hospitalists were male and 3 were female. The hospitalists were a mean age of 31 1.6 years of age and had been practicing as a hospitalist for a mean of 2.1 1.0 years. The hospitalists saw an average of 9.4 4.0 patients on the days they were shadowed by the research assistant. Because simultaneous activities were recorded, a total of 5557 minutes of activities were recorded.
The distribution of total minutes recorded in each activity category is shown in Figure 1. Hospitalists spent 18% of their time doing direct patient care, 69% on indirect patient care, 4% on personal activities, and 3% each on professional development, education, and travel.
Of the time hospitalists directly cared for patients, 18% was spent obtaining histories and performing physical examinations on new patients, 53% seeing patients in follow‐up visits, 16% going over discharge instructions, and 13% in family meetings (Figure 2). Of the time hospitalists spent doing indirect patient care, 37% was taken up by documentation, 21% by reviewing results, 7% by orders, and 35% by communication (Figure 2).
As just explained, communication accounted for 35% of indirect patient care activities; it also accounted for 24% of the total activity minutes. The time spent by hospitalists on communication was further broken down as 23% paging other physicians, 31% returning pages, 34% in face‐to‐face communication, 5% taking report on new admissions, 4% on sign‐out to the night float hospitalist, and 3% receiving sign‐out from the night float hospitalist.
Multitasking, performing more than 1 activity at the same time, was done 21% of the time. Hospitalists received an average of 3.4 1.5 pages per hour, and 7% of total activity time was spent returning pages. Other forms of interruption were not evaluated.
DISCUSSION
Our study had several important findings. First, hospitalists spent most of their time on indirect patient care activities and relatively little time on direct patient care. Time‐motion studies of nonhospitalist physicians have reported similar findings.5, 6 A considerable amount of hospitalist time was spent on documentation. This finding also has been reported in studies of nonhospitalist physicians.5, 7
A unique finding in our study was the large amount of time, 24% of total minutes, spent on communication. A study of emergency medicine physicians by Hollingsworth found that 13% of their time was spent on communication activities.5 The large amount of time spent on communication in our study underscores the need for hospitalists to have outstanding communication skills and systems that support efficient communication. Hospitalists spent 6% of their total time paging other physicians and 7% returning pages. Improvements in the efficiency of paging communication could greatly reduce the amount of time communicating by page. Our paging system provides unidirectional alphanumeric paging. In an effort to improve the efficiency of paging, we have asked nurses and consultants to include FYI and callback in the text of the page so it is clear whether the person who has paged the hospitalist needs to be called back. This simple solution to help reduce the number of unnecessary callbacks has previously been proposed by others.8
Another part of solving this problem is adopting the use of 2‐way pagers instead of alphanumeric pagers. Two‐way paging can increase the efficiency of communication even further. For example, a nurse sends a hospitalist a page that asks if the previous diet orders for a patient just returned from a procedure can be resumed. This hospitalist is on another floor in another patient's room. Rather than spending time leaving the other patient's room, finding a phone, calling the floor, waiting for an answer, and then waiting on hold, the hospitalist simply texts a 1‐word answer, Yes, in the 2‐way paging system. In addition to the time occupied by paging activities, hospitalists spent a large amount of time in face‐to‐face communication (8% of total activity time). On the one hand, having hospitalists discuss patient care with consultants and nurses in person on an ongoing basis throughout the day may improve clinical efficiency. On the other hand, the constant potential for interruption may be problematic. Similarly, 2‐way paging could facilitate communication to such a degree that it could actually increase the frequency of interruptions. Research on improvements in communications systems, interventions to improve communication skills, and team‐based care is warranted in order to evaluate the impact on hospitalist workflow.
An important finding in our study was that multitasking and paging interruptions were common. Although this may come as no surprise to practicing hospitalists, the distraction caused by interruptions and multitasking is an important potential cause of medical errors.911 A thorough examination of the types of activities performed simultaneously and whether they contributed to medical error was beyond the scope of our study. Some activities, such as documenting a note on a patient while reviewing the patient's lab results, are concordant (ie, conducted for the same patient) and therefore may be unlikely to contribute to medical error. Other combinations of activities, such as returning a page about one patient while documenting a note on a different patient or having face‐to‐face communication about one patient while entering an order on another patient, are discordant. Discordant activities may contribute to medical error. Further research of the effect of hospitalist multitasking and interruption on medical error is warranted and should be conducted within the framework of concordant versus discordant activities.
We had hoped to find activities that could be performed by non‐physician providers. No high impact activities were discovered that would be better suited for a non‐physician provider in this study. Clerical tasks, such as calling for radiology orders or obtaining medical records, amounted to a small percentage of hospitalist time (less than 1% combined). We did identify several activities in which automation or process improvement would be helpful. Hospitalists spent 5% of time on the combined activity of documenting discharge instructions and writing out prescriptions. Our institution is in the process of implementing an electronic medical record and computerized physician order entry. We are currently working on an automated process to generate printed discharge instructions and prescriptions. This has the potential not only to improve efficiency, but also to eliminate medication errors, as care is transitioned to the outpatient setting.
Our study had several limitations. First, our findings reflect the experience at one institution. Hospitalist practices vary widely in their staffing and scheduling models as well as in their organizational support. The amount of time that hospitalists spend on activities may differ between practices and between individual hospitalists in the same practice. Another limitation to our study pertains to the workflow of our hospitalists and the locations of their patients. As discussed earlier, patients were assigned to a hospitalist according to time of admission, not location of admission. Because of this, the hospitalists were caring for patients on as many as 5 wards. Although travel time amounted to only 3% of total minutes, it is possible that communication time could have been reduced if patients were distributed to hospitalists on the basis of patient location rather than time of admission of patient. For example, physicians and nurses might spend less time communicating in person compared to communicating via unidirectional paging, which frequently requires waiting for a callback. Finally, our study only observed activities performed by the daytime hospitalists at our hospital. The distribution and types of activities performed by nighttime hospitalists may be somewhat different.
Our study may serve as a model for hospitalist time‐motion studies in other settings. Our findings are of particular importance to resident‐uncovered hospitalist programs in academic hospitals, a setting in which operational inefficiencies may be abundant as house staff members have been poorly positioned in the hospital organization to lobby for process change. We hope that our study is a precursor to research evaluating modifications to the environments and systems in which hospitalists work. Such modifications have the potential to improve productivity and work conditions and promote career satisfaction.
Acknowledgements
We thank Patricia Georgas for shadowing the hospitalists and collecting the data in this study.
- Society of Hospital Medicine. Available at http://www.hospitalmedicine.org/AM/Template.cfm?Section=FAQs106:441–445.
- ,.The hospitalist movement 5 years later.JAMA.2002;287:487–494.
- ,.Hospitalists in teaching hospitals: opportunities but not without danger.J Gen Intern Med.2004;4:392–393.
- ,,,,.How do physicians and nurses spend their time in the Emergency Department?Ann Emerg Med.1998;31:97–91.
- ,,,,.A time‐motion study of the activities of attending physicians in an Internal Medicine and Internal Medicine‐Pediatrics resident continuity clinic.Acad Med.2000;75:1138–1143.
- ,,,.Work interrupted: a comparison of workplace interruptions in emergency departments and primary care offices.Ann Emerg Med.2001;38:146–151.
- ,.Residents' suggestions for reducing errors in teaching hospitals.N Engl J Med.2003;348:851–855.
- ,,,.Emergency department workplace interruptions: are emergency physicians “interrupt‐driven” and “multitasking”?Acad Emerg Med.2000;7:1239–243.
- ,,.Understanding medical error and improving patient safety in the inpatient setting.Med Clin N Am.2002;86:847–867.
- ,,,.Sharps‐related injuries in health care workers: a case‐crossover study.Am J Med.2003;114:687–694.
The hospitalist model of care has experienced dramatic growth. In 2003 it was estimated that there were 8000 US hospitalists, a number projected to ultimately reach more than 19 000.1, 2 This rapid growth has largely been driven by improvements in clinical efficiency as a result of hospitalist programs. There is a substantial body of evidence showing that hospitalists reduce length of stay and inpatient costs.3 Despite the rapid growth and proven benefit to clinical efficiency, no studies have evaluated the type and frequency of activities that hospitalists perform during routine work. Although the use of hospitalists improves clinical efficiency for the hospital, relatively little is known about how the hospital can improve efficiency for the hospitalist.
Our institution greatly expanded our hospitalist program in June 2003 to create a resident‐uncovered hospitalist service. The impetus for this change was the need to comply with newly revised Accreditation Council for Graduate Medicine Education (ACGME) program requirements regarding resident duty hours. Many teaching hospitals have implemented similar resident‐uncovered hospitalist services.4 Inefficiencies in their work activities quickly became apparent to our hospitalists. Furthermore, our hospitalists believed that they frequently performed simultaneous activities and that they were excessively interrupted by pages.
To evaluate the type and frequency of activities that the hospitalists performed during routine work, we performed a time‐motion study of hospitalist physicians on the resident‐uncovered hospitalist service. Our goal was to identify areas for systems improvements and activities that were better suited for nonphysician providers and to quantify the time spent multitasking and the frequency of paging interruptions.
METHODS
Northwestern Memorial Hospital (NMH) is a 753‐bed hospital in Chicago, Illinois. NMH is the primary teaching hospital affiliated with the Feinberg School of Medicine of Northwestern University. There are 2 general medicine services at NMH: a traditional resident‐covered ward service and the resident‐uncovered hospitalist service. Patients are admitted to one of these 2 services on the basis of, in order of importance, capacity of the services, preference of the outpatient physician, and potential educational value of the admission. Patients admitted to the hospitalist service are preferentially given beds on specific wards intended for hospitalist service patients. Fourth‐year medical students are frequently paired with hospitalists during their medicine subinternship.
The resident‐uncovered hospitalist service comprises 5 daytime hospitalists on duty at a time. The hospitalists are on service for 7 consecutive days, usually followed by 7 consecutive days off. Hospitalists pick up new patients from the night float hospitalist each morning. Daytime admitting duties rotate on a daily basis. One hospitalist accepts new admissions each morning from 7:00 AM until noon. Two hospitalists accept admissions from noon until 5:00 PM. One hospitalist accepts admissions from 5:00 PM until 9:00 PM. One hospitalist is free from accepting new admissions each day. All daytime hospitalists begin the workday at 7:00 AM and leave when their duties are completed for the day. One night float hospitalist is on duty each night of the week. The night float hospitalist performs admissions and all cross cover activities from 7:00 PM until 7:00 AM.
We first conducted a pilot study to help identify specific activities that our hospitalists routinely perform. Broad categories and subcategories of activities were created based on the results of our pilot study, and a published time‐motion study performed on emergency medicine physicians5 (Table 1). Once activities were defined and codes established, our research assistant unobtrusively shadowed hospitalist physicians for periods lasting 3‐5 hours. The observation periods were distributed in order to sample all activities that a daytime hospitalist would perform throughout a typical week. Observation periods included 2 morning admitting periods, 4 morning nonadmitting periods, 4 afternoon admitting periods, 4 afternoon nonadmitting periods, and 2 admitting periods from 5:00 PM to 9:00 PM. Activities were recorded on a standardized data collection form in 1‐minute intervals. When multiple activities were performed at the same time, all activities were recorded in the same 1‐minute interval. Incoming pages were recorded as well. To minimize the possibility that observation would affect hospitalist behavior, the research assistant was instructed not to initiate conversation with the hospitalists.
| Direct patient care |
| Taking initial history and physical exam |
| Seeing patient in follow‐up visit |
| Going over discharge instructions |
| Family meetings |
| Indirect patient care |
| Reviewing test results and medical records |
| Documentation |
| Documenting history and physical, daily notes, filling out discharge instructions, writing out prescriptions |
| Communication |
| Taking report from night float, taking admission report, face‐to‐face discussion, initiating and returning pages |
| Orders |
| Writing/emnputting orders, calling radiology |
| Professional development |
| Going to conferences, grand rounds, etc |
| Reading articles, textbooks, online references |
| Education |
| Teaching during work rounds |
| Didactic sessions with subintern |
| Travel |
| Walking, taking elevator, etc |
| Personal |
| Lunch, washroom break, etc. |
The data collection forms were manually abstracted and minutes tallied for each category and subcategory, for which summary statistics were converted to percentage of total minutes.
RESULTS
Ten hospitalists were shadowed by a single research assistant for a total of 4467 minutes. Seven hospitalists were male and 3 were female. The hospitalists were a mean age of 31 1.6 years of age and had been practicing as a hospitalist for a mean of 2.1 1.0 years. The hospitalists saw an average of 9.4 4.0 patients on the days they were shadowed by the research assistant. Because simultaneous activities were recorded, a total of 5557 minutes of activities were recorded.
The distribution of total minutes recorded in each activity category is shown in Figure 1. Hospitalists spent 18% of their time doing direct patient care, 69% on indirect patient care, 4% on personal activities, and 3% each on professional development, education, and travel.
Of the time hospitalists directly cared for patients, 18% was spent obtaining histories and performing physical examinations on new patients, 53% seeing patients in follow‐up visits, 16% going over discharge instructions, and 13% in family meetings (Figure 2). Of the time hospitalists spent doing indirect patient care, 37% was taken up by documentation, 21% by reviewing results, 7% by orders, and 35% by communication (Figure 2).
As just explained, communication accounted for 35% of indirect patient care activities; it also accounted for 24% of the total activity minutes. The time spent by hospitalists on communication was further broken down as 23% paging other physicians, 31% returning pages, 34% in face‐to‐face communication, 5% taking report on new admissions, 4% on sign‐out to the night float hospitalist, and 3% receiving sign‐out from the night float hospitalist.
Multitasking, performing more than 1 activity at the same time, was done 21% of the time. Hospitalists received an average of 3.4 1.5 pages per hour, and 7% of total activity time was spent returning pages. Other forms of interruption were not evaluated.
DISCUSSION
Our study had several important findings. First, hospitalists spent most of their time on indirect patient care activities and relatively little time on direct patient care. Time‐motion studies of nonhospitalist physicians have reported similar findings.5, 6 A considerable amount of hospitalist time was spent on documentation. This finding also has been reported in studies of nonhospitalist physicians.5, 7
A unique finding in our study was the large amount of time, 24% of total minutes, spent on communication. A study of emergency medicine physicians by Hollingsworth found that 13% of their time was spent on communication activities.5 The large amount of time spent on communication in our study underscores the need for hospitalists to have outstanding communication skills and systems that support efficient communication. Hospitalists spent 6% of their total time paging other physicians and 7% returning pages. Improvements in the efficiency of paging communication could greatly reduce the amount of time communicating by page. Our paging system provides unidirectional alphanumeric paging. In an effort to improve the efficiency of paging, we have asked nurses and consultants to include FYI and callback in the text of the page so it is clear whether the person who has paged the hospitalist needs to be called back. This simple solution to help reduce the number of unnecessary callbacks has previously been proposed by others.8
Another part of solving this problem is adopting the use of 2‐way pagers instead of alphanumeric pagers. Two‐way paging can increase the efficiency of communication even further. For example, a nurse sends a hospitalist a page that asks if the previous diet orders for a patient just returned from a procedure can be resumed. This hospitalist is on another floor in another patient's room. Rather than spending time leaving the other patient's room, finding a phone, calling the floor, waiting for an answer, and then waiting on hold, the hospitalist simply texts a 1‐word answer, Yes, in the 2‐way paging system. In addition to the time occupied by paging activities, hospitalists spent a large amount of time in face‐to‐face communication (8% of total activity time). On the one hand, having hospitalists discuss patient care with consultants and nurses in person on an ongoing basis throughout the day may improve clinical efficiency. On the other hand, the constant potential for interruption may be problematic. Similarly, 2‐way paging could facilitate communication to such a degree that it could actually increase the frequency of interruptions. Research on improvements in communications systems, interventions to improve communication skills, and team‐based care is warranted in order to evaluate the impact on hospitalist workflow.
An important finding in our study was that multitasking and paging interruptions were common. Although this may come as no surprise to practicing hospitalists, the distraction caused by interruptions and multitasking is an important potential cause of medical errors.911 A thorough examination of the types of activities performed simultaneously and whether they contributed to medical error was beyond the scope of our study. Some activities, such as documenting a note on a patient while reviewing the patient's lab results, are concordant (ie, conducted for the same patient) and therefore may be unlikely to contribute to medical error. Other combinations of activities, such as returning a page about one patient while documenting a note on a different patient or having face‐to‐face communication about one patient while entering an order on another patient, are discordant. Discordant activities may contribute to medical error. Further research of the effect of hospitalist multitasking and interruption on medical error is warranted and should be conducted within the framework of concordant versus discordant activities.
We had hoped to find activities that could be performed by non‐physician providers. No high impact activities were discovered that would be better suited for a non‐physician provider in this study. Clerical tasks, such as calling for radiology orders or obtaining medical records, amounted to a small percentage of hospitalist time (less than 1% combined). We did identify several activities in which automation or process improvement would be helpful. Hospitalists spent 5% of time on the combined activity of documenting discharge instructions and writing out prescriptions. Our institution is in the process of implementing an electronic medical record and computerized physician order entry. We are currently working on an automated process to generate printed discharge instructions and prescriptions. This has the potential not only to improve efficiency, but also to eliminate medication errors, as care is transitioned to the outpatient setting.
Our study had several limitations. First, our findings reflect the experience at one institution. Hospitalist practices vary widely in their staffing and scheduling models as well as in their organizational support. The amount of time that hospitalists spend on activities may differ between practices and between individual hospitalists in the same practice. Another limitation to our study pertains to the workflow of our hospitalists and the locations of their patients. As discussed earlier, patients were assigned to a hospitalist according to time of admission, not location of admission. Because of this, the hospitalists were caring for patients on as many as 5 wards. Although travel time amounted to only 3% of total minutes, it is possible that communication time could have been reduced if patients were distributed to hospitalists on the basis of patient location rather than time of admission of patient. For example, physicians and nurses might spend less time communicating in person compared to communicating via unidirectional paging, which frequently requires waiting for a callback. Finally, our study only observed activities performed by the daytime hospitalists at our hospital. The distribution and types of activities performed by nighttime hospitalists may be somewhat different.
Our study may serve as a model for hospitalist time‐motion studies in other settings. Our findings are of particular importance to resident‐uncovered hospitalist programs in academic hospitals, a setting in which operational inefficiencies may be abundant as house staff members have been poorly positioned in the hospital organization to lobby for process change. We hope that our study is a precursor to research evaluating modifications to the environments and systems in which hospitalists work. Such modifications have the potential to improve productivity and work conditions and promote career satisfaction.
Acknowledgements
We thank Patricia Georgas for shadowing the hospitalists and collecting the data in this study.
- Society of Hospital Medicine. Available at http://www.hospitalmedicine.org/AM/Template.cfm?Section=FAQs106:441–445.
- ,.The hospitalist movement 5 years later.JAMA.2002;287:487–494.
- ,.Hospitalists in teaching hospitals: opportunities but not without danger.J Gen Intern Med.2004;4:392–393.
- ,,,,.How do physicians and nurses spend their time in the Emergency Department?Ann Emerg Med.1998;31:97–91.
- ,,,,.A time‐motion study of the activities of attending physicians in an Internal Medicine and Internal Medicine‐Pediatrics resident continuity clinic.Acad Med.2000;75:1138–1143.
- ,,,.Work interrupted: a comparison of workplace interruptions in emergency departments and primary care offices.Ann Emerg Med.2001;38:146–151.
- ,.Residents' suggestions for reducing errors in teaching hospitals.N Engl J Med.2003;348:851–855.
- ,,,.Emergency department workplace interruptions: are emergency physicians “interrupt‐driven” and “multitasking”?Acad Emerg Med.2000;7:1239–243.
- ,,.Understanding medical error and improving patient safety in the inpatient setting.Med Clin N Am.2002;86:847–867.
- ,,,.Sharps‐related injuries in health care workers: a case‐crossover study.Am J Med.2003;114:687–694.
Copyright © 2006 Society of Hospital Medicine
