User login
Do Combined Pharmacist and Prescriber Efforts on Medication Reconciliation Reduce Postdischarge Patient Emergency Department Visits and Hospital Readmissions?
Healthcare systems are targeting effective strategies to improve patient safety and reduce hospital readmissions. Hospital readmissions can be detrimental to patients’ health, a source of avoidable healthcare costs, and are frequently a reflection of the quality of patient care during transitions of care. Medication reconciliation (Med Rec) was identified as 1 of 12 interventions that may reduce 30-day readmissions; however, rigorously designed studies are scarce.1,2 Published systematic reviews and meta-analyses have produced mixed conclusions regarding the impact of Med Rec on unplanned 30-day readmissions.2-4
In several studies, researchers have established the positive impact of Med Rec on reducing patient medication discrepancies and potential adverse drug events.4-8 Pharmacy-led Med Rec interventions have been shown to easily identify more clinically relevant and higher impact medication discrepancies when compared to usual care.8 In a systematic review, Mueller et al.2 suggest that there are several interrelated elements that determine if a Med Rec intervention will influence hospital readmissions. These elements form a multicomponent “bundle” of interventions, including a systematic medication history process, admission reconciliation, patient education on discharge, discharge reconciliation, and communication to outpatient providers.9 Several prospective randomized controlled studies have demonstrated lower readmission rates and fewer visits to the emergency department (ED) after implementing a comprehensive, interprofessional, bundled intervention (including Med Rec) from admission to discharge.10-13 A 2016 systematic review and meta-analysis specifically evaluated pharmacy-led Med Rec programs (the majority of which included interventions involving multicomponent bundles) and demonstrated a significant reduction in posthospital healthcare utilization.14
Although comprehensive, interprofessional, bundled interventions have been shown to reduce readmission rates and ED visits in randomized controlled trials (RCTs), limited resources often prevent hospitals from consistently implementing all aspects of these multicomponent interventions. In practice, clinicians may provide varying components of the bundle, such as the combination of admission medication history by the pharmacist and discharge Med Rec completed by the physician alone. The unique impact of combined pharmacist and prescriber Med Rec interventions from admission to discharge on readmissions remains inconclusive. Further, it is unclear which high-risk patient groups will benefit the most from these interventions. We set out to evaluate the impact of an enhanced, interprofessional Med Rec process from admission to discharge (characterized within the context of a novel taxonomy continuum that specifies clinician involvement and intensity of services) on readmissions to hospital and ED visits within 30 days of discharge.
METHODS
We conducted a retrospective, observational, analytical cohort study using QuadraMed’s Computerized Patient Record and the EMITT (Electronic Medication Information Transfer Tool)15 to collect data from 2007 to 2011.
Setting
The study was conducted at a 417-bed tertiary care teaching hospital in Toronto, Ontario, Canada.
Med Rec Process and Description of Exposure (Intervention)
The targeted clinical areas had sustained interprofessional models of patient care in place from admission to discharge. They also were actively using an in-house EMITT to facilitate the documentation and tracking of Med Rec efforts throughout patient admission, transfer, and discharge.15 On admission, the pharmacist conducted a best possible medication history (BPMH). A BPMH provides the cornerstone for Med Rec. It differs from a routine medication history in that it involves (1) a systematic process for interviewing the patient (or family) and (2) a review of at least one other reliable source of information (eg, a provincial medication database, an inspection of medication vials, or contact with the community pharmacy) to obtain and verify patient medications (prescribed and nonprescribed). The pharmacist recorded the BPMH in the electronic patient record. The application supported admission and discharge Med Rec. On discharge, there were 2 options: (1) the prescriber alone would review and complete the discharge Med Rec and generate electronic prescriptions (Table 1, Silver level care) or (2) the pharmacist would collaborate with the prescriber to complete the discharge reconciliation and the prescriber would electronically generate prescriptions (Table 1, Gold level care). All clinical areas had a combined pharmacist and prescriber Med Rec model in place at admission, but the proportion of patients receiving discharge reconciliation completed by pharmacist and prescriber versus the prescriber-alone varied based on the individual clinician’s practices.
Patient Selection
All consecutive hospitalized patients admitted and discharged by the general internal medicine [GIM] service from March 2007 to December 2011 were included. The GIM service was chosen for the main analysis because they had been performing the intervention for the longest period of time and had the largest population of patients. Patients were identified via their hospital-specific medical record identification number and specific hospital-visit number. Patients were excluded if any of the following occurred: (1) the length of stay of their index admission was less than 24 hours; (2) they died during the visit; (3) they were transferred to a separate acute care inpatient facility; or (4) they left hospital against medical advice. Patient visits were excluded as index cases from the analysis if they were returning within 90 days of a previous discharge.
Outcomes
The primary study outcome was the occurrence of an inpatient readmission or ED visit within 30 days of discharge. In our secondary analyses, we examined the impact of the intervention on high-risk patient populations, such as those ≥65 years of age, with a length of stay, acuity of admission, Charlson comorbidity index, and emergency department visits in past 6 months (LACE) index score ≥10 (see supplementary Appendix 1 for LACE score description), on high-alert medications (1 or more of warfarin, insulin, digoxin, and opioids), and on ≥10 medications.
Data Collection
Identification of Exposure of Interest
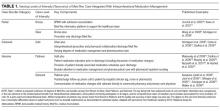
We used the electronic database to capture all patients who received pharmacist and prescriber supported admission-to-discharge reconciliation. We explicitly defined increasing intensity of Med Rec care in categories of Bronze, Silver, and Gold care levels (Table 1). The exposed (intervention) group received an enhanced Med Rec bundle (patients receiving Gold level care). The control group was made of patients receiving a partial Med Rec Bundle (patients receiving Silver or Bronze level of care or below).
Determination of Hospital Visits
A search of administrative databases was used to determine if patients admitted to the targeted services had an ED visit or urgent inpatient admission to the study hospital within 30 days.
Statistical Analysis
A logistic regression for outcomes was performed. This yielded an adjusted odds ratio with a 95% confidence interval (CI) between the intervention and control groups. Statistical significance was determined with a 2-sided α level of 0.05. In the analysis, we used Statistical Analysis Software version 9.2.
In our multivariate logistic regression model, we adjusted for confounding factors that might influence the patients’ risk of readmission or the type of Med Rec they received upon discharge. By using administrative databases, patient level demographics, and the Charlson comorbidity index, the most responsible diagnosis and disease burden were collected. Medication-related factors collected included the number of medications on discharge and the presence of predefined high-alert medications. The number of medications on the medication discharge list was determined by using the electronic database. The final adjustment model included age, gender, the number of medications on discharge, and the LACE index score (supplementary Appendix 1). The LACE index score has been validated in Ontario, Canada, populations to quantify the risk of death or unplanned readmission within 30 days of discharge.24
Propensity Score Adjustment
Propensity scoring (probability of treatment assignment conditional on observed baseline characteristics) was planned a priori to account for possible factors that would impact whether a patient received the intervention or control care levels. The propensity score for receiving Med Rec was computed from a logistic model using Med Rec as the outcome. A structured iterative approach was used to refine this model to achieve covariate balance within the matched pairs. Covariate balance was measured by the standardized difference, in which an absolute standardized difference >10% represents meaningful imbalance.25 From the original cohort, we attempted to match patients who had the intervention to patients from the control by means of a matching algorithm using the logit of the propensity score for receiving the intervention.26
Subgroup Analysis
We also examined the impact of the intervention on high-risk patient populations such as those ≥65 years of age, with a LACE index score ≥10, on high-alert medications, and on ≥10 medications. A univariate analysis was conducted to identify patient-related risk predictors that may be independently correlated with a higher risk of hospital visits.
RESULTS
Baseline Characteristics
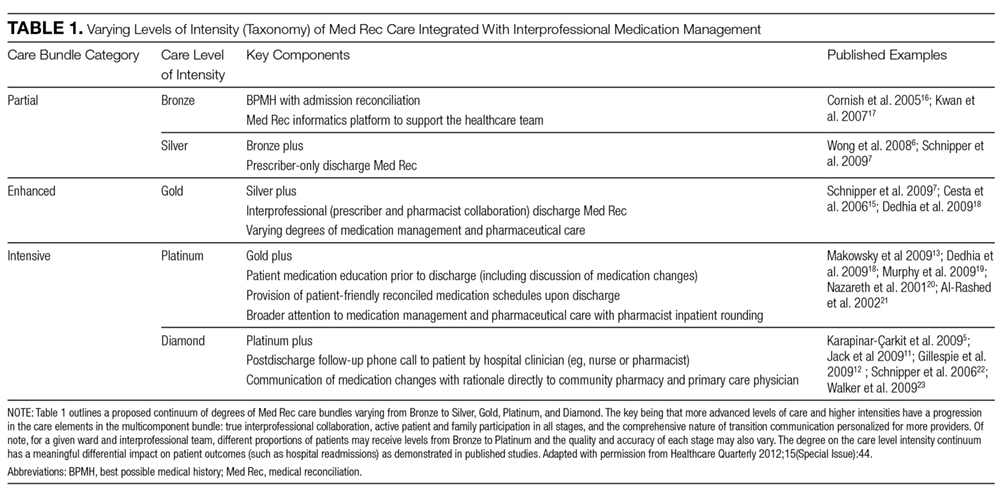
A total of 8678 patients representing 9931 unique visits met the inclusion criteria for analysis. There were 2541 unique visits (approximately 26% of visits) in the intervention group that received Gold level care and 7390 unique visits in the control group. The patients in the control group were largely patients who received the original standard of care at the institution, Silver level care (67% of the control group). Patients who received Bronze level care or less comprised 33% of the control group.
Patients in the intervention group were significantly older (average of 68 years old versus 64 years old) and on more medications. They also notably had a longer duration of stay in hospital, an increased percentage of visits with a LACE index score ≥10, and were more likely to be discharged home on a high-alert medication and with supports (Table 2).
Main Analysis
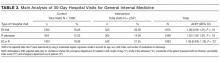

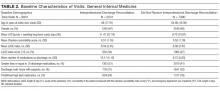
The main unadjusted analysis of GIM patients (n = 9931 visits) did not detect a difference in 30-day ED visits and readmissions between the intervention group (540 out of 2541; 21.2%) and control (1423 out of 7390; 19.3%; Table 3). By using a multivariate logistic regression model to account for age, sex, LACE index, and number of medications on discharge, the adjusted odds ratio was 1.06 (95% CI, 0.95-1.19; P = 0.33). After propensity score adjustment, the relative risk of readmission was 0.88 (16.7% vs 18.9%; 95% CI, 0.59-1.32; P = 0.54).
Secondary Analyses
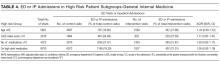
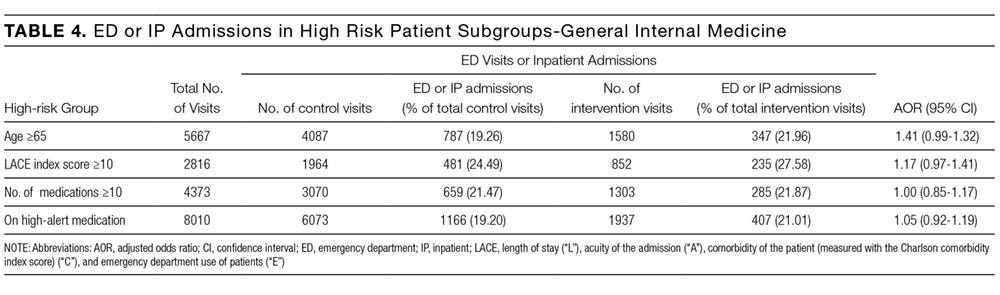
In each predefined high-risk patient subgroup (age ≥65, LACE index score ≥10, number of discharge medications ≥10, and the presence of high-alert medications), analyses of our primary endpoint did not detect significant adjusted odds ratios (Table 4). In our univariate analysis, increasing number of medications, LACE index score, and male gender were independently correlated with a higher risk of hospital visits (supplementary Appendix 2).
DISCUSSION
Med Rec is widely recommended as a patient safety strategy to prevent clinically significant medication discrepancies at transitions in care.4-9 However, Med Rec varies widely in terms of what it entails and who delivers it, with the preponderance of evidence suggesting an impact on clinically significant medication discrepancies only when interprofessional care delivered includes a central role for pharmacists.27 Furthermore, Med Rec appears to impact short term readmissions only when embedded in a broader, multifaceted, bundled intervention in which pharmacists or other team members educate patients about their medications and deliver postdischarge follow-up phone calls.10-13
As very few hospitals have the resources to sustainably deliver intensive care bundles that are represented in RCTs (characterized by Platinum and Diamond levels of care in Table 1), in our observational study, we sought to explore whether a resource-attainable, enhanced Med Rec care bundle (Gold level) had an impact on hospital utilization compared to partial Med Rec care bundles (Bronze and Silver levels). In our findings, we did not detect a significant difference on ED visits and readmissions within 30 days between enhanced and partial care bundles. In a secondary analysis of the influence of the intervention on prespecified high-risk patient subgroups, we also did not detect a difference.
As far as we are aware, our long-term, observational study is the largest to date to explore a real-life, enhanced Med Rec intervention and examine its impact on meaningful patient outcomes. We extrapolated that our intervention group received several critical attributes of a successful bundle as discussed by Mueller in a systematic review.2 Our intervention included the following: (1) a systematic BPMH process on admission; (2) integrated admission-to-discharge reconciliation processes; (3) discharge delineation of medication changes since admission; (4) pharmacist involvement in reconciliation from admission to discharge; (5) an electronic platform; and (6) formal discharge reconciliation with interprofessional collaboration. Additional components in the bundle described by Mueller included the following: patient education at discharge, postdischarge communication with the patient, and communication with outpatient providers and medication management.
In our results, we did not find a difference in outcomes between the intervention and control groups. Therefore, it is possible that the enhanced bundle’s focus on interprofessional involvement in discharge reconciliation (Gold care level) has no impact on hospital utilization compared to partial care bundles (Silver and Bronze levels). Kwan et al.3 describe similar findings in their systematic review, in which they evaluated the effects of hospital-based Med Rec on unintentional discrepancies with nontrivial risks for harm to patients on 30-day postdischarge hospital visits. Kwan et al.3 concluded that larger well-designed studies are required to further evaluate this outcome, but authors of current published studies suggest that Med Rec alone probably does not reduce postdischarge hospital utilization within 30 days. Med Rec may have a more significant impact on utilization when bundled with other interventions that improve discharge coordination.3
There may be several reasons why we were unable to detect a significant difference between the intervention and control groups. One limitation is that our nonrandomized, retrospective design may have led to unmeasured confounders that impacted allocation into the intervention group versus the control group. It was notable that patients in the intervention group had an increased age, longer duration of hospital stay, more medications, and high-alert medications on discharge compared to the control group and that may have biased our results towards the null hypothesis. Although the propensity score analysis attempted to adjust for this, it also did not detect a significant difference between groups.
In addition, the existing standard of care during the study period allowed for patients in the control group to receive varying levels of Med Rec. Ideally, we would have compared the intervention to a placebo group that did not receive any Med Rec-related care elements. However, as this was a real-life observational study, the majority of patients received some Med Rec services as a part of the standard of care. As a result, 67% of patients in the control group received Silver level Med Rec with a BPMH, admission reconciliation, and prescriber-only discharge reconciliation. This may have made it more difficult to show an incremental benefit on readmissions between the intervention and control.
Also, our primary outcome of all-cause ED or hospital readmissions within 30 days may not have been sensitive enough to detect the effect of Med Rec interventions alone. Only a small proportion of readmissions within 30 days of discharge are preventable and many patient and community level factors responsible for readmissions cannot be controlled by the hospital’s actions.28 Comprehensive pharmacy interventions have demonstrated decreased hospitalizations and emergency visits at 12 months; however, the largest impact was seen on the more specific outcome of medication-related hospitalizations (80% reduction).29 Lastly, another limitation was that we were unable to capture hospital visits to other centres. However, in our region, almost 75% of readmissions are to the same site as the initial hospitalization.30
Overall, our findings in this study and novel characterization of Med Rec services are relevant to many hospital sites that are striving to implement integrated Med Rec with limited healthcare resources. Although interprofessional Med Rec likely reduces clinically significant medication discrepancies, enhanced interprofessional Med Rec on discharge (Gold Med Rec) alone may not be enough to impact hospital utilization compared to partial Med Rec services (Silver and Bronze Med Rec). Further research into practical, targeted Med Rec bundles on more specific outcomes (such as preventable postdischarge adverse events, “avoidable” hospital readmissions, and medication-related readmissions) may detect a significant benefit.
CONCLUSION
A long-term observational evaluation of interprofessional Med Rec did not detect a difference in 30-day postdischarge patient hospital visits between patients who received enhanced versus partial Med Rec patient care bundles. Researchers of future prospective studies could focus on evaluating high-risk populations or specific elements of Med Rec services on avoidable medication-related hospital admissions and postdischarge adverse drug events.
Acknowledgments
The authors thank Nita Dhir, MBA.
Presented as a poster and oral presentation at the 2012 American College of Clinical Pharmacy Annual Meeting, Hollywood, Florida, October 21-24, 2012, and as an encore poster presentation at the Canadian Society of Hospital Pharmacists Professional Practice Conference, Toronto, Canada, Feb 3, 2013.
Disclosure
The authors declare no conflicts of interest related to the manuscript submitted. All monies used for the research came from the University Health Network Department of Pharmacy Budget, including the pharmacy residency program.
1. Hansen LO, Young RS, Hinami K, Leung A, Williams MV. Interventions to reduce 30-day rehospitalization: a systematic review. Ann Intern Med. 2011;155:520-528. PubMed
2. Mueller SK, Sponsler KC, Kripalani S, Schnipper JL. Hospital-based medication reconciliation practices: a systematic review. Arch Intern Med. 2012;172(14):1057-1069. PubMed
3. Kwan JL, Lo L, Sampson M, Shojania KG. Medication reconciliation during transitions of care as a patient safety strategy: a systematic review. Ann Intern Med. 2013;158:397-403. PubMed
4. Safer Health Care Now. Medication Reconciliation in Home Care Getting Started Kit. March 2015. www.ismp-canada.org/download/MedRec/Medrec_HC_English_GSK_v2.pdf. Accessed August 22, 2017.
5. Karapinar-Çarkit F, Borgsteede SD, Zoer J, Smit HJ, Egberts AC, van den Bemt PM. Effect of medication reconciliation with and without patient counseling on the number of pharmaceutical interventions among patients discharged from the hospital. Ann Pharmacother. 2009;43(6):1001-1010. PubMed
6. Wong JD, Bajcar JM, Wong GG, et al. Medication reconciliation at hospital discharge: evaluating discrepancies. Ann Pharmacother. 2008;42(10):1373-1379. PubMed
7. Schnipper JL, Hamann C, Ndumele CD, et al. Effect of an electronic medication reconciliation application and process redesign on potential adverse drug events: a cluster-randomized trial. Arch Intern Med. 2009;169(8):771-780. PubMed
8. Mekonnen AB, McLachlan AJ, Brien JA. Pharmacy-led medication reconciliation programmes at hospital transitions: a systematic review and meta-analysis. J Clin Pharm Ther. 2016;41(2):128-144. PubMed
9. Kaboli PJ, Fernandes O. Medication reconciliation: moving forward. Arch Intern Med. 2012;172(14):1069-1070. PubMed
10. Koehler BE, Richter KM, Youngblood L, et al. Reduction of 30-day postdischarge hospital readmission or emergency department (ED) visit rates in high-risk elderly medical patients through delivery of a targeted care bundle. J Hosp Med. 2009;4:211-218. PubMed
11. Jack BW, Chetty VK, Anthony D, et al. A reengineered hospital discharge program to decrease rehospitalization: a randomized trial. Ann Intern Med. 2009;150:178-187. PubMed
12. Gillespie U, Alassaad A, Henrohn D, et al. A comprehensive pharmacist intervention to reduce morbidity in patients 80 years or older. Arch Intern Med. 2009:169(9):894-900. PubMed
13. Makowsky MJ, Koshman SL, Midodzi WK, Tsuyuki RT. Capturing outcomes of clinical activities performed by a rounding pharmacist practicing in a team environment: the COLLABORATE study [NCT00351676]. Med Care. 2009;47(6):642-650. PubMed
14. Mekonnen AB, McLachlan AJ, Brien JA. Effectiveness of pharmacist-led medication reconciliation programmes on clinical outcomes at hospital transitions: a systematic review and meta-analysis. BMJ Open. 2016;6(2):e010003. PubMed
15. Cesta A, Bajcar JM, Ong SW, Fernandes OA. The EMITT study: development and evaluation of a medication information transfer tool. Ann Pharmacother. 2006:40(6):1074-1081 PubMed
16. Cornish P, et al. Unintended medication discrepancies at the time of hospital admission. Arch Internal Medicine, 2005, Feb: 165: 424-29. PubMed
17. Kwan Y, Fernandes OA, Nagge JJ, et al. Pharmacist medication assessments in a surgical preadmission clinic. Arch Intern Med. 2007;167(10):1034-1040 PubMed
18. Dedhia P, Kravet S, Bulger J, et al. A quality improvement intervention to facilitate the transition of older adults from three hospitals back to their homes. J Am Geriatr Soc. 2009;57:1540–1546. PubMed
19. Murphy EM, Oxencis CJ, Klauck JA, et al. Medication reconciliation at an academic medical center: implementation of a comprehensive program from admission to discharge. Am J Health Syst Pharm. 2009;66:2126–31 PubMed
20. , , , , , . A pharmacy discharge plan for hospitalized elderly patients - a randomized controlled trial. Age and Ageing. 2001;30(1):33-40. PubMed
21. Al-Rashed SA, Wright DJ, Roebuck N, et al. The value of inpatient pharmaceutical counselling to elderly patients prior to discharge. Br J Clin Pharmacol. 2002 Dec;54(6):657–64. PubMed
22. Schnipper JL, Kirwin JL, Cotugno MC, et al. Role of pharmacist counseling in preventing adverse drug events after hospitalization. Arch Intern Med. 2006 Mar 13;166(5):565–71. PubMed
23. Walker PC, Bernstein SJ, Jones JN, et al. Impact of a pharmacist-facilitated hospital discharge program: a quasi-experimental study. Arch Intern Med. 2009 Nov 23;169(21):2003–10. PubMed
24. van Walraven C, Dhalla IA, Bell C, et al. Derivation and validation of an index to predict early death or unplanned readmission after discharge from hospital to the community. CMAJ. 2010;182(6):551-557. PubMed
25. Normand ST, Landrum MB, Guadagnoli E, et al. Validating recommendations for coronary angiography following an acute myocardial infarction in the elderly: a matched analysis using propensity scores. J Clin Epidemiol. 2001;54(4):387-398. PubMed
26. Rosenbaum PR., Donald BR. Constructing a control group using multivariate matched sampling methods that incorporate the propensity score. Am Stat. 1985;39(1):33-38.
27. Fernandes O, Shojania KG. Medication reconciliation in the hospital: what, why, where, when, who and how? Healthc Q. 2012;15(Special Issue):42-49. PubMed
28. Joynt KE, Jha AK. Thirty-day readmissions—truth and consequences. N Engl J Med. 2012;366(15):1366-1369. PubMed
29. Zed PJ, Abu-Laban RB, Balen RM, et al. Incidence, severity and preventability of medication-related visits to the emergency department: a prospective study. CMAJ. 2008;178(12):1563-1569. PubMed
30. Gruneir A, Dhalla IA, van Walraven C, et al. Unplanned readmissions after hospital discharge among patients identified as being at high risk for readmission using a validated predictive algorithm. Open Med. 2011;5(2):e104-e111. PubMed
Healthcare systems are targeting effective strategies to improve patient safety and reduce hospital readmissions. Hospital readmissions can be detrimental to patients’ health, a source of avoidable healthcare costs, and are frequently a reflection of the quality of patient care during transitions of care. Medication reconciliation (Med Rec) was identified as 1 of 12 interventions that may reduce 30-day readmissions; however, rigorously designed studies are scarce.1,2 Published systematic reviews and meta-analyses have produced mixed conclusions regarding the impact of Med Rec on unplanned 30-day readmissions.2-4
In several studies, researchers have established the positive impact of Med Rec on reducing patient medication discrepancies and potential adverse drug events.4-8 Pharmacy-led Med Rec interventions have been shown to easily identify more clinically relevant and higher impact medication discrepancies when compared to usual care.8 In a systematic review, Mueller et al.2 suggest that there are several interrelated elements that determine if a Med Rec intervention will influence hospital readmissions. These elements form a multicomponent “bundle” of interventions, including a systematic medication history process, admission reconciliation, patient education on discharge, discharge reconciliation, and communication to outpatient providers.9 Several prospective randomized controlled studies have demonstrated lower readmission rates and fewer visits to the emergency department (ED) after implementing a comprehensive, interprofessional, bundled intervention (including Med Rec) from admission to discharge.10-13 A 2016 systematic review and meta-analysis specifically evaluated pharmacy-led Med Rec programs (the majority of which included interventions involving multicomponent bundles) and demonstrated a significant reduction in posthospital healthcare utilization.14
Although comprehensive, interprofessional, bundled interventions have been shown to reduce readmission rates and ED visits in randomized controlled trials (RCTs), limited resources often prevent hospitals from consistently implementing all aspects of these multicomponent interventions. In practice, clinicians may provide varying components of the bundle, such as the combination of admission medication history by the pharmacist and discharge Med Rec completed by the physician alone. The unique impact of combined pharmacist and prescriber Med Rec interventions from admission to discharge on readmissions remains inconclusive. Further, it is unclear which high-risk patient groups will benefit the most from these interventions. We set out to evaluate the impact of an enhanced, interprofessional Med Rec process from admission to discharge (characterized within the context of a novel taxonomy continuum that specifies clinician involvement and intensity of services) on readmissions to hospital and ED visits within 30 days of discharge.
METHODS
We conducted a retrospective, observational, analytical cohort study using QuadraMed’s Computerized Patient Record and the EMITT (Electronic Medication Information Transfer Tool)15 to collect data from 2007 to 2011.
Setting
The study was conducted at a 417-bed tertiary care teaching hospital in Toronto, Ontario, Canada.
Med Rec Process and Description of Exposure (Intervention)
The targeted clinical areas had sustained interprofessional models of patient care in place from admission to discharge. They also were actively using an in-house EMITT to facilitate the documentation and tracking of Med Rec efforts throughout patient admission, transfer, and discharge.15 On admission, the pharmacist conducted a best possible medication history (BPMH). A BPMH provides the cornerstone for Med Rec. It differs from a routine medication history in that it involves (1) a systematic process for interviewing the patient (or family) and (2) a review of at least one other reliable source of information (eg, a provincial medication database, an inspection of medication vials, or contact with the community pharmacy) to obtain and verify patient medications (prescribed and nonprescribed). The pharmacist recorded the BPMH in the electronic patient record. The application supported admission and discharge Med Rec. On discharge, there were 2 options: (1) the prescriber alone would review and complete the discharge Med Rec and generate electronic prescriptions (Table 1, Silver level care) or (2) the pharmacist would collaborate with the prescriber to complete the discharge reconciliation and the prescriber would electronically generate prescriptions (Table 1, Gold level care). All clinical areas had a combined pharmacist and prescriber Med Rec model in place at admission, but the proportion of patients receiving discharge reconciliation completed by pharmacist and prescriber versus the prescriber-alone varied based on the individual clinician’s practices.
Patient Selection
All consecutive hospitalized patients admitted and discharged by the general internal medicine [GIM] service from March 2007 to December 2011 were included. The GIM service was chosen for the main analysis because they had been performing the intervention for the longest period of time and had the largest population of patients. Patients were identified via their hospital-specific medical record identification number and specific hospital-visit number. Patients were excluded if any of the following occurred: (1) the length of stay of their index admission was less than 24 hours; (2) they died during the visit; (3) they were transferred to a separate acute care inpatient facility; or (4) they left hospital against medical advice. Patient visits were excluded as index cases from the analysis if they were returning within 90 days of a previous discharge.
Outcomes
The primary study outcome was the occurrence of an inpatient readmission or ED visit within 30 days of discharge. In our secondary analyses, we examined the impact of the intervention on high-risk patient populations, such as those ≥65 years of age, with a length of stay, acuity of admission, Charlson comorbidity index, and emergency department visits in past 6 months (LACE) index score ≥10 (see supplementary Appendix 1 for LACE score description), on high-alert medications (1 or more of warfarin, insulin, digoxin, and opioids), and on ≥10 medications.
Data Collection
Identification of Exposure of Interest
We used the electronic database to capture all patients who received pharmacist and prescriber supported admission-to-discharge reconciliation. We explicitly defined increasing intensity of Med Rec care in categories of Bronze, Silver, and Gold care levels (Table 1). The exposed (intervention) group received an enhanced Med Rec bundle (patients receiving Gold level care). The control group was made of patients receiving a partial Med Rec Bundle (patients receiving Silver or Bronze level of care or below).
Determination of Hospital Visits
A search of administrative databases was used to determine if patients admitted to the targeted services had an ED visit or urgent inpatient admission to the study hospital within 30 days.
Statistical Analysis
A logistic regression for outcomes was performed. This yielded an adjusted odds ratio with a 95% confidence interval (CI) between the intervention and control groups. Statistical significance was determined with a 2-sided α level of 0.05. In the analysis, we used Statistical Analysis Software version 9.2.
In our multivariate logistic regression model, we adjusted for confounding factors that might influence the patients’ risk of readmission or the type of Med Rec they received upon discharge. By using administrative databases, patient level demographics, and the Charlson comorbidity index, the most responsible diagnosis and disease burden were collected. Medication-related factors collected included the number of medications on discharge and the presence of predefined high-alert medications. The number of medications on the medication discharge list was determined by using the electronic database. The final adjustment model included age, gender, the number of medications on discharge, and the LACE index score (supplementary Appendix 1). The LACE index score has been validated in Ontario, Canada, populations to quantify the risk of death or unplanned readmission within 30 days of discharge.24
Propensity Score Adjustment
Propensity scoring (probability of treatment assignment conditional on observed baseline characteristics) was planned a priori to account for possible factors that would impact whether a patient received the intervention or control care levels. The propensity score for receiving Med Rec was computed from a logistic model using Med Rec as the outcome. A structured iterative approach was used to refine this model to achieve covariate balance within the matched pairs. Covariate balance was measured by the standardized difference, in which an absolute standardized difference >10% represents meaningful imbalance.25 From the original cohort, we attempted to match patients who had the intervention to patients from the control by means of a matching algorithm using the logit of the propensity score for receiving the intervention.26
Subgroup Analysis
We also examined the impact of the intervention on high-risk patient populations such as those ≥65 years of age, with a LACE index score ≥10, on high-alert medications, and on ≥10 medications. A univariate analysis was conducted to identify patient-related risk predictors that may be independently correlated with a higher risk of hospital visits.
RESULTS
Baseline Characteristics
A total of 8678 patients representing 9931 unique visits met the inclusion criteria for analysis. There were 2541 unique visits (approximately 26% of visits) in the intervention group that received Gold level care and 7390 unique visits in the control group. The patients in the control group were largely patients who received the original standard of care at the institution, Silver level care (67% of the control group). Patients who received Bronze level care or less comprised 33% of the control group.
Patients in the intervention group were significantly older (average of 68 years old versus 64 years old) and on more medications. They also notably had a longer duration of stay in hospital, an increased percentage of visits with a LACE index score ≥10, and were more likely to be discharged home on a high-alert medication and with supports (Table 2).
Main Analysis
The main unadjusted analysis of GIM patients (n = 9931 visits) did not detect a difference in 30-day ED visits and readmissions between the intervention group (540 out of 2541; 21.2%) and control (1423 out of 7390; 19.3%; Table 3). By using a multivariate logistic regression model to account for age, sex, LACE index, and number of medications on discharge, the adjusted odds ratio was 1.06 (95% CI, 0.95-1.19; P = 0.33). After propensity score adjustment, the relative risk of readmission was 0.88 (16.7% vs 18.9%; 95% CI, 0.59-1.32; P = 0.54).
Secondary Analyses
In each predefined high-risk patient subgroup (age ≥65, LACE index score ≥10, number of discharge medications ≥10, and the presence of high-alert medications), analyses of our primary endpoint did not detect significant adjusted odds ratios (Table 4). In our univariate analysis, increasing number of medications, LACE index score, and male gender were independently correlated with a higher risk of hospital visits (supplementary Appendix 2).
DISCUSSION
Med Rec is widely recommended as a patient safety strategy to prevent clinically significant medication discrepancies at transitions in care.4-9 However, Med Rec varies widely in terms of what it entails and who delivers it, with the preponderance of evidence suggesting an impact on clinically significant medication discrepancies only when interprofessional care delivered includes a central role for pharmacists.27 Furthermore, Med Rec appears to impact short term readmissions only when embedded in a broader, multifaceted, bundled intervention in which pharmacists or other team members educate patients about their medications and deliver postdischarge follow-up phone calls.10-13
As very few hospitals have the resources to sustainably deliver intensive care bundles that are represented in RCTs (characterized by Platinum and Diamond levels of care in Table 1), in our observational study, we sought to explore whether a resource-attainable, enhanced Med Rec care bundle (Gold level) had an impact on hospital utilization compared to partial Med Rec care bundles (Bronze and Silver levels). In our findings, we did not detect a significant difference on ED visits and readmissions within 30 days between enhanced and partial care bundles. In a secondary analysis of the influence of the intervention on prespecified high-risk patient subgroups, we also did not detect a difference.
As far as we are aware, our long-term, observational study is the largest to date to explore a real-life, enhanced Med Rec intervention and examine its impact on meaningful patient outcomes. We extrapolated that our intervention group received several critical attributes of a successful bundle as discussed by Mueller in a systematic review.2 Our intervention included the following: (1) a systematic BPMH process on admission; (2) integrated admission-to-discharge reconciliation processes; (3) discharge delineation of medication changes since admission; (4) pharmacist involvement in reconciliation from admission to discharge; (5) an electronic platform; and (6) formal discharge reconciliation with interprofessional collaboration. Additional components in the bundle described by Mueller included the following: patient education at discharge, postdischarge communication with the patient, and communication with outpatient providers and medication management.
In our results, we did not find a difference in outcomes between the intervention and control groups. Therefore, it is possible that the enhanced bundle’s focus on interprofessional involvement in discharge reconciliation (Gold care level) has no impact on hospital utilization compared to partial care bundles (Silver and Bronze levels). Kwan et al.3 describe similar findings in their systematic review, in which they evaluated the effects of hospital-based Med Rec on unintentional discrepancies with nontrivial risks for harm to patients on 30-day postdischarge hospital visits. Kwan et al.3 concluded that larger well-designed studies are required to further evaluate this outcome, but authors of current published studies suggest that Med Rec alone probably does not reduce postdischarge hospital utilization within 30 days. Med Rec may have a more significant impact on utilization when bundled with other interventions that improve discharge coordination.3
There may be several reasons why we were unable to detect a significant difference between the intervention and control groups. One limitation is that our nonrandomized, retrospective design may have led to unmeasured confounders that impacted allocation into the intervention group versus the control group. It was notable that patients in the intervention group had an increased age, longer duration of hospital stay, more medications, and high-alert medications on discharge compared to the control group and that may have biased our results towards the null hypothesis. Although the propensity score analysis attempted to adjust for this, it also did not detect a significant difference between groups.
In addition, the existing standard of care during the study period allowed for patients in the control group to receive varying levels of Med Rec. Ideally, we would have compared the intervention to a placebo group that did not receive any Med Rec-related care elements. However, as this was a real-life observational study, the majority of patients received some Med Rec services as a part of the standard of care. As a result, 67% of patients in the control group received Silver level Med Rec with a BPMH, admission reconciliation, and prescriber-only discharge reconciliation. This may have made it more difficult to show an incremental benefit on readmissions between the intervention and control.
Also, our primary outcome of all-cause ED or hospital readmissions within 30 days may not have been sensitive enough to detect the effect of Med Rec interventions alone. Only a small proportion of readmissions within 30 days of discharge are preventable and many patient and community level factors responsible for readmissions cannot be controlled by the hospital’s actions.28 Comprehensive pharmacy interventions have demonstrated decreased hospitalizations and emergency visits at 12 months; however, the largest impact was seen on the more specific outcome of medication-related hospitalizations (80% reduction).29 Lastly, another limitation was that we were unable to capture hospital visits to other centres. However, in our region, almost 75% of readmissions are to the same site as the initial hospitalization.30
Overall, our findings in this study and novel characterization of Med Rec services are relevant to many hospital sites that are striving to implement integrated Med Rec with limited healthcare resources. Although interprofessional Med Rec likely reduces clinically significant medication discrepancies, enhanced interprofessional Med Rec on discharge (Gold Med Rec) alone may not be enough to impact hospital utilization compared to partial Med Rec services (Silver and Bronze Med Rec). Further research into practical, targeted Med Rec bundles on more specific outcomes (such as preventable postdischarge adverse events, “avoidable” hospital readmissions, and medication-related readmissions) may detect a significant benefit.
CONCLUSION
A long-term observational evaluation of interprofessional Med Rec did not detect a difference in 30-day postdischarge patient hospital visits between patients who received enhanced versus partial Med Rec patient care bundles. Researchers of future prospective studies could focus on evaluating high-risk populations or specific elements of Med Rec services on avoidable medication-related hospital admissions and postdischarge adverse drug events.
Acknowledgments
The authors thank Nita Dhir, MBA.
Presented as a poster and oral presentation at the 2012 American College of Clinical Pharmacy Annual Meeting, Hollywood, Florida, October 21-24, 2012, and as an encore poster presentation at the Canadian Society of Hospital Pharmacists Professional Practice Conference, Toronto, Canada, Feb 3, 2013.
Disclosure
The authors declare no conflicts of interest related to the manuscript submitted. All monies used for the research came from the University Health Network Department of Pharmacy Budget, including the pharmacy residency program.
1. Hansen LO, Young RS, Hinami K, Leung A, Williams MV. Interventions to reduce 30-day rehospitalization: a systematic review. Ann Intern Med. 2011;155:520-528. PubMed
2. Mueller SK, Sponsler KC, Kripalani S, Schnipper JL. Hospital-based medication reconciliation practices: a systematic review. Arch Intern Med. 2012;172(14):1057-1069. PubMed
3. Kwan JL, Lo L, Sampson M, Shojania KG. Medication reconciliation during transitions of care as a patient safety strategy: a systematic review. Ann Intern Med. 2013;158:397-403. PubMed
4. Safer Health Care Now. Medication Reconciliation in Home Care Getting Started Kit. March 2015. www.ismp-canada.org/download/MedRec/Medrec_HC_English_GSK_v2.pdf. Accessed August 22, 2017.
5. Karapinar-Çarkit F, Borgsteede SD, Zoer J, Smit HJ, Egberts AC, van den Bemt PM. Effect of medication reconciliation with and without patient counseling on the number of pharmaceutical interventions among patients discharged from the hospital. Ann Pharmacother. 2009;43(6):1001-1010. PubMed
6. Wong JD, Bajcar JM, Wong GG, et al. Medication reconciliation at hospital discharge: evaluating discrepancies. Ann Pharmacother. 2008;42(10):1373-1379. PubMed
7. Schnipper JL, Hamann C, Ndumele CD, et al. Effect of an electronic medication reconciliation application and process redesign on potential adverse drug events: a cluster-randomized trial. Arch Intern Med. 2009;169(8):771-780. PubMed
8. Mekonnen AB, McLachlan AJ, Brien JA. Pharmacy-led medication reconciliation programmes at hospital transitions: a systematic review and meta-analysis. J Clin Pharm Ther. 2016;41(2):128-144. PubMed
9. Kaboli PJ, Fernandes O. Medication reconciliation: moving forward. Arch Intern Med. 2012;172(14):1069-1070. PubMed
10. Koehler BE, Richter KM, Youngblood L, et al. Reduction of 30-day postdischarge hospital readmission or emergency department (ED) visit rates in high-risk elderly medical patients through delivery of a targeted care bundle. J Hosp Med. 2009;4:211-218. PubMed
11. Jack BW, Chetty VK, Anthony D, et al. A reengineered hospital discharge program to decrease rehospitalization: a randomized trial. Ann Intern Med. 2009;150:178-187. PubMed
12. Gillespie U, Alassaad A, Henrohn D, et al. A comprehensive pharmacist intervention to reduce morbidity in patients 80 years or older. Arch Intern Med. 2009:169(9):894-900. PubMed
13. Makowsky MJ, Koshman SL, Midodzi WK, Tsuyuki RT. Capturing outcomes of clinical activities performed by a rounding pharmacist practicing in a team environment: the COLLABORATE study [NCT00351676]. Med Care. 2009;47(6):642-650. PubMed
14. Mekonnen AB, McLachlan AJ, Brien JA. Effectiveness of pharmacist-led medication reconciliation programmes on clinical outcomes at hospital transitions: a systematic review and meta-analysis. BMJ Open. 2016;6(2):e010003. PubMed
15. Cesta A, Bajcar JM, Ong SW, Fernandes OA. The EMITT study: development and evaluation of a medication information transfer tool. Ann Pharmacother. 2006:40(6):1074-1081 PubMed
16. Cornish P, et al. Unintended medication discrepancies at the time of hospital admission. Arch Internal Medicine, 2005, Feb: 165: 424-29. PubMed
17. Kwan Y, Fernandes OA, Nagge JJ, et al. Pharmacist medication assessments in a surgical preadmission clinic. Arch Intern Med. 2007;167(10):1034-1040 PubMed
18. Dedhia P, Kravet S, Bulger J, et al. A quality improvement intervention to facilitate the transition of older adults from three hospitals back to their homes. J Am Geriatr Soc. 2009;57:1540–1546. PubMed
19. Murphy EM, Oxencis CJ, Klauck JA, et al. Medication reconciliation at an academic medical center: implementation of a comprehensive program from admission to discharge. Am J Health Syst Pharm. 2009;66:2126–31 PubMed
20. , , , , , . A pharmacy discharge plan for hospitalized elderly patients - a randomized controlled trial. Age and Ageing. 2001;30(1):33-40. PubMed
21. Al-Rashed SA, Wright DJ, Roebuck N, et al. The value of inpatient pharmaceutical counselling to elderly patients prior to discharge. Br J Clin Pharmacol. 2002 Dec;54(6):657–64. PubMed
22. Schnipper JL, Kirwin JL, Cotugno MC, et al. Role of pharmacist counseling in preventing adverse drug events after hospitalization. Arch Intern Med. 2006 Mar 13;166(5):565–71. PubMed
23. Walker PC, Bernstein SJ, Jones JN, et al. Impact of a pharmacist-facilitated hospital discharge program: a quasi-experimental study. Arch Intern Med. 2009 Nov 23;169(21):2003–10. PubMed
24. van Walraven C, Dhalla IA, Bell C, et al. Derivation and validation of an index to predict early death or unplanned readmission after discharge from hospital to the community. CMAJ. 2010;182(6):551-557. PubMed
25. Normand ST, Landrum MB, Guadagnoli E, et al. Validating recommendations for coronary angiography following an acute myocardial infarction in the elderly: a matched analysis using propensity scores. J Clin Epidemiol. 2001;54(4):387-398. PubMed
26. Rosenbaum PR., Donald BR. Constructing a control group using multivariate matched sampling methods that incorporate the propensity score. Am Stat. 1985;39(1):33-38.
27. Fernandes O, Shojania KG. Medication reconciliation in the hospital: what, why, where, when, who and how? Healthc Q. 2012;15(Special Issue):42-49. PubMed
28. Joynt KE, Jha AK. Thirty-day readmissions—truth and consequences. N Engl J Med. 2012;366(15):1366-1369. PubMed
29. Zed PJ, Abu-Laban RB, Balen RM, et al. Incidence, severity and preventability of medication-related visits to the emergency department: a prospective study. CMAJ. 2008;178(12):1563-1569. PubMed
30. Gruneir A, Dhalla IA, van Walraven C, et al. Unplanned readmissions after hospital discharge among patients identified as being at high risk for readmission using a validated predictive algorithm. Open Med. 2011;5(2):e104-e111. PubMed
© 2018 Society of Hospital Medicine
Covert Observation of Hand Hygiene
Hand hygiene (HH) is believed to be one of the single most important interventions to prevent healthcare‐associated infection, yet physicians are notorious for their poor compliance.[1, 2, 3] At our 800‐bed acute care academic hospital, we implemented a multifaceted HH program[4] in 2007, which was associated with improved HH compliance rates from 43% to 87%. Despite this improvement, HH compliance among physicians remained suboptimal, with rates below 60% in some patient areas. A targeted campaign focused on recruitment of physician champions, resulted in some improvement, but physician compliance has consistently remained below performance of nurses (70%75% for physicians vs 85%90% for nurses).
Our experience parallels the results seen in multinational surveys demonstrating consistently lower physician HH compliance.[5] Given the multiple improvement efforts directed at physicians and the apparent ceiling observed in HH performance, we wanted to confirm whether physicians are truly recalcitrant to cleaning their hands, or whether lower compliance among physicians reflected a differential in the Hawthorne effect inherent to direct observation methods. Specifically, we wondered if nurses tend to recognize auditors more readily than physicians and therefore show higher apparent HH compliance when auditors are present. We also wanted to verify whether the behavior of attending physicians influenced compliance of their physician trainees. To test these hypotheses, we trained 2 clinical observers to covertly measure HH compliance of nurses and physicians on 3 different clinical services.
METHODS
Between May 27, 2015 and July 31, 2015, 2 student observers joined clinical rotations on physician and nursing teams, respectively. Healthcare teams were unaware that the student observers were measuring HH compliance during their clinical rotation. Students rotated in the emergency department, general medical and surgical wards for no more than 1 week at a time to increase exposure to different providers and minimize risk of exposing the covert observation.
Prior to the study period, the students underwent training and validation with a hospital HH auditor at another clinical setting offsite to avoid any recognition of these students by healthcare providers as observers of HH at the main hospital. Training with the auditors occurred until interobserver agreement between all HH opportunities reached 100% agreement for 2 consecutive observation days.
During their rotations, students covertly recorded HH compliance based on moments of hand hygiene[4] and also noted location, presence, and compliance of the attending physician, team size during patient encounter, and isolation requirements. Both students measured HH compliance of nurses and physicians around them. Although students spent the majority of their time with their assigned physician or nurse teams, they did not limit their observations to these individuals only, but recorded compliance of any nurse or physician on the ward as long as they were within sight during an HH opportunity. To limit clustering of observations of the same healthcare worker, up to a maximum of 2 observations per healthcare worker per day was recorded.
We compared covertly measured HH compliance with data from overt observation by hospital auditors during the same time period. Differences in proportion of HH compliance were compared with hospital audits during the same period with a 2 test. Difference between differences in overtly and covertly measured HH compliance for nurses and physicians was compared using Breslow day test.
The study was approved by the hospital's research ethics board. Although deception was used in this study,[2, 6] all data were collected for quality improvement purposes, and the aggregate results were disclosed to hospital staff following the study.
RESULTS
Covertly observed HH compliance was 50.0% (799/1597) compared with 83.7% (2769/3309) recorded by hospital auditors during the same time period (P < 0.0002) (Table 1). There was no significant difference in the compliance measured by each student (50.1%, 473/928 vs 48.7%, 326/669) (P = 0.3), and their results were combined for the rest of the analysis. Compliance before contact with the patient or patient environment was 43.1% (344/798), 74.3% (26/35) before clean/aseptic procedures, 34.8% (8/23) after potential body fluid exposure, and 56.8% (483/851) after contact with the patient or patient environment. Healthcare providers examining patients with isolation precautions were found to have a HH compliance of 74.8% (101/135) compared to 47.0% (385/820) when isolation precautions were not required (P < 0.0002).
| Covert Observers, Compliance (95% CI) | Hospital Auditors, Compliance (95% CI) | Difference | |
|---|---|---|---|
| |||
| Overall hand hygiene compliance | 50.0% (47.6‐52.5) | 83.7% (82.4‐84.9) | 33.7% |
| Service | |||
| Medicine | 58.9% (55.3‐62.5) | 85.0% (82.7‐87.3) | 26.1% |
| Surgery | 45.7% (41.6‐49.8) | 91.0% (87.5‐93.7) | 45.3% |
| Emergency | 43.9% (38.9‐49.9) | 73.8% (68.9‐78.2) | 29.9% |
| Nurses | 45.1% (41.5‐48.7) | 85.8% (83.3‐87.9) | 40.7% |
| Physicians | |||
| Overall compliance | 54.2% (50.9‐57.1) | 73.2% (67.3‐78.4) | 19.0% |
| Trainee compliance* | 79.5% (73.6‐84.3) | ||
| Trainee compliance | 18.9% (13.3‐26.1) | ||
Hospital auditor data showed that surgery and medicine had similarly high rates of compliance (91.0% and 85.0%, respectively), whereas the emergency department had a notably lower rate of 73.8%. Covert observation confirmed a lower rate in the emergency department (43.9%), but showed a higher compliance on general medicine than on surgery (58.9% vs 45.7%; P = 0.02). The difference in physician compliance between hospital auditors and covert observers was 19.0% (73.2%, 175/239 vs. 54.2%, 469/865); for nurses this difference was much higher at 40.7% (85.8%, 754/879 vs. 45.1%, 330/732) (P < 0.0001) (Table 1).
In terms of physician compliance, primary teams tended to have lower HH compliance of 50.4% (323/641) compared with consulting services at 57.0% (158/277) (P = 0.06). Team rounds of 3 members were associated with higher compliance compared with encounters involving <3 members (62.1%, 282/454 vs. 42.0%, 128/308) (P < 0.0002). Presence of attending physician did not affect trainee HH compliance (55.5%, 201/362 when attending present vs. 56.8%, 133/234 when attending absent; P = 0.79). However, trainee HH compliance improved markedly when attending staff cleaned their hands and decreased markedly when they did not (79.5%, 174/219 vs. 18.9%, 27/143; P < 0.0002).
DISCUSSION
We introduced covert HH observers at our hospital to determine whether differences in Hawthorne effect accounted for measured disparity between physician HH compliance, and to gain further insights into the barriers and enablers of physician HH compliance. We discovered that performance differences between physicians and nurses decreased when neither group was aware that HH was being measured, suggesting that healthcare professions are differentially affected by the Hawthorne effect. This difference may be explained by the continuity of nurses on the ward that makes them more aware of visitors like HH auditors,[7] compared with physicians who rotate periodically on the ward.
Although hospital auditors play a central role in HH education through in‐the‐moment feedback, use of these data to benchmark performance can lead to inappropriate inferences about HH compliance. Prior studies using automated HH surveillance have suggested that the magnitude of the Hawthorne effect varies based on baseline HH rates,[8] whereas our study suggests a differential Hawthorne effect between professions and clinical services. If we relied only on auditor data, we would have continued to believe that only physicians in our organization had poor HH compliance, and we would not be aware of the global nature of the HH problem.
Our results are similar to that of Pan et al., who used covert medical students to measure HH and found compliance of 44.1% compared with 94.1% by unit auditors.[2] Because their study involved an active feedback intervention, the differential in Hawthorne effect between professions could not be reliably assessed. However, they observed a progressive increase in nurse HH compliance using covert observation methods, suggesting improvement in HH performance independent of observer bias.[7]
Covert observation in our study also provided important insights regarding barriers and enablers of HH compliance. Self‐preservation behaviors were common among both nurses and physicians, as HH compliance was consistently higher after patient contact compared to before or when seeing patients who required additional precautions. This finding confirms that the perceived risk of transmission seems to be a powerful motivating factor for HH.[9] Larger groups of trainees were more likely to clean their hands, likely due to peer effects.[10] The strong impact of role modeling on HH was also noted as previously suggested in the literature,[3, 6] but our study captures the magnitude of this effect. Whether or not the attending physician cleaned their hands during rounds either positively or negatively influenced HH compliance of the rest of the physician team (80% when compliant vs 20% when noncompliant).
Our study has several important limitations. The differential Hawthorne effect seen at our center may not reflect other institutions that have numerous HH auditors or high staff turnover resulting in lower ability to recognize auditors. We cannot exclude the possibility of Hawthorne effect using covert methods that could have affected nurse and physician performance differently, but frequent rotation of the students helped maintain covertness of observations. Finally, due to the nature of the covert student observers, a longer observation time frame could not be sustained.
Our experience using covert HH auditors suggests that traditional HH audits not only overstate HH performance overall, but can lead to inaccurate inferences regarding HH performance due to relative differences in Hawthorne effect. The answer to the question regarding whether physicians clean their hands appears to be that they do just as often as nurses, but that all healthcare workers have tremendous room for improvement. We suggest that future improvement efforts will rely on more accurate HH monitoring systems and strong attending physician leadership to set an example for trainees.
Disclosures
This study was jointly funded by the Centre for Quality Improvement and Patient Safety of the University of Toronto in collaboration with Sunnybrook Health Sciences Centre. All authors report no conflicts of interest relevant to this article.
- World Health Organization. WHO guidelines on hand hygiene in health care. Available at: http://whqlibdoc.who.int/publications/2009/9789241597906_eng.pdf. Accessed April 4th, 2015.
- , , , et al. Compliance of health care workers with hand hygiene practices: independent advantages of overt and covert observers. PLoS One. 2013;8:e53746.
- , , , et al. Understanding practice: factors that influence physician hand hygiene compliance. Infect Control Hosp Epidemiol. 2014;35:1511–1520.
- (JCYH) Just Clean Your Hands. Ontario Agency for Health Promotion and Protection. Available at: http://www.publichealthontario.ca/en/BrowseByTopic/InfectiousDiseases/JustCleanYourHands/Pages/Just‐Clean‐Your‐Hands.aspx. Accessed August 4, 2015.
- , , , et al. Global implementation of WHO's multimodal strategy for improvement of hand hygiene: a quasi‐experimental study. Lancet Infect Dis. 2013;13:843–851.
- , , , et al. Hand hygiene adherence is influenced by the behavior of role models. Pediatr Crit Care Med. 2009;10:360–363.
- , , , . Quantification of the Hawthorne effect in hand hygiene compliance monitoring using an electronic monitoring system: a retrospective cohort study. BMJ Qual Saf. 2014;23:974–980.
- , , , et al. Variability in the Hawthorne effect with regard to hand hygiene performance in high‐ and low‐performing inpatient care units. Infect Control Hosp Epidemiol. 2009;30:222–225.
- , , , et al. Self‐protection as a driver for hand hygiene among healthcare workers. Infect Control. 2009;30:578–580.
- , , et al. Do peer effects improve hand hygiene adherence among healthcare workers? Infect Control Hosp Epidemiol. 2014;35:1277–1285.
Hand hygiene (HH) is believed to be one of the single most important interventions to prevent healthcare‐associated infection, yet physicians are notorious for their poor compliance.[1, 2, 3] At our 800‐bed acute care academic hospital, we implemented a multifaceted HH program[4] in 2007, which was associated with improved HH compliance rates from 43% to 87%. Despite this improvement, HH compliance among physicians remained suboptimal, with rates below 60% in some patient areas. A targeted campaign focused on recruitment of physician champions, resulted in some improvement, but physician compliance has consistently remained below performance of nurses (70%75% for physicians vs 85%90% for nurses).
Our experience parallels the results seen in multinational surveys demonstrating consistently lower physician HH compliance.[5] Given the multiple improvement efforts directed at physicians and the apparent ceiling observed in HH performance, we wanted to confirm whether physicians are truly recalcitrant to cleaning their hands, or whether lower compliance among physicians reflected a differential in the Hawthorne effect inherent to direct observation methods. Specifically, we wondered if nurses tend to recognize auditors more readily than physicians and therefore show higher apparent HH compliance when auditors are present. We also wanted to verify whether the behavior of attending physicians influenced compliance of their physician trainees. To test these hypotheses, we trained 2 clinical observers to covertly measure HH compliance of nurses and physicians on 3 different clinical services.
METHODS
Between May 27, 2015 and July 31, 2015, 2 student observers joined clinical rotations on physician and nursing teams, respectively. Healthcare teams were unaware that the student observers were measuring HH compliance during their clinical rotation. Students rotated in the emergency department, general medical and surgical wards for no more than 1 week at a time to increase exposure to different providers and minimize risk of exposing the covert observation.
Prior to the study period, the students underwent training and validation with a hospital HH auditor at another clinical setting offsite to avoid any recognition of these students by healthcare providers as observers of HH at the main hospital. Training with the auditors occurred until interobserver agreement between all HH opportunities reached 100% agreement for 2 consecutive observation days.
During their rotations, students covertly recorded HH compliance based on moments of hand hygiene[4] and also noted location, presence, and compliance of the attending physician, team size during patient encounter, and isolation requirements. Both students measured HH compliance of nurses and physicians around them. Although students spent the majority of their time with their assigned physician or nurse teams, they did not limit their observations to these individuals only, but recorded compliance of any nurse or physician on the ward as long as they were within sight during an HH opportunity. To limit clustering of observations of the same healthcare worker, up to a maximum of 2 observations per healthcare worker per day was recorded.
We compared covertly measured HH compliance with data from overt observation by hospital auditors during the same time period. Differences in proportion of HH compliance were compared with hospital audits during the same period with a 2 test. Difference between differences in overtly and covertly measured HH compliance for nurses and physicians was compared using Breslow day test.
The study was approved by the hospital's research ethics board. Although deception was used in this study,[2, 6] all data were collected for quality improvement purposes, and the aggregate results were disclosed to hospital staff following the study.
RESULTS
Covertly observed HH compliance was 50.0% (799/1597) compared with 83.7% (2769/3309) recorded by hospital auditors during the same time period (P < 0.0002) (Table 1). There was no significant difference in the compliance measured by each student (50.1%, 473/928 vs 48.7%, 326/669) (P = 0.3), and their results were combined for the rest of the analysis. Compliance before contact with the patient or patient environment was 43.1% (344/798), 74.3% (26/35) before clean/aseptic procedures, 34.8% (8/23) after potential body fluid exposure, and 56.8% (483/851) after contact with the patient or patient environment. Healthcare providers examining patients with isolation precautions were found to have a HH compliance of 74.8% (101/135) compared to 47.0% (385/820) when isolation precautions were not required (P < 0.0002).
| Covert Observers, Compliance (95% CI) | Hospital Auditors, Compliance (95% CI) | Difference | |
|---|---|---|---|
| |||
| Overall hand hygiene compliance | 50.0% (47.6‐52.5) | 83.7% (82.4‐84.9) | 33.7% |
| Service | |||
| Medicine | 58.9% (55.3‐62.5) | 85.0% (82.7‐87.3) | 26.1% |
| Surgery | 45.7% (41.6‐49.8) | 91.0% (87.5‐93.7) | 45.3% |
| Emergency | 43.9% (38.9‐49.9) | 73.8% (68.9‐78.2) | 29.9% |
| Nurses | 45.1% (41.5‐48.7) | 85.8% (83.3‐87.9) | 40.7% |
| Physicians | |||
| Overall compliance | 54.2% (50.9‐57.1) | 73.2% (67.3‐78.4) | 19.0% |
| Trainee compliance* | 79.5% (73.6‐84.3) | ||
| Trainee compliance | 18.9% (13.3‐26.1) | ||
Hospital auditor data showed that surgery and medicine had similarly high rates of compliance (91.0% and 85.0%, respectively), whereas the emergency department had a notably lower rate of 73.8%. Covert observation confirmed a lower rate in the emergency department (43.9%), but showed a higher compliance on general medicine than on surgery (58.9% vs 45.7%; P = 0.02). The difference in physician compliance between hospital auditors and covert observers was 19.0% (73.2%, 175/239 vs. 54.2%, 469/865); for nurses this difference was much higher at 40.7% (85.8%, 754/879 vs. 45.1%, 330/732) (P < 0.0001) (Table 1).
In terms of physician compliance, primary teams tended to have lower HH compliance of 50.4% (323/641) compared with consulting services at 57.0% (158/277) (P = 0.06). Team rounds of 3 members were associated with higher compliance compared with encounters involving <3 members (62.1%, 282/454 vs. 42.0%, 128/308) (P < 0.0002). Presence of attending physician did not affect trainee HH compliance (55.5%, 201/362 when attending present vs. 56.8%, 133/234 when attending absent; P = 0.79). However, trainee HH compliance improved markedly when attending staff cleaned their hands and decreased markedly when they did not (79.5%, 174/219 vs. 18.9%, 27/143; P < 0.0002).
DISCUSSION
We introduced covert HH observers at our hospital to determine whether differences in Hawthorne effect accounted for measured disparity between physician HH compliance, and to gain further insights into the barriers and enablers of physician HH compliance. We discovered that performance differences between physicians and nurses decreased when neither group was aware that HH was being measured, suggesting that healthcare professions are differentially affected by the Hawthorne effect. This difference may be explained by the continuity of nurses on the ward that makes them more aware of visitors like HH auditors,[7] compared with physicians who rotate periodically on the ward.
Although hospital auditors play a central role in HH education through in‐the‐moment feedback, use of these data to benchmark performance can lead to inappropriate inferences about HH compliance. Prior studies using automated HH surveillance have suggested that the magnitude of the Hawthorne effect varies based on baseline HH rates,[8] whereas our study suggests a differential Hawthorne effect between professions and clinical services. If we relied only on auditor data, we would have continued to believe that only physicians in our organization had poor HH compliance, and we would not be aware of the global nature of the HH problem.
Our results are similar to that of Pan et al., who used covert medical students to measure HH and found compliance of 44.1% compared with 94.1% by unit auditors.[2] Because their study involved an active feedback intervention, the differential in Hawthorne effect between professions could not be reliably assessed. However, they observed a progressive increase in nurse HH compliance using covert observation methods, suggesting improvement in HH performance independent of observer bias.[7]
Covert observation in our study also provided important insights regarding barriers and enablers of HH compliance. Self‐preservation behaviors were common among both nurses and physicians, as HH compliance was consistently higher after patient contact compared to before or when seeing patients who required additional precautions. This finding confirms that the perceived risk of transmission seems to be a powerful motivating factor for HH.[9] Larger groups of trainees were more likely to clean their hands, likely due to peer effects.[10] The strong impact of role modeling on HH was also noted as previously suggested in the literature,[3, 6] but our study captures the magnitude of this effect. Whether or not the attending physician cleaned their hands during rounds either positively or negatively influenced HH compliance of the rest of the physician team (80% when compliant vs 20% when noncompliant).
Our study has several important limitations. The differential Hawthorne effect seen at our center may not reflect other institutions that have numerous HH auditors or high staff turnover resulting in lower ability to recognize auditors. We cannot exclude the possibility of Hawthorne effect using covert methods that could have affected nurse and physician performance differently, but frequent rotation of the students helped maintain covertness of observations. Finally, due to the nature of the covert student observers, a longer observation time frame could not be sustained.
Our experience using covert HH auditors suggests that traditional HH audits not only overstate HH performance overall, but can lead to inaccurate inferences regarding HH performance due to relative differences in Hawthorne effect. The answer to the question regarding whether physicians clean their hands appears to be that they do just as often as nurses, but that all healthcare workers have tremendous room for improvement. We suggest that future improvement efforts will rely on more accurate HH monitoring systems and strong attending physician leadership to set an example for trainees.
Disclosures
This study was jointly funded by the Centre for Quality Improvement and Patient Safety of the University of Toronto in collaboration with Sunnybrook Health Sciences Centre. All authors report no conflicts of interest relevant to this article.
- World Health Organization. WHO guidelines on hand hygiene in health care. Available at: http://whqlibdoc.who.int/publications/2009/9789241597906_eng.pdf. Accessed April 4th, 2015.
- , , , et al. Compliance of health care workers with hand hygiene practices: independent advantages of overt and covert observers. PLoS One. 2013;8:e53746.
- , , , et al. Understanding practice: factors that influence physician hand hygiene compliance. Infect Control Hosp Epidemiol. 2014;35:1511–1520.
- (JCYH) Just Clean Your Hands. Ontario Agency for Health Promotion and Protection. Available at: http://www.publichealthontario.ca/en/BrowseByTopic/InfectiousDiseases/JustCleanYourHands/Pages/Just‐Clean‐Your‐Hands.aspx. Accessed August 4, 2015.
- , , , et al. Global implementation of WHO's multimodal strategy for improvement of hand hygiene: a quasi‐experimental study. Lancet Infect Dis. 2013;13:843–851.
- , , , et al. Hand hygiene adherence is influenced by the behavior of role models. Pediatr Crit Care Med. 2009;10:360–363.
- , , , . Quantification of the Hawthorne effect in hand hygiene compliance monitoring using an electronic monitoring system: a retrospective cohort study. BMJ Qual Saf. 2014;23:974–980.
- , , , et al. Variability in the Hawthorne effect with regard to hand hygiene performance in high‐ and low‐performing inpatient care units. Infect Control Hosp Epidemiol. 2009;30:222–225.
- , , , et al. Self‐protection as a driver for hand hygiene among healthcare workers. Infect Control. 2009;30:578–580.
- , , et al. Do peer effects improve hand hygiene adherence among healthcare workers? Infect Control Hosp Epidemiol. 2014;35:1277–1285.
Evidence for Thromboembolism Prophylaxis
Deep venous thrombosis (DVT) and pulmonary embolism (PE), collectively referred to as venous thromboembolism (VTE), are common events in hospitalized patients and result in significant morbidity and mortality. Often silent and frequently unexpected, VTE is preventable. Accordingly, the American College of Chest Physicians recommends that pharmacologic prophylaxis be given to acutely ill medical patients admitted to the hospital with congestive heart failure or severe respiratory disease, or to patients who are confined to bed who have additional risk factors, such as cancer or previous VTE.1 Three recent meta‐analyses24 demonstrated significant reductions in VTE in general medicine patients with pharmacologic prophylaxis. Recently the National Quality Forum advocated that hospitals evaluate each patient upon admission and regularly thereafter, for the risk of developing DVT/VTE and utilize clinically appropriate methods to prevent DVT/VTE.5
Despite recommendations for prophylaxis, multiple studies demonstrate utilization in <50% of at‐risk general medical patients.68 Physicians' lack of awareness may partially explain this underutilization, but other likely factors include physicians' questions about the clinical importance of the outcome (eg, some studies have shown reductions primarily in asymptomatic distal DVT), doubt regarding the best form of prophylaxis (ie, unfractionated heparin [UFH] vs. low molecular weight heparin [LMWH]), uncertainty regarding optimal dosing regimens, and comparable uncertainty regarding which patients have sufficiently high risk for VTE to outweigh the risks of anticoagulation.
We undertook the current meta‐analysis to address questions about thromboembolism prevention in general medicine patients. Does pharmacologic prophylaxis prevent clinically relevant events? Is LMWH or UFH preferable in terms of either efficacy or safety?
MATERIALS AND METHODS
Search Strategy
We conducted an extensive search that included reviewing electronic databases (MEDLINE, EMBASE, and CINAHL) through June 2008, reviewing conference proceedings, and contacting drug manufacturers. The MEDLINE search combined the key words deep venous thrombosis, thromboembolism, AND pulmonary embolism with the terms primary prevention, prophylaxis, OR prevention. We limited the search results using the filter for randomized controlled trials in PubMed. Similar strategies (available on request) were used to search EMBASE, CINAHL, and the Cochrane Central Register of Controlled Trials. We also searched the Cochrane Database of Systematic Reviews to identify previous reviews on the same topic. We obtained translations of eligible, non‐English‐language articles.
The proceedings of annual meetings from the American Thoracic Society, the American Society of Hematology, and the Society for General Internal Medicine from 1994 to 2008 were hand‐searched for reports on DVT or PE prevention published in abstract form only. (Note: the American Society of Hematology was only available through 2007). We contacted the 3 main manufacturers of LMWHPfizer (dalteparin), Aventis (enoxaparin), Glaxo Smith Kline (nadoparin)and requested information on unpublished pharmaceutical sponsored trials. First authors from the trials included in this meta‐analysis were also contacted to determine if they knew of additional published or unpublished trials.
Inclusion and Exclusion Criteria
Studies were required to be prospective randomized controlled trials comparing UFH or LMWH to mechanical prophylaxis, placebo, or no intervention. We also included randomized head‐to‐head comparisons of UFH and LMWH. Eligible studies enrolled general medical patients. Trials including predominantly intensive care unit (ICU) patients; stroke, spinal cord, or acute myocardial infarction patients were excluded. We excluded trials focused on these populations because the risk for VTE may differ from that for general medical patients and because patients in these groups already commonly receive anticoagulants as a preventive measure or as active treatment (eg, for acute myocardial infarction [MI] care). Trials assessing thrombosis in patients with long‐term central venous access/catheters were also excluded. Articles focusing on long‐term rehabilitation patients were excluded.
Studies had to employ objective criteria for diagnosing VTE. For DVT these included duplex ultrasonography, venography, fibrinogen uptake scanning, impedance plethysmography, or autopsy as a primary or secondary outcome. Studies utilizing thermographic techniques were excluded.9 Eligible diagnostic modalities for PE consisted of pulmonary arteriogram, ventilation/perfusion scan, CT angiography, and autopsy.
After an initial review of article titles and abstracts, the full texts of all articles that potentially met our inclusion criteria were independently reviewed for eligibility by 2 authors (G.M.B., M.D.). In cases of disagreement, a third author (S.F.) independently reviewed the article and adjudicated decisions.
Quantitative Data Synthesis and Statistical Analysis
For all included articles, 2 reviewers independently abstracted data on key study features (including population size, trial design, modality of VTE diagnosis, and interventions delivered to treatment and control groups), results (including the rates of all DVT, proximal DVT, symptomatic DVT, PE, and death), as well as adverse events (such as bleeding and thrombocytopenia). We accepted the endpoint of DVT when assessed by duplex ultrasonography, venography, autopsy, or when diagnosed by fibrinogen uptake scanning or impedance plethysmography. For all endpoints we abstracted event rates as number of events based on intention to treat. Each study was assessed for quality using the Jadad scale.10 The Jadad scale is a validated tool for characterizing study quality that accounts for randomization, blinding, and description of withdrawals and dropouts in individual trials. The Jadad score ranges from 0 to 5 with higher numbers identifying trials of greater methodological rigor.
The trials were divided into 4 groups based on the prophylaxis agent used and the method of comparison (UFH vs. control, LMWH vs. control, LMWH vs. UFH, and LMWH/UFH combined vs. control). After combining trials for each group, we calculated a pooled relative risk (RR) and a 95% confidence interval (CI) based on both fixed and a random effects model using the DerSimonian and Laird method. Heterogeneity of the included studies was evaluated with a chi‐square statistic. The percentage of variation in the pooled RR attributable to heterogeneity was calculated and reported using the I‐squared statistic.11 Sensitivity analyses were performed and included repeating all analyses using high‐quality studies only (Jadad score 3 or higher). Publication bias was assessed using the methods developed by Egger et al.12 and Begg and Mazumdar.13 All analyses were performed using STATA SE version 9 (Stata Corp, College Station, TX).
RESULTS
Study Identification and Selection
The computerized literature search resulted in 5284 articles. Three additional citations were found by review of bibliographies. No additional trials were identified from reviews of abstracts from national meetings. Representatives from the 3 pharmaceutical companies reported no knowledge of additional published or unpublished data. Of the 5287 studies identified by the search, 14 studies met all eligibility criteria (Figure 1).

Study Characteristics
The 14 trials eligible for inclusion in the analysis consisted of 8 comparisons of UFH or LMWH vs. control (Table 1) and 6 head‐to‐head comparisons of UFH and LMWH (Table 2). The 14 studies included 8 multicenter trials and enrolled a total of 24,515 patients: 20,594 in the 8 trials that compared UFH or LMWH with placebo and 3921 in the 6 trials that compared LMWH with UFH. Two trials exclusively enrolled patients with either congestive heart failure or severe respiratory disease,14, 15 while 12 trials enrolled mixed populations. In 8 trials a period of immobility was necessary for study entry,14, 1621 while in 2 trials immobility was not required.22, 23 In the 4 remaining trials immobility was not explicitly discussed.15, 2426 One‐half of the trials required a length of stay greater than 3 days.1719, 2225
| Study (Year)Reference | Patients (n) | Duration (days) | VTE Risk Factors | Drug Dose | Comparison | DVT Assessed | PE Assessed | Double Blind | Jadad Score |
|---|---|---|---|---|---|---|---|---|---|
| |||||||||
| Belch et al. (1981)15 | 100 | 8 | Age 40‐80 years; CHF; chest infection | UFH TID | None | FUS | VQ | No | 1 |
| Dahan et al. (1986)23 | 270 | 10* | Age >65 years | Enoxaparin 60 mg | Placebo | FUS | Autopsy | Yes | 3 |
| Halkin et al. (1982)20 | 1358 | Not reported | Age >40 years; immobile | UFH BID | None | No | No | No | 1 |
| Mahe et al. (2005)16 | 2474 | 13.08 | Age >40 years; immobile | Nadroparin 7500 IU | Placebo | Autopsy | Autopsy | Yes | 5 |
| Gardlund (1996)21 | 11693 | 8.2 | Age >55 years; immobile | UFH BID | None | Autopsy | Autopsy | No | 2 |
| Samama et al. (1999)24 | 738 | 7 | Age >40 years; length of stay 6 days; CHF; respiratory failure or 1 additional risk factor | Enoxaparin 40 mg | Placebo | Venography | Composite | Yes | 4 |
| Leizorovicz et al. (2004)25 | 3681 | 12.6 | Age >40 years; length of stay 4 days; CHF; respiratory failure or 1 additional risk factor | Dalteparin 5000 IU | Placebo | DUS | Composite | Yes | 4 |
| Lederle et al. (2006)22 | 280 | 13.4 | Age >60 years; length of stay 3 days | Enoxaparin 40 mg | Placebo | DUS | Composite | Yes | 5 |
| Study (Year)reference | Patients (n) | Duration (days) | VTE Risk Factors | Drug/Dose | Comparison | DVT Assessed | PE Assessed | Double Blind | Jadad Score |
|---|---|---|---|---|---|---|---|---|---|
| |||||||||
| Bergmann and Neuhart (1996)27 | 442 | 9.5 | Age >65 years; immobile | Enoxaparin 20 mg | UFH BID | FUS | Composite | Yes | 5 |
| Harenberg et al. (1990)19 | 166 | 10* | Age 40‐80 years; 1 week of bed rest | LMWH 1.500 aPTT units QD | UFH TID | IP | No | Yes | 3 |
| Kleber et al. (2003)14 | 665 | 9.8 | Age 18 years; severe CHF or respiratory disease; immobile | Enoxaparin 40 mg | UFH TID | Venography | Composite | No | 3 |
| Aquino et al. (1990)26 | 99 | Not reported | Age >70 years | Nadoparine 7500 IU | UFH BID | DUS | Composite | No | 1 |
| Harenberg et al. (1996)18 | 1590 | 10* | Age 50‐80 years; immobile + 1 additional risk factor | Nadoparine 36 mg | UFH TID | DUS | Composite | Yes | 4 |
| Lechler et al. (1996)17 | 959 | 7* | Age >18 years; immobile + 1 additional risk factor | Enoxaparin 40 mg | UFH TID | DUS | Composite | Yes | 3 |
While minimum age for study entry varied, the patient population predominantly ranged from 65 to 85 years of age. Many of the trials reported expected, not actual, treatment duration. The range of expected treatment was 7 to 21 days, with 10 days of treatment the most frequently mentioned. In the 8 trials1416, 21, 22, 24, 25, 27 that reported actual treatment duration, the range was 8 to 13.4 days. Most trials did not report number of VTE risk factors per patient, nor was there uniform acceptance of risk factors across trials.
UFH or LMWH vs. Control
DVT
Across 7 trials comparing either UFH or LMWH to control, heparin products significantly decreased the risk of all DVT (RR = 0.55; 95% CI: 0.36‐0.83) (Figure 2A). When stratified by methodological quality, 5 trials16, 2225 with Jadad scores of 3 or higher showed an RR reduction of 0.53 (95% CI: 0.38‐0.72) in reducing all DVT. All of the higher‐quality trials compared LMWH to placebo. Across 4 trials that reported data for symptomatic DVT there was a nonsignificant reduction in RR compared with placebo (RR = 0.73; 95% CI: 0.45‐1.16) (Figure 2B). Only 2 trials24, 25 (both LMWH trials) reported results for proximal DVT and demonstrated significant benefit of prophylaxis with a pooled RR of 0.46 (95% CI: 0.31‐0.69) (Figure 2C).
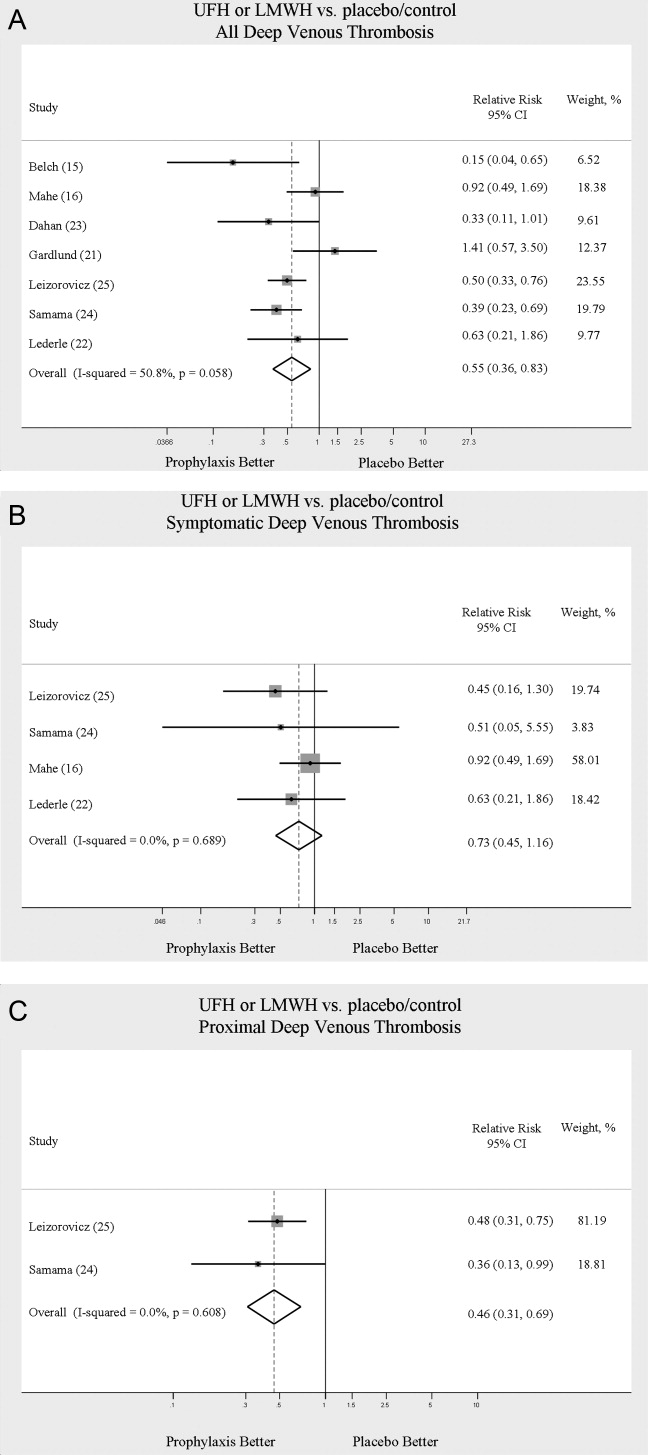
PE
Across 7 trials comparing either UFH or LMWH to control, heparin products significantly decreased the risk of PE (RR = 0.70; 95% CI: 0.53‐0.93) (Figure 3A). The 5 trials16, 2225 with Jadad scores of 3 or greater showed a similar relative risk reduction, but the result was no longer statistically significant (RR = 0.56; 95% CI: 0.31‐1.02). Two of the trials16, 21 relied solely on the results of autopsy to diagnose PE, which may have given rise to chance differences in detection due to generally low autopsy rates. Eliminating these 2 studies from the analysis resulted in loss of statistical significance for the reduction in risk for PE (RR = 0.48; 95% CI: 0.20‐1.15).
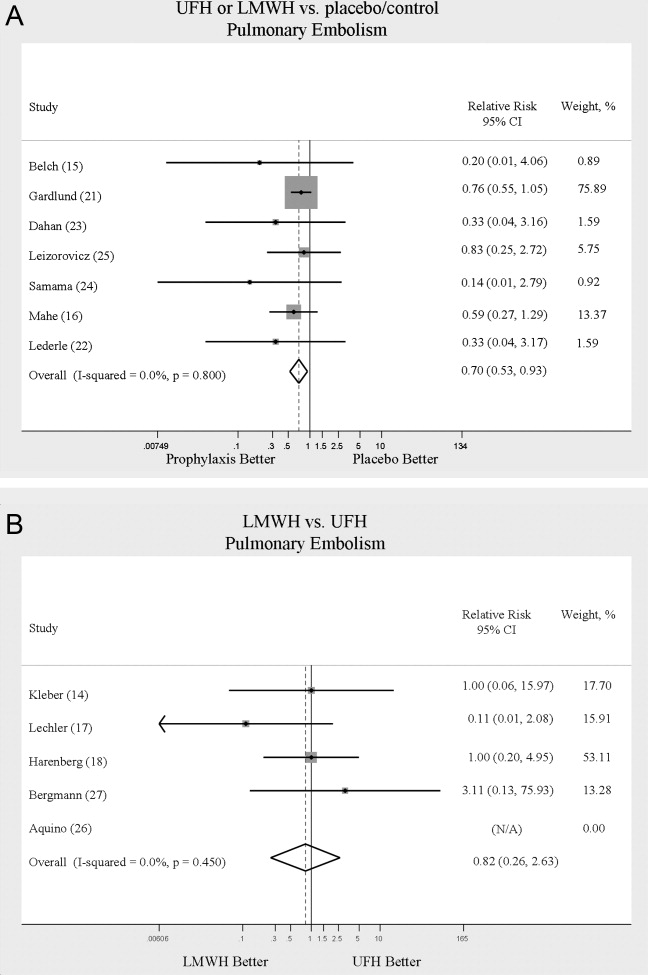
Death
Seven trials16, 2025 comparing either UFH or LMWH to control examined the impact of pharmacologic prophylaxis on death and found no significant difference between treated and untreated patients across all trials (RR = 0.92; 95% CI: 0.82‐1.03) and those limited to studies with Jadad scores of 3 or higher (RR = 0.97; 95% CI: 0.80‐1.17).
LMWH vs. UFH
DVT
In 6 trials14, 1719, 26, 27 comparing LMWH to UFH given either twice a day (BID) or 3 times a day (TID), there was no statistically significant difference in all DVT (RR = 0.90; 95% CI: 0.57‐1.43). (For all analyses RRs <1 favor LMWH, while RRs >1 favor UFH.) A total of 2 trials14, 18 reported results separately for proximal DVT with no statistically significant difference noted between UFH and LMWH (RR = 1.60; 95% CI: 0.53‐4.88). One small trial26 reported findings comparing UFH to LMWH for prevention of symptomatic DVT with no difference noted.
PE
Pooled data from the 5 trials14, 17, 18, 26, 27 comparing UFH to LMWH in the prevention of PE showed no statistically significant difference in rates of pulmonary embolism (RR = 0.82; 95% CI: 0.26‐2.63) (Figure 3B). In sensitivity analysis this result was not impacted by Jadad score.
Death
When UFH was compared to LMWH no statistically significant difference in the rate of death was found (RR = 0.96; 95% CI: 0.50‐1.85). Here again, no difference was noted when limited to studies with Jadad scores of 3 or higher.
Complications
We evaluated adverse events of heparin products used for prophylaxis and whether there were differences between UFH and LMWH. Reporting of complications was not uniform from study to study, making pooling more difficult. However, we were able to abstract data on any bleeding, major bleeding, and thrombocytopenia from several studies. In 5 studies15, 16, 2325 of either UFH or LMWH vs. control, a significantly increased risk of any bleeding (RR = 1.54; 95% CI: 1.15‐2.06) (Figure 4A) was found. When only major bleeding was evaluated, no statistically significant difference was noted (RR = 1.20; 95% CI: 0.55‐2.58) (Figure 4B). In 4 trials16, 22, 24, 25 the occurrence of thrombocytopenia was not significantly different when comparing UFH or LMWH to control (RR = 0.92; 95% CI: 0.46‐1.86).
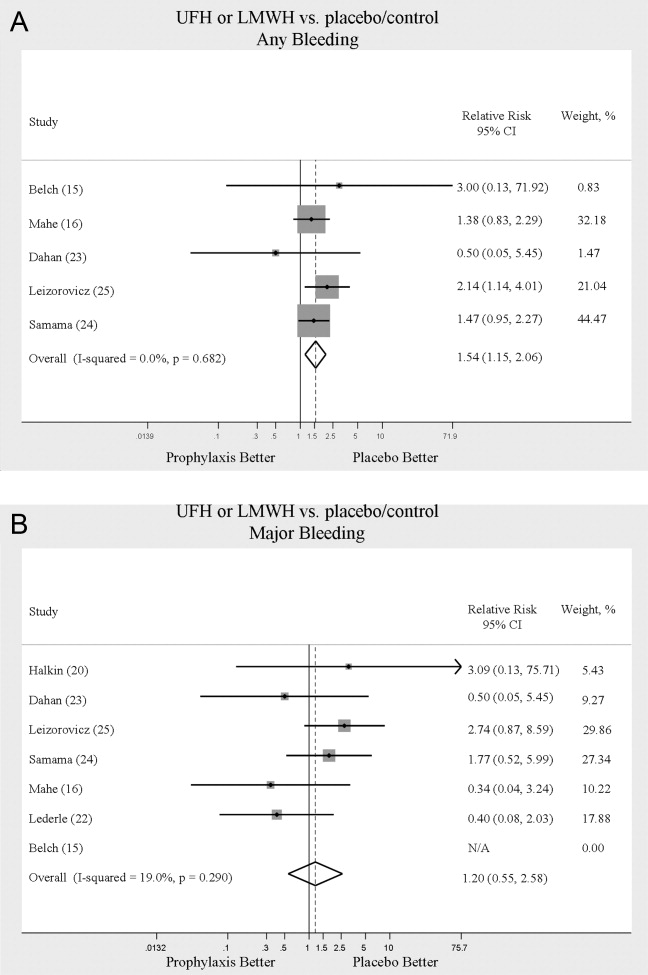
When LMWH was compared to UFH in 4 trials,14, 17, 18, 27 a nonsignificant trend toward a decrease in any bleeding was found in the LMWH group (RR = 0.72; 95% CI: 0.44‐1.16) (Figure 5A). A similar trend was seen favoring LMWH in rates of major bleeding (RR = 0.57; 95% CI: 0.25‐1.32) (Figure 5B). Neither trend was statistically significant. Three trials comparing LMWH to UFH reported on thrombocytopenia17, 18, 27 with no significant difference noted (RR = 0.52; 95% CI: 0.06‐4.18).
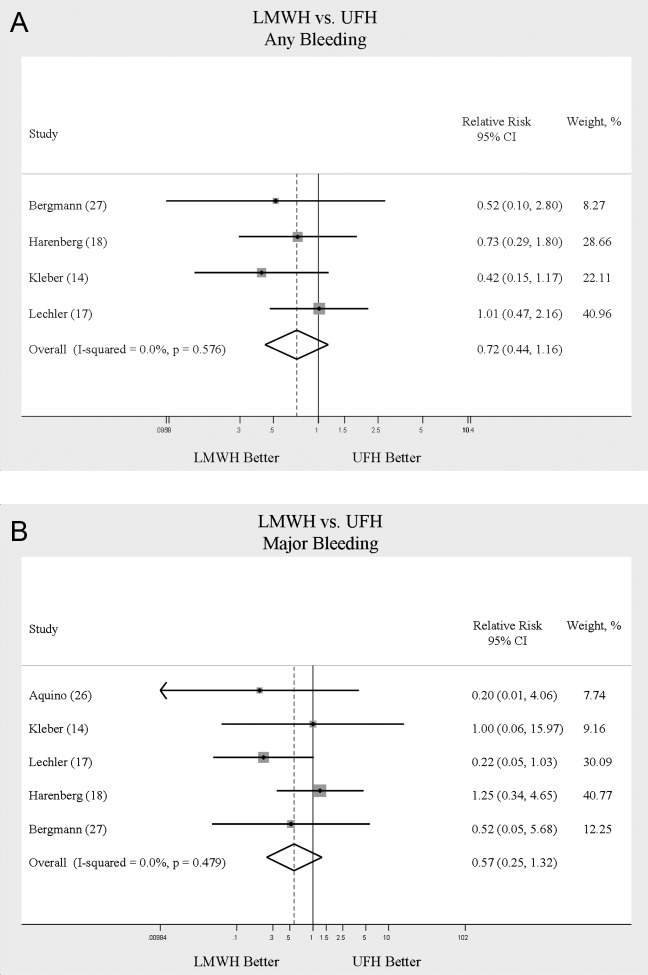
Heterogeneity and Publication Bias
No statistically significant heterogeneity was identified between trials for any outcomes. The highest I‐squared value was 54.5% (P = 0.14) for the endpoint of thrombocytopenia when UFH was compared to LMWH. In some cases, the nonsignificant results for tests of heterogeneity may have reflected small numbers of trials, but the values for I‐squared for all other endpoints were close to zero indicating that little nonrandom variation existed in the results across studies. All analyses were run using both random effects and fixed effects modeling. While we report results for random effects, no significant differences were observed using fixed effects.
We tested for publication bias using the methods developed by Egger et al.12 and Begg and Mazumdar.13 There was evidence of bias only for the outcome of PE when prophylaxis was compared to control, as the results for both tests were significant (Begg and Mazumdar:13 P = 0.035; Egger et al.:12 P = 0.010). For other outcomes tested, including all DVT (prophylaxis compared to control, and LMWH vs. UFH) as well as PE (LMWH vs. UFH), the P‐values were not significant.
DISCUSSION
When compared to control, LMWH or UFH decreased the risk of all DVT by 45% (RR = 0.55; 95% CI: 0.36‐0.83) and proximal DVT by 54% (RR = 0.46; 95% CI: 0.31‐0.69). PE was also decreased by 30% (RR = 0.70; 95% CI: 0.53‐0.93). Of note, when prophylaxis was compared with placebo all of the high‐quality studies showing a benefit were done using LMWH. The benefits of prophylaxis occurred at the cost of a 54% increased overall risk of bleeding (RR = 1.54; 95% CI 1.15‐2.06). However, the risk of major bleeding was not significantly increased. We did not find a mortality benefit to pharmacologic thromboembolism prophylaxis.
When comparing UFH to LMWH, we noted no difference in all DVT, symptomatic DVT, proximal DVT, PE, or death. While there was a trend toward less bleeding with LMWH, this was not statistically significant.
Taken in aggregate, our findings are in agreement with previous published meta‐analyses reporting net benefit for thromboembolism prophylaxis in medical patients.24, 22, 28, 29 Our meta‐analysis has several methodological strengths over the prior studies, including a comprehensive search of both the published and unpublished literature and assessment of the relationship between methodological quality of included trials and reported benefit. In contrast to previous reviews, our analysis highlights several limitations of the current evidence.
First, many of the studies are older, with predicted lengths of stay of greater than 1 week. The 8‐13‐day range of treatment duration we found in this study is longer than the average length of stay in today's hospitals. Second, there is variability in the diagnostic tests used to diagnose DVT, as well as variation in the definition of DVT among studies. Studies using fibrinogen uptake scanning reported rates of DVT as high as 26%15 while studies using venography reported DVT rates of almost 15% in the placebo arm.24 These rates are higher than most physicians' routine practice. One reason for this discrepancy is most studies did not distinguish below‐the‐knee DVT from more clinically relevant above‐the‐knee DVT. Systematic reviews of medical and surgical patients have found rates of proximal propagation from 0% to 29% in untreated patients.30, 31 Though controversial, below‐the‐knee DVT is believed less morbid than proximal DVT or symptomatic DVT. We addressed this by focusing specifically on clinically relevant endpoints of proximal and symptomatic DVT. When we restricted our analysis to proximal DVT we found a 54% RR reduction in 2 pooled trials of LMWH compared to placebo. In pooled analyses symptomatic DVT was not affected by prophylaxis. When compared head‐to‐head there were no differences between LMWH and UFH for proximal DVT or symptomatic DVT.
When considering PE, the utilization of autopsy as the sole diagnostic method in 2 large trials16, 21 is particularly problematic. In the trial by Garlund,21 the mortality rate was 5.4%, with an autopsy rate of 60.1%. Similarly, in the trial by Mahe et al.,16 the mortality rate was 10%, with an autopsy rate of 49%. Given the low absolute number of deaths and substantial proportion of decedents without autopsy, the potential for chance to produce an imbalance in detection of PE is high in these studies. When we excluded these 2 trials, we found that PE was no longer reduced to a statistically significant degree by prophylaxis. Loss of significance for PE in 2 sensitivity analyses (when excluding studies of lower quality, or using autopsy as a sole diagnostic study) is problematic and calls into question the true benefit of prophylaxis for prevention of PE.
Another limitation of the current literature centers on the variability of dosing used. We pooled trials of UFH whether given BID or TID. Given the small number of trials we did not do sensitivity analyses by dosage. A recent meta‐analysis3 found both doses are efficacious, while a recent review article32 suggested superiority of TID dosing. We believe the available literature does not clearly address this issue. Regarding comparisons of LMWH to UFH, dosing variability was also noted. The trial by Bergmann and Neuhart27 used enoxaparin 20 mg per day and found similar efficacy to UFH BID, while the Samama et al.24 trial found enoxaparin 20 mg per day no more efficacious than placebo. While the literature does not clearly define a best dose, we believe enoxaparin doses lower than 40 mg daily do not reflect the standard of care.
An additional limitation of the literature is publication bias. We assessed the possibility of publication bias by a variety of means. We did find statistical evidence of publication bias for the outcome of PE when prophylaxis was compared to control. Importantly, two meta‐analyses2, 4 on thromboembolism prophylaxis for general medicine patients suggested publication bias is present and our finding supports this conclusion. While no test for publication bias is foolproof, the best protection against publication bias, which we pursued in our study, consists of a thorough search for unpublished studies, including a search of conference proceedings, contact with experts in the field, and manufacturers of LMWH.
A final limitation of the current literature centers on risk assessment. All of the trials in this meta‐analysis included patients with an elevated level of risk. Unfortunately, risk was not clearly defined in many studies, and there was no minimum level of risk between trials. While immobility, age, and length of stay were reported for most studies, other risk factors such as personal history of thromboembolism and malignancy were not uniformly reported. Based on our analysis we are not confident our results can be extrapolated to all general medicine patients.
In conclusion, we found good evidence that pharmacologic prophylaxis significantly decreases the risk of all DVT and proximal DVT in at‐risk general medical patients. However, only LMWH was shown to prevent proximal DVT. We found inconclusive evidence that prophylaxis prevents PE. When compared directly we did not find clear superiority between UFH and LMWH, though several limitations of the current literature hamper decision‐making. Given the lower cost, it may seem justified to use UFH. However, there are other practical issues, such as the fact that LMWH is given once daily, and so potentially preferred by patients and more efficient for nurses. All of these results pertain to patients with elevated risk. While we did not find significant safety concerns with prophylaxis we do not know if these results can be extrapolated to lower‐risk patients. We believe that recommending widespread prophylaxis of all general medicine patients requires additional evidence about appropriate patient selection.
Acknowledgements
The authors thank Emmanuelle Williams, MD, for translating articles from French; Claudia Figueroa, MS, for translating articles from Spanish; Vikas Gulani, MD, for translating articles from German; and Rebecca Lee, MS, for translating articles from German, Dutch, and Italian. In addition, the authors thank Dr. Dilzer from Pfizer Global Pharmaceuticals, Kathleen E. Moigis from Aventis, and Carol McCullen from Glaxo Smith Kline for their search for unpublished pharmaceutical trials of low molecular weight heparins. Finally, the authors thank the Veterans Administration/University of Michigan Patient Safety Enhancement Program for research support.
- ,,, et al.Prevention of venous thromboembolism: the Seventh ACCP Conference on Antithrombotic and Thrombolytic Therapy.Chest.2004;126(suppl):338S–400S.
- ,,,,.Pharmacological venous thromboembolism prophylaxis in hospitalized medical patients: a meta‐analysis of randomized controlled trials.Arch Intern Med.2007;167(14):1476–1486.
- ,,,,.Twice vs three times daily heparin dosing for thromboembolism prophylaxis in the general medical population: a metaanalysis.Chest.2007;131(2):507–516.
- ,,,,.Meta‐analysis: anticoagulant prophylaxis to prevent symptomatic venous thromboembolism in hospitalized medical patients.Ann Intern Med.2007;146(4):278–288.
- National Quality Forum. National Consensus Standards for the Prevention and Care of Venous Thromboembolism (including Deep Vein Thrombosis and Pulmonary Embolism). Available at: http://www.qualityforum.org/projects/completed/vte/index.asp. Accessed May2009.
- ,.A prospective registry of 5,451 patients with ultrasound‐confirmed deep vein thrombosis.Am J Cardiol.2004;93(2):259–262.
- ,,, et al.Venous thromboembolism risk and prophylaxis in the acute hospital care setting (ENDORSE study): a multinational cross‐sectional study.Lancet.2008;371(9610):387–394.
- ,,,.Pharmacological thromboembolic prophylaxis in a medical ward: room for improvement.J Gen Intern Med.2002;17(10):788–791.
- ,,,.[Effectiveness of low molecular weight heparin (Fragmin) in the prevention of thromboembolism in internal medicine patients. A randomized double‐blind study].Med Klin (Munich).1988;83(7):241–245, 278.
- ,,, et al.Assessing the quality of reports of randomized clinical trials: is blinding necessary?Control Clin Trials.1996;17(1):1–12.
- ,.Quantifying heterogeneity in a meta‐analysis.Stat Med.2002;21(11):1539–1558.
- ,,,.Bias in meta‐analysis detected by a simple, graphical test.BMJ.1997;315(7109):629–634.
- ,.Operating characteristics of a rank correlation test for publication bias.Biometrics.1994;50(4):1088–1101.
- ,,,,,.Randomized comparison of enoxaparin with unfractionated heparin for the prevention of venous thromboembolism in medical patients with heart failure or severe respiratory disease.Am Heart J.2003;145(4):614–621.
- ,,,,.Prevention of deep vein thrombosis in medical patients by low‐dose heparin.Scott Med J.1981;26(2):115–117.
- ,,,,.Lack of effect of a low‐molecular‐weight heparin (nadroparin) on mortality in bedridden medical in‐patients: a prospective randomised double‐blind study.Eur J Clin Pharmacol.2005;61(5‐6):347–351.
- ,,.The venous thrombotic risk in non‐surgical patients: epidemiological data and efficacy/safety profile of a low‐molecular‐weight heparin (enoxaparin). The Prime Study Group.Haemostasis.1996;26(suppl 2):49–56.
- ,,.Subcutaneous low‐molecular‐weight heparin versus standard heparin and the prevention of thromboembolism in medical inpatients. The Heparin Study in Internal Medicine Group.Haemostasis.1996;26(3):127–139.
- ,,, et al.Randomized controlled study of heparin and low molecular weight heparin for prevention of deep‐vein thrombosis in medical patients.Thromb Res.1990;59(3):639–650.
- ,,,.Reduction of mortality in general medical in‐patients by low‐dose heparin prophylaxis.Ann Intern Med.1982;96(5):561–565.
- .Randomised, controlled trial of low‐dose heparin for prevention of fatal pulmonary embolism in patients with infectious diseases. The Heparin Prophylaxis Study Group.Lancet.1996;347(9012):1357–1361.
- ,,, et al.The prophylaxis of medical patients for thromboembolism pilot study.Am J Med.2006;119(1):54–59.
- ,,, et al.Prevention of deep vein thrombosis in elderly medical in‐patients by a low molecular weight heparin: a randomized double‐blind trial.Haemostasis.1986;16(2):159–164.
- ,,, et al.A comparison of enoxaparin with placebo for the prevention of venous thromboembolism in acutely ill medical patients. Prophylaxis in Medical Patients with Enoxaparin Study Group.N Engl J Med.1999;341(11):793–800.
- ,,,,,.Randomized, placebo‐controlled trial of dalteparin for the prevention of venous thromboembolism in acutely ill medical patients.Circulation.2004;110(7):874–879.
- ,,.Prevention of thromboembolic accidents in elderly subjects with Fraxiparine. In: Bounameaux H, Samama MM, Ten Cate JW, eds.Fraxiaparine. 2nd International Symposium. Recent pharmacological and clinical data.New York:Schattauer;1990:51‐54.
- ,.A multicenter randomized double‐blind study of enoxaparin compared with unfractionated heparin in the prevention of venous thromboembolic disease in elderly in‐patients bedridden for an acute medical illness. The Enoxaparin in Medicine Study Group.Thromb Haemost.1996;76(4):529–534.
- ,,, et al.Prevention of venous thromboembolism in internal medicine with unfractionated or low‐molecular‐weight heparins: a meta‐analysis of randomised clinical trials.Thromb Haemost.2000;83(1):14–19.
- ,,,,.Meta‐analysis of venous thromboembolism prophylaxis in medically Ill patients.Clin Ther.2007;29(11):2395–2405.
- ,,,,,.Clinical relevance of distal deep vein thrombosis. Review of literature data.Thromb Haemost.2006;95(1):56–64.
- .Natural history of venous thromboembolism.Circulation.2003;107(suppl 1):I22–I30.
- .Clinical practice. Prophylaxis for thromboembolism in hospitalized medical patients.N Engl J Med.2007;356(14):1438–1444.
Deep venous thrombosis (DVT) and pulmonary embolism (PE), collectively referred to as venous thromboembolism (VTE), are common events in hospitalized patients and result in significant morbidity and mortality. Often silent and frequently unexpected, VTE is preventable. Accordingly, the American College of Chest Physicians recommends that pharmacologic prophylaxis be given to acutely ill medical patients admitted to the hospital with congestive heart failure or severe respiratory disease, or to patients who are confined to bed who have additional risk factors, such as cancer or previous VTE.1 Three recent meta‐analyses24 demonstrated significant reductions in VTE in general medicine patients with pharmacologic prophylaxis. Recently the National Quality Forum advocated that hospitals evaluate each patient upon admission and regularly thereafter, for the risk of developing DVT/VTE and utilize clinically appropriate methods to prevent DVT/VTE.5
Despite recommendations for prophylaxis, multiple studies demonstrate utilization in <50% of at‐risk general medical patients.68 Physicians' lack of awareness may partially explain this underutilization, but other likely factors include physicians' questions about the clinical importance of the outcome (eg, some studies have shown reductions primarily in asymptomatic distal DVT), doubt regarding the best form of prophylaxis (ie, unfractionated heparin [UFH] vs. low molecular weight heparin [LMWH]), uncertainty regarding optimal dosing regimens, and comparable uncertainty regarding which patients have sufficiently high risk for VTE to outweigh the risks of anticoagulation.
We undertook the current meta‐analysis to address questions about thromboembolism prevention in general medicine patients. Does pharmacologic prophylaxis prevent clinically relevant events? Is LMWH or UFH preferable in terms of either efficacy or safety?
MATERIALS AND METHODS
Search Strategy
We conducted an extensive search that included reviewing electronic databases (MEDLINE, EMBASE, and CINAHL) through June 2008, reviewing conference proceedings, and contacting drug manufacturers. The MEDLINE search combined the key words deep venous thrombosis, thromboembolism, AND pulmonary embolism with the terms primary prevention, prophylaxis, OR prevention. We limited the search results using the filter for randomized controlled trials in PubMed. Similar strategies (available on request) were used to search EMBASE, CINAHL, and the Cochrane Central Register of Controlled Trials. We also searched the Cochrane Database of Systematic Reviews to identify previous reviews on the same topic. We obtained translations of eligible, non‐English‐language articles.
The proceedings of annual meetings from the American Thoracic Society, the American Society of Hematology, and the Society for General Internal Medicine from 1994 to 2008 were hand‐searched for reports on DVT or PE prevention published in abstract form only. (Note: the American Society of Hematology was only available through 2007). We contacted the 3 main manufacturers of LMWHPfizer (dalteparin), Aventis (enoxaparin), Glaxo Smith Kline (nadoparin)and requested information on unpublished pharmaceutical sponsored trials. First authors from the trials included in this meta‐analysis were also contacted to determine if they knew of additional published or unpublished trials.
Inclusion and Exclusion Criteria
Studies were required to be prospective randomized controlled trials comparing UFH or LMWH to mechanical prophylaxis, placebo, or no intervention. We also included randomized head‐to‐head comparisons of UFH and LMWH. Eligible studies enrolled general medical patients. Trials including predominantly intensive care unit (ICU) patients; stroke, spinal cord, or acute myocardial infarction patients were excluded. We excluded trials focused on these populations because the risk for VTE may differ from that for general medical patients and because patients in these groups already commonly receive anticoagulants as a preventive measure or as active treatment (eg, for acute myocardial infarction [MI] care). Trials assessing thrombosis in patients with long‐term central venous access/catheters were also excluded. Articles focusing on long‐term rehabilitation patients were excluded.
Studies had to employ objective criteria for diagnosing VTE. For DVT these included duplex ultrasonography, venography, fibrinogen uptake scanning, impedance plethysmography, or autopsy as a primary or secondary outcome. Studies utilizing thermographic techniques were excluded.9 Eligible diagnostic modalities for PE consisted of pulmonary arteriogram, ventilation/perfusion scan, CT angiography, and autopsy.
After an initial review of article titles and abstracts, the full texts of all articles that potentially met our inclusion criteria were independently reviewed for eligibility by 2 authors (G.M.B., M.D.). In cases of disagreement, a third author (S.F.) independently reviewed the article and adjudicated decisions.
Quantitative Data Synthesis and Statistical Analysis
For all included articles, 2 reviewers independently abstracted data on key study features (including population size, trial design, modality of VTE diagnosis, and interventions delivered to treatment and control groups), results (including the rates of all DVT, proximal DVT, symptomatic DVT, PE, and death), as well as adverse events (such as bleeding and thrombocytopenia). We accepted the endpoint of DVT when assessed by duplex ultrasonography, venography, autopsy, or when diagnosed by fibrinogen uptake scanning or impedance plethysmography. For all endpoints we abstracted event rates as number of events based on intention to treat. Each study was assessed for quality using the Jadad scale.10 The Jadad scale is a validated tool for characterizing study quality that accounts for randomization, blinding, and description of withdrawals and dropouts in individual trials. The Jadad score ranges from 0 to 5 with higher numbers identifying trials of greater methodological rigor.
The trials were divided into 4 groups based on the prophylaxis agent used and the method of comparison (UFH vs. control, LMWH vs. control, LMWH vs. UFH, and LMWH/UFH combined vs. control). After combining trials for each group, we calculated a pooled relative risk (RR) and a 95% confidence interval (CI) based on both fixed and a random effects model using the DerSimonian and Laird method. Heterogeneity of the included studies was evaluated with a chi‐square statistic. The percentage of variation in the pooled RR attributable to heterogeneity was calculated and reported using the I‐squared statistic.11 Sensitivity analyses were performed and included repeating all analyses using high‐quality studies only (Jadad score 3 or higher). Publication bias was assessed using the methods developed by Egger et al.12 and Begg and Mazumdar.13 All analyses were performed using STATA SE version 9 (Stata Corp, College Station, TX).
RESULTS
Study Identification and Selection
The computerized literature search resulted in 5284 articles. Three additional citations were found by review of bibliographies. No additional trials were identified from reviews of abstracts from national meetings. Representatives from the 3 pharmaceutical companies reported no knowledge of additional published or unpublished data. Of the 5287 studies identified by the search, 14 studies met all eligibility criteria (Figure 1).
Study Characteristics
The 14 trials eligible for inclusion in the analysis consisted of 8 comparisons of UFH or LMWH vs. control (Table 1) and 6 head‐to‐head comparisons of UFH and LMWH (Table 2). The 14 studies included 8 multicenter trials and enrolled a total of 24,515 patients: 20,594 in the 8 trials that compared UFH or LMWH with placebo and 3921 in the 6 trials that compared LMWH with UFH. Two trials exclusively enrolled patients with either congestive heart failure or severe respiratory disease,14, 15 while 12 trials enrolled mixed populations. In 8 trials a period of immobility was necessary for study entry,14, 1621 while in 2 trials immobility was not required.22, 23 In the 4 remaining trials immobility was not explicitly discussed.15, 2426 One‐half of the trials required a length of stay greater than 3 days.1719, 2225
| Study (Year)Reference | Patients (n) | Duration (days) | VTE Risk Factors | Drug Dose | Comparison | DVT Assessed | PE Assessed | Double Blind | Jadad Score |
|---|---|---|---|---|---|---|---|---|---|
| |||||||||
| Belch et al. (1981)15 | 100 | 8 | Age 40‐80 years; CHF; chest infection | UFH TID | None | FUS | VQ | No | 1 |
| Dahan et al. (1986)23 | 270 | 10* | Age >65 years | Enoxaparin 60 mg | Placebo | FUS | Autopsy | Yes | 3 |
| Halkin et al. (1982)20 | 1358 | Not reported | Age >40 years; immobile | UFH BID | None | No | No | No | 1 |
| Mahe et al. (2005)16 | 2474 | 13.08 | Age >40 years; immobile | Nadroparin 7500 IU | Placebo | Autopsy | Autopsy | Yes | 5 |
| Gardlund (1996)21 | 11693 | 8.2 | Age >55 years; immobile | UFH BID | None | Autopsy | Autopsy | No | 2 |
| Samama et al. (1999)24 | 738 | 7 | Age >40 years; length of stay 6 days; CHF; respiratory failure or 1 additional risk factor | Enoxaparin 40 mg | Placebo | Venography | Composite | Yes | 4 |
| Leizorovicz et al. (2004)25 | 3681 | 12.6 | Age >40 years; length of stay 4 days; CHF; respiratory failure or 1 additional risk factor | Dalteparin 5000 IU | Placebo | DUS | Composite | Yes | 4 |
| Lederle et al. (2006)22 | 280 | 13.4 | Age >60 years; length of stay 3 days | Enoxaparin 40 mg | Placebo | DUS | Composite | Yes | 5 |
| Study (Year)reference | Patients (n) | Duration (days) | VTE Risk Factors | Drug/Dose | Comparison | DVT Assessed | PE Assessed | Double Blind | Jadad Score |
|---|---|---|---|---|---|---|---|---|---|
| |||||||||
| Bergmann and Neuhart (1996)27 | 442 | 9.5 | Age >65 years; immobile | Enoxaparin 20 mg | UFH BID | FUS | Composite | Yes | 5 |
| Harenberg et al. (1990)19 | 166 | 10* | Age 40‐80 years; 1 week of bed rest | LMWH 1.500 aPTT units QD | UFH TID | IP | No | Yes | 3 |
| Kleber et al. (2003)14 | 665 | 9.8 | Age 18 years; severe CHF or respiratory disease; immobile | Enoxaparin 40 mg | UFH TID | Venography | Composite | No | 3 |
| Aquino et al. (1990)26 | 99 | Not reported | Age >70 years | Nadoparine 7500 IU | UFH BID | DUS | Composite | No | 1 |
| Harenberg et al. (1996)18 | 1590 | 10* | Age 50‐80 years; immobile + 1 additional risk factor | Nadoparine 36 mg | UFH TID | DUS | Composite | Yes | 4 |
| Lechler et al. (1996)17 | 959 | 7* | Age >18 years; immobile + 1 additional risk factor | Enoxaparin 40 mg | UFH TID | DUS | Composite | Yes | 3 |
While minimum age for study entry varied, the patient population predominantly ranged from 65 to 85 years of age. Many of the trials reported expected, not actual, treatment duration. The range of expected treatment was 7 to 21 days, with 10 days of treatment the most frequently mentioned. In the 8 trials1416, 21, 22, 24, 25, 27 that reported actual treatment duration, the range was 8 to 13.4 days. Most trials did not report number of VTE risk factors per patient, nor was there uniform acceptance of risk factors across trials.
UFH or LMWH vs. Control
DVT
Across 7 trials comparing either UFH or LMWH to control, heparin products significantly decreased the risk of all DVT (RR = 0.55; 95% CI: 0.36‐0.83) (Figure 2A). When stratified by methodological quality, 5 trials16, 2225 with Jadad scores of 3 or higher showed an RR reduction of 0.53 (95% CI: 0.38‐0.72) in reducing all DVT. All of the higher‐quality trials compared LMWH to placebo. Across 4 trials that reported data for symptomatic DVT there was a nonsignificant reduction in RR compared with placebo (RR = 0.73; 95% CI: 0.45‐1.16) (Figure 2B). Only 2 trials24, 25 (both LMWH trials) reported results for proximal DVT and demonstrated significant benefit of prophylaxis with a pooled RR of 0.46 (95% CI: 0.31‐0.69) (Figure 2C).
PE
Across 7 trials comparing either UFH or LMWH to control, heparin products significantly decreased the risk of PE (RR = 0.70; 95% CI: 0.53‐0.93) (Figure 3A). The 5 trials16, 2225 with Jadad scores of 3 or greater showed a similar relative risk reduction, but the result was no longer statistically significant (RR = 0.56; 95% CI: 0.31‐1.02). Two of the trials16, 21 relied solely on the results of autopsy to diagnose PE, which may have given rise to chance differences in detection due to generally low autopsy rates. Eliminating these 2 studies from the analysis resulted in loss of statistical significance for the reduction in risk for PE (RR = 0.48; 95% CI: 0.20‐1.15).
Death
Seven trials16, 2025 comparing either UFH or LMWH to control examined the impact of pharmacologic prophylaxis on death and found no significant difference between treated and untreated patients across all trials (RR = 0.92; 95% CI: 0.82‐1.03) and those limited to studies with Jadad scores of 3 or higher (RR = 0.97; 95% CI: 0.80‐1.17).
LMWH vs. UFH
DVT
In 6 trials14, 1719, 26, 27 comparing LMWH to UFH given either twice a day (BID) or 3 times a day (TID), there was no statistically significant difference in all DVT (RR = 0.90; 95% CI: 0.57‐1.43). (For all analyses RRs <1 favor LMWH, while RRs >1 favor UFH.) A total of 2 trials14, 18 reported results separately for proximal DVT with no statistically significant difference noted between UFH and LMWH (RR = 1.60; 95% CI: 0.53‐4.88). One small trial26 reported findings comparing UFH to LMWH for prevention of symptomatic DVT with no difference noted.
PE
Pooled data from the 5 trials14, 17, 18, 26, 27 comparing UFH to LMWH in the prevention of PE showed no statistically significant difference in rates of pulmonary embolism (RR = 0.82; 95% CI: 0.26‐2.63) (Figure 3B). In sensitivity analysis this result was not impacted by Jadad score.
Death
When UFH was compared to LMWH no statistically significant difference in the rate of death was found (RR = 0.96; 95% CI: 0.50‐1.85). Here again, no difference was noted when limited to studies with Jadad scores of 3 or higher.
Complications
We evaluated adverse events of heparin products used for prophylaxis and whether there were differences between UFH and LMWH. Reporting of complications was not uniform from study to study, making pooling more difficult. However, we were able to abstract data on any bleeding, major bleeding, and thrombocytopenia from several studies. In 5 studies15, 16, 2325 of either UFH or LMWH vs. control, a significantly increased risk of any bleeding (RR = 1.54; 95% CI: 1.15‐2.06) (Figure 4A) was found. When only major bleeding was evaluated, no statistically significant difference was noted (RR = 1.20; 95% CI: 0.55‐2.58) (Figure 4B). In 4 trials16, 22, 24, 25 the occurrence of thrombocytopenia was not significantly different when comparing UFH or LMWH to control (RR = 0.92; 95% CI: 0.46‐1.86).
When LMWH was compared to UFH in 4 trials,14, 17, 18, 27 a nonsignificant trend toward a decrease in any bleeding was found in the LMWH group (RR = 0.72; 95% CI: 0.44‐1.16) (Figure 5A). A similar trend was seen favoring LMWH in rates of major bleeding (RR = 0.57; 95% CI: 0.25‐1.32) (Figure 5B). Neither trend was statistically significant. Three trials comparing LMWH to UFH reported on thrombocytopenia17, 18, 27 with no significant difference noted (RR = 0.52; 95% CI: 0.06‐4.18).
Heterogeneity and Publication Bias
No statistically significant heterogeneity was identified between trials for any outcomes. The highest I‐squared value was 54.5% (P = 0.14) for the endpoint of thrombocytopenia when UFH was compared to LMWH. In some cases, the nonsignificant results for tests of heterogeneity may have reflected small numbers of trials, but the values for I‐squared for all other endpoints were close to zero indicating that little nonrandom variation existed in the results across studies. All analyses were run using both random effects and fixed effects modeling. While we report results for random effects, no significant differences were observed using fixed effects.
We tested for publication bias using the methods developed by Egger et al.12 and Begg and Mazumdar.13 There was evidence of bias only for the outcome of PE when prophylaxis was compared to control, as the results for both tests were significant (Begg and Mazumdar:13 P = 0.035; Egger et al.:12 P = 0.010). For other outcomes tested, including all DVT (prophylaxis compared to control, and LMWH vs. UFH) as well as PE (LMWH vs. UFH), the P‐values were not significant.
DISCUSSION
When compared to control, LMWH or UFH decreased the risk of all DVT by 45% (RR = 0.55; 95% CI: 0.36‐0.83) and proximal DVT by 54% (RR = 0.46; 95% CI: 0.31‐0.69). PE was also decreased by 30% (RR = 0.70; 95% CI: 0.53‐0.93). Of note, when prophylaxis was compared with placebo all of the high‐quality studies showing a benefit were done using LMWH. The benefits of prophylaxis occurred at the cost of a 54% increased overall risk of bleeding (RR = 1.54; 95% CI 1.15‐2.06). However, the risk of major bleeding was not significantly increased. We did not find a mortality benefit to pharmacologic thromboembolism prophylaxis.
When comparing UFH to LMWH, we noted no difference in all DVT, symptomatic DVT, proximal DVT, PE, or death. While there was a trend toward less bleeding with LMWH, this was not statistically significant.
Taken in aggregate, our findings are in agreement with previous published meta‐analyses reporting net benefit for thromboembolism prophylaxis in medical patients.24, 22, 28, 29 Our meta‐analysis has several methodological strengths over the prior studies, including a comprehensive search of both the published and unpublished literature and assessment of the relationship between methodological quality of included trials and reported benefit. In contrast to previous reviews, our analysis highlights several limitations of the current evidence.
First, many of the studies are older, with predicted lengths of stay of greater than 1 week. The 8‐13‐day range of treatment duration we found in this study is longer than the average length of stay in today's hospitals. Second, there is variability in the diagnostic tests used to diagnose DVT, as well as variation in the definition of DVT among studies. Studies using fibrinogen uptake scanning reported rates of DVT as high as 26%15 while studies using venography reported DVT rates of almost 15% in the placebo arm.24 These rates are higher than most physicians' routine practice. One reason for this discrepancy is most studies did not distinguish below‐the‐knee DVT from more clinically relevant above‐the‐knee DVT. Systematic reviews of medical and surgical patients have found rates of proximal propagation from 0% to 29% in untreated patients.30, 31 Though controversial, below‐the‐knee DVT is believed less morbid than proximal DVT or symptomatic DVT. We addressed this by focusing specifically on clinically relevant endpoints of proximal and symptomatic DVT. When we restricted our analysis to proximal DVT we found a 54% RR reduction in 2 pooled trials of LMWH compared to placebo. In pooled analyses symptomatic DVT was not affected by prophylaxis. When compared head‐to‐head there were no differences between LMWH and UFH for proximal DVT or symptomatic DVT.
When considering PE, the utilization of autopsy as the sole diagnostic method in 2 large trials16, 21 is particularly problematic. In the trial by Garlund,21 the mortality rate was 5.4%, with an autopsy rate of 60.1%. Similarly, in the trial by Mahe et al.,16 the mortality rate was 10%, with an autopsy rate of 49%. Given the low absolute number of deaths and substantial proportion of decedents without autopsy, the potential for chance to produce an imbalance in detection of PE is high in these studies. When we excluded these 2 trials, we found that PE was no longer reduced to a statistically significant degree by prophylaxis. Loss of significance for PE in 2 sensitivity analyses (when excluding studies of lower quality, or using autopsy as a sole diagnostic study) is problematic and calls into question the true benefit of prophylaxis for prevention of PE.
Another limitation of the current literature centers on the variability of dosing used. We pooled trials of UFH whether given BID or TID. Given the small number of trials we did not do sensitivity analyses by dosage. A recent meta‐analysis3 found both doses are efficacious, while a recent review article32 suggested superiority of TID dosing. We believe the available literature does not clearly address this issue. Regarding comparisons of LMWH to UFH, dosing variability was also noted. The trial by Bergmann and Neuhart27 used enoxaparin 20 mg per day and found similar efficacy to UFH BID, while the Samama et al.24 trial found enoxaparin 20 mg per day no more efficacious than placebo. While the literature does not clearly define a best dose, we believe enoxaparin doses lower than 40 mg daily do not reflect the standard of care.
An additional limitation of the literature is publication bias. We assessed the possibility of publication bias by a variety of means. We did find statistical evidence of publication bias for the outcome of PE when prophylaxis was compared to control. Importantly, two meta‐analyses2, 4 on thromboembolism prophylaxis for general medicine patients suggested publication bias is present and our finding supports this conclusion. While no test for publication bias is foolproof, the best protection against publication bias, which we pursued in our study, consists of a thorough search for unpublished studies, including a search of conference proceedings, contact with experts in the field, and manufacturers of LMWH.
A final limitation of the current literature centers on risk assessment. All of the trials in this meta‐analysis included patients with an elevated level of risk. Unfortunately, risk was not clearly defined in many studies, and there was no minimum level of risk between trials. While immobility, age, and length of stay were reported for most studies, other risk factors such as personal history of thromboembolism and malignancy were not uniformly reported. Based on our analysis we are not confident our results can be extrapolated to all general medicine patients.
In conclusion, we found good evidence that pharmacologic prophylaxis significantly decreases the risk of all DVT and proximal DVT in at‐risk general medical patients. However, only LMWH was shown to prevent proximal DVT. We found inconclusive evidence that prophylaxis prevents PE. When compared directly we did not find clear superiority between UFH and LMWH, though several limitations of the current literature hamper decision‐making. Given the lower cost, it may seem justified to use UFH. However, there are other practical issues, such as the fact that LMWH is given once daily, and so potentially preferred by patients and more efficient for nurses. All of these results pertain to patients with elevated risk. While we did not find significant safety concerns with prophylaxis we do not know if these results can be extrapolated to lower‐risk patients. We believe that recommending widespread prophylaxis of all general medicine patients requires additional evidence about appropriate patient selection.
Acknowledgements
The authors thank Emmanuelle Williams, MD, for translating articles from French; Claudia Figueroa, MS, for translating articles from Spanish; Vikas Gulani, MD, for translating articles from German; and Rebecca Lee, MS, for translating articles from German, Dutch, and Italian. In addition, the authors thank Dr. Dilzer from Pfizer Global Pharmaceuticals, Kathleen E. Moigis from Aventis, and Carol McCullen from Glaxo Smith Kline for their search for unpublished pharmaceutical trials of low molecular weight heparins. Finally, the authors thank the Veterans Administration/University of Michigan Patient Safety Enhancement Program for research support.
- ,,, et al.Prevention of venous thromboembolism: the Seventh ACCP Conference on Antithrombotic and Thrombolytic Therapy.Chest.2004;126(suppl):338S–400S.
- ,,,,.Pharmacological venous thromboembolism prophylaxis in hospitalized medical patients: a meta‐analysis of randomized controlled trials.Arch Intern Med.2007;167(14):1476–1486.
- ,,,,.Twice vs three times daily heparin dosing for thromboembolism prophylaxis in the general medical population: a metaanalysis.Chest.2007;131(2):507–516.
- ,,,,.Meta‐analysis: anticoagulant prophylaxis to prevent symptomatic venous thromboembolism in hospitalized medical patients.Ann Intern Med.2007;146(4):278–288.
- National Quality Forum. National Consensus Standards for the Prevention and Care of Venous Thromboembolism (including Deep Vein Thrombosis and Pulmonary Embolism). Available at: http://www.qualityforum.org/projects/completed/vte/index.asp. Accessed May2009.
- ,.A prospective registry of 5,451 patients with ultrasound‐confirmed deep vein thrombosis.Am J Cardiol.2004;93(2):259–262.
- ,,, et al.Venous thromboembolism risk and prophylaxis in the acute hospital care setting (ENDORSE study): a multinational cross‐sectional study.Lancet.2008;371(9610):387–394.
- ,,,.Pharmacological thromboembolic prophylaxis in a medical ward: room for improvement.J Gen Intern Med.2002;17(10):788–791.
- ,,,.[Effectiveness of low molecular weight heparin (Fragmin) in the prevention of thromboembolism in internal medicine patients. A randomized double‐blind study].Med Klin (Munich).1988;83(7):241–245, 278.
- ,,, et al.Assessing the quality of reports of randomized clinical trials: is blinding necessary?Control Clin Trials.1996;17(1):1–12.
- ,.Quantifying heterogeneity in a meta‐analysis.Stat Med.2002;21(11):1539–1558.
- ,,,.Bias in meta‐analysis detected by a simple, graphical test.BMJ.1997;315(7109):629–634.
- ,.Operating characteristics of a rank correlation test for publication bias.Biometrics.1994;50(4):1088–1101.
- ,,,,,.Randomized comparison of enoxaparin with unfractionated heparin for the prevention of venous thromboembolism in medical patients with heart failure or severe respiratory disease.Am Heart J.2003;145(4):614–621.
- ,,,,.Prevention of deep vein thrombosis in medical patients by low‐dose heparin.Scott Med J.1981;26(2):115–117.
- ,,,,.Lack of effect of a low‐molecular‐weight heparin (nadroparin) on mortality in bedridden medical in‐patients: a prospective randomised double‐blind study.Eur J Clin Pharmacol.2005;61(5‐6):347–351.
- ,,.The venous thrombotic risk in non‐surgical patients: epidemiological data and efficacy/safety profile of a low‐molecular‐weight heparin (enoxaparin). The Prime Study Group.Haemostasis.1996;26(suppl 2):49–56.
- ,,.Subcutaneous low‐molecular‐weight heparin versus standard heparin and the prevention of thromboembolism in medical inpatients. The Heparin Study in Internal Medicine Group.Haemostasis.1996;26(3):127–139.
- ,,, et al.Randomized controlled study of heparin and low molecular weight heparin for prevention of deep‐vein thrombosis in medical patients.Thromb Res.1990;59(3):639–650.
- ,,,.Reduction of mortality in general medical in‐patients by low‐dose heparin prophylaxis.Ann Intern Med.1982;96(5):561–565.
- .Randomised, controlled trial of low‐dose heparin for prevention of fatal pulmonary embolism in patients with infectious diseases. The Heparin Prophylaxis Study Group.Lancet.1996;347(9012):1357–1361.
- ,,, et al.The prophylaxis of medical patients for thromboembolism pilot study.Am J Med.2006;119(1):54–59.
- ,,, et al.Prevention of deep vein thrombosis in elderly medical in‐patients by a low molecular weight heparin: a randomized double‐blind trial.Haemostasis.1986;16(2):159–164.
- ,,, et al.A comparison of enoxaparin with placebo for the prevention of venous thromboembolism in acutely ill medical patients. Prophylaxis in Medical Patients with Enoxaparin Study Group.N Engl J Med.1999;341(11):793–800.
- ,,,,,.Randomized, placebo‐controlled trial of dalteparin for the prevention of venous thromboembolism in acutely ill medical patients.Circulation.2004;110(7):874–879.
- ,,.Prevention of thromboembolic accidents in elderly subjects with Fraxiparine. In: Bounameaux H, Samama MM, Ten Cate JW, eds.Fraxiaparine. 2nd International Symposium. Recent pharmacological and clinical data.New York:Schattauer;1990:51‐54.
- ,.A multicenter randomized double‐blind study of enoxaparin compared with unfractionated heparin in the prevention of venous thromboembolic disease in elderly in‐patients bedridden for an acute medical illness. The Enoxaparin in Medicine Study Group.Thromb Haemost.1996;76(4):529–534.
- ,,, et al.Prevention of venous thromboembolism in internal medicine with unfractionated or low‐molecular‐weight heparins: a meta‐analysis of randomised clinical trials.Thromb Haemost.2000;83(1):14–19.
- ,,,,.Meta‐analysis of venous thromboembolism prophylaxis in medically Ill patients.Clin Ther.2007;29(11):2395–2405.
- ,,,,,.Clinical relevance of distal deep vein thrombosis. Review of literature data.Thromb Haemost.2006;95(1):56–64.
- .Natural history of venous thromboembolism.Circulation.2003;107(suppl 1):I22–I30.
- .Clinical practice. Prophylaxis for thromboembolism in hospitalized medical patients.N Engl J Med.2007;356(14):1438–1444.
Copyright © 2009 Society of Hospital Medicine
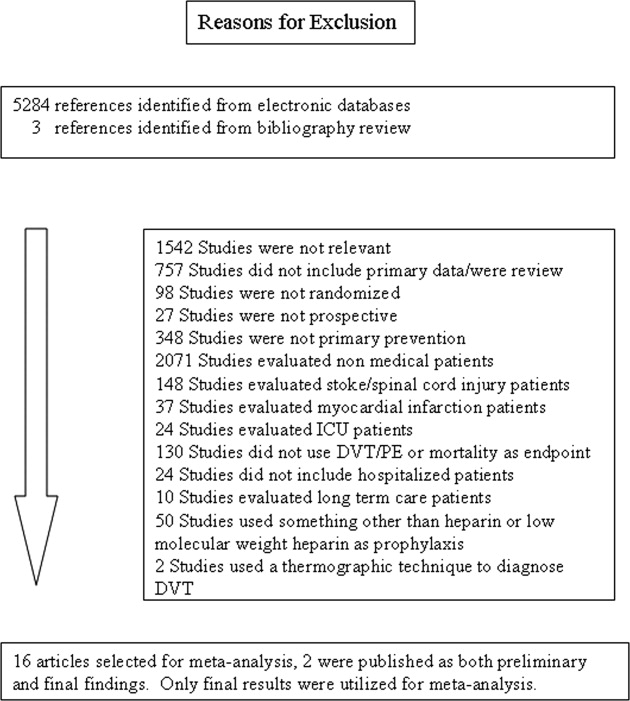
Systematic Review of Rapid Response Systems
A medical emergency team1 is a group of clinicians trained to quickly assess and treat hospitalized patients showing acute signs of clinical deterioration. Equivalent terms used are rapid response team,2 critical care outreach team,3 and patient‐at‐risk team.4 A consensus panel5 recently endorsed use of the term rapid response system (RRS) to denote any system that uses a standard set of clinical criteria to summon caregivers to the bedside of a patient who is deemed unstable but not in cardiopulmonary arrest (in which case a standard resuscitation team would be summoned). Such teams primarily evaluate patients on general hospital wards.
RRSs have been developed in response to data indicating that patients frequently demonstrate premonitory signs or receive inadequate care prior to unanticipated intensive care unit (ICU) admission, cardiopulmonary arrest, or death outside the ICU.614 Earlier identification and treatment of such patients could prevent adverse clinical outcomes. The structure of RRSs varies but generally includes a physician and nurse and may also include other staff such as respiratory therapists.5 Teams are summoned by hospital staff to assess patients meeting specific clinical criteria (see box) about whom the bedside staff has significant concern.150
| Any staff member may call the team if 1 of the following criteria is met: |
| Heart rate > 140/min or < 40/min |
| Respiratory rate > 28/min or < 8/min |
| Systolic blood pressure > 180 mmHg or < 90 mm Hg |
| Oxygen saturation < 90% despite supplementation |
| Acute change in mental status |
| Urine output < 50 cc over 4 hours |
| Staff member has significant concern about patient's condition |
| Additional criteria used at some institutions: |
| Chest pain unrelieved by nitroglycerin |
| Threatened airway |
| Seizure |
| Uncontrolled pain |
Initial studies of RRSs, performed primarily in Australia and the United Kingdom, showed promising reductions in unanticipated ICU admissions, cardiac arrests, and even overall inpatient mortality.1, 16, 17 The considerable enthusiasm generated by these studies18, 19 resulted in the Institute for Healthcare Improvement (IHI) incorporating RRSs into its 100,000 Lives campaign,2 and RRSs are now being implemented in the more than 3000 U.S. hospitals that joined the campaign. However, a recent commentary on rapid response teams20 and a systematic review of critical care outreach teams21 have raised concerns that this widespread implementation may not be justified by the available evidence. We performed a systematic review of studies of all variations of RRSs in order to determine their effect on patient outcomes and to characterize variations in their organization and implementation.
METHODS
Literature Search and Inclusion and Exclusion Criteria
We systematically searched MEDLINE, CINAHL, and BIOSIS through August 2006 for relevant studies using the various terms for RRSs (eg, medical emergency team, rapid response team, critical care outreach) and medical subject headings relevant to inpatient care and critical illness (eg, patient care team and resuscitation; the full search strategy is given in the Appendix). We also reviewed the abstract lists from the 2004 and 2005 American Thoracic Society and Society of Critical Care Medicine annual meetings and scanned reference lists from key articles.
We screened the abstracts of the articles identified by the search, and 2 independent reviewers abstracted potentially relevant articles using a standardized data abstraction form. Disagreements between the reviewers were resolved by consensus and, if necessary, discussion with a third reviewer. We included randomized controlled trials (RCTs), controlled before‐after studies, and interrupted time series, including simple before‐after studies with no contemporaneous control group, though we planned to separately analyze data from controlled studies if possible. We included only English‐language articles.
On the basis of RRS features in widely cited articles2224 and the recommendations of a recent consensus statement,5 we defined an RRS as having the following characteristics: (1) its primary responsibility is to intervene whenever hospitalized patients become unstable before cardiopulmonary arrest occurs; (2) it must primarily provide care outside the ICU and emergency department; (3) specific clinical criteria must be in place that define instability and trigger a call to the team; and (4) it must be expected to respond within a specified time. We defined these criteria in order to distinguish studies of RRSs from studies of cardiac arrest (code blue) teams or traditional consulting services.
To be included in the analysis, articles had to report the effects of a rapid response system on at least 1 of these outcomes: inpatient mortality, inpatient cardiac arrest, or unscheduled ICU transfer. We used the definitions of cardiac arrest and unscheduled ICU transfer given in the primary studies. In addition to these outcomes, we abstracted information on the number of admissions and the number of RRS calls during the study period. To maximize the comparability of study outcomes, we calculated the rates of mortality, cardiac arrest, unscheduled ICU transfer, and RRS calls per 1000 admissions for studies that did not supply data in this fashion.
Assessment of Study Quality
Quality scoring instruments for studies included in systematic reviews generally focus on randomized controlled trials, which we anticipated would account for a minority of included studies. On the basis of recommendations for the assessment of methodology for nonrandomized study designs,25, 26 we identified and abstracted 4 important determinants of internal validity (Table 1). The consensus statement5 recommends monitoring the effectiveness of RRSs by measuring the rate of unscheduled ICU admissions (defined as an unplanned admission to the ICU from a general ward27) and cardiac arrests of patients who were not listed as do not resuscitate (DNR). As the definition of unscheduled ICU admission allows room for subjectivity, we considered the blinding of assessment of this outcome to study group assignment to be important, especially for retrospective studies. Measurement of cardiac arrests should be less susceptible to blinding issues, but one of the functions of an RRS can be to initiate discussions that result in changes in the goals of care and code status.22 Thus, excluding patients made DNR by the team from cardiac arrest calculations could falsely lower the cardiac arrest rate.
| Quality measures |
|---|
|
| A. Internal validity |
| 1. Did the study have a contemporaneous control group? |
| 2. If there was no contemporaneous control group, did the study report data for more than 1 time point before and after the intervention? |
| 3. Were nonobjective primary outcomes (eg, unplanned ICU transfer) measured in a blinded fashion? |
| 4. Were patients made DNR by the RRS included in calculations of the cardiac arrest and mortality rates? |
| B. Generalizability |
| 5. Was the intervention performed independent of other quality improvement interventions targeting the care of critically ill patients? |
| 6. Did the study report the number of admissions and RRS calls during the study period? |
| 7. Did the study report the availability of intensivists before and after the intervention? |
We also abstracted 3 separate elements of study quality pertaining to the external validity or generalizability of included studies (Table 1). These elements were defined a priori by consensus reached by discussion among the reviewers. These elements were intended to provide a framework for interpreting the included studies and to guide subgroup analyses. They were not used to form a composite quality score.
Statistical Analysis
We performed a random‐effects meta‐analysis to calculate summary risk ratios with 95% confidence intervals for the effects of RRSs on inpatient mortality, cardiopulmonary arrest, and unscheduled ICU admission. Included in the meta‐analysis were the studies that reported total number of admissions and incidence of each outcome before and after institution of the RRS. For randomized trials that reported pre‐ and postintervention data, we treated the intervention and control groups as separate trials in order to be able to compare their effects with the before‐after trials. For studies that reported results adjusted for clustering (ie, by hospital), we back‐calculated the unadjusted results by multiplying the standard error by the square of the design factor coefficient.28, 29 We calculated the I2 statistic to assess heterogeneity.30 All analyses were performed using Stata version 8.2 (Stata Corporation, College Station, TX).
RESULTS
The database searches identified 861 citations, and 1 additional prepublication study was supplied by the study's first author31; 89 articles underwent full‐text review (Fig. 1). Most studies excluded during the full‐text review did not meet our criteria for a study of an RRS or were observational studies or review articles. For instance, Sebat et al.32 published a study of a shock team at a community hospital that intervened when any patient suffered nontraumatic shock; the study did not meet our inclusion criteria as all patients were admitted to the ICU, most directly from the emergency department. Another frequently cited study, by Bristow et al.,16 was excluded as it was a case‐control study. Thirteen studies,3, 2224, 31, 334011 full‐length studies and 2 abstractsmet all criteria for inclusion.

Characteristics of Included Trials
The characteristics of included studies are outlined in Table 2. Five studies were performed in Australia, 4 in the United States, and 4 in the United Kingdom. All were conducted in academic teaching hospitals. Two studies37, 38 focused on pediatric inpatients, and the remainder involved hospitalized adults. The RRS intervened for all hospitalized patients in all but 2 studies (1 of which focused on surgical inpatients33 and the other in which the RRS evaluated only patients discharged from the ICU3). In 2 studies,31, 39 the RRS was available to evaluate outpatients, such as hospital visitors, in addition to inpatients.0
| Study | Location | Hospital type | Patient population | RRS composition | Measured outcomes | Definition of unscheduled ICU admission | Definition of cardiac arrest |
|---|---|---|---|---|---|---|---|
| |||||||
| Buist et al., 200220 | Australia | Tertiary‐care academic hospital | Adult inpatients | ICU registrar | DNR status | Not supplied | Any code blue team activation |
| Medical registrar | Cardiac arrest | ||||||
| ICU nurse | Unscheduled ICU admission | ||||||
| Mortality | |||||||
| Bellomo et al., 200321 | Australia | Tertiary‐care academic hospital | Adult inpatients | ICU nurse and ICU fellow attended all calls; ICU attending (8 AM‐8 PM) and medical registrar attended if requested | Mortality | NA | Unresponsive, with no pulse or blood pressure, and basic life support initiated |
| Cardiac arrest | |||||||
| DNR status | |||||||
| Pittard et al., 200322 | United Kingdom | Tertiary‐care academic hospital | Adult inpatients on surgical wards | Senior critical care nurses and medical staff | Unscheduled ICU admission | Any patient not admitted directly from operating theater after elective surgery | NA |
| Bellomo et al., 200431 | Australia | Tertiary‐care academic hospital | Adult postoperative patients | ICU attending | Mortality Unscheduled ICU admission ICU length of stay DNR status | Postoperative admission to ICU because of a clinical complication | NA |
| ICU fellow | Unscheduled ICU admission | ||||||
| ICU registered nurse | ICU length of stay | ||||||
| Medical fellow | DNR status | ||||||
| DeVita et al., 200432 | United States | Tertiary‐care academic hospital | Adult inpatients | ICU physician | Cardiac arrest | NA | Any code blue team activation |
| Anesthesiologist | |||||||
| 2 other physicians | |||||||
| 2 ICU nurses | |||||||
| Floor nurse | |||||||
| Respiratory therapist | |||||||
| Garcea et al., 20043 | United Kingdom | Teaching hospital | Adult patients discharged from ICU | 2 ICU nurses | Mortality | Emergency readmissions to ICU | NA |
| 1 ICU nurse specialist | Unscheduled ICU admission | ||||||
| ICU consultant physician (if needed) | |||||||
| Kenward et al., 200438 | United Kingdom | Teaching hospital | Adult inpatients | Not stated | Mortality | NA | Loss of spontaneous circulation |
| Cardiac arrest | |||||||
| Priestley et al., 200433 | United Kingdom | Teaching hospital | Adult inpatients | ICU nurse consultant | Mortality | NA | NA |
| ICU physician available if needed | Overall length of stay | ||||||
| Hillman et al., 200534 | Australia | 23 hospitals (17 academic, 6 nonacademic) | Adult inpatients | Varied between study hospitals; required to have at least 1 MD and 1 RN from ED or ICU | Mortality | Any unscheduled admission to ICU from general ward | No palpable pulse |
| Cardiac arrest | |||||||
| Unscheduled ICU admission | |||||||
| DNR status | |||||||
| Hunt et al., 2005 (abstract)36 | United States | Pediatric tertiary‐care academic hospital | Pediatric inpatients | Not provided | Cardiac arrest | NA | Not provided |
| Meredith et al., 2005 (abstract)37 | United States | Tertiary‐care academic hospital | Adult inpatients, outpatients, and visitors | ICU registered nurse | Mortality | NA | Not provided |
| Respiratory therapist | |||||||
| Tibballs et al., 200535 | Australia | Pediatric tertiary‐care academic hospital | Pediatric inpatients | ICU physician | Cardiac arrest | Not supplied | Not provided |
| Medical registrar | Unscheduled ICU admission | ||||||
| ED physician | |||||||
| ICU nurse | |||||||
| King et al., 200629 | United States | Tertiary‐care academic hospital | Adult inpatients, outpatients, and visitors | Hospitalist | Cardiac arrest | NA | Not provided |
| Internal medicine resident | |||||||
| ICU nurse | |||||||
| Ward nurse | |||||||
| Pharmacist | |||||||
RRS Structure, Calling Criteria, and Responsibilities
Seven studies22, 23, 31, 33, 34, 36, 37 that described the team composition used variants of the medical emergency team model, a physician‐led team (Table 2). In 6 of these 7 studies, the team included a critical care physician (attending or fellow) and an ICU nurse; in the sole RCT (the MERIT study36), the team structure varied between hospitals, consisting of a nurse and physician from either the emergency department or ICU. Hospitalists, who are involved in RRS responses at many U.S. hospitals, were primary team leaders of the RRS in only 1 study.31 In 2 studies34, 37 the RRS also responded to code blue calls, and in 4 studies23, 31, 33, 39 the RRS and the code blue team had separate personnel; the remaining studies did not define the distinction between RRS and code blue team.
| Study | Contemporaneous control group | Data reported at more than 1 time before/after intervention | RRS calling rate reported | Outcomes analysis included patients made DNR by team | Blind measurement of nonobjective outcomes | Intensivist always available | Other QI efforts during study |
|---|---|---|---|---|---|---|---|
| |||||||
| Buist et al., 200220 | No | No | Yes | No (mortality) | No | NR | NR |
| Bellomo et al., 200321 | No | No | Yes | Yes (mortality) | NA | Yes (ICU fellow) | No |
| Pittard et al., 200322 | No | No | Yes | NA | No | NR | NR |
| Bellomo et al., 200431 | No | No | Yes | Yes (mortality) | No | Yes (ICU fellow) | No |
| DeVita et al., 200432 | No | Yes | Yes | NA | No | Yes (critical care attending physician) | NR |
| Garcea et al., 200433 | No | No | No | Unclear | No | NR | NR |
| Kenward et al., 200438 | No | No | Yes | Unclear | No | NR | NR |
| Priestley et al., 200433 | No (interrupted time series) | Yes | No | NA | No | NR | NR |
| Hillman et al., 200534 | Yes | No | Yes | Unclear | Yes | NR | No |
| Hunt et al., 2005 (abstract)36 | No | No | Yes | NA | NR | NR | NR |
| Meredith et al., 2005 (abstract)37 | No | No | Yes | No | NA | No | No |
| Tibballs et al., 200535 | No | No | Yes | Unclear | No | NR | Yes (educational workshops/more training in APLS) |
| King et al., 200629 | No | Yes | Yes | NA | No | Yes | No |
In 4 studies the RRSs were led by nurses. One study published in abstract form39 used the rapid response team model, consisting of a critical care nurse and a respiratory therapist, with assistance as needed from the primary medical staff and a critical care physician. Three studies3, 24, 35 from UK hospitals used the critical care outreach (CCO) model, in which ICU‐trained nurses respond initially with assistance from intensivists. The CCO model also involves follow‐up on patients discharged from the ICU and proactive rounding on unstable ward patients.
The hospitals used broadly similar approaches to determining when to summon the RRS, relying on combinations of objective clinical criteria (eg, vital sign abnormalities) and subjective criteria (eg, acute mental status change, staff member concerned about patient's condition). Three studies3, 24, 35 used a formal clinical score (the Patient‐At‐Risk score or the Modified Early Warning score) to trigger calls to the RRS. Three studies, 2 of them from the same institution,23, 33 reported the frequency of specific triggers for RRS activation. Concern by bedside staff and respiratory distress were the most frequent activators of the RRS.
Study Internal Validity and Generalizability
One study,36 the MERIT trial, conducted in Australia, was a cluster‐randomized RCT (randomized by hospital) that adhered to recommended elements of design and reporting for studies of this type.41 In this study, hospitals in the control group received an educational intervention on caring for deteriorating patients only; hospitals in the intervention group received the educational module and started an RRS. An additional study35 identified itself as a randomized trial, but randomization occurred at the hospital ward level, with introduction of the intervention (critical care outreach) staggered so that at different points an individual ward could have been in either the control or intervention group; therefore, this study was considered an interrupted time series. All other trials included were before‐after studies with no contemporaneous control group
Most studies did not meet criteria for internal validity or generalizability (Table 2). Two studies3, 35 did not report the number of RRS calls during the study period. One study22 omitted patients whose resuscitation status was changed after RRS evaluation from the calculation of inpatient mortality; thus, the patients who had been made do not resuscitate by the RRS did not contribute to the calculated mortality rate. The disposition of these patients was unclear in another study.36 All studies measured clinical outcomes retrospectively, and no studies reported blinding of outcomes assessors for nonobjective outcomes (eg, unplanned ICU admission). Studies generally did not report on the availability of intensivists or if other quality improvement interventions targeting critically ill patients were implemented along with the RRS.
RRS Usage and Effects on Patient Outcomes
Seven studies2224, 34, 3638 reported enough information to calculate the RRS calling rate (4 studies24, 31, 39, 40 reported the total number of calls but not the number of admissions, and 2 studies3, 35 did not report either). In these 7 studies, the calling rate varied from 4.5 to 25.8 calls per 1000 admissions. Three studies documented the calling rate before and after the intervention: a study at a hospital with a preexisting RRS34 reported that the calling rate increased from 13.7 to 25.8 calls per 1000 admissions after an intensive education and publicity program; in a pediatric trial,38 the overall emergency calling rate (for cardiac arrests and medical emergencies) was reported to increase from 6.6 to 10.4 per 1000 admissions; and in the MERIT trial,36 calls increased from 3.1 to 8.7 per 1000 admissions.
Effects of RRS on Clinical Outcomes
Nine studies3, 22, 23, 33, 3537, 39, 40 reported the effect of an RRS on inpatient mortality, 9 studies22, 23, 31, 33, 34, 3638, 40 reported its effect on cardiopulmonary arrests, and 6 studies3, 22, 24, 33, 36, 37 reported its effect on unscheduled ICU admissions. Of these, 7 trials that reported mortality and cardiopulmonary arrests and 6 studies that reported unscheduled ICU admissions supplied sufficient data for meta‐analysis.
Observational studies demonstrated improvement in inpatient mortality, with a summary risk ratio of 0.82 (95% CI: 0.74‐0.91, heterogeneity I2 62.1%; Fig. 2). However, the magnitude of these improvements was very similar to that seen in the control group of the MERIT trial (RR 0.73, 95% CI: 0.53‐1.02). The intervention group of the MERIT trial also demonstrated a reduction in mortality that was not significantly different from that of the control group (RR 0.65, 95% CI: 0.48‐0.87). We found a similar pattern in studies reporting RRS effects on cardiopulmonary arrests (Fig. 3). The observational studies did not show any effect on the risk of unscheduled ICU admissions (summary RR 1.08, 95% CI: 0.96‐1.22, heterogeneity I2 79.1%) nor did the MERIT trial (Fig. 4).
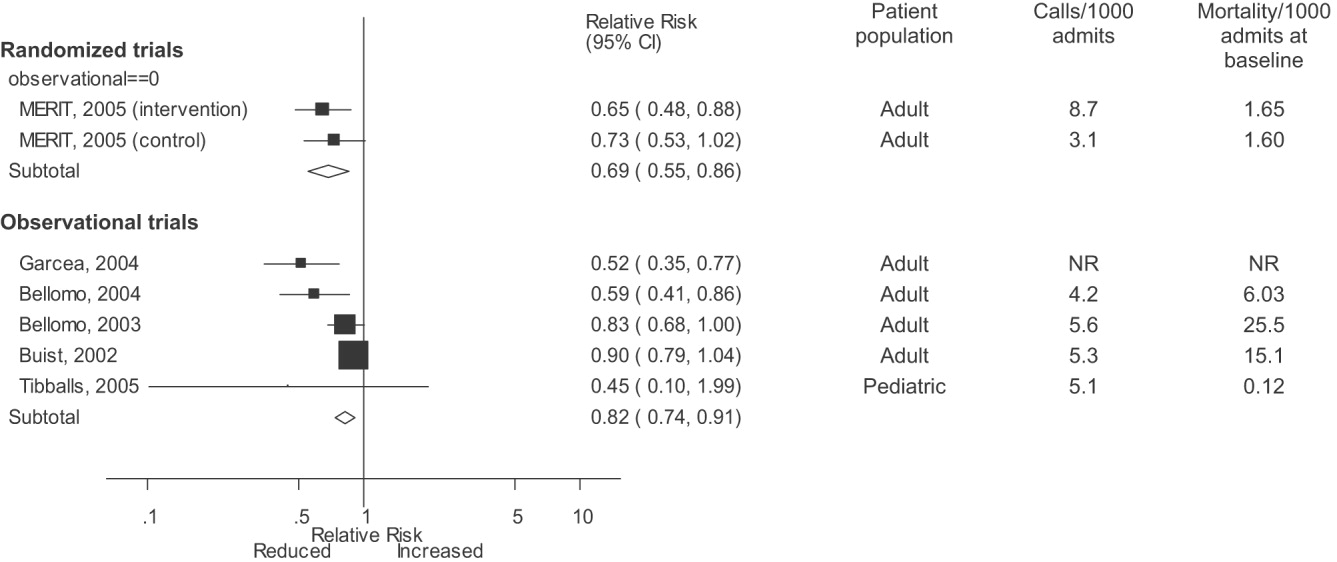
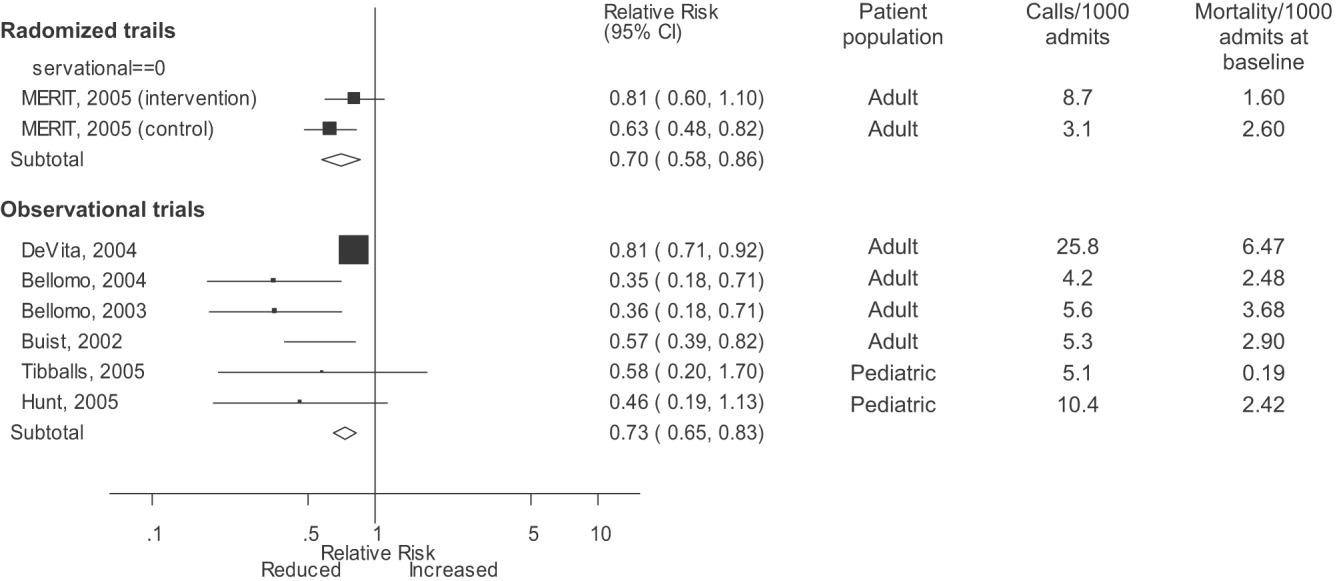
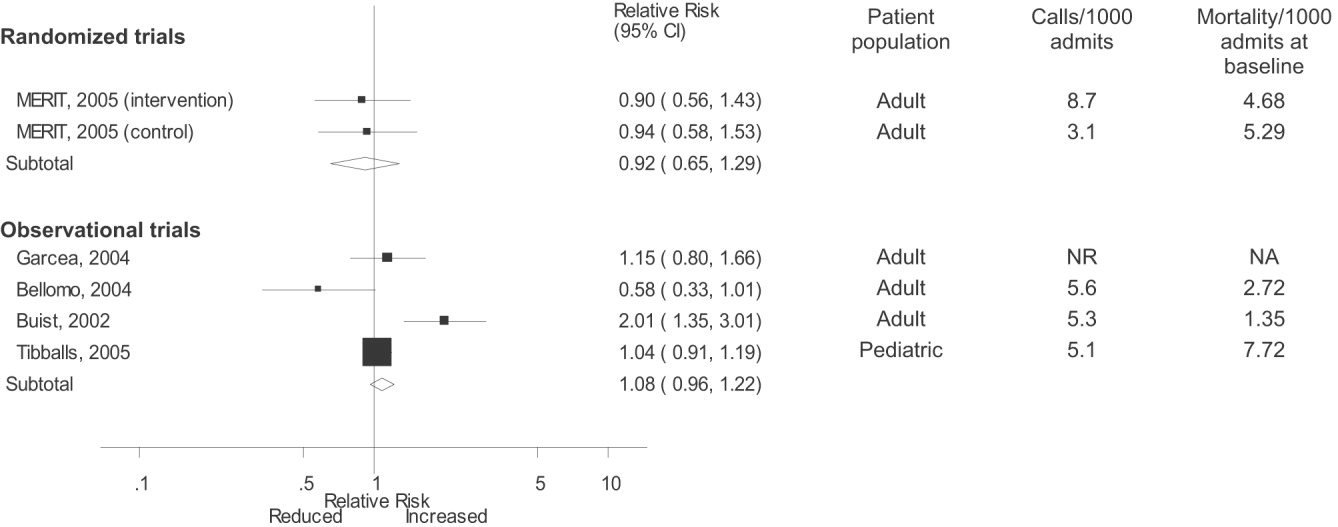
DISCUSSION
Despite the strong face validity of the RRS concept, the current literature on medical emergency teams, rapid response teams, and critical care outreach suffers from substantial flaws that make it difficult to determine the effect of an RRS on patient outcomes. These flaws include the use of suboptimal study designs, failure to report important cointerventions, the methods in which outcomes were defined, and lack of verification of the validity of the outcomes measured. As a result, very little empiric data are available to define the effectiveness of RRSs or to provide guidance for hospitals planning to implement an RRS.
Though early studies reported that RRSs appeared to reduce mortality and cardiac arrest rates, the sole randomized trial of an RRS (the MERIT trial36) showed no differences between intervention and control hospitals for any clinical outcome. Both inpatient mortality and cardiac arrest rates declined in the intervention and control groups of the MERIT trial, and the reductions in these outcomes in observational trials were similar to those seen in the MERIT control group. This strongly implies that other factors besides the RRS were responsible for the results of previous before‐after studies. These studies, which have been widely cited by proponents of the RRS, suffer from methodological limitations intrinsic to the study design and issues with outcome measurement that may have introduced systematic bias; these factors likely explain the contrast between the generally positive results of the before‐after studies and the negative results of the MERIT trial.
Most early RRS trials used an uncontrolled before‐after study design, as is common in quality improvement studies.42 This study design cannot account for secular trends or other factors, including other QI interventions, that could influence the effect of an intervention.26 The statistically significant reduction in impatient mortality in the control arm of the MERIT trial is an instructive example; this decline could have been a result of the educational intervention on caring for deteriorating patients, other ongoing QI projects at the individual hospitals, or simply random variation during the relatively short (6‐month) follow‐up period. Such factors could also entirely account for the impressive results seen in the initial uncontrolled RRS studies. Nearly all the studies we reviewed also did not discuss any aspects of the hospital context that could influence outcomes for critically ill patients, such as the nurse‐staffing ratio,43 ICU bed availability,4446 overall hospital census,47 or availability of intensivists48 or hospitalists.49 Failure to control foror at least report important aspects ofthe environment in which the intervention was performed is akin to failing to report baseline patient comorbidities or concurrent therapies in a study of a drug's effectiveness.
Our review also suggests how bias in the measurement of clinical outcomes may have contributed to the apparent effect of RRSs. In 1 before‐after study, patients for whom RRS activation resulted in a change code status to do not resuscitate (DNR) were excluded from calculations of mortality,22, 50 resulting in underreporting of mortality after RRS implementation. Disposition of such patients was unclear in 3 other studies.3, 36, 40 Some studies22, 34 defined cardiopulmonary arrest as any activation of the code blue team, regardless of whether the patient was actually in cardiac arrest. This almost inevitably would result in fewer arrests after implementation of the RRS, as the indications for calling the code blue team would be narrower. Finally, nearly all studies used trends in nonobjective primary outcomes (eg, unplanned ICU transfer) to support RRS effects but did not validate any of these outcomes (eg, how often did reviewers agree an ICU transfer was preventable), and none of the assessors of these outcomes were blinded.
Some have attributed the MERIT trial not finding the RRS beneficial to inadequate implementation, as the RRS calling rate of 8.7 calls per 1000 admissions was less than the 15 calls per 1000 admissions cited as optimal in a mature RRS.51 However, published studies generally reported a calling rate of 4‐5 calls per 1000 admissions,22, 23, 37 with only 1 trial reporting a higher calling rate.34
A recent commentary20 and a systematic review of critical care outreach teams21 both addressed the effectiveness of RRSs. We sought to examine the effects of all RRS subtypes and using quantitative analysis and analysis of methodological quality, to determine the overall effect of RRSs. The results of our analysis (which included data from several newer studies31, 38, 39) support and extend the conclusion of prior reviews that RRSs, although a potentially promising intervention, do not unequivocally benefit patients and are not worthy of more widespread use until more evidence becomes available. Our analysis also demonstrates that many studies widely cited as supporting wide implementation of RRSs are flawed and probably not generalizable.
Despite these caveats, RRSs remain an intuitively attractive concept and may be of benefit at some hospitals. Further studies in this area should focus on identifying which patient populations are at high risk for clinical decompensation, identifying the role of clinical structures of care (eg, nurse‐staffing ratio, presence of hospitalists) in preventing adverse outcomes and determining which specific RRS model is most effective. As well, more information is needed about educating bedside staff and RRS team members, as this is likely critical to success of the team. Unfortunately, only the article by King et al.31 provided sufficient detail about the implementation process to assist hospitals in planning an RRS. The remaining articles had only scant details about the intervention and its implementation, a common problem noted in the quality improvement literature.42, 52, 53
Our analysis had several limitations. We attempted to identify as many RRS trials as possible by searching multiple databases and reviewing abstract proceedings, but as the RRS literature is in its infancy, we may not have located other unpublished studies or gray literature. There is no validated system for evaluating the methodological strength of nonrandomized studies; therefore, we assessed study quality on the basis of prespecified criteria for internal and external validity. Finally, we found significant statistical heterogeneity in our quantitative analyses, indicating that the variability between individual studies in treatment effects was greater than that expected by chance. As the primary reasons we conducted a meta‐analysis was to compare the results of before‐after trials with those of the randomized MERIT trial, we did not further explore the reasons for this heterogeneity, although variation in patient populations and RRS structure likely accounts for a significant proportion of the heterogeneity.
Although there is a theoretical basis for implementing a rapid response system, the published literature shows inconsistent benefits to patients and suffers from serious methodological flaws. Future studies of RRSs should attempt to define which patient populations are at risk, the essential characteristics of RRSs, effective implementation strategies, andmost importantwhether any RRS improves clinical outcomes. Until such evidence is available, hospitals should not be mandated to establish an RRS and should consider prioritizing quality improvement resources for interventions with a stronger evidence base.
Acknowledgements
The authors thank Emmanuel King, MD, for graciously providing a copy of his manuscript prior to publication and Alexis Meredith, MD, for providing additional information regarding his study. Dr. Shojania holds a Government of Canada Research Chair in Patient Safety and Quality Improvement.
APPENDIX
| Search terms | Citations | |
|---|---|---|
| 1 | {(rapid [ti] AND (response [ti] OR resuscitation [ti]) OR (patient at risk [ti])} AND (program [ti] OR team* [ti] OR service* [ti]) | 23 |
| 2 | medical emergency team* [ti] OR medical crisis team* [ti] OR {(critical [ti] OR intensive [ti]) AND care [ti] AND outreach [ti]} | 87 |
| 3 | hospital [ti] AND resuscitation [ti] AND team* [ti] | 11 |
| 4 | medical emergency team* [ab] OR rapid response team [ab] OR medical crisis team* [ab] | 89 |
| 5 | #1 OR #2 OR #3 OR #4 | 158 |
| 6 | Resuscitation [mh] OR heart arrest [mh] OR hospital mortality [mh] | 72,488 |
| 7 | (patient care team [mh] OR critical care [mh] OR intensive care units [mh]) AND (patient readmission [mh] OR organization and administration [mh]) | 20,321 |
| 8 | #6 AND #7 | 1,419 |
| 9 | {(randomised[ti] OR randomized[ti] OR controlled[ti] OR intervention[ti] OR evaluation[ti] OR comparative[ti] OR effectiveness[ti] OR evaluation[ti] OR feasibility[ti]) AND (trial[ti] OR studies[ti] OR study[ti] OR program[ti] OR design[ti])} OR clinical trial[pt] OR randomized controlled trial[pt] OR epidemiologic studies[mh] OR evaluation studies[mh] OR comparative study[mh] OR feasibility studies[mh] OR intervention studies[mh] OR program evaluation[mh] OR epidemiologic research design[mh] OR systematic5 | 2,688,847 |
| 10 | #8 AND #9 | 748 |
| 11 | #5 OR #10 | 806 |
- ,,,.The medical emergency team.Anaesth Intensive Care.1995;23(2):183–186.
- ,,,.The 100 000 Lives Campaign: setting a goal and a deadline for improving health care quality.JAMA.2006;295(3):324–7.
- ,,,,.Impact of a critical care outreach team on critical care readmissions and mortality.Acta Anaesthesiol Scand2004;48:1096–1100.
- ,.The patient‐at‐risk team.Anaesthesia.2000;55(2):198.
- ,,, et al.Findings of the First Consensus Conference on Medical Emergency Teams.Crit Care Med.2006;34:2463–2478.
- .Recognition of patients who require emergency assistance: a descriptive study.Heart Lung.2000;29(4):262–268.
- ,,, et al.Antecedents to hospital deaths.Intern Med J.2001;31:343–348.
- ,,, et al.Duration of life‐threatening antecedents prior to intensive care admission.Intensive Care Med.2002;28:1629–1634.
- ,,,,.The identification of risk factors for cardiac arrest and formulation of activation criteria to alert a medical emergency team.Resuscitation.2002;54:125–131.
- ,,,,,.A comparison of antecedents to cardiac arrests, deaths and emergency intensive care admissions in Australia and New Zealand, and the United Kingdom—the ACADEMIA study.Resuscitation.2004;62:275–282.
- ,,,.Validation of a modified Early Warning Score in medical admissions.QJM.2001;94:521–526.
- ,,,,.Inpatient transfers to the intensive care unit: delays are associated with increased mortality and morbidity.J Gen Intern Med.2003;18(2):77–83.
- ,,,,.Clinical antecedents to in‐hospital cardiopulmonary arrest.Chest.1990;98:1388–1392.
- ,.Developing strategies to prevent inhospital cardiac arrest: analyzing responses of physicians and nurses in the hours before the event.Crit Care Med.1994;22(2):244–247.
- ,,.Introduction to the rapid response systems series.Jt Comm J Qual Patient Saf.2006;32:359–360.
- ,,, et al.Rates of in‐hospital arrests, deaths and intensive care admissions: the effect of a medical emergency team.Med J Aust.2000;173:236–240.
- ,,,,.The patient‐at‐risk team: identifying and managing seriously ill ward patients.Anaesthesia.1999;54:853–860.
- .The medical emergency team: no evidence to justify not implementing change.Med J Aust.2000;173:228–229.
- ,.The medical emergency team, evidence‐based medicine and ethics.Med J Aust.2003;179:313–315.
- ,,.Rapid response teams—walk, don't run.JAMA.2006;296:1645–1647.
- ,,, et al.Investigating the effectiveness of critical care outreach services: a systematic review.Intensive Care Med.2006;32:1713–1721.
- ,,,,,.Effects of a medical emergency team on reduction of incidence of and mortality from unexpected cardiac arrests in hospital: preliminary study.BMJ.2002;324:387–390.
- ,,, et al.A prospective before‐and‐after trial of a medical emergency team.Med J Aust.2003;179:283–287.
- .Out of our reach? Assessing the impact of introducing a critical care outreach service.Anaesthesia.2003;58:882–885.
- Cochrane Collaboration Effective Practice and Organisation of Care group. Available at: http://www.epoc.uottawa.ca/inttime.pdf.Accessed August 4,2006.
- ,,.Experimental and Quasi‐Experimental Designs for Generalized Causal Inference.Boston, MA:Houghton Mifflin;2002.
- ,,, et al.Guidelines for the uniform reporting of data for Medical Emergency Teams.Resuscitation.2006;68(1):11–25.
- ,.The intracluster correlation coefficient in cluster randomisation.BMJ.1998;316:1455.
- ,.Issues in the meta‐analysis of cluster randomized trials.Stat Med.2002;21:2971–2980.
- ,,,.Measuring inconsistency in meta‐analyses.BMJ.2003;327:557–560.
- ,,.Establishing a rapid response team (RRT) in an academic hospital: one year's experience.J Hosp Med.2006;1:296–305.
- ,,, et al.A multidisciplinary community hospital program for early and rapid resuscitation of shock in nontrauma patients.Chest.2005;127:1729–1743.
- ,,, et al.Prospective controlled trial of effect of medical emergency team on postoperative morbidity and mortality rates.Crit Care Med.2004;32:916–921.
- ,,,,,.Use of medical emergency team responses to reduce hospital cardiopulmonary arrests.Qual Saf Health Care.2004;13:251–254.
- ,,, et al.Introducing critical care outreach: a ward‐randomised trial of phased introduction in a general hospital.Intensive Care Med.2004;30:1398–1404.
- ,,, et al.Introduction of the medical emergency team (MET) system: a cluster‐randomised controlled trial.Lancet.2005;365:2091–2097.
- ,,,,.Reduction of paediatric in‐patient cardiac arrest and death with a medical emergency team: preliminary results.Arch Dis Child.2005;90:1148–1152.
- ,,, et al.The effect of transition from a traditional code team to a rapid response team in a children's center: a before and after intervention trial [abstract].Crit Care Med.2005;33(12 suppl):A17.
- ,,,,.Improved hospital mortality by institution of a rapid response team in a university hospital.Chest.2005;128(suppl S):182S.
- ,,,.Evaluation of a medical emergency team one year after implementation.Resuscitation.2004;61(3):257–263.
- ,,.CONSORT statement: extension to cluster randomised trials.BMJ.2004;328:702–708.
- ,.Evidence‐Based Quality Improvement: The State Of The Science.Health Aff.2005;24(1):138–150.
- ,,,,.Hospital nurse staffing and patient mortality, nurse burnout, and job dissatisfaction.JAMA.2002;288:1987–1993.
- ,,, et al.Evaluation of triage decisions for intensive care admission.Crit Care Med.1999;27:1073–1079.
- ,,,,.Rationing of intensive care unit services. An everyday occurrence.JAMA.1986;255:1143–1146.
- ,,,.How do physicians adapt when the coronary care unit is full? A prospective multicenter study.JAMA.1987;257:1181–1185.
- ,,,,.The association between hospital overcrowding and mortality among patients admitted via Western Australian emergency departments.Med J Aust.2006;184:208–212.
- ,,,,,.Physician staffing patterns and clinical outcomes in critically ill patients: a systematic review.JAMA.2002;288:2151–2'62.
- ,,,,,.Implementation of a voluntary hospitalist service at a community teaching hospital: improved clinical efficiency and patient outcomes.Ann Intern Med.2002;137:859–865.
- .Critical care outreach team's effect on patient outcome: other conclusions are possible.BMJ.2004;328:347; author reply
- The “MERIT” Trial of medical emergency teams in Australia: an analysis of findings and implications for the 100,000 Lives Campaign. Institute for Healthcare Improvement,2006. Available at: http://www.ihi.org/NR/rdonlyres/F3401FEF‐2179‐4403‐8F67–B9255C57E207/0/LancetAnalysis81505.pdf. Accessed August 17, 2006.
- ,,, et al.Toward evidence‐based quality improvement. evidence (and its limitations) of the effectiveness of guideline dissemination and implementation strategies 1966‐1998.J Gen Intern Med.2006;21(suppl 2):S14–S20.
- ,,, et al.lessons learned about implementing research evidence into clinical practice. Experiences from VA QUERI.J Gen Intern Med.2006;21(suppl 2):S21–S24.
- ,,,,,.Improving the quality of reports of meta‐analyses of randomised controlled trials: the QUOROM statement. Quality of reporting of meta‐analyses.Lancet.1999;354:1896–1900.
- ,,,,,.Improving the utilization of medical crisis teams (Condition C) at an urban tertiary care hospital.J Crit Care.2003;18(2):87–94.
- ,,, et al.Long term effect of a medical emergency team on cardiac arrests in a teaching hospital.Crit Care.2005;9:R808–R815.
A medical emergency team1 is a group of clinicians trained to quickly assess and treat hospitalized patients showing acute signs of clinical deterioration. Equivalent terms used are rapid response team,2 critical care outreach team,3 and patient‐at‐risk team.4 A consensus panel5 recently endorsed use of the term rapid response system (RRS) to denote any system that uses a standard set of clinical criteria to summon caregivers to the bedside of a patient who is deemed unstable but not in cardiopulmonary arrest (in which case a standard resuscitation team would be summoned). Such teams primarily evaluate patients on general hospital wards.
RRSs have been developed in response to data indicating that patients frequently demonstrate premonitory signs or receive inadequate care prior to unanticipated intensive care unit (ICU) admission, cardiopulmonary arrest, or death outside the ICU.614 Earlier identification and treatment of such patients could prevent adverse clinical outcomes. The structure of RRSs varies but generally includes a physician and nurse and may also include other staff such as respiratory therapists.5 Teams are summoned by hospital staff to assess patients meeting specific clinical criteria (see box) about whom the bedside staff has significant concern.150
| Any staff member may call the team if 1 of the following criteria is met: |
| Heart rate > 140/min or < 40/min |
| Respiratory rate > 28/min or < 8/min |
| Systolic blood pressure > 180 mmHg or < 90 mm Hg |
| Oxygen saturation < 90% despite supplementation |
| Acute change in mental status |
| Urine output < 50 cc over 4 hours |
| Staff member has significant concern about patient's condition |
| Additional criteria used at some institutions: |
| Chest pain unrelieved by nitroglycerin |
| Threatened airway |
| Seizure |
| Uncontrolled pain |
Initial studies of RRSs, performed primarily in Australia and the United Kingdom, showed promising reductions in unanticipated ICU admissions, cardiac arrests, and even overall inpatient mortality.1, 16, 17 The considerable enthusiasm generated by these studies18, 19 resulted in the Institute for Healthcare Improvement (IHI) incorporating RRSs into its 100,000 Lives campaign,2 and RRSs are now being implemented in the more than 3000 U.S. hospitals that joined the campaign. However, a recent commentary on rapid response teams20 and a systematic review of critical care outreach teams21 have raised concerns that this widespread implementation may not be justified by the available evidence. We performed a systematic review of studies of all variations of RRSs in order to determine their effect on patient outcomes and to characterize variations in their organization and implementation.
METHODS
Literature Search and Inclusion and Exclusion Criteria
We systematically searched MEDLINE, CINAHL, and BIOSIS through August 2006 for relevant studies using the various terms for RRSs (eg, medical emergency team, rapid response team, critical care outreach) and medical subject headings relevant to inpatient care and critical illness (eg, patient care team and resuscitation; the full search strategy is given in the Appendix). We also reviewed the abstract lists from the 2004 and 2005 American Thoracic Society and Society of Critical Care Medicine annual meetings and scanned reference lists from key articles.
We screened the abstracts of the articles identified by the search, and 2 independent reviewers abstracted potentially relevant articles using a standardized data abstraction form. Disagreements between the reviewers were resolved by consensus and, if necessary, discussion with a third reviewer. We included randomized controlled trials (RCTs), controlled before‐after studies, and interrupted time series, including simple before‐after studies with no contemporaneous control group, though we planned to separately analyze data from controlled studies if possible. We included only English‐language articles.
On the basis of RRS features in widely cited articles2224 and the recommendations of a recent consensus statement,5 we defined an RRS as having the following characteristics: (1) its primary responsibility is to intervene whenever hospitalized patients become unstable before cardiopulmonary arrest occurs; (2) it must primarily provide care outside the ICU and emergency department; (3) specific clinical criteria must be in place that define instability and trigger a call to the team; and (4) it must be expected to respond within a specified time. We defined these criteria in order to distinguish studies of RRSs from studies of cardiac arrest (code blue) teams or traditional consulting services.
To be included in the analysis, articles had to report the effects of a rapid response system on at least 1 of these outcomes: inpatient mortality, inpatient cardiac arrest, or unscheduled ICU transfer. We used the definitions of cardiac arrest and unscheduled ICU transfer given in the primary studies. In addition to these outcomes, we abstracted information on the number of admissions and the number of RRS calls during the study period. To maximize the comparability of study outcomes, we calculated the rates of mortality, cardiac arrest, unscheduled ICU transfer, and RRS calls per 1000 admissions for studies that did not supply data in this fashion.
Assessment of Study Quality
Quality scoring instruments for studies included in systematic reviews generally focus on randomized controlled trials, which we anticipated would account for a minority of included studies. On the basis of recommendations for the assessment of methodology for nonrandomized study designs,25, 26 we identified and abstracted 4 important determinants of internal validity (Table 1). The consensus statement5 recommends monitoring the effectiveness of RRSs by measuring the rate of unscheduled ICU admissions (defined as an unplanned admission to the ICU from a general ward27) and cardiac arrests of patients who were not listed as do not resuscitate (DNR). As the definition of unscheduled ICU admission allows room for subjectivity, we considered the blinding of assessment of this outcome to study group assignment to be important, especially for retrospective studies. Measurement of cardiac arrests should be less susceptible to blinding issues, but one of the functions of an RRS can be to initiate discussions that result in changes in the goals of care and code status.22 Thus, excluding patients made DNR by the team from cardiac arrest calculations could falsely lower the cardiac arrest rate.
| Quality measures |
|---|
|
| A. Internal validity |
| 1. Did the study have a contemporaneous control group? |
| 2. If there was no contemporaneous control group, did the study report data for more than 1 time point before and after the intervention? |
| 3. Were nonobjective primary outcomes (eg, unplanned ICU transfer) measured in a blinded fashion? |
| 4. Were patients made DNR by the RRS included in calculations of the cardiac arrest and mortality rates? |
| B. Generalizability |
| 5. Was the intervention performed independent of other quality improvement interventions targeting the care of critically ill patients? |
| 6. Did the study report the number of admissions and RRS calls during the study period? |
| 7. Did the study report the availability of intensivists before and after the intervention? |
We also abstracted 3 separate elements of study quality pertaining to the external validity or generalizability of included studies (Table 1). These elements were defined a priori by consensus reached by discussion among the reviewers. These elements were intended to provide a framework for interpreting the included studies and to guide subgroup analyses. They were not used to form a composite quality score.
Statistical Analysis
We performed a random‐effects meta‐analysis to calculate summary risk ratios with 95% confidence intervals for the effects of RRSs on inpatient mortality, cardiopulmonary arrest, and unscheduled ICU admission. Included in the meta‐analysis were the studies that reported total number of admissions and incidence of each outcome before and after institution of the RRS. For randomized trials that reported pre‐ and postintervention data, we treated the intervention and control groups as separate trials in order to be able to compare their effects with the before‐after trials. For studies that reported results adjusted for clustering (ie, by hospital), we back‐calculated the unadjusted results by multiplying the standard error by the square of the design factor coefficient.28, 29 We calculated the I2 statistic to assess heterogeneity.30 All analyses were performed using Stata version 8.2 (Stata Corporation, College Station, TX).
RESULTS
The database searches identified 861 citations, and 1 additional prepublication study was supplied by the study's first author31; 89 articles underwent full‐text review (Fig. 1). Most studies excluded during the full‐text review did not meet our criteria for a study of an RRS or were observational studies or review articles. For instance, Sebat et al.32 published a study of a shock team at a community hospital that intervened when any patient suffered nontraumatic shock; the study did not meet our inclusion criteria as all patients were admitted to the ICU, most directly from the emergency department. Another frequently cited study, by Bristow et al.,16 was excluded as it was a case‐control study. Thirteen studies,3, 2224, 31, 334011 full‐length studies and 2 abstractsmet all criteria for inclusion.
Characteristics of Included Trials
The characteristics of included studies are outlined in Table 2. Five studies were performed in Australia, 4 in the United States, and 4 in the United Kingdom. All were conducted in academic teaching hospitals. Two studies37, 38 focused on pediatric inpatients, and the remainder involved hospitalized adults. The RRS intervened for all hospitalized patients in all but 2 studies (1 of which focused on surgical inpatients33 and the other in which the RRS evaluated only patients discharged from the ICU3). In 2 studies,31, 39 the RRS was available to evaluate outpatients, such as hospital visitors, in addition to inpatients.0
| Study | Location | Hospital type | Patient population | RRS composition | Measured outcomes | Definition of unscheduled ICU admission | Definition of cardiac arrest |
|---|---|---|---|---|---|---|---|
| |||||||
| Buist et al., 200220 | Australia | Tertiary‐care academic hospital | Adult inpatients | ICU registrar | DNR status | Not supplied | Any code blue team activation |
| Medical registrar | Cardiac arrest | ||||||
| ICU nurse | Unscheduled ICU admission | ||||||
| Mortality | |||||||
| Bellomo et al., 200321 | Australia | Tertiary‐care academic hospital | Adult inpatients | ICU nurse and ICU fellow attended all calls; ICU attending (8 AM‐8 PM) and medical registrar attended if requested | Mortality | NA | Unresponsive, with no pulse or blood pressure, and basic life support initiated |
| Cardiac arrest | |||||||
| DNR status | |||||||
| Pittard et al., 200322 | United Kingdom | Tertiary‐care academic hospital | Adult inpatients on surgical wards | Senior critical care nurses and medical staff | Unscheduled ICU admission | Any patient not admitted directly from operating theater after elective surgery | NA |
| Bellomo et al., 200431 | Australia | Tertiary‐care academic hospital | Adult postoperative patients | ICU attending | Mortality Unscheduled ICU admission ICU length of stay DNR status | Postoperative admission to ICU because of a clinical complication | NA |
| ICU fellow | Unscheduled ICU admission | ||||||
| ICU registered nurse | ICU length of stay | ||||||
| Medical fellow | DNR status | ||||||
| DeVita et al., 200432 | United States | Tertiary‐care academic hospital | Adult inpatients | ICU physician | Cardiac arrest | NA | Any code blue team activation |
| Anesthesiologist | |||||||
| 2 other physicians | |||||||
| 2 ICU nurses | |||||||
| Floor nurse | |||||||
| Respiratory therapist | |||||||
| Garcea et al., 20043 | United Kingdom | Teaching hospital | Adult patients discharged from ICU | 2 ICU nurses | Mortality | Emergency readmissions to ICU | NA |
| 1 ICU nurse specialist | Unscheduled ICU admission | ||||||
| ICU consultant physician (if needed) | |||||||
| Kenward et al., 200438 | United Kingdom | Teaching hospital | Adult inpatients | Not stated | Mortality | NA | Loss of spontaneous circulation |
| Cardiac arrest | |||||||
| Priestley et al., 200433 | United Kingdom | Teaching hospital | Adult inpatients | ICU nurse consultant | Mortality | NA | NA |
| ICU physician available if needed | Overall length of stay | ||||||
| Hillman et al., 200534 | Australia | 23 hospitals (17 academic, 6 nonacademic) | Adult inpatients | Varied between study hospitals; required to have at least 1 MD and 1 RN from ED or ICU | Mortality | Any unscheduled admission to ICU from general ward | No palpable pulse |
| Cardiac arrest | |||||||
| Unscheduled ICU admission | |||||||
| DNR status | |||||||
| Hunt et al., 2005 (abstract)36 | United States | Pediatric tertiary‐care academic hospital | Pediatric inpatients | Not provided | Cardiac arrest | NA | Not provided |
| Meredith et al., 2005 (abstract)37 | United States | Tertiary‐care academic hospital | Adult inpatients, outpatients, and visitors | ICU registered nurse | Mortality | NA | Not provided |
| Respiratory therapist | |||||||
| Tibballs et al., 200535 | Australia | Pediatric tertiary‐care academic hospital | Pediatric inpatients | ICU physician | Cardiac arrest | Not supplied | Not provided |
| Medical registrar | Unscheduled ICU admission | ||||||
| ED physician | |||||||
| ICU nurse | |||||||
| King et al., 200629 | United States | Tertiary‐care academic hospital | Adult inpatients, outpatients, and visitors | Hospitalist | Cardiac arrest | NA | Not provided |
| Internal medicine resident | |||||||
| ICU nurse | |||||||
| Ward nurse | |||||||
| Pharmacist | |||||||
RRS Structure, Calling Criteria, and Responsibilities
Seven studies22, 23, 31, 33, 34, 36, 37 that described the team composition used variants of the medical emergency team model, a physician‐led team (Table 2). In 6 of these 7 studies, the team included a critical care physician (attending or fellow) and an ICU nurse; in the sole RCT (the MERIT study36), the team structure varied between hospitals, consisting of a nurse and physician from either the emergency department or ICU. Hospitalists, who are involved in RRS responses at many U.S. hospitals, were primary team leaders of the RRS in only 1 study.31 In 2 studies34, 37 the RRS also responded to code blue calls, and in 4 studies23, 31, 33, 39 the RRS and the code blue team had separate personnel; the remaining studies did not define the distinction between RRS and code blue team.
| Study | Contemporaneous control group | Data reported at more than 1 time before/after intervention | RRS calling rate reported | Outcomes analysis included patients made DNR by team | Blind measurement of nonobjective outcomes | Intensivist always available | Other QI efforts during study |
|---|---|---|---|---|---|---|---|
| |||||||
| Buist et al., 200220 | No | No | Yes | No (mortality) | No | NR | NR |
| Bellomo et al., 200321 | No | No | Yes | Yes (mortality) | NA | Yes (ICU fellow) | No |
| Pittard et al., 200322 | No | No | Yes | NA | No | NR | NR |
| Bellomo et al., 200431 | No | No | Yes | Yes (mortality) | No | Yes (ICU fellow) | No |
| DeVita et al., 200432 | No | Yes | Yes | NA | No | Yes (critical care attending physician) | NR |
| Garcea et al., 200433 | No | No | No | Unclear | No | NR | NR |
| Kenward et al., 200438 | No | No | Yes | Unclear | No | NR | NR |
| Priestley et al., 200433 | No (interrupted time series) | Yes | No | NA | No | NR | NR |
| Hillman et al., 200534 | Yes | No | Yes | Unclear | Yes | NR | No |
| Hunt et al., 2005 (abstract)36 | No | No | Yes | NA | NR | NR | NR |
| Meredith et al., 2005 (abstract)37 | No | No | Yes | No | NA | No | No |
| Tibballs et al., 200535 | No | No | Yes | Unclear | No | NR | Yes (educational workshops/more training in APLS) |
| King et al., 200629 | No | Yes | Yes | NA | No | Yes | No |
In 4 studies the RRSs were led by nurses. One study published in abstract form39 used the rapid response team model, consisting of a critical care nurse and a respiratory therapist, with assistance as needed from the primary medical staff and a critical care physician. Three studies3, 24, 35 from UK hospitals used the critical care outreach (CCO) model, in which ICU‐trained nurses respond initially with assistance from intensivists. The CCO model also involves follow‐up on patients discharged from the ICU and proactive rounding on unstable ward patients.
The hospitals used broadly similar approaches to determining when to summon the RRS, relying on combinations of objective clinical criteria (eg, vital sign abnormalities) and subjective criteria (eg, acute mental status change, staff member concerned about patient's condition). Three studies3, 24, 35 used a formal clinical score (the Patient‐At‐Risk score or the Modified Early Warning score) to trigger calls to the RRS. Three studies, 2 of them from the same institution,23, 33 reported the frequency of specific triggers for RRS activation. Concern by bedside staff and respiratory distress were the most frequent activators of the RRS.
Study Internal Validity and Generalizability
One study,36 the MERIT trial, conducted in Australia, was a cluster‐randomized RCT (randomized by hospital) that adhered to recommended elements of design and reporting for studies of this type.41 In this study, hospitals in the control group received an educational intervention on caring for deteriorating patients only; hospitals in the intervention group received the educational module and started an RRS. An additional study35 identified itself as a randomized trial, but randomization occurred at the hospital ward level, with introduction of the intervention (critical care outreach) staggered so that at different points an individual ward could have been in either the control or intervention group; therefore, this study was considered an interrupted time series. All other trials included were before‐after studies with no contemporaneous control group
Most studies did not meet criteria for internal validity or generalizability (Table 2). Two studies3, 35 did not report the number of RRS calls during the study period. One study22 omitted patients whose resuscitation status was changed after RRS evaluation from the calculation of inpatient mortality; thus, the patients who had been made do not resuscitate by the RRS did not contribute to the calculated mortality rate. The disposition of these patients was unclear in another study.36 All studies measured clinical outcomes retrospectively, and no studies reported blinding of outcomes assessors for nonobjective outcomes (eg, unplanned ICU admission). Studies generally did not report on the availability of intensivists or if other quality improvement interventions targeting critically ill patients were implemented along with the RRS.
RRS Usage and Effects on Patient Outcomes
Seven studies2224, 34, 3638 reported enough information to calculate the RRS calling rate (4 studies24, 31, 39, 40 reported the total number of calls but not the number of admissions, and 2 studies3, 35 did not report either). In these 7 studies, the calling rate varied from 4.5 to 25.8 calls per 1000 admissions. Three studies documented the calling rate before and after the intervention: a study at a hospital with a preexisting RRS34 reported that the calling rate increased from 13.7 to 25.8 calls per 1000 admissions after an intensive education and publicity program; in a pediatric trial,38 the overall emergency calling rate (for cardiac arrests and medical emergencies) was reported to increase from 6.6 to 10.4 per 1000 admissions; and in the MERIT trial,36 calls increased from 3.1 to 8.7 per 1000 admissions.
Effects of RRS on Clinical Outcomes
Nine studies3, 22, 23, 33, 3537, 39, 40 reported the effect of an RRS on inpatient mortality, 9 studies22, 23, 31, 33, 34, 3638, 40 reported its effect on cardiopulmonary arrests, and 6 studies3, 22, 24, 33, 36, 37 reported its effect on unscheduled ICU admissions. Of these, 7 trials that reported mortality and cardiopulmonary arrests and 6 studies that reported unscheduled ICU admissions supplied sufficient data for meta‐analysis.
Observational studies demonstrated improvement in inpatient mortality, with a summary risk ratio of 0.82 (95% CI: 0.74‐0.91, heterogeneity I2 62.1%; Fig. 2). However, the magnitude of these improvements was very similar to that seen in the control group of the MERIT trial (RR 0.73, 95% CI: 0.53‐1.02). The intervention group of the MERIT trial also demonstrated a reduction in mortality that was not significantly different from that of the control group (RR 0.65, 95% CI: 0.48‐0.87). We found a similar pattern in studies reporting RRS effects on cardiopulmonary arrests (Fig. 3). The observational studies did not show any effect on the risk of unscheduled ICU admissions (summary RR 1.08, 95% CI: 0.96‐1.22, heterogeneity I2 79.1%) nor did the MERIT trial (Fig. 4).
DISCUSSION
Despite the strong face validity of the RRS concept, the current literature on medical emergency teams, rapid response teams, and critical care outreach suffers from substantial flaws that make it difficult to determine the effect of an RRS on patient outcomes. These flaws include the use of suboptimal study designs, failure to report important cointerventions, the methods in which outcomes were defined, and lack of verification of the validity of the outcomes measured. As a result, very little empiric data are available to define the effectiveness of RRSs or to provide guidance for hospitals planning to implement an RRS.
Though early studies reported that RRSs appeared to reduce mortality and cardiac arrest rates, the sole randomized trial of an RRS (the MERIT trial36) showed no differences between intervention and control hospitals for any clinical outcome. Both inpatient mortality and cardiac arrest rates declined in the intervention and control groups of the MERIT trial, and the reductions in these outcomes in observational trials were similar to those seen in the MERIT control group. This strongly implies that other factors besides the RRS were responsible for the results of previous before‐after studies. These studies, which have been widely cited by proponents of the RRS, suffer from methodological limitations intrinsic to the study design and issues with outcome measurement that may have introduced systematic bias; these factors likely explain the contrast between the generally positive results of the before‐after studies and the negative results of the MERIT trial.
Most early RRS trials used an uncontrolled before‐after study design, as is common in quality improvement studies.42 This study design cannot account for secular trends or other factors, including other QI interventions, that could influence the effect of an intervention.26 The statistically significant reduction in impatient mortality in the control arm of the MERIT trial is an instructive example; this decline could have been a result of the educational intervention on caring for deteriorating patients, other ongoing QI projects at the individual hospitals, or simply random variation during the relatively short (6‐month) follow‐up period. Such factors could also entirely account for the impressive results seen in the initial uncontrolled RRS studies. Nearly all the studies we reviewed also did not discuss any aspects of the hospital context that could influence outcomes for critically ill patients, such as the nurse‐staffing ratio,43 ICU bed availability,4446 overall hospital census,47 or availability of intensivists48 or hospitalists.49 Failure to control foror at least report important aspects ofthe environment in which the intervention was performed is akin to failing to report baseline patient comorbidities or concurrent therapies in a study of a drug's effectiveness.
Our review also suggests how bias in the measurement of clinical outcomes may have contributed to the apparent effect of RRSs. In 1 before‐after study, patients for whom RRS activation resulted in a change code status to do not resuscitate (DNR) were excluded from calculations of mortality,22, 50 resulting in underreporting of mortality after RRS implementation. Disposition of such patients was unclear in 3 other studies.3, 36, 40 Some studies22, 34 defined cardiopulmonary arrest as any activation of the code blue team, regardless of whether the patient was actually in cardiac arrest. This almost inevitably would result in fewer arrests after implementation of the RRS, as the indications for calling the code blue team would be narrower. Finally, nearly all studies used trends in nonobjective primary outcomes (eg, unplanned ICU transfer) to support RRS effects but did not validate any of these outcomes (eg, how often did reviewers agree an ICU transfer was preventable), and none of the assessors of these outcomes were blinded.
Some have attributed the MERIT trial not finding the RRS beneficial to inadequate implementation, as the RRS calling rate of 8.7 calls per 1000 admissions was less than the 15 calls per 1000 admissions cited as optimal in a mature RRS.51 However, published studies generally reported a calling rate of 4‐5 calls per 1000 admissions,22, 23, 37 with only 1 trial reporting a higher calling rate.34
A recent commentary20 and a systematic review of critical care outreach teams21 both addressed the effectiveness of RRSs. We sought to examine the effects of all RRS subtypes and using quantitative analysis and analysis of methodological quality, to determine the overall effect of RRSs. The results of our analysis (which included data from several newer studies31, 38, 39) support and extend the conclusion of prior reviews that RRSs, although a potentially promising intervention, do not unequivocally benefit patients and are not worthy of more widespread use until more evidence becomes available. Our analysis also demonstrates that many studies widely cited as supporting wide implementation of RRSs are flawed and probably not generalizable.
Despite these caveats, RRSs remain an intuitively attractive concept and may be of benefit at some hospitals. Further studies in this area should focus on identifying which patient populations are at high risk for clinical decompensation, identifying the role of clinical structures of care (eg, nurse‐staffing ratio, presence of hospitalists) in preventing adverse outcomes and determining which specific RRS model is most effective. As well, more information is needed about educating bedside staff and RRS team members, as this is likely critical to success of the team. Unfortunately, only the article by King et al.31 provided sufficient detail about the implementation process to assist hospitals in planning an RRS. The remaining articles had only scant details about the intervention and its implementation, a common problem noted in the quality improvement literature.42, 52, 53
Our analysis had several limitations. We attempted to identify as many RRS trials as possible by searching multiple databases and reviewing abstract proceedings, but as the RRS literature is in its infancy, we may not have located other unpublished studies or gray literature. There is no validated system for evaluating the methodological strength of nonrandomized studies; therefore, we assessed study quality on the basis of prespecified criteria for internal and external validity. Finally, we found significant statistical heterogeneity in our quantitative analyses, indicating that the variability between individual studies in treatment effects was greater than that expected by chance. As the primary reasons we conducted a meta‐analysis was to compare the results of before‐after trials with those of the randomized MERIT trial, we did not further explore the reasons for this heterogeneity, although variation in patient populations and RRS structure likely accounts for a significant proportion of the heterogeneity.
Although there is a theoretical basis for implementing a rapid response system, the published literature shows inconsistent benefits to patients and suffers from serious methodological flaws. Future studies of RRSs should attempt to define which patient populations are at risk, the essential characteristics of RRSs, effective implementation strategies, andmost importantwhether any RRS improves clinical outcomes. Until such evidence is available, hospitals should not be mandated to establish an RRS and should consider prioritizing quality improvement resources for interventions with a stronger evidence base.
Acknowledgements
The authors thank Emmanuel King, MD, for graciously providing a copy of his manuscript prior to publication and Alexis Meredith, MD, for providing additional information regarding his study. Dr. Shojania holds a Government of Canada Research Chair in Patient Safety and Quality Improvement.
APPENDIX
| Search terms | Citations | |
|---|---|---|
| 1 | {(rapid [ti] AND (response [ti] OR resuscitation [ti]) OR (patient at risk [ti])} AND (program [ti] OR team* [ti] OR service* [ti]) | 23 |
| 2 | medical emergency team* [ti] OR medical crisis team* [ti] OR {(critical [ti] OR intensive [ti]) AND care [ti] AND outreach [ti]} | 87 |
| 3 | hospital [ti] AND resuscitation [ti] AND team* [ti] | 11 |
| 4 | medical emergency team* [ab] OR rapid response team [ab] OR medical crisis team* [ab] | 89 |
| 5 | #1 OR #2 OR #3 OR #4 | 158 |
| 6 | Resuscitation [mh] OR heart arrest [mh] OR hospital mortality [mh] | 72,488 |
| 7 | (patient care team [mh] OR critical care [mh] OR intensive care units [mh]) AND (patient readmission [mh] OR organization and administration [mh]) | 20,321 |
| 8 | #6 AND #7 | 1,419 |
| 9 | {(randomised[ti] OR randomized[ti] OR controlled[ti] OR intervention[ti] OR evaluation[ti] OR comparative[ti] OR effectiveness[ti] OR evaluation[ti] OR feasibility[ti]) AND (trial[ti] OR studies[ti] OR study[ti] OR program[ti] OR design[ti])} OR clinical trial[pt] OR randomized controlled trial[pt] OR epidemiologic studies[mh] OR evaluation studies[mh] OR comparative study[mh] OR feasibility studies[mh] OR intervention studies[mh] OR program evaluation[mh] OR epidemiologic research design[mh] OR systematic5 | 2,688,847 |
| 10 | #8 AND #9 | 748 |
| 11 | #5 OR #10 | 806 |
- ,,,.The medical emergency team.Anaesth Intensive Care.1995;23(2):183–186.
- ,,,.The 100 000 Lives Campaign: setting a goal and a deadline for improving health care quality.JAMA.2006;295(3):324–7.
- ,,,,.Impact of a critical care outreach team on critical care readmissions and mortality.Acta Anaesthesiol Scand2004;48:1096–1100.
- ,.The patient‐at‐risk team.Anaesthesia.2000;55(2):198.
- ,,, et al.Findings of the First Consensus Conference on Medical Emergency Teams.Crit Care Med.2006;34:2463–2478.
- .Recognition of patients who require emergency assistance: a descriptive study.Heart Lung.2000;29(4):262–268.
- ,,, et al.Antecedents to hospital deaths.Intern Med J.2001;31:343–348.
- ,,, et al.Duration of life‐threatening antecedents prior to intensive care admission.Intensive Care Med.2002;28:1629–1634.
- ,,,,.The identification of risk factors for cardiac arrest and formulation of activation criteria to alert a medical emergency team.Resuscitation.2002;54:125–131.
- ,,,,,.A comparison of antecedents to cardiac arrests, deaths and emergency intensive care admissions in Australia and New Zealand, and the United Kingdom—the ACADEMIA study.Resuscitation.2004;62:275–282.
- ,,,.Validation of a modified Early Warning Score in medical admissions.QJM.2001;94:521–526.
- ,,,,.Inpatient transfers to the intensive care unit: delays are associated with increased mortality and morbidity.J Gen Intern Med.2003;18(2):77–83.
- ,,,,.Clinical antecedents to in‐hospital cardiopulmonary arrest.Chest.1990;98:1388–1392.
- ,.Developing strategies to prevent inhospital cardiac arrest: analyzing responses of physicians and nurses in the hours before the event.Crit Care Med.1994;22(2):244–247.
- ,,.Introduction to the rapid response systems series.Jt Comm J Qual Patient Saf.2006;32:359–360.
- ,,, et al.Rates of in‐hospital arrests, deaths and intensive care admissions: the effect of a medical emergency team.Med J Aust.2000;173:236–240.
- ,,,,.The patient‐at‐risk team: identifying and managing seriously ill ward patients.Anaesthesia.1999;54:853–860.
- .The medical emergency team: no evidence to justify not implementing change.Med J Aust.2000;173:228–229.
- ,.The medical emergency team, evidence‐based medicine and ethics.Med J Aust.2003;179:313–315.
- ,,.Rapid response teams—walk, don't run.JAMA.2006;296:1645–1647.
- ,,, et al.Investigating the effectiveness of critical care outreach services: a systematic review.Intensive Care Med.2006;32:1713–1721.
- ,,,,,.Effects of a medical emergency team on reduction of incidence of and mortality from unexpected cardiac arrests in hospital: preliminary study.BMJ.2002;324:387–390.
- ,,, et al.A prospective before‐and‐after trial of a medical emergency team.Med J Aust.2003;179:283–287.
- .Out of our reach? Assessing the impact of introducing a critical care outreach service.Anaesthesia.2003;58:882–885.
- Cochrane Collaboration Effective Practice and Organisation of Care group. Available at: http://www.epoc.uottawa.ca/inttime.pdf.Accessed August 4,2006.
- ,,.Experimental and Quasi‐Experimental Designs for Generalized Causal Inference.Boston, MA:Houghton Mifflin;2002.
- ,,, et al.Guidelines for the uniform reporting of data for Medical Emergency Teams.Resuscitation.2006;68(1):11–25.
- ,.The intracluster correlation coefficient in cluster randomisation.BMJ.1998;316:1455.
- ,.Issues in the meta‐analysis of cluster randomized trials.Stat Med.2002;21:2971–2980.
- ,,,.Measuring inconsistency in meta‐analyses.BMJ.2003;327:557–560.
- ,,.Establishing a rapid response team (RRT) in an academic hospital: one year's experience.J Hosp Med.2006;1:296–305.
- ,,, et al.A multidisciplinary community hospital program for early and rapid resuscitation of shock in nontrauma patients.Chest.2005;127:1729–1743.
- ,,, et al.Prospective controlled trial of effect of medical emergency team on postoperative morbidity and mortality rates.Crit Care Med.2004;32:916–921.
- ,,,,,.Use of medical emergency team responses to reduce hospital cardiopulmonary arrests.Qual Saf Health Care.2004;13:251–254.
- ,,, et al.Introducing critical care outreach: a ward‐randomised trial of phased introduction in a general hospital.Intensive Care Med.2004;30:1398–1404.
- ,,, et al.Introduction of the medical emergency team (MET) system: a cluster‐randomised controlled trial.Lancet.2005;365:2091–2097.
- ,,,,.Reduction of paediatric in‐patient cardiac arrest and death with a medical emergency team: preliminary results.Arch Dis Child.2005;90:1148–1152.
- ,,, et al.The effect of transition from a traditional code team to a rapid response team in a children's center: a before and after intervention trial [abstract].Crit Care Med.2005;33(12 suppl):A17.
- ,,,,.Improved hospital mortality by institution of a rapid response team in a university hospital.Chest.2005;128(suppl S):182S.
- ,,,.Evaluation of a medical emergency team one year after implementation.Resuscitation.2004;61(3):257–263.
- ,,.CONSORT statement: extension to cluster randomised trials.BMJ.2004;328:702–708.
- ,.Evidence‐Based Quality Improvement: The State Of The Science.Health Aff.2005;24(1):138–150.
- ,,,,.Hospital nurse staffing and patient mortality, nurse burnout, and job dissatisfaction.JAMA.2002;288:1987–1993.
- ,,, et al.Evaluation of triage decisions for intensive care admission.Crit Care Med.1999;27:1073–1079.
- ,,,,.Rationing of intensive care unit services. An everyday occurrence.JAMA.1986;255:1143–1146.
- ,,,.How do physicians adapt when the coronary care unit is full? A prospective multicenter study.JAMA.1987;257:1181–1185.
- ,,,,.The association between hospital overcrowding and mortality among patients admitted via Western Australian emergency departments.Med J Aust.2006;184:208–212.
- ,,,,,.Physician staffing patterns and clinical outcomes in critically ill patients: a systematic review.JAMA.2002;288:2151–2'62.
- ,,,,,.Implementation of a voluntary hospitalist service at a community teaching hospital: improved clinical efficiency and patient outcomes.Ann Intern Med.2002;137:859–865.
- .Critical care outreach team's effect on patient outcome: other conclusions are possible.BMJ.2004;328:347; author reply
- The “MERIT” Trial of medical emergency teams in Australia: an analysis of findings and implications for the 100,000 Lives Campaign. Institute for Healthcare Improvement,2006. Available at: http://www.ihi.org/NR/rdonlyres/F3401FEF‐2179‐4403‐8F67–B9255C57E207/0/LancetAnalysis81505.pdf. Accessed August 17, 2006.
- ,,, et al.Toward evidence‐based quality improvement. evidence (and its limitations) of the effectiveness of guideline dissemination and implementation strategies 1966‐1998.J Gen Intern Med.2006;21(suppl 2):S14–S20.
- ,,, et al.lessons learned about implementing research evidence into clinical practice. Experiences from VA QUERI.J Gen Intern Med.2006;21(suppl 2):S21–S24.
- ,,,,,.Improving the quality of reports of meta‐analyses of randomised controlled trials: the QUOROM statement. Quality of reporting of meta‐analyses.Lancet.1999;354:1896–1900.
- ,,,,,.Improving the utilization of medical crisis teams (Condition C) at an urban tertiary care hospital.J Crit Care.2003;18(2):87–94.
- ,,, et al.Long term effect of a medical emergency team on cardiac arrests in a teaching hospital.Crit Care.2005;9:R808–R815.
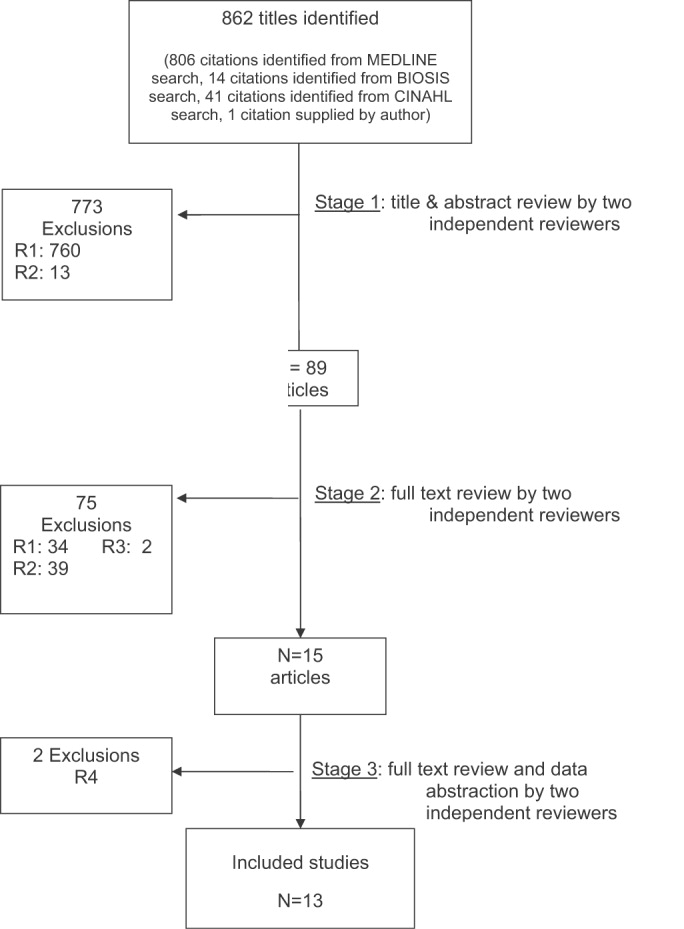
Impact of CT on PE Diagnosis
Spiral computed tomographic pulmonary angiography (CTPA) is a common first‐line test for the evaluation of suspected pulmonary embolism (PE). At our institution CTPA became the initial diagnostic study in 83% of patients with suspected PE within 3 years of the introduction of CT,1 and by 2001 CTPA had become the most common diagnostic test performed nationwide in patients diagnosed with PE.2 Most scans are interpreted as either positive or negative for pulmonary embolism, providing clinicians with a greater sense of diagnostic certainty than with the probabilistic results of lung scintigraphy. Initial studies of CTPA supported this appearance of diagnostic certainty, reporting sensitivity and specificity of greater than 90%,3, 4 but several subsequent studies have failed to reproduce these results.57 Newer multidetector CT scans are believed to be more accurate than earlier single‐detector CT,8 but true estimates of CTPA test characteristics will not be known until publication of the forthcoming PIOPED II study.9
Even without these data, CT‐based diagnostic algorithms have already appeared.1014 These algorithms generally focus on minimizing the false‐negative rate through use of serial testing (involving combinations of serum D‐dimer, lower‐extremity ultrasound, and CTPA). A recent meta‐analysis demonstrated that negative CTPA is highly accurate at ruling out PE, with test characteristics similar to conventional pulmonary angiography.15 Another meta‐analysis found that the 3‐month rate of subsequent venous thromboembolism after negative CTPA was 1.4% (95% CI 1.1%‐1.8%),16 supporting the strategy of withholding anticoagulants after negative CTPA in combination with other tests. However, use of serial testing to establish the diagnosis of PE and initiate anticoagulation has not been systematically evaluated or recommended, even for patients with a low pretest probability of PE.17
To assess the potential impact of these algorithms on the diagnosis of PE in clinical practice, we analyzed the clinical presentation and treatment of a cohort of patients at our institution who underwent CTPA for suspected PE.1 We calculated a range of posttest probabilities for pulmonary embolism for these patients, given the pretest probabilities, test results, and estimates of CTPA test characteristics. We then compared the treatment decisions of clinicians to the posttest probabilities of PE in order to establish the potential frequency of false‐positive and false‐negative diagnoses and to determine if patients were treated appropriately based on these estimates.
METHODS
Sites and Subjects
Details of the sites, subjects, and methods used to collect patient‐level data in this analysis have been previously published.1 The study was performed at Moffitt‐Long Hospital and San Francisco General Hospital, teaching hospitals affiliated with the University of California San Francisco School of Medicine. At both sites, single‐detector CT scans were available 24 hours a day throughout the study period and were read by attending radiologists who specialized in thoracic imaging. We excluded patients whose CTPA was not completed as the initial test in the evaluation of suspected PE, those who underwent testing for any indication other than suspected acute PE, and those with incomplete medical records or technically inadequate CTPA.
We randomly selected 345 patients who underwent CTPA between January 1, 1998, and December 31, 2000, from the Radiology Department databases. One investigator (R.L.T.) then abstracted charts of all patients. For each subject, we collected data about history and clinical presentation, diagnostic impressions of the treating clinicians, treatments administered both before and after diagnostic testing, CTPA result, results of other diagnostic tests for PE, and final clinical diagnosis. During the study period, there were no institution‐ or department‐specific guidelines or decision aids available for the diagnosis of PE. Ventilation‐perfusion scan, lower extremity ultrasound, and pulmonary angiography were available, but highly sensitive D‐dimer assays were not in use. The study was approved by the Institutional Review Boards of both sites, and requirement for written informed consent from patients was waived.
Estimates of Pretest Probabilities of Pulmonary Embolism and CTPA Test Characteristics
Several prediction rules1820 generate clinical pretest probabilities for patients with suspected PE. We used the Wells score18 to assign a pretest probability of low, moderate, or high to each patient on the basis of the following clinical variables: leg swelling, hemoptysis, tachycardia, history of recent immobilization, history of prior DVT or PE, active malignancy, and lack of a more likely alternative diagnosis. We chose this rule as (unlike other prediction rules such as the Geneva rule20) the Wells score has been validated for hospitalized patients with suspected PE and does not require arterial blood gas measurements. The prevalence of PE reported in the evaluation of the Wells score was 3.4%, 27.8%, and 78.3% for low, moderate, and high pretest probabilities, respectively.18
As in our previous study,1 we assumed CTPA to be 90% sensitive and 95% specific based on published estimates.3, 17 These values correspond to a positive likelihood ratio of 18 and a negative likelihood ratio of 0.1.21 We chose these values as a best‐case estimate of the test characteristics of CTPA, although other studies have found less impressive results.7 Using these pretest probabilities and likelihood ratios, we then used Bayes' theorem (Figure 1) to calculate the range of expected posttest probabilities of pulmonary embolism.
Calculation of Posttest Probabilities and Comparison to Treatment Outcomes
For each pretest probability category, we used the posttest probabilities calculated above to determine the number of true‐positive pulmonary emboli, as follows:
RESULTS
Patient Characteristics
After excluding 23 patients receiving anticoagulants for other indications prior to CTPA, the study cohort included 322 patients (57.7% female), with an average age of 58.6 years, of whom 20.5% had cancer and 4.5% had a prior history of thromboembolic disease. Scans were primarily ordered by the medicine service (47.7% of cases) and emergency department (22.9%). CTPA was the initial test for 9% of patients evaluated for suspected acute PE during the first 6 months of the study period, increasing to 83% by the end of 2000.1 The overall pretest probability distribution remained the same throughout the entire study period.1
Test Results and Treatment Decisions
Most patients in our cohort had a low (n = 184, 57.1%) or a moderate (n = 101, 31.4%) pretest probability of PE (Table 1). The likelihood of a positive CTPA increased as the pretest probability increased, but even among patients with high clinical risk, only 35.1% had positive CT scans. In total, scans were positive in 57 patients and negative in 265 patients. Clinicians treated 55 patients with a positive CTPA (96.5%); none of these patients underwent additional testing for DVT or PE after the imaging study. Among patients with a negative CTPA, 254 (95.8%) were not treated; none of the patients in whom anticoagulation was withheld underwent further testing, whereas the other 11 patients were treated on the basis of other tests (5 high‐probability ventilation‐perfusion scans, 3 positive leg ultrasounds, and 3 for unclear reasons). Overall, 66 patients (20.5%) were treated for pulmonary embolism.
| Pretest probability of PE (number of CTPA performed) | Low (N = 184) | Moderate (N = 101) | High (N = 37) | Total (N = 322) |
|---|---|---|---|---|
| ||||
| CTPA positive for PE (% of pretest probability group) | 22 (12.0%) | 22 (21.8%) | 13 (35.1%) | 57 (17.7%) |
| CTPA negative for PE (% of pretest probability group) | 162 (88.0%) | 79 (78.2%) | 24 (64.9%) | 265 (82.3%) |
| Patients with positive CT subsequently treated for PE (% of pretest probability group) | 21 (11.4%) | 21 (20.8%) | 13 (35.1%) | 55 (17.1%) |
| Patients treated for PE despite negative CT (% of pretest probability group) | 5 (2.7%) | 3 (3.0%) | 3 (8.1%) | 11 (3.4%) |
| Total patients treated for PE (% of pretest probability group) | 26 (14.1%) | 24 (23.8%) | 16 (43.2%) | 66 (20.5%) |
Literature‐Derived Estimates of Posttest Probabilities of Pulmonary Embolism
Patients who have a low pretest probability of PE and a positive CTPA have a posttest probability of 41.6% under our estimate of CTPA test characteristics. Patients with moderate pretest probability have a posttest probability of 87.4% and patients with a high pretest probability will have a 98.5% probability of embolism with a positive scan. The traditional treatment threshold for PE is a posttest probability of 90%.22
Observed Versus Expected PE Rates and Subsequent Treatment
Only 9 of the 22 patients (41%) with a low pretest probability and a positive CTPA likely represent true‐positive emboli. However, clinicians chose to treat 21 of the 22 patients with this combination of pretest probability and imaging findings. Thus, 12 emboli would be considered possible false‐positive diagnoses. Similarly, in the moderate pretest probability group, 2 of 21 patients with moderate pretest probability and 0 of 13 patients with high pretest probability treated for PE had a possibly false‐positive diagnosis. Thus, in total, 25.4% (14 of 55) patients treated for PE had a possible false‐positive diagnosis of pulmonary embolism and may have been unnecessarily administered anticoagulants (Table 2). All patients who potentially had a false‐positive PE had either a low or moderate pretest probability of PE; in fact, the majority (57.1%) of patients with a low pretest probability of PE who were subsequently treated for PE likely had a false‐positive diagnosis.
| Pretest probability | ||||
|---|---|---|---|---|
| Low (n = 184) | Moderate (n = 101) | High (n = 37) | Total (n = 322) | |
| ||||
| CTPA positive for PE (% of pretest probability group) | 22 (12.0%) | 22 (21.8%) | 13 (35.1%) | 57 (17.7%) |
| Patients with positive CTPA treated for pulmonary embolism (n, % treated in risk group) | 21 (95.4%) | 21 (95.4%) | 13 (100%) | 55 (96.5%) |
| Calculated number and rate of probable true‐positive evaluations | ||||
| Number of true‐positive PE (n, % treated in risk group) | 9 (42.9%) | 19 (90.5%) | 13 (100%) | 41 (74.6%) |
| Calculated number and rate of possible false‐positive evaluations | ||||
| Number of possible false‐positive PE (n, % in risk group with unexpected PE) | 12 (58.1%) | 2 (9.5%) | 0 | 14 (25.4%) |
Clinicians were more likely to overtreat a patient with a possible false‐positive CT scan than to withhold treatment from a patient with a possible false‐negative diagnosis. Using the same estimates of CTPA test characteristics, the incidence of possible false‐negative diagnosis of PE was 1.6% (4 possible false‐negative diagnoses among 254 patients with negative CTPA results who were not treated for PE.) All these patients had a high pretest probability of PE.
DISCUSSION
Physicians at our institution regarded CTPA results as definitive, anticoagulating 96.5% of patients with a positive CT and withholding treatment in 95.8% of patients with a negative scan. This practice pattern may result in unnecessary anticoagulation of many patients with a low pretest probability of PE who may have had false‐positive CTPA findings. In contrast, the rate of possible false‐negative diagnosis of PE was low, consistent with the results of several other studies.16
The use of CTPA is likely to increase because of the publication of multiple algorithms advocating that CTPA be the chief imaging study used in the diagnosis of PE.1014 These algorithms recommend serial testing on patients with a negative CTPA in order to minimize the false‐negative rate, but they do not require systematic follow‐up in patients with a positive scan, even if the pretest probability was low. In management trials, this approach resulted in a low false‐negative rate (1.0%‐1.8% at 3‐month follow‐up).1114 However, the rate of major bleeding in patients treated for PE was 3.2%‐6.0% at 3 months,1214 illustrating the potential risk of anticoagulating patients who may have false‐positive diagnoses. Furthermore, premature diagnostic closure after a CTPA positive for PE may result in additional morbidity as a result of missing the true diagnosis.
One potential explanation for the large number of potential false‐positive emboli seen in low‐risk patients is that it is difficult to accurately diagnose distal pulmonary emboli with CTPA. The interrater reliability of CTPA for diagnosis of subsegmental PE is suboptimal,23 and the clinical significance of these emboli remains uncertain.24 Thus, many emboli found in patients with low pretest probability actually may have been subsegmental PE that would not have been diagnosed by another radiologist. As CTPA is more accurate for diagnosing central PE,25 clinicians should consider reviewing positive scans with the interpreting radiologist, especially when the pretest probability was low and the filling defects identified are in distal vessels.
Our results may also illustrate that clinicians have a lower treatment threshold when presented with apparently definitive evidence of pulmonary embolism. Previous proposals on the appropriate treatment threshold for PE, which used Bayesian decision‐making methods similar to ours,22 incorporated PIOPED26 data on the pretest probability of pulmonary embolism, the test characteristics of ventilation‐perfusion scans, and the clinical outcomes of patients in each test result/pretest probability category. However, there is no corresponding data for CTPA, as its test characteristics are still uncertain, and long‐term clinical outcomes have not been documented for patients treated (or not treated) on the basis of CT results.
Our study had several limitations. First, charting bias potentially was introduced by our using a retrospective method of collecting data for calculating pretest probabilities. To address this potential bias, we collected data from the entire medical record, including information available at and preceding the time of the CT scan. We believe this method was effective, as the range of pretest probabilities and the prevalence of PE in our study were very similar to those seen in a number of prospective studies.1820, 26, 27 Although other risk indices exist, the Wells score has been shown to have predictive powers equal to other algorithms and to clinicians; implicit assessments.28, 29 In our cohort, 35.1% of patients with a high pretest probability were diagnosed with PE; although this was lower than that in the initial Wells cohort,18 it was very similar to a subsequent validation study using the Wells algorithm, in which the prevalence of PE in patients with high pretest probability was 37.5%.27 Plasma D‐dimer testing is not routinely used at our hospitals, but it is a component of some CTPA‐based diagnostic algorithms.1114 Although use of D‐dimer testing may have led to fewer scans in patients with negative D‐dimer test results and low pretest probability,30 the high false‐positive rate for D‐dimer assays31 makes it difficult to predict the effect of widespread D‐dimer use on the overall pretest probability distribution. Using our assumptions about CT test characteristics, a pretest probability of more than 30% is required to generate a posttest probability of PE of at least 90% (the traditional treatment threshold for anticoagulant therapy22) with a positive scan. Extensive D‐dimer use would be unlikely to cause such a shift in the distribution of pretest probabilities.
Finally, CT technology has continued to advance, and many institutions now use 64‐slice scanners32 in contrast to the single‐slice scanners in use at the time our data were collected. Our assumptions were that CTPA has a positive likelihood ratio of 18.0 and a negative likelihood ratio of 0.1 (corresponding to a sensitivity of 90% and a specificity of 95%), although many studies of single‐detector CTPA found less impressive values.5, 7 Multidetector CT is thought to be more accurate than was earlier technology, but the true diagnostic performance of multidetector CT is not yet known. However, our findings pertain primarily to clinicians' responses to test results, so even if newer scanners are more accurate, Bayesian analysis will still be required in order to appropriately treat patients. A recent meta‐analysis of diagnostic strategies for PE found CTPA to have a positive likelihood ratio of 24.1, but even using this higher value, patients with a low pretest probability and positive CTPA still have a posttest probability of PE below the traditional treatment threshold.33 As most patients undergoing evaluation for suspected PE have a low pretest probability,17 a substantial number of false‐positive diagnoses of PE may still occur, even with a more accurate diagnostic test.
CT pulmonary angiography has become the first‐line test for pulmonary embolism at our institution, a situation likely mirrored elsewhere. CTPA is safe and rapid and offers the advantage of revealing ancillary lung findings that may be clinically significant.12 Although the test is an important addition to a clinician's diagnostic armamentarium, Bayesian analysis must be used to interpret its results, especially when CTPA is used as the first‐line diagnostic test. Our data raise the troubling concern that reliance on CTPA as the sole diagnostic test for suspected pulmonary embolism may result in a large number of patients with false‐positive CT scans receiving anticoagulation treatment.
- ,,,,.The impact of helical computed tomography on diagnostic and treatment strategies in patients with suspected pulmonary embolism.Am J Med.2004;116:84–90.
- ,,.Trends in the use of diagnostic imaging in patients hospitalized with acute pulmonary embolism.Am J Cardiol.2004;93:1316–1317.
- ,,,.Central pulmonary thromboembolism: diagnosis with spiral volumetric CT with the single‐breath‐old technique—comparison with pulmonary angiography.Radiology.1992;185:381–387.
- ,,, et al.Pulmonary embolism: validation of spiral CT angiography in 149 patients.Radiology.1996;201:467–470.
- ,,,,.Lung scintigraphy and helical computed tomography for the diagnosis of pulmonary embolism: a meta‐analysis.Clin Appl Thromb Hemost.2001;7(2):87–92.
- ,,,.The role of spiral volumetric computed tomography in the diagnosis of pulmonary embolism.Arch Intern Med.2000;160(3):293–298.
- ,,.Sensitivity and specificity of helical computed tomography in the diagnosis of pulmonary embolism: a systematic review.Ann Intern Med.2000;132(3):227–232.
- ,,, et al.Suspected acute pulmonary embolism: evaluation with multi‐detector row CT versus digital subtraction pulmonary arteriography.Radiology.2004;233:806–815.
- ,,,.Overview of Prospective Investigation of Pulmonary Embolism Diagnosis II.Semin Nucl Med.2002;32(3):173–182.
- ,,, et al.Management of suspected pulmonary embolism (PE) by D‐dimer and multi‐slice computed tomography in outpatients: an outcome study.J Thromb Haemost.2005;3:1926–1932.
- ,,, et al.Multidetector‐row computed tomography in suspected pulmonary embolism.N Engl J Med.2005;352:1760–1768.
- ,,, et al.Single‐detector helical computed tomography as the primary diagnostic test in suspected pulmonary embolism: a multicenter clinical management study of 510 patients.Ann Intern Med.2003;138:307–314.
- ,,, et al.Diagnostic strategy for patients with suspected pulmonary embolism: a prospective multicentre outcome study.Lancet.2002;260:1914–1920.
- ,,, et al.Diagnosing pulmonary embolism in outpatients with clinical assessment, D‐dimer measurement, venous ultrasound, and helical computed tomography: a multicenter management study.Am J Med.2004;116:291–299.
- ,,, et al.Clinical validity of a negative computed tomography scan in patients with suspected pulmonary embolism: a systematic review.JAMA.2005;293:2012–2017.
- ,,,.Meta‐analysis: outcomes in patients with suspected pulmonary embolism managed with computed tomographic pulmonary angiography.Ann Intern Med.2004;141:866–874.
- ,.Clinical Practice: The evaluation of suspected pulmonary embolism.N Engl J Med.2003;349:1247–1256.
- ,,, et al.Use of a clinical model for safe management of patients with suspected pulmonary embolism.Ann Intern Med.1998;129:997–1005.
- ,,.A structured clinical model for predicting the probability of pulmonary embolism.Am J Med.2003;114(3):173–179.
- ,,,,.Assessing clinical probability of pulmonary embolism in the emergency ward: a simple score.Arch Intern Med.2001;161(1):92–97.
- ,,,.Interpretation of diagnostic tests and strategies for their use in quantitative decision making. In:Diagnostic strategies for common medical problems.Philadelphia, PA:American College of Physicians,1999.
- ,,,.Strategy for diagnosis of patients with suspected acute pulmonary embolism.Chest.1993;103:1553–1559.
- ,,, et al.Prospective comparison of helical CT with angiography in pulmonary embolism: global and selective vascular territory analysis. Interobserver agreement.Eur Radiol.2003;13:823–829.
- ,.Prevalence of acute pulmonary embolism among patients in a general hospital and at autopsy.Chest.1995;108:978–981.
- ,,, et al.Performance of helical computed tomography in unselected outpatients with suspected pulmonary embolism.Ann Intern Med.2001;135(2):88–97.
- Value of the ventilation/perfusion scan in acute pulmonary embolism. Results of the prospective investigation of pulmonary embolism diagnosis (PIOPED).The PIOPED Investigators.JAMA.1990;263:2753–2759.
- ,,, et al.Excluding pulmonary embolism at the bedside without diagnostic imaging: management of patients with suspected pulmonary embolism presenting to the emergency department by using a simple clinical model and d‐dimer.Ann Intern Med.2001;135(2):98–107.
- ,,, et al.Comparison of two clinical prediction rules and implicit assessment among patients with suspected pulmonary embolism.Am J Med.2002;113(4):269–275.
- ,,, et al.Does this patient have pulmonary embolism?JAMA.2003;290:2849–2858.
- ,,,,.Diagnostic strategies for excluding pulmonary embolism in clinical outcome studies. A systematic review.Ann Intern Med.2003;138:941–951.
- ,,, et al.D‐dimer for the exclusion of acute venous thrombosis and pulmonary embolism: a systematic review.Ann Intern Med.2004;140:589–602.
- .Multislice computed tomography for pulmonary embolism—a technological marvel.N Engl J Med2005;352(17):1812–4.
- ,,,,,.Systematic review and meta‐analysis of strategies for the diagnosis of suspected pulmonary embolism.Br Med J.2005;331:259.
Spiral computed tomographic pulmonary angiography (CTPA) is a common first‐line test for the evaluation of suspected pulmonary embolism (PE). At our institution CTPA became the initial diagnostic study in 83% of patients with suspected PE within 3 years of the introduction of CT,1 and by 2001 CTPA had become the most common diagnostic test performed nationwide in patients diagnosed with PE.2 Most scans are interpreted as either positive or negative for pulmonary embolism, providing clinicians with a greater sense of diagnostic certainty than with the probabilistic results of lung scintigraphy. Initial studies of CTPA supported this appearance of diagnostic certainty, reporting sensitivity and specificity of greater than 90%,3, 4 but several subsequent studies have failed to reproduce these results.57 Newer multidetector CT scans are believed to be more accurate than earlier single‐detector CT,8 but true estimates of CTPA test characteristics will not be known until publication of the forthcoming PIOPED II study.9
Even without these data, CT‐based diagnostic algorithms have already appeared.1014 These algorithms generally focus on minimizing the false‐negative rate through use of serial testing (involving combinations of serum D‐dimer, lower‐extremity ultrasound, and CTPA). A recent meta‐analysis demonstrated that negative CTPA is highly accurate at ruling out PE, with test characteristics similar to conventional pulmonary angiography.15 Another meta‐analysis found that the 3‐month rate of subsequent venous thromboembolism after negative CTPA was 1.4% (95% CI 1.1%‐1.8%),16 supporting the strategy of withholding anticoagulants after negative CTPA in combination with other tests. However, use of serial testing to establish the diagnosis of PE and initiate anticoagulation has not been systematically evaluated or recommended, even for patients with a low pretest probability of PE.17
To assess the potential impact of these algorithms on the diagnosis of PE in clinical practice, we analyzed the clinical presentation and treatment of a cohort of patients at our institution who underwent CTPA for suspected PE.1 We calculated a range of posttest probabilities for pulmonary embolism for these patients, given the pretest probabilities, test results, and estimates of CTPA test characteristics. We then compared the treatment decisions of clinicians to the posttest probabilities of PE in order to establish the potential frequency of false‐positive and false‐negative diagnoses and to determine if patients were treated appropriately based on these estimates.
METHODS
Sites and Subjects
Details of the sites, subjects, and methods used to collect patient‐level data in this analysis have been previously published.1 The study was performed at Moffitt‐Long Hospital and San Francisco General Hospital, teaching hospitals affiliated with the University of California San Francisco School of Medicine. At both sites, single‐detector CT scans were available 24 hours a day throughout the study period and were read by attending radiologists who specialized in thoracic imaging. We excluded patients whose CTPA was not completed as the initial test in the evaluation of suspected PE, those who underwent testing for any indication other than suspected acute PE, and those with incomplete medical records or technically inadequate CTPA.
We randomly selected 345 patients who underwent CTPA between January 1, 1998, and December 31, 2000, from the Radiology Department databases. One investigator (R.L.T.) then abstracted charts of all patients. For each subject, we collected data about history and clinical presentation, diagnostic impressions of the treating clinicians, treatments administered both before and after diagnostic testing, CTPA result, results of other diagnostic tests for PE, and final clinical diagnosis. During the study period, there were no institution‐ or department‐specific guidelines or decision aids available for the diagnosis of PE. Ventilation‐perfusion scan, lower extremity ultrasound, and pulmonary angiography were available, but highly sensitive D‐dimer assays were not in use. The study was approved by the Institutional Review Boards of both sites, and requirement for written informed consent from patients was waived.
Estimates of Pretest Probabilities of Pulmonary Embolism and CTPA Test Characteristics
Several prediction rules1820 generate clinical pretest probabilities for patients with suspected PE. We used the Wells score18 to assign a pretest probability of low, moderate, or high to each patient on the basis of the following clinical variables: leg swelling, hemoptysis, tachycardia, history of recent immobilization, history of prior DVT or PE, active malignancy, and lack of a more likely alternative diagnosis. We chose this rule as (unlike other prediction rules such as the Geneva rule20) the Wells score has been validated for hospitalized patients with suspected PE and does not require arterial blood gas measurements. The prevalence of PE reported in the evaluation of the Wells score was 3.4%, 27.8%, and 78.3% for low, moderate, and high pretest probabilities, respectively.18
As in our previous study,1 we assumed CTPA to be 90% sensitive and 95% specific based on published estimates.3, 17 These values correspond to a positive likelihood ratio of 18 and a negative likelihood ratio of 0.1.21 We chose these values as a best‐case estimate of the test characteristics of CTPA, although other studies have found less impressive results.7 Using these pretest probabilities and likelihood ratios, we then used Bayes' theorem (Figure 1) to calculate the range of expected posttest probabilities of pulmonary embolism.
Calculation of Posttest Probabilities and Comparison to Treatment Outcomes
For each pretest probability category, we used the posttest probabilities calculated above to determine the number of true‐positive pulmonary emboli, as follows:
RESULTS
Patient Characteristics
After excluding 23 patients receiving anticoagulants for other indications prior to CTPA, the study cohort included 322 patients (57.7% female), with an average age of 58.6 years, of whom 20.5% had cancer and 4.5% had a prior history of thromboembolic disease. Scans were primarily ordered by the medicine service (47.7% of cases) and emergency department (22.9%). CTPA was the initial test for 9% of patients evaluated for suspected acute PE during the first 6 months of the study period, increasing to 83% by the end of 2000.1 The overall pretest probability distribution remained the same throughout the entire study period.1
Test Results and Treatment Decisions
Most patients in our cohort had a low (n = 184, 57.1%) or a moderate (n = 101, 31.4%) pretest probability of PE (Table 1). The likelihood of a positive CTPA increased as the pretest probability increased, but even among patients with high clinical risk, only 35.1% had positive CT scans. In total, scans were positive in 57 patients and negative in 265 patients. Clinicians treated 55 patients with a positive CTPA (96.5%); none of these patients underwent additional testing for DVT or PE after the imaging study. Among patients with a negative CTPA, 254 (95.8%) were not treated; none of the patients in whom anticoagulation was withheld underwent further testing, whereas the other 11 patients were treated on the basis of other tests (5 high‐probability ventilation‐perfusion scans, 3 positive leg ultrasounds, and 3 for unclear reasons). Overall, 66 patients (20.5%) were treated for pulmonary embolism.
| Pretest probability of PE (number of CTPA performed) | Low (N = 184) | Moderate (N = 101) | High (N = 37) | Total (N = 322) |
|---|---|---|---|---|
| ||||
| CTPA positive for PE (% of pretest probability group) | 22 (12.0%) | 22 (21.8%) | 13 (35.1%) | 57 (17.7%) |
| CTPA negative for PE (% of pretest probability group) | 162 (88.0%) | 79 (78.2%) | 24 (64.9%) | 265 (82.3%) |
| Patients with positive CT subsequently treated for PE (% of pretest probability group) | 21 (11.4%) | 21 (20.8%) | 13 (35.1%) | 55 (17.1%) |
| Patients treated for PE despite negative CT (% of pretest probability group) | 5 (2.7%) | 3 (3.0%) | 3 (8.1%) | 11 (3.4%) |
| Total patients treated for PE (% of pretest probability group) | 26 (14.1%) | 24 (23.8%) | 16 (43.2%) | 66 (20.5%) |
Literature‐Derived Estimates of Posttest Probabilities of Pulmonary Embolism
Patients who have a low pretest probability of PE and a positive CTPA have a posttest probability of 41.6% under our estimate of CTPA test characteristics. Patients with moderate pretest probability have a posttest probability of 87.4% and patients with a high pretest probability will have a 98.5% probability of embolism with a positive scan. The traditional treatment threshold for PE is a posttest probability of 90%.22
Observed Versus Expected PE Rates and Subsequent Treatment
Only 9 of the 22 patients (41%) with a low pretest probability and a positive CTPA likely represent true‐positive emboli. However, clinicians chose to treat 21 of the 22 patients with this combination of pretest probability and imaging findings. Thus, 12 emboli would be considered possible false‐positive diagnoses. Similarly, in the moderate pretest probability group, 2 of 21 patients with moderate pretest probability and 0 of 13 patients with high pretest probability treated for PE had a possibly false‐positive diagnosis. Thus, in total, 25.4% (14 of 55) patients treated for PE had a possible false‐positive diagnosis of pulmonary embolism and may have been unnecessarily administered anticoagulants (Table 2). All patients who potentially had a false‐positive PE had either a low or moderate pretest probability of PE; in fact, the majority (57.1%) of patients with a low pretest probability of PE who were subsequently treated for PE likely had a false‐positive diagnosis.
| Pretest probability | ||||
|---|---|---|---|---|
| Low (n = 184) | Moderate (n = 101) | High (n = 37) | Total (n = 322) | |
| ||||
| CTPA positive for PE (% of pretest probability group) | 22 (12.0%) | 22 (21.8%) | 13 (35.1%) | 57 (17.7%) |
| Patients with positive CTPA treated for pulmonary embolism (n, % treated in risk group) | 21 (95.4%) | 21 (95.4%) | 13 (100%) | 55 (96.5%) |
| Calculated number and rate of probable true‐positive evaluations | ||||
| Number of true‐positive PE (n, % treated in risk group) | 9 (42.9%) | 19 (90.5%) | 13 (100%) | 41 (74.6%) |
| Calculated number and rate of possible false‐positive evaluations | ||||
| Number of possible false‐positive PE (n, % in risk group with unexpected PE) | 12 (58.1%) | 2 (9.5%) | 0 | 14 (25.4%) |
Clinicians were more likely to overtreat a patient with a possible false‐positive CT scan than to withhold treatment from a patient with a possible false‐negative diagnosis. Using the same estimates of CTPA test characteristics, the incidence of possible false‐negative diagnosis of PE was 1.6% (4 possible false‐negative diagnoses among 254 patients with negative CTPA results who were not treated for PE.) All these patients had a high pretest probability of PE.
DISCUSSION
Physicians at our institution regarded CTPA results as definitive, anticoagulating 96.5% of patients with a positive CT and withholding treatment in 95.8% of patients with a negative scan. This practice pattern may result in unnecessary anticoagulation of many patients with a low pretest probability of PE who may have had false‐positive CTPA findings. In contrast, the rate of possible false‐negative diagnosis of PE was low, consistent with the results of several other studies.16
The use of CTPA is likely to increase because of the publication of multiple algorithms advocating that CTPA be the chief imaging study used in the diagnosis of PE.1014 These algorithms recommend serial testing on patients with a negative CTPA in order to minimize the false‐negative rate, but they do not require systematic follow‐up in patients with a positive scan, even if the pretest probability was low. In management trials, this approach resulted in a low false‐negative rate (1.0%‐1.8% at 3‐month follow‐up).1114 However, the rate of major bleeding in patients treated for PE was 3.2%‐6.0% at 3 months,1214 illustrating the potential risk of anticoagulating patients who may have false‐positive diagnoses. Furthermore, premature diagnostic closure after a CTPA positive for PE may result in additional morbidity as a result of missing the true diagnosis.
One potential explanation for the large number of potential false‐positive emboli seen in low‐risk patients is that it is difficult to accurately diagnose distal pulmonary emboli with CTPA. The interrater reliability of CTPA for diagnosis of subsegmental PE is suboptimal,23 and the clinical significance of these emboli remains uncertain.24 Thus, many emboli found in patients with low pretest probability actually may have been subsegmental PE that would not have been diagnosed by another radiologist. As CTPA is more accurate for diagnosing central PE,25 clinicians should consider reviewing positive scans with the interpreting radiologist, especially when the pretest probability was low and the filling defects identified are in distal vessels.
Our results may also illustrate that clinicians have a lower treatment threshold when presented with apparently definitive evidence of pulmonary embolism. Previous proposals on the appropriate treatment threshold for PE, which used Bayesian decision‐making methods similar to ours,22 incorporated PIOPED26 data on the pretest probability of pulmonary embolism, the test characteristics of ventilation‐perfusion scans, and the clinical outcomes of patients in each test result/pretest probability category. However, there is no corresponding data for CTPA, as its test characteristics are still uncertain, and long‐term clinical outcomes have not been documented for patients treated (or not treated) on the basis of CT results.
Our study had several limitations. First, charting bias potentially was introduced by our using a retrospective method of collecting data for calculating pretest probabilities. To address this potential bias, we collected data from the entire medical record, including information available at and preceding the time of the CT scan. We believe this method was effective, as the range of pretest probabilities and the prevalence of PE in our study were very similar to those seen in a number of prospective studies.1820, 26, 27 Although other risk indices exist, the Wells score has been shown to have predictive powers equal to other algorithms and to clinicians; implicit assessments.28, 29 In our cohort, 35.1% of patients with a high pretest probability were diagnosed with PE; although this was lower than that in the initial Wells cohort,18 it was very similar to a subsequent validation study using the Wells algorithm, in which the prevalence of PE in patients with high pretest probability was 37.5%.27 Plasma D‐dimer testing is not routinely used at our hospitals, but it is a component of some CTPA‐based diagnostic algorithms.1114 Although use of D‐dimer testing may have led to fewer scans in patients with negative D‐dimer test results and low pretest probability,30 the high false‐positive rate for D‐dimer assays31 makes it difficult to predict the effect of widespread D‐dimer use on the overall pretest probability distribution. Using our assumptions about CT test characteristics, a pretest probability of more than 30% is required to generate a posttest probability of PE of at least 90% (the traditional treatment threshold for anticoagulant therapy22) with a positive scan. Extensive D‐dimer use would be unlikely to cause such a shift in the distribution of pretest probabilities.
Finally, CT technology has continued to advance, and many institutions now use 64‐slice scanners32 in contrast to the single‐slice scanners in use at the time our data were collected. Our assumptions were that CTPA has a positive likelihood ratio of 18.0 and a negative likelihood ratio of 0.1 (corresponding to a sensitivity of 90% and a specificity of 95%), although many studies of single‐detector CTPA found less impressive values.5, 7 Multidetector CT is thought to be more accurate than was earlier technology, but the true diagnostic performance of multidetector CT is not yet known. However, our findings pertain primarily to clinicians' responses to test results, so even if newer scanners are more accurate, Bayesian analysis will still be required in order to appropriately treat patients. A recent meta‐analysis of diagnostic strategies for PE found CTPA to have a positive likelihood ratio of 24.1, but even using this higher value, patients with a low pretest probability and positive CTPA still have a posttest probability of PE below the traditional treatment threshold.33 As most patients undergoing evaluation for suspected PE have a low pretest probability,17 a substantial number of false‐positive diagnoses of PE may still occur, even with a more accurate diagnostic test.
CT pulmonary angiography has become the first‐line test for pulmonary embolism at our institution, a situation likely mirrored elsewhere. CTPA is safe and rapid and offers the advantage of revealing ancillary lung findings that may be clinically significant.12 Although the test is an important addition to a clinician's diagnostic armamentarium, Bayesian analysis must be used to interpret its results, especially when CTPA is used as the first‐line diagnostic test. Our data raise the troubling concern that reliance on CTPA as the sole diagnostic test for suspected pulmonary embolism may result in a large number of patients with false‐positive CT scans receiving anticoagulation treatment.
- ,,,,.The impact of helical computed tomography on diagnostic and treatment strategies in patients with suspected pulmonary embolism.Am J Med.2004;116:84–90.
- ,,.Trends in the use of diagnostic imaging in patients hospitalized with acute pulmonary embolism.Am J Cardiol.2004;93:1316–1317.
- ,,,.Central pulmonary thromboembolism: diagnosis with spiral volumetric CT with the single‐breath‐old technique—comparison with pulmonary angiography.Radiology.1992;185:381–387.
- ,,, et al.Pulmonary embolism: validation of spiral CT angiography in 149 patients.Radiology.1996;201:467–470.
- ,,,,.Lung scintigraphy and helical computed tomography for the diagnosis of pulmonary embolism: a meta‐analysis.Clin Appl Thromb Hemost.2001;7(2):87–92.
- ,,,.The role of spiral volumetric computed tomography in the diagnosis of pulmonary embolism.Arch Intern Med.2000;160(3):293–298.
- ,,.Sensitivity and specificity of helical computed tomography in the diagnosis of pulmonary embolism: a systematic review.Ann Intern Med.2000;132(3):227–232.
- ,,, et al.Suspected acute pulmonary embolism: evaluation with multi‐detector row CT versus digital subtraction pulmonary arteriography.Radiology.2004;233:806–815.
- ,,,.Overview of Prospective Investigation of Pulmonary Embolism Diagnosis II.Semin Nucl Med.2002;32(3):173–182.
- ,,, et al.Management of suspected pulmonary embolism (PE) by D‐dimer and multi‐slice computed tomography in outpatients: an outcome study.J Thromb Haemost.2005;3:1926–1932.
- ,,, et al.Multidetector‐row computed tomography in suspected pulmonary embolism.N Engl J Med.2005;352:1760–1768.
- ,,, et al.Single‐detector helical computed tomography as the primary diagnostic test in suspected pulmonary embolism: a multicenter clinical management study of 510 patients.Ann Intern Med.2003;138:307–314.
- ,,, et al.Diagnostic strategy for patients with suspected pulmonary embolism: a prospective multicentre outcome study.Lancet.2002;260:1914–1920.
- ,,, et al.Diagnosing pulmonary embolism in outpatients with clinical assessment, D‐dimer measurement, venous ultrasound, and helical computed tomography: a multicenter management study.Am J Med.2004;116:291–299.
- ,,, et al.Clinical validity of a negative computed tomography scan in patients with suspected pulmonary embolism: a systematic review.JAMA.2005;293:2012–2017.
- ,,,.Meta‐analysis: outcomes in patients with suspected pulmonary embolism managed with computed tomographic pulmonary angiography.Ann Intern Med.2004;141:866–874.
- ,.Clinical Practice: The evaluation of suspected pulmonary embolism.N Engl J Med.2003;349:1247–1256.
- ,,, et al.Use of a clinical model for safe management of patients with suspected pulmonary embolism.Ann Intern Med.1998;129:997–1005.
- ,,.A structured clinical model for predicting the probability of pulmonary embolism.Am J Med.2003;114(3):173–179.
- ,,,,.Assessing clinical probability of pulmonary embolism in the emergency ward: a simple score.Arch Intern Med.2001;161(1):92–97.
- ,,,.Interpretation of diagnostic tests and strategies for their use in quantitative decision making. In:Diagnostic strategies for common medical problems.Philadelphia, PA:American College of Physicians,1999.
- ,,,.Strategy for diagnosis of patients with suspected acute pulmonary embolism.Chest.1993;103:1553–1559.
- ,,, et al.Prospective comparison of helical CT with angiography in pulmonary embolism: global and selective vascular territory analysis. Interobserver agreement.Eur Radiol.2003;13:823–829.
- ,.Prevalence of acute pulmonary embolism among patients in a general hospital and at autopsy.Chest.1995;108:978–981.
- ,,, et al.Performance of helical computed tomography in unselected outpatients with suspected pulmonary embolism.Ann Intern Med.2001;135(2):88–97.
- Value of the ventilation/perfusion scan in acute pulmonary embolism. Results of the prospective investigation of pulmonary embolism diagnosis (PIOPED).The PIOPED Investigators.JAMA.1990;263:2753–2759.
- ,,, et al.Excluding pulmonary embolism at the bedside without diagnostic imaging: management of patients with suspected pulmonary embolism presenting to the emergency department by using a simple clinical model and d‐dimer.Ann Intern Med.2001;135(2):98–107.
- ,,, et al.Comparison of two clinical prediction rules and implicit assessment among patients with suspected pulmonary embolism.Am J Med.2002;113(4):269–275.
- ,,, et al.Does this patient have pulmonary embolism?JAMA.2003;290:2849–2858.
- ,,,,.Diagnostic strategies for excluding pulmonary embolism in clinical outcome studies. A systematic review.Ann Intern Med.2003;138:941–951.
- ,,, et al.D‐dimer for the exclusion of acute venous thrombosis and pulmonary embolism: a systematic review.Ann Intern Med.2004;140:589–602.
- .Multislice computed tomography for pulmonary embolism—a technological marvel.N Engl J Med2005;352(17):1812–4.
- ,,,,,.Systematic review and meta‐analysis of strategies for the diagnosis of suspected pulmonary embolism.Br Med J.2005;331:259.
Copyright © 2006 Society of Hospital Medicine
