User login
Deimplementation of Routine Chest X-rays in Adult Intensive Care Units
Despite increased awareness of Choosing Wisely (CW)® recommendations to reduce low-value care,1 there is limited published data about strategies to implement these guidelines or evidence that they have influenced ordering patterns or reduced healthcare spending
In ICUs, CXR ordering strategies may be routine (daily) or on-demand (with clinical indication). The former strategy’s principal advantage is the potential to detect life-threatening situations that may otherwise escape diagnosis.11 Disadvantages include cost, radiation exposure, patient inconvenience, false-positive workups, and low diagnostic and therapeutic value.12,13 On-demand strategies may safely reduce CXR ordering by 32% to 45%.11-17 Based on this evidence, the Critical Care Societies Collaborative and the American College of Radiology have recommended on-demand CXR ordering.18,19 Here, we describe the effectiveness of an intervention to reduce CXR ordering in two ICUs while evaluating the deimplementation strategies using a validated framework.
METHODS
Setting and Design
Vanderbilt University Medical Center (VUMC) is an academic referral center in Nashville, Tennessee. The cardiovascular ICU (CVICU) has 27 beds and the medical ICU (MICU) has 34 beds. Acute care nurse practitioners (ACNPs) and two critical care physicians staff the CVICU; cardiology fellows, anesthesia critical care fellows, and transplant and cardiac surgeons are also active in patient care. The MICU is staffed by two critical care physicians who supervise one team of ACNPs and two teams of medical residents who rotate through the unit every two weeks. Each MICU team is assigned a fellow in pulmonary and critical care.
We conducted a prospective, nonrandomized study in these units from October 2015 to June 2016. The VUMC Institutional Review Board approved the intervention as a quality improvement (QI) activity, waiving the requirement for informed consent.
Intervention
Following the top CW recommendation of the Critical Care Societies Collaborative—“Don’t order diagnostic tests at regular intervals (such as every day), but rather in response to specific clinical questions.”19—the VUMC resident-led CW Steering Committee designed a multifaceted approach to reduce ordering of routine CXRs in ICUs. The intervention included a didactic session on CW and proper CXR ordering practices, peer champions, data audits, and feedback to providers through weekly e-mails (see Supplemental Materials, 1 – Resident Presentation and 2 – CXR Flyer). 20
In September 2015, CVICU and MICU teams received a didactic session highlighting CW, current CXR ordering rates, and the plan for reducing CXR ordering. On October 5, 2015, teams began receiving weekly e-mails with ordering rates defined as CXRs ordered per patient per day and a brief rationale for reducing unnecessary CXRs. To encourage friendly competition, we provided weekly rates to the MICU teams, allowing for transparent benchmarking against one another. A similar competition strategy was not used in the CVICU due to the lack of multiple teams.
In the CVICU, two ACNPs volunteered as peer champions. These champions coordinated data feedback and advocated for the intervention among their colleagues. In the MICU, three internal medicine residents volunteered as peer champions and fulfilled similar roles.
To facilitate deimplementation, we conducted two Plan-Do-Study-Act (PDSA) cycles, the first from November to mid-December 2015 and the second from mid-December 2015 to mid-January 2016. During these cycles, we tailored our deimplementation strategy based on barriers identified by the peer champions and ICU leaders (described in the Qualitative Results section). Peer champions and the CW Steering Committee generated potential solutions by conversing with stakeholders and using the Expert Recommendations for Implementing Change (ERIC).20 Interventions included disseminating promotional flyers, holding meetings with stakeholders, and providing monthly CXR ordering rates. After the PDSA cycles, we continued reexamining the deimplementation efforts by reviewing ordering rates and soliciting feedback from ICU leaders and peer champions. However, no significant changes to the intervention were made during this time.
Quantitative Evaluation
We extracted data from VUMC’s Enterprise Data Warehouse during the intervention period (October 5, 2015 to May 24, 2016) and a historical control period (October 1, 2014 to October 4, 2015). Within each ICU, descriptive statistics were used to compare patient cohorts in the baseline and intervention periods by age, sex, and race.
The primary outcome was CXRs ordered per patient per day by hospital unit (CVICU or MICU). The baseline period included all data between October 1, 2014 and September 15, 2015. To account for priming of providers from didactic education, we allowed a washout period from September 16, 2015 to October 4, 2015. As a preliminary analysis, we compared CXR rates in the baseline and intervention periods using Wilcoxon rank-sum tests. We then conducted interrupted time-series analyses with segmented linear regression to assess differences in linear trends in CXR rates over the two periods. To account for different staffing models in the MICU, we stratified the impact of the intervention by team—medical resident (physician) or ACNP. R version 3.4.0 was used for statistical analysis.21
Qualitative Evaluation
Our qualitative evaluation consisted of embedded observation and semistructured interviews with stakeholders. The qualitative portion was guided by the Consolidated Framework for Implementation Research (CFIR), a widely used framework for design and evaluation of improvement initiatives that helped us to determine major facilitators and barriers to implementation.22,23
Embedded Observation
From November 2015 to January 2016, we observed morning rounds in the CVICU and MICU one to two times weekly to understand factors facilitating and inhibiting uptake of the intervention. Observations were recorded and organized using a CFIR-based template and directed toward understanding interactions among team members (eg, the decision-making process hierarchy), team workflows and decision-making processes, process of ordering CXRs, and providers’ knowledge and perceptions of the CXR intervention (see Supplemental Material, 3 – CFIR Table).22,23 After rounds, ICU team members were invited to share suggestions for improving the intervention. All observations occurred during and shortly following morning rounds when the vast majority of routine CXRs are ordered; we did not evaluate night or evening workflows. In the spirit of continuous improvement, we evaluated data in real-time.
Semistructured Interviews
Based on the direct observations, we developed semistructured interview questions to further evaluate provider perspectives (eg, “Do you believe ICU patients need a daily CXR?”) and constructs aligning with CFIR (eg, “intervention source—internally vs externally developed;” see Supplemental Material, 4 – Interview Questions).
Stakeholders from both ICUs were recruited through e-mail and in-person requests to participate in semistructured interviews. In the CVICU, we interviewed critical care physicians, anesthesia critical care fellows, and ACNPs. In the MICU, we interviewed medical students, interns, residents, critical care fellows, attending intensivist physicians, and ACNPs. We also interviewed X-ray technologists who routinely perform portable films in the units.
RESULTS
Quantitative Results

Cardiovascular Intensive Care Unit
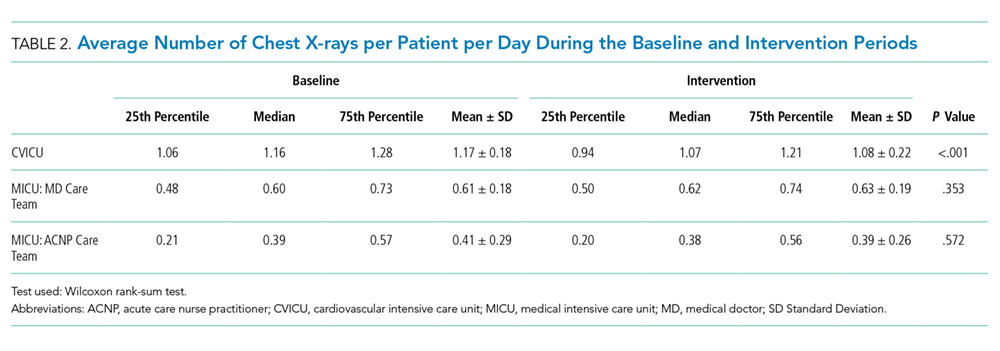
The median baseline CXR ordering rate in the CVICU was 1.16 CXRs per patient per day, with interquartile range (IQR) 1.06-1.28. During the intervention period, the rate dropped to 1.07 (IQR 0.94-1.21; P < .001; Table 2). The time-series analysis suggested an essentially flat trend during the baseline period, followed by a small but significant drop in ordering rates during the intervention period (P < .001; Table 3 and Figure 1). Ordering rates appeared to increase slightly over the course of the intervention period, but this slight upward trend was not significantly different from the flat trend seen during the baseline period.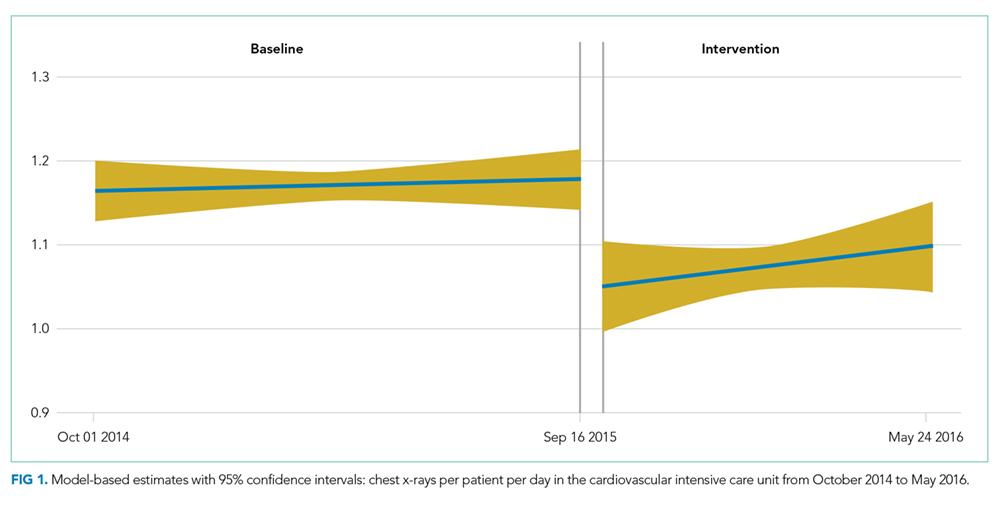
Medical Intensive Care Unit
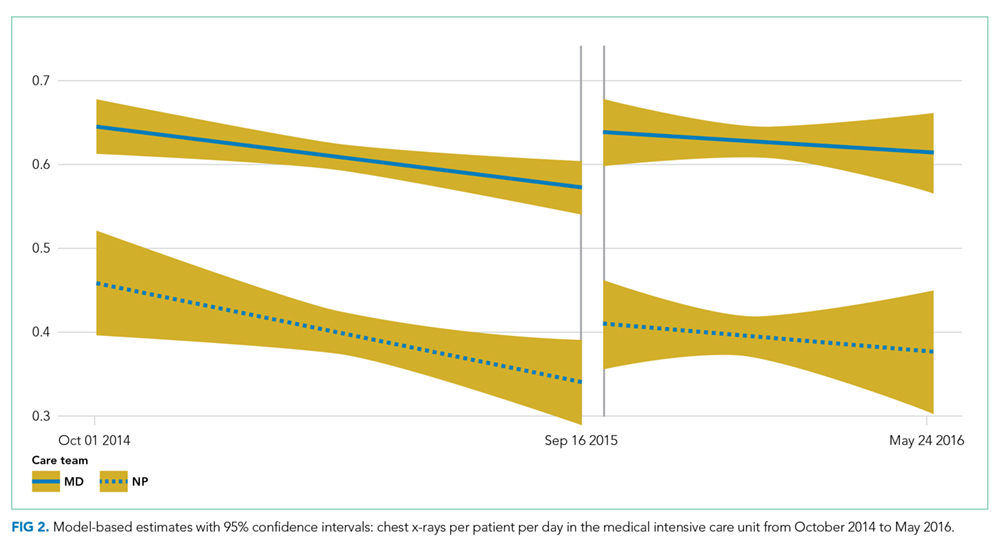
For both physician and ACPN teams, the median baseline CXR ordering rates in the MICU were much lower than the baseline rate in the CVICU (Table 2). For the MICU physician care team, the baseline CXR ordering rate was 0.60 CXRs per patient per day (IQR 0.48-0.73). For the ACNP team, the median rate was 0.39 CXRs per patient per day (IQR 0.21-0.57). Both rates stayed approximately the same during the intervention period (Table 2). The time-series analysis suggested a statistically significant but very slight downward trend in CXR ordering rates during the baseline period, in the physician (P = .011) and ACNP (P = .022) teams (Table 3, Figure 2). Under this model, a small increase in CXR ordering initially occurred during the intervention period for both physician and ACNP teams (P = .010 and P = .055, respectively), after which the rates declined slightly. Trends in ordering rates during the intervention period were not significantly different from the slight downward trends seen during the baseline period.
Qualitative Results
We identified 25 of 39 CFIR constructs as relevant to the initiative (see Supplemental Materials, 3 – CFIR Table.) We determined the major facilitators of deimplementation to be peer champion discussions about CXR ordering on rounds and weekly data feedback, particularly if accompanied by in-person follow-up.
We also noted differences in CXR ordering rationales and decisions between the units. Generally, residents in the MICU and ACNPs in the CVICU made decisions to order CXRs. However, decisions were influenced by the expectations of attending physicians. While CVICU providers tended to order CXRs reflexively as part of morning labs, MICU providers—in particular, ACNPs who had been trained on indications for proper CXR ordering—generally ordered CXRs for specific indications (eg, worsening respiratory status). Of note, MICU ACNPs reported the use of bedside ultrasound as an alternate imaging modality and a reason for their higher threshold to order CXRs.
Deimplementation barriers in both units included the need to identify goal CXR ordering rates and the intervention’s limited visibility. To address these barriers, we conducted PDSA cycles and used the CFIR and ERIC to generate potential solutions.24 We established a goal of a 20% absolute reduction in the CVICU, added monthly CXR rates to weekly e-mail reports to better account for variations in patient populations and ordering practices, and circulated materials to promote on-demand CXR ordering. Promotional materials contained guidelines on CXR ordering and five “Frequently Held Misconceptions” about ordering practices with succinct, evidence-based explanations (see Supplemental Material, 2 – CXR Flyer).
Approximately four months after the start of intervention, some CVICU physicians became concerned that on-demand CXR ordering might be inappropriate for high-risk surgical patients, including those who are undergoing or have undergone heart transplants, lung transplants, or left-ventricular assist device placement. This concern arose following two adverse outcomes, which were not attributed to the CXR initiative, but which heightened concerns about patient safety. A rise in CXR ordering then occurred, and CVICU providers requested that we perform an analysis of these high-risk groups. While segmented linear regression in this subgroup suggested that average daily CXR ordering rates did decrease among the high-risk group at the start of the intervention period (P = .001), the difference between the rates in the two periods was not significant using the Wilcoxon rank-sum test. Exclusion of these patients from the main analysis did not alter the interpretation of the findings reported above for the CVICU.
DISCUSSION
A deimplementation intervention using provider education, peer champions, and data feedback was associated with fewer CXRs in the CVICU (P < .001) but not in the MICU. The CFIR-guided qualitative analysis was valuable for evaluating our deimplementation strategy and for identifying differences between the two ICUs.
Relatively few studies have demonstrated effective interventions that address CW recommendations.25-28 However, three population-level analyses of insurance claims show mixed results.3,4,29 Experts have thus proposed using implementation science to improve uptake of CW recommendations.2,3,7,8 Our study demonstrates the effectiveness of this approach. As expected, providers largely endorsed an on-demand CXR ordering strategy. Using the CFIR, however, we discovered barriers (eg, concern that data feedback did not reflect variations in patients’ needs). Using methods from implementation science allowed us to diagnose and tailor our approaches.
Our qualitative evaluation suggested that the intervention was ineffective mostly due to CFIR’s “inner setting” constructs, including resident fatigue, competing priorities, and decreased investment in QI projects because of the rotating nature of providers in training. Baseline CXR ordering rates in the MICU were also considerably lower than in the CVICU. We observed that CVICU providers ordered many CXRs following the placement of lines or tubes and that ACNPs in the MICU had received education on appropriate CXR ordering practices and had access to an alternate imaging modality in ultrasound. These factors may partially explain the difference in baseline rates.
As noted in a study of cardiac stress testing guidelines, the existence of high-value care recommendations does not mean overuse.30 Indeed, the lack of significant CXR over-ordering in the MICU highlights the importance of baseline measurement and partnering with information technology departments to create the best possible data feedback systems.30-32 Our experience shows that these systems should provide sufficient pre-implementation data (ideally >1 year), such that teams selecting QI projects can ensure that a project is a good use of institutional resources and change capital.
To inform future work, we informally assessed program costs and savings. We estimate the initiative cost $1,600, including $1,000 for curriculum development and teaching time, $300 for educational materials, and $300 for CXR tracking dashboard development. Hospital charges and reimbursements for CXR vary widely.33 We calculated savings using a range of rates, from a conservative $23 (the Medicare reimbursement rate for single-view CXR, CPT code 71010, global fee) to $50 (an approximate blended reimbursement rate across payers).34,35 In the CVICU, we estimate that 51 CXRs were avoided each month, saving $1,173-$2,550 per month or $9,384-$20,400 over eight months of follow-up. Annualizing these figures, we estimate net savings of $12,476-$29,000 in the first year in a 27-bed ICU. Costs to continue the program include education of new employees, booster training, and dashboard maintenance for an estimated annual cost of $1,000. It is difficult to estimate effectiveness over time, but if we conservatively assume that 30 CXRs were avoided each month, then the projected savings would be $8,280-$18,000 per year or an annual net savings of $7,280-$17,000 in the ICU. Although these amounts are modest, providing trainees with experiential learning opportunities in high-value care is valuable in its own right, meets curricular goals, may result in spill-over effects to other diagnostic and therapeutic decisions, and may influence long-term practice patterns. Institutional decisions to pursue projects such as this should take into account these potential benefits.
This evaluation is not without limitations. First, the study was conducted in a single tertiary-care hospital, potentially limiting its generalizability.36 Second, the study design lacked a concurrent control group, and observed outcomes may have been influenced by broader CXR utilization trends, increased awareness of low-value care generally or from previous CW projects at VUMC, seasonal effects, or the Hawthorne effect. Third, the study outcome was all CXRs ordered, rather than CXRs that were unnecessary or not clinically indicated. We chose all CXRs because it was more pragmatic, did not require clinical case review, and could be incorporated promptly into dashboards, enabling timely performance feedback. Other performance measures have taken a similar tack (eg, tracking all-cause readmissions rather than preventable readmissions). Given this approach, we did not track clinical indications for CXRs (eg, central line placement). Fourth, although we compared resident and APRN orders, we did not collect data on other provider characteristics such as years in/out of training or board certification status. These considerations should be addressed in future research.
Finally, the increase in CVICU CXR ordering at the end of the intervention period, which occurred following two adverse events, raises concerns about sustainability. While unrelated to CXR orders, the events resulted in increased ordering of diagnostic tests and showed the difficulty of deimplementation in ICUs. Indeed, some CVICU providers argued that on-demand CXR ordering represented minimal potential cost savings and had not been studied among heart and lung transplant patients. Subsequently, Tonna et al. have shown that on-demand CXR ordering can be safely implemented among such patients.37 Also similar to our study, Tonna et al. observed an initial decrease in CXR ordering, followed by a gradual increase toward baseline ordering rates. These findings highlight the need for sustained awareness and interventions and for the careful selection of high-value projects.
In conclusion, our study shows that a deimplementation intervention based on CW recommendations can reduce CXR ordering and that ongoing evaluation of contextual factors provides insights for both real-time modifications of current interventions and the design of future interventions. We found that messaging about reducing unnecessary tests works well when discussions are framed at the unit level but may be counterproductive if used to question individual ordering decisions.38 Additional lessons learned include the value of participation on rounds to build trust among stakeholders, the utility of monthly rather than weekly statistics for feedback, stakeholder input and peer champions, and differences in approach with physician and ACNP audiences.
Acknowledgments
The authors thank the VUMC Choosing Wisely committee; Mr. Bill Harrell in Advanced Data Analytics for developing the Tableau platform used in our data feedback strategy; Emily Feld, MD, Jerry Zifodya, MD, and Ryan Kindle, MD for assisting with data feedback to providers in the MICU; Todd Rice, MD, Director of the MICU, for his support of the initiative; and Beth Prusaczyk, PhD, MSW and David Stevenson, PhD for providing feedback on earlier drafts of this manuscript.
Disclosures
Dr. Kripalani reports personal fees from Verustat, personal fees from SAI Interactive, and equity from Bioscape Digital, outside the submitted work. All other authors have nothing to disclose.
Funding
This work was supported by an Innovation Grant from the Alliance for Academic Internal Medicine (AAIM, 2016) and by the Departments of Internal Medicine and Graduate Medical Education at Vanderbilt University Medical Center. The AAIM did not have a role in the study design, data collection, data analysis, data interpretation, or manuscript writing.
1. Cassel CK, Guest JA. Choosing Wisely: Helping physicians and patients make smart decisions about their care. JAMA. 2012;307(17):1801-1802.
2. Gonzales R, Cattamanchi A. Changing clinician behavior when less is more. JAMA Intern Med. 2015;175(12):1921-1922.
3. Rosenberg A, Agiro A, Gottlieb M, et al. Early trends among seven recommendations from the Choosing Wisely campaign. JAMA Intern Med. 2015;175(12):1913-1920.
4. Hong AS, Ross-Degnan D, Zhang F, Wharam JF. Small decline in low-value back imaging associated with the ‘Choosing Wisely’ campaign, 2012-14. Health Aff (Millwood). 2017;36(4):671-679. doi: 10.1377/hlthaff.2016.1263.
5. Parks AL, O’Malley PG. From choosing wisely to practicing value—more to the story. JAMA Intern Med. 2016;176(10):1571-1572.
6. Johnson PT, Pahwa AK, Feldman LS, Ziegelstein RC, Hellmann DB. Advancing high-value health care: a new AJM column dedicated to cost-conscious care quality improvement. Am J Med. 2017;130(6):619-621. doi: 10.1016/j.amjmed.2016.12.018.
7. Eccles MP, Mittman BS. Welcome to implementation science. Implement Sci. 2006;1:1. doi: 10.1186/1748-5908-1-1.
8. Bhatia RS, Levinson W, Shortt S, et al. Measuring the effect of Choosing Wisely: an integrated framework to assess campaign impact on low-value care. BMJ Qual Saf. 2015;24:523-531. doi: 10.1136/bmjqs-2015-004070.
9. Selby K, Barnes GD. Learning to de-adopt ineffective healthcare practices. Am J Med. 2018;131(7):721-722. doi: 10.1016/j.amjmed.2018.03.014.
10. Curran GM, Bauer M, Mittman B, Pyne JM, Stetler C. Effectiveness-implementation hybrid designs. Med Care. 2012;50(3):217-226. doi: 10.1097/MLR.0b013e3182408812.
11. Ganapathy A, Adhikari NK, Spiegelman J, Scales DC. Routine chest x-rays in intensive care units: a systematic review and meta-analysis. Crit Care. 2012;16(2):R68. doi: 10.1186/cc11321.
12. Graat ME, Kröner A, Spronk PE, et al. Elimination of daily routine chest radiographs in a mixed medical-surgical intensive care unit. Intensive Care Med. 2007;33(4):639-644. doi: 10.1007/s00134-007-0542-1.
13. Hendrikse KA, Gratama JWC, Ten Hove W, Rommes JH, Schultz MJ, Spronk PE. Low value of routine chest radiographs in a mixed medical-surgical ICU. Chest. 2007;132(3):823-828. doi: 10.1378/chest.07-1162.
14. Clec’h C, Simon P, Hamdi A, et al. Are daily routine chest radiographs useful in critically ill, mechanically ventilated patients? A randomized study. Intensive Care Med. 2008;34(2):264-270. doi: 10.1007/s00134-007-0919-1.
15. Oba Y, Zaza T. Abandoning daily routine chest radiography in the intensive care unit: meta-analysis. Radiology. 2010;255(2):386-395. doi: 10.1148/radiol.10090946.
16. Mets O, Spronk PE, Binnekade J, Stoker J, de Mol BAJM, Schultz MJ. Elimination of daily routine chest radiographs does not change on-demand radiography practice in post-cardiothoracic surgery patients. J Thorac Cardiovasc Surg. 2007;134(1):139-144. doi: 10.1016/j.jtcvs.2007.02.029.
17. Hejblum G, Chalumeau-Lemoine L, Ioos V, et al. Comparison of routine and on-demand prescription of chest radiographs in mechanically ventilated adults: a multicentre, cluster-randomised, two-period crossover study. Lancet. 2009;374(9702):1687-1693. doi: 10.1016/S0140-6736(09)61459-8.
18. McComb BL, Chung JH, Crabtree TD, et al. ACR appropriateness criteria® routine chest radiography. J Thorac Imaging. 2016;31(2):W13-W15. doi: 10.1097/RTI.0000000000000200.
19. Halpern SD, Becker D, Curtis JR, et al. An official American Thoracic Society/American Association of Critical-Care Nurses/American College of Chest Physicians/Society of Critical Care Medicine policy statement: the Choosing Wisely® top 5 list in critical care medicine. Am J Respir Crit Care Med. 2014;190(7):818-826. doi: 10.1164/rccm.201407-1317ST.
20. Powell BJ, Waltz TJ, Chinman MJ, et al. A refined compilation of implementation strategies: Results from the Expert Recommendations for Implementing Change (ERIC) project. Implement Sci. 2015;10:21. doi: 10.1186/s13012-015-0209-1.
21. R [computer program]. Version 3.4.0. Vienna, Austria: R Foundation for Statistical Computing; 2013.
22. Damschroder LJ, Aron DC, Keith RE, Kirsh SR, Alexander JA, Lowery JC. Fostering implementation of health services research findings into practice: a consolidated framework for advancing implementation science. Implement Sci. 2009;4:50. doi: 10.1186/1748-5908-4-50.
23. Kirk MA, Kelley C, Yankey N, Birken SA, Abadie B, Damschroder L. A systematic review of the use of the Consolidated Framework for Implementation Research. Implement Sci. 2016;11:72. doi: 10.1186/s13012-016-0437-z.
24. Speroff T, James BC, Nelson EC, Headrick LA, Brommels M, Reed JE. Guidelines for appraisal and publication of PDSA quality improvement. Qual Manag Health Care. 2014;13(1):33-39. doi: 10.1097/00019514-200401000-00003.
25. Corson AH, Fan VS, White T, et al. A multifaceted hospitalist quality improvement intervention: Decreased frequency of common labs. J Hosp Med. 2015;10(6):390-395. doi: 10.1002/jhm.2354.
26. Ferrari R. Evaluation of the Canadian Rheumatology Association Choosing Wisely recommendation concerning anti-nuclear antibody (ANA) testing. Clin Rheumatol. 2015;34(9):1551-1556. doi: 10.1007/s10067-015-2985-z.
27. Ferrari R, Prosser C. Testing vitamin D levels and choosing wisely. JAMA Intern Med. 2016;176(7):1019-1020.
28. Iams W, Heck J, Kapp M, et al. A multidisciplinary housestaff-led initiative to safely reduce daily laboratory testing. Acad Med. 2016;91(6):813-820. doi: 10.1097/ACM.0000000000001149.
29. Kost A, Genao I, Lee JW, Smith SR. Clinical decisions made in primary care clinics before and after Choosing WiselyTM. J Am Board Fam Med. 2015;28(4):471-474. doi: 10.3122/jabfm.2015.05.140332.
30. Kerr EA, Chen J, Sussman JB, Klamerus ML, Nallamothu BK. Stress testing before low-risk surgery: so many recommendations, so little overuse. JAMA Intern Med. 2015;175(4):645-647. doi: 10.1001/jamainternmed.2014.7877.
31. Colla CH, Morden NE, Sequist TD, Schpero WL, Rosenthal MB. Choosing wisely: prevalence and correlates of low-value health care services in the United States. J Gen Intern Med. 2014;30(2):221-228. doi: 10.1007/s11606-014-3070-z.
32. Shetty KD, Meeker D, Schneider EC, Hussey PS, Damberg CL. Evaluating the feasibility and utility of translating Choosing Wisely recommendations into e-Measures. Healthcare. 2015;3(1):24-37. doi: 10.1016/j.hjdsi.2014.12.002.
33. Woodland DC, Cooper CR, Rashid MF, et al. Routine chest X-ray is unnecessary after ultrasound-guided central venous line placement in the operating room. J Crit Care. 2018;46:13-16. doi: 10.1016/j.jcrc.2018.03.027.
34. Krause TM, Ukhanova M, Revere FL. Private carriers’ physician payment rates compared with Medicare and Medicaid. Tex Med. 2016;112(6):e1.
35. American College of Radiology. Medicare physician fee schedule. Available at https://www.acr.org/Advocacy-and-Economics/Radiology-Economics/Medicare-Medicaid/MPFS. Accessed October 15, 2018.
36. Siegel MD, Rubinowitz AN. Routine daily vs on-demand chest radiographs in intensive care. Lancet. 2009;374(9702):1656-1658. doi: 10.1016/S0140-6736(09)61632-9.
37. Tonna JE, Kawamoto K, Presson AP, et al. Single intervention for a reduction in portable chest radiography (pCXR) in cardiovascular and surgical/trauma ICUs and associated outcomes. J Crit Care. 2018;44:18-23. doi: 10.1016/j.jcrc.2017.10.003.
38. Wolfson D, Santa J, Slass L. Engaging physicians and consumers in conversations about treatment overuse and waste: a short history of the choosing wisely campaign. Acad Med. 2014;89(7):990-995. doi: 10.1097/ACM.0000000000000270.
Despite increased awareness of Choosing Wisely (CW)® recommendations to reduce low-value care,1 there is limited published data about strategies to implement these guidelines or evidence that they have influenced ordering patterns or reduced healthcare spending
In ICUs, CXR ordering strategies may be routine (daily) or on-demand (with clinical indication). The former strategy’s principal advantage is the potential to detect life-threatening situations that may otherwise escape diagnosis.11 Disadvantages include cost, radiation exposure, patient inconvenience, false-positive workups, and low diagnostic and therapeutic value.12,13 On-demand strategies may safely reduce CXR ordering by 32% to 45%.11-17 Based on this evidence, the Critical Care Societies Collaborative and the American College of Radiology have recommended on-demand CXR ordering.18,19 Here, we describe the effectiveness of an intervention to reduce CXR ordering in two ICUs while evaluating the deimplementation strategies using a validated framework.
METHODS
Setting and Design
Vanderbilt University Medical Center (VUMC) is an academic referral center in Nashville, Tennessee. The cardiovascular ICU (CVICU) has 27 beds and the medical ICU (MICU) has 34 beds. Acute care nurse practitioners (ACNPs) and two critical care physicians staff the CVICU; cardiology fellows, anesthesia critical care fellows, and transplant and cardiac surgeons are also active in patient care. The MICU is staffed by two critical care physicians who supervise one team of ACNPs and two teams of medical residents who rotate through the unit every two weeks. Each MICU team is assigned a fellow in pulmonary and critical care.
We conducted a prospective, nonrandomized study in these units from October 2015 to June 2016. The VUMC Institutional Review Board approved the intervention as a quality improvement (QI) activity, waiving the requirement for informed consent.
Intervention
Following the top CW recommendation of the Critical Care Societies Collaborative—“Don’t order diagnostic tests at regular intervals (such as every day), but rather in response to specific clinical questions.”19—the VUMC resident-led CW Steering Committee designed a multifaceted approach to reduce ordering of routine CXRs in ICUs. The intervention included a didactic session on CW and proper CXR ordering practices, peer champions, data audits, and feedback to providers through weekly e-mails (see Supplemental Materials, 1 – Resident Presentation and 2 – CXR Flyer). 20
In September 2015, CVICU and MICU teams received a didactic session highlighting CW, current CXR ordering rates, and the plan for reducing CXR ordering. On October 5, 2015, teams began receiving weekly e-mails with ordering rates defined as CXRs ordered per patient per day and a brief rationale for reducing unnecessary CXRs. To encourage friendly competition, we provided weekly rates to the MICU teams, allowing for transparent benchmarking against one another. A similar competition strategy was not used in the CVICU due to the lack of multiple teams.
In the CVICU, two ACNPs volunteered as peer champions. These champions coordinated data feedback and advocated for the intervention among their colleagues. In the MICU, three internal medicine residents volunteered as peer champions and fulfilled similar roles.
To facilitate deimplementation, we conducted two Plan-Do-Study-Act (PDSA) cycles, the first from November to mid-December 2015 and the second from mid-December 2015 to mid-January 2016. During these cycles, we tailored our deimplementation strategy based on barriers identified by the peer champions and ICU leaders (described in the Qualitative Results section). Peer champions and the CW Steering Committee generated potential solutions by conversing with stakeholders and using the Expert Recommendations for Implementing Change (ERIC).20 Interventions included disseminating promotional flyers, holding meetings with stakeholders, and providing monthly CXR ordering rates. After the PDSA cycles, we continued reexamining the deimplementation efforts by reviewing ordering rates and soliciting feedback from ICU leaders and peer champions. However, no significant changes to the intervention were made during this time.
Quantitative Evaluation
We extracted data from VUMC’s Enterprise Data Warehouse during the intervention period (October 5, 2015 to May 24, 2016) and a historical control period (October 1, 2014 to October 4, 2015). Within each ICU, descriptive statistics were used to compare patient cohorts in the baseline and intervention periods by age, sex, and race.
The primary outcome was CXRs ordered per patient per day by hospital unit (CVICU or MICU). The baseline period included all data between October 1, 2014 and September 15, 2015. To account for priming of providers from didactic education, we allowed a washout period from September 16, 2015 to October 4, 2015. As a preliminary analysis, we compared CXR rates in the baseline and intervention periods using Wilcoxon rank-sum tests. We then conducted interrupted time-series analyses with segmented linear regression to assess differences in linear trends in CXR rates over the two periods. To account for different staffing models in the MICU, we stratified the impact of the intervention by team—medical resident (physician) or ACNP. R version 3.4.0 was used for statistical analysis.21
Qualitative Evaluation
Our qualitative evaluation consisted of embedded observation and semistructured interviews with stakeholders. The qualitative portion was guided by the Consolidated Framework for Implementation Research (CFIR), a widely used framework for design and evaluation of improvement initiatives that helped us to determine major facilitators and barriers to implementation.22,23
Embedded Observation
From November 2015 to January 2016, we observed morning rounds in the CVICU and MICU one to two times weekly to understand factors facilitating and inhibiting uptake of the intervention. Observations were recorded and organized using a CFIR-based template and directed toward understanding interactions among team members (eg, the decision-making process hierarchy), team workflows and decision-making processes, process of ordering CXRs, and providers’ knowledge and perceptions of the CXR intervention (see Supplemental Material, 3 – CFIR Table).22,23 After rounds, ICU team members were invited to share suggestions for improving the intervention. All observations occurred during and shortly following morning rounds when the vast majority of routine CXRs are ordered; we did not evaluate night or evening workflows. In the spirit of continuous improvement, we evaluated data in real-time.
Semistructured Interviews
Based on the direct observations, we developed semistructured interview questions to further evaluate provider perspectives (eg, “Do you believe ICU patients need a daily CXR?”) and constructs aligning with CFIR (eg, “intervention source—internally vs externally developed;” see Supplemental Material, 4 – Interview Questions).
Stakeholders from both ICUs were recruited through e-mail and in-person requests to participate in semistructured interviews. In the CVICU, we interviewed critical care physicians, anesthesia critical care fellows, and ACNPs. In the MICU, we interviewed medical students, interns, residents, critical care fellows, attending intensivist physicians, and ACNPs. We also interviewed X-ray technologists who routinely perform portable films in the units.
RESULTS
Quantitative Results
Cardiovascular Intensive Care Unit
The median baseline CXR ordering rate in the CVICU was 1.16 CXRs per patient per day, with interquartile range (IQR) 1.06-1.28. During the intervention period, the rate dropped to 1.07 (IQR 0.94-1.21; P < .001; Table 2). The time-series analysis suggested an essentially flat trend during the baseline period, followed by a small but significant drop in ordering rates during the intervention period (P < .001; Table 3 and Figure 1). Ordering rates appeared to increase slightly over the course of the intervention period, but this slight upward trend was not significantly different from the flat trend seen during the baseline period.
Medical Intensive Care Unit
For both physician and ACPN teams, the median baseline CXR ordering rates in the MICU were much lower than the baseline rate in the CVICU (Table 2). For the MICU physician care team, the baseline CXR ordering rate was 0.60 CXRs per patient per day (IQR 0.48-0.73). For the ACNP team, the median rate was 0.39 CXRs per patient per day (IQR 0.21-0.57). Both rates stayed approximately the same during the intervention period (Table 2). The time-series analysis suggested a statistically significant but very slight downward trend in CXR ordering rates during the baseline period, in the physician (P = .011) and ACNP (P = .022) teams (Table 3, Figure 2). Under this model, a small increase in CXR ordering initially occurred during the intervention period for both physician and ACNP teams (P = .010 and P = .055, respectively), after which the rates declined slightly. Trends in ordering rates during the intervention period were not significantly different from the slight downward trends seen during the baseline period.
Qualitative Results
We identified 25 of 39 CFIR constructs as relevant to the initiative (see Supplemental Materials, 3 – CFIR Table.) We determined the major facilitators of deimplementation to be peer champion discussions about CXR ordering on rounds and weekly data feedback, particularly if accompanied by in-person follow-up.
We also noted differences in CXR ordering rationales and decisions between the units. Generally, residents in the MICU and ACNPs in the CVICU made decisions to order CXRs. However, decisions were influenced by the expectations of attending physicians. While CVICU providers tended to order CXRs reflexively as part of morning labs, MICU providers—in particular, ACNPs who had been trained on indications for proper CXR ordering—generally ordered CXRs for specific indications (eg, worsening respiratory status). Of note, MICU ACNPs reported the use of bedside ultrasound as an alternate imaging modality and a reason for their higher threshold to order CXRs.
Deimplementation barriers in both units included the need to identify goal CXR ordering rates and the intervention’s limited visibility. To address these barriers, we conducted PDSA cycles and used the CFIR and ERIC to generate potential solutions.24 We established a goal of a 20% absolute reduction in the CVICU, added monthly CXR rates to weekly e-mail reports to better account for variations in patient populations and ordering practices, and circulated materials to promote on-demand CXR ordering. Promotional materials contained guidelines on CXR ordering and five “Frequently Held Misconceptions” about ordering practices with succinct, evidence-based explanations (see Supplemental Material, 2 – CXR Flyer).
Approximately four months after the start of intervention, some CVICU physicians became concerned that on-demand CXR ordering might be inappropriate for high-risk surgical patients, including those who are undergoing or have undergone heart transplants, lung transplants, or left-ventricular assist device placement. This concern arose following two adverse outcomes, which were not attributed to the CXR initiative, but which heightened concerns about patient safety. A rise in CXR ordering then occurred, and CVICU providers requested that we perform an analysis of these high-risk groups. While segmented linear regression in this subgroup suggested that average daily CXR ordering rates did decrease among the high-risk group at the start of the intervention period (P = .001), the difference between the rates in the two periods was not significant using the Wilcoxon rank-sum test. Exclusion of these patients from the main analysis did not alter the interpretation of the findings reported above for the CVICU.
DISCUSSION
A deimplementation intervention using provider education, peer champions, and data feedback was associated with fewer CXRs in the CVICU (P < .001) but not in the MICU. The CFIR-guided qualitative analysis was valuable for evaluating our deimplementation strategy and for identifying differences between the two ICUs.
Relatively few studies have demonstrated effective interventions that address CW recommendations.25-28 However, three population-level analyses of insurance claims show mixed results.3,4,29 Experts have thus proposed using implementation science to improve uptake of CW recommendations.2,3,7,8 Our study demonstrates the effectiveness of this approach. As expected, providers largely endorsed an on-demand CXR ordering strategy. Using the CFIR, however, we discovered barriers (eg, concern that data feedback did not reflect variations in patients’ needs). Using methods from implementation science allowed us to diagnose and tailor our approaches.
Our qualitative evaluation suggested that the intervention was ineffective mostly due to CFIR’s “inner setting” constructs, including resident fatigue, competing priorities, and decreased investment in QI projects because of the rotating nature of providers in training. Baseline CXR ordering rates in the MICU were also considerably lower than in the CVICU. We observed that CVICU providers ordered many CXRs following the placement of lines or tubes and that ACNPs in the MICU had received education on appropriate CXR ordering practices and had access to an alternate imaging modality in ultrasound. These factors may partially explain the difference in baseline rates.
As noted in a study of cardiac stress testing guidelines, the existence of high-value care recommendations does not mean overuse.30 Indeed, the lack of significant CXR over-ordering in the MICU highlights the importance of baseline measurement and partnering with information technology departments to create the best possible data feedback systems.30-32 Our experience shows that these systems should provide sufficient pre-implementation data (ideally >1 year), such that teams selecting QI projects can ensure that a project is a good use of institutional resources and change capital.
To inform future work, we informally assessed program costs and savings. We estimate the initiative cost $1,600, including $1,000 for curriculum development and teaching time, $300 for educational materials, and $300 for CXR tracking dashboard development. Hospital charges and reimbursements for CXR vary widely.33 We calculated savings using a range of rates, from a conservative $23 (the Medicare reimbursement rate for single-view CXR, CPT code 71010, global fee) to $50 (an approximate blended reimbursement rate across payers).34,35 In the CVICU, we estimate that 51 CXRs were avoided each month, saving $1,173-$2,550 per month or $9,384-$20,400 over eight months of follow-up. Annualizing these figures, we estimate net savings of $12,476-$29,000 in the first year in a 27-bed ICU. Costs to continue the program include education of new employees, booster training, and dashboard maintenance for an estimated annual cost of $1,000. It is difficult to estimate effectiveness over time, but if we conservatively assume that 30 CXRs were avoided each month, then the projected savings would be $8,280-$18,000 per year or an annual net savings of $7,280-$17,000 in the ICU. Although these amounts are modest, providing trainees with experiential learning opportunities in high-value care is valuable in its own right, meets curricular goals, may result in spill-over effects to other diagnostic and therapeutic decisions, and may influence long-term practice patterns. Institutional decisions to pursue projects such as this should take into account these potential benefits.
This evaluation is not without limitations. First, the study was conducted in a single tertiary-care hospital, potentially limiting its generalizability.36 Second, the study design lacked a concurrent control group, and observed outcomes may have been influenced by broader CXR utilization trends, increased awareness of low-value care generally or from previous CW projects at VUMC, seasonal effects, or the Hawthorne effect. Third, the study outcome was all CXRs ordered, rather than CXRs that were unnecessary or not clinically indicated. We chose all CXRs because it was more pragmatic, did not require clinical case review, and could be incorporated promptly into dashboards, enabling timely performance feedback. Other performance measures have taken a similar tack (eg, tracking all-cause readmissions rather than preventable readmissions). Given this approach, we did not track clinical indications for CXRs (eg, central line placement). Fourth, although we compared resident and APRN orders, we did not collect data on other provider characteristics such as years in/out of training or board certification status. These considerations should be addressed in future research.
Finally, the increase in CVICU CXR ordering at the end of the intervention period, which occurred following two adverse events, raises concerns about sustainability. While unrelated to CXR orders, the events resulted in increased ordering of diagnostic tests and showed the difficulty of deimplementation in ICUs. Indeed, some CVICU providers argued that on-demand CXR ordering represented minimal potential cost savings and had not been studied among heart and lung transplant patients. Subsequently, Tonna et al. have shown that on-demand CXR ordering can be safely implemented among such patients.37 Also similar to our study, Tonna et al. observed an initial decrease in CXR ordering, followed by a gradual increase toward baseline ordering rates. These findings highlight the need for sustained awareness and interventions and for the careful selection of high-value projects.
In conclusion, our study shows that a deimplementation intervention based on CW recommendations can reduce CXR ordering and that ongoing evaluation of contextual factors provides insights for both real-time modifications of current interventions and the design of future interventions. We found that messaging about reducing unnecessary tests works well when discussions are framed at the unit level but may be counterproductive if used to question individual ordering decisions.38 Additional lessons learned include the value of participation on rounds to build trust among stakeholders, the utility of monthly rather than weekly statistics for feedback, stakeholder input and peer champions, and differences in approach with physician and ACNP audiences.
Acknowledgments
The authors thank the VUMC Choosing Wisely committee; Mr. Bill Harrell in Advanced Data Analytics for developing the Tableau platform used in our data feedback strategy; Emily Feld, MD, Jerry Zifodya, MD, and Ryan Kindle, MD for assisting with data feedback to providers in the MICU; Todd Rice, MD, Director of the MICU, for his support of the initiative; and Beth Prusaczyk, PhD, MSW and David Stevenson, PhD for providing feedback on earlier drafts of this manuscript.
Disclosures
Dr. Kripalani reports personal fees from Verustat, personal fees from SAI Interactive, and equity from Bioscape Digital, outside the submitted work. All other authors have nothing to disclose.
Funding
This work was supported by an Innovation Grant from the Alliance for Academic Internal Medicine (AAIM, 2016) and by the Departments of Internal Medicine and Graduate Medical Education at Vanderbilt University Medical Center. The AAIM did not have a role in the study design, data collection, data analysis, data interpretation, or manuscript writing.
1. Cassel CK, Guest JA. Choosing Wisely: Helping physicians and patients make smart decisions about their care. JAMA. 2012;307(17):1801-1802.
2. Gonzales R, Cattamanchi A. Changing clinician behavior when less is more. JAMA Intern Med. 2015;175(12):1921-1922.
3. Rosenberg A, Agiro A, Gottlieb M, et al. Early trends among seven recommendations from the Choosing Wisely campaign. JAMA Intern Med. 2015;175(12):1913-1920.
4. Hong AS, Ross-Degnan D, Zhang F, Wharam JF. Small decline in low-value back imaging associated with the ‘Choosing Wisely’ campaign, 2012-14. Health Aff (Millwood). 2017;36(4):671-679. doi: 10.1377/hlthaff.2016.1263.
5. Parks AL, O’Malley PG. From choosing wisely to practicing value—more to the story. JAMA Intern Med. 2016;176(10):1571-1572.
6. Johnson PT, Pahwa AK, Feldman LS, Ziegelstein RC, Hellmann DB. Advancing high-value health care: a new AJM column dedicated to cost-conscious care quality improvement. Am J Med. 2017;130(6):619-621. doi: 10.1016/j.amjmed.2016.12.018.
7. Eccles MP, Mittman BS. Welcome to implementation science. Implement Sci. 2006;1:1. doi: 10.1186/1748-5908-1-1.
8. Bhatia RS, Levinson W, Shortt S, et al. Measuring the effect of Choosing Wisely: an integrated framework to assess campaign impact on low-value care. BMJ Qual Saf. 2015;24:523-531. doi: 10.1136/bmjqs-2015-004070.
9. Selby K, Barnes GD. Learning to de-adopt ineffective healthcare practices. Am J Med. 2018;131(7):721-722. doi: 10.1016/j.amjmed.2018.03.014.
10. Curran GM, Bauer M, Mittman B, Pyne JM, Stetler C. Effectiveness-implementation hybrid designs. Med Care. 2012;50(3):217-226. doi: 10.1097/MLR.0b013e3182408812.
11. Ganapathy A, Adhikari NK, Spiegelman J, Scales DC. Routine chest x-rays in intensive care units: a systematic review and meta-analysis. Crit Care. 2012;16(2):R68. doi: 10.1186/cc11321.
12. Graat ME, Kröner A, Spronk PE, et al. Elimination of daily routine chest radiographs in a mixed medical-surgical intensive care unit. Intensive Care Med. 2007;33(4):639-644. doi: 10.1007/s00134-007-0542-1.
13. Hendrikse KA, Gratama JWC, Ten Hove W, Rommes JH, Schultz MJ, Spronk PE. Low value of routine chest radiographs in a mixed medical-surgical ICU. Chest. 2007;132(3):823-828. doi: 10.1378/chest.07-1162.
14. Clec’h C, Simon P, Hamdi A, et al. Are daily routine chest radiographs useful in critically ill, mechanically ventilated patients? A randomized study. Intensive Care Med. 2008;34(2):264-270. doi: 10.1007/s00134-007-0919-1.
15. Oba Y, Zaza T. Abandoning daily routine chest radiography in the intensive care unit: meta-analysis. Radiology. 2010;255(2):386-395. doi: 10.1148/radiol.10090946.
16. Mets O, Spronk PE, Binnekade J, Stoker J, de Mol BAJM, Schultz MJ. Elimination of daily routine chest radiographs does not change on-demand radiography practice in post-cardiothoracic surgery patients. J Thorac Cardiovasc Surg. 2007;134(1):139-144. doi: 10.1016/j.jtcvs.2007.02.029.
17. Hejblum G, Chalumeau-Lemoine L, Ioos V, et al. Comparison of routine and on-demand prescription of chest radiographs in mechanically ventilated adults: a multicentre, cluster-randomised, two-period crossover study. Lancet. 2009;374(9702):1687-1693. doi: 10.1016/S0140-6736(09)61459-8.
18. McComb BL, Chung JH, Crabtree TD, et al. ACR appropriateness criteria® routine chest radiography. J Thorac Imaging. 2016;31(2):W13-W15. doi: 10.1097/RTI.0000000000000200.
19. Halpern SD, Becker D, Curtis JR, et al. An official American Thoracic Society/American Association of Critical-Care Nurses/American College of Chest Physicians/Society of Critical Care Medicine policy statement: the Choosing Wisely® top 5 list in critical care medicine. Am J Respir Crit Care Med. 2014;190(7):818-826. doi: 10.1164/rccm.201407-1317ST.
20. Powell BJ, Waltz TJ, Chinman MJ, et al. A refined compilation of implementation strategies: Results from the Expert Recommendations for Implementing Change (ERIC) project. Implement Sci. 2015;10:21. doi: 10.1186/s13012-015-0209-1.
21. R [computer program]. Version 3.4.0. Vienna, Austria: R Foundation for Statistical Computing; 2013.
22. Damschroder LJ, Aron DC, Keith RE, Kirsh SR, Alexander JA, Lowery JC. Fostering implementation of health services research findings into practice: a consolidated framework for advancing implementation science. Implement Sci. 2009;4:50. doi: 10.1186/1748-5908-4-50.
23. Kirk MA, Kelley C, Yankey N, Birken SA, Abadie B, Damschroder L. A systematic review of the use of the Consolidated Framework for Implementation Research. Implement Sci. 2016;11:72. doi: 10.1186/s13012-016-0437-z.
24. Speroff T, James BC, Nelson EC, Headrick LA, Brommels M, Reed JE. Guidelines for appraisal and publication of PDSA quality improvement. Qual Manag Health Care. 2014;13(1):33-39. doi: 10.1097/00019514-200401000-00003.
25. Corson AH, Fan VS, White T, et al. A multifaceted hospitalist quality improvement intervention: Decreased frequency of common labs. J Hosp Med. 2015;10(6):390-395. doi: 10.1002/jhm.2354.
26. Ferrari R. Evaluation of the Canadian Rheumatology Association Choosing Wisely recommendation concerning anti-nuclear antibody (ANA) testing. Clin Rheumatol. 2015;34(9):1551-1556. doi: 10.1007/s10067-015-2985-z.
27. Ferrari R, Prosser C. Testing vitamin D levels and choosing wisely. JAMA Intern Med. 2016;176(7):1019-1020.
28. Iams W, Heck J, Kapp M, et al. A multidisciplinary housestaff-led initiative to safely reduce daily laboratory testing. Acad Med. 2016;91(6):813-820. doi: 10.1097/ACM.0000000000001149.
29. Kost A, Genao I, Lee JW, Smith SR. Clinical decisions made in primary care clinics before and after Choosing WiselyTM. J Am Board Fam Med. 2015;28(4):471-474. doi: 10.3122/jabfm.2015.05.140332.
30. Kerr EA, Chen J, Sussman JB, Klamerus ML, Nallamothu BK. Stress testing before low-risk surgery: so many recommendations, so little overuse. JAMA Intern Med. 2015;175(4):645-647. doi: 10.1001/jamainternmed.2014.7877.
31. Colla CH, Morden NE, Sequist TD, Schpero WL, Rosenthal MB. Choosing wisely: prevalence and correlates of low-value health care services in the United States. J Gen Intern Med. 2014;30(2):221-228. doi: 10.1007/s11606-014-3070-z.
32. Shetty KD, Meeker D, Schneider EC, Hussey PS, Damberg CL. Evaluating the feasibility and utility of translating Choosing Wisely recommendations into e-Measures. Healthcare. 2015;3(1):24-37. doi: 10.1016/j.hjdsi.2014.12.002.
33. Woodland DC, Cooper CR, Rashid MF, et al. Routine chest X-ray is unnecessary after ultrasound-guided central venous line placement in the operating room. J Crit Care. 2018;46:13-16. doi: 10.1016/j.jcrc.2018.03.027.
34. Krause TM, Ukhanova M, Revere FL. Private carriers’ physician payment rates compared with Medicare and Medicaid. Tex Med. 2016;112(6):e1.
35. American College of Radiology. Medicare physician fee schedule. Available at https://www.acr.org/Advocacy-and-Economics/Radiology-Economics/Medicare-Medicaid/MPFS. Accessed October 15, 2018.
36. Siegel MD, Rubinowitz AN. Routine daily vs on-demand chest radiographs in intensive care. Lancet. 2009;374(9702):1656-1658. doi: 10.1016/S0140-6736(09)61632-9.
37. Tonna JE, Kawamoto K, Presson AP, et al. Single intervention for a reduction in portable chest radiography (pCXR) in cardiovascular and surgical/trauma ICUs and associated outcomes. J Crit Care. 2018;44:18-23. doi: 10.1016/j.jcrc.2017.10.003.
38. Wolfson D, Santa J, Slass L. Engaging physicians and consumers in conversations about treatment overuse and waste: a short history of the choosing wisely campaign. Acad Med. 2014;89(7):990-995. doi: 10.1097/ACM.0000000000000270.
© 2019 Society of Hospital Medicine
Numeracy, Health Literacy, Cognition, and 30-Day Readmissions among Patients with Heart Failure
Most studies to identify risk factors for readmission among patients with heart failure (HF) have focused on demographic and clinical characteristics.1,2 Although easy to extract from administrative databases, this approach fails to capture the complex psychosocial and cognitive factors that influence the ability of HF patients to manage their disease in the postdischarge period, as depicted in the framework by Meyers et al.3 (2014). To date, studies have found low health literacy, decreased social support, and cognitive impairment to be associated with health behaviors and outcomes among HF patients, including decreased self-care,4 low HF-specific knowledge,5 medication nonadherence,6 hospitalizations,7 and mortality.8-10 Less, however, is known about the effect of numeracy on HF outcomes, such as 30-day readmission.
Numeracy, or quantitative literacy, refers to the ability to access, understand, and apply numerical data to health-related decisions.11 It is estimated that 110 million people in the United States have limited numeracy skills.12 Low numeracy is a risk factor for poor glycemic control among patients with diabetes,13 medication adherence in HIV/AIDS,14 and worse blood pressure control in hypertensives.15 Much like these conditions, HF requires that patients understand, use, and act on numerical information. Maintaining a low-salt diet, monitoring weight, adjusting diuretic doses, and measuring blood pressure are tasks that HF patients are asked to perform on a daily or near-daily basis. These tasks are particularly important in the posthospitalization period and could be complicated by medication changes, which might create additional challenges for patients with inadequate numeracy. Additionally, cognitive impairment, which is a highly prevalent comorbid condition among adults with HF,16,17 might impose additional barriers for those with inadequate numeracy who do not have adequate social support. However, to date, numeracy in the context of HF has not been well described.
Herein, we examined the effects of numeracy, alongside health literacy and cognition, on 30-day readmission risk among patients hospitalized for acute decompensated HF (ADHF).
METHODS
Study Design
The Vanderbilt Inpatient Cohort Study (VICS) is a prospective observational study of patients admitted with cardiovascular disease to Vanderbilt University Medical Center (VUMC), an academic tertiary care hospital. VICS was designed to investigate the impact of social determinants of health on postdischarge health outcomes. A detailed description of the study rationale, design, and methods is described elsewhere.3
Briefly, participants completed a baseline interview while hospitalized, and follow-up phone calls were conducted within 1 week of discharge, at 30 days, and at 90 days. At 30 and 90 days postdischarge, healthcare utilization was ascertained by review of medical records and patient report. Clinical data about the index hospitalization were also abstracted. The Vanderbilt University Institutional Review Board approved the study.
Study Population
Patients hospitalized from 2011 to 2015 with a likely diagnosis of acute coronary syndrome and/or ADHF, as determined by a physician’s review of the medical record, were identified as potentially eligible. Research assistants assessed these patients for the presence of the following exclusion criteria: less than 18 years of age, non-English speaking, unstable psychiatric illness, a low likelihood of follow-up (eg, no reliable telephone number), on hospice, or otherwise too ill to complete an interview. Additionally, those with severe cognitive impairment, as assessed from the medical record (such as seeing a note describing dementia), and those with delirium, as assessed by the brief confusion assessment method, were excluded from enrollment in the study.18,19 Those who died before discharge or during the 30-day follow-up period were excluded. For this analysis, we restricted our sample to only include participants who were hospitalized for ADHF.
Outcome Measure: 30-Day Readmission
The main outcome was all-cause readmission to any hospital within 30 days of discharge, as determined by patient interview, review of electronic medical records from VUMC, and review of outside hospital records.
Main Exposures: Numeracy, Health Literacy, and Cognitive Impairment
Numeracy was assessed with a 3-item version of the Subjective Numeracy Scale (SNS-3), which quantifies the patients perceived quantitative abilities.20 Other authors have shown that the SNS-3 has a correlation coefficient of 0.88 with the full-length SNS-8 and a Cronbach’s alpha of 0.78.20-22 The SNS-3 is reported as the mean on a scale from 1 to 6, with higher scores reflecting higher numeracy.
Subjective health literacy was assessed by using the 3-item Brief Health Literacy Screen (BHLS).23 Scores range from 3 to 15, with higher scores reflecting higher literacy. Objective health literacy was assessed with the short form of the Test of Functional Health Literacy in Adults (sTOFHLA).24,25 Scores may be categorized as inadequate (0-16), marginal (17-22), or adequate (23-36).
We assessed cognition by using the 10-item Short Portable Mental Status Questionnaire (SPMSQ).26 The SPMSQ, which describes a person’s capacity for memory, structured thought, and orientation, has been validated and has demonstrated good reliability and validity.27 Scores of 0 were considered to reflect intact cognition, and scores of 1 or more were considered to reflect any cognitive impairment, a scoring approach employed by other authors.28 We used this approach, rather than the traditional scoring system developed by Pfeiffer et al.26 (1975), because it would be the most sensitive to detect any cognitive impairment in the VICS cohort, which excluded those with severe cognition impairment, dementia, and delirium.
Covariates
During the hospitalization, participants completed an in-person interviewer-administered baseline assessment composed of demographic information, including age, self-reported race (white and nonwhite), educational attainment, home status (married, not married and living with someone, not married and living alone), and household income.
Clinical and diagnostic characteristics abstracted from the medical record included a medical history of HF, HF subtype (classified by left ventricular ejection fraction [LVEF]), coronary artery disease, chronic obstructive pulmonary disease (COPD), diabetes mellitus (DM), and comorbidity burden as summarized by the van Walraven-Elixhauser score.29,30 Depressive symptoms were assessed during the 2 weeks prior to the hospitalization by using the first 8 items of the Patient Health Questionnaire.31 Scores ranged from 0 to 24, with higher scores reflecting more severe depressive symptoms. Laboratory values included estimated glomerular filtration rate (eGFR), hemoglobin (g/dl), sodium (mg/L), and brain natriuretic peptide (BNP) (pg/ml) from the last laboratory draw before discharge. Smoking status was also assessed (current and former/nonsmokers).
Hospitalization characteristics included length of stay in days, number of prior admissions in the last year, and transfer to the intensive care unit during the index admission.
Statistical Analysis
Descriptive statistics were used to summarize patient characteristics. The Kruskal-Wallis test and the Pearson χ2 test were used to determine the association between patient characteristics and levels of numeracy, literacy, and cognition separately. The unadjusted relationship between patient characteristics and 30-day readmission was assessed by using Wilcoxon rank sums tests for continuous variables and Pearson χ2 tests for categorical variables. In addition, a correlation matrix was performed to assess the correlations between numeracy, health literacy, and cognition (supplementary Figure 1).
To examine the association between numeracy, health literacy, and cognition and 30-day readmissions, a series of multivariable Poisson (log-linear) regression models were fit.32 Like other studies, numeracy, health literacy, and cognition were examined as categorical and continuous measures in models.33 Each model was modified with a sandwich estimator for robust standard errors. Log-linear models were chosen over logistic regression models for ease of interpretation because (exponentiated) parameters correspond to risk ratios (RRs) as opposed to odds ratios. Furthermore, the fitting challenges associated with log-linear models when predicted probabilities are near 0 or 1 were not present in these analyses. Redundancy analyses were conducted to ensure that independent variables were not highly correlated with a linear combination of the other independent variables. To avoid case-wise deletion of records with missing covariates, we employed multiple imputation with 10 imputation samples by using predictive mean matching.34,35 All analyses were conducted in R version 3.1.2 (The R Foundation, Vienna, Austria).36
RESULTS
Overall, 883 patients were included in this analysis (supplementary Figure 2). Of the 883 participants, 46% were female and 76% were white (Table 1). Their median age was 60 years (interdecile range [IDR] 39-78) and the median educational attainment was 13.5 years (IDR 11-18).
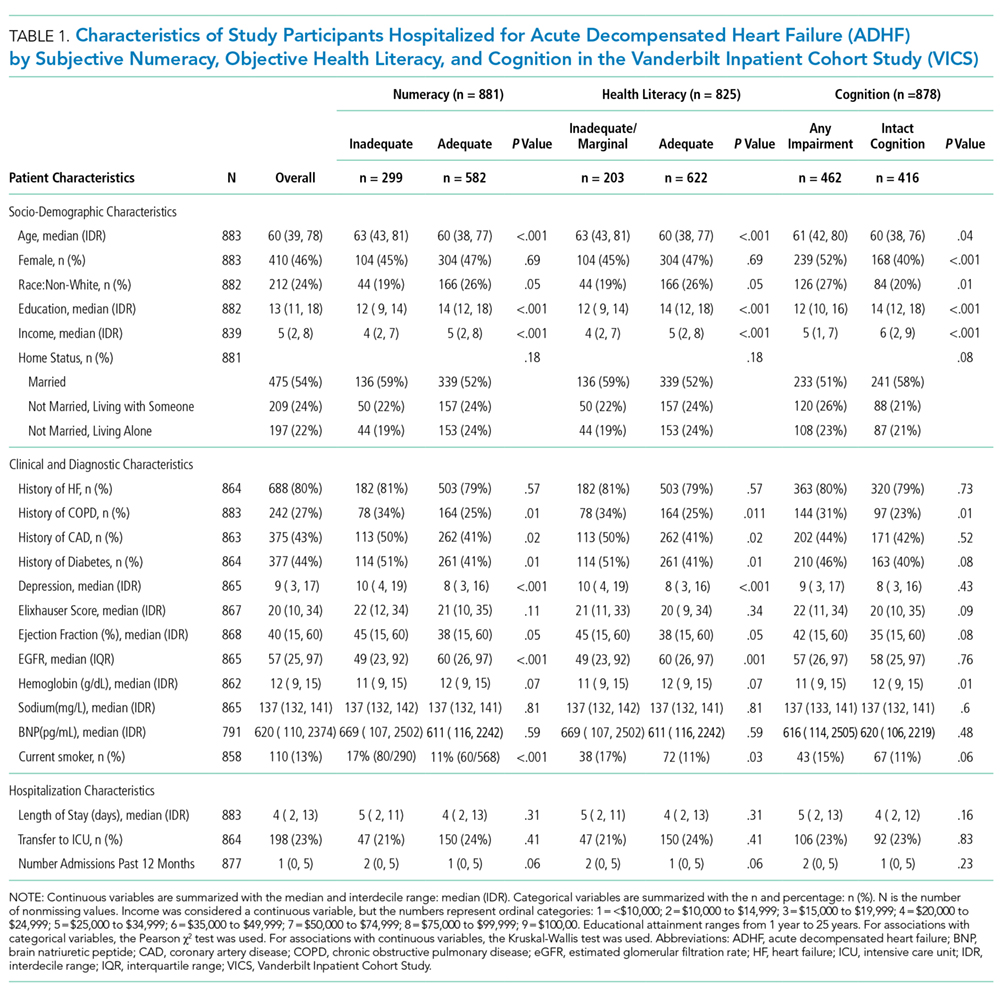
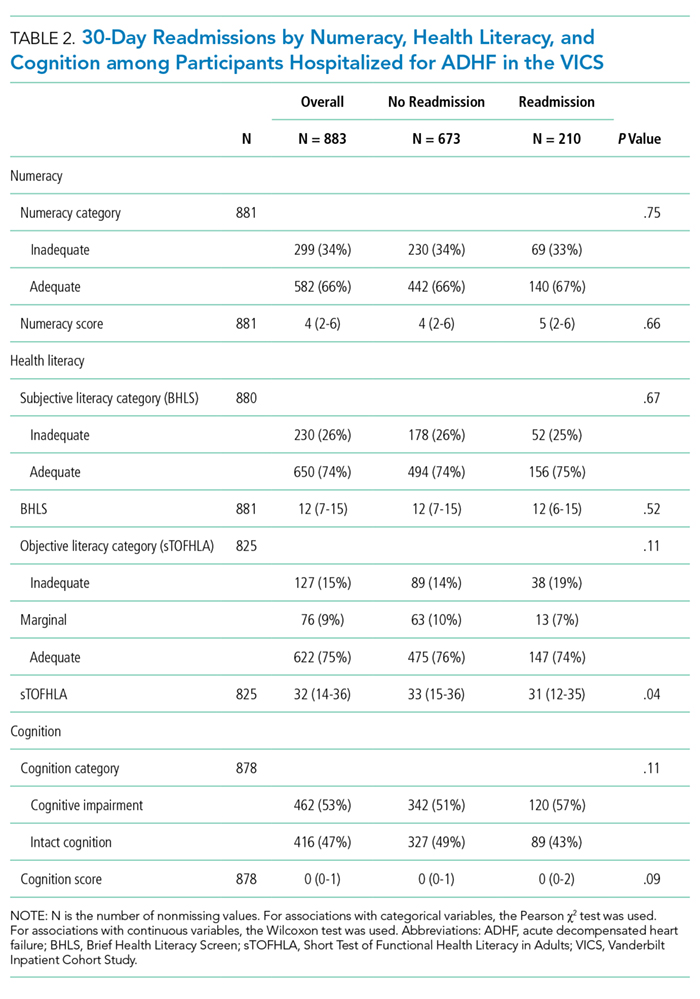
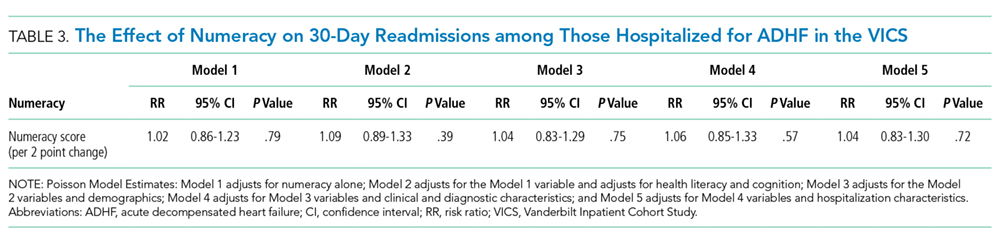
DISCUSSION
This is the first study to examine the effect of numeracy alongside literacy and cognition on 30-day readmission risk among patients hospitalized with ADHF. Overall, we found that 33.9% of participants had inadequate numeracy skills, and 24.6% had inadequate or marginal health literacy. In unadjusted and adjusted models, numeracy was not associated with 30-day readmission. Although (objective) low health literacy was associated with 30-day readmission in unadjusted models, it was not in adjusted models. Additionally, though 53% of participants had any cognitive impairment, readmission did not differ significantly by this factor. Taken together, these findings suggest that other factors may be greater determinants of 30-day readmissions among patients hospitalized for ADHF.
Only 1 other study has examined the effect of numeracy on readmission risk among patients hospitalized for HF. In this multicenter prospective study, McNaughton et al.37 found low numeracy to be associated with higher odds of recidivism to the emergency department (ED) or hospital within 30 days. Our findings may differ from theirs for a few reasons. First, their study had a significantly higher percentage of individuals with low numeracy (55%) compared with ours (33.9%). This may be because they did not exclude individuals with severe cognitive impairment, and their patient population was of lower socioeconomic status (SES) than ours. Low SES is associated with higher 30-day readmissions among HF patients1,10 throughout the literature, and low numeracy is associated with low SES in other diseases.13,38,39 Finally, they studied recidivism, which was defined as any unplanned return to the ED or hospital within 30 days of the index ED visit for acute HF. We only focused on 30-day readmissions, which also may explain why our results differed.
We found that health literacy was not associated with 30-day readmissions, which is consistent with the literature. Although an association between health literacy and mortality exists among adults with HF, several studies have not found an association between health literacy and 30- and 90-day readmission among adults hospitalized for HF.8,9,40 Although we found an association between objective health literacy and 30-day readmission in unadjusted analyses, we did not find one in the multivariable model. This, along with our numeracy finding, suggests that numeracy and literacy may not be driving the 30-day readmission risk among patients hospitalized with ADHF.
We examined cognition alongside numeracy and literacy because it is a prevalent condition among HF patients and because it is associated with adverse outcomes among patients with HF, including readmission.41,42 Studies have shown that HF preferentially affects certain cognitive domains,43 some of which are vital to HF self-care activities. We found that 53% of patients had any cognitive impairment, which is consistent with the literature of adults hospitalized for ADHF.44,45 Cognitive impairment was not, however, associated with 30-day readmissions. There may be a couple reasons for this. First, we measured cognitive impairment with the SPMSQ, which, although widely used and well-validated, does not assess executive function, the domain most commonly affected in HF patients with cognitive impairment.46 Second, patients with severe cognitive impairment and those with delirium were excluded from this study, which may have limited our ability to detect differences in readmission by this factor.
As in prior studies, we found that a history of DM and more hospitalizations in the prior year were independently associated with 30-day readmissions in fully adjusted models. Like other studies, in adjusted models, we found that LVEF and a history of HF were not independently associated with 30-day readmission.47-49 This, however, is not surprising because recent studies have shown that, although HF patients are at risk for multiple hospitalizations, early readmission after a hospitalization for ADHF specifically is often because of reasons unrelated to HF or a non-cardiovascular cause in general.50,51
Although a negative study, several important themes emerged. First, while we were able to assess numeracy, health literacy, and cognition, none of these measures were HF-specific. It is possible that we did not see an effect on readmission because our instruments failed to assess domains specific to HF, such as monitoring weight changes, following a low-salt diet, and interpreting blood pressure. Currently, however, no HF-specific objective numeracy measure exists. With respect to health literacy, only 1 HF-specific measure exists,52 although it was only recently developed and validated. Second, while numeracy may not be a driving influence of all-cause 30-day readmissions, it may be associated with other health behaviors and quality metrics that we did not examine here, such as self-care, medication adherence, and HF-specific readmissions. Third, it is likely that the progression of HF itself, as well as the clinical management of patients following discharge, contribute significantly to 30-day readmissions. Increased attention to predischarge processes for HF patients occurred at VUMC during the study period; close follow-up and evidence-directed therapies may have mitigated some of the expected associations. Finally, we were not able to assess numeracy of participants’ primary caregivers who may help patients at home, especially postdischarge. Though a number of studies have examined the role of family caregivers in the management of HF,53,54 none have examined numeracy levels of caregivers in the context of HF, and this may be worth doing in future studies.
Overall, our study has several strengths. The size of the cohort is large and there were high response rates during the follow-up period. Unlike other HF readmission studies, VICS accounts for readmissions to outside hospitals. Approximately 35% of all hospitalizations in VICS are to outside facilities. Thus, the ascertainment of readmissions to hospitals other than Vanderbilt is more comprehensive than if readmissions to VUMC were only considered. We were able to include a number of clinical comorbidities, laboratory and diagnostic tests from the index admission, and hospitalization characteristics in our analyses. Finally, we performed additional analyses to investigate the correlation between numeracy, literacy, and cognition; ultimately, we found that the majority of these correlations were weak, which supports our ability to study them simultaneously among VICS participants.
Nonetheless, we note some limitations. Although we captured readmissions to outside hospitals, the study took place at a single referral center in Tennessee. Though patients were diverse in age and comorbidities, they were mostly white and of higher SES. Finally, we used home status as a proxy for social support, which may underestimate the support that home care workers provide.
In conclusion, in this prospective longitudinal study of adults hospitalized with ADHF, inadequate numeracy was present in more than a third of patients, and low health literacy was present in roughly a quarter of patients. Neither numeracy nor health literacy, however, were associated with 30-day readmissions in adjusted analyses. Any cognitive impairment, although present in roughly one-half of patients, was not associated with 30-day readmission either. Our findings suggest that other influences may play a more dominant role in determining 30-day readmission rates in patients hospitalized for ADHF than inadequate numeracy, low health literacy, or cognitive impairment as assessed here.
Acknowledgments
This research was supported by the National Heart, Lung, and Blood Institute (R01 HL109388) and in part by the National Center for Advancing Translational Sciences (UL1 TR000445-06). The content is solely the responsibility of the authors and does not necessarily represent official views of the National Institutes of Health. The authors’ funding sources did not participate in the planning, collection, analysis, or interpretation of data or in the decision to submit for publication. Dr. Sterling is supported by T32HS000066 from the Agency for Healthcare Research and Quality. The content is solely the responsibility of the authors and does not necessarily represent the official views of the Agency for Healthcare Research and Quality. Dr. Mixon has a VA Health Services Research and Development Service Career Development Award at the Tennessee Valley Healthcare System, Department of Veterans Affairs (CDA 12-168). This material was presented at the Society of General Internal Medicine Annual Meeting on April 20, 2017, in Washington, DC.
Disclosure
Dr. Kripalani reports personal fees from Verustat, personal fees from SAI Interactive, and equity from Bioscape Digital, all outside of the submitted work. Dr. Rothman and Dr. Wallston report personal fees from EdLogics outside of the submitted work. All of the other authors have nothing to disclose
1. Ross JS, Mulvey GK, Stauffer B, et al. Statistical models and patient predictors of readmission for heart failure: a systematic review. Arch of Intern Med. 2008;168(13):1371-1386. PubMed
33. Bohannon AD, Fillenbaum GG, Pieper CF, Hanlon JT, Blazer DG. Relationship of race/ethnicity and blood pressure to change in cognitive function. J Am Geriatr Soc. 2002;50(3):424-429. PubMed
38. Abdel-Kader K, Dew MA, Bhatnagar M, et al. Numeracy Skills in CKD: Correlates and Outcomes. Clin J Am Soc Nephrol. 2010;5(9):1566-1573. PubMed
Most studies to identify risk factors for readmission among patients with heart failure (HF) have focused on demographic and clinical characteristics.1,2 Although easy to extract from administrative databases, this approach fails to capture the complex psychosocial and cognitive factors that influence the ability of HF patients to manage their disease in the postdischarge period, as depicted in the framework by Meyers et al.3 (2014). To date, studies have found low health literacy, decreased social support, and cognitive impairment to be associated with health behaviors and outcomes among HF patients, including decreased self-care,4 low HF-specific knowledge,5 medication nonadherence,6 hospitalizations,7 and mortality.8-10 Less, however, is known about the effect of numeracy on HF outcomes, such as 30-day readmission.
Numeracy, or quantitative literacy, refers to the ability to access, understand, and apply numerical data to health-related decisions.11 It is estimated that 110 million people in the United States have limited numeracy skills.12 Low numeracy is a risk factor for poor glycemic control among patients with diabetes,13 medication adherence in HIV/AIDS,14 and worse blood pressure control in hypertensives.15 Much like these conditions, HF requires that patients understand, use, and act on numerical information. Maintaining a low-salt diet, monitoring weight, adjusting diuretic doses, and measuring blood pressure are tasks that HF patients are asked to perform on a daily or near-daily basis. These tasks are particularly important in the posthospitalization period and could be complicated by medication changes, which might create additional challenges for patients with inadequate numeracy. Additionally, cognitive impairment, which is a highly prevalent comorbid condition among adults with HF,16,17 might impose additional barriers for those with inadequate numeracy who do not have adequate social support. However, to date, numeracy in the context of HF has not been well described.
Herein, we examined the effects of numeracy, alongside health literacy and cognition, on 30-day readmission risk among patients hospitalized for acute decompensated HF (ADHF).
METHODS
Study Design
The Vanderbilt Inpatient Cohort Study (VICS) is a prospective observational study of patients admitted with cardiovascular disease to Vanderbilt University Medical Center (VUMC), an academic tertiary care hospital. VICS was designed to investigate the impact of social determinants of health on postdischarge health outcomes. A detailed description of the study rationale, design, and methods is described elsewhere.3
Briefly, participants completed a baseline interview while hospitalized, and follow-up phone calls were conducted within 1 week of discharge, at 30 days, and at 90 days. At 30 and 90 days postdischarge, healthcare utilization was ascertained by review of medical records and patient report. Clinical data about the index hospitalization were also abstracted. The Vanderbilt University Institutional Review Board approved the study.
Study Population
Patients hospitalized from 2011 to 2015 with a likely diagnosis of acute coronary syndrome and/or ADHF, as determined by a physician’s review of the medical record, were identified as potentially eligible. Research assistants assessed these patients for the presence of the following exclusion criteria: less than 18 years of age, non-English speaking, unstable psychiatric illness, a low likelihood of follow-up (eg, no reliable telephone number), on hospice, or otherwise too ill to complete an interview. Additionally, those with severe cognitive impairment, as assessed from the medical record (such as seeing a note describing dementia), and those with delirium, as assessed by the brief confusion assessment method, were excluded from enrollment in the study.18,19 Those who died before discharge or during the 30-day follow-up period were excluded. For this analysis, we restricted our sample to only include participants who were hospitalized for ADHF.
Outcome Measure: 30-Day Readmission
The main outcome was all-cause readmission to any hospital within 30 days of discharge, as determined by patient interview, review of electronic medical records from VUMC, and review of outside hospital records.
Main Exposures: Numeracy, Health Literacy, and Cognitive Impairment
Numeracy was assessed with a 3-item version of the Subjective Numeracy Scale (SNS-3), which quantifies the patients perceived quantitative abilities.20 Other authors have shown that the SNS-3 has a correlation coefficient of 0.88 with the full-length SNS-8 and a Cronbach’s alpha of 0.78.20-22 The SNS-3 is reported as the mean on a scale from 1 to 6, with higher scores reflecting higher numeracy.
Subjective health literacy was assessed by using the 3-item Brief Health Literacy Screen (BHLS).23 Scores range from 3 to 15, with higher scores reflecting higher literacy. Objective health literacy was assessed with the short form of the Test of Functional Health Literacy in Adults (sTOFHLA).24,25 Scores may be categorized as inadequate (0-16), marginal (17-22), or adequate (23-36).
We assessed cognition by using the 10-item Short Portable Mental Status Questionnaire (SPMSQ).26 The SPMSQ, which describes a person’s capacity for memory, structured thought, and orientation, has been validated and has demonstrated good reliability and validity.27 Scores of 0 were considered to reflect intact cognition, and scores of 1 or more were considered to reflect any cognitive impairment, a scoring approach employed by other authors.28 We used this approach, rather than the traditional scoring system developed by Pfeiffer et al.26 (1975), because it would be the most sensitive to detect any cognitive impairment in the VICS cohort, which excluded those with severe cognition impairment, dementia, and delirium.
Covariates
During the hospitalization, participants completed an in-person interviewer-administered baseline assessment composed of demographic information, including age, self-reported race (white and nonwhite), educational attainment, home status (married, not married and living with someone, not married and living alone), and household income.
Clinical and diagnostic characteristics abstracted from the medical record included a medical history of HF, HF subtype (classified by left ventricular ejection fraction [LVEF]), coronary artery disease, chronic obstructive pulmonary disease (COPD), diabetes mellitus (DM), and comorbidity burden as summarized by the van Walraven-Elixhauser score.29,30 Depressive symptoms were assessed during the 2 weeks prior to the hospitalization by using the first 8 items of the Patient Health Questionnaire.31 Scores ranged from 0 to 24, with higher scores reflecting more severe depressive symptoms. Laboratory values included estimated glomerular filtration rate (eGFR), hemoglobin (g/dl), sodium (mg/L), and brain natriuretic peptide (BNP) (pg/ml) from the last laboratory draw before discharge. Smoking status was also assessed (current and former/nonsmokers).
Hospitalization characteristics included length of stay in days, number of prior admissions in the last year, and transfer to the intensive care unit during the index admission.
Statistical Analysis
Descriptive statistics were used to summarize patient characteristics. The Kruskal-Wallis test and the Pearson χ2 test were used to determine the association between patient characteristics and levels of numeracy, literacy, and cognition separately. The unadjusted relationship between patient characteristics and 30-day readmission was assessed by using Wilcoxon rank sums tests for continuous variables and Pearson χ2 tests for categorical variables. In addition, a correlation matrix was performed to assess the correlations between numeracy, health literacy, and cognition (supplementary Figure 1).
To examine the association between numeracy, health literacy, and cognition and 30-day readmissions, a series of multivariable Poisson (log-linear) regression models were fit.32 Like other studies, numeracy, health literacy, and cognition were examined as categorical and continuous measures in models.33 Each model was modified with a sandwich estimator for robust standard errors. Log-linear models were chosen over logistic regression models for ease of interpretation because (exponentiated) parameters correspond to risk ratios (RRs) as opposed to odds ratios. Furthermore, the fitting challenges associated with log-linear models when predicted probabilities are near 0 or 1 were not present in these analyses. Redundancy analyses were conducted to ensure that independent variables were not highly correlated with a linear combination of the other independent variables. To avoid case-wise deletion of records with missing covariates, we employed multiple imputation with 10 imputation samples by using predictive mean matching.34,35 All analyses were conducted in R version 3.1.2 (The R Foundation, Vienna, Austria).36
RESULTS
Overall, 883 patients were included in this analysis (supplementary Figure 2). Of the 883 participants, 46% were female and 76% were white (Table 1). Their median age was 60 years (interdecile range [IDR] 39-78) and the median educational attainment was 13.5 years (IDR 11-18).
DISCUSSION
This is the first study to examine the effect of numeracy alongside literacy and cognition on 30-day readmission risk among patients hospitalized with ADHF. Overall, we found that 33.9% of participants had inadequate numeracy skills, and 24.6% had inadequate or marginal health literacy. In unadjusted and adjusted models, numeracy was not associated with 30-day readmission. Although (objective) low health literacy was associated with 30-day readmission in unadjusted models, it was not in adjusted models. Additionally, though 53% of participants had any cognitive impairment, readmission did not differ significantly by this factor. Taken together, these findings suggest that other factors may be greater determinants of 30-day readmissions among patients hospitalized for ADHF.
Only 1 other study has examined the effect of numeracy on readmission risk among patients hospitalized for HF. In this multicenter prospective study, McNaughton et al.37 found low numeracy to be associated with higher odds of recidivism to the emergency department (ED) or hospital within 30 days. Our findings may differ from theirs for a few reasons. First, their study had a significantly higher percentage of individuals with low numeracy (55%) compared with ours (33.9%). This may be because they did not exclude individuals with severe cognitive impairment, and their patient population was of lower socioeconomic status (SES) than ours. Low SES is associated with higher 30-day readmissions among HF patients1,10 throughout the literature, and low numeracy is associated with low SES in other diseases.13,38,39 Finally, they studied recidivism, which was defined as any unplanned return to the ED or hospital within 30 days of the index ED visit for acute HF. We only focused on 30-day readmissions, which also may explain why our results differed.
We found that health literacy was not associated with 30-day readmissions, which is consistent with the literature. Although an association between health literacy and mortality exists among adults with HF, several studies have not found an association between health literacy and 30- and 90-day readmission among adults hospitalized for HF.8,9,40 Although we found an association between objective health literacy and 30-day readmission in unadjusted analyses, we did not find one in the multivariable model. This, along with our numeracy finding, suggests that numeracy and literacy may not be driving the 30-day readmission risk among patients hospitalized with ADHF.
We examined cognition alongside numeracy and literacy because it is a prevalent condition among HF patients and because it is associated with adverse outcomes among patients with HF, including readmission.41,42 Studies have shown that HF preferentially affects certain cognitive domains,43 some of which are vital to HF self-care activities. We found that 53% of patients had any cognitive impairment, which is consistent with the literature of adults hospitalized for ADHF.44,45 Cognitive impairment was not, however, associated with 30-day readmissions. There may be a couple reasons for this. First, we measured cognitive impairment with the SPMSQ, which, although widely used and well-validated, does not assess executive function, the domain most commonly affected in HF patients with cognitive impairment.46 Second, patients with severe cognitive impairment and those with delirium were excluded from this study, which may have limited our ability to detect differences in readmission by this factor.
As in prior studies, we found that a history of DM and more hospitalizations in the prior year were independently associated with 30-day readmissions in fully adjusted models. Like other studies, in adjusted models, we found that LVEF and a history of HF were not independently associated with 30-day readmission.47-49 This, however, is not surprising because recent studies have shown that, although HF patients are at risk for multiple hospitalizations, early readmission after a hospitalization for ADHF specifically is often because of reasons unrelated to HF or a non-cardiovascular cause in general.50,51
Although a negative study, several important themes emerged. First, while we were able to assess numeracy, health literacy, and cognition, none of these measures were HF-specific. It is possible that we did not see an effect on readmission because our instruments failed to assess domains specific to HF, such as monitoring weight changes, following a low-salt diet, and interpreting blood pressure. Currently, however, no HF-specific objective numeracy measure exists. With respect to health literacy, only 1 HF-specific measure exists,52 although it was only recently developed and validated. Second, while numeracy may not be a driving influence of all-cause 30-day readmissions, it may be associated with other health behaviors and quality metrics that we did not examine here, such as self-care, medication adherence, and HF-specific readmissions. Third, it is likely that the progression of HF itself, as well as the clinical management of patients following discharge, contribute significantly to 30-day readmissions. Increased attention to predischarge processes for HF patients occurred at VUMC during the study period; close follow-up and evidence-directed therapies may have mitigated some of the expected associations. Finally, we were not able to assess numeracy of participants’ primary caregivers who may help patients at home, especially postdischarge. Though a number of studies have examined the role of family caregivers in the management of HF,53,54 none have examined numeracy levels of caregivers in the context of HF, and this may be worth doing in future studies.
Overall, our study has several strengths. The size of the cohort is large and there were high response rates during the follow-up period. Unlike other HF readmission studies, VICS accounts for readmissions to outside hospitals. Approximately 35% of all hospitalizations in VICS are to outside facilities. Thus, the ascertainment of readmissions to hospitals other than Vanderbilt is more comprehensive than if readmissions to VUMC were only considered. We were able to include a number of clinical comorbidities, laboratory and diagnostic tests from the index admission, and hospitalization characteristics in our analyses. Finally, we performed additional analyses to investigate the correlation between numeracy, literacy, and cognition; ultimately, we found that the majority of these correlations were weak, which supports our ability to study them simultaneously among VICS participants.
Nonetheless, we note some limitations. Although we captured readmissions to outside hospitals, the study took place at a single referral center in Tennessee. Though patients were diverse in age and comorbidities, they were mostly white and of higher SES. Finally, we used home status as a proxy for social support, which may underestimate the support that home care workers provide.
In conclusion, in this prospective longitudinal study of adults hospitalized with ADHF, inadequate numeracy was present in more than a third of patients, and low health literacy was present in roughly a quarter of patients. Neither numeracy nor health literacy, however, were associated with 30-day readmissions in adjusted analyses. Any cognitive impairment, although present in roughly one-half of patients, was not associated with 30-day readmission either. Our findings suggest that other influences may play a more dominant role in determining 30-day readmission rates in patients hospitalized for ADHF than inadequate numeracy, low health literacy, or cognitive impairment as assessed here.
Acknowledgments
This research was supported by the National Heart, Lung, and Blood Institute (R01 HL109388) and in part by the National Center for Advancing Translational Sciences (UL1 TR000445-06). The content is solely the responsibility of the authors and does not necessarily represent official views of the National Institutes of Health. The authors’ funding sources did not participate in the planning, collection, analysis, or interpretation of data or in the decision to submit for publication. Dr. Sterling is supported by T32HS000066 from the Agency for Healthcare Research and Quality. The content is solely the responsibility of the authors and does not necessarily represent the official views of the Agency for Healthcare Research and Quality. Dr. Mixon has a VA Health Services Research and Development Service Career Development Award at the Tennessee Valley Healthcare System, Department of Veterans Affairs (CDA 12-168). This material was presented at the Society of General Internal Medicine Annual Meeting on April 20, 2017, in Washington, DC.
Disclosure
Dr. Kripalani reports personal fees from Verustat, personal fees from SAI Interactive, and equity from Bioscape Digital, all outside of the submitted work. Dr. Rothman and Dr. Wallston report personal fees from EdLogics outside of the submitted work. All of the other authors have nothing to disclose
1. Ross JS, Mulvey GK, Stauffer B, et al. Statistical models and patient predictors of readmission for heart failure: a systematic review. Arch of Intern Med. 2008;168(13):1371-1386. PubMed
33. Bohannon AD, Fillenbaum GG, Pieper CF, Hanlon JT, Blazer DG. Relationship of race/ethnicity and blood pressure to change in cognitive function. J Am Geriatr Soc. 2002;50(3):424-429. PubMed
38. Abdel-Kader K, Dew MA, Bhatnagar M, et al. Numeracy Skills in CKD: Correlates and Outcomes. Clin J Am Soc Nephrol. 2010;5(9):1566-1573. PubMed
© 2018 Society of Hospital Medicine
Low Health Literacy Is Associated with Increased Transitional Care Needs in Hospitalized Patients
A special concern since the institution of hospital readmission penalties1 is the transitions in care of a patient from one care setting to another, often at hospital discharge. Burke et al.2 proposed a framework for an ideal transition in care (ITC) to study and improve transitions from the hospital to home. The features in the ITC were identified based upon their inclusion in the interventions that improved discharge outcomes.3-5 Inspired by the ITC and other patient risk tools,6 we identified 10 domains of transitional care needs ([TCN] specified below), which we define as patient-centered risk factors that should be addressed to foster a safe and effective transition in care.7
One particularly important risk factor in patient self-management at transition points is health literacy, a patient’s ability to obtain, understand, and use basic health information and services. Low health literacy affects approximately 26% to 36% of adults in the United States.8,9 Health literacy is associated with many factors that may affect successful navigation of care transitions, including doctor-patient communication,10,11 understanding of the medication regimen,12 and self-management.13-15 Research has also demonstrated an association between low health literacy and poor outcomes after hospital discharge, including medication errors,16 30-day hospital readmission,17 and mortality.18 Transitional care initiatives have begun to incorporate health literacy into patient risk assessments6 and provide specific attention to low health literacy in interventions to reduce adverse drug events and readmission.4,19 Training programs for medical students and nurses advise teaching skills in health literacy as part of fostering effective transitions in care.20,21
Although low health literacy is generally recognized as a barrier to patient education and self-management, little is known about whether patients with low health literacy are more likely to have other risk factors that could further increase their risk for poor transitions in care. A better understanding of associated risks would inform and improve patient care. We hypothesized that TCNs are more common among patients with low health literacy, as compared with those with adequate health literacy. We also aimed to describe the relationship between low health literacy and specific TCNs in order to guide clinical care and future interventions.
METHODS
Setting
The present study is a cross-sectional analysis of data from a quality improvement (QI) intervention that was performed at Vanderbilt University Medical Center, a tertiary care facility in Nashville, Tennessee. The QI intervention, My Health Team (MHT), was funded by the Centers for Medicare and Medicaid Services Innovation Award program. The overall MHT program included outpatient care coordination for chronic disease management as well as a transitional care program that was designed to reduce hospital readmission. The latter included an inpatient needs assessment (which provided data for the present analysis), inpatient intervention, and postdischarge phone follow-up. The MHT initiative was reviewed by the institutional review board (IRB), which deemed it a QI program and granted a waiver of informed consent. The present secondary data analysis was reviewed and approved by the IRB.
Sample
Patients were identified for inclusion in the MHT transitions of care program if the presenting problem for hospital admission was pneumonia, chronic obstructive pulmonary disease (COPD) exacerbation, or decompensated heart failure, as determined by the review of clinical documentation by nurse transition care coordinators (TCCs). Adults over the age of 18 years were eligible, though priority was given to patients aged 65 years or older. This study includes the first inpatient encounter between June 2013 and December 31, 2014, for patients having a completed needs assessment and documentation of health literacy data in the medical record.
Data Collection
TCN assessment was developed from published patient risk tools and the ITC framework.2,6,22 The assessment has 10 domains composed of 49 individual items as follows: (1) caregiver support (caregiver support not sufficient for patient needs), (2) transportation (relies on public or others for transportation and misses medical care because of transportation), (3) health care utilization (no primary care physician, unplanned hospitalization in the last year, emergency department [ED] visit in the last 6 months, or home health services in the last 60 days), (4) high-risk medical comorbidities (malnutrition or body mass index <18.5, renal failure, chronic pain, diabetes, heart failure, COPD, or stroke), (5) medication management provider or caregiver concern (cannot provide medication list, >10 preadmission medications, high-risk medications [eg, insulin, warfarin], poor medication understanding, or adherence issue identified), (6) medical devices (vascular access, urinary catheter, wounds, or home supplemental oxygen), (7) functional status (weakness of extremities, limited extremity range of motion, difficulty with mobility, falls at home, or activities of daily living challenges), (8) mental health comorbidities (over the past month has felt down, depressed, or hopeless or over the past month has felt little interest or pleasure in doing things, high-risk alcohol use, or high-risk substance use), (9) communication (limited English proficiency or at risk for limited health literacy), and (10) financial resources (no health insurance, skips or rations medicines because of cost, misses medical care because of cost, or misses medical care because of job).
The 49 items of the TCN assessment were documented as being present or absent by nurse TCCs at the time patients were enrolled in the transitional care program, based on patient and family interview and chart review, and the items were later extracted for analysis. Patients were determined to have a domain-level need if they reported a need on any individual item within that domain, resulting in a binary score (any need present, absent) for each of the 10 TCN domains.
Health literacy was assessed by using the Brief Health Literacy Screen (BHLS), which is administered routinely by nurses at hospital intake and documented in the medical record, with completion rates of approximately 90%.23 The BHLS is a 3-question subjective health literacy assessment (scoring range 3-15) that has been validated against longer objective measures24 and shown to predict disease control and mortality.18,25 To improve the stability of scores (for patients who completed the BHLS more than once because of repeat hospitalizations) and to reduce missing values, we calculated the patient’s mean BHLS score for assessments obtained between January 1, 2013, and December 31, 2014. Patients were then categorized as having inadequate health literacy (BHLS ≤ 9) or adequate health literacy (BHLS > 9).18,25 Demographic information was extracted from patient records and included age, sex (male/female), marital status (married/without a partner), race (white/nonwhite), and years of education. Income level and primary language were not available for analysis.
Statistical Analysis
Patient characteristics and TCNs were summarized by using the frequency and percentages for categorical variables and the mean and standard deviation (SD) for continuous variables. We compared patient characteristics (age, sex, marital status, race, and education) between health literacy groups (inadequate vs adequate) by using χ2 or analysis of variance as appropriate. We assessed Pearson correlations among the 10 TCN domains, and we examined differences in reported needs for each of 10 TCN domains by the level of health literacy by using the χ2 test. Because the TCN domain of communication included low health literacy as one of its items, we excluded this domain from subsequent analyses. We then compared differences in the number of TCNs documented (scoring range 0-9) by using an independent samples Student t test.
Multivariate logistic regression models were then constructed to examine the independent association of inadequate health literacy with 8 TCN domains while controlling for age, sex, marital status, race, and education. Patients with incomplete demographic data were excluded from these models. Additionally, these analyses excluded 2 TCN domains: the communication domain for reasons noted above and the high-risk medical comorbidity domain because it ended up being positive in 98.4% of patients. Statistical significance was set at an alpha of 0.05. All analyses were performed by using SPSS Statistics for Mac, version 23.0 (IBM Corp., Armonk, New York)
RESULTS

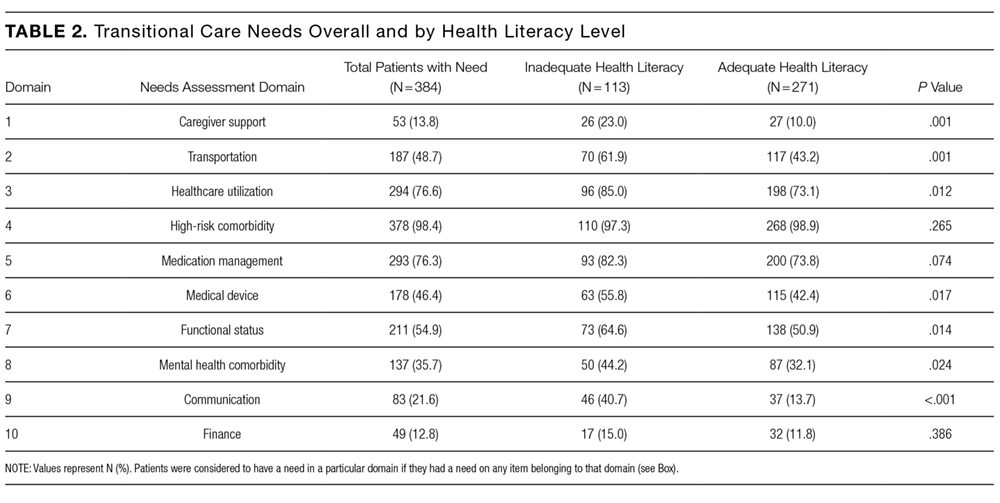
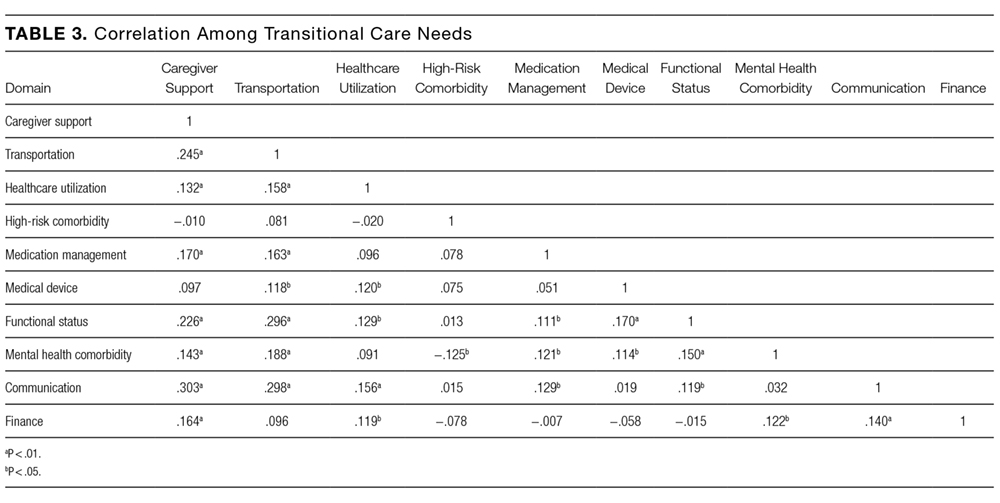
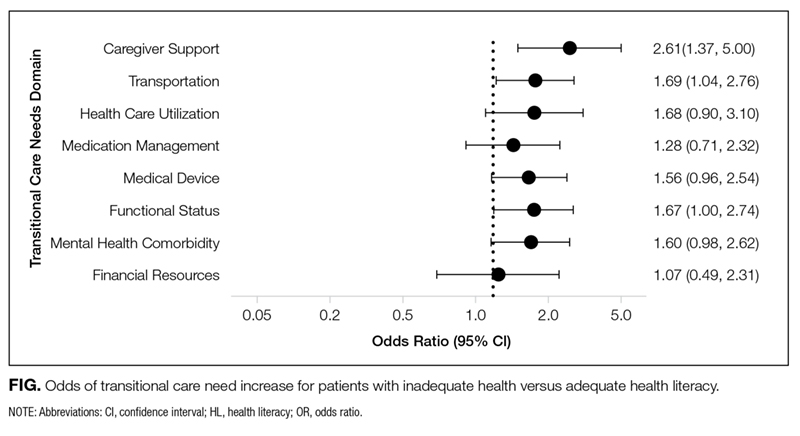
Older age was independently associated with more needs related to medical devices (OR, 1.02; 95% CI, 1.00-1.04), functional status (OR, 1.03; 95% CI, 1.02-1.05), and fewer financial needs (OR, 0.93; 95% CI, 0.91-0.96). Being married or living with a partner was associated with fewer needs related to caregiver support (OR, 0.37; 95% CI, 0.19-0.75) and more device-related needs (OR, 1.60; 95% CI, 1.03-2.49). A higher level of education was associated with fewer transportation needs (OR, 0.89; 95% CI, 0.82-0.97).
DISCUSSION
A structured patient risk factor assessment derived from literature was used to record TCNs in preparation for hospital discharge. On average, patients had needs in about half of the TCN domains (4.6 of 9). The most common areas identified were related to the presence of high-risk comorbidities (98.4%), frequent or prior healthcare utilization (76.6%), medication management (76.3%), functional status (54.9%), and transportation (48.7%). Many of the TCNs were significantly correlated with one another. The prevalence of these needs highlights the importance of using a structured assessment to identify patient concerns so that they may be addressed through discharge planning and follow-up. In addition, using a standardized TCN instrument based on a framework for ITC promotes further research in understanding patient needs and in developing personalized interventions to address them.
As hypothesized, we found that TCNs were more common in patients with inadequate health literacy. After adjustment for demographic factors, inadequate health literacy was significantly associated with transportation barriers and inadequate caregiver support. Analyses also suggested a relationship with needs related to medical devices, functional status, and mental health comorbidities. A review of the literature substantiates a link between inadequate health literacy and these needs and also suggests solutions to address these barriers.
The association with inadequate caregiver support is concerning because there is often a high degree of reliance on caregivers at transitions in care.3-5 Caregivers are routinely called upon to provide assistance with activities that may be difficult for patients with low health literacy, including medication adherence, provider communication, and self-care activities.26,27 Our finding that patients with inadequate health literacy are more likely to have inadequate caregiver support indicates additional vulnerability. This may be because of the absence of a caregiver, or in many cases, the presence of a caregiver who is underprepared to assist with care. Prior research has shown that when caregivers are present, up to 33% have low health literacy, even when they are paid nonfamilial caregivers.26,28 Other studies have noted the inadequacy of information and patient training for caregivers.29,30 Transitional care programs to improve caregiver understanding have been developed31 and have been demonstrated to lower rehospitalization and ED visits.32
Patients with inadequate health literacy were also more likely to have transportation barriers. Lack of transportation has been recorded as a factor in early hospital readmission in patients with chronic disease,33 and it has been shown to have a negative effect on a variety of health outcomes.34 A likely link between readmission and lack of transportation is poor follow-up care. Wheeler et al.35 found that 59% of patients expected difficulty keeping postdischarge appointments because of transportation needs. Instead of expecting patients to navigate their own transportation, the Agency for Healthcare Research and Quality recommends identifying community resources for patients with low health literacy.36
In this sample, inadequate health literacy also had near significant associations with TCNs in the use of medical devices, lower functional status, and mental health comorbidities. The use of a medical device, such as home oxygen, is a risk factor for readmission,37 and early reports suggest that interventions, including education related to home oxygen use, can dramatically reduce these readmissions.38 Lower functional capacity and faster functional decline are associated with inadequate health literacy,39 which may have to do with the inability to appropriately utilize health resources.40 If so, structured discharge planning could alleviate the known connection between functional impairment and hospital readmissions.41 A relationship between low health literacy and depression has been demonstrated repeatedly,42 with worsened symptoms in those with addiction.43 As has been shown in other domains where health literacy is a factor, literacy-focused interventions provide greater benefits to these depressed patients.44
The TCN assessment worked well overall, but certain domains proved less valuable and could be removed in the future. First, it was not useful to separately identify communication barriers, because doing so did not add to information beyond the measurement of health literacy. Second, high-risk comorbidities were ubiquitous within the sample and therefore unhelpful for group comparisons. In hindsight, this is unsurprising because the sample was comprised primarily of elderly patients admitted to medical services. Still, in a younger population or a surgical setting, identifying patients with high-risk medical comorbidities may be more useful.
We acknowledge several limitations of this study. First, the study was performed at a single center, and the TCN assessments were conducted by a small number of registered nurses who received training. Therefore, the results may not generalize to the profile of patient needs at other settings, and the instrument may perform differently when scaled across an organization. Second, the needs assessment was developed for this QI initiative and did not undergo formal validation, although it was developed from published frameworks and similar assessments. Third, for the measure of health literacy, we relied on data collected by nurses as part of their normal workflow. As is often the case with data collected during routine care, the scores are imperfect,45 but they have proven to be a valuable and valid indicator of health literacy in our previous research.18,24,25,46 Fourth, we chose to declare a domain as positive if any item in that domain was positive and to perform a domain-level analysis (for greater clarity). We did not take into account the variable number of items within each domain or attempt to grade their severity, as this would be a subjective exercise and impractical in the discharge planning process. Finally, we were unable to address associations among socioeconomic status,47 primary language,48 and health literacy, because relevant data were not available for this analysis.
CONCLUSION
In this sample of hospitalized patients who were administered a structured needs assessment, patients commonly had needs that placed them at a higher risk of adverse outcomes, such as hospital readmission. Patients with low health literacy had more TCNs that extended beyond the areas that we normally associate with low health literacy, namely patient education and self-management. Healthcare professionals should be aware of the greater likelihood of transportation barriers and inadequate caregiver support among patients with low health literacy. Screening for health literacy and TCN at admission or as part of the discharge planning process will elevate such risks, better positioning clinicians and hospitals to address them as a part of the efforts to ensure a quality transition of care.
Disclosure
This work was funded by the Centers for Medicare and Medicaid Services (1C1CMS330979) and in part by the National Center for Advancing Translational Sciences (2 UL1 TR000445-06). The content is solely the responsibility of the authors and does not necessarily represent official views of the funding agencies, which did not participate in the planning, collection, analysis, or interpretation of data or in the decision to submit for publication.
Dr. Dittus reports personal fees as a board member of the Robert Wood Johnson Foundation Medical Faculty Scholars Program National Advisory Committee; consultancy fees from the University of Virginia, Indiana University, University of Michigan, Northwestern University, Montana State University, and Purdue University; has grants/grants pending from NIH (research grants), PCORI (research grant), CME (innovation award), VA (training grant); payment for lectures including service on speakers bureaus from Corporate Parity (conference organizer) for the Global Hospital Management & Innovation Summit; and other from Medical Decision Making, Inc. (passive owner); all outside the submitted work. Dr. Kripalani has grants from NIH (research grant), PCORI (research grant), and CMS (QI grant); outside the submitted work. All other authors have nothing to disclose.
1. Rau J. Medicare to penalize 2,211 hospitals for excess readmissions. Kaiser Heal News. 2012;13(6):48-49.
2. Burke RE, Kripalani S, Vasilevskis EE, Schnipper JL. Moving beyond readmission penalties: creating an ideal process to improve transitional care. J Hosp Med. 2013;8(2):102-109. PubMed
3. Naylor MD, Brooten D, Campbell R, et al. Comprehensive discharge planning and home follow-up of hospitalized elders. JAMA. 1999;281(7):613-620. PubMed
4. Jack BW, Chetty VK, Anthony D, et al. A reengineered hospital discharge program to decrease rehospitalization. Ann Intern Med. 2009;150(3):178-187. PubMed
5. Coleman EA, Parry C, Chalmers S, Min S. The Care Transitions Intervention. Arch Intern Med. 2006;166(17):1822-1828. PubMed
6. Hansen LO, Greenwald JL, Budnitz T, et al. Project BOOST: effectiveness of a multihospital effort to reduce rehospitalization. J Hosp Med. 2013;8(8):421-427. PubMed
7. Hatch M, Bruce P, Mansolino A, Kripalani S. Transition care coordinators deliver personalized approach. Readmissions News. 2014;3(9):1-4.
8. Paasche-Orlow MK, Parker RM, Gazmararian JA, Nielsen-Bohlman LT, Rudd RR. The prevalence of limited health literacy. J Gen Intern Med. 2005;20(2):175-184. PubMed
9. Kutner M, Greenburg E, Jin Y, et al. The Health Literacy of America’s Adults: Results from the 2003 National Assessment of Adult Literacy. NCES 2006-483. Natl Cent Educ Stat. 2006;6:1-59.
10. Kripalani S, Jacobson TA, Mugalla IC, Cawthon CR, Niesner KJ, Vaccarino V. Health literacy and the quality of physician-patient communication during hospitalization. J Hosp Med. 2010;5(5):269-275. PubMed
11. Goggins KM, Wallston KA., Nwosu S, et al. Health literacy, numeracy, and other characteristics associated with hospitalized patients’ preferences for involvement in decision making. J Health Commun. 2014;19(sup2):29-43. PubMed
12. Marvanova M, Roumie CL, Eden SK, Cawthon C, Schnipper JL, Kripalani S. Health literacy and medication understanding among hospitalized adults. J Hosp Med. 2011;6(9):488-493. PubMed
13. Evangelista LS, Rasmusson KD, Laramee AS, et al. Health literacy and the patient with heart failure—implications for patient care and research: a consensus statement of the Heart Failure Society of America. J Card Fail. 2010;16(1):9-16. PubMed
14. Lindquist LA, Go L, Fleisher J, Jain N, Friesema E, Baker DW. Relationship of health literacy to intentional and unintentional non-adherence of hospital discharge medications. J Gen Intern Med. 2012;27(2):173-178. PubMed
15. Coleman EA, Chugh A, Williams MV, et al. Understanding and execution of discharge instructions. Am J Med Qual. 2013;28(5):383-391. PubMed
16. Mixon AS, Myers AP, Leak CL, et al. Characteristics associated with postdischarge medication errors. Mayo Clin Proc. 2014;89(8):1042-1051. PubMed
17. Mitchell SE, Sadikova E, Jack BW, Paasche-Orlow MK. Health literacy and 30-day postdischarge hospital utilization. J Health Commun. 2012;17(sup3):325-338. PubMed
18. McNaughton CD, Cawthon C, Kripalani S, Liu D, Storrow AB, Roumie CL. Health literacy and mortality: a cohort study of patients hospitalized for acute heart failure. J Am Heart Assoc. 2015;4(5):e001799. PubMed
19. Kripalani S, Roumie CL, Dalal AK, et al. Effect of a pharmacist intervention on clinically important medication errors after hospital discharge: a randomized trial. Ann Intern Med. 2012;157(1):1-10. PubMed
20. Polster D. Patient discharge information: Tools for success. Nursing (Lond). 2015;45(5):42-49. PubMed
21. Bradley SM, Chang D, Fallar R, Karani R. A patient safety and transitions of care curriculum for third-year medical students. Gerontol Geriatr Educ. 2015;36(1):45-57. PubMed
22. Kripalani S, Theobald CN, Anctil B, Vasilevskis EE. Reducing hospital readmission rates: current strategies and future directions. Annu Rev Med. 2014;65:471-485. PubMed
23. Cawthon C, Mion LC, Willens DE, Roumie CL, Kripalani S. Implementing routine health literacy assessment in hospital and primary care patients. Jt Comm J Qual Patient Saf. 2014;40(2):68-76. PubMed
24. Wallston KA, Cawthon C, McNaughton CD, Rothman RL, Osborn CY, Kripalani S. Psychometric properties of the brief health literacy screen in clinical practice. J Gen Intern Med. 2013:1-8. PubMed
25. McNaughton CD, Kripalani S, Cawthon C, Mion LC, Wallston KA, Roumie CL. Association of health literacy with elevated blood pressure: a cohort study of hospitalized patients. Med Care. 2014;52(4):346-353. PubMed
26. Garcia CH, Espinoza SE, Lichtenstein M, Hazuda HP. Health literacy associations between Hispanic elderly patients and their caregivers. J Health Commun. 2013;18 Suppl 1:256-272. PubMed
27. Levin JB, Peterson PN, Dolansky MA, Boxer RS. Health literacy and heart failure management in patient-caregiver dyads. J Card Fail. 2014;20(10):755-761. PubMed
28. Lindquist LA, Jain N, Tam K, Martin GJ, Baker DW. Inadequate health literacy among paid caregivers of seniors. J Gen Intern Med. 2011;26(5):474-479. PubMed
29. Graham CL, Ivey SL, Neuhauser L. From hospital to home: assessing the transitional care needs of vulnerable seniors. Gerontologist. 2009;49(1):23-33. PubMed
30. Foust JB, Vuckovic N, Henriquez E. Hospital to home health care transition: patient, caregiver, and clinician perspectives. West J Nurs Res. 2012;34(2):194-212. PubMed
31. Hahn-Goldberg S, Okrainec K, Huynh T, Zahr N, Abrams H. Co-creating patient-oriented discharge instructions with patients, caregivers, and healthcare providers. J Hosp Med. 2015;10(12):804-807. PubMed
32. Hendrix C, Tepfer S, Forest S, et al. Transitional care partners: a hospital-to-home support for older adults and their caregivers. J Am Assoc Nurse Pract. 2013;25(8):407-414. PubMed
33. Rubin DJ, Donnell-Jackson K, Jhingan R, Golden SH, Paranjape A. Early readmission among patients with diabetes: a qualitative assessment of contributing factors. J Diabetes Complications. 2014;28(6):869-873. PubMed
34. Syed ST, Gerber BS, Sharp LK. Traveling towards disease: transportation barriers to health care access. J Community Health. 2013;38(5):976-993. PubMed
35. Wheeler K, Crawford R, McAdams D, et al. Inpatient to outpatient transfer of diabetes care: perceptions of barriers to postdischarge followup in urban African American patients. Ethn Dis. 2007;17(2):238-243. PubMed
36. Brega A, Barnard J, Mabachi N, et al. AHRQ Health Literacy Universal Precautions Toolkit, Second Edition. Rockville: Agency for Healthcare Research and Qualiy; 2015. https://www.ahrq.gov/professionals/quality-patient-safety/quality-resources/tools/literacy-toolkit/index.html. Accessed August 21, 2017.
37. Sharif R, Parekh TM, Pierson KS, Kuo YF, Sharma G. Predictors of early readmission among patients 40 to 64 years of age hospitalized for chronic obstructive pulmonary disease. Ann Am Thorac Soc. 2014;11(5):685-694. PubMed
38. Carlin B, Wiles K, Easley D, Dskonerwpahsorg DS, Prenner B. Transition of care and rehospitalization rates for patients who require home oxygen therapy following hospitalization. Eur Respir J. 2012;40(Suppl 56):P617.
39. Wolf MS, Gazmararian JA, Baker DW. Health literacy and functional health status among older adults. Arch Intern Med. 2005;165(17):1946-1952. PubMed
40. Smith SG, O’Conor R, Curtis LM, et al. Low health literacy predicts decline in physical function among older adults: findings from the LitCog cohort study. J Epidemiol Community Health. 2015;69(5):474-480. PubMed
41. Greysen SR, Stijacic Cenzer I, Auerbach AD, Covinsky KE. Functional impairment and hospital readmission in medicare seniors. JAMA Intern Med. 2015;175(4):559-565. PubMed
42. Berkman ND, Sheridan SL, Donahue KE, et al. Health literacy interventions and outcomes: an updated systematic review. Evid Rep Technol Assess (Full Rep). 2011;199:1-941. PubMed
43. Lincoln A, Paasche-Orlow M, Cheng D, et al. Impact of health literacy on depressive symptoms and mental health-related quality of life among adults with addiction. J Gen Intern Med. 2006;21(8):818-822. PubMed
44. Weiss BD, Francis L, Senf JH, et al. Literacy education as treatment for depression in patients with limited literacy and depression: a randomized controlled trial. J Gen Intern Med. 2006;21(8):823-828. PubMed
45. Goggins K, Wallston KA, Mion L, Cawthon C, Kripalani S. What patient characteristics influence nurses’ assessment of health literacy? J Health Commun. 2016;21(sup2):105-108. PubMed
46. Scarpato KR, Kappa SF, Goggins KM, et al. The impact of health literacy on surgical outcomes following radical cystectomy. J Health Commun. 2016;21(sup2):99-104.
PubMed
47. Sudore RL, Mehta KM, Simonsick EM, et al. Limited literacy in older people and disparities in health and healthcare access. J Am Geriatr Soc. 2006;54(5):770-776. PubMed
48. Jacobson HE, Hund L, Mas FS. Predictors of English health literacy among US Hispanic immigrants: the importance of language, bilingualism and sociolinguistic environment
A special concern since the institution of hospital readmission penalties1 is the transitions in care of a patient from one care setting to another, often at hospital discharge. Burke et al.2 proposed a framework for an ideal transition in care (ITC) to study and improve transitions from the hospital to home. The features in the ITC were identified based upon their inclusion in the interventions that improved discharge outcomes.3-5 Inspired by the ITC and other patient risk tools,6 we identified 10 domains of transitional care needs ([TCN] specified below), which we define as patient-centered risk factors that should be addressed to foster a safe and effective transition in care.7
One particularly important risk factor in patient self-management at transition points is health literacy, a patient’s ability to obtain, understand, and use basic health information and services. Low health literacy affects approximately 26% to 36% of adults in the United States.8,9 Health literacy is associated with many factors that may affect successful navigation of care transitions, including doctor-patient communication,10,11 understanding of the medication regimen,12 and self-management.13-15 Research has also demonstrated an association between low health literacy and poor outcomes after hospital discharge, including medication errors,16 30-day hospital readmission,17 and mortality.18 Transitional care initiatives have begun to incorporate health literacy into patient risk assessments6 and provide specific attention to low health literacy in interventions to reduce adverse drug events and readmission.4,19 Training programs for medical students and nurses advise teaching skills in health literacy as part of fostering effective transitions in care.20,21
Although low health literacy is generally recognized as a barrier to patient education and self-management, little is known about whether patients with low health literacy are more likely to have other risk factors that could further increase their risk for poor transitions in care. A better understanding of associated risks would inform and improve patient care. We hypothesized that TCNs are more common among patients with low health literacy, as compared with those with adequate health literacy. We also aimed to describe the relationship between low health literacy and specific TCNs in order to guide clinical care and future interventions.
METHODS
Setting
The present study is a cross-sectional analysis of data from a quality improvement (QI) intervention that was performed at Vanderbilt University Medical Center, a tertiary care facility in Nashville, Tennessee. The QI intervention, My Health Team (MHT), was funded by the Centers for Medicare and Medicaid Services Innovation Award program. The overall MHT program included outpatient care coordination for chronic disease management as well as a transitional care program that was designed to reduce hospital readmission. The latter included an inpatient needs assessment (which provided data for the present analysis), inpatient intervention, and postdischarge phone follow-up. The MHT initiative was reviewed by the institutional review board (IRB), which deemed it a QI program and granted a waiver of informed consent. The present secondary data analysis was reviewed and approved by the IRB.
Sample
Patients were identified for inclusion in the MHT transitions of care program if the presenting problem for hospital admission was pneumonia, chronic obstructive pulmonary disease (COPD) exacerbation, or decompensated heart failure, as determined by the review of clinical documentation by nurse transition care coordinators (TCCs). Adults over the age of 18 years were eligible, though priority was given to patients aged 65 years or older. This study includes the first inpatient encounter between June 2013 and December 31, 2014, for patients having a completed needs assessment and documentation of health literacy data in the medical record.
Data Collection
TCN assessment was developed from published patient risk tools and the ITC framework.2,6,22 The assessment has 10 domains composed of 49 individual items as follows: (1) caregiver support (caregiver support not sufficient for patient needs), (2) transportation (relies on public or others for transportation and misses medical care because of transportation), (3) health care utilization (no primary care physician, unplanned hospitalization in the last year, emergency department [ED] visit in the last 6 months, or home health services in the last 60 days), (4) high-risk medical comorbidities (malnutrition or body mass index <18.5, renal failure, chronic pain, diabetes, heart failure, COPD, or stroke), (5) medication management provider or caregiver concern (cannot provide medication list, >10 preadmission medications, high-risk medications [eg, insulin, warfarin], poor medication understanding, or adherence issue identified), (6) medical devices (vascular access, urinary catheter, wounds, or home supplemental oxygen), (7) functional status (weakness of extremities, limited extremity range of motion, difficulty with mobility, falls at home, or activities of daily living challenges), (8) mental health comorbidities (over the past month has felt down, depressed, or hopeless or over the past month has felt little interest or pleasure in doing things, high-risk alcohol use, or high-risk substance use), (9) communication (limited English proficiency or at risk for limited health literacy), and (10) financial resources (no health insurance, skips or rations medicines because of cost, misses medical care because of cost, or misses medical care because of job).
The 49 items of the TCN assessment were documented as being present or absent by nurse TCCs at the time patients were enrolled in the transitional care program, based on patient and family interview and chart review, and the items were later extracted for analysis. Patients were determined to have a domain-level need if they reported a need on any individual item within that domain, resulting in a binary score (any need present, absent) for each of the 10 TCN domains.
Health literacy was assessed by using the Brief Health Literacy Screen (BHLS), which is administered routinely by nurses at hospital intake and documented in the medical record, with completion rates of approximately 90%.23 The BHLS is a 3-question subjective health literacy assessment (scoring range 3-15) that has been validated against longer objective measures24 and shown to predict disease control and mortality.18,25 To improve the stability of scores (for patients who completed the BHLS more than once because of repeat hospitalizations) and to reduce missing values, we calculated the patient’s mean BHLS score for assessments obtained between January 1, 2013, and December 31, 2014. Patients were then categorized as having inadequate health literacy (BHLS ≤ 9) or adequate health literacy (BHLS > 9).18,25 Demographic information was extracted from patient records and included age, sex (male/female), marital status (married/without a partner), race (white/nonwhite), and years of education. Income level and primary language were not available for analysis.
Statistical Analysis
Patient characteristics and TCNs were summarized by using the frequency and percentages for categorical variables and the mean and standard deviation (SD) for continuous variables. We compared patient characteristics (age, sex, marital status, race, and education) between health literacy groups (inadequate vs adequate) by using χ2 or analysis of variance as appropriate. We assessed Pearson correlations among the 10 TCN domains, and we examined differences in reported needs for each of 10 TCN domains by the level of health literacy by using the χ2 test. Because the TCN domain of communication included low health literacy as one of its items, we excluded this domain from subsequent analyses. We then compared differences in the number of TCNs documented (scoring range 0-9) by using an independent samples Student t test.
Multivariate logistic regression models were then constructed to examine the independent association of inadequate health literacy with 8 TCN domains while controlling for age, sex, marital status, race, and education. Patients with incomplete demographic data were excluded from these models. Additionally, these analyses excluded 2 TCN domains: the communication domain for reasons noted above and the high-risk medical comorbidity domain because it ended up being positive in 98.4% of patients. Statistical significance was set at an alpha of 0.05. All analyses were performed by using SPSS Statistics for Mac, version 23.0 (IBM Corp., Armonk, New York)
RESULTS
Older age was independently associated with more needs related to medical devices (OR, 1.02; 95% CI, 1.00-1.04), functional status (OR, 1.03; 95% CI, 1.02-1.05), and fewer financial needs (OR, 0.93; 95% CI, 0.91-0.96). Being married or living with a partner was associated with fewer needs related to caregiver support (OR, 0.37; 95% CI, 0.19-0.75) and more device-related needs (OR, 1.60; 95% CI, 1.03-2.49). A higher level of education was associated with fewer transportation needs (OR, 0.89; 95% CI, 0.82-0.97).
DISCUSSION
A structured patient risk factor assessment derived from literature was used to record TCNs in preparation for hospital discharge. On average, patients had needs in about half of the TCN domains (4.6 of 9). The most common areas identified were related to the presence of high-risk comorbidities (98.4%), frequent or prior healthcare utilization (76.6%), medication management (76.3%), functional status (54.9%), and transportation (48.7%). Many of the TCNs were significantly correlated with one another. The prevalence of these needs highlights the importance of using a structured assessment to identify patient concerns so that they may be addressed through discharge planning and follow-up. In addition, using a standardized TCN instrument based on a framework for ITC promotes further research in understanding patient needs and in developing personalized interventions to address them.
As hypothesized, we found that TCNs were more common in patients with inadequate health literacy. After adjustment for demographic factors, inadequate health literacy was significantly associated with transportation barriers and inadequate caregiver support. Analyses also suggested a relationship with needs related to medical devices, functional status, and mental health comorbidities. A review of the literature substantiates a link between inadequate health literacy and these needs and also suggests solutions to address these barriers.
The association with inadequate caregiver support is concerning because there is often a high degree of reliance on caregivers at transitions in care.3-5 Caregivers are routinely called upon to provide assistance with activities that may be difficult for patients with low health literacy, including medication adherence, provider communication, and self-care activities.26,27 Our finding that patients with inadequate health literacy are more likely to have inadequate caregiver support indicates additional vulnerability. This may be because of the absence of a caregiver, or in many cases, the presence of a caregiver who is underprepared to assist with care. Prior research has shown that when caregivers are present, up to 33% have low health literacy, even when they are paid nonfamilial caregivers.26,28 Other studies have noted the inadequacy of information and patient training for caregivers.29,30 Transitional care programs to improve caregiver understanding have been developed31 and have been demonstrated to lower rehospitalization and ED visits.32
Patients with inadequate health literacy were also more likely to have transportation barriers. Lack of transportation has been recorded as a factor in early hospital readmission in patients with chronic disease,33 and it has been shown to have a negative effect on a variety of health outcomes.34 A likely link between readmission and lack of transportation is poor follow-up care. Wheeler et al.35 found that 59% of patients expected difficulty keeping postdischarge appointments because of transportation needs. Instead of expecting patients to navigate their own transportation, the Agency for Healthcare Research and Quality recommends identifying community resources for patients with low health literacy.36
In this sample, inadequate health literacy also had near significant associations with TCNs in the use of medical devices, lower functional status, and mental health comorbidities. The use of a medical device, such as home oxygen, is a risk factor for readmission,37 and early reports suggest that interventions, including education related to home oxygen use, can dramatically reduce these readmissions.38 Lower functional capacity and faster functional decline are associated with inadequate health literacy,39 which may have to do with the inability to appropriately utilize health resources.40 If so, structured discharge planning could alleviate the known connection between functional impairment and hospital readmissions.41 A relationship between low health literacy and depression has been demonstrated repeatedly,42 with worsened symptoms in those with addiction.43 As has been shown in other domains where health literacy is a factor, literacy-focused interventions provide greater benefits to these depressed patients.44
The TCN assessment worked well overall, but certain domains proved less valuable and could be removed in the future. First, it was not useful to separately identify communication barriers, because doing so did not add to information beyond the measurement of health literacy. Second, high-risk comorbidities were ubiquitous within the sample and therefore unhelpful for group comparisons. In hindsight, this is unsurprising because the sample was comprised primarily of elderly patients admitted to medical services. Still, in a younger population or a surgical setting, identifying patients with high-risk medical comorbidities may be more useful.
We acknowledge several limitations of this study. First, the study was performed at a single center, and the TCN assessments were conducted by a small number of registered nurses who received training. Therefore, the results may not generalize to the profile of patient needs at other settings, and the instrument may perform differently when scaled across an organization. Second, the needs assessment was developed for this QI initiative and did not undergo formal validation, although it was developed from published frameworks and similar assessments. Third, for the measure of health literacy, we relied on data collected by nurses as part of their normal workflow. As is often the case with data collected during routine care, the scores are imperfect,45 but they have proven to be a valuable and valid indicator of health literacy in our previous research.18,24,25,46 Fourth, we chose to declare a domain as positive if any item in that domain was positive and to perform a domain-level analysis (for greater clarity). We did not take into account the variable number of items within each domain or attempt to grade their severity, as this would be a subjective exercise and impractical in the discharge planning process. Finally, we were unable to address associations among socioeconomic status,47 primary language,48 and health literacy, because relevant data were not available for this analysis.
CONCLUSION
In this sample of hospitalized patients who were administered a structured needs assessment, patients commonly had needs that placed them at a higher risk of adverse outcomes, such as hospital readmission. Patients with low health literacy had more TCNs that extended beyond the areas that we normally associate with low health literacy, namely patient education and self-management. Healthcare professionals should be aware of the greater likelihood of transportation barriers and inadequate caregiver support among patients with low health literacy. Screening for health literacy and TCN at admission or as part of the discharge planning process will elevate such risks, better positioning clinicians and hospitals to address them as a part of the efforts to ensure a quality transition of care.
Disclosure
This work was funded by the Centers for Medicare and Medicaid Services (1C1CMS330979) and in part by the National Center for Advancing Translational Sciences (2 UL1 TR000445-06). The content is solely the responsibility of the authors and does not necessarily represent official views of the funding agencies, which did not participate in the planning, collection, analysis, or interpretation of data or in the decision to submit for publication.
Dr. Dittus reports personal fees as a board member of the Robert Wood Johnson Foundation Medical Faculty Scholars Program National Advisory Committee; consultancy fees from the University of Virginia, Indiana University, University of Michigan, Northwestern University, Montana State University, and Purdue University; has grants/grants pending from NIH (research grants), PCORI (research grant), CME (innovation award), VA (training grant); payment for lectures including service on speakers bureaus from Corporate Parity (conference organizer) for the Global Hospital Management & Innovation Summit; and other from Medical Decision Making, Inc. (passive owner); all outside the submitted work. Dr. Kripalani has grants from NIH (research grant), PCORI (research grant), and CMS (QI grant); outside the submitted work. All other authors have nothing to disclose.
1. Rau J. Medicare to penalize 2,211 hospitals for excess readmissions. Kaiser Heal News. 2012;13(6):48-49.
2. Burke RE, Kripalani S, Vasilevskis EE, Schnipper JL. Moving beyond readmission penalties: creating an ideal process to improve transitional care. J Hosp Med. 2013;8(2):102-109. PubMed
3. Naylor MD, Brooten D, Campbell R, et al. Comprehensive discharge planning and home follow-up of hospitalized elders. JAMA. 1999;281(7):613-620. PubMed
4. Jack BW, Chetty VK, Anthony D, et al. A reengineered hospital discharge program to decrease rehospitalization. Ann Intern Med. 2009;150(3):178-187. PubMed
5. Coleman EA, Parry C, Chalmers S, Min S. The Care Transitions Intervention. Arch Intern Med. 2006;166(17):1822-1828. PubMed
6. Hansen LO, Greenwald JL, Budnitz T, et al. Project BOOST: effectiveness of a multihospital effort to reduce rehospitalization. J Hosp Med. 2013;8(8):421-427. PubMed
7. Hatch M, Bruce P, Mansolino A, Kripalani S. Transition care coordinators deliver personalized approach. Readmissions News. 2014;3(9):1-4.
8. Paasche-Orlow MK, Parker RM, Gazmararian JA, Nielsen-Bohlman LT, Rudd RR. The prevalence of limited health literacy. J Gen Intern Med. 2005;20(2):175-184. PubMed
9. Kutner M, Greenburg E, Jin Y, et al. The Health Literacy of America’s Adults: Results from the 2003 National Assessment of Adult Literacy. NCES 2006-483. Natl Cent Educ Stat. 2006;6:1-59.
10. Kripalani S, Jacobson TA, Mugalla IC, Cawthon CR, Niesner KJ, Vaccarino V. Health literacy and the quality of physician-patient communication during hospitalization. J Hosp Med. 2010;5(5):269-275. PubMed
11. Goggins KM, Wallston KA., Nwosu S, et al. Health literacy, numeracy, and other characteristics associated with hospitalized patients’ preferences for involvement in decision making. J Health Commun. 2014;19(sup2):29-43. PubMed
12. Marvanova M, Roumie CL, Eden SK, Cawthon C, Schnipper JL, Kripalani S. Health literacy and medication understanding among hospitalized adults. J Hosp Med. 2011;6(9):488-493. PubMed
13. Evangelista LS, Rasmusson KD, Laramee AS, et al. Health literacy and the patient with heart failure—implications for patient care and research: a consensus statement of the Heart Failure Society of America. J Card Fail. 2010;16(1):9-16. PubMed
14. Lindquist LA, Go L, Fleisher J, Jain N, Friesema E, Baker DW. Relationship of health literacy to intentional and unintentional non-adherence of hospital discharge medications. J Gen Intern Med. 2012;27(2):173-178. PubMed
15. Coleman EA, Chugh A, Williams MV, et al. Understanding and execution of discharge instructions. Am J Med Qual. 2013;28(5):383-391. PubMed
16. Mixon AS, Myers AP, Leak CL, et al. Characteristics associated with postdischarge medication errors. Mayo Clin Proc. 2014;89(8):1042-1051. PubMed
17. Mitchell SE, Sadikova E, Jack BW, Paasche-Orlow MK. Health literacy and 30-day postdischarge hospital utilization. J Health Commun. 2012;17(sup3):325-338. PubMed
18. McNaughton CD, Cawthon C, Kripalani S, Liu D, Storrow AB, Roumie CL. Health literacy and mortality: a cohort study of patients hospitalized for acute heart failure. J Am Heart Assoc. 2015;4(5):e001799. PubMed
19. Kripalani S, Roumie CL, Dalal AK, et al. Effect of a pharmacist intervention on clinically important medication errors after hospital discharge: a randomized trial. Ann Intern Med. 2012;157(1):1-10. PubMed
20. Polster D. Patient discharge information: Tools for success. Nursing (Lond). 2015;45(5):42-49. PubMed
21. Bradley SM, Chang D, Fallar R, Karani R. A patient safety and transitions of care curriculum for third-year medical students. Gerontol Geriatr Educ. 2015;36(1):45-57. PubMed
22. Kripalani S, Theobald CN, Anctil B, Vasilevskis EE. Reducing hospital readmission rates: current strategies and future directions. Annu Rev Med. 2014;65:471-485. PubMed
23. Cawthon C, Mion LC, Willens DE, Roumie CL, Kripalani S. Implementing routine health literacy assessment in hospital and primary care patients. Jt Comm J Qual Patient Saf. 2014;40(2):68-76. PubMed
24. Wallston KA, Cawthon C, McNaughton CD, Rothman RL, Osborn CY, Kripalani S. Psychometric properties of the brief health literacy screen in clinical practice. J Gen Intern Med. 2013:1-8. PubMed
25. McNaughton CD, Kripalani S, Cawthon C, Mion LC, Wallston KA, Roumie CL. Association of health literacy with elevated blood pressure: a cohort study of hospitalized patients. Med Care. 2014;52(4):346-353. PubMed
26. Garcia CH, Espinoza SE, Lichtenstein M, Hazuda HP. Health literacy associations between Hispanic elderly patients and their caregivers. J Health Commun. 2013;18 Suppl 1:256-272. PubMed
27. Levin JB, Peterson PN, Dolansky MA, Boxer RS. Health literacy and heart failure management in patient-caregiver dyads. J Card Fail. 2014;20(10):755-761. PubMed
28. Lindquist LA, Jain N, Tam K, Martin GJ, Baker DW. Inadequate health literacy among paid caregivers of seniors. J Gen Intern Med. 2011;26(5):474-479. PubMed
29. Graham CL, Ivey SL, Neuhauser L. From hospital to home: assessing the transitional care needs of vulnerable seniors. Gerontologist. 2009;49(1):23-33. PubMed
30. Foust JB, Vuckovic N, Henriquez E. Hospital to home health care transition: patient, caregiver, and clinician perspectives. West J Nurs Res. 2012;34(2):194-212. PubMed
31. Hahn-Goldberg S, Okrainec K, Huynh T, Zahr N, Abrams H. Co-creating patient-oriented discharge instructions with patients, caregivers, and healthcare providers. J Hosp Med. 2015;10(12):804-807. PubMed
32. Hendrix C, Tepfer S, Forest S, et al. Transitional care partners: a hospital-to-home support for older adults and their caregivers. J Am Assoc Nurse Pract. 2013;25(8):407-414. PubMed
33. Rubin DJ, Donnell-Jackson K, Jhingan R, Golden SH, Paranjape A. Early readmission among patients with diabetes: a qualitative assessment of contributing factors. J Diabetes Complications. 2014;28(6):869-873. PubMed
34. Syed ST, Gerber BS, Sharp LK. Traveling towards disease: transportation barriers to health care access. J Community Health. 2013;38(5):976-993. PubMed
35. Wheeler K, Crawford R, McAdams D, et al. Inpatient to outpatient transfer of diabetes care: perceptions of barriers to postdischarge followup in urban African American patients. Ethn Dis. 2007;17(2):238-243. PubMed
36. Brega A, Barnard J, Mabachi N, et al. AHRQ Health Literacy Universal Precautions Toolkit, Second Edition. Rockville: Agency for Healthcare Research and Qualiy; 2015. https://www.ahrq.gov/professionals/quality-patient-safety/quality-resources/tools/literacy-toolkit/index.html. Accessed August 21, 2017.
37. Sharif R, Parekh TM, Pierson KS, Kuo YF, Sharma G. Predictors of early readmission among patients 40 to 64 years of age hospitalized for chronic obstructive pulmonary disease. Ann Am Thorac Soc. 2014;11(5):685-694. PubMed
38. Carlin B, Wiles K, Easley D, Dskonerwpahsorg DS, Prenner B. Transition of care and rehospitalization rates for patients who require home oxygen therapy following hospitalization. Eur Respir J. 2012;40(Suppl 56):P617.
39. Wolf MS, Gazmararian JA, Baker DW. Health literacy and functional health status among older adults. Arch Intern Med. 2005;165(17):1946-1952. PubMed
40. Smith SG, O’Conor R, Curtis LM, et al. Low health literacy predicts decline in physical function among older adults: findings from the LitCog cohort study. J Epidemiol Community Health. 2015;69(5):474-480. PubMed
41. Greysen SR, Stijacic Cenzer I, Auerbach AD, Covinsky KE. Functional impairment and hospital readmission in medicare seniors. JAMA Intern Med. 2015;175(4):559-565. PubMed
42. Berkman ND, Sheridan SL, Donahue KE, et al. Health literacy interventions and outcomes: an updated systematic review. Evid Rep Technol Assess (Full Rep). 2011;199:1-941. PubMed
43. Lincoln A, Paasche-Orlow M, Cheng D, et al. Impact of health literacy on depressive symptoms and mental health-related quality of life among adults with addiction. J Gen Intern Med. 2006;21(8):818-822. PubMed
44. Weiss BD, Francis L, Senf JH, et al. Literacy education as treatment for depression in patients with limited literacy and depression: a randomized controlled trial. J Gen Intern Med. 2006;21(8):823-828. PubMed
45. Goggins K, Wallston KA, Mion L, Cawthon C, Kripalani S. What patient characteristics influence nurses’ assessment of health literacy? J Health Commun. 2016;21(sup2):105-108. PubMed
46. Scarpato KR, Kappa SF, Goggins KM, et al. The impact of health literacy on surgical outcomes following radical cystectomy. J Health Commun. 2016;21(sup2):99-104.
PubMed
47. Sudore RL, Mehta KM, Simonsick EM, et al. Limited literacy in older people and disparities in health and healthcare access. J Am Geriatr Soc. 2006;54(5):770-776. PubMed
48. Jacobson HE, Hund L, Mas FS. Predictors of English health literacy among US Hispanic immigrants: the importance of language, bilingualism and sociolinguistic environment
© 2017 Society of Hospital Medicine
Discharge Preparedness and Readmission
In recent years, US hospitals have focused on decreasing readmission rates, incented by reimbursement penalties to hospitals having excessive readmissions.[1] Gaps in the quality of care provided during transitions likely contribute to preventable readmissions.[2] One compelling quality assessment in this setting is measuring patients' discharge preparedness, using key dimensions such as understanding their instructions for medication use and follow‐up. Patient‐reported preparedness for discharge may also be useful to identify risk of readmission.
Several patient‐reported measures of preparedness for discharge exist, and herein we describe 2 measures of interest. First, the Brief‐PREPARED (B‐PREPARED) measure was derived from the longer PREPARED instrument (Prescriptions, Ready to re‐enter community, Education, Placement, Assurance of safety, Realistic expectations, Empowerment, Directed to appropriate services), which reflects the patient's perceived needs at discharge. In previous research, the B‐PREPARED measure predicted emergency department (ED) visits for patients who had been recently hospitalized and had a high risk for readmission.[3] Second, the Care Transitions Measure‐3 (CTM‐3) was developed by Coleman et al. as a patient‐reported measure to discriminate between patients who were more likely to have an ED visit or readmission from those who did not. CTM‐3 has also been used to evaluate hospitals' level of care coordination and for public reporting purposes.[4, 5, 6] It has been endorsed by the National Quality Forum and incorporated into the Hospital Consumer Assessment of Healthcare Providers and Systems (HCAHPS) survey provided to samples of recently hospitalized US patients.[7] However, recent evidence from an inpatient cohort of cardiovascular patients suggests the CTM‐3 overinflates care transition scores compared to the longer 15‐item CTM. In that cohort, the CTM‐3 could not differentiate between patients who did or did not have repeat ED visits or readmission.[8] Thus far, the B‐PREPARED and CTM‐3 measures have not been compared to one another directly.
In addition to the development of patient‐reported measures, hospitals increasingly employ administrative algorithms to predict likelihood of readmission.[9] A commonly used measure is the LACE index (Length of stay, Acuity, Comorbidity, and Emergency department use).[10] The LACE index predicted readmission and death within 30 days of discharge in a large cohort in Canada. In 2 retrospective studies of recently hospitalized patients in the United States, the LACE index's ability to discriminate between patients readmitted or not ranged from slightly better than chance to moderate (C statistic 0.56‐0.77).[11, 12]
It is unknown whether adding patient‐reported preparedness measures to commonly used readmission prediction scores increases the ability to predict readmission risk. We sought to determine whether the B‐PREPARED and CTM‐3 measures were predictive of readmission or death, as compared to the LACE index, in a large cohort of cardiovascular patients. In addition, we sought to determine the additional predictive and discriminative ability gained from administering the B‐PREPARED and CTM‐3 measures, while adjusting for the LACE index and other clinical factors. We hypothesized that: (1) higher preparedness scores on both measures would predict lower risk of readmission or death in a cohort of patients hospitalized with cardiac diagnoses; and (2) because it provides more specific and actionable information, the B‐PREPARED would discriminate readmission more accurately than CTM‐3, after controlling for clinical factors.
METHODS
Study Setting and Design
The Vanderbilt Inpatient Cohort Study (VICS) is a prospective study of patients admitted with cardiovascular disease to Vanderbilt University Hospital. The purpose of VICS is to investigate the impact of patient and social factors on postdischarge health outcomes such as quality of life, unplanned hospital utilization, and mortality. The rationale and design of VICS are detailed elsewhere.[13] Briefly, participants completed a baseline interview while hospitalized, and follow‐up phone calls were conducted within 2 to 9 days and at approximately 30 and 90 days postdischarge. During the first follow‐up call conducted by research assistants, we collected preparedness for discharge data utilizing the 2 measures described below. After the 90‐day phone call, we collected healthcare utilization since the index admission. The study was approved by the Vanderbilt University Institutional Review Board.
Patients
Eligibility screening shortly after admission identified patients with acute decompensated heart failure (ADHF) and/or an intermediate or high likelihood of acute coronary syndrome (ACS) per a physician's review of the clinical record. Exclusion criteria included: age <18 years, non‐English speaker, unstable psychiatric illness, delirium, low likelihood of follow‐up (eg, no reliable telephone number), on hospice, or otherwise too ill to complete an interview. To be included in these analyses, patients must have completed the preparedness for discharge measurements during the first follow‐up call. Patients who died before discharge or before completing the follow‐up call were excluded.
Preparedness for Discharge Measures (Patient‐Reported Data)
Preparedness for discharge was assessed using the 11‐item B‐PREPARED and the 3‐item CTM‐3.
The B‐PREPARED measures how prepared patients felt leaving the hospital with regard to: self‐care information for medications and activity, equipment/community services needed, and confidence in managing one's health after hospitalization. The B‐PREPARED measure has good internal consistency reliability (Cronbach's = 0.76) and has been validated in patients of varying age within a week of discharge. Preparedness is the sum of responses to all 11 questions, with a range of 0 to 22. Higher scores reflect increased preparedness for discharge.[3]
The CTM‐3 asks patients to rate how well their preferences were considered regarding transitional needs, as well as their understanding of postdischarge self‐management and the purpose of their medications, each on a 4‐point response scale (strongly disagree to strongly agree). The sum of the 3 responses quantifies the patient's perception of the quality of the care transition at discharge (Cronbach's = 0.86,[14] 0.92 in a cohort similar to ours[8]). Scores range from 3 to 12, with higher score indicating more preparedness. Then, the sum is transformed to a 0 to 100 scale.[15]
Clinical Readmission Risk Measures (Medical Record Data)
The LACE index, published by Van Walraven et al.,[10] takes into account 4 categories of clinical data: length of hospital stay, acuity of event, comorbidities, and ED visits in the prior 6 months. More specifically, a diagnostic code‐based, modified version of the Charlson Comorbidity Index was used to calculate the comorbidity score. These clinical criteria were obtained from an administrative database and weighted according to the methods used by Van Walraven et al. An overall score was calculated on a scale of 0 to 19, with higher scores indicating higher risk of readmission or death within 30 days.
From medical records, we also collected patients' demographic data including age, race, and gender, and diagnosis of ACS, ADHF, or both at hospital admission.
Outcome Measures
Healthcare utilization data were obtained from the index hospital as well as outside facilities. The electronic medical records from Vanderbilt University Hospital provided information about healthcare utilization at Vanderbilt 90 days after initial discharge. We also used Vanderbilt records to see if patients were transferred to Vanderbilt from other hospitals or if patients visited other hospitals before or after enrollment. We supplemented this with patient self‐report during the follow‐up telephone calls (at 30 and 90 days after initial discharge) so that any additional ED and hospital visits could be captured. Mortality data were collected from medical records, Social Security data, and family reports. The main outcome was time to first unplanned hospital readmission or death within 30 and 90 days of discharge.
Analysis
To describe our sample, we summarized categorical variables with percentages and continuous variables with percentiles. To test for evidence of unadjusted covariate‐outcome relationships, we used Pearson 2 and Wilcoxon rank sum tests for categorical and continuous covariates, respectively.
For the primary analyses we used Cox proportional hazard models to examine the independent associations between the prespecified predictors for patient‐reported preparedness and time to first unplanned readmission or death within 30 and 90 days of discharge. For each outcome (30‐ and 90‐day readmission or death), we fit marginal models separately for each of the B‐PREPARED, CTM‐3, and LACE scores. We then fit multivariable models that used both preparedness measures as well as age, gender, race, and diagnosis (ADHF and/or ACS), variables available to clinicians when patients are admitted. When fitting the multivariable models, we did not find strong evidence of nonlinear effects; therefore, only linear effects are reported. To facilitate comparison of effects, we scaled continuous variables by their interquartile range (IQR). The associated, exponentiated regression parameter estimates may therefore be interpreted as hazard ratios for readmission or death per IQR change in each predictor. In addition to parameter estimation, we computed the C index to evaluate capacity for the model to discriminate those who were and were not readmitted or died. All analyses were conducted in R version 3.1.2 (R Foundation for Statistical Computing, Vienna, Austria).
RESULTS
From the cohort of 1239 patients (Figure 1), 64%, 28%, and 7% of patients were hospitalized with ACS, ADHF, or both, respectively (Table 1). Nearly 45% of patients were female, 83% were white, and the median age was 61 years (IQR 5269). The median length of stay was 3 days (IQR 25). The median preparedness scores were high for both B‐PREPARED (21, IQR 1822) and CTM‐3 (77.8, IQR 66.7100). A total of 211 (17%) and 380 (31%) were readmitted or died within 30 and 90 days, respectively. The completion rate for the postdischarge phone calls was 88%.
| Death or Readmission Within 30 Days | Death or Readmission Within 90 Days | |||||
|---|---|---|---|---|---|---|
| Not Readmitted, N = 1028 | Death/Readmitted, N = 211 | P Value | Not Readmitted, N = 859 | Death/Readmitted, N = 380 | P Value | |
| ||||||
| Gender, male | 55.8% (574) | 53.1% (112) | 0.463* | 56.3% (484) | 53.2% (202) | 0.298* |
| Female | 44.2% (454) | 46.9% (99) | 43.7% (375) | 46.8% (178) | ||
| Race, white | 83.9% (860) | 80.6% (170) | 0.237* | 86.0% (737) | 77.3% (293) | <0.001* |
| Race, nonwhite | 16.1% (165) | 19.4% (41) | 14.0% (120) | 22.7% (86) | ||
| Diagnosis ACS | 68.0% (699) | 46.4% (98) | <0.001* | 72.9% (626) | 45.0% (171) | <0.001* |
| ADHF | 24.8% (255) | 46.0% (97) | 20.3% (174) | 46.8% (178) | ||
| Both | 7.2% (74) | 7.6% (16) | 6.9% (59) | 8.2% (31) | ||
| Age | 39.4:52:61:68:80 | 37.5:53.5:62:70:82 | 0.301 | 40:52:61:68:80 | 38:52:61 :70:82 | 0.651 |
| LOS | 1:2:3:5:10 | 1:3: 4:7.5:17 | <0.001 | 1:2:3:5:9 | 1:3:4:7:15 | <0.001 |
| CTM‐3 | 55.6:66.7: 77.8:100:100 | 55.6:66.7:77.8:100 :100 | 0.305 | 55.6:66.7:88.9:100:100 | 55.6:66.7:77.8:100 :100 | 0.080 |
| B‐PREPARED | 12:18:21:22.:22 | 10:17:20:22:22 | 0.066 | 12:18:21:22:22 | 10:17:20 :22:22 | 0.030 |
| LACE | 1:4: 7:10 :14 | 3.5:7:10:13:17 | <0.001 | 1:4:6: 9:14 | 3:7:10:13:16 | <0.001 |

B‐PREPARED and CTM‐3 were moderately correlated with one another (Spearman's = 0.40, P < 0.001). In bivariate analyses (Table 1), the association between B‐PREPARED and readmission or death was significant at 90 days (P = 0.030) but not 30 days. The CTM‐3 showed no significant association with readmission or death at either time point. The LACE score was significantly associated with rates of readmission at 30 and 90 days (P < 0.001).
Outcomes Within 30 Days of Discharge
When examining readmission or death within 30 days of discharge, simple unadjusted models 2 and 3 showed that the B‐PREPARED and LACE scores, respectively, were each significantly associated with time to first readmission or death (Table 2). Specifically, a 4‐point increase in the B‐PREPARED score was associated with a 16% decrease in the hazard of readmission or death (hazard ratio [HR] = 0.84, 95% confidence interval [CI]: 0.72 to 0.97). A 5‐point increase in the LACE score was associated with a 100% increase in the hazard of readmission or death (HR = 2.00, 95% CI: 1.72 to 2.32). In the multivariable model with both preparedness scores and diagnosis (model 4), the B‐PREPARED score (HR = 0.82, 95% CI: 0.70 to 0.97) was significantly associated with time to first readmission or death. In the full 30‐day model including B‐PREPARED, CTM‐3, LACE, age, gender, race, and diagnosis (model 5), only the LACE score (HR = 1.83, 95% CI: 1.54 to 2.18) was independently associated with time to readmission or death. Finally, the CTM‐3 did not predict 30‐day readmission or death in any of the models tested.
| Models | HR (95% CI)* | P Value | C Index |
|---|---|---|---|
| |||
| 1. CTM (per 10‐point change) | 0.95 (0.88 to 1.03) | 0.257 | 0.523 |
| 2. B‐PREPARED (per 4‐point change) | 0.84 (0.72 to 0.97) | 0.017 | 0.537 |
| 3. LACE (per 5‐point change) | 2.00 (1.72 to 2.32) | <0.001 | 0.679 |
| 4. CTM (per 10‐point change) | 1.00 (0.92 to 1.10) | 0.935 | 0.620 |
| B‐PREPARED (per 4‐point change) | 0.82 (0.70 to 0.97) | 0.019 | |
| ADHF only (vs ACS only) | 2.46 (1.86 to 3.26) | <0.001 | |
| ADHF and ACS (vs ACS only) | 1.42 (0.84 to 2.42) | 0.191 | |
| 5. CTM (per 10‐point change) | 1.02 (0.93 to 1.11) | 0.722 | 0.692 |
| B‐PREPARED (per 4 point change) | 0.87 (0.74 to 1.03) | 0.106 | |
| LACE (per 5‐point change) | 1.83 (1.54 to 2.18) | <0.001 | |
| ADHF only (vs ACS only) | 1.51 (1.10 to 2.08) | 0.010 | |
| ADHF and ACS (vs ACS only) | 0.90 (0.52 to 1.55) | 0.690 | |
| Age (per 10‐year change) | 1.02 (0.92 to 1.14) | 0.669 | |
| Female (vs male) | 1.11 (0.85 to 1.46) | 0.438 | |
| Nonwhite (vs white) | 0.92 (0.64 to 1.30) | 0.624 | |
Outcomes Within 90 Days of Discharge
At 90 days after discharge, again the separate unadjusted models 2 and 3 demonstrated that the B‐PREPARED and LACE scores, respectively, were each significantly associated with time to first readmission or death, whereas the CTM‐3 model only showed marginal significance (Table 3). In the multivariable model with both preparedness scores and diagnosis (model 4), results were similar to 30 days as the B‐PREPARED score was significantly associated with time to first readmission or death. Lastly, in the full model (model 5) at 90 days, again the LACE score was significantly associated with time to first readmission or death. In addition, B‐PREPARED scores were associated with a significant decrease in risk of readmission or death (HR = 0.88, 95% CI: 0.78 to 1.00); CTM‐3 scores were not independently associated with outcomes.
| Model | HR (95% CI)* | P Value | C Index |
|---|---|---|---|
| |||
| 1. CTM (per 10‐point change) | 0.94 (0.89 to 1.00) | 0.051 | 0.526 |
| 2. B‐PREPARED (per 4‐point change) | 0.84 (0.75 to 0.94) | 0.002 | 0.533 |
| 3. LACE (per 5‐point change) | 2.03 (1.82 to 2.27) | <0.001 | 0.683 |
| 4. CTM (per 10‐point change) | 0.99 (0.93 to 1.06) | 0.759 | 0.640 |
| B‐PREPARED (per 4‐point change) | 0.83 (0.74 to 0.94) | 0.003 | |
| ADHF only (vs ACS only) | 2.88 (2.33 to 3.56) | <0.001 | |
| ADHF and ACS (vs ACS only) | 1.62 (1.11 to 2.38) | 0.013 | |
| 5. CTM (per 10‐point change) | 1.00 (0.94 to 1.07) | 0.932 | 0.698 |
| B‐PREPARED (per 4‐point change) | 0.88 (0.78 to 1.00) | 0.043 | |
| LACE (per 5‐point change) | 1.76 (1.55 to 2.00) | <0.001 | |
| ADHF only (vs ACS only) | 1.76 (1.39 to 2.24) | <0.001 | |
| ADHF and ACS (vs ACS only) | 1.00 (0.67 to 1.50) | 0.980 | |
| Age (per 10‐year change) | 1.00 (0.93 to 1.09) | 0.894 | |
| Female (vs male) | 1.10 (0.90 to 1.35) | 0.341 | |
| Nonwhite (vs white) | 1.14 (0.89 to 1.47) | 0.288 | |
Tables 2 and 3 also display the C indices, or the discriminative ability of the models to differentiate whether or not a patient was readmitted or died. The range of the C index is 0.5 to 1, where values closer to 0.5 indicate random predictions and values closer to 1 indicate perfect prediction. At 30 days, the individual C indices for B‐PREPARED and CTM‐3 were only slightly better than chance (0.54 and 0.52, respectively) in their discriminative abilities. However, the C indices for the LACE score alone (0.68) and the multivariable model (0.69) including all 3 measures (ie, B‐PREPARED, CTM‐3, LACE), and clinical and demographic variables, had higher utility in discriminating patients who were readmitted/died or not. The 90‐day C indices were comparable in magnitude to those at 30 days.
DISCUSSION/CONCLUSION
In this cohort of patients hospitalized with cardiovascular disease, we compared 2 patient‐reported measures of preparedness for discharge, their association with time to death or readmission at 30 and 90 days, and their ability to discriminate patients who were or were not readmitted or died. Higher preparedness as measured by higher B‐PREPARED scores was associated with lower risk of readmission or death at 30 and 90 days after discharge in unadjusted models, and at 90 days in adjusted models. CTM‐3 was not associated with the outcome in any analyses. Lastly, the individual preparedness measures were not as strongly associated with readmission or death compared to the LACE readmission index alone.
How do our findings relate to the measurement of care transition quality? We consider 2 scenarios. First, if hospitals utilize the LACE index to predict readmission, then neither self‐reported measure of preparedness adds meaningfully to its predictive ability. However, hospital management may still find the B‐PREPARED and CTM‐3 useful as a means to direct care transition quality‐improvement efforts. These measures can instruct hospitals as to what areas their patients express the greatest difficulty or lack of preparedness and closely attend to patient needs with appropriate resources. Furthermore, the patient's perception of being prepared for discharge may be different than their actual preparedness. Their perceived preparedness may be affected by cognitive impairment, dissatisfaction with medical care, depression, lower health‐related quality of life, and lower educational attainment as demonstrated by Lau et al.[16] If a patient's perception of preparedness were low, it would behoove the clinician to investigate these other issues and address those that are mutable. Additionally, perceived preparedness may not correlate with the patient's understanding of their medical conditions, so it is imperative that clinicians provide prospective guidance about their probable postdischarge trajectory. If hospitals are not utilizing the LACE index, then perhaps using the B‐PREPARED, but not the CTM‐3, may be beneficial for predicting readmission.
How do our results fit with evidence from prior studies, and what do they mean in the context of care transitions quality? First, in the psychometric evaluation of the B‐PREPARED measure in a cohort of recently hospitalized patients, the mean score was 17.3, lower than the median of 21 in our cohort.[3] Numerous studies have utilized the CTM‐3 and the longer‐version CTM‐15. Though we cannot make a direct comparison, the median in our cohort (77.8) was on par with the means from other studies, which ranged from 63 to 82.[5, 17, 18, 19] Several studies also note ceiling effects with clusters of scores at the upper end of the scale, as did we. We conjecture that our cohort's preparedness scores may be higher because our institution has made concerted efforts to improve the discharge education for cardiovascular patients.
In a comparable patient population, the TRACE‐CORE (Transitions, Risks, and Actions in Coronary Events Center for Outcomes Research and Education) study is a cohort of more than 2200 patients with ACS who were administered the CTM‐15 within 1 month of discharge.[8] In that study, the median CTM‐15 score was 66.6, which is lower than our cohort. With regard to the predictive ability of the CTM‐3, they note that CTM‐3 scores did not differentiate between patients who were or were not readmitted or had emergency department visits. Our results support their concern that the CTM‐15 and by extension the CTM‐3, though adopted widely as part of HCAHPS, may not have sufficient ability to discriminate differences in patient outcomes or the quality of care transitions.
More recently, patient‐reported preparedness for discharge was assessed in a prospective cohort in Canada.[16] Lau et al. administered a single‐item measure of readiness at the time of discharge to general medicine patients, and found that lower readiness scores were also not associated with readmission or death at 30 days, when adjusted for the LACE index as we did.
We must acknowledge the limitations of our findings. First, our sample of recently discharged patients with cardiovascular disease is different than the community‐dwelling, underserved Americans hospitalized in the prior year, which served as the sample for reducing the CTM‐15 to 3 items.[5] This fact may explain why we did not find the CTM‐3 to be associated with readmission in our sample. Second, our analyses did not include extensive adjustment for patient‐related factors. Rather, our intention was to see how well the preparedness measures performed independently and compare their abilities to predict readmission, which is particularly relevant for clinicians who may not have all possible covariates in predicting readmission. Finally, because we limited the analyses to the patients who completed the B‐PREPARED and CTM‐3 measures (88% completion rate), we may not have data for: (1) very ill patients, who had a higher risk of readmission and least prepared, and were not able to answer the postdischarge phone call; and (2) very functional patients, who had a lower risk of readmission and were too busy to answer the postdischarge phone call. This may have limited the extremes in the spectrum of our sample.
Importantly, our study has several strengths. We report on the largest sample to date with results of both B‐PREPARED and CTM‐3. Moreover, we examined how these measures compared to a widely used readmission prediction tool, the LACE index. We had very high postdischarge phone call completion rates in the week following discharge. Furthermore, we had thorough assessment of readmission data through patient report, electronic medical record documentation, and collection of outside medical records.
Further research is needed to elucidate: (1) the ideal administration time of the patient‐reported measures of preparedness (before or after discharge), and (2) the challenges to the implementation of measures in healthcare systems. Remaining research questions center on the tradeoffs and barriers to implementing a longer measure like the 11‐item B‐PREPARED compared to a shorter measure like the CTM‐3. We do not know whether longer measures preclude their use by busy clinicians, though it provides more specific information about what patients feel they need at hospital discharge. Additionally, studies need to demonstrate the mutability of preparedness and the response of measures to interventions designed to improve the hospital discharge process.
In our sample of recently hospitalized cardiovascular patients, there was a statistically significant association between patient‐reported preparedness for discharged, as measured by B‐PREPARED, and readmissions/death at 30 and 90 days, but the magnitude of the association was very small. Furthermore, another patient‐reported preparedness measure, CTM‐3, was not associated with readmissions or death at either 30 or 90 days. Lastly, neither measure discriminated well between patients who were readmitted or not, and neither measure added meaningfully to the LACE index in terms of predicting 30‐ or 90‐day readmissions.
Disclosures
This study was supported by grant R01 HL109388 from the National Heart, Lung, and Blood Institute (Dr. Kripalani) and in part by grant UL1 RR024975‐01 from the National Center for Research Resources, and grant 2 UL1 TR000445‐06 from the National Center for Advancing Translational Sciences. Dr. Kripalani is a consultant to SAI Interactive and holds equity in Bioscape Digital, and is a consultant to and holds equity in PictureRx, LLC. Dr. Bell is supported by the National Institutes of Health (K23AG048347) and by the Eisenstein Women's Heart Fund. Dr. Vasilevskis is supported by the National Institutes of Health (K23AG040157) and the Geriatric Research, Education and Clinical Center. Dr. Mixon is a Veterans Affairs Health Services Research and Development Service Career Development awardee (12‐168) at the Nashville Department of Veterans Affairs. The content is solely the responsibility of the authors and does not necessarily represent the official views of the National Institutes of Health. The funding agency was not involved in the design and conduct of the study; collection, management, analysis, and interpretation of the data; and preparation, review, or approval of the manuscript. All authors had full access to all study data and had a significant role in writing the manuscript. The contents do not represent the views of the US Department of Veterans Affairs or the United States government. Dr. Kripalani is a consultant to and holds equity in PictureRx, LLC.
- Centers for Medicare 9(9):598–603.
- , , . Brief scale measuring patient preparedness for hospital discharge to home: psychometric properties. J Hosp Med. 2008;3(6):446–454.
- , , . Assessing the quality of preparation for posthospital care from the patient's perspective: the care transitions measure. Med Care. 2005;43(3):246–255.
- , , , . Assessing the quality of transitional care: further applications of the care transitions measure. Med Care. 2008;46(3):317–322.
- , , , , . The central role of performance measurement in improving the quality of transitional care. Home Health Care Serv Q. 2007;26(4):93–104.
- Centers for Medicare 3:e001053.
- , , , et al. Risk prediction models for hospital readmission: a systematic review. JAMA. 2011;306(15):1688–1698.
- , , , et al. Derivation and validation of an index to predict early death or unplanned readmission after discharge from hospital to the community. CMAJ. 2010;182(6):551–557.
- , , , et al. Using the LACE index to predict hospital readmissions in congestive heart failure patients. BMC Cardiovasc Disord. 2014;14:97.
- , , , . Validation of a predictive model to identify patients at high risk for hospital readmission. J Healthc Qual. 2016;38(1):34–41.
- , , , et al. Determinants of health after hospital discharge: rationale and design of the Vanderbilt Inpatient Cohort Study (VICS). BMC Health Serv Res. 2014;14:10.
- . CTM frequently asked questions. Available at: http://caretransitions.org/tools-and-resources/. Accessed January 22, 2016.
- . Instructions for scoring the CTM‐3. Available at: http://caretransitions.org/tools-and-resources/. Accessed January 22, 2016.
- , , , et al. Patient‐reported discharge readiness and 30‐day risk of readmission or death: a prospective cohort study. Am J Med. 2016;129:89–95.
- , , , , . Implementaiton of the Care Transitions Intervention: sustainability and lessons learned. Prof Case Manag. 2009;14(6):282–293.
- , , , . The care transitions innovation (C‐TraIn) for socioeconomically disadvantaged adults: results of a cluster randomized controlled trial. J Gen Intern Med. 2014;29(11):1460–1467.
- , , , et al. Telephone calls to patients after discharge from the hospital: an important part of transitions of care. Med Educ Online. 2015;29(20):26701.
In recent years, US hospitals have focused on decreasing readmission rates, incented by reimbursement penalties to hospitals having excessive readmissions.[1] Gaps in the quality of care provided during transitions likely contribute to preventable readmissions.[2] One compelling quality assessment in this setting is measuring patients' discharge preparedness, using key dimensions such as understanding their instructions for medication use and follow‐up. Patient‐reported preparedness for discharge may also be useful to identify risk of readmission.
Several patient‐reported measures of preparedness for discharge exist, and herein we describe 2 measures of interest. First, the Brief‐PREPARED (B‐PREPARED) measure was derived from the longer PREPARED instrument (Prescriptions, Ready to re‐enter community, Education, Placement, Assurance of safety, Realistic expectations, Empowerment, Directed to appropriate services), which reflects the patient's perceived needs at discharge. In previous research, the B‐PREPARED measure predicted emergency department (ED) visits for patients who had been recently hospitalized and had a high risk for readmission.[3] Second, the Care Transitions Measure‐3 (CTM‐3) was developed by Coleman et al. as a patient‐reported measure to discriminate between patients who were more likely to have an ED visit or readmission from those who did not. CTM‐3 has also been used to evaluate hospitals' level of care coordination and for public reporting purposes.[4, 5, 6] It has been endorsed by the National Quality Forum and incorporated into the Hospital Consumer Assessment of Healthcare Providers and Systems (HCAHPS) survey provided to samples of recently hospitalized US patients.[7] However, recent evidence from an inpatient cohort of cardiovascular patients suggests the CTM‐3 overinflates care transition scores compared to the longer 15‐item CTM. In that cohort, the CTM‐3 could not differentiate between patients who did or did not have repeat ED visits or readmission.[8] Thus far, the B‐PREPARED and CTM‐3 measures have not been compared to one another directly.
In addition to the development of patient‐reported measures, hospitals increasingly employ administrative algorithms to predict likelihood of readmission.[9] A commonly used measure is the LACE index (Length of stay, Acuity, Comorbidity, and Emergency department use).[10] The LACE index predicted readmission and death within 30 days of discharge in a large cohort in Canada. In 2 retrospective studies of recently hospitalized patients in the United States, the LACE index's ability to discriminate between patients readmitted or not ranged from slightly better than chance to moderate (C statistic 0.56‐0.77).[11, 12]
It is unknown whether adding patient‐reported preparedness measures to commonly used readmission prediction scores increases the ability to predict readmission risk. We sought to determine whether the B‐PREPARED and CTM‐3 measures were predictive of readmission or death, as compared to the LACE index, in a large cohort of cardiovascular patients. In addition, we sought to determine the additional predictive and discriminative ability gained from administering the B‐PREPARED and CTM‐3 measures, while adjusting for the LACE index and other clinical factors. We hypothesized that: (1) higher preparedness scores on both measures would predict lower risk of readmission or death in a cohort of patients hospitalized with cardiac diagnoses; and (2) because it provides more specific and actionable information, the B‐PREPARED would discriminate readmission more accurately than CTM‐3, after controlling for clinical factors.
METHODS
Study Setting and Design
The Vanderbilt Inpatient Cohort Study (VICS) is a prospective study of patients admitted with cardiovascular disease to Vanderbilt University Hospital. The purpose of VICS is to investigate the impact of patient and social factors on postdischarge health outcomes such as quality of life, unplanned hospital utilization, and mortality. The rationale and design of VICS are detailed elsewhere.[13] Briefly, participants completed a baseline interview while hospitalized, and follow‐up phone calls were conducted within 2 to 9 days and at approximately 30 and 90 days postdischarge. During the first follow‐up call conducted by research assistants, we collected preparedness for discharge data utilizing the 2 measures described below. After the 90‐day phone call, we collected healthcare utilization since the index admission. The study was approved by the Vanderbilt University Institutional Review Board.
Patients
Eligibility screening shortly after admission identified patients with acute decompensated heart failure (ADHF) and/or an intermediate or high likelihood of acute coronary syndrome (ACS) per a physician's review of the clinical record. Exclusion criteria included: age <18 years, non‐English speaker, unstable psychiatric illness, delirium, low likelihood of follow‐up (eg, no reliable telephone number), on hospice, or otherwise too ill to complete an interview. To be included in these analyses, patients must have completed the preparedness for discharge measurements during the first follow‐up call. Patients who died before discharge or before completing the follow‐up call were excluded.
Preparedness for Discharge Measures (Patient‐Reported Data)
Preparedness for discharge was assessed using the 11‐item B‐PREPARED and the 3‐item CTM‐3.
The B‐PREPARED measures how prepared patients felt leaving the hospital with regard to: self‐care information for medications and activity, equipment/community services needed, and confidence in managing one's health after hospitalization. The B‐PREPARED measure has good internal consistency reliability (Cronbach's = 0.76) and has been validated in patients of varying age within a week of discharge. Preparedness is the sum of responses to all 11 questions, with a range of 0 to 22. Higher scores reflect increased preparedness for discharge.[3]
The CTM‐3 asks patients to rate how well their preferences were considered regarding transitional needs, as well as their understanding of postdischarge self‐management and the purpose of their medications, each on a 4‐point response scale (strongly disagree to strongly agree). The sum of the 3 responses quantifies the patient's perception of the quality of the care transition at discharge (Cronbach's = 0.86,[14] 0.92 in a cohort similar to ours[8]). Scores range from 3 to 12, with higher score indicating more preparedness. Then, the sum is transformed to a 0 to 100 scale.[15]
Clinical Readmission Risk Measures (Medical Record Data)
The LACE index, published by Van Walraven et al.,[10] takes into account 4 categories of clinical data: length of hospital stay, acuity of event, comorbidities, and ED visits in the prior 6 months. More specifically, a diagnostic code‐based, modified version of the Charlson Comorbidity Index was used to calculate the comorbidity score. These clinical criteria were obtained from an administrative database and weighted according to the methods used by Van Walraven et al. An overall score was calculated on a scale of 0 to 19, with higher scores indicating higher risk of readmission or death within 30 days.
From medical records, we also collected patients' demographic data including age, race, and gender, and diagnosis of ACS, ADHF, or both at hospital admission.
Outcome Measures
Healthcare utilization data were obtained from the index hospital as well as outside facilities. The electronic medical records from Vanderbilt University Hospital provided information about healthcare utilization at Vanderbilt 90 days after initial discharge. We also used Vanderbilt records to see if patients were transferred to Vanderbilt from other hospitals or if patients visited other hospitals before or after enrollment. We supplemented this with patient self‐report during the follow‐up telephone calls (at 30 and 90 days after initial discharge) so that any additional ED and hospital visits could be captured. Mortality data were collected from medical records, Social Security data, and family reports. The main outcome was time to first unplanned hospital readmission or death within 30 and 90 days of discharge.
Analysis
To describe our sample, we summarized categorical variables with percentages and continuous variables with percentiles. To test for evidence of unadjusted covariate‐outcome relationships, we used Pearson 2 and Wilcoxon rank sum tests for categorical and continuous covariates, respectively.
For the primary analyses we used Cox proportional hazard models to examine the independent associations between the prespecified predictors for patient‐reported preparedness and time to first unplanned readmission or death within 30 and 90 days of discharge. For each outcome (30‐ and 90‐day readmission or death), we fit marginal models separately for each of the B‐PREPARED, CTM‐3, and LACE scores. We then fit multivariable models that used both preparedness measures as well as age, gender, race, and diagnosis (ADHF and/or ACS), variables available to clinicians when patients are admitted. When fitting the multivariable models, we did not find strong evidence of nonlinear effects; therefore, only linear effects are reported. To facilitate comparison of effects, we scaled continuous variables by their interquartile range (IQR). The associated, exponentiated regression parameter estimates may therefore be interpreted as hazard ratios for readmission or death per IQR change in each predictor. In addition to parameter estimation, we computed the C index to evaluate capacity for the model to discriminate those who were and were not readmitted or died. All analyses were conducted in R version 3.1.2 (R Foundation for Statistical Computing, Vienna, Austria).
RESULTS
From the cohort of 1239 patients (Figure 1), 64%, 28%, and 7% of patients were hospitalized with ACS, ADHF, or both, respectively (Table 1). Nearly 45% of patients were female, 83% were white, and the median age was 61 years (IQR 5269). The median length of stay was 3 days (IQR 25). The median preparedness scores were high for both B‐PREPARED (21, IQR 1822) and CTM‐3 (77.8, IQR 66.7100). A total of 211 (17%) and 380 (31%) were readmitted or died within 30 and 90 days, respectively. The completion rate for the postdischarge phone calls was 88%.
| Death or Readmission Within 30 Days | Death or Readmission Within 90 Days | |||||
|---|---|---|---|---|---|---|
| Not Readmitted, N = 1028 | Death/Readmitted, N = 211 | P Value | Not Readmitted, N = 859 | Death/Readmitted, N = 380 | P Value | |
| ||||||
| Gender, male | 55.8% (574) | 53.1% (112) | 0.463* | 56.3% (484) | 53.2% (202) | 0.298* |
| Female | 44.2% (454) | 46.9% (99) | 43.7% (375) | 46.8% (178) | ||
| Race, white | 83.9% (860) | 80.6% (170) | 0.237* | 86.0% (737) | 77.3% (293) | <0.001* |
| Race, nonwhite | 16.1% (165) | 19.4% (41) | 14.0% (120) | 22.7% (86) | ||
| Diagnosis ACS | 68.0% (699) | 46.4% (98) | <0.001* | 72.9% (626) | 45.0% (171) | <0.001* |
| ADHF | 24.8% (255) | 46.0% (97) | 20.3% (174) | 46.8% (178) | ||
| Both | 7.2% (74) | 7.6% (16) | 6.9% (59) | 8.2% (31) | ||
| Age | 39.4:52:61:68:80 | 37.5:53.5:62:70:82 | 0.301 | 40:52:61:68:80 | 38:52:61 :70:82 | 0.651 |
| LOS | 1:2:3:5:10 | 1:3: 4:7.5:17 | <0.001 | 1:2:3:5:9 | 1:3:4:7:15 | <0.001 |
| CTM‐3 | 55.6:66.7: 77.8:100:100 | 55.6:66.7:77.8:100 :100 | 0.305 | 55.6:66.7:88.9:100:100 | 55.6:66.7:77.8:100 :100 | 0.080 |
| B‐PREPARED | 12:18:21:22.:22 | 10:17:20:22:22 | 0.066 | 12:18:21:22:22 | 10:17:20 :22:22 | 0.030 |
| LACE | 1:4: 7:10 :14 | 3.5:7:10:13:17 | <0.001 | 1:4:6: 9:14 | 3:7:10:13:16 | <0.001 |
B‐PREPARED and CTM‐3 were moderately correlated with one another (Spearman's = 0.40, P < 0.001). In bivariate analyses (Table 1), the association between B‐PREPARED and readmission or death was significant at 90 days (P = 0.030) but not 30 days. The CTM‐3 showed no significant association with readmission or death at either time point. The LACE score was significantly associated with rates of readmission at 30 and 90 days (P < 0.001).
Outcomes Within 30 Days of Discharge
When examining readmission or death within 30 days of discharge, simple unadjusted models 2 and 3 showed that the B‐PREPARED and LACE scores, respectively, were each significantly associated with time to first readmission or death (Table 2). Specifically, a 4‐point increase in the B‐PREPARED score was associated with a 16% decrease in the hazard of readmission or death (hazard ratio [HR] = 0.84, 95% confidence interval [CI]: 0.72 to 0.97). A 5‐point increase in the LACE score was associated with a 100% increase in the hazard of readmission or death (HR = 2.00, 95% CI: 1.72 to 2.32). In the multivariable model with both preparedness scores and diagnosis (model 4), the B‐PREPARED score (HR = 0.82, 95% CI: 0.70 to 0.97) was significantly associated with time to first readmission or death. In the full 30‐day model including B‐PREPARED, CTM‐3, LACE, age, gender, race, and diagnosis (model 5), only the LACE score (HR = 1.83, 95% CI: 1.54 to 2.18) was independently associated with time to readmission or death. Finally, the CTM‐3 did not predict 30‐day readmission or death in any of the models tested.
| Models | HR (95% CI)* | P Value | C Index |
|---|---|---|---|
| |||
| 1. CTM (per 10‐point change) | 0.95 (0.88 to 1.03) | 0.257 | 0.523 |
| 2. B‐PREPARED (per 4‐point change) | 0.84 (0.72 to 0.97) | 0.017 | 0.537 |
| 3. LACE (per 5‐point change) | 2.00 (1.72 to 2.32) | <0.001 | 0.679 |
| 4. CTM (per 10‐point change) | 1.00 (0.92 to 1.10) | 0.935 | 0.620 |
| B‐PREPARED (per 4‐point change) | 0.82 (0.70 to 0.97) | 0.019 | |
| ADHF only (vs ACS only) | 2.46 (1.86 to 3.26) | <0.001 | |
| ADHF and ACS (vs ACS only) | 1.42 (0.84 to 2.42) | 0.191 | |
| 5. CTM (per 10‐point change) | 1.02 (0.93 to 1.11) | 0.722 | 0.692 |
| B‐PREPARED (per 4 point change) | 0.87 (0.74 to 1.03) | 0.106 | |
| LACE (per 5‐point change) | 1.83 (1.54 to 2.18) | <0.001 | |
| ADHF only (vs ACS only) | 1.51 (1.10 to 2.08) | 0.010 | |
| ADHF and ACS (vs ACS only) | 0.90 (0.52 to 1.55) | 0.690 | |
| Age (per 10‐year change) | 1.02 (0.92 to 1.14) | 0.669 | |
| Female (vs male) | 1.11 (0.85 to 1.46) | 0.438 | |
| Nonwhite (vs white) | 0.92 (0.64 to 1.30) | 0.624 | |
Outcomes Within 90 Days of Discharge
At 90 days after discharge, again the separate unadjusted models 2 and 3 demonstrated that the B‐PREPARED and LACE scores, respectively, were each significantly associated with time to first readmission or death, whereas the CTM‐3 model only showed marginal significance (Table 3). In the multivariable model with both preparedness scores and diagnosis (model 4), results were similar to 30 days as the B‐PREPARED score was significantly associated with time to first readmission or death. Lastly, in the full model (model 5) at 90 days, again the LACE score was significantly associated with time to first readmission or death. In addition, B‐PREPARED scores were associated with a significant decrease in risk of readmission or death (HR = 0.88, 95% CI: 0.78 to 1.00); CTM‐3 scores were not independently associated with outcomes.
| Model | HR (95% CI)* | P Value | C Index |
|---|---|---|---|
| |||
| 1. CTM (per 10‐point change) | 0.94 (0.89 to 1.00) | 0.051 | 0.526 |
| 2. B‐PREPARED (per 4‐point change) | 0.84 (0.75 to 0.94) | 0.002 | 0.533 |
| 3. LACE (per 5‐point change) | 2.03 (1.82 to 2.27) | <0.001 | 0.683 |
| 4. CTM (per 10‐point change) | 0.99 (0.93 to 1.06) | 0.759 | 0.640 |
| B‐PREPARED (per 4‐point change) | 0.83 (0.74 to 0.94) | 0.003 | |
| ADHF only (vs ACS only) | 2.88 (2.33 to 3.56) | <0.001 | |
| ADHF and ACS (vs ACS only) | 1.62 (1.11 to 2.38) | 0.013 | |
| 5. CTM (per 10‐point change) | 1.00 (0.94 to 1.07) | 0.932 | 0.698 |
| B‐PREPARED (per 4‐point change) | 0.88 (0.78 to 1.00) | 0.043 | |
| LACE (per 5‐point change) | 1.76 (1.55 to 2.00) | <0.001 | |
| ADHF only (vs ACS only) | 1.76 (1.39 to 2.24) | <0.001 | |
| ADHF and ACS (vs ACS only) | 1.00 (0.67 to 1.50) | 0.980 | |
| Age (per 10‐year change) | 1.00 (0.93 to 1.09) | 0.894 | |
| Female (vs male) | 1.10 (0.90 to 1.35) | 0.341 | |
| Nonwhite (vs white) | 1.14 (0.89 to 1.47) | 0.288 | |
Tables 2 and 3 also display the C indices, or the discriminative ability of the models to differentiate whether or not a patient was readmitted or died. The range of the C index is 0.5 to 1, where values closer to 0.5 indicate random predictions and values closer to 1 indicate perfect prediction. At 30 days, the individual C indices for B‐PREPARED and CTM‐3 were only slightly better than chance (0.54 and 0.52, respectively) in their discriminative abilities. However, the C indices for the LACE score alone (0.68) and the multivariable model (0.69) including all 3 measures (ie, B‐PREPARED, CTM‐3, LACE), and clinical and demographic variables, had higher utility in discriminating patients who were readmitted/died or not. The 90‐day C indices were comparable in magnitude to those at 30 days.
DISCUSSION/CONCLUSION
In this cohort of patients hospitalized with cardiovascular disease, we compared 2 patient‐reported measures of preparedness for discharge, their association with time to death or readmission at 30 and 90 days, and their ability to discriminate patients who were or were not readmitted or died. Higher preparedness as measured by higher B‐PREPARED scores was associated with lower risk of readmission or death at 30 and 90 days after discharge in unadjusted models, and at 90 days in adjusted models. CTM‐3 was not associated with the outcome in any analyses. Lastly, the individual preparedness measures were not as strongly associated with readmission or death compared to the LACE readmission index alone.
How do our findings relate to the measurement of care transition quality? We consider 2 scenarios. First, if hospitals utilize the LACE index to predict readmission, then neither self‐reported measure of preparedness adds meaningfully to its predictive ability. However, hospital management may still find the B‐PREPARED and CTM‐3 useful as a means to direct care transition quality‐improvement efforts. These measures can instruct hospitals as to what areas their patients express the greatest difficulty or lack of preparedness and closely attend to patient needs with appropriate resources. Furthermore, the patient's perception of being prepared for discharge may be different than their actual preparedness. Their perceived preparedness may be affected by cognitive impairment, dissatisfaction with medical care, depression, lower health‐related quality of life, and lower educational attainment as demonstrated by Lau et al.[16] If a patient's perception of preparedness were low, it would behoove the clinician to investigate these other issues and address those that are mutable. Additionally, perceived preparedness may not correlate with the patient's understanding of their medical conditions, so it is imperative that clinicians provide prospective guidance about their probable postdischarge trajectory. If hospitals are not utilizing the LACE index, then perhaps using the B‐PREPARED, but not the CTM‐3, may be beneficial for predicting readmission.
How do our results fit with evidence from prior studies, and what do they mean in the context of care transitions quality? First, in the psychometric evaluation of the B‐PREPARED measure in a cohort of recently hospitalized patients, the mean score was 17.3, lower than the median of 21 in our cohort.[3] Numerous studies have utilized the CTM‐3 and the longer‐version CTM‐15. Though we cannot make a direct comparison, the median in our cohort (77.8) was on par with the means from other studies, which ranged from 63 to 82.[5, 17, 18, 19] Several studies also note ceiling effects with clusters of scores at the upper end of the scale, as did we. We conjecture that our cohort's preparedness scores may be higher because our institution has made concerted efforts to improve the discharge education for cardiovascular patients.
In a comparable patient population, the TRACE‐CORE (Transitions, Risks, and Actions in Coronary Events Center for Outcomes Research and Education) study is a cohort of more than 2200 patients with ACS who were administered the CTM‐15 within 1 month of discharge.[8] In that study, the median CTM‐15 score was 66.6, which is lower than our cohort. With regard to the predictive ability of the CTM‐3, they note that CTM‐3 scores did not differentiate between patients who were or were not readmitted or had emergency department visits. Our results support their concern that the CTM‐15 and by extension the CTM‐3, though adopted widely as part of HCAHPS, may not have sufficient ability to discriminate differences in patient outcomes or the quality of care transitions.
More recently, patient‐reported preparedness for discharge was assessed in a prospective cohort in Canada.[16] Lau et al. administered a single‐item measure of readiness at the time of discharge to general medicine patients, and found that lower readiness scores were also not associated with readmission or death at 30 days, when adjusted for the LACE index as we did.
We must acknowledge the limitations of our findings. First, our sample of recently discharged patients with cardiovascular disease is different than the community‐dwelling, underserved Americans hospitalized in the prior year, which served as the sample for reducing the CTM‐15 to 3 items.[5] This fact may explain why we did not find the CTM‐3 to be associated with readmission in our sample. Second, our analyses did not include extensive adjustment for patient‐related factors. Rather, our intention was to see how well the preparedness measures performed independently and compare their abilities to predict readmission, which is particularly relevant for clinicians who may not have all possible covariates in predicting readmission. Finally, because we limited the analyses to the patients who completed the B‐PREPARED and CTM‐3 measures (88% completion rate), we may not have data for: (1) very ill patients, who had a higher risk of readmission and least prepared, and were not able to answer the postdischarge phone call; and (2) very functional patients, who had a lower risk of readmission and were too busy to answer the postdischarge phone call. This may have limited the extremes in the spectrum of our sample.
Importantly, our study has several strengths. We report on the largest sample to date with results of both B‐PREPARED and CTM‐3. Moreover, we examined how these measures compared to a widely used readmission prediction tool, the LACE index. We had very high postdischarge phone call completion rates in the week following discharge. Furthermore, we had thorough assessment of readmission data through patient report, electronic medical record documentation, and collection of outside medical records.
Further research is needed to elucidate: (1) the ideal administration time of the patient‐reported measures of preparedness (before or after discharge), and (2) the challenges to the implementation of measures in healthcare systems. Remaining research questions center on the tradeoffs and barriers to implementing a longer measure like the 11‐item B‐PREPARED compared to a shorter measure like the CTM‐3. We do not know whether longer measures preclude their use by busy clinicians, though it provides more specific information about what patients feel they need at hospital discharge. Additionally, studies need to demonstrate the mutability of preparedness and the response of measures to interventions designed to improve the hospital discharge process.
In our sample of recently hospitalized cardiovascular patients, there was a statistically significant association between patient‐reported preparedness for discharged, as measured by B‐PREPARED, and readmissions/death at 30 and 90 days, but the magnitude of the association was very small. Furthermore, another patient‐reported preparedness measure, CTM‐3, was not associated with readmissions or death at either 30 or 90 days. Lastly, neither measure discriminated well between patients who were readmitted or not, and neither measure added meaningfully to the LACE index in terms of predicting 30‐ or 90‐day readmissions.
Disclosures
This study was supported by grant R01 HL109388 from the National Heart, Lung, and Blood Institute (Dr. Kripalani) and in part by grant UL1 RR024975‐01 from the National Center for Research Resources, and grant 2 UL1 TR000445‐06 from the National Center for Advancing Translational Sciences. Dr. Kripalani is a consultant to SAI Interactive and holds equity in Bioscape Digital, and is a consultant to and holds equity in PictureRx, LLC. Dr. Bell is supported by the National Institutes of Health (K23AG048347) and by the Eisenstein Women's Heart Fund. Dr. Vasilevskis is supported by the National Institutes of Health (K23AG040157) and the Geriatric Research, Education and Clinical Center. Dr. Mixon is a Veterans Affairs Health Services Research and Development Service Career Development awardee (12‐168) at the Nashville Department of Veterans Affairs. The content is solely the responsibility of the authors and does not necessarily represent the official views of the National Institutes of Health. The funding agency was not involved in the design and conduct of the study; collection, management, analysis, and interpretation of the data; and preparation, review, or approval of the manuscript. All authors had full access to all study data and had a significant role in writing the manuscript. The contents do not represent the views of the US Department of Veterans Affairs or the United States government. Dr. Kripalani is a consultant to and holds equity in PictureRx, LLC.
- Centers for Medicare 9(9):598–603.
- , , . Brief scale measuring patient preparedness for hospital discharge to home: psychometric properties. J Hosp Med. 2008;3(6):446–454.
- , , . Assessing the quality of preparation for posthospital care from the patient's perspective: the care transitions measure. Med Care. 2005;43(3):246–255.
- , , , . Assessing the quality of transitional care: further applications of the care transitions measure. Med Care. 2008;46(3):317–322.
- , , , , . The central role of performance measurement in improving the quality of transitional care. Home Health Care Serv Q. 2007;26(4):93–104.
- Centers for Medicare 3:e001053.
- , , , et al. Risk prediction models for hospital readmission: a systematic review. JAMA. 2011;306(15):1688–1698.
- , , , et al. Derivation and validation of an index to predict early death or unplanned readmission after discharge from hospital to the community. CMAJ. 2010;182(6):551–557.
- , , , et al. Using the LACE index to predict hospital readmissions in congestive heart failure patients. BMC Cardiovasc Disord. 2014;14:97.
- , , , . Validation of a predictive model to identify patients at high risk for hospital readmission. J Healthc Qual. 2016;38(1):34–41.
- , , , et al. Determinants of health after hospital discharge: rationale and design of the Vanderbilt Inpatient Cohort Study (VICS). BMC Health Serv Res. 2014;14:10.
- . CTM frequently asked questions. Available at: http://caretransitions.org/tools-and-resources/. Accessed January 22, 2016.
- . Instructions for scoring the CTM‐3. Available at: http://caretransitions.org/tools-and-resources/. Accessed January 22, 2016.
- , , , et al. Patient‐reported discharge readiness and 30‐day risk of readmission or death: a prospective cohort study. Am J Med. 2016;129:89–95.
- , , , , . Implementaiton of the Care Transitions Intervention: sustainability and lessons learned. Prof Case Manag. 2009;14(6):282–293.
- , , , . The care transitions innovation (C‐TraIn) for socioeconomically disadvantaged adults: results of a cluster randomized controlled trial. J Gen Intern Med. 2014;29(11):1460–1467.
- , , , et al. Telephone calls to patients after discharge from the hospital: an important part of transitions of care. Med Educ Online. 2015;29(20):26701.
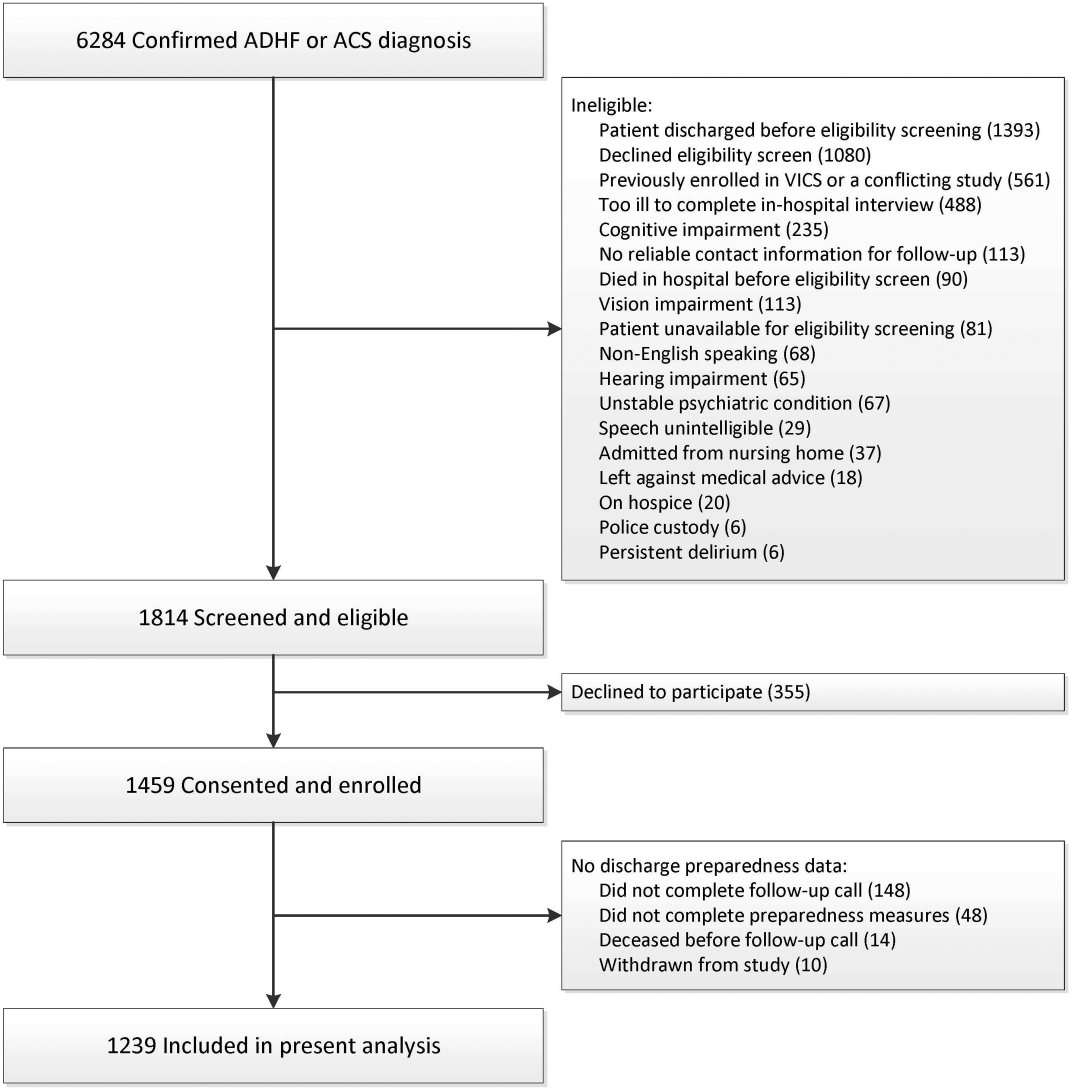
Primary Medication Nonadherence
Medication nonadherence after hospital discharge impacts morbidity and mortality in patients with cardiovascular disease.[1] Primary nonadherence, part of the spectrum of medication underuse, occurs when a patient receives a prescription but does not fill it.[1] Prior studies utilizing retrospective administrative data have found a prevalence of postdischarge primary nonadherence between 24% and 28%,[1, 2] similar to findings in a variety of outpatient populations.[3, 4]
One strategy for reduction in nonadherence is discharge medication counseling, which has been associated with improved postdischarge outcomes.[1] We evaluated the prevalence and predictors of refractory primary nonadherence in a cohort of patients hospitalized for acute cardiovascular conditions who received pharmacist counseling prior to discharge to guide future adherence interventions.
METHODS
Setting and Participants
The present study represents a secondary analysis of data from the Pharmacist Intervention for Low Literacy in Cardiovascular Disease (PILL‐CVD) study. PILL‐CVD was a randomized controlled trial that evaluated the effect of a tailored intervention consisting of pharmacist‐assisted medication reconciliation, discharge counseling, low‐literacy adherence aids, and follow‐up phone calls in adults hospitalized for acute coronary syndromes or acute decompensated heart failure. Patients likely to be discharged home taking primary responsibility for their medication management were eligible. Full study methods and results, including inclusion and exclusion criteria, can be found elsewhere.[5] The institutional review boards of each site approved the study.
For the present analysis, patients were included if they had any new discharge prescriptions to fill and received the study intervention, including a postdischarge follow‐up phone call with questions about filling discharge prescriptions.
Baseline Measures
Baseline data were obtained from medical records and patient interviews, including demographic information as well as survey data for cognitive impairment (Mini‐Cog) and health literacy (Short Test of Functional Health Literacy in Adults).[6, 7]
Data were also collected related to medication use, including the number of scheduled and as‐needed medications listed at discharge, self‐reported preadmission adherence, medication understanding, and medication management practices (eg, use of a pillbox, refill reminders). Self‐reported medication adherence was measured with the 4‐item Morisky scale.[8] Medication understanding was assessed with a tool previously developed by Marvanova et al.[9]
Outcome Measures
The primary outcome was the percentage of patients who reported not filling at least 1 discharge prescription on a telephone call that was conducted 1 to 4 days postdischarge. Patients were asked a dichotomous question about whether or not they filled all of their discharge prescriptions. Further characterization of the class or number of medications not filled was not performed. Patients were asked to provide a reason for not filling the prescriptions.
Analysis
We evaluated the prevalence and possible predictors of primary nonadherence including age, gender, race, marital status, education and income levels, insurance type, health literacy, cognition, presence of a primary care physician, number of listed discharge medications, prehospital medication adherence, medication understanding, and medication management practices using Pearson 2, Fisher exact, or Wilcoxon rank sum tests as appropriate. Multiple logistic regression with backward elimination was performed to identify independent predictors, selected with P values<0.1. We also evaluated reasons that patients cited for not filling prescriptions. Two‐sided P values<0.05 were considered statistically significant. All analyses were conducted using Stata version 13.1 (StataCorp LP, College Station, TX).
RESULTS
Of 851 patients in the PILL‐CVD study, the present sample includes 341 patients who received the intervention, completed the postdischarge follow‐up call, and had new discharge prescriptions to be filled. This represents 85% of patients who received the intervention.
The mean age of participants was 61.3 years, and 59.5% were male (Table 1). The majority were white (75.1%), and 88% had at least a high school education. Married or cohabitating patients represented 54.3% of the group. Just over half of the patients (54%) had an income of $35K or greater. The primary source of insurance for 82.5% of patients was either Medicare or private insurance, and 7.4% of patients were self‐pay. Most patients (80%) had adequate health literacy. The median Mini‐Cog score was 4 out of 5 (interquartile range [IQR]=35), and 11% of patients had scores indicating cognitive impairment. Just less than one‐fourth of the patients (24.1%) had a Morisky score of 8, indicating high self‐reported adherence, and the median score of patients' understanding of medications (range of 03) was 2.5 (IQR=2.22.8), reflecting relatively high understanding. The median number of prescriptions on patients' discharge medications lists was 10 (IQR=813).
| Variable | Overall 341 (100.0%) | Filled Prescription309 (90.6%) | Did Not Fill 32 (9.4%) | P Value |
|---|---|---|---|---|
| ||||
| Age, y, N (%) | 0.745a | |||
| 1849 | 69 | 63 (91.3) | 6 (8.7) | |
| 5064 | 128 | 114 (89.1) | 14 (10.9) | |
| 65+ | 144 | 132 (91.7) | 12 (8.3) | |
| Gender, N (%) | 0.056a | |||
| Male | 203 | 189 (93.1) | 14 (6.9) | |
| Female | 138 | 120 (87.0) | 18 (13.0) | |
| Race, N (%) | 0.712a | |||
| White | 256 | 234 (91.4) | 22 (8.6) | |
| African American | 60 | 54 (90.0) | 6 (10.0) | |
| Other | 22 | 19 (86.4) | 3 (13.6) | |
| Education, N (%) | 0.054a | |||
| Less than high school | 40 | 32 (80.0) | 8 (20.0) | |
| High school | 99 | 91 (91.9) | 8 (8.1) | |
| 1315 years | 93 | 83 (89.2) | 10 (10.8) | |
| 16 years | 109 | 103 (94.5) | 6 (5.5) | |
| Marital status, N (%) | ||||
| Separated/divorced/widowed/never married | 156 | 135 (86.5) | 21 (13.5) | 0.018a, b |
| Married/cohabitating | 185 | 174 (94.1) | 11 (5.9) | |
| Income, N (%) | 0.040a, b | |||
| <10K<20K | 58 | 48 (82.8) | 10 (17.2) | |
| 20K35K | 86 | 76 (88.4) | 10 (11.6) | |
| 35K<50K | 40 | 36 (90.0) | 4 (10.0) | |
| 50K<75K | 46 | 43 (93.5) | 3 (6.5) | |
| 75K+ | 83 | 81 (97.6) | 2 (2.4) | |
| Primary source of payment, N (%) | 0.272a | |||
| Medicaid | 34 | 28 (82.4) | 6 (17.6) | |
| Medicare | 145 | 131 (90.3) | 14 (9.7) | |
| Private | 132 | 123 (93.2) | 9 (6.8) | |
| Self‐pay | 25 | 22 (88.0) | 3 (12.0) | |
| Primary care physician, N (%) | 1.000c | |||
| None/do not know | 28 | 26 (92.9) | 2 (7.1) | |
| Yes | 313 | 283 (90.4) | 30 (9.6) | |
| Site, N (%) | 0.071a | |||
| Nashville, TN | 172 | 151 (87.8) | 21 (12.2) | |
| Boston, MA | 169 | 158 (93.5) | 11 (6.5) | |
The prevalence of refractory primary nonadherence was 9.4%. In univariate analysis, single marital status, lower income, and having more than 10 total discharge medications were significantly associated with not filling medications (P=0.018, 0.04, 0.016, respectively; Table 1). In multivariable analysis, single marital status and having more than 10 total discharge medications maintained significance when controlling for other patient characteristics. Patients who were single had higher odds of failing to fill discharge prescriptions compared to married or cohabitating individuals (odds ratio [OR]: 2.2, 95% confidence interval [CI]: 1.014.8, P=0.047). Patients with more than 10 discharge medications also had higher odds of failing to fill compared with patients who had fewer total medications (OR: 2.3, 95% CI: 1.054.98, P=0.036).
Filling discharge prescriptions was not associated with health literacy, cognition, prehospital adherence, patients' medication understanding, or any of the surveyed medication management practices (Table 2). Patients' reasons for not filling included lack of time to go to the pharmacy, medications not being delivered or dispensed, or inability to afford prescriptions. Prescription cost was cited by 23.5% of patients who did not fill their prescriptions and provided a reason.
| Variable | Overall 341 (100.0%) | Filled Prescription 309 (90.6%) | Did Not Fill 32 (9.4%) | P Value |
|---|---|---|---|---|
| ||||
| s‐TOFHLA score, range 036, N (%) | 0.443a | |||
| Inadequate, 016 | 40 | 34 (85.0) | 6 (15.0) | |
| Marginal, 1722 | 27 | 25 (92.6) | 2 (7.4) | |
| Adequate, 2336 | 268 | 244 (91.0) | 24 (9.0) | |
| MiniCog score, range 05, N (%) | 0.764b | |||
| Not impaired, 35 | 304 | 276 (90.8) | 28 (9.2) | |
| Impaired, 02 | 37 | 33 (89.2) | 4 (10.8) | |
| Morisky score, range 48, N (%) | 0.517a | |||
| Low/moderate self‐reported adherence, 47 | 249 | 224 (90.0) | 25 (10.0) | |
| High self‐reported adherence, 8 | 79 | 73 (92.4) | 6 (7.6) | |
| No. of discharge medications, range 126, N (%)c | 0.016a | |||
| 010 medications | 186 | 175 (94.1) | 11 (5.9) | |
| 11+medications | 155 | 134 (86.5) | 21 (13.5) | |
| Patient responses to medication behavior questions | ||||
| Patient associates medication taking time with daily events | 253 | 229 (90.5) | 24 (9.5) | 0.913a |
| Patient uses a pillbox to organize medicine | 180 | 162 (90.0) | 18 (10.0) | 0.680a |
| Friends of family help remind patient when it is time to take medicine | 89 | 79 (88.8) | 10 (11.2) | 0.486a |
| Patient writes down instructions for when to take medicine | 60 | 55 (91.7) | 5 (8.3) | 0.758a |
| Patient uses an alarm or a reminder that beeps when it is time to take medicine | 8 | 6 (75.0) | 2 (25.0) | 0.167a |
| Patient marks refill date on calendar | 38 | 35 (92.1) | 3 (7.9) | 1.000b |
| Pharmacy gives or sends patient a reminder when it is time to refill medicine | 94 | 84 (89.4) | 10 (10.6) | 0.624a |
| Friends or family help patient to refill medicine | 60 | 53 (88.3) | 7 (11.7) | 0.504a |
DISCUSSION
Almost 1 in 10 patients hospitalized with cardiovascular disease demonstrated primary nonadherence refractory to an intervention including pharmacist discharge medication counseling. Being unmarried and having greater than 10 medications at discharge were significantly associated with higher primary nonadherence when controlling for other patient factors.
Patients with a cohabitant partner were significantly less likely to exhibit primary nonadherence, which may reflect higher levels of social support, including encouragement for disease self‐management and/or support with tasks such as picking up medications from the pharmacy. Previous research has demonstrated that social support mediates outpatient medication adherence for heart failure patients.[10]
Similar to Jackevicius et al., we found that patients with more medications at discharge were less likely to fill their prescriptions.[1] These findings may reflect the challenges that patients face in adhering to complex treatment plans, which are associated with increased coordination and cost. Conversely, some prior studies have found that patients with fewer prescriptions were less likely to fill.[11, 12] These patients were often younger, thus potentially less conditioned to fill prescriptions, and unlike our cohort, these populations had consistent prescription coverage. Interventions for polypharmacy, which have been shown to improve outcomes and decrease costs, especially in the geriatric population, may be of benefit for primary nonadherence as well.[13]
Additionally, patients with lower household incomes had higher rates of primary nonadherence, at least in univariate analysis. Medication cost and transportation limitations, which are more pronounced in lower‐income patients, likely play influential roles in this group. These findings build on prior literature that has found lower prescription cost to be associated with better medication adherence in a variety of settings.[3, 4, 14]
Because the prevalence of primary nonadherence in this cohort is less than half of historical rates, we suspect the intervention did reduce unintentional nonadherence. However, regimen cost and complexity, transportation challenges, and ingrained medication beliefs likely remained barriers. It may be that a postdischarge phone call is able address unintended primary nonadherence in many cases. Meds to beds programs, where a supply of medications is provided to patients prior to discharge, could assist patients with limited transportation. Prior studies have also found reduced primary nonadherence when e‐prescriptions are utilized.[3]
Establishing outpatient follow‐up at discharge provides additional opportunities to address unanticipated adherence barriers. Because the efficacy of any adherence intervention depends on individual patient barriers, we recommend combining medication counseling with a targeted approach for patient‐specific needs.
We note several limitations to our study. First, because we studied primary nonadherence that persisted despite an intervention, this cohort likely underestimates the prevalence of primary nonadherence and alters the associated patient characteristics found in routine practice (although counseling is becoming more common). Second, patient reporting is subject to biases that underestimate nonadherence, although this approach has been validated previously.[15] Third, our outcome measure was unable to capture the spectrum of non‐adherence that could provide a more nuanced look at predictors of postdischarge nonadherence. Fourth, we did not have patient copayment data to better characterize whether out of pocket costs or pharmacologic classes drove nonadherence. Finally, sample size may have limited the detection of other important factors, and the university setting may limit generalizability to cardiovascular patients in other practice environments. Future research should focus on intervention strategies that assess patients' individual adherence barriers for a targeted or multimodal approach to improve adherence.
In conclusion, we found a prevalence of primary nonadherence of almost 1 in 10 patients who received pharmacist counseling. Nonadherence was associated with being single and those discharged with longer medication lists. Our results support existing literature that primary nonadherence is a significant problem in the postdischarge setting and substantiate the need for ongoing efforts to study and implement interventions for adherence after hospital discharge.
Disclosures
This material is based on work supported by the Office of Academic Affiliations, Department of Veterans Affairs, Veterans Affairs National Quality Scholars Program, and with use of facilities at Veterans Affairs Tennessee Valley Healthcare System, Nashville, Tennessee (Dr. Wooldridge). The funding agency supported the work indirectly through provision of salary support and training for the primary author, but had no specific role in the design and conduct of the study; collection, management, analysis, and interpretation of the data; preparation, review, or approval of the manuscript; or decision to submit the manuscript for publication. This work was also supported by R01 HL089755 (Dr. Kripalani) and in part by K23 HL077597 (Dr. Kripalani), K08 HL072806 (Dr. Schnipper), and the Center for Clinical Quality and Implementation Research at Vanderbilt University Medical Center. A preliminary version of this research was presented at the AcademyHealth Annual Research Meeting, June 16, 2015, Minneapolis, Minnesota. The authors report the following potential conflicts of interest: Jeffrey Schnipper: PI, investigator‐initiated study funded by Sanofi‐Aventis to develop, implement, and evaluate a multifaceted intervention to improve transitions of care in patients with diabetes mellitus discharged on insulin. Robert Dittus: passive co‐owner, Medical Decision Modeling, Inc.; Bayer HealthCare. One‐day consultation and panelist on educational video for population health (consultant fee); GlaxoSmithKline. One‐day consultant for population health, envisioning the future (consultant fee). Sunil Kripalani: Bioscape Digital, stock ownership
- , , . Prevalence, predictors, and outcomes of primary nonadherence after acute myocardial infarction. Circulation. 2008;117(8):1028–1036.
- , , , . Primary medication non‐adherence after discharge from a general internal medicine service. PloS One. 2013;8(5):e61735.
- , , , et al. Trouble getting started: predictors of primary medication nonadherence. Am J Med. 2011;124(11):1081.e9–22.
- , , , , . The incidence and determinants of primary nonadherence with prescribed medication in primary care: a cohort study. Ann Intern Med. 2014;160(7):441–450.
- , , , et al. Effect of a pharmacist intervention on clinically important medication errors after hospital discharge: a randomized trial. Ann Intern Med. 2012;157(1):1–10.
- , , , . Short Test of Functional Health Literacy in Adults. Snow Camp, NC: Peppercorn Books and Press; 1998.
- , , , , . Simplifying detection of cognitive impairment: comparison of the Mini‐Cog and Mini‐Mental State Examination in a multiethnic sample. J Am Geriatr Soc. 2005;53(5):871–874.
- , , . Concurrent and predictive validity of a self‐reported measure of medication adherence. Med Care. 1986;24(1):67–74.
- , , , , , . Health literacy and medication understanding among hospitalized adults. J Hosp Med. 2011;6(9):488–493.
- , , , , , . Medication adherence, social support, and event‐free survival in patients with heart failure. Health Psychol. 2013;32(6):637–646.
- , , , , , . Effect of patient comorbidities on filling of antihypertensive prescriptions. Am J Manag Care. 2009;15(1):24–30.
- , , , et al. Primary nonadherence to statin medications in a managed care organization. J Manag Care Pharm. 2013;19(5):367–373.
- , , , et al. Reducing cost by reducing polypharmacy: the polypharmacy outcomes project. J Am Med Dir Assoc. 2012;13(9):818.e811–815.
- , , , et al. The epidemiology of prescriptions abandoned at the pharmacy. Ann Intern Med. 2010;153(10):633–640.
- , , , , , . Can simple clinical measurements detect patient noncompliance? Hypertension. 1980;2(6):757–764.
Medication nonadherence after hospital discharge impacts morbidity and mortality in patients with cardiovascular disease.[1] Primary nonadherence, part of the spectrum of medication underuse, occurs when a patient receives a prescription but does not fill it.[1] Prior studies utilizing retrospective administrative data have found a prevalence of postdischarge primary nonadherence between 24% and 28%,[1, 2] similar to findings in a variety of outpatient populations.[3, 4]
One strategy for reduction in nonadherence is discharge medication counseling, which has been associated with improved postdischarge outcomes.[1] We evaluated the prevalence and predictors of refractory primary nonadherence in a cohort of patients hospitalized for acute cardiovascular conditions who received pharmacist counseling prior to discharge to guide future adherence interventions.
METHODS
Setting and Participants
The present study represents a secondary analysis of data from the Pharmacist Intervention for Low Literacy in Cardiovascular Disease (PILL‐CVD) study. PILL‐CVD was a randomized controlled trial that evaluated the effect of a tailored intervention consisting of pharmacist‐assisted medication reconciliation, discharge counseling, low‐literacy adherence aids, and follow‐up phone calls in adults hospitalized for acute coronary syndromes or acute decompensated heart failure. Patients likely to be discharged home taking primary responsibility for their medication management were eligible. Full study methods and results, including inclusion and exclusion criteria, can be found elsewhere.[5] The institutional review boards of each site approved the study.
For the present analysis, patients were included if they had any new discharge prescriptions to fill and received the study intervention, including a postdischarge follow‐up phone call with questions about filling discharge prescriptions.
Baseline Measures
Baseline data were obtained from medical records and patient interviews, including demographic information as well as survey data for cognitive impairment (Mini‐Cog) and health literacy (Short Test of Functional Health Literacy in Adults).[6, 7]
Data were also collected related to medication use, including the number of scheduled and as‐needed medications listed at discharge, self‐reported preadmission adherence, medication understanding, and medication management practices (eg, use of a pillbox, refill reminders). Self‐reported medication adherence was measured with the 4‐item Morisky scale.[8] Medication understanding was assessed with a tool previously developed by Marvanova et al.[9]
Outcome Measures
The primary outcome was the percentage of patients who reported not filling at least 1 discharge prescription on a telephone call that was conducted 1 to 4 days postdischarge. Patients were asked a dichotomous question about whether or not they filled all of their discharge prescriptions. Further characterization of the class or number of medications not filled was not performed. Patients were asked to provide a reason for not filling the prescriptions.
Analysis
We evaluated the prevalence and possible predictors of primary nonadherence including age, gender, race, marital status, education and income levels, insurance type, health literacy, cognition, presence of a primary care physician, number of listed discharge medications, prehospital medication adherence, medication understanding, and medication management practices using Pearson 2, Fisher exact, or Wilcoxon rank sum tests as appropriate. Multiple logistic regression with backward elimination was performed to identify independent predictors, selected with P values<0.1. We also evaluated reasons that patients cited for not filling prescriptions. Two‐sided P values<0.05 were considered statistically significant. All analyses were conducted using Stata version 13.1 (StataCorp LP, College Station, TX).
RESULTS
Of 851 patients in the PILL‐CVD study, the present sample includes 341 patients who received the intervention, completed the postdischarge follow‐up call, and had new discharge prescriptions to be filled. This represents 85% of patients who received the intervention.
The mean age of participants was 61.3 years, and 59.5% were male (Table 1). The majority were white (75.1%), and 88% had at least a high school education. Married or cohabitating patients represented 54.3% of the group. Just over half of the patients (54%) had an income of $35K or greater. The primary source of insurance for 82.5% of patients was either Medicare or private insurance, and 7.4% of patients were self‐pay. Most patients (80%) had adequate health literacy. The median Mini‐Cog score was 4 out of 5 (interquartile range [IQR]=35), and 11% of patients had scores indicating cognitive impairment. Just less than one‐fourth of the patients (24.1%) had a Morisky score of 8, indicating high self‐reported adherence, and the median score of patients' understanding of medications (range of 03) was 2.5 (IQR=2.22.8), reflecting relatively high understanding. The median number of prescriptions on patients' discharge medications lists was 10 (IQR=813).
| Variable | Overall 341 (100.0%) | Filled Prescription309 (90.6%) | Did Not Fill 32 (9.4%) | P Value |
|---|---|---|---|---|
| ||||
| Age, y, N (%) | 0.745a | |||
| 1849 | 69 | 63 (91.3) | 6 (8.7) | |
| 5064 | 128 | 114 (89.1) | 14 (10.9) | |
| 65+ | 144 | 132 (91.7) | 12 (8.3) | |
| Gender, N (%) | 0.056a | |||
| Male | 203 | 189 (93.1) | 14 (6.9) | |
| Female | 138 | 120 (87.0) | 18 (13.0) | |
| Race, N (%) | 0.712a | |||
| White | 256 | 234 (91.4) | 22 (8.6) | |
| African American | 60 | 54 (90.0) | 6 (10.0) | |
| Other | 22 | 19 (86.4) | 3 (13.6) | |
| Education, N (%) | 0.054a | |||
| Less than high school | 40 | 32 (80.0) | 8 (20.0) | |
| High school | 99 | 91 (91.9) | 8 (8.1) | |
| 1315 years | 93 | 83 (89.2) | 10 (10.8) | |
| 16 years | 109 | 103 (94.5) | 6 (5.5) | |
| Marital status, N (%) | ||||
| Separated/divorced/widowed/never married | 156 | 135 (86.5) | 21 (13.5) | 0.018a, b |
| Married/cohabitating | 185 | 174 (94.1) | 11 (5.9) | |
| Income, N (%) | 0.040a, b | |||
| <10K<20K | 58 | 48 (82.8) | 10 (17.2) | |
| 20K35K | 86 | 76 (88.4) | 10 (11.6) | |
| 35K<50K | 40 | 36 (90.0) | 4 (10.0) | |
| 50K<75K | 46 | 43 (93.5) | 3 (6.5) | |
| 75K+ | 83 | 81 (97.6) | 2 (2.4) | |
| Primary source of payment, N (%) | 0.272a | |||
| Medicaid | 34 | 28 (82.4) | 6 (17.6) | |
| Medicare | 145 | 131 (90.3) | 14 (9.7) | |
| Private | 132 | 123 (93.2) | 9 (6.8) | |
| Self‐pay | 25 | 22 (88.0) | 3 (12.0) | |
| Primary care physician, N (%) | 1.000c | |||
| None/do not know | 28 | 26 (92.9) | 2 (7.1) | |
| Yes | 313 | 283 (90.4) | 30 (9.6) | |
| Site, N (%) | 0.071a | |||
| Nashville, TN | 172 | 151 (87.8) | 21 (12.2) | |
| Boston, MA | 169 | 158 (93.5) | 11 (6.5) | |
The prevalence of refractory primary nonadherence was 9.4%. In univariate analysis, single marital status, lower income, and having more than 10 total discharge medications were significantly associated with not filling medications (P=0.018, 0.04, 0.016, respectively; Table 1). In multivariable analysis, single marital status and having more than 10 total discharge medications maintained significance when controlling for other patient characteristics. Patients who were single had higher odds of failing to fill discharge prescriptions compared to married or cohabitating individuals (odds ratio [OR]: 2.2, 95% confidence interval [CI]: 1.014.8, P=0.047). Patients with more than 10 discharge medications also had higher odds of failing to fill compared with patients who had fewer total medications (OR: 2.3, 95% CI: 1.054.98, P=0.036).
Filling discharge prescriptions was not associated with health literacy, cognition, prehospital adherence, patients' medication understanding, or any of the surveyed medication management practices (Table 2). Patients' reasons for not filling included lack of time to go to the pharmacy, medications not being delivered or dispensed, or inability to afford prescriptions. Prescription cost was cited by 23.5% of patients who did not fill their prescriptions and provided a reason.
| Variable | Overall 341 (100.0%) | Filled Prescription 309 (90.6%) | Did Not Fill 32 (9.4%) | P Value |
|---|---|---|---|---|
| ||||
| s‐TOFHLA score, range 036, N (%) | 0.443a | |||
| Inadequate, 016 | 40 | 34 (85.0) | 6 (15.0) | |
| Marginal, 1722 | 27 | 25 (92.6) | 2 (7.4) | |
| Adequate, 2336 | 268 | 244 (91.0) | 24 (9.0) | |
| MiniCog score, range 05, N (%) | 0.764b | |||
| Not impaired, 35 | 304 | 276 (90.8) | 28 (9.2) | |
| Impaired, 02 | 37 | 33 (89.2) | 4 (10.8) | |
| Morisky score, range 48, N (%) | 0.517a | |||
| Low/moderate self‐reported adherence, 47 | 249 | 224 (90.0) | 25 (10.0) | |
| High self‐reported adherence, 8 | 79 | 73 (92.4) | 6 (7.6) | |
| No. of discharge medications, range 126, N (%)c | 0.016a | |||
| 010 medications | 186 | 175 (94.1) | 11 (5.9) | |
| 11+medications | 155 | 134 (86.5) | 21 (13.5) | |
| Patient responses to medication behavior questions | ||||
| Patient associates medication taking time with daily events | 253 | 229 (90.5) | 24 (9.5) | 0.913a |
| Patient uses a pillbox to organize medicine | 180 | 162 (90.0) | 18 (10.0) | 0.680a |
| Friends of family help remind patient when it is time to take medicine | 89 | 79 (88.8) | 10 (11.2) | 0.486a |
| Patient writes down instructions for when to take medicine | 60 | 55 (91.7) | 5 (8.3) | 0.758a |
| Patient uses an alarm or a reminder that beeps when it is time to take medicine | 8 | 6 (75.0) | 2 (25.0) | 0.167a |
| Patient marks refill date on calendar | 38 | 35 (92.1) | 3 (7.9) | 1.000b |
| Pharmacy gives or sends patient a reminder when it is time to refill medicine | 94 | 84 (89.4) | 10 (10.6) | 0.624a |
| Friends or family help patient to refill medicine | 60 | 53 (88.3) | 7 (11.7) | 0.504a |
DISCUSSION
Almost 1 in 10 patients hospitalized with cardiovascular disease demonstrated primary nonadherence refractory to an intervention including pharmacist discharge medication counseling. Being unmarried and having greater than 10 medications at discharge were significantly associated with higher primary nonadherence when controlling for other patient factors.
Patients with a cohabitant partner were significantly less likely to exhibit primary nonadherence, which may reflect higher levels of social support, including encouragement for disease self‐management and/or support with tasks such as picking up medications from the pharmacy. Previous research has demonstrated that social support mediates outpatient medication adherence for heart failure patients.[10]
Similar to Jackevicius et al., we found that patients with more medications at discharge were less likely to fill their prescriptions.[1] These findings may reflect the challenges that patients face in adhering to complex treatment plans, which are associated with increased coordination and cost. Conversely, some prior studies have found that patients with fewer prescriptions were less likely to fill.[11, 12] These patients were often younger, thus potentially less conditioned to fill prescriptions, and unlike our cohort, these populations had consistent prescription coverage. Interventions for polypharmacy, which have been shown to improve outcomes and decrease costs, especially in the geriatric population, may be of benefit for primary nonadherence as well.[13]
Additionally, patients with lower household incomes had higher rates of primary nonadherence, at least in univariate analysis. Medication cost and transportation limitations, which are more pronounced in lower‐income patients, likely play influential roles in this group. These findings build on prior literature that has found lower prescription cost to be associated with better medication adherence in a variety of settings.[3, 4, 14]
Because the prevalence of primary nonadherence in this cohort is less than half of historical rates, we suspect the intervention did reduce unintentional nonadherence. However, regimen cost and complexity, transportation challenges, and ingrained medication beliefs likely remained barriers. It may be that a postdischarge phone call is able address unintended primary nonadherence in many cases. Meds to beds programs, where a supply of medications is provided to patients prior to discharge, could assist patients with limited transportation. Prior studies have also found reduced primary nonadherence when e‐prescriptions are utilized.[3]
Establishing outpatient follow‐up at discharge provides additional opportunities to address unanticipated adherence barriers. Because the efficacy of any adherence intervention depends on individual patient barriers, we recommend combining medication counseling with a targeted approach for patient‐specific needs.
We note several limitations to our study. First, because we studied primary nonadherence that persisted despite an intervention, this cohort likely underestimates the prevalence of primary nonadherence and alters the associated patient characteristics found in routine practice (although counseling is becoming more common). Second, patient reporting is subject to biases that underestimate nonadherence, although this approach has been validated previously.[15] Third, our outcome measure was unable to capture the spectrum of non‐adherence that could provide a more nuanced look at predictors of postdischarge nonadherence. Fourth, we did not have patient copayment data to better characterize whether out of pocket costs or pharmacologic classes drove nonadherence. Finally, sample size may have limited the detection of other important factors, and the university setting may limit generalizability to cardiovascular patients in other practice environments. Future research should focus on intervention strategies that assess patients' individual adherence barriers for a targeted or multimodal approach to improve adherence.
In conclusion, we found a prevalence of primary nonadherence of almost 1 in 10 patients who received pharmacist counseling. Nonadherence was associated with being single and those discharged with longer medication lists. Our results support existing literature that primary nonadherence is a significant problem in the postdischarge setting and substantiate the need for ongoing efforts to study and implement interventions for adherence after hospital discharge.
Disclosures
This material is based on work supported by the Office of Academic Affiliations, Department of Veterans Affairs, Veterans Affairs National Quality Scholars Program, and with use of facilities at Veterans Affairs Tennessee Valley Healthcare System, Nashville, Tennessee (Dr. Wooldridge). The funding agency supported the work indirectly through provision of salary support and training for the primary author, but had no specific role in the design and conduct of the study; collection, management, analysis, and interpretation of the data; preparation, review, or approval of the manuscript; or decision to submit the manuscript for publication. This work was also supported by R01 HL089755 (Dr. Kripalani) and in part by K23 HL077597 (Dr. Kripalani), K08 HL072806 (Dr. Schnipper), and the Center for Clinical Quality and Implementation Research at Vanderbilt University Medical Center. A preliminary version of this research was presented at the AcademyHealth Annual Research Meeting, June 16, 2015, Minneapolis, Minnesota. The authors report the following potential conflicts of interest: Jeffrey Schnipper: PI, investigator‐initiated study funded by Sanofi‐Aventis to develop, implement, and evaluate a multifaceted intervention to improve transitions of care in patients with diabetes mellitus discharged on insulin. Robert Dittus: passive co‐owner, Medical Decision Modeling, Inc.; Bayer HealthCare. One‐day consultation and panelist on educational video for population health (consultant fee); GlaxoSmithKline. One‐day consultant for population health, envisioning the future (consultant fee). Sunil Kripalani: Bioscape Digital, stock ownership
- , , . Prevalence, predictors, and outcomes of primary nonadherence after acute myocardial infarction. Circulation. 2008;117(8):1028–1036.
- , , , . Primary medication non‐adherence after discharge from a general internal medicine service. PloS One. 2013;8(5):e61735.
- , , , et al. Trouble getting started: predictors of primary medication nonadherence. Am J Med. 2011;124(11):1081.e9–22.
- , , , , . The incidence and determinants of primary nonadherence with prescribed medication in primary care: a cohort study. Ann Intern Med. 2014;160(7):441–450.
- , , , et al. Effect of a pharmacist intervention on clinically important medication errors after hospital discharge: a randomized trial. Ann Intern Med. 2012;157(1):1–10.
- , , , . Short Test of Functional Health Literacy in Adults. Snow Camp, NC: Peppercorn Books and Press; 1998.
- , , , , . Simplifying detection of cognitive impairment: comparison of the Mini‐Cog and Mini‐Mental State Examination in a multiethnic sample. J Am Geriatr Soc. 2005;53(5):871–874.
- , , . Concurrent and predictive validity of a self‐reported measure of medication adherence. Med Care. 1986;24(1):67–74.
- , , , , , . Health literacy and medication understanding among hospitalized adults. J Hosp Med. 2011;6(9):488–493.
- , , , , , . Medication adherence, social support, and event‐free survival in patients with heart failure. Health Psychol. 2013;32(6):637–646.
- , , , , , . Effect of patient comorbidities on filling of antihypertensive prescriptions. Am J Manag Care. 2009;15(1):24–30.
- , , , et al. Primary nonadherence to statin medications in a managed care organization. J Manag Care Pharm. 2013;19(5):367–373.
- , , , et al. Reducing cost by reducing polypharmacy: the polypharmacy outcomes project. J Am Med Dir Assoc. 2012;13(9):818.e811–815.
- , , , et al. The epidemiology of prescriptions abandoned at the pharmacy. Ann Intern Med. 2010;153(10):633–640.
- , , , , , . Can simple clinical measurements detect patient noncompliance? Hypertension. 1980;2(6):757–764.