User login
Proactive Rounding by RRT
Rapid response teams (RRT) have been promoted by numerous patient safety organizations to reduce preventable in‐hospital deaths.14 Initial studies of RRTs were promising,57 but recent literature,811 including systematic reviews and meta‐analyses, has called these findings into question. Nevertheless, RRTs remain popular in academic and community hospitals worldwide, and many have expanded their roles beyond solely responding to the deteriorating patient.12
Some RRTs, for example, proactively round on seriously ill ward patients and patients recently discharged from the intensive care unit (ICU) in an effort to prevent transitions to higher levels of care. Priestley and colleagues demonstrated that institution of such a team, referred to as a critical care outreach team (CCOT), decreased in‐hospital mortality while possibly increasing hospital length of stay (LOS).13 Three additional single‐center studies from the United Kingdom, where CCOTs are common, specifically examined proactive rounding by CCOTs on the ICU readmission rate: 2 observed no improvement,14, 15 while the third, limited by a small sample size, demonstrated a modest reduction in ICU readmissions.16
We sought to determine the impact of proactive rounding by an RRT on patients discharged from intensive care on the ICU readmission rate, ICU LOS, and in‐hospital mortality of patients discharged from the ICU. We hypothesized that proactive rounding by an RRT would decrease the ICU readmission rate, ICU LOS, and the in‐hospital mortality of patients discharged from the ICU.
MATERIALS AND METHODS
Site and Subjects
We carried out a retrospective, observational study of adult patients discharged from the ICU at University of California San Francisco (UCSF) Medical Center between January 2006 and June 2009. UCSF is a 790‐bed quaternary care academic hospital that admits approximately 17,000 patients annually and has 5 adult ICUs, with 62 beds and 3500 to 4000 ICU admissions annually. Our study was approved by the UCSF Medical Center Committee on Human Research; need for informed consent was waived.
Description of the RRT Before June 1, 2007
Throughout the study, the goal of the RRT was unchanged: to assess, triage, and institute early treatment in patients who experienced an acute decline in their clinical status. From November 2005 to October 2006, the RRT was staffed by an attending hospitalist and medicine resident during daytime, and by a critical care fellow at nighttime and on weekends. The RRT could be activated by any concerned staff member in response to a set of predetermined vital sign abnormalities, decreased urine output, or altered mental status, or simply if the staff member was concerned about the patient's clinical status. Despite extensive educational efforts, utilization of the team was low (2.7 calls per 1000 admissions) and, accordingly, it was discontinued in October 2006. After this time, staff would contact the primary team caring for the patient, should concerns regarding the patient's condition arise.
Description of the RRT After June 1, 2007
In an effort to expand its scope and utility, the RRT was reinstated on June 1, 2007 with a new composition and increased responsibilities. After this date, physician roles were eliminated, and the team composition changed to a dedicated critical care nurse and respiratory therapist, available 24 hours a day. Criteria for calling the team remained unchanged. In addition to responding to acute deteriorations in patients' clinical courses, the RRT began to proactively assess all patients within 12 hours of discharge from the ICU and would continue to round on these patients daily until it was felt that they were clinically stable. During these rounds, the RRT would provide consultation expertise to the bedside nurse and contact the patient's clinicians if concern existed about a patient's clinical trajectory; decisions to transfer a patient back to the ICU ultimately rested with the patient's primary team. During this time period, the RRT received an average of 110.6 calls per 1000 admissions.
Data Sources
Data collected included: demographics, clinical information (all patient refined [APR] severity of illness, APR risk of mortality, and the presence of 29 comorbidities), whether there was a readmission to the ICU, the total ICU LOS, and the vital status at the time of hospital discharge.
Outcomes
Outcomes included: readmission to the ICU, defined as 2 noncontiguous ICU stays during a single hospitalization; ICU LOS, defined as the total number of ICU days accrued during hospitalization; and in‐hospital mortality of patients discharged from the ICU.
Adjustment Variables
Patient age, gender, race, and ethnicity were available from administrative data. We used admission diagnosis code data to classify comorbidities using the method of Elixhauser et al.17
Statistical Analysis
For each of the 3 study outcomes, we assessed the effects of the intervention using multivariable models adjusting for patient‐ and service‐level factors, including a gamma model for ICU LOS and logistic models for ICU readmission and in‐hospital mortality of patients discharged from the ICU. We first compared unadjusted outcome levels before and after implementation. We then used an interrupted time series (ITS) framework to assess the effects of the intervention in terms of 5 measures: 1) the secular trend in the mean of the outcome before the intervention; 2) the change in the mean at the start of the implementation, or immediate effects; 3) the secular trend in the mean after implementation; 4) the change in secular trend, reflecting cumulative intervention effects; and 5) the net effect of the intervention, estimated as the adjusted difference between the fitted mean at the end of the postintervention period and the expected mean if the preintervention trend had continued without interruption or change.
Secondary Analyses
Given the heterogeneity of the RRT in the preintervention period, we assessed potential changes in trend at October 2006, the month in which the RRT was discontinued. We also examined changes in trend midway through the postimplementation period to evaluate for increased efficacy of the RRT with time.
Selection of Covariates
Age, race, and admitting service were included in both the prepost and ITS models by default for face validity. Additional covariates were selected for each outcome using backwards deletion with a retention criterion of P < 0.05, based on models that allowed the outcome rate to vary freely month to month. Because these data were obtained from administrative billing datasets, and the presence of comorbidities could not be definitively linked with time points during hospitalization, only those comorbidities that were likely present prior at ICU discharge were included. For similar reasons, APR severity of illness and risk of mortality scores, which were calculated from billing diagnoses at the end of hospitalization, were excluded from the models.
RESULTS
Patient Characteristics
During the study period, 11,687 patients were admitted to the ICU; 10,288 were discharged from the ICU alive and included in the analysis. In the 17 months prior to the introduction of proactive rounding by the RRT, 4902 (41.9%) patients were admitted, and during the 25 months afterwards, 6785 (58.1%) patients. Patients admitted in the 2 time periods were similar, although there were clinically small but statistically significant differences in race, APR severity of illness, APR risk of mortality, and certain comorbidities between the 2 groups (Table 1).
| Pre‐RRT (n = 4305) N (%) | Post‐RRT (n = 5983) N (%) | P Value | |
|---|---|---|---|
| |||
| Age, mean (y [SD]) | 57.7 [16.6] | 57.9 [16.5] | 0.50 |
| Female gender | 2,005 (46.6) | 2,824 (47.2) | 0.53 |
| Race | 0.0013 | ||
| White | 2,538 (59.0) | 3,520 (58.8) | |
| Black | 327 (7.6) | 436 (7.3) | |
| Asian | 642 (14.9) | 842 (14.1) | |
| Other | 719 (16.7) | 1,121 (18.7) | |
| Unknown | 79 (1.8) | 64 (1.1) | |
| Ethnicity | 0.87 | ||
| Hispanic | 480 (11.2) | 677 (11.3%) | |
| Non‐Hispanic | 3,547 (82.4) | 4,907 (82.0%) | |
| Unknown | 278 (6.5) | 399 (6.7) | |
| Insurance | 0.50 | ||
| Medicare | 1,788 (41.5) | 2,415 (40.4) | |
| Medicaid/Medi‐Cal | 699 (16.2) | 968 (16.2) | |
| Private | 1,642 (38.1) | 2,329 (38.9) | |
| Other | 176 (4.1) | 271 (4.5) | |
| Admission source | 0.41 | ||
| ED | 1,621 (37.7) | 2,244 (37.5) | |
| Outside hospital | 652 (15.2) | 855 (14.3) | |
| Direct admit | 2,032 (47.2) | 2,884 (48.2) | |
| Major surgery | 0.99 | ||
| Yes | 3,107 (72.2) | 4,319 (72.2) | |
| APR severity of illness | 0.0001 | ||
| Mild | 622 (14.5) | 828 (13.8) | |
| Moderate | 1,328 (30.9) | 1,626 (27.2) | |
| Major | 1,292 (30.0) | 1,908 (31.9) | |
| Extreme | 1,063 (24.7) | 1,621 (27.1) | |
| APR risk of mortality | 0.0109 | ||
| Mild | 1,422 (33.0) | 1,821 (30.4) | |
| Moderate | 1,074 (25.0) | 1,467 (24.5) | |
| Major | 947 (22.0) | 1,437 (24.0) | |
| Extreme | 862 (20.0) | 1,258 (21.0) | |
| Admitting service | 0.11 | ||
| Adult general surgery | 190 (4.4) | 260 (4.4) | |
| Cardiology | 347 (8.1) | 424 (7.1) | |
| Cardiothoracic surgery | 671 (15.6) | 930 (15.5) | |
| Kidney transplant surgery | 105 (2.4) | 112 (1.9) | |
| Liver transplant surgery | 298 (6.9) | 379 (6.3) | |
| Medicine | 683 (15.9) | 958 (16.0) | |
| Neurology | 420 (9.8) | 609 (10.2) | |
| Neurosurgery | 1,345 (31.2) | 1,995 (33.3) | |
| Vascular surgery | 246 (5.7) | 316 (5.3) | |
| Comorbidities | |||
| Hypertension | 2,054 (47.7) | 2,886 (48.2) | 0.60 |
| Fluid and electrolyte disorders | 998 (23.2) | 1,723 (28.8) | <0.0001 |
| Diabetes | 708 (16.5) | 880 (14.7) | 0.02 |
| Chronic obstructive pulmonary disease | 632 (14.7) | 849 (14.2) | 0.48 |
| Iron deficiency anemia | 582 (13.5) | 929 (15.5) | 0.005 |
| Renal failure | 541 (12.6) | 744 (12.4) | 0.84 |
| Coagulopathy | 418 (9.7) | 712 (11.9) | 0.0005 |
| Liver disease | 400 (9.3) | 553 (9.2) | 0.93 |
| Hypothyroidism | 330 (7.7) | 500 (8.4) | 0.20 |
| Depression | 306 (7.1) | 508 (8.5) | 0.01 |
| Peripheral vascular disease | 304 (7.1) | 422 (7.1) | 0.99 |
| Congestive heart failure | 263 (6.1) | 360 (6.0) | 0.85 |
| Weight loss | 236 (5.5) | 425 (7.1) | 0.0009 |
| Paralysis | 225 (5.2) | 328 (5.5) | 0.57 |
| Neurological disorders | 229 (5.3) | 276 (4.6) | 0.10 |
| Valvular disease | 210 (4.9) | 329 (5.5) | 0.16 |
| Drug abuse | 198 (4.6) | 268 (4.5) | 0.77 |
| Metastatic cancer | 198 (4.6) | 296 (5.0) | 0.42 |
| Obesity | 201 (4.7) | 306 (5.1) | 0.30 |
| Alcohol abuse | 178 (4.1) | 216 (3.6) | 0.17 |
| Diabetes with complications | 175 (4.1) | 218 (3.6) | 0.27 |
| Solid tumor without metastasis | 146 (3.4) | 245 (4.1) | 0.07 |
| Psychoses | 115 (2.7) | 183 (3.1) | 0.25 |
| Rheumatoid arthritis/collagen vascular disease | 96 (2.2) | 166 (2.8) | 0.08 |
| Pulmonary circulation disease | 83 (1.9) | 181 (3.0) | 0.0005 |
| Outcomes | |||
| Readmission to ICU | 288 (6.7) | 433 (7.3) | 0.24 |
| ICU length of stay, mean [SD] | 5.1 [9.7] | 4.9 [8.3] | 0.24 |
| In‐hospital mortality of patients discharged from the ICU | 260 (6.0) | 326 (5.5) | 0.24 |
ICU Readmission Rate
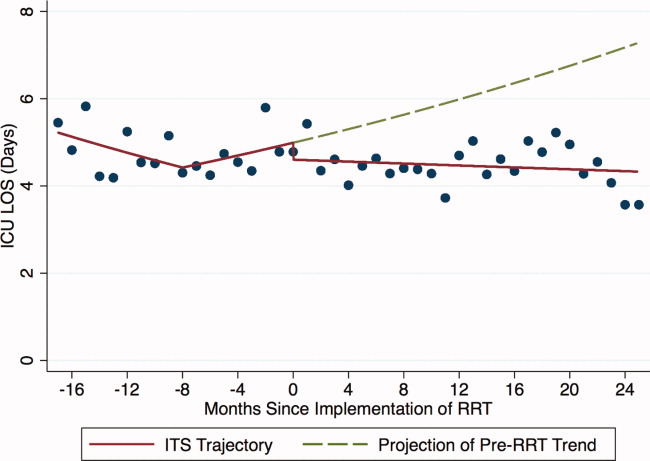
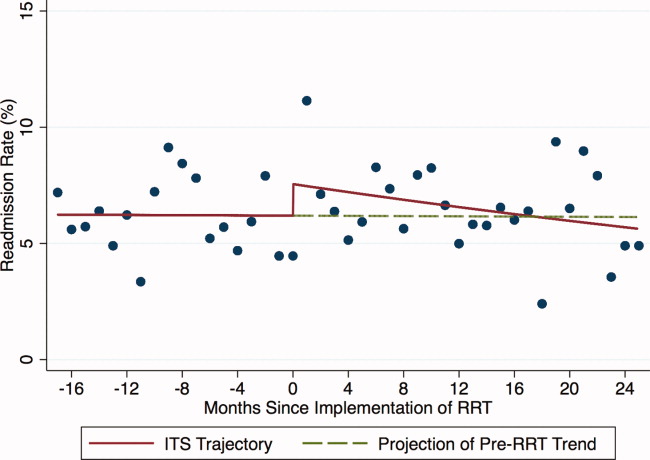
Introduction of proactive rounding by the RRT was not associated with unadjusted differences in the ICU readmission rate (6.7% preintervention vs 7.3% postintervention, P = 0.24; Table 1). In the adjusted ITS model, the intervention had no net effect on the odds of ICU readmission (adjusted odds ratio [AOR] for net intervention effect 0.98, 95% confidence interval [CI] 0.42, 2.28), with similar secular trends both preintervention (AOR 1.00 per year, 95% CI 0.97, 1.03), and afterwards (AOR 0.99 per year, 95% CI 0.98, 01.00), and a nonsignificant increase at implementation (Table 2). Figure 1 uses solid lines to show the fitted readmission rates, a hatched line to show the projection of the preintervention secular trend into the postintervention period, and circles to represent adjusted monthly means. The lack of a net intervention effect is indicated by the convergence of the solid and hatched lines 24 months postintervention.

| Outcome: Summary Effect Measure | Value (95% CI) | P Value |
|---|---|---|
| ||
| ICU readmission rateadjusted odds ratio | ||
| Pre‐RRT trend | 1.00 (0.97, 1.03) | 0.98 |
| Change at RRT implementation | 1.24 (0.94, 1.63) | 0.13 |
| Post‐RRT trend | 0.98 (0.97, 1.00) | 0.06 |
| Change in trend | 0.98 (0.96, 1.02) | 0.39 |
| Net intervention effect | 0.92 (0.40, 2.12) | 0.85 |
| ICU average length of stayadjusted ratio of means | ||
| Trend at 9 mo pre‐RRT | 0.98 (0.96, 1.00) | 0.05 |
| Trend at 3 mo pre‐RRT | 1.02 (0.99, 1.04) | 0.19 |
| Change in trend at 3 mo pre‐RRT | 1.03 (1.00, 1.07) | 0.07 |
| Change at RRT implementation | 0.92 (0.80, 1.06) | 0.27 |
| Post‐RRT trend | 1.00 (0.99, 1.00) | 0.35 |
| Change in trend at RRT implementation | 0.98 (0.96, 1.01) | 0.14 |
| Net intervention effect | 0.60 (0.31, 1.18) | 0.14 |
| In‐hospital mortality of patients discharged from the ICUadjusted odds ratio | ||
| Pre‐RRT trend | 1.02 (0.99, 1.06) | 0.15 |
| Change at RRT implementation | 0.74 (0.51, 1.08) | 0.12 |
| Post‐RRT trend | 1.00 (0.98, 1.01) | 0.68 |
| Change in trend | 0.97 (0.94, 1.01) | 0.14 |
| Net intervention effect | 0.39 (0.14, 1.10) | 0.08 |
ICU Average LOS
Introduction of proactive rounding by the RRT was not associated with unadjusted differences in ICU average LOS (5.1 days preintervention vs 4.9 days postintervention, P = 0.24; Table 1). Trends in ICU LOS may have changed in October 2006 (P = 0.07), decreasing in the first half of the study period (adjusted rate ratio [ARR] 0.98 per year, 95% CI 0.961.00), but did not change significantly thereafter. As with the ICU readmission rate, neither the change in estimated secular trend after implementation (ARR 0.98, 95% CI 0.961.01), nor the net effect of the intervention (ARR 0.62, 95% CI 0.321.22) was statistically significant (Table 2); these results are depicted graphically in Figure 2.
In‐Hospital Mortality of Patients Discharged From the ICU
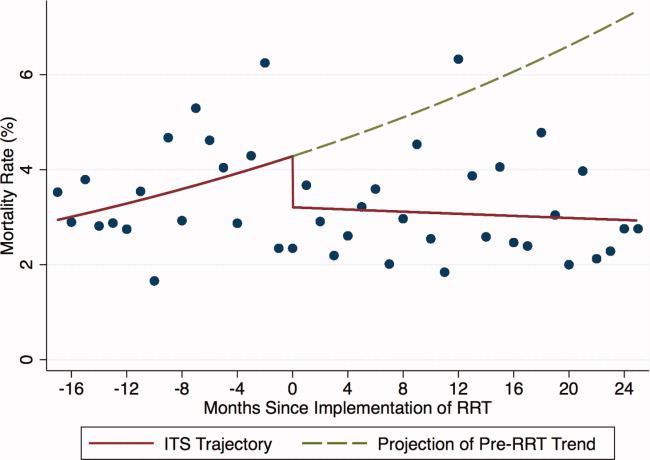
Introduction of proactive rounding by the RRT was not associated with unadjusted differences in the mortality of patients discharged from the ICU (6.0% preintervention vs 5.5% postintervention, P = 0.24; Table 1). Similarly, in the adjusted ITS model, the intervention had no statistically significant net effect on the mortality outcome (Table 2 and Figure 3).
Secondary Analyses
Apart from weak evidence for a change in trend in ICU LOS in October 2006, no other changes in trend were found within the preintervention or postintervention periods (data not shown). This suggests that the heterogeneity of the preintervention RRT had no significant impact on the 3 outcomes examined, and that the RRT intervention failed to gain efficacy with time in the postintervention period. Additionally, we saw no outcome benefit in sensitivity analyses among all ICU patients or in service‐defined analyses (eg, surgical services), where ability to control for illness severity was improved.
DISCUSSION
In this single center study, introduction of an RRT that proactively rounded on patients discharged from the ICU did not reduce the ICU readmission rate, ICU LOS, or mortality of patients discharged from the ICU, after accounting for secular trends using robust ITS methods and adjusting for patient level factors.
Our study is consistent with 2 smaller studies that assessed the impact of proactive rounding by a CCOT on ICU readmission rate. Leary and Ridley14 found that proactively rounding by a CCOT did not reduce ICU readmissions or shorten the ICU LOS, although this study was limited by a surprisingly low ICU readmission rate and short ICU LOS prior to the intervention. Another study15 also observed no change in the ICU readmission rate following introduction of a proactively rounding CCOT but noted small reductions in both ICU and hospital mortality. The sole study showing an effect16 observed a lower ICU readmission rate and increased survival to hospital discharge (after excluding do not resuscitate [DNR] patients) with implementation of a CCOT, although some of their findings may be explained by their CCOT's use of palliative care services, a function not featured in our model.
Our study adds to the meta‐analyses and systematic reviews810 that have questioned the hypothesis that a trained and proactive team of caregivers should be able to prevent patients from returning to the ICU. Perhaps one reason why this is not true is that proactive rounding by RRTs may have minimal effect in systems where step‐down beds are readily available. At UCSF, nearly every patient transferred out of the ICU is triaged to a step‐down unit, where telemetry and pulse oximetry are continuously monitored. Despite this, however, our institution's 2 step‐down units generate more calls to our RRT than any other units in the hospital.
We were surprised to see that proactive rounding failed to shorten ICU LOS, hypothesizing that clinicians would be more comfortable discharging patients from the ICU knowing that the RRT would be closely monitoring them afterwards. Although we have no data to support this hypothesis, increased use of the RRT may have also increased step‐down bed use, as patients on the general medicalsurgical floors were transferred to a higher level of care upon recommendation of the RRT, thereby delaying transfers out of the ICU. Moreover, the opening of an additional 16‐bed ICU in October 2008 might have encouraged clinicians to transfer patients back to the ICU simply because beds were more easily accessible than before.
Introduction of proactive rounding by the RRT was also not associated with differences in the mortality rate of patients discharged from the ICU. This finding conflicts with the results of Garcea et al,15 Ball et al,16 and Priestley et al13, all of which found that implementation of a CCOT led to small but statistically significant reductions in in‐hospital mortality. All 3 of these studies, however, examined smaller patient populations (1380, 470, and 2903 patients, respectively), and both the Priestley and Ball studies13, 16 had significantly shorter periods of data collection (24 months and 32 weeks, respectively). Our results are based on models with confidence intervals and P values that account for variability in all 3 underlying effect estimates but assume a linear extrapolation of the preintervention trend. This approach allowed us to flexibly deal with changes related to the intervention, while relying on our large sample size to define time trends not dealt with adequately (or at all) in previous research.
The lack of improvement in outcomes cannot be attributed to immaturity of the RRT or failure of the clinical staff to use the RRT adequately. A prespecified secondary data analysis midway through the postintervention time period demonstrated that the RRT failed to gain efficacy with time with respect to all 3 outcomes. The postintervention RRT was also utilized far more frequently than its predecessor (110.6 vs 2.7 calls per 1000 admissions, respectively), and this degree of RRT utilization far surpasses the dose considered to be indicative of a mature RRT system.12
Our study has several limitations. First, we relied on administrative rather than chart‐collected data to determine the reason for ICU admission, and the APR severity of illness and risk of mortality scores. It seems unlikely, however, that coding deficiencies or biases affected the preintervention and postintervention patient populations differently. Even though we adjusted for all available measures, it is possible that we were not able to account for time trends in all potential confounders. Second, we did not have detailed clinical information on reasons for ICU readmission and whether readmissions occurred before or after the RRT proactively rounded on the patient. Therefore, potential readmissions to the ICU that might have been planned or which would have happened regardless of the presence of the RRT, such as for antibiotic desensitization, could not be accounted for. Third, introduction of proactive rounding by the RRT in June 2007 was accompanied by a change in the RRT's composition, from a physician‐led model to a nurse‐led model. Therefore, inherent differences in the way that physicians and nurses might assess and triage patients could not have been adjusted for. Lastly, this was a retrospective study conducted at a single academic medical center with a specific RRT model, and our results may not be directly applicable to nonteaching settings or to different RRT models.
Our findings raise further questions about the benefits of RRTs as they assume additional roles, such as proactive rounding on patients recently discharged from the ICU. The failure of our RRT to reduce the ICU readmission rate, the ICU average LOS, and the mortality of patients discharged from the ICU raises concerns that the benefits of our RRT are not commensurate with its cost. While defining the degree of impact and underlying mechanisms are worthy of prospective study, hospitals seeking to improve their RRT models should consider how to develop systems that achieve the RRT's promise in measurable ways.
Acknowledgements
The authors acknowledge Heather Leicester, MSPH, Senior Performance Improvement Analyst for Patient Safety and Quality Services at the University of California San Francisco for her work in data acquisition.
Disclosures: Dr Vittinghoff received salary support from an NIH grant during the time of this work for statistical consulting. He receives textbook royalties from Springer Verlag. Dr Auerbach was supported by 5K24HL098372‐02 from the National Heart Lung and Blood Institute during the period of this study although not specifically for this study; they had no role in the design or conduct of the study; the collection, analysis, or interpretation of the data; or the preparation, review, or approval of the manuscript. The other authors have no financial conflicts of interest.
- , , , . The 100,000 lives campaign: setting a goal and a deadline for improving health care quality. JAMA. 2006;295(3):324–327.
- Clinical Governance Unit, Quality and Safety Branch, Rural and Regional Health and Aged Care Services Division Safer Systems, Department of Human Services, State Government of Victoria. Safer Systems—Saving Lives Campaign. Available at: http://www.health.vic.gov.au/sssl. Accessed April 5, 2012.
- Canadian Patient Safety Institute. Safer Healthcare Now! Campaign. Available at: http://www.saferhealthcarenow.ca. Accessed April 5, 2012.
- , . The growth of rapid response systems. Jt Comm J Qual Patient Saf. 2008;34:489–495.
- , , , . The medical emergency team. Anaesth Intensive Care. 1995;23(2):183–186.
- , , , et al. Rates of in‐hospital arrests, deaths, and intensive care admission: the effect of a medical emergency team. Med J Aust. 2000;173:236–240.
- , , , , . The patient‐at‐risk team: identifying and managing seriously ill ward patients. Anaesthesia. 1999;54:853–860.
- , , , , . Effects of rapid response systems on clinical outcomes: systemic review and meta‐analysis. J Hosp Med. 2007;2:422–432.
- , , , , . Rapid response teams: a systemic review and meta‐analysis. Arch Intern Med. 2010;170(1):18–26.
- , , , , , . Rapid response systems: a systematic review. Crit Care Med. 2007;35(5):1238–1243.
- , , , et al. Introduction of the medical emergency team (MET) system: a cluster‐randomised controlled trial. Lancet. 2005;365:2091–2097.
- , , . Rapid response teams. N Engl J Med. 2011;365:139–146.
- , , , et al. Introducing critical care outreach: a ward‐randomised trial of phased introduction in a general hospital. Intensive Care Med. 2004;30(7):1398–1404.
- , . Impact of an outreach team on re‐admissions to a critical care unit. Anaesthesia. 2003;58:328–332.
- , , , , . Impact of a critical care outreach team on critical care readmissions and mortality. Acta Anaesthesiol Scand. 2004;48:1096–1100.
- , , . Effect of the critical care outreach team on patient survival to discharge from hospital and readmission to critical care: non‐randomised population based study. BMJ. 2003;327:1014–1017.
- , , , . Comorbidity measures for use with administrative data. Med Care. 1998;36(1):8–27.
Rapid response teams (RRT) have been promoted by numerous patient safety organizations to reduce preventable in‐hospital deaths.14 Initial studies of RRTs were promising,57 but recent literature,811 including systematic reviews and meta‐analyses, has called these findings into question. Nevertheless, RRTs remain popular in academic and community hospitals worldwide, and many have expanded their roles beyond solely responding to the deteriorating patient.12
Some RRTs, for example, proactively round on seriously ill ward patients and patients recently discharged from the intensive care unit (ICU) in an effort to prevent transitions to higher levels of care. Priestley and colleagues demonstrated that institution of such a team, referred to as a critical care outreach team (CCOT), decreased in‐hospital mortality while possibly increasing hospital length of stay (LOS).13 Three additional single‐center studies from the United Kingdom, where CCOTs are common, specifically examined proactive rounding by CCOTs on the ICU readmission rate: 2 observed no improvement,14, 15 while the third, limited by a small sample size, demonstrated a modest reduction in ICU readmissions.16
We sought to determine the impact of proactive rounding by an RRT on patients discharged from intensive care on the ICU readmission rate, ICU LOS, and in‐hospital mortality of patients discharged from the ICU. We hypothesized that proactive rounding by an RRT would decrease the ICU readmission rate, ICU LOS, and the in‐hospital mortality of patients discharged from the ICU.
MATERIALS AND METHODS
Site and Subjects
We carried out a retrospective, observational study of adult patients discharged from the ICU at University of California San Francisco (UCSF) Medical Center between January 2006 and June 2009. UCSF is a 790‐bed quaternary care academic hospital that admits approximately 17,000 patients annually and has 5 adult ICUs, with 62 beds and 3500 to 4000 ICU admissions annually. Our study was approved by the UCSF Medical Center Committee on Human Research; need for informed consent was waived.
Description of the RRT Before June 1, 2007
Throughout the study, the goal of the RRT was unchanged: to assess, triage, and institute early treatment in patients who experienced an acute decline in their clinical status. From November 2005 to October 2006, the RRT was staffed by an attending hospitalist and medicine resident during daytime, and by a critical care fellow at nighttime and on weekends. The RRT could be activated by any concerned staff member in response to a set of predetermined vital sign abnormalities, decreased urine output, or altered mental status, or simply if the staff member was concerned about the patient's clinical status. Despite extensive educational efforts, utilization of the team was low (2.7 calls per 1000 admissions) and, accordingly, it was discontinued in October 2006. After this time, staff would contact the primary team caring for the patient, should concerns regarding the patient's condition arise.
Description of the RRT After June 1, 2007
In an effort to expand its scope and utility, the RRT was reinstated on June 1, 2007 with a new composition and increased responsibilities. After this date, physician roles were eliminated, and the team composition changed to a dedicated critical care nurse and respiratory therapist, available 24 hours a day. Criteria for calling the team remained unchanged. In addition to responding to acute deteriorations in patients' clinical courses, the RRT began to proactively assess all patients within 12 hours of discharge from the ICU and would continue to round on these patients daily until it was felt that they were clinically stable. During these rounds, the RRT would provide consultation expertise to the bedside nurse and contact the patient's clinicians if concern existed about a patient's clinical trajectory; decisions to transfer a patient back to the ICU ultimately rested with the patient's primary team. During this time period, the RRT received an average of 110.6 calls per 1000 admissions.
Data Sources
Data collected included: demographics, clinical information (all patient refined [APR] severity of illness, APR risk of mortality, and the presence of 29 comorbidities), whether there was a readmission to the ICU, the total ICU LOS, and the vital status at the time of hospital discharge.
Outcomes
Outcomes included: readmission to the ICU, defined as 2 noncontiguous ICU stays during a single hospitalization; ICU LOS, defined as the total number of ICU days accrued during hospitalization; and in‐hospital mortality of patients discharged from the ICU.
Adjustment Variables
Patient age, gender, race, and ethnicity were available from administrative data. We used admission diagnosis code data to classify comorbidities using the method of Elixhauser et al.17
Statistical Analysis
For each of the 3 study outcomes, we assessed the effects of the intervention using multivariable models adjusting for patient‐ and service‐level factors, including a gamma model for ICU LOS and logistic models for ICU readmission and in‐hospital mortality of patients discharged from the ICU. We first compared unadjusted outcome levels before and after implementation. We then used an interrupted time series (ITS) framework to assess the effects of the intervention in terms of 5 measures: 1) the secular trend in the mean of the outcome before the intervention; 2) the change in the mean at the start of the implementation, or immediate effects; 3) the secular trend in the mean after implementation; 4) the change in secular trend, reflecting cumulative intervention effects; and 5) the net effect of the intervention, estimated as the adjusted difference between the fitted mean at the end of the postintervention period and the expected mean if the preintervention trend had continued without interruption or change.
Secondary Analyses
Given the heterogeneity of the RRT in the preintervention period, we assessed potential changes in trend at October 2006, the month in which the RRT was discontinued. We also examined changes in trend midway through the postimplementation period to evaluate for increased efficacy of the RRT with time.
Selection of Covariates
Age, race, and admitting service were included in both the prepost and ITS models by default for face validity. Additional covariates were selected for each outcome using backwards deletion with a retention criterion of P < 0.05, based on models that allowed the outcome rate to vary freely month to month. Because these data were obtained from administrative billing datasets, and the presence of comorbidities could not be definitively linked with time points during hospitalization, only those comorbidities that were likely present prior at ICU discharge were included. For similar reasons, APR severity of illness and risk of mortality scores, which were calculated from billing diagnoses at the end of hospitalization, were excluded from the models.
RESULTS
Patient Characteristics
During the study period, 11,687 patients were admitted to the ICU; 10,288 were discharged from the ICU alive and included in the analysis. In the 17 months prior to the introduction of proactive rounding by the RRT, 4902 (41.9%) patients were admitted, and during the 25 months afterwards, 6785 (58.1%) patients. Patients admitted in the 2 time periods were similar, although there were clinically small but statistically significant differences in race, APR severity of illness, APR risk of mortality, and certain comorbidities between the 2 groups (Table 1).
| Pre‐RRT (n = 4305) N (%) | Post‐RRT (n = 5983) N (%) | P Value | |
|---|---|---|---|
| |||
| Age, mean (y [SD]) | 57.7 [16.6] | 57.9 [16.5] | 0.50 |
| Female gender | 2,005 (46.6) | 2,824 (47.2) | 0.53 |
| Race | 0.0013 | ||
| White | 2,538 (59.0) | 3,520 (58.8) | |
| Black | 327 (7.6) | 436 (7.3) | |
| Asian | 642 (14.9) | 842 (14.1) | |
| Other | 719 (16.7) | 1,121 (18.7) | |
| Unknown | 79 (1.8) | 64 (1.1) | |
| Ethnicity | 0.87 | ||
| Hispanic | 480 (11.2) | 677 (11.3%) | |
| Non‐Hispanic | 3,547 (82.4) | 4,907 (82.0%) | |
| Unknown | 278 (6.5) | 399 (6.7) | |
| Insurance | 0.50 | ||
| Medicare | 1,788 (41.5) | 2,415 (40.4) | |
| Medicaid/Medi‐Cal | 699 (16.2) | 968 (16.2) | |
| Private | 1,642 (38.1) | 2,329 (38.9) | |
| Other | 176 (4.1) | 271 (4.5) | |
| Admission source | 0.41 | ||
| ED | 1,621 (37.7) | 2,244 (37.5) | |
| Outside hospital | 652 (15.2) | 855 (14.3) | |
| Direct admit | 2,032 (47.2) | 2,884 (48.2) | |
| Major surgery | 0.99 | ||
| Yes | 3,107 (72.2) | 4,319 (72.2) | |
| APR severity of illness | 0.0001 | ||
| Mild | 622 (14.5) | 828 (13.8) | |
| Moderate | 1,328 (30.9) | 1,626 (27.2) | |
| Major | 1,292 (30.0) | 1,908 (31.9) | |
| Extreme | 1,063 (24.7) | 1,621 (27.1) | |
| APR risk of mortality | 0.0109 | ||
| Mild | 1,422 (33.0) | 1,821 (30.4) | |
| Moderate | 1,074 (25.0) | 1,467 (24.5) | |
| Major | 947 (22.0) | 1,437 (24.0) | |
| Extreme | 862 (20.0) | 1,258 (21.0) | |
| Admitting service | 0.11 | ||
| Adult general surgery | 190 (4.4) | 260 (4.4) | |
| Cardiology | 347 (8.1) | 424 (7.1) | |
| Cardiothoracic surgery | 671 (15.6) | 930 (15.5) | |
| Kidney transplant surgery | 105 (2.4) | 112 (1.9) | |
| Liver transplant surgery | 298 (6.9) | 379 (6.3) | |
| Medicine | 683 (15.9) | 958 (16.0) | |
| Neurology | 420 (9.8) | 609 (10.2) | |
| Neurosurgery | 1,345 (31.2) | 1,995 (33.3) | |
| Vascular surgery | 246 (5.7) | 316 (5.3) | |
| Comorbidities | |||
| Hypertension | 2,054 (47.7) | 2,886 (48.2) | 0.60 |
| Fluid and electrolyte disorders | 998 (23.2) | 1,723 (28.8) | <0.0001 |
| Diabetes | 708 (16.5) | 880 (14.7) | 0.02 |
| Chronic obstructive pulmonary disease | 632 (14.7) | 849 (14.2) | 0.48 |
| Iron deficiency anemia | 582 (13.5) | 929 (15.5) | 0.005 |
| Renal failure | 541 (12.6) | 744 (12.4) | 0.84 |
| Coagulopathy | 418 (9.7) | 712 (11.9) | 0.0005 |
| Liver disease | 400 (9.3) | 553 (9.2) | 0.93 |
| Hypothyroidism | 330 (7.7) | 500 (8.4) | 0.20 |
| Depression | 306 (7.1) | 508 (8.5) | 0.01 |
| Peripheral vascular disease | 304 (7.1) | 422 (7.1) | 0.99 |
| Congestive heart failure | 263 (6.1) | 360 (6.0) | 0.85 |
| Weight loss | 236 (5.5) | 425 (7.1) | 0.0009 |
| Paralysis | 225 (5.2) | 328 (5.5) | 0.57 |
| Neurological disorders | 229 (5.3) | 276 (4.6) | 0.10 |
| Valvular disease | 210 (4.9) | 329 (5.5) | 0.16 |
| Drug abuse | 198 (4.6) | 268 (4.5) | 0.77 |
| Metastatic cancer | 198 (4.6) | 296 (5.0) | 0.42 |
| Obesity | 201 (4.7) | 306 (5.1) | 0.30 |
| Alcohol abuse | 178 (4.1) | 216 (3.6) | 0.17 |
| Diabetes with complications | 175 (4.1) | 218 (3.6) | 0.27 |
| Solid tumor without metastasis | 146 (3.4) | 245 (4.1) | 0.07 |
| Psychoses | 115 (2.7) | 183 (3.1) | 0.25 |
| Rheumatoid arthritis/collagen vascular disease | 96 (2.2) | 166 (2.8) | 0.08 |
| Pulmonary circulation disease | 83 (1.9) | 181 (3.0) | 0.0005 |
| Outcomes | |||
| Readmission to ICU | 288 (6.7) | 433 (7.3) | 0.24 |
| ICU length of stay, mean [SD] | 5.1 [9.7] | 4.9 [8.3] | 0.24 |
| In‐hospital mortality of patients discharged from the ICU | 260 (6.0) | 326 (5.5) | 0.24 |
ICU Readmission Rate
Introduction of proactive rounding by the RRT was not associated with unadjusted differences in the ICU readmission rate (6.7% preintervention vs 7.3% postintervention, P = 0.24; Table 1). In the adjusted ITS model, the intervention had no net effect on the odds of ICU readmission (adjusted odds ratio [AOR] for net intervention effect 0.98, 95% confidence interval [CI] 0.42, 2.28), with similar secular trends both preintervention (AOR 1.00 per year, 95% CI 0.97, 1.03), and afterwards (AOR 0.99 per year, 95% CI 0.98, 01.00), and a nonsignificant increase at implementation (Table 2). Figure 1 uses solid lines to show the fitted readmission rates, a hatched line to show the projection of the preintervention secular trend into the postintervention period, and circles to represent adjusted monthly means. The lack of a net intervention effect is indicated by the convergence of the solid and hatched lines 24 months postintervention.
| Outcome: Summary Effect Measure | Value (95% CI) | P Value |
|---|---|---|
| ||
| ICU readmission rateadjusted odds ratio | ||
| Pre‐RRT trend | 1.00 (0.97, 1.03) | 0.98 |
| Change at RRT implementation | 1.24 (0.94, 1.63) | 0.13 |
| Post‐RRT trend | 0.98 (0.97, 1.00) | 0.06 |
| Change in trend | 0.98 (0.96, 1.02) | 0.39 |
| Net intervention effect | 0.92 (0.40, 2.12) | 0.85 |
| ICU average length of stayadjusted ratio of means | ||
| Trend at 9 mo pre‐RRT | 0.98 (0.96, 1.00) | 0.05 |
| Trend at 3 mo pre‐RRT | 1.02 (0.99, 1.04) | 0.19 |
| Change in trend at 3 mo pre‐RRT | 1.03 (1.00, 1.07) | 0.07 |
| Change at RRT implementation | 0.92 (0.80, 1.06) | 0.27 |
| Post‐RRT trend | 1.00 (0.99, 1.00) | 0.35 |
| Change in trend at RRT implementation | 0.98 (0.96, 1.01) | 0.14 |
| Net intervention effect | 0.60 (0.31, 1.18) | 0.14 |
| In‐hospital mortality of patients discharged from the ICUadjusted odds ratio | ||
| Pre‐RRT trend | 1.02 (0.99, 1.06) | 0.15 |
| Change at RRT implementation | 0.74 (0.51, 1.08) | 0.12 |
| Post‐RRT trend | 1.00 (0.98, 1.01) | 0.68 |
| Change in trend | 0.97 (0.94, 1.01) | 0.14 |
| Net intervention effect | 0.39 (0.14, 1.10) | 0.08 |
ICU Average LOS
Introduction of proactive rounding by the RRT was not associated with unadjusted differences in ICU average LOS (5.1 days preintervention vs 4.9 days postintervention, P = 0.24; Table 1). Trends in ICU LOS may have changed in October 2006 (P = 0.07), decreasing in the first half of the study period (adjusted rate ratio [ARR] 0.98 per year, 95% CI 0.961.00), but did not change significantly thereafter. As with the ICU readmission rate, neither the change in estimated secular trend after implementation (ARR 0.98, 95% CI 0.961.01), nor the net effect of the intervention (ARR 0.62, 95% CI 0.321.22) was statistically significant (Table 2); these results are depicted graphically in Figure 2.
In‐Hospital Mortality of Patients Discharged From the ICU
Introduction of proactive rounding by the RRT was not associated with unadjusted differences in the mortality of patients discharged from the ICU (6.0% preintervention vs 5.5% postintervention, P = 0.24; Table 1). Similarly, in the adjusted ITS model, the intervention had no statistically significant net effect on the mortality outcome (Table 2 and Figure 3).
Secondary Analyses
Apart from weak evidence for a change in trend in ICU LOS in October 2006, no other changes in trend were found within the preintervention or postintervention periods (data not shown). This suggests that the heterogeneity of the preintervention RRT had no significant impact on the 3 outcomes examined, and that the RRT intervention failed to gain efficacy with time in the postintervention period. Additionally, we saw no outcome benefit in sensitivity analyses among all ICU patients or in service‐defined analyses (eg, surgical services), where ability to control for illness severity was improved.
DISCUSSION
In this single center study, introduction of an RRT that proactively rounded on patients discharged from the ICU did not reduce the ICU readmission rate, ICU LOS, or mortality of patients discharged from the ICU, after accounting for secular trends using robust ITS methods and adjusting for patient level factors.
Our study is consistent with 2 smaller studies that assessed the impact of proactive rounding by a CCOT on ICU readmission rate. Leary and Ridley14 found that proactively rounding by a CCOT did not reduce ICU readmissions or shorten the ICU LOS, although this study was limited by a surprisingly low ICU readmission rate and short ICU LOS prior to the intervention. Another study15 also observed no change in the ICU readmission rate following introduction of a proactively rounding CCOT but noted small reductions in both ICU and hospital mortality. The sole study showing an effect16 observed a lower ICU readmission rate and increased survival to hospital discharge (after excluding do not resuscitate [DNR] patients) with implementation of a CCOT, although some of their findings may be explained by their CCOT's use of palliative care services, a function not featured in our model.
Our study adds to the meta‐analyses and systematic reviews810 that have questioned the hypothesis that a trained and proactive team of caregivers should be able to prevent patients from returning to the ICU. Perhaps one reason why this is not true is that proactive rounding by RRTs may have minimal effect in systems where step‐down beds are readily available. At UCSF, nearly every patient transferred out of the ICU is triaged to a step‐down unit, where telemetry and pulse oximetry are continuously monitored. Despite this, however, our institution's 2 step‐down units generate more calls to our RRT than any other units in the hospital.
We were surprised to see that proactive rounding failed to shorten ICU LOS, hypothesizing that clinicians would be more comfortable discharging patients from the ICU knowing that the RRT would be closely monitoring them afterwards. Although we have no data to support this hypothesis, increased use of the RRT may have also increased step‐down bed use, as patients on the general medicalsurgical floors were transferred to a higher level of care upon recommendation of the RRT, thereby delaying transfers out of the ICU. Moreover, the opening of an additional 16‐bed ICU in October 2008 might have encouraged clinicians to transfer patients back to the ICU simply because beds were more easily accessible than before.
Introduction of proactive rounding by the RRT was also not associated with differences in the mortality rate of patients discharged from the ICU. This finding conflicts with the results of Garcea et al,15 Ball et al,16 and Priestley et al13, all of which found that implementation of a CCOT led to small but statistically significant reductions in in‐hospital mortality. All 3 of these studies, however, examined smaller patient populations (1380, 470, and 2903 patients, respectively), and both the Priestley and Ball studies13, 16 had significantly shorter periods of data collection (24 months and 32 weeks, respectively). Our results are based on models with confidence intervals and P values that account for variability in all 3 underlying effect estimates but assume a linear extrapolation of the preintervention trend. This approach allowed us to flexibly deal with changes related to the intervention, while relying on our large sample size to define time trends not dealt with adequately (or at all) in previous research.
The lack of improvement in outcomes cannot be attributed to immaturity of the RRT or failure of the clinical staff to use the RRT adequately. A prespecified secondary data analysis midway through the postintervention time period demonstrated that the RRT failed to gain efficacy with time with respect to all 3 outcomes. The postintervention RRT was also utilized far more frequently than its predecessor (110.6 vs 2.7 calls per 1000 admissions, respectively), and this degree of RRT utilization far surpasses the dose considered to be indicative of a mature RRT system.12
Our study has several limitations. First, we relied on administrative rather than chart‐collected data to determine the reason for ICU admission, and the APR severity of illness and risk of mortality scores. It seems unlikely, however, that coding deficiencies or biases affected the preintervention and postintervention patient populations differently. Even though we adjusted for all available measures, it is possible that we were not able to account for time trends in all potential confounders. Second, we did not have detailed clinical information on reasons for ICU readmission and whether readmissions occurred before or after the RRT proactively rounded on the patient. Therefore, potential readmissions to the ICU that might have been planned or which would have happened regardless of the presence of the RRT, such as for antibiotic desensitization, could not be accounted for. Third, introduction of proactive rounding by the RRT in June 2007 was accompanied by a change in the RRT's composition, from a physician‐led model to a nurse‐led model. Therefore, inherent differences in the way that physicians and nurses might assess and triage patients could not have been adjusted for. Lastly, this was a retrospective study conducted at a single academic medical center with a specific RRT model, and our results may not be directly applicable to nonteaching settings or to different RRT models.
Our findings raise further questions about the benefits of RRTs as they assume additional roles, such as proactive rounding on patients recently discharged from the ICU. The failure of our RRT to reduce the ICU readmission rate, the ICU average LOS, and the mortality of patients discharged from the ICU raises concerns that the benefits of our RRT are not commensurate with its cost. While defining the degree of impact and underlying mechanisms are worthy of prospective study, hospitals seeking to improve their RRT models should consider how to develop systems that achieve the RRT's promise in measurable ways.
Acknowledgements
The authors acknowledge Heather Leicester, MSPH, Senior Performance Improvement Analyst for Patient Safety and Quality Services at the University of California San Francisco for her work in data acquisition.
Disclosures: Dr Vittinghoff received salary support from an NIH grant during the time of this work for statistical consulting. He receives textbook royalties from Springer Verlag. Dr Auerbach was supported by 5K24HL098372‐02 from the National Heart Lung and Blood Institute during the period of this study although not specifically for this study; they had no role in the design or conduct of the study; the collection, analysis, or interpretation of the data; or the preparation, review, or approval of the manuscript. The other authors have no financial conflicts of interest.
- , , , . The 100,000 lives campaign: setting a goal and a deadline for improving health care quality. JAMA. 2006;295(3):324–327.
- Clinical Governance Unit, Quality and Safety Branch, Rural and Regional Health and Aged Care Services Division Safer Systems, Department of Human Services, State Government of Victoria. Safer Systems—Saving Lives Campaign. Available at: http://www.health.vic.gov.au/sssl. Accessed April 5, 2012.
- Canadian Patient Safety Institute. Safer Healthcare Now! Campaign. Available at: http://www.saferhealthcarenow.ca. Accessed April 5, 2012.
- , . The growth of rapid response systems. Jt Comm J Qual Patient Saf. 2008;34:489–495.
- , , , . The medical emergency team. Anaesth Intensive Care. 1995;23(2):183–186.
- , , , et al. Rates of in‐hospital arrests, deaths, and intensive care admission: the effect of a medical emergency team. Med J Aust. 2000;173:236–240.
- , , , , . The patient‐at‐risk team: identifying and managing seriously ill ward patients. Anaesthesia. 1999;54:853–860.
- , , , , . Effects of rapid response systems on clinical outcomes: systemic review and meta‐analysis. J Hosp Med. 2007;2:422–432.
- , , , , . Rapid response teams: a systemic review and meta‐analysis. Arch Intern Med. 2010;170(1):18–26.
- , , , , , . Rapid response systems: a systematic review. Crit Care Med. 2007;35(5):1238–1243.
- , , , et al. Introduction of the medical emergency team (MET) system: a cluster‐randomised controlled trial. Lancet. 2005;365:2091–2097.
- , , . Rapid response teams. N Engl J Med. 2011;365:139–146.
- , , , et al. Introducing critical care outreach: a ward‐randomised trial of phased introduction in a general hospital. Intensive Care Med. 2004;30(7):1398–1404.
- , . Impact of an outreach team on re‐admissions to a critical care unit. Anaesthesia. 2003;58:328–332.
- , , , , . Impact of a critical care outreach team on critical care readmissions and mortality. Acta Anaesthesiol Scand. 2004;48:1096–1100.
- , , . Effect of the critical care outreach team on patient survival to discharge from hospital and readmission to critical care: non‐randomised population based study. BMJ. 2003;327:1014–1017.
- , , , . Comorbidity measures for use with administrative data. Med Care. 1998;36(1):8–27.
Copyright © 2012 Society of Hospital Medicine
Patient Satisfaction With Procedural Care
In order to improve resident supervision and timeliness of invasive bedside procedures such as paracentesis, thoracentesis, and lumbar puncture, some academic medical centers have implemented procedure services that focus on providing high‐quality procedural care.1, 2
Procedure services have the potential to affect patient satisfaction, a key indicator in quality of care measurment.3 Having senior physicians present increases patient comfort during outpatient case presentations4 and improves patient satisfaction with explanations of tests and medications.5 However, we had concerns that teaching during a procedure may heighten patient anxiety. Patients are reluctant to be the first patient of a resident or medical student for a procedure,68 and patients are more likely to refuse consent to have a resident perform complex procedures.8 In previous studies, patient satisfaction with gynecological exams and flexible sigmoidoscopy performed by residents was comparable to satisfaction with those performed by staff physicians,9, 10 though in the case of flexible sigmoidoscopy, procedure duration was slightly longer.10 Few, if any, data describe bedside teaching or patient impressions of physician communication during procedures.
We carried out a prospective study of patient perceptions of the University of California San Francisco (UCSF) Hospitalist Procedure Service (HPS). Our study had the primary goal of understanding how our modelwhich involves bedside procedural teaching and feedback in real time (eg, as the procedure is performed)is perceived by patients.
Patients and Methods
Site
Our survey was carried out at UCSF Moffitt‐Long Hospital, a 560‐bed university teaching hospital and the primary university hospital for the University of California San Francisco. This study was reviewed and approved by the Committee on Human Research at UCSF.
Procedure Service
The HPS is composed of two interns who rotate for 2 weeks on a mandatory rotation performing the majority of the procedures done by the service. Every procedure is supervised by an attending hospitalist who has received extended training from interventional radiologists and emergency department ultrasound faculty. Patients are referred to the service by their primary admitting team. Interns receive procedure‐specific didactics, demonstration, and practice with procedure kits, supplemental readings, computer‐based procedure modules, and evidence‐based summaries of procedure‐related considerations. All interns also attend a half‐day procedure simulation session to review procedural and ultrasound techniques.
While interns obtain informed consent and prepare the patient for the procedure, the attending and intern team communicate the following points with each patient: 1) identification as the dedicated procedure team, separate from the primary team caring for the patient; 2) attending self‐identification as the supervisor; 3) attention to stepwise communication with the patient during the procedure; 4) attention to patient comfort throughout the procedure; 5) emphasis on patient safety through the use of time‐outs, sterile technique, and ultrasound when appropriate; and 6) the intention to discuss best practice and teach during the procedure.
All paracentesis and thoracentesis sites are marked by using bedside ultrasound (S‐Cath, SonoSite, Bothell, WA) guidance prior to and, if needed, during the procedure. Ultrasound is occasionally used for marking joint aspiration and lumbar puncture.11 Interns are responsible for making an initial site marking, which is then confirmed by the attending physician. Although not systematized, our service encourages the intern and attending to communicate about proper technique during the procedure itself. For example, attendings ask questions about technique based on evidence in the literature (eg, Why do you replace the stylet in a lumbar puncture needle prior to removal?) or about trouble shooting (eg, What would you do if the flow of ascites stops during this paracentesis?) and also correct any errors in technique (Recall the angle you intended to use based on the ultrasound view).
Patients
Patients are referred to the procedure service by their primary team; referrals are accepted for patients on all services at all levels of care, including the emergency department (ED) and the intensive care unit (ICU). Participants in this study were referred for one of our target procedures (paracentesis, thoracentesis, or lumbar puncture) between November 2008 and July 2009. Patients gave written consent for the supplemental survey independent of consent for the procedure. All consents and procedures were performed in a patient's hospital room and one family member was allowed to stay in the room if desired by the patient. After the completion of the procedure, the attending on the procedure service at the time, which included study authors D.S. and M.M., approached consecutive patients who spoke and read English and were deemed to have capacity to consent for their own procedure to be surveyed. Patients were considered to have capacity to consent based on commonly accepted criteria described in the literature.12, 13 Patients were also excluded if their procedure was performed by the attending alone, if they had repeated procedures done by the service, or if they were too altered or critically ill to participate in the survey.
Survey
Our survey was developed through identification of items reported in the literature,1421 as well as items newly developed for purposes of examining our primary aims. Newly developed questions focused on patients' satisfaction with major aspects of procedure performance as well as the quality and impact of communication with the patient and between members of the team. Two open‐text questions were included to allow patients to share what went well with the procedure as well as areas for improvement. The research team developed a pool of question items for potential inclusion in a patient satisfaction questionnaire. These items were then shown to a group of research‐oriented health professionals, who meet regularly to review academic research protocols. The group provided their opinions about the content and comprehension of the questions, and the written survey employed was a result of their revisions (see Appendix in Supporting Information online).
Written surveys were distributed to patients by the hospitalist attending on service following the procedure as permitted by patients' severity of illness and availability. Surveys were anonymous and self‐administered by the patient or a family member who was in the room for the procedure; all questions were voluntary. A nurse was made responsible for collecting the survey when possible. Survey results were entered into a database without identifiers, with limited demographic information; patient gender, age, and procedure type were included by the attending hospitalist at the end of the survey. A separate and more detailed procedure database was kept of all procedures performed and was used to record patient consent or reason for not consenting as well as documented receipt of a completed survey. This non‐anonymous database contained detailed supplemental information including patient age, level of care, referring service, presence of bloody fluid at any point during the procedure, and physician‐reported immediate complications at the bedside in free text.
Analysis
Reported immediate complications were classified into major and minor based on reported definitions in the literature.2226 Similar to previous studies, major immediate complications were defined as those requiring further procedural intervention, medical therapy, or both.27 Major complications were defined as: bleeding requiring transfusion, pneumothorax requiring a chest tube, respiratory failure, bowel perforation, cerebral herniation or shock, cerebrospinal fluid (CSF) leak requiring intervention, and transfer to a higher level of care. For patients receiving a thoracentesis, chart review was performed to determine the presence of a follow‐up chest x‐ray, the presence of a pneumothorax, or clinical evidence for re‐expansion pulmonary edema. We analyzed differences between respondents and non‐respondents using Chi‐square tests for categorical variables (gender, level of care, referring service, procedure type, bloody fluid, and immediate reported complications) and independent t tests for continuous variables (age).
After review of the open‐ended fields, responses were classified into the following categories: pain control, physician skill, professionalism, communication, symptom relief, procedure duration, and miscellaneous comments. Responses regarding patient perceptions of physician communication were dichotomized into positive (1 = Strongly Agree, 2 = Agree) and negative (3 = Neutral, 4 = Disagree, and 5 = Strongly Disagree), and independent t tests were used to determine the contribution of factors, such as age, while Chi‐square tests were used for the contribution of gender and procedure type. All statistical tests were performed by using the SAS statistical application program (version 9.2).
Results
Respondent Characteristics
Of 324 procedures performed by the HPS during the study period, 95 (29%) were eligible for consent. Of the 229 patients not eligible for consent, 32 (10%) were excluded because the procedure was performed by the attending alone, 76 (23%) lacked English proficiency or literacy, 66 (20%) had altered mental status, 32 (10%) were intubated and/or had severe illness precluding consent, and 23 (7%) were repeat procedures on patients who had previously completed the survey. Only two patients specifically requested an attending to perform the procedure after an introduction to the service. Of the 95 patients eligible for consent, 89 were consented for the survey, and 65 (68%) completed the survey. Of the six eligible, non‐consented patients, all were leaving the floor immediately following the procedure, and time did not allow for consent and survey distribution. There were no differences between eligible responders and nonresponders in age, gender, procedure, requesting service, presence of bloody fluid, or physician‐reported immediate complications (Table 1).
| Demographics | Respondera (n = 65) | Nonresponder (n = 24) |
|---|---|---|
| ||
| Age, y [mean (SD)] | 55.4 (15.7) | 50.4 (17.4) |
| Male gender, n (%) male | 41 (63.1) | 11 (45.8) |
| Procedure, n (%) | ||
| Paracentesis | 31 (47.7) | 10 (41.7) |
| Thoracentesis | 17 (25.8) | 6 (25.0) |
| Lumbar puncture | 15 (22.7) | 7 (29.2) |
| Arthrocentesis | 2 (3.0) | 1 (4.2) |
| Patient location, n (%) | ||
| Floor | 47 (72.3) | 19 (79.2) |
| Step down/telemetry | 17 (26.1) | 3 (12.5) |
| Intensive care unit | 1 (1.5) | 2 (8.3) |
| Service requesting, n (%) | ||
| Medicine | 29 (44.6) | 10 (41.7) |
| Cardiology | 6 (9.1) | 3 (12.5) |
| Liver transplant | 20 (30.3) | 7 (29.2) |
| Bone marrow transplant | 7 (10.6) | 1 (4.2) |
| Surgery | 0 | 1 (4.2) |
| Neurosurgery | 1 (1.5) | 1 (4.2) |
| Other | 2 (3.0) | 1 (4.2) |
| Reported presence of bloody fluid at any point in the procedure, n (%) | 9 (13.6) | 4 (16.7) |
| Other reported immediate complications | ||
| Equipment malfunction | 2 (3.0) | 1 (4.2) |
| Significant cough/pleuritic pain | 1 (1.5) | 1 (4.2) |
| Transient oxygen desaturation | 1 (1.5) | 0 |
| Ascites leak | 0 | 0 |
| Hematoma | 0 | 0 |
| Persistent bleeding | 0 | 0 |
| Transfer to a higher level of care | 0 | 0 |
Complications
As complications would likely play a role in procedure satisfaction, we describe immediate complications for the study population. Of the 324 procedures performed during the study period, no patient had predefined major immediate complications. Upon further chart review of the 96 patients that had a thoracentesis performed, all had a follow‐up chest x‐ray and none suffered an iatrogenic pneumothorax or re‐expansion pulmonary edema. Minor immediate complications for the 324 procedures were reported as follows: postprocedure pain in four patients (1.2%), cough in nine patients (2.8%), five equipment malfunctions (1.5%), four ascites leaks (1.2%), and one incisional bleed requiring a suture for hemostasis (0.3%). There was no significant difference in complications between those consented for the survey and the total study population.
Procedure Satisfaction
More than 90% of patients were satisfied or very satisfied with most aspects of the procedure, including the informed consent process, pain control, expertise, and courtesy of physicians (Table 2). The percentage of patients satisfied with the duration of procedure (88%) was lower than for other measures of satisfaction. Of the 38 patients receiving therapeutic procedures, 34 (89%) were satisfied or highly satisfied with the improvement in symptoms following the procedure.
| Very Satisfied and Satisfied No. (%) | Neutral No. (%) | Dissatisfied and Very Dissatisfied No. (%) | N/A No. (%) | |
|---|---|---|---|---|
| Your overall procedure experience | 65 (100) | 0 (0) | 0 (0) | 0 (0) |
| Explanation of the procedure, risks, and benefits before the procedure | 64 (99) | 1 (2) | 0 (0) | 0 (0) |
| Pain control during the procedure | 60 (92) | 5 (8) | 0 (0) | 0 (0) |
| Expertise/skill of the physicians performing your procedure | 62 (95) | 3 (5) | 0 (0) | 0 (0) |
| Courtesy and bedside manner of the physicians performing your procedure | 65 (100) | 0 (0) | 0 (0) | 0 (0) |
| The time it took to perform your procedure | 57 (88) | 6 (9) | 0 (0) | 2 (3) |
| Improvement in your symptoms following this procedure, if applicable | 34 (52) | 7 (11) | 0 (0) | 24 (37) |
When asked what went well with the procedure, 59 (91%) respondents provided additional comments and feedback. Each response was classified as described in the Methods section. Of the free text responses, 8 of the 59 patients (14%) commented on the attention to pain control (eg, The caring and attention to my pain was most important to me), 5 (8%) on the skills of the operators (Great examination of the entire stomach region with the ultrasound to ensure the best position of the catheter), 6 (10%) on the courtesy and professionalism of the team (eg, Courteous, team‐feeling, addressed my concerns), 9 (15%) on their communication with the team (eg, The doctors made me feel very comfortable before the procedure by laying out the plan and explaining each part of the procedure), and 8 (14%) on relief of their symptoms (eg, There was an almost immediate and significant improvement in my breathing, bloating, and pain). Twenty‐three of the 59 comments (39%) were categorized as miscellaneous (eg, All went great. I fell asleep).
When asked areas for improvement, 55 (85%) patients responded. Thirty‐three patients (60%) reported that nothing could be improved or they instructed the team to just keep doing what you are doing, while 22 (40%) patients expressed a concern. Responses were categorized in a similar fashion to the positive responses. Five of the 22 negative comments (23%) reported that the procedure took too long (eg, Procedure could have been shorter. I got tired sitting up), 4 (18%) commented on pain control (eg, The poke for marking my skin hurt more than the anesthetic. I was surprised), 6 (27%) felt communication was a problem (eg, Discuss the steps with the patient audibly, no whispering, speak clearly), and 7 (32%) had miscellaneous concerns (eg, Try not to do this procedure right after another one).
Physician Communication
Sixty‐four patients (98%) reported that the physicians performing their procedure communicated with each other during the procedure (Table 3). Although one patient did not feel that the physicians communicated with each other, he or she still answered the follow‐up questions regarding perceptions of physician communication. We excluded this patient from our analysis as his or her answers may not be reliable. The majority of patients (84%) reported this communication as reassuring and felt it was a normal part of procedure performance (94%). Those that did not agree that physician communication was reassuring did not differ in average age (P = 0.307), gender (P = 0.511), or procedure type (P = 0.562).
| Strongly Agree and Agree No. (%) | Neutral No. (%) | Disagree, and Strongly Disagree No. (%) | |
|---|---|---|---|
| I felt that the physicians talking to each other about my procedure was reassuring to me | 54 (84) | 10 (16) | 0 (0) |
| Physicians talking to each other while doing a procedure is a normal part of doing a procedure | 60 (94) | 4 (6) | 0 (0) |
Of all positive and negative comments, five specifically addressed communication between physicians. Most (four) reflected satisfaction with bedside teaching (eg, They discussed the procedure in a professional manner and eased my mind at all times) and with having an expert in the room (eg, [The team] discussed things like needle placement, which was nice because there was a second opinion right there in the room). Patients also felt that it was good to experience the teaching, with one patient reporting that the best part of the procedure was watching doctors learn from each other. Patients did not express specific reservations about bedside teaching, resident technique, or fear of complications in free text.
Discussion
Even though novice interns performed procedures and simultaneous bedside teaching, patient satisfaction with a teaching procedure service was high, and reported complication rates were low. In addition, a majority of patients found discussions related to teaching activities reassuring and potentially important to their perception of care quality. Analogous studies examining patient satisfaction with endoscopic care found similar rates of patient satisfaction with endoscopists' bedside manner, technical skills, and pain control, but these studies included sedated patients.21 Our results are unique, as we evaluated awake patients with attention to perception of bedside teaching with novice interns.
Our findings offer an alternative strategy for bedside procedural teaching that employs transparency in the use of an expert and a trainee to introduce patients to bedside teaching by experts, which is not common at many academic medical centers.28 Patients may have been reassured by a clear explanation of the role of the service and the providers involved as well as an assurance of expertise and attention to patient comfort and safety. In addition to patient satisfaction, this model has the potential to impact both the safety of bedside procedures and housestaff education around procedure performance. For example, pneumothorax rates using our procedure service model are lower than those published (0% vs. 4% for ultrasound‐guided thoracentesis and 8.5% for thoracentesis by less experienced clinicians).29
Providers may be reluctant to teach at the bedside of awake patients for fear of heightening patient anxiety over trainee inexperience. In the 1960s similar fears were raised over the concern for patient anxiety with bedside rounding,30 but later studies revealed these concerns to be largely unfounded. Instead, bedside rounds have been shown to positively influence patients' feelings about their hospital experience and their relationships with their physicians compared with patients whose case presentations were made in a conference room.31, 32 Given the opportunity to comment on areas for improvement, patients in our study specifically elaborated regarding pain control, communication, and efficiency problems. Although 16% of patients did not find the communication of physicians reassuring, none of the negative comments reflected problems with bedside teaching, but rather concepts such as desiring a better explanation of steps throughout the procedure. Specifically, patients desire better communication for unanticipated pain.
There are several limitations to this study. Lack of patient satisfaction data from a control group of patients whose procedures were performed by attendings or housestaff alone limits our ability to draw conclusions about our satisfaction scores. The scarce applicable literature offers only imperfect comparison data. Because hospitalists were not blinded to the survey, attending behavior may have been subject to a Hawthorne effect.33 Consenting patients after the procedure could have provided hospitalists with an opportunity to exclude patients who appeared less satisfied with their procedure; however, attempts were made to prevent this behavior by requiring strict accounting of why a patient was not consented for the study. Use of alternative personnel for consent such as nurses was explored, but was found not to be feasible due to limited resources. These data are only applicable to English‐speaking patients who are literate and well enough to complete a survey. It is not clear whether the experience for other patients would reflect the same outcomes. It is plausible that non‐English‐speaking patients might have more concerns about incomprehensible conversations taking place during their procedure. Although the surveys were anonymous and patients were told that the proceduralists would not see individual responses, responses may have been biased out of patient concern that their response might affect their care. Hospitalists obtaining consent, however, were careful to stress anonymity and the distinction between the primary team and the procedure team.
Academic hospitals are struggling with providing quality procedural care while balancing housestaff education and experience.28 With hospitalists playing an increasingly prominent role in housestaff education and patient satisfaction initiatives, the supervision of housestaff by trained hospitalist faculty may help meet both aims in the performance of invasive bedside procedures, particularly at institutions where simulation training resources are limited. Although concern may exist for potential patient anxiety with bedside teaching, our data demonstrate high levels of patient satisfaction with a hospitalist procedure service despite novice procedure performers and an emphasis on teaching during the procedure.
- ,,, et al.Creation of an innovative inpatient medical procedure service and a method to evaluate house staff competency.J Gen Intern Med.2004;19(5 Pt 2):510–513.
- ,,, et al.Impact of a bedside procedure service on general medicine inpatients: A firm‐based trial.J Hosp Med.2007;2(3):143–149.
- Hospital Care Quality Information from the Consumer Perspective (HCAHPS).Quality Assurance Guidelines.Baltimore, MD:Centers for Medicare 113(8):657–662.
- ,,,,.The effect of bedside case presentations on patients' perceptions of their medical care.N Engl J Med.1997;336(16):1150–1155.
- ,,,.‘Sorry, it's my first time!’ Will patients consent to medical students learning procedures?Med Educ.2005;39(4):365–369.
- ,.Ethical considerations surrounding first time procedures: a study and analysis of patient attitudes toward spinal taps by students.Kennedy Inst Ethics J.1992;2(3):217–231.
- ,,,.Patients' willingness to allow residents to learn to practice medical procedures.Acad Med.2004;79(2):144–147.
- ,,.Patient satisfaction with gynecologic care provided by family practice resident physicians.Fam Pract Res J.1991;11(4):421–428.
- ,,.Resident participation in flexible sigmoidoscopy does not affect patient satisfaction.Am J Gastroenterol.2000;95(6):1563–1566.
- ,.Bedside ultrasound for difficult lumbar puncture.J Emerg Med.2005;28(2):197–200.
- ,.Conducting the Assessment. In:Assessing Competence to Consent to Treatment: A Guide for Physicians and Other Health Professionals.First Edition ed.New York, NY:Oxford University Press;1998:80–91.
- ,.Care of Ill, Socially Complicated Patients. In:Medical Management of Vulnerable 2007:407–418.
- ,,,,.Interventional radiologic procedures: patient anxiety, perception of pain, understanding of procedure, and satisfaction with medication‐‐a prospective study.Radiology.2000;215(3):684–688.
- ,,,,.Improving the assessment of (in)patients' satisfaction with hospital care.Med Care.2001;39(3):270–283.
- ,,,.Factors determining inpatient satisfaction with care.Soc Sci Med.2002;54(4):493–504.
- ,,,.Reliability and validity of the Satisfaction with Hospital Care Questionnaire.Int J Qual Health Care.2002;14(6):471–482.
- ,,,,.A randomized trial of four patient satisfaction questionnaires.Med Care.2003;41(12):1343–1352.
- ,,, et al.Development and validation of an in‐patient satisfaction questionnaire.Int J Qual Health Care.2005;17(6):465–472.
- ,,,.Central venous port catheters: evaluation of patients' satisfaction with implantation under local anesthesia.J Vasc Access.2009;10(1):27–32.
- ,,,.Factors influencing patient satisfaction when undergoing endoscopic procedures.Gastrointest Endosc.2009;69(4):883–91, quiz 891.e1.
- ,,, et al.Complications associated with thoracentesis. A prospective, randomized study comparing three different methods.Arch Intern Med.1990;150(4):873–877.
- ,,, et al.Risk of complications after abdominal paracentesis in cirrhotic patients: a prospective study.Clin Gastroenterol Hepatol.2009;7(8):906–909.
- ,,, et al.Performance standards for therapeutic abdominal paracentesis.Hepatology.2004;40(2):484–488.
- ,,,,.Lumbar puncture: its indications, contraindications, complications and technique.Rev Neurol.2007;45(7):433–436.
- .How to perform a lumbar puncture with the patient in the seated position.Br J Hosp Med (Lond).2006;67(3):M46–7.
- ,,.Are commonly used resident measurements associated with procedural skills in internal medicine residency training?J Gen Intern Med.2007;22(3):357–361.
- ,,,MERN Group,.Supervising the Supervisors‐Procedural Training and Supervision in Internal Medicine Residency.J Gen Intern Med.2010.
- ,,,.Pneumothorax following thoracentesis: a systematic review and meta‐analysis.Arch Intern Med.2010;170(4):332–339.
- ,,.The emotional impact of ward rounds.J Mt Sinai Hosp NY.1956;23(6):782–803.
- ,,,.The physiologic and psychological effects of the bedside presentation.N Engl J Med.1989;321(18):1273–1275.
- ,,,,.The effect of bedside case presentations on patients' perceptions of their medical care.N Engl J Med.1997;336(16):1150–1155.
- .Hawthorne effects and research into professional practice.J Eval Clin Pract.2001;7(1):65–70.
In order to improve resident supervision and timeliness of invasive bedside procedures such as paracentesis, thoracentesis, and lumbar puncture, some academic medical centers have implemented procedure services that focus on providing high‐quality procedural care.1, 2
Procedure services have the potential to affect patient satisfaction, a key indicator in quality of care measurment.3 Having senior physicians present increases patient comfort during outpatient case presentations4 and improves patient satisfaction with explanations of tests and medications.5 However, we had concerns that teaching during a procedure may heighten patient anxiety. Patients are reluctant to be the first patient of a resident or medical student for a procedure,68 and patients are more likely to refuse consent to have a resident perform complex procedures.8 In previous studies, patient satisfaction with gynecological exams and flexible sigmoidoscopy performed by residents was comparable to satisfaction with those performed by staff physicians,9, 10 though in the case of flexible sigmoidoscopy, procedure duration was slightly longer.10 Few, if any, data describe bedside teaching or patient impressions of physician communication during procedures.
We carried out a prospective study of patient perceptions of the University of California San Francisco (UCSF) Hospitalist Procedure Service (HPS). Our study had the primary goal of understanding how our modelwhich involves bedside procedural teaching and feedback in real time (eg, as the procedure is performed)is perceived by patients.
Patients and Methods
Site
Our survey was carried out at UCSF Moffitt‐Long Hospital, a 560‐bed university teaching hospital and the primary university hospital for the University of California San Francisco. This study was reviewed and approved by the Committee on Human Research at UCSF.
Procedure Service
The HPS is composed of two interns who rotate for 2 weeks on a mandatory rotation performing the majority of the procedures done by the service. Every procedure is supervised by an attending hospitalist who has received extended training from interventional radiologists and emergency department ultrasound faculty. Patients are referred to the service by their primary admitting team. Interns receive procedure‐specific didactics, demonstration, and practice with procedure kits, supplemental readings, computer‐based procedure modules, and evidence‐based summaries of procedure‐related considerations. All interns also attend a half‐day procedure simulation session to review procedural and ultrasound techniques.
While interns obtain informed consent and prepare the patient for the procedure, the attending and intern team communicate the following points with each patient: 1) identification as the dedicated procedure team, separate from the primary team caring for the patient; 2) attending self‐identification as the supervisor; 3) attention to stepwise communication with the patient during the procedure; 4) attention to patient comfort throughout the procedure; 5) emphasis on patient safety through the use of time‐outs, sterile technique, and ultrasound when appropriate; and 6) the intention to discuss best practice and teach during the procedure.
All paracentesis and thoracentesis sites are marked by using bedside ultrasound (S‐Cath, SonoSite, Bothell, WA) guidance prior to and, if needed, during the procedure. Ultrasound is occasionally used for marking joint aspiration and lumbar puncture.11 Interns are responsible for making an initial site marking, which is then confirmed by the attending physician. Although not systematized, our service encourages the intern and attending to communicate about proper technique during the procedure itself. For example, attendings ask questions about technique based on evidence in the literature (eg, Why do you replace the stylet in a lumbar puncture needle prior to removal?) or about trouble shooting (eg, What would you do if the flow of ascites stops during this paracentesis?) and also correct any errors in technique (Recall the angle you intended to use based on the ultrasound view).
Patients
Patients are referred to the procedure service by their primary team; referrals are accepted for patients on all services at all levels of care, including the emergency department (ED) and the intensive care unit (ICU). Participants in this study were referred for one of our target procedures (paracentesis, thoracentesis, or lumbar puncture) between November 2008 and July 2009. Patients gave written consent for the supplemental survey independent of consent for the procedure. All consents and procedures were performed in a patient's hospital room and one family member was allowed to stay in the room if desired by the patient. After the completion of the procedure, the attending on the procedure service at the time, which included study authors D.S. and M.M., approached consecutive patients who spoke and read English and were deemed to have capacity to consent for their own procedure to be surveyed. Patients were considered to have capacity to consent based on commonly accepted criteria described in the literature.12, 13 Patients were also excluded if their procedure was performed by the attending alone, if they had repeated procedures done by the service, or if they were too altered or critically ill to participate in the survey.
Survey
Our survey was developed through identification of items reported in the literature,1421 as well as items newly developed for purposes of examining our primary aims. Newly developed questions focused on patients' satisfaction with major aspects of procedure performance as well as the quality and impact of communication with the patient and between members of the team. Two open‐text questions were included to allow patients to share what went well with the procedure as well as areas for improvement. The research team developed a pool of question items for potential inclusion in a patient satisfaction questionnaire. These items were then shown to a group of research‐oriented health professionals, who meet regularly to review academic research protocols. The group provided their opinions about the content and comprehension of the questions, and the written survey employed was a result of their revisions (see Appendix in Supporting Information online).
Written surveys were distributed to patients by the hospitalist attending on service following the procedure as permitted by patients' severity of illness and availability. Surveys were anonymous and self‐administered by the patient or a family member who was in the room for the procedure; all questions were voluntary. A nurse was made responsible for collecting the survey when possible. Survey results were entered into a database without identifiers, with limited demographic information; patient gender, age, and procedure type were included by the attending hospitalist at the end of the survey. A separate and more detailed procedure database was kept of all procedures performed and was used to record patient consent or reason for not consenting as well as documented receipt of a completed survey. This non‐anonymous database contained detailed supplemental information including patient age, level of care, referring service, presence of bloody fluid at any point during the procedure, and physician‐reported immediate complications at the bedside in free text.
Analysis
Reported immediate complications were classified into major and minor based on reported definitions in the literature.2226 Similar to previous studies, major immediate complications were defined as those requiring further procedural intervention, medical therapy, or both.27 Major complications were defined as: bleeding requiring transfusion, pneumothorax requiring a chest tube, respiratory failure, bowel perforation, cerebral herniation or shock, cerebrospinal fluid (CSF) leak requiring intervention, and transfer to a higher level of care. For patients receiving a thoracentesis, chart review was performed to determine the presence of a follow‐up chest x‐ray, the presence of a pneumothorax, or clinical evidence for re‐expansion pulmonary edema. We analyzed differences between respondents and non‐respondents using Chi‐square tests for categorical variables (gender, level of care, referring service, procedure type, bloody fluid, and immediate reported complications) and independent t tests for continuous variables (age).
After review of the open‐ended fields, responses were classified into the following categories: pain control, physician skill, professionalism, communication, symptom relief, procedure duration, and miscellaneous comments. Responses regarding patient perceptions of physician communication were dichotomized into positive (1 = Strongly Agree, 2 = Agree) and negative (3 = Neutral, 4 = Disagree, and 5 = Strongly Disagree), and independent t tests were used to determine the contribution of factors, such as age, while Chi‐square tests were used for the contribution of gender and procedure type. All statistical tests were performed by using the SAS statistical application program (version 9.2).
Results
Respondent Characteristics
Of 324 procedures performed by the HPS during the study period, 95 (29%) were eligible for consent. Of the 229 patients not eligible for consent, 32 (10%) were excluded because the procedure was performed by the attending alone, 76 (23%) lacked English proficiency or literacy, 66 (20%) had altered mental status, 32 (10%) were intubated and/or had severe illness precluding consent, and 23 (7%) were repeat procedures on patients who had previously completed the survey. Only two patients specifically requested an attending to perform the procedure after an introduction to the service. Of the 95 patients eligible for consent, 89 were consented for the survey, and 65 (68%) completed the survey. Of the six eligible, non‐consented patients, all were leaving the floor immediately following the procedure, and time did not allow for consent and survey distribution. There were no differences between eligible responders and nonresponders in age, gender, procedure, requesting service, presence of bloody fluid, or physician‐reported immediate complications (Table 1).
| Demographics | Respondera (n = 65) | Nonresponder (n = 24) |
|---|---|---|
| ||
| Age, y [mean (SD)] | 55.4 (15.7) | 50.4 (17.4) |
| Male gender, n (%) male | 41 (63.1) | 11 (45.8) |
| Procedure, n (%) | ||
| Paracentesis | 31 (47.7) | 10 (41.7) |
| Thoracentesis | 17 (25.8) | 6 (25.0) |
| Lumbar puncture | 15 (22.7) | 7 (29.2) |
| Arthrocentesis | 2 (3.0) | 1 (4.2) |
| Patient location, n (%) | ||
| Floor | 47 (72.3) | 19 (79.2) |
| Step down/telemetry | 17 (26.1) | 3 (12.5) |
| Intensive care unit | 1 (1.5) | 2 (8.3) |
| Service requesting, n (%) | ||
| Medicine | 29 (44.6) | 10 (41.7) |
| Cardiology | 6 (9.1) | 3 (12.5) |
| Liver transplant | 20 (30.3) | 7 (29.2) |
| Bone marrow transplant | 7 (10.6) | 1 (4.2) |
| Surgery | 0 | 1 (4.2) |
| Neurosurgery | 1 (1.5) | 1 (4.2) |
| Other | 2 (3.0) | 1 (4.2) |
| Reported presence of bloody fluid at any point in the procedure, n (%) | 9 (13.6) | 4 (16.7) |
| Other reported immediate complications | ||
| Equipment malfunction | 2 (3.0) | 1 (4.2) |
| Significant cough/pleuritic pain | 1 (1.5) | 1 (4.2) |
| Transient oxygen desaturation | 1 (1.5) | 0 |
| Ascites leak | 0 | 0 |
| Hematoma | 0 | 0 |
| Persistent bleeding | 0 | 0 |
| Transfer to a higher level of care | 0 | 0 |
Complications
As complications would likely play a role in procedure satisfaction, we describe immediate complications for the study population. Of the 324 procedures performed during the study period, no patient had predefined major immediate complications. Upon further chart review of the 96 patients that had a thoracentesis performed, all had a follow‐up chest x‐ray and none suffered an iatrogenic pneumothorax or re‐expansion pulmonary edema. Minor immediate complications for the 324 procedures were reported as follows: postprocedure pain in four patients (1.2%), cough in nine patients (2.8%), five equipment malfunctions (1.5%), four ascites leaks (1.2%), and one incisional bleed requiring a suture for hemostasis (0.3%). There was no significant difference in complications between those consented for the survey and the total study population.
Procedure Satisfaction
More than 90% of patients were satisfied or very satisfied with most aspects of the procedure, including the informed consent process, pain control, expertise, and courtesy of physicians (Table 2). The percentage of patients satisfied with the duration of procedure (88%) was lower than for other measures of satisfaction. Of the 38 patients receiving therapeutic procedures, 34 (89%) were satisfied or highly satisfied with the improvement in symptoms following the procedure.
| Very Satisfied and Satisfied No. (%) | Neutral No. (%) | Dissatisfied and Very Dissatisfied No. (%) | N/A No. (%) | |
|---|---|---|---|---|
| Your overall procedure experience | 65 (100) | 0 (0) | 0 (0) | 0 (0) |
| Explanation of the procedure, risks, and benefits before the procedure | 64 (99) | 1 (2) | 0 (0) | 0 (0) |
| Pain control during the procedure | 60 (92) | 5 (8) | 0 (0) | 0 (0) |
| Expertise/skill of the physicians performing your procedure | 62 (95) | 3 (5) | 0 (0) | 0 (0) |
| Courtesy and bedside manner of the physicians performing your procedure | 65 (100) | 0 (0) | 0 (0) | 0 (0) |
| The time it took to perform your procedure | 57 (88) | 6 (9) | 0 (0) | 2 (3) |
| Improvement in your symptoms following this procedure, if applicable | 34 (52) | 7 (11) | 0 (0) | 24 (37) |
When asked what went well with the procedure, 59 (91%) respondents provided additional comments and feedback. Each response was classified as described in the Methods section. Of the free text responses, 8 of the 59 patients (14%) commented on the attention to pain control (eg, The caring and attention to my pain was most important to me), 5 (8%) on the skills of the operators (Great examination of the entire stomach region with the ultrasound to ensure the best position of the catheter), 6 (10%) on the courtesy and professionalism of the team (eg, Courteous, team‐feeling, addressed my concerns), 9 (15%) on their communication with the team (eg, The doctors made me feel very comfortable before the procedure by laying out the plan and explaining each part of the procedure), and 8 (14%) on relief of their symptoms (eg, There was an almost immediate and significant improvement in my breathing, bloating, and pain). Twenty‐three of the 59 comments (39%) were categorized as miscellaneous (eg, All went great. I fell asleep).
When asked areas for improvement, 55 (85%) patients responded. Thirty‐three patients (60%) reported that nothing could be improved or they instructed the team to just keep doing what you are doing, while 22 (40%) patients expressed a concern. Responses were categorized in a similar fashion to the positive responses. Five of the 22 negative comments (23%) reported that the procedure took too long (eg, Procedure could have been shorter. I got tired sitting up), 4 (18%) commented on pain control (eg, The poke for marking my skin hurt more than the anesthetic. I was surprised), 6 (27%) felt communication was a problem (eg, Discuss the steps with the patient audibly, no whispering, speak clearly), and 7 (32%) had miscellaneous concerns (eg, Try not to do this procedure right after another one).
Physician Communication
Sixty‐four patients (98%) reported that the physicians performing their procedure communicated with each other during the procedure (Table 3). Although one patient did not feel that the physicians communicated with each other, he or she still answered the follow‐up questions regarding perceptions of physician communication. We excluded this patient from our analysis as his or her answers may not be reliable. The majority of patients (84%) reported this communication as reassuring and felt it was a normal part of procedure performance (94%). Those that did not agree that physician communication was reassuring did not differ in average age (P = 0.307), gender (P = 0.511), or procedure type (P = 0.562).
| Strongly Agree and Agree No. (%) | Neutral No. (%) | Disagree, and Strongly Disagree No. (%) | |
|---|---|---|---|
| I felt that the physicians talking to each other about my procedure was reassuring to me | 54 (84) | 10 (16) | 0 (0) |
| Physicians talking to each other while doing a procedure is a normal part of doing a procedure | 60 (94) | 4 (6) | 0 (0) |
Of all positive and negative comments, five specifically addressed communication between physicians. Most (four) reflected satisfaction with bedside teaching (eg, They discussed the procedure in a professional manner and eased my mind at all times) and with having an expert in the room (eg, [The team] discussed things like needle placement, which was nice because there was a second opinion right there in the room). Patients also felt that it was good to experience the teaching, with one patient reporting that the best part of the procedure was watching doctors learn from each other. Patients did not express specific reservations about bedside teaching, resident technique, or fear of complications in free text.
Discussion
Even though novice interns performed procedures and simultaneous bedside teaching, patient satisfaction with a teaching procedure service was high, and reported complication rates were low. In addition, a majority of patients found discussions related to teaching activities reassuring and potentially important to their perception of care quality. Analogous studies examining patient satisfaction with endoscopic care found similar rates of patient satisfaction with endoscopists' bedside manner, technical skills, and pain control, but these studies included sedated patients.21 Our results are unique, as we evaluated awake patients with attention to perception of bedside teaching with novice interns.
Our findings offer an alternative strategy for bedside procedural teaching that employs transparency in the use of an expert and a trainee to introduce patients to bedside teaching by experts, which is not common at many academic medical centers.28 Patients may have been reassured by a clear explanation of the role of the service and the providers involved as well as an assurance of expertise and attention to patient comfort and safety. In addition to patient satisfaction, this model has the potential to impact both the safety of bedside procedures and housestaff education around procedure performance. For example, pneumothorax rates using our procedure service model are lower than those published (0% vs. 4% for ultrasound‐guided thoracentesis and 8.5% for thoracentesis by less experienced clinicians).29
Providers may be reluctant to teach at the bedside of awake patients for fear of heightening patient anxiety over trainee inexperience. In the 1960s similar fears were raised over the concern for patient anxiety with bedside rounding,30 but later studies revealed these concerns to be largely unfounded. Instead, bedside rounds have been shown to positively influence patients' feelings about their hospital experience and their relationships with their physicians compared with patients whose case presentations were made in a conference room.31, 32 Given the opportunity to comment on areas for improvement, patients in our study specifically elaborated regarding pain control, communication, and efficiency problems. Although 16% of patients did not find the communication of physicians reassuring, none of the negative comments reflected problems with bedside teaching, but rather concepts such as desiring a better explanation of steps throughout the procedure. Specifically, patients desire better communication for unanticipated pain.
There are several limitations to this study. Lack of patient satisfaction data from a control group of patients whose procedures were performed by attendings or housestaff alone limits our ability to draw conclusions about our satisfaction scores. The scarce applicable literature offers only imperfect comparison data. Because hospitalists were not blinded to the survey, attending behavior may have been subject to a Hawthorne effect.33 Consenting patients after the procedure could have provided hospitalists with an opportunity to exclude patients who appeared less satisfied with their procedure; however, attempts were made to prevent this behavior by requiring strict accounting of why a patient was not consented for the study. Use of alternative personnel for consent such as nurses was explored, but was found not to be feasible due to limited resources. These data are only applicable to English‐speaking patients who are literate and well enough to complete a survey. It is not clear whether the experience for other patients would reflect the same outcomes. It is plausible that non‐English‐speaking patients might have more concerns about incomprehensible conversations taking place during their procedure. Although the surveys were anonymous and patients were told that the proceduralists would not see individual responses, responses may have been biased out of patient concern that their response might affect their care. Hospitalists obtaining consent, however, were careful to stress anonymity and the distinction between the primary team and the procedure team.
Academic hospitals are struggling with providing quality procedural care while balancing housestaff education and experience.28 With hospitalists playing an increasingly prominent role in housestaff education and patient satisfaction initiatives, the supervision of housestaff by trained hospitalist faculty may help meet both aims in the performance of invasive bedside procedures, particularly at institutions where simulation training resources are limited. Although concern may exist for potential patient anxiety with bedside teaching, our data demonstrate high levels of patient satisfaction with a hospitalist procedure service despite novice procedure performers and an emphasis on teaching during the procedure.
- ,,, et al.Creation of an innovative inpatient medical procedure service and a method to evaluate house staff competency.J Gen Intern Med.2004;19(5 Pt 2):510–513.
- ,,, et al.Impact of a bedside procedure service on general medicine inpatients: A firm‐based trial.J Hosp Med.2007;2(3):143–149.
- Hospital Care Quality Information from the Consumer Perspective (HCAHPS).Quality Assurance Guidelines.Baltimore, MD:Centers for Medicare 113(8):657–662.
- ,,,,.The effect of bedside case presentations on patients' perceptions of their medical care.N Engl J Med.1997;336(16):1150–1155.
- ,,,.‘Sorry, it's my first time!’ Will patients consent to medical students learning procedures?Med Educ.2005;39(4):365–369.
- ,.Ethical considerations surrounding first time procedures: a study and analysis of patient attitudes toward spinal taps by students.Kennedy Inst Ethics J.1992;2(3):217–231.
- ,,,.Patients' willingness to allow residents to learn to practice medical procedures.Acad Med.2004;79(2):144–147.
- ,,.Patient satisfaction with gynecologic care provided by family practice resident physicians.Fam Pract Res J.1991;11(4):421–428.
- ,,.Resident participation in flexible sigmoidoscopy does not affect patient satisfaction.Am J Gastroenterol.2000;95(6):1563–1566.
- ,.Bedside ultrasound for difficult lumbar puncture.J Emerg Med.2005;28(2):197–200.
- ,.Conducting the Assessment. In:Assessing Competence to Consent to Treatment: A Guide for Physicians and Other Health Professionals.First Edition ed.New York, NY:Oxford University Press;1998:80–91.
- ,.Care of Ill, Socially Complicated Patients. In:Medical Management of Vulnerable 2007:407–418.
- ,,,,.Interventional radiologic procedures: patient anxiety, perception of pain, understanding of procedure, and satisfaction with medication‐‐a prospective study.Radiology.2000;215(3):684–688.
- ,,,,.Improving the assessment of (in)patients' satisfaction with hospital care.Med Care.2001;39(3):270–283.
- ,,,.Factors determining inpatient satisfaction with care.Soc Sci Med.2002;54(4):493–504.
- ,,,.Reliability and validity of the Satisfaction with Hospital Care Questionnaire.Int J Qual Health Care.2002;14(6):471–482.
- ,,,,.A randomized trial of four patient satisfaction questionnaires.Med Care.2003;41(12):1343–1352.
- ,,, et al.Development and validation of an in‐patient satisfaction questionnaire.Int J Qual Health Care.2005;17(6):465–472.
- ,,,.Central venous port catheters: evaluation of patients' satisfaction with implantation under local anesthesia.J Vasc Access.2009;10(1):27–32.
- ,,,.Factors influencing patient satisfaction when undergoing endoscopic procedures.Gastrointest Endosc.2009;69(4):883–91, quiz 891.e1.
- ,,, et al.Complications associated with thoracentesis. A prospective, randomized study comparing three different methods.Arch Intern Med.1990;150(4):873–877.
- ,,, et al.Risk of complications after abdominal paracentesis in cirrhotic patients: a prospective study.Clin Gastroenterol Hepatol.2009;7(8):906–909.
- ,,, et al.Performance standards for therapeutic abdominal paracentesis.Hepatology.2004;40(2):484–488.
- ,,,,.Lumbar puncture: its indications, contraindications, complications and technique.Rev Neurol.2007;45(7):433–436.
- .How to perform a lumbar puncture with the patient in the seated position.Br J Hosp Med (Lond).2006;67(3):M46–7.
- ,,.Are commonly used resident measurements associated with procedural skills in internal medicine residency training?J Gen Intern Med.2007;22(3):357–361.
- ,,,MERN Group,.Supervising the Supervisors‐Procedural Training and Supervision in Internal Medicine Residency.J Gen Intern Med.2010.
- ,,,.Pneumothorax following thoracentesis: a systematic review and meta‐analysis.Arch Intern Med.2010;170(4):332–339.
- ,,.The emotional impact of ward rounds.J Mt Sinai Hosp NY.1956;23(6):782–803.
- ,,,.The physiologic and psychological effects of the bedside presentation.N Engl J Med.1989;321(18):1273–1275.
- ,,,,.The effect of bedside case presentations on patients' perceptions of their medical care.N Engl J Med.1997;336(16):1150–1155.
- .Hawthorne effects and research into professional practice.J Eval Clin Pract.2001;7(1):65–70.
Copyright © 2011 Society of Hospital Medicine
Redefining Readmission Risk Factors
Within Medicare recipients, an astounding one in five medical patients (19.6%) is readmitted within 30 days, accounting for $15 billion in spending.1, 2 Amidst the current healthcare system crisis, reducing these hospital readmissions has risen to the highest priority. Reducing readmissions is the newest addition to multiple quality dashboards, both institutional and national, as a measure of the care delivered during hospitalization.3 One of the most notable of these reporting entities, Hospital Compare, now publicly reports Medicare readmission rates for a few common diagnoses.4 While Medicare already withholds payment to hospitals for readmissions within 24 hours for the same diagnosis, Medicare may soon reduce payment to hospitals with the highest rates of readmission within 30 days, a powerful incentive for hospitals to intervene. Readmissions have also reached the radar of additional stakeholders, even making its way onto Obama's budget considerations, given the potential cost savings to the system overall.5
To develop systems which reduce readmissions, one must first gain understanding of the characteristics of readmissions. A few clinical risk factors (such as age, number of prior admissions, and comorbidities) have been well defined in subgroups of general medicine inpatients.612 Likewise, interventions aiming to reduce readmissions have also focused on subgroups, excluding a large portion of hospitalized patients (for example, non‐English speakers and younger patients).1320 Other data have been derived in veterans or within non‐US populations that have inherently different payer, race, ethnicity, and primary language composition, and may not be applicable outside those settings.7, 8, 10, 11, 21 Lastly, little is known regarding risk that may be associated with operational factors, such as weekend discharge or admission source. As a result, there are few data describing the clinical, operational, and demographic factors associated with readmission in a heterogeneous population of hospitalized general medicine patientsthe patient population of most generalists in the United States.
To understand the impact of a variety of risk factors in a diverse general medicine population, we evaluated the characteristics of readmitted patients in a large urban university medical center over a 2‐year period. We hypothesized that a number of clinical, operational, and sociodemographic factors would be associated with readmission.
Methods
Sites and Subjects
Our data were collected on general medicine patients during hospitalization between June 1, 2006 and May 31, 2008, at the University of California San Francisco. The University of California, San Francisco (UCSF) Medical Center is composed of Moffitt‐Long Hospital (a 400‐bed center) and UCSF‐Mount Zion Hospital (a 200‐bed facility) located in San Francisco, CA.
Medical patients at Moffitt‐Long Hospital are admitted to 1 of 8 medical teams composed of a resident, 1 to 2 interns, and 0 to 3 medical students, supervised by an attending physician who is most often a hospitalist. At Moffitt‐Long Hospital, housestaff write all orders and provide 24‐hour coverage to inpatients. Mount Zion medical patients are cared for by 1 of 2 teams and staffed by a hospitalist on each team who is responsible for all elements of care. Both services care for common inpatient diagnoses, as well as specialty‐associated diagnoses such as cancer, pneumonia, and chronic obstructive pulmonary disease (COPD). Of note, at Moffitt‐Long Hospital, those patients with primary cardiac diagnoses are cared for by a separate team composed of housestaff and students supervised by a cardiologist.
The discharge process at both sites utilizes a multidisciplinary teamincluding physicians, case managers, nurses, pharmacists, and discharge coordinatorsworking in concert. Key components include arranging follow‐up care, faxing the discharge summary to the primary care provider, and educating the patient and caregivers, especially regarding medications. While these goals are clearly delineated, significant variability exists in how these tasks are actually accomplished. The multidisciplinary approach, components of the discharge process, and lack of a systematic approach are representative of the discharge process around the country.22
Data
Data regarding patient demographics, age, comorbidities, and insurance status were collected from administrative data systems at UCSF, reflecting the patient's status at the time of index admission. These same systems were used to collect a date‐stamped log of all medications (eg, anticoagulants) for which the patient was billed during the last 48 hours of hospitalization. Specifically, data were obtained for medications previously shown to cause adverse drug events following hospital discharge.23, 24 These medication groups include corticosteroids, anticoagulants, antibiotics, narcotics, nonsteroidal anti‐inflammatory drugs (NSAIDs), cardiovascular medications, antiepileptics, anticholinergics, antidepressants, and antidiabetics. Operational factors that we hypothesized would affect readmission risk included admission source, discharge disposition, and weekday vs. weekend discharge. Case management, social work, and pharmacy services operate with limited staffing on weekends. Likewise, resident and intern physicians are more likely to be off on a weekend day than a weekday; covering attending physicians care for about half of patients during the weekend. Data were obtained from Transition Systems International (TSI, Boston, MA) administrative databases, a cost‐accounting system that collects data abstracted from patient charts upon discharge from UCSF.
Definition of Readmission Measure
Using TSI, we detected readmission to UCSF by screening for any inpatient encounters on any service (not just medicine) within the 30 days following discharge from the general medicine service at the 2 UCSF campuses. We excluded elective readmissions, such as for scheduled chemotherapy. Patients who died at the index admission were excluded from the cohort.
Adjustment Variables
Age, gender, payer status and APR risk of mortality (3M Health Information Systems, St. Paul, MN) were collected from administrative data. The All Patient Refined (APR) risk of mortality is the all patients risk of mortality score developed by 3M which divides patients into 4 subclasses of risk based on clinical problems and comorbidities.25 We used secondary diagnosis codes in administrative data to classify comorbidities using the method of Elixhauser.26
Using the log of medication charges, we grouped high‐risk medications according to the classification scheme of Forster et al.23 and Hanlon et al.24 We then created a count representing the total number of medications administered to patients within the final 48 hours of stay.
Analysis
We first described study patients and hospitals using univariable methods. Multivariable generalized estimating equations (SAS PROC GENMOD) were used to account for clustering of patients within physicians and calculate adjusted odds ratios (ORs). As there were 2 sites within UCSF Medical Center (Moffitt‐Long and Mount Zion hospitals), we included site as a fixed effect in our model. Models were constructed using manual variable selection methods with final selection being made based on whether the covariate was associated with readmission at P < 0.05. All analyses were carried out using SAS version 9.2 (SAS Institute, Inc. Cary, NC).
Results
Baseline Characteristics
During the 2‐year accrual period, 295 attending physicians admitted 6805 unique patients for a total of 10,359 admissions. Seventeen percent of these 10,359 admissions were readmitted within 30 days. The cohort of all patients had a mean age of 59.6 years 19.5 standard deviation (SD), with 52.8% women. The mean length of stay was 5.6 days 10.4 SD. Medicare was the payer source for approximately half of the admissions. The majority of admissions (90.4%) were billed for at least 1 high risk medication, with narcotics, cardiac medications, and antibiotics being the most common. Regarding disposition, 79.5% of admissions were discharged to home; 9.1% were discharged to a skilled nursing facility (SNF).
Baseline sociodemographic, operational, and clinical characteristics for patients readmitted and not readmitted are shown in Table 1. Demographic characteristics with significant differences (P < 0.05) between readmitted and nonreadmitted groups included mean age, race, payer status, and primary language other than English. Regarding operational characteristics, readmitted patients had a higher median length of stay and were more likely to be admitted through the emergency room during their index admission. Discharge to an SNF was higher in the readmitted group versus the nonreadmitted group (9.7% vs. 9.0%). Several clinical factors were more prevalent in the readmitted group: high‐risk medications, specifically steroids, narcotics, and cardiovascular medications; high‐risk medication count of 3 or greater; and comorbidities including congestive heart failure, renal disease, cancer, anemia, and depression.
| Characteristic | Patients Readmitted (n = 1762 17.0%), n (%) | Patients Not Readmitted (n = 8597 83.0%), n (%) | P Value |
|---|---|---|---|
| |||
| Mean age (years) (SD) | 58.8 (19.3) | 59.8 (19.6) | 0.0491 |
| Female | 930 (52.8) | 4548 (52.9) | 0.9260 |
| Race* | |||
| White | 785 (44.6) | 4166 (48.8) | <0.0001 |
| Black | 442 (25.1) | 1401 (16.4) | |
| Asian | 323 (18.4) | 1726 (20.2) | |
| Other | 209 (11.9) | 1240 (14.5) | |
| Hispanic ethnicity | 140 (8.1) | 734 (8.9) | 0.2737 |
| Payer status | |||
| Medicare | 905 (51.4) | 4266 (49.6) | <0.0001 |
| Medicaid/Medi‐cal | 458 (26.0) | 1578 (18.4) | |
| Private | 370 (21.0) | 2092 (24.3) | |
| Other | 29 (1.7) | 661 (7.7) | |
| Primary language other than English | 242 (17.1) | 1394 (19.5) | 0.0359 |
| Median length of stay (days) (interquartile range) | 4 (2, 7) | 3 (2, 6) | <0.0001 |
| Admit source | |||
| Emergency room | 1506 (85.5) | 6898 (80.2) | <0.0001 |
| Outside hospital | 38 (2.2) | 271 (3.2) | |
| Direct admission/other (jail) | 218 (12.4) | 1428 (16.6) | |
| Discharge to | |||
| Home | 1461 (82.9) | 6773 (78.8) | <0.0001 |
| SNF | 170 (9.7) | 774 (9.0) | |
| Other | 131 (7.4) | 1050 (12.2) | |
| Discharged on weekend | 381 (21.6) | 1904 (22.1) | 0.6288 |
| Patient medications | |||
| Any high‐risk medication | 1679 (95.3) | 7684 (89.4) | <0.0001 |
| High‐risk medication count | |||
| 02 | 577 (32.8) | 3666 (42.6) | <0.0001 |
| 34 | 692 (39.3) | 2968 (34.5) | |
| 5 | 493 (28) | 1963 (22.8) | |
| Any corticosteroids | 399 (22.6) | 1571 (18.3) | <0.0001 |
| Anticoagulant | 120 (6.8) | 559 (6.5) | 0.6340 |
| Any antibiotic | 904 (51.3) | 4203 (48.9) | 0.0646 |
| Any narcotic | 1036 (58.8) | 4206 (48.9) | <0.0001 |
| Any NSAID | 68 (3.9) | 320 (3.7) | 0.7826 |
| Any cardiovascular med | 887 (50.3) | 3806 (44.3) | <0.0001 |
| Any antiepileptic | 93 (5.3) | 470 (5.5) | 0.7500 |
| Any anticholinergic | 47 (2.7) | 354 (4.1) | 0.0040 |
| Any antidepressant | 455 (25.8) | 1863 (25.8) | 0.0001 |
| Any antidiabetic | 198 (11.2) | 994 (11.6) | 0.6970 |
| Elixhauser comorbidities | |||
| Congestive heart failure | 219 (12.4) | 795 (9.3) | <0.0001 |
| Pulmonary circulation disease | 72 (4.1) | 178 (2.1) | <0.0001 |
| Peripheral vascular disease | 84 (4.8) | 331 (3.9) | 0.0737 |
| Hypertension | 745 (42.3) | 3741 (43.5) | 0.3411 |
| Other neurological disease | 101 (5.7) | 696 (8.1) | 0.0007 |
| Chronic pulmonary disease | 317 (18.0) | 1442 (16.8) | 0.2149 |
| Diabetes | 303 (17.2) | 1333 (15.5) | 0.0762 |
| Renal failure | 339 (19.2) | 1286 (15.0) | <0.0001 |
| Liver disease | 188 (10.7) | 774 (9.0) | 0.0281 |
| Metastatic cancer | 160 (9.1) | 530 (6.2) | <0.0001 |
| Solid tumor w/o metastases | 100 (5.7) | 277 (3.2) | <0.0001 |
| Rheumatoid arthritis/collagen vas | 81 (4.6) | 303 (3.5) | 0.0299 |
| Weight loss | 153 (8.7) | 584 (6.8) | 0.0449 |
| Deficiency anemia | 522 (29.6) | 1979 (23.0) | <0.0001 |
| Alcohol abuse | 101 (5.7) | 428 (5.0) | 0.1905 |
| Drug abuse | 148 (8.4) | 619 (7.2) | 0.0798 |
| Depression | 244 (13.9) | 963 (11.2) | 0.0016 |
| APR risk of mortality | |||
| 1 | 451 (25.6) | 3101 (36.1) | <0.0001 |
| 2 | 619 (35.1) | 2797 (32.5) | |
| 3 | 536 (30.4) | 1907 (22.2) | |
| 4 | 156 (8.9) | 792 (9.2) | |
Frequency of Readmission
The 30‐day readmission rate was 17.0% (1762 patients), with 49.7% (875 patients) of the readmissions occurring within 10 days of discharge. Of patients readmitted, the general medicine service was the readmitting team in 78.2%. A quarter of readmissions (26.2%) had the same primary diagnosis on initial and repeat admission.
Factors Associated With Readmission
Factors associated with readmission were categorized as sociodemographic, operational, and clinical. Factors associated with readmission with P < 0.05 and present in at least 5% of admissions are presented in Table 2. Of the sociodemographic factors, black race was significantly associated with readmission. Within the Medicare cohort, risk for readmission was similar for white vs. nonwhite race, with relative risk of 1.0 (95% confidence interval [CI], 0.86‐1.18). Medicaid as payer status was significantly associated in the unadjusted model, and in the adjusted model showed a trend toward readmission. Mean age was significantly different in the readmitted and nonreadmitted groups, but the difference was small (1.0 year). Moreover, when we evaluated age in 5‐year categories (ex. 65‐70, 71‐75, etc.), age was not associated with readmission. In the adjusted model, none of the operational factors were significantly associated with readmission, including discharge to SNF, weekend discharge, or admit source.
| Covariate | Unadjusted OR (95% CI) | Adjusted OR (95% CI) |
|---|---|---|
| ||
| Age | 1.00 (0.991.00) | 1.00 (0.991.00) |
| Race | ||
| White | Referent | Referent |
| Black | 1.67 (1.471.91) | 1.43 (1.241.65) |
| Asian | 0.99 (0.861.14) | 0.95 (0.821.11) |
| Other | 0.89 (0.761.06) | 0.84 (0.671.06) |
| Payer | ||
| Medicare | Referent | Referent |
| Medicaid/medical | 1.37 (1.211.55) | 1.15 (0.971.36) |
| Private | 0.83 (0.730.95) | 0.78 (0.650.95) |
| Other | 0.21 (0.140.30) | 0.23 (0.110.45) |
| Disposition | ||
| To home | Referent | Referent |
| SNF | 1.02 (0.851.21) | 0.98 (0.821.18) |
| Other | 0.58 (0.480.70) | 0.53 (0.430.66) |
| Highrisk medications | ||
| Corticosteroids | 1.31 (1.161.48) | 1.24 (1.091.42) |
| Narcotics | 1.49 (1.341.65) | 1.33 (1.161.53) |
| Anticholinergics | 0.64 (0.470.87) | 0.66 (0.480.90) |
| Comorbidities | ||
| Congestive heart failure | 1.39 (1.191.63) | 1.30 (1.091.56) |
| Neurological disorders | 0.69 (0.560.86) | 0.70 (0.570.87) |
| Renal failure | 1.35 (1.191.55) | 1.19 (1.051.36) |
| Metastatic cancer | 1.52 (1.261.83) | 1.61 (1.331.95) |
| Solid tumor w/o metastasis | 1.81 (1.432.29) | 1.95 (1.542.47) |
| Deficiency anemia | 1.41 (1.261.58) | 1.27 (1.131.44) |
| Weight loss | 1.30 (1.081.57) | 1.26 (1.091.47) |
Of the clinical factors, high‐risk medications and 6 comorbidities were associated with readmission. High‐risk medication categories associated with readmission were steroids and narcotics; anticholinergics medications were protective. The 6 comorbidities associated with readmission were congestive heart failure, renal disease, cancer (with and without metastasis), weight loss, and iron deficiency anemia. While APR risk of mortality was associated with readmission at P < 0.05, including APR in our final model did not alter which other factors were significantly associated with readmission. When site (Moffitt‐Long vs. Mount Zion Hospitals) was added to the model, the ORs for factors associated with readmission did not change appreciably (0.01).
Discussion
In this retrospective observational study of hospitalized patients, we found that readmission was common and associated with a number of risk factors that could be easily identified early in hospitalization. Nonclinical factors associated with readmission were black race and Medicaid payer status (in the unadjusted model). Clinical factors were high risk medications including steroids and narcotics; and comorbidities including congestive heart failure, renal disease, cancer, anemia, and weight loss. In contrast, other potential riskssuch as discharge on a weekend and discharge to an SNFwere not independently associated with readmission. This cohortwith a mix of clinical scenarios, payers, age, etc.represents the inherently heterogeneous population of inpatient general medicine across the country and abroad. Hospitalists provided care for over 65% of the general medicine service, again representative of the trend in US inpatient medicine.27, 28 Lastly, our cohort did not have the benefit of a systematic and consistent discharge process with interventions focused on reducing readmissions. This gap, which is common across hospitals, highlights the utility of this data in targeting quality improvement efforts.
Reducing risks for readmission requires identification of patient populations at highest risk; in those patients, one can further identify factors which are potentially modifiable via education or patient‐engagement interventions. While in the hospital, more intensive predischarge counseling and efforts to increase mobility may be most useful if targeted early and often on those at highest risk.15, 16, 29, 30 Finally, broader‐based support in the form of better home services, more access to longitudinal care, or targeted postdischarge efforts may be required.14, 31
Though current strategies focus largely on clinical risk factors, this study shows that nonclinical factors play an equally important but underappreciated role in contributing to readmission. While prior studies have shown variable results on association of black race with readmission,2, 9, 11 none have evaluated or linked Medicaid to readmission, which just missed statistical significance in this study (OR, 1.15; 95% CI, 0.971.36). Both black race and Medicaid as payer are proxies for the underlying root cause aspects leading to readmission, such as access to longitudinal care. Following this trail to the root cause will require in‐depth qualitative evaluation that includes the patient perspective as a source of data.32 For example, risk for readmission may not stem solely from being on warfarin, but in combination with not having transportation to get an international normalized ratio (INR) checked, a suboptimal understanding of how to take the medication, or not recognizing potential side effects until too late to avoid inpatient admission.
Several of the strongest associations, and perhaps most conducive to targeted interventions, were high‐risk medications at discharge. Risk related to medications and adverse drug events following discharge have been a consistent theme in readmission literature.24, 33 Our current system, which includes mandated inpatient medicine reconciliation, does not encourage discontinuation of unnecessary medications to combat polypharmacy, address affordability of medications, provide consistent medication counseling, or focus on the highest risk medications. In fact, bundled interventions which implement pharmacists to focus on these measures have been successful in decreasing readmission,14, 16, 29 but unfortunately are not yet part of the standard of care. The challenge remains transforming a mandatory policy such as medicine reconciliation into a valuable and systematic tool in the discharge process.
Two factors were surprisingly protective against readmission: neurologic diagnosis and anticholinergic medications. This first may be explained by the presence of a separate neurology service at our institution which skews our data. For example, a patient with acute stroke, who has a 20% rate of bounce‐back to a higher level of care within 30 days of discharge,34 would be admitted to the neurology service, not general medicine, and therefore would not nr part of our cohort. Regarding anticholinergics, several factors may explain this unexpected result. First, use of anticholinergics was relatively rare in our sample (2.7% in readmitted patients, 4.1% in patients not readmitted), possibly creating a false positive result. Second, Hanlon et al.24 showed only a weak association at best between anticholinergics and postdischarge adverse drug reactions (hazard ratio, 1.11; 95% CI, 0.86‐1.43). Lastly, anticholinergics include a varied group of medications, therefore diluting possible relative risk of specific medications.
While this study allows providers to identify patients at increased risk of readmission, the identified factors do not fully account for readmission risk; we did not aim to produce a risk‐prediction rule with our study. Prior readmission studies have been unable to create a tool to predict which patients will be readmitted with much success.3537 These results underscore the complexities and variability of readmission, which often lack a clear single cause and effect relationship. Given the breadth of risk factors we identified, it seems likely that more intensive interventions will require a multidisciplinary approach, one which might be costly if applied broadly. Our study does not attempt to predict who will be readmitted and who will not, but rather provides a list of risk factors which might be used to deploy resources more efficiently.
This study had several limitations. We did not capture readmissions to outside hospitals, which account for 22% to 24% of all readmissions in prior studies, and therefore have underestimated the readmission rate in our population.2, 8 However, by limiting our data to 2 hospitals within 1 institution, we were able to include more detailed patient level data, which is not accurately available in other large databases. Also, while studies of risk factors in a managed care population (such as within Medicare, the Veterans Affairs medical centers, or countries with national integrated medical records) are able to capture all readmissions, this study is the first to evaluate readmissions risk factors in a truly heterogeneous U.S. inpatient medicine population without limitation by age or payer status. Second, we did not have access to outpatient medications lists; however use of these same medications within the last 48 hours of admission is likely a reasonable proxy for outpatient use and more conducive to potential interventions (such as medication reconciliation or patient education) that could flag patients prior to discharge. Payer data was limited to only the primary payer, so patients who were dual eligible (ie, have both Medicare and Medicaid) were categorized as Medicare. Regarding sociodemographic factors, while primary language other than English was not associated with readmission, language data was missing in 17.4% of admissions, thereby limiting our ability to evaluate this factor. Our data did not include access to outpatient or primary care, and therefore we were unable to evaluate access to postdischarge follow‐up care as a risk factor for readmission. Lastly, while this study did not include outpatient deaths, we did exclude patients who died in the hospital.
Conclusions
Readmission is common among general medicine patients, with approximately 1 in 5 patients being readmitted within 30 days. While the identified associated factors do not account for all the potential reasons for readmission, our study suggests a spectrum of risk factors which might be used to target more intensive multidisciplinary interventions. Specifically, the nonclinical factors of race and payer status merit further in depth research incorporating the patient experience to truly determine causation of readmission. Hospitalists, who are at nexus of the discharge process and uniquely invested in quality inpatient care, are ideally positioned to lead efforts to reduce readmissions. How to use our study's results to develop and implement effective interventions to reduce readmissions remains a subject for future studies.
- A path to bundled payment around a rehospitalization.: Medicare payment Advisory Commission; June2005.
- ,,.Rehospitalizations among patients in the Medicare fee‐for‐service program.N Engl J Med.2009;360(14):1418–1428.
- University HealthSystem Consortium. Available at: https://www.uhc.edu. Accessed May2010.
- U.S. Department of Health 15(5):599–606.
- ,,,.Development and validation of a model for predicting emergency admissions over the next year (PEONY): a UK historical cohort study.Arch Intern Med.2008;168(13):1416–1422.
- ,,, et al.Incidence and main factors associated with early unplanned hospital readmission among French medical inpatients aged 75 and over admitted through emergency units.Age Ageing.2008;37(4):416–422.
- ,,,,,.Factors associated with unplanned hospital readmission among patients 65 years of age and older in a Medicare managed care plan.Am J Med.1999;107(1):13–17.
- ,,.Risk factors for early unplanned hospital readmission in the elderly.J Gen Intern Med.1991;6(3):223–228.
- ,,, et al.Predicting non‐elective hospital readmissions: a multi‐site study. Department of Veterans Affairs Cooperative Study Group on Primary Care and Readmissions.J Clin Epidemiol.2000;53(11):1113–1118.
- ,.Effect of gender, ethnicity, pulmonary disease, and symptom stability on rehospitalization in patients with heart failure.Am J Cardiol.2007;100(7):1139–1144.
- ,,,.The care transitions intervention: results of a randomized controlled trial.Arch Intern Med.2006;166(17):1822–1828.
- ,,,.The impact of follow‐up telephone calls to patients after hospitalization.Am J Med.2001;111(9B):26S–30S.
- ,,, et al.A reengineered hospital discharge program to decrease rehospitalization: a randomized trial.Ann Intern Med.2009;150(3):178–187.
- ,,, et al.Reduction of 30‐day postdischarge hospital readmission or emergency department (ED) visit rates in high‐risk elderly medical patients through delivery of a targeted care bundle.J Hosp Med.2009;4(4):211–218.
- ,,,,,.Comprehensive discharge planning with postdischarge support for older patients with congestive heart failure: a meta‐analysis.JAMA.2004;291(11):1358–1367.
- ,.Home‐based intervention in congestive heart failure: long‐term implications on readmission and survival.Circulation.2002;105(24):2861–2866.
- ,,,,,.Effect of a standardized nurse case‐management telephone intervention on resource use in patients with chronic heart failure.Arch Intern Med.2002;162(6):705–712.
- ,,,.The impact of follow‐up physician visits on emergency readmissions for patients with asthma and chronic obstructive pulmonary disease: a population‐based study.Am J Med.2002;112(2):120–125.
- ,.Factors predicting readmission of older general medicine patients.J Gen Intern Med.1991;6(5):389–393.
- BOOSTing Care Transitions. Available at: http://www.hospitalmedicine.org/ResourceRoomRedesign/RR_CareTransitions/CT_Home.cfm. Accessed May2010.
- ,,,,.Adverse drug events occurring following hospital discharge.J Gen Intern Med.2005;20(4):317–323.
- ,,, et al.Incidence and predictors of all and preventable adverse drug reactions in frail elderly persons after hospital stay.J Gerontol A Biol Sci Med Sci.2006;61(5):511–515.
- . Development of the 3M™ All Patient Refined Diagnosis Related Groups (APR DRGs). Available at: http://www.ahrq.gov/qual/mortality/Hughes.htm. Accessed May2010.
- ,,.Volume thresholds and hospital characteristics in the United States.Health Aff (Millwood).2003;22(2):167–177.
- ,,,.The status of hospital medicine groups in the United States.J Hosp Med.2006;1(2):75–80.
- ,,,.Growth in the care of older patients by hospitalists in the United States.N Engl J Med.2009;360(11):1102–1112.
- ,,, et al.Role of pharmacist counseling in preventing adverse drug events after hospitalization.Arch Intern Med.2006;166(5):565–571.
- ,,, et al.Effects of a multicomponent intervention on functional outcomes and process of care in hospitalized older patients: a randomized controlled trial of Acute Care for Elders (ACE) in a community hospital.J Am Geriatr Soc.2000;48(12):1572–1581.
- ,,,,,.Telehome monitoring in patients with cardiac disease who are at high risk of readmission.Heart Lung.2008;37(1):36–45.
- ,,.Understanding rehospitalization risk: can hospital discharge be modified to reduce recurrent hospitalization?J Hosp Med.2007;2(5):297–304.
- ,,,,.The incidence and severity of adverse events affecting patients after discharge from the hospital.Ann Intern Med.2003;138(3):161–167.
- ,,,.Bouncing back: patterns and predictors of complicated transitions 30 days after hospitalization for acute ischemic stroke.J Am Geriatr Soc.2007;55(3):365–373.
- ,,,.Case finding for patients at risk of readmission to hospital: development of algorithm to identify high risk patients.BMJ.2006;333(7563):327.
- ,,,,,.Screening elders for risk of hospital admission.J Am Geriatr Soc.1993;41(8):811–817.
- ,,,.Using routine inpatient data to identify patients at risk of hospital readmission.BMC Health Serv Res.2009;9:96.
Within Medicare recipients, an astounding one in five medical patients (19.6%) is readmitted within 30 days, accounting for $15 billion in spending.1, 2 Amidst the current healthcare system crisis, reducing these hospital readmissions has risen to the highest priority. Reducing readmissions is the newest addition to multiple quality dashboards, both institutional and national, as a measure of the care delivered during hospitalization.3 One of the most notable of these reporting entities, Hospital Compare, now publicly reports Medicare readmission rates for a few common diagnoses.4 While Medicare already withholds payment to hospitals for readmissions within 24 hours for the same diagnosis, Medicare may soon reduce payment to hospitals with the highest rates of readmission within 30 days, a powerful incentive for hospitals to intervene. Readmissions have also reached the radar of additional stakeholders, even making its way onto Obama's budget considerations, given the potential cost savings to the system overall.5
To develop systems which reduce readmissions, one must first gain understanding of the characteristics of readmissions. A few clinical risk factors (such as age, number of prior admissions, and comorbidities) have been well defined in subgroups of general medicine inpatients.612 Likewise, interventions aiming to reduce readmissions have also focused on subgroups, excluding a large portion of hospitalized patients (for example, non‐English speakers and younger patients).1320 Other data have been derived in veterans or within non‐US populations that have inherently different payer, race, ethnicity, and primary language composition, and may not be applicable outside those settings.7, 8, 10, 11, 21 Lastly, little is known regarding risk that may be associated with operational factors, such as weekend discharge or admission source. As a result, there are few data describing the clinical, operational, and demographic factors associated with readmission in a heterogeneous population of hospitalized general medicine patientsthe patient population of most generalists in the United States.
To understand the impact of a variety of risk factors in a diverse general medicine population, we evaluated the characteristics of readmitted patients in a large urban university medical center over a 2‐year period. We hypothesized that a number of clinical, operational, and sociodemographic factors would be associated with readmission.
Methods
Sites and Subjects
Our data were collected on general medicine patients during hospitalization between June 1, 2006 and May 31, 2008, at the University of California San Francisco. The University of California, San Francisco (UCSF) Medical Center is composed of Moffitt‐Long Hospital (a 400‐bed center) and UCSF‐Mount Zion Hospital (a 200‐bed facility) located in San Francisco, CA.
Medical patients at Moffitt‐Long Hospital are admitted to 1 of 8 medical teams composed of a resident, 1 to 2 interns, and 0 to 3 medical students, supervised by an attending physician who is most often a hospitalist. At Moffitt‐Long Hospital, housestaff write all orders and provide 24‐hour coverage to inpatients. Mount Zion medical patients are cared for by 1 of 2 teams and staffed by a hospitalist on each team who is responsible for all elements of care. Both services care for common inpatient diagnoses, as well as specialty‐associated diagnoses such as cancer, pneumonia, and chronic obstructive pulmonary disease (COPD). Of note, at Moffitt‐Long Hospital, those patients with primary cardiac diagnoses are cared for by a separate team composed of housestaff and students supervised by a cardiologist.
The discharge process at both sites utilizes a multidisciplinary teamincluding physicians, case managers, nurses, pharmacists, and discharge coordinatorsworking in concert. Key components include arranging follow‐up care, faxing the discharge summary to the primary care provider, and educating the patient and caregivers, especially regarding medications. While these goals are clearly delineated, significant variability exists in how these tasks are actually accomplished. The multidisciplinary approach, components of the discharge process, and lack of a systematic approach are representative of the discharge process around the country.22
Data
Data regarding patient demographics, age, comorbidities, and insurance status were collected from administrative data systems at UCSF, reflecting the patient's status at the time of index admission. These same systems were used to collect a date‐stamped log of all medications (eg, anticoagulants) for which the patient was billed during the last 48 hours of hospitalization. Specifically, data were obtained for medications previously shown to cause adverse drug events following hospital discharge.23, 24 These medication groups include corticosteroids, anticoagulants, antibiotics, narcotics, nonsteroidal anti‐inflammatory drugs (NSAIDs), cardiovascular medications, antiepileptics, anticholinergics, antidepressants, and antidiabetics. Operational factors that we hypothesized would affect readmission risk included admission source, discharge disposition, and weekday vs. weekend discharge. Case management, social work, and pharmacy services operate with limited staffing on weekends. Likewise, resident and intern physicians are more likely to be off on a weekend day than a weekday; covering attending physicians care for about half of patients during the weekend. Data were obtained from Transition Systems International (TSI, Boston, MA) administrative databases, a cost‐accounting system that collects data abstracted from patient charts upon discharge from UCSF.
Definition of Readmission Measure
Using TSI, we detected readmission to UCSF by screening for any inpatient encounters on any service (not just medicine) within the 30 days following discharge from the general medicine service at the 2 UCSF campuses. We excluded elective readmissions, such as for scheduled chemotherapy. Patients who died at the index admission were excluded from the cohort.
Adjustment Variables
Age, gender, payer status and APR risk of mortality (3M Health Information Systems, St. Paul, MN) were collected from administrative data. The All Patient Refined (APR) risk of mortality is the all patients risk of mortality score developed by 3M which divides patients into 4 subclasses of risk based on clinical problems and comorbidities.25 We used secondary diagnosis codes in administrative data to classify comorbidities using the method of Elixhauser.26
Using the log of medication charges, we grouped high‐risk medications according to the classification scheme of Forster et al.23 and Hanlon et al.24 We then created a count representing the total number of medications administered to patients within the final 48 hours of stay.
Analysis
We first described study patients and hospitals using univariable methods. Multivariable generalized estimating equations (SAS PROC GENMOD) were used to account for clustering of patients within physicians and calculate adjusted odds ratios (ORs). As there were 2 sites within UCSF Medical Center (Moffitt‐Long and Mount Zion hospitals), we included site as a fixed effect in our model. Models were constructed using manual variable selection methods with final selection being made based on whether the covariate was associated with readmission at P < 0.05. All analyses were carried out using SAS version 9.2 (SAS Institute, Inc. Cary, NC).
Results
Baseline Characteristics
During the 2‐year accrual period, 295 attending physicians admitted 6805 unique patients for a total of 10,359 admissions. Seventeen percent of these 10,359 admissions were readmitted within 30 days. The cohort of all patients had a mean age of 59.6 years 19.5 standard deviation (SD), with 52.8% women. The mean length of stay was 5.6 days 10.4 SD. Medicare was the payer source for approximately half of the admissions. The majority of admissions (90.4%) were billed for at least 1 high risk medication, with narcotics, cardiac medications, and antibiotics being the most common. Regarding disposition, 79.5% of admissions were discharged to home; 9.1% were discharged to a skilled nursing facility (SNF).
Baseline sociodemographic, operational, and clinical characteristics for patients readmitted and not readmitted are shown in Table 1. Demographic characteristics with significant differences (P < 0.05) between readmitted and nonreadmitted groups included mean age, race, payer status, and primary language other than English. Regarding operational characteristics, readmitted patients had a higher median length of stay and were more likely to be admitted through the emergency room during their index admission. Discharge to an SNF was higher in the readmitted group versus the nonreadmitted group (9.7% vs. 9.0%). Several clinical factors were more prevalent in the readmitted group: high‐risk medications, specifically steroids, narcotics, and cardiovascular medications; high‐risk medication count of 3 or greater; and comorbidities including congestive heart failure, renal disease, cancer, anemia, and depression.
| Characteristic | Patients Readmitted (n = 1762 17.0%), n (%) | Patients Not Readmitted (n = 8597 83.0%), n (%) | P Value |
|---|---|---|---|
| |||
| Mean age (years) (SD) | 58.8 (19.3) | 59.8 (19.6) | 0.0491 |
| Female | 930 (52.8) | 4548 (52.9) | 0.9260 |
| Race* | |||
| White | 785 (44.6) | 4166 (48.8) | <0.0001 |
| Black | 442 (25.1) | 1401 (16.4) | |
| Asian | 323 (18.4) | 1726 (20.2) | |
| Other | 209 (11.9) | 1240 (14.5) | |
| Hispanic ethnicity | 140 (8.1) | 734 (8.9) | 0.2737 |
| Payer status | |||
| Medicare | 905 (51.4) | 4266 (49.6) | <0.0001 |
| Medicaid/Medi‐cal | 458 (26.0) | 1578 (18.4) | |
| Private | 370 (21.0) | 2092 (24.3) | |
| Other | 29 (1.7) | 661 (7.7) | |
| Primary language other than English | 242 (17.1) | 1394 (19.5) | 0.0359 |
| Median length of stay (days) (interquartile range) | 4 (2, 7) | 3 (2, 6) | <0.0001 |
| Admit source | |||
| Emergency room | 1506 (85.5) | 6898 (80.2) | <0.0001 |
| Outside hospital | 38 (2.2) | 271 (3.2) | |
| Direct admission/other (jail) | 218 (12.4) | 1428 (16.6) | |
| Discharge to | |||
| Home | 1461 (82.9) | 6773 (78.8) | <0.0001 |
| SNF | 170 (9.7) | 774 (9.0) | |
| Other | 131 (7.4) | 1050 (12.2) | |
| Discharged on weekend | 381 (21.6) | 1904 (22.1) | 0.6288 |
| Patient medications | |||
| Any high‐risk medication | 1679 (95.3) | 7684 (89.4) | <0.0001 |
| High‐risk medication count | |||
| 02 | 577 (32.8) | 3666 (42.6) | <0.0001 |
| 34 | 692 (39.3) | 2968 (34.5) | |
| 5 | 493 (28) | 1963 (22.8) | |
| Any corticosteroids | 399 (22.6) | 1571 (18.3) | <0.0001 |
| Anticoagulant | 120 (6.8) | 559 (6.5) | 0.6340 |
| Any antibiotic | 904 (51.3) | 4203 (48.9) | 0.0646 |
| Any narcotic | 1036 (58.8) | 4206 (48.9) | <0.0001 |
| Any NSAID | 68 (3.9) | 320 (3.7) | 0.7826 |
| Any cardiovascular med | 887 (50.3) | 3806 (44.3) | <0.0001 |
| Any antiepileptic | 93 (5.3) | 470 (5.5) | 0.7500 |
| Any anticholinergic | 47 (2.7) | 354 (4.1) | 0.0040 |
| Any antidepressant | 455 (25.8) | 1863 (25.8) | 0.0001 |
| Any antidiabetic | 198 (11.2) | 994 (11.6) | 0.6970 |
| Elixhauser comorbidities | |||
| Congestive heart failure | 219 (12.4) | 795 (9.3) | <0.0001 |
| Pulmonary circulation disease | 72 (4.1) | 178 (2.1) | <0.0001 |
| Peripheral vascular disease | 84 (4.8) | 331 (3.9) | 0.0737 |
| Hypertension | 745 (42.3) | 3741 (43.5) | 0.3411 |
| Other neurological disease | 101 (5.7) | 696 (8.1) | 0.0007 |
| Chronic pulmonary disease | 317 (18.0) | 1442 (16.8) | 0.2149 |
| Diabetes | 303 (17.2) | 1333 (15.5) | 0.0762 |
| Renal failure | 339 (19.2) | 1286 (15.0) | <0.0001 |
| Liver disease | 188 (10.7) | 774 (9.0) | 0.0281 |
| Metastatic cancer | 160 (9.1) | 530 (6.2) | <0.0001 |
| Solid tumor w/o metastases | 100 (5.7) | 277 (3.2) | <0.0001 |
| Rheumatoid arthritis/collagen vas | 81 (4.6) | 303 (3.5) | 0.0299 |
| Weight loss | 153 (8.7) | 584 (6.8) | 0.0449 |
| Deficiency anemia | 522 (29.6) | 1979 (23.0) | <0.0001 |
| Alcohol abuse | 101 (5.7) | 428 (5.0) | 0.1905 |
| Drug abuse | 148 (8.4) | 619 (7.2) | 0.0798 |
| Depression | 244 (13.9) | 963 (11.2) | 0.0016 |
| APR risk of mortality | |||
| 1 | 451 (25.6) | 3101 (36.1) | <0.0001 |
| 2 | 619 (35.1) | 2797 (32.5) | |
| 3 | 536 (30.4) | 1907 (22.2) | |
| 4 | 156 (8.9) | 792 (9.2) | |
Frequency of Readmission
The 30‐day readmission rate was 17.0% (1762 patients), with 49.7% (875 patients) of the readmissions occurring within 10 days of discharge. Of patients readmitted, the general medicine service was the readmitting team in 78.2%. A quarter of readmissions (26.2%) had the same primary diagnosis on initial and repeat admission.
Factors Associated With Readmission
Factors associated with readmission were categorized as sociodemographic, operational, and clinical. Factors associated with readmission with P < 0.05 and present in at least 5% of admissions are presented in Table 2. Of the sociodemographic factors, black race was significantly associated with readmission. Within the Medicare cohort, risk for readmission was similar for white vs. nonwhite race, with relative risk of 1.0 (95% confidence interval [CI], 0.86‐1.18). Medicaid as payer status was significantly associated in the unadjusted model, and in the adjusted model showed a trend toward readmission. Mean age was significantly different in the readmitted and nonreadmitted groups, but the difference was small (1.0 year). Moreover, when we evaluated age in 5‐year categories (ex. 65‐70, 71‐75, etc.), age was not associated with readmission. In the adjusted model, none of the operational factors were significantly associated with readmission, including discharge to SNF, weekend discharge, or admit source.
| Covariate | Unadjusted OR (95% CI) | Adjusted OR (95% CI) |
|---|---|---|
| ||
| Age | 1.00 (0.991.00) | 1.00 (0.991.00) |
| Race | ||
| White | Referent | Referent |
| Black | 1.67 (1.471.91) | 1.43 (1.241.65) |
| Asian | 0.99 (0.861.14) | 0.95 (0.821.11) |
| Other | 0.89 (0.761.06) | 0.84 (0.671.06) |
| Payer | ||
| Medicare | Referent | Referent |
| Medicaid/medical | 1.37 (1.211.55) | 1.15 (0.971.36) |
| Private | 0.83 (0.730.95) | 0.78 (0.650.95) |
| Other | 0.21 (0.140.30) | 0.23 (0.110.45) |
| Disposition | ||
| To home | Referent | Referent |
| SNF | 1.02 (0.851.21) | 0.98 (0.821.18) |
| Other | 0.58 (0.480.70) | 0.53 (0.430.66) |
| Highrisk medications | ||
| Corticosteroids | 1.31 (1.161.48) | 1.24 (1.091.42) |
| Narcotics | 1.49 (1.341.65) | 1.33 (1.161.53) |
| Anticholinergics | 0.64 (0.470.87) | 0.66 (0.480.90) |
| Comorbidities | ||
| Congestive heart failure | 1.39 (1.191.63) | 1.30 (1.091.56) |
| Neurological disorders | 0.69 (0.560.86) | 0.70 (0.570.87) |
| Renal failure | 1.35 (1.191.55) | 1.19 (1.051.36) |
| Metastatic cancer | 1.52 (1.261.83) | 1.61 (1.331.95) |
| Solid tumor w/o metastasis | 1.81 (1.432.29) | 1.95 (1.542.47) |
| Deficiency anemia | 1.41 (1.261.58) | 1.27 (1.131.44) |
| Weight loss | 1.30 (1.081.57) | 1.26 (1.091.47) |
Of the clinical factors, high‐risk medications and 6 comorbidities were associated with readmission. High‐risk medication categories associated with readmission were steroids and narcotics; anticholinergics medications were protective. The 6 comorbidities associated with readmission were congestive heart failure, renal disease, cancer (with and without metastasis), weight loss, and iron deficiency anemia. While APR risk of mortality was associated with readmission at P < 0.05, including APR in our final model did not alter which other factors were significantly associated with readmission. When site (Moffitt‐Long vs. Mount Zion Hospitals) was added to the model, the ORs for factors associated with readmission did not change appreciably (0.01).
Discussion
In this retrospective observational study of hospitalized patients, we found that readmission was common and associated with a number of risk factors that could be easily identified early in hospitalization. Nonclinical factors associated with readmission were black race and Medicaid payer status (in the unadjusted model). Clinical factors were high risk medications including steroids and narcotics; and comorbidities including congestive heart failure, renal disease, cancer, anemia, and weight loss. In contrast, other potential riskssuch as discharge on a weekend and discharge to an SNFwere not independently associated with readmission. This cohortwith a mix of clinical scenarios, payers, age, etc.represents the inherently heterogeneous population of inpatient general medicine across the country and abroad. Hospitalists provided care for over 65% of the general medicine service, again representative of the trend in US inpatient medicine.27, 28 Lastly, our cohort did not have the benefit of a systematic and consistent discharge process with interventions focused on reducing readmissions. This gap, which is common across hospitals, highlights the utility of this data in targeting quality improvement efforts.
Reducing risks for readmission requires identification of patient populations at highest risk; in those patients, one can further identify factors which are potentially modifiable via education or patient‐engagement interventions. While in the hospital, more intensive predischarge counseling and efforts to increase mobility may be most useful if targeted early and often on those at highest risk.15, 16, 29, 30 Finally, broader‐based support in the form of better home services, more access to longitudinal care, or targeted postdischarge efforts may be required.14, 31
Though current strategies focus largely on clinical risk factors, this study shows that nonclinical factors play an equally important but underappreciated role in contributing to readmission. While prior studies have shown variable results on association of black race with readmission,2, 9, 11 none have evaluated or linked Medicaid to readmission, which just missed statistical significance in this study (OR, 1.15; 95% CI, 0.971.36). Both black race and Medicaid as payer are proxies for the underlying root cause aspects leading to readmission, such as access to longitudinal care. Following this trail to the root cause will require in‐depth qualitative evaluation that includes the patient perspective as a source of data.32 For example, risk for readmission may not stem solely from being on warfarin, but in combination with not having transportation to get an international normalized ratio (INR) checked, a suboptimal understanding of how to take the medication, or not recognizing potential side effects until too late to avoid inpatient admission.
Several of the strongest associations, and perhaps most conducive to targeted interventions, were high‐risk medications at discharge. Risk related to medications and adverse drug events following discharge have been a consistent theme in readmission literature.24, 33 Our current system, which includes mandated inpatient medicine reconciliation, does not encourage discontinuation of unnecessary medications to combat polypharmacy, address affordability of medications, provide consistent medication counseling, or focus on the highest risk medications. In fact, bundled interventions which implement pharmacists to focus on these measures have been successful in decreasing readmission,14, 16, 29 but unfortunately are not yet part of the standard of care. The challenge remains transforming a mandatory policy such as medicine reconciliation into a valuable and systematic tool in the discharge process.
Two factors were surprisingly protective against readmission: neurologic diagnosis and anticholinergic medications. This first may be explained by the presence of a separate neurology service at our institution which skews our data. For example, a patient with acute stroke, who has a 20% rate of bounce‐back to a higher level of care within 30 days of discharge,34 would be admitted to the neurology service, not general medicine, and therefore would not nr part of our cohort. Regarding anticholinergics, several factors may explain this unexpected result. First, use of anticholinergics was relatively rare in our sample (2.7% in readmitted patients, 4.1% in patients not readmitted), possibly creating a false positive result. Second, Hanlon et al.24 showed only a weak association at best between anticholinergics and postdischarge adverse drug reactions (hazard ratio, 1.11; 95% CI, 0.86‐1.43). Lastly, anticholinergics include a varied group of medications, therefore diluting possible relative risk of specific medications.
While this study allows providers to identify patients at increased risk of readmission, the identified factors do not fully account for readmission risk; we did not aim to produce a risk‐prediction rule with our study. Prior readmission studies have been unable to create a tool to predict which patients will be readmitted with much success.3537 These results underscore the complexities and variability of readmission, which often lack a clear single cause and effect relationship. Given the breadth of risk factors we identified, it seems likely that more intensive interventions will require a multidisciplinary approach, one which might be costly if applied broadly. Our study does not attempt to predict who will be readmitted and who will not, but rather provides a list of risk factors which might be used to deploy resources more efficiently.
This study had several limitations. We did not capture readmissions to outside hospitals, which account for 22% to 24% of all readmissions in prior studies, and therefore have underestimated the readmission rate in our population.2, 8 However, by limiting our data to 2 hospitals within 1 institution, we were able to include more detailed patient level data, which is not accurately available in other large databases. Also, while studies of risk factors in a managed care population (such as within Medicare, the Veterans Affairs medical centers, or countries with national integrated medical records) are able to capture all readmissions, this study is the first to evaluate readmissions risk factors in a truly heterogeneous U.S. inpatient medicine population without limitation by age or payer status. Second, we did not have access to outpatient medications lists; however use of these same medications within the last 48 hours of admission is likely a reasonable proxy for outpatient use and more conducive to potential interventions (such as medication reconciliation or patient education) that could flag patients prior to discharge. Payer data was limited to only the primary payer, so patients who were dual eligible (ie, have both Medicare and Medicaid) were categorized as Medicare. Regarding sociodemographic factors, while primary language other than English was not associated with readmission, language data was missing in 17.4% of admissions, thereby limiting our ability to evaluate this factor. Our data did not include access to outpatient or primary care, and therefore we were unable to evaluate access to postdischarge follow‐up care as a risk factor for readmission. Lastly, while this study did not include outpatient deaths, we did exclude patients who died in the hospital.
Conclusions
Readmission is common among general medicine patients, with approximately 1 in 5 patients being readmitted within 30 days. While the identified associated factors do not account for all the potential reasons for readmission, our study suggests a spectrum of risk factors which might be used to target more intensive multidisciplinary interventions. Specifically, the nonclinical factors of race and payer status merit further in depth research incorporating the patient experience to truly determine causation of readmission. Hospitalists, who are at nexus of the discharge process and uniquely invested in quality inpatient care, are ideally positioned to lead efforts to reduce readmissions. How to use our study's results to develop and implement effective interventions to reduce readmissions remains a subject for future studies.
- A path to bundled payment around a rehospitalization.: Medicare payment Advisory Commission; June2005.
- ,,.Rehospitalizations among patients in the Medicare fee‐for‐service program.N Engl J Med.2009;360(14):1418–1428.
- University HealthSystem Consortium. Available at: https://www.uhc.edu. Accessed May2010.
- U.S. Department of Health 15(5):599–606.
- ,,,.Development and validation of a model for predicting emergency admissions over the next year (PEONY): a UK historical cohort study.Arch Intern Med.2008;168(13):1416–1422.
- ,,, et al.Incidence and main factors associated with early unplanned hospital readmission among French medical inpatients aged 75 and over admitted through emergency units.Age Ageing.2008;37(4):416–422.
- ,,,,,.Factors associated with unplanned hospital readmission among patients 65 years of age and older in a Medicare managed care plan.Am J Med.1999;107(1):13–17.
- ,,.Risk factors for early unplanned hospital readmission in the elderly.J Gen Intern Med.1991;6(3):223–228.
- ,,, et al.Predicting non‐elective hospital readmissions: a multi‐site study. Department of Veterans Affairs Cooperative Study Group on Primary Care and Readmissions.J Clin Epidemiol.2000;53(11):1113–1118.
- ,.Effect of gender, ethnicity, pulmonary disease, and symptom stability on rehospitalization in patients with heart failure.Am J Cardiol.2007;100(7):1139–1144.
- ,,,.The care transitions intervention: results of a randomized controlled trial.Arch Intern Med.2006;166(17):1822–1828.
- ,,,.The impact of follow‐up telephone calls to patients after hospitalization.Am J Med.2001;111(9B):26S–30S.
- ,,, et al.A reengineered hospital discharge program to decrease rehospitalization: a randomized trial.Ann Intern Med.2009;150(3):178–187.
- ,,, et al.Reduction of 30‐day postdischarge hospital readmission or emergency department (ED) visit rates in high‐risk elderly medical patients through delivery of a targeted care bundle.J Hosp Med.2009;4(4):211–218.
- ,,,,,.Comprehensive discharge planning with postdischarge support for older patients with congestive heart failure: a meta‐analysis.JAMA.2004;291(11):1358–1367.
- ,.Home‐based intervention in congestive heart failure: long‐term implications on readmission and survival.Circulation.2002;105(24):2861–2866.
- ,,,,,.Effect of a standardized nurse case‐management telephone intervention on resource use in patients with chronic heart failure.Arch Intern Med.2002;162(6):705–712.
- ,,,.The impact of follow‐up physician visits on emergency readmissions for patients with asthma and chronic obstructive pulmonary disease: a population‐based study.Am J Med.2002;112(2):120–125.
- ,.Factors predicting readmission of older general medicine patients.J Gen Intern Med.1991;6(5):389–393.
- BOOSTing Care Transitions. Available at: http://www.hospitalmedicine.org/ResourceRoomRedesign/RR_CareTransitions/CT_Home.cfm. Accessed May2010.
- ,,,,.Adverse drug events occurring following hospital discharge.J Gen Intern Med.2005;20(4):317–323.
- ,,, et al.Incidence and predictors of all and preventable adverse drug reactions in frail elderly persons after hospital stay.J Gerontol A Biol Sci Med Sci.2006;61(5):511–515.
- . Development of the 3M™ All Patient Refined Diagnosis Related Groups (APR DRGs). Available at: http://www.ahrq.gov/qual/mortality/Hughes.htm. Accessed May2010.
- ,,.Volume thresholds and hospital characteristics in the United States.Health Aff (Millwood).2003;22(2):167–177.
- ,,,.The status of hospital medicine groups in the United States.J Hosp Med.2006;1(2):75–80.
- ,,,.Growth in the care of older patients by hospitalists in the United States.N Engl J Med.2009;360(11):1102–1112.
- ,,, et al.Role of pharmacist counseling in preventing adverse drug events after hospitalization.Arch Intern Med.2006;166(5):565–571.
- ,,, et al.Effects of a multicomponent intervention on functional outcomes and process of care in hospitalized older patients: a randomized controlled trial of Acute Care for Elders (ACE) in a community hospital.J Am Geriatr Soc.2000;48(12):1572–1581.
- ,,,,,.Telehome monitoring in patients with cardiac disease who are at high risk of readmission.Heart Lung.2008;37(1):36–45.
- ,,.Understanding rehospitalization risk: can hospital discharge be modified to reduce recurrent hospitalization?J Hosp Med.2007;2(5):297–304.
- ,,,,.The incidence and severity of adverse events affecting patients after discharge from the hospital.Ann Intern Med.2003;138(3):161–167.
- ,,,.Bouncing back: patterns and predictors of complicated transitions 30 days after hospitalization for acute ischemic stroke.J Am Geriatr Soc.2007;55(3):365–373.
- ,,,.Case finding for patients at risk of readmission to hospital: development of algorithm to identify high risk patients.BMJ.2006;333(7563):327.
- ,,,,,.Screening elders for risk of hospital admission.J Am Geriatr Soc.1993;41(8):811–817.
- ,,,.Using routine inpatient data to identify patients at risk of hospital readmission.BMC Health Serv Res.2009;9:96.
Copyright © 2010 Society of Hospital Medicine
ICU Characteristics in Michigan
Organization of physician services in intensive care units (ICUs) varies widely and influences mortality, morbidity, and costs of care. Intensive care provided by intensivists in a high‐intensity physician staffing model, in which intensivists are the sole attending physicians or consult on all patients, has been associated with desirable outcomes such as decreased length of stay, resource utilization, and mortality.1‐4 As a result, higher intensity ICU models have been recommended by various healthcare agencies, including the National Quality Forum and the Leapfrog Group.5‐7
One national survey indicated that 47% of ICUs surveyed had some intensivist coverage and only 4% of intensive care units met Leapfrog high‐intensity model standards.8 However, only one‐third of ICUs responded to this survey, smaller ICUs were overrepresented, and the survey may not have reflected the influence of newer policy initiatives because it was conducted in 1997. Though the attributes by which intensivists improve patient outcomes is unknown, researchers have suggested it is by having a knowledgeable physician present in the ICU, having a physician communicate with other clinicians and families, and by having a physician who manages the ICU by writing policies and procedures and administrative activities.9
Results have been conflicting as patients managed by intensivists have also been found to have an increased mortality, particularly when managed on an elective consultation basis in an open ICU, where patient orders are written by several physician specialties.10, 11 Alternative ICU staffing models, such as the use of hospitalists, have been utilized to compensate for the intensivist workforce shortage. Hospitalists often provide ICU care, although they are seldom board‐certified in critical care. Hospitalist care has been shown to provide clinical and efficiency benefits such as decreased length of hospital stay.12‐14
Understanding the manner in which critical care is currently delivered, particularly the utilization of intensivist and nonintensivist care providers, can provide insights into subsequent allocation of a limited intensivist workforce as nonintensivist care providers such as hospitalists become more available. To understand how intensivists and other practitioners, such as hospitalists, deliver critical care in Michigan, we performed a cross‐sectional survey of Michigan hospitals participating in the Keystone ICU project, a statewide quality‐improvement initiative.
Methods
The hospitals involved and the methods of Keystone ICU have been published previously.15 The Keystone ICU project is a collaborative quality improvement initiative first organized in October 2003 by the Michigan Health and Hospitals Association (MHA) Keystone Center for Patient Safety and Quality. At its inception, 103 ICUs voluntarily agreed to participate in Keystone ICU and reported data representing 85% of ICU beds in Michigan. Nonparticipating hospitals (n = 37) were smaller, 79% having fewer than 100 beds, many of which did not have ICUs. All ICUs from the 72 hospitals participating in the Keystone ICU project as of July 2005 were asked to complete surveys as part of ongoing data collection.
Keystone ICU sought to improve safety culture, increase adherence to evidence‐based practices among patients receiving mechanical ventilation, and reduce central lineassociated bloodstream infections and ventilator‐associated pneumonia through a number of interventions. Keystone also encouraged teams to standardize their physician staffing, and presented teams with evidence regarding the benefits of ICU physician staffing. Because many of the ICUs were small and believed it was not practical to staff their ICUs with intensivists, Keystone encouraged ICUs to create as many of the attributes of intensivist staffing as possible: having someone present who is knowledgeable, able to manage at the unit level, and who communicates well with clinicians and families.9 As part of this project, we developed a survey to describe the physician staffing in Michigan ICUs. Additional elements of the survey sought to ascertain how medical decision‐making occurred, which decisions were made by what types of clinicians, and who performed various procedures in the ICU.
Survey Development
The survey for this study was developed based on expert opinion and on previous work by the research team (A.D.A., P.J.P., S.A.F.). The survey was pilot tested in a small group of non‐Michigan hospitals and found to be understandable and readable. The survey was then revised and disseminated to all hospitals participating in the Keystone ICU project. Construct validity was determined by review of literature and discussion with the research team (A.D.A., P.J.P., S.A.F., R.C.H.). Content validity was determined by the pilot test, which included interviews with the individuals who pilot‐tested the survey. The survey sought to describe the organization of ICU physician services (including both intensivist and nonintensivist). A copy of the survey is available upon request.
Survey Protocol
Surveys were sent by e‐mail to the official nurse and/or physician project leader at each site in July 2005 from contact information provided by MHA. Another copy of the survey was emailed to ICUs that did not respond to the initial survey after 3 months and, if needed, a third survey was sent at 6 months with a follow‐up telephone call by 1 of the investigators (R.C.H.). The completed surveys were returned to MHA for compilation and analysis. The research project was reviewed by the University of Michigan Institutional Review Board and determined to be exempt from ongoing IRB review per federal exemption category 45 CFR 46.101.(b). The funder was not involved in the design of the study, collection, analysis, and interpretation of the data, or the decision to approve publication of the finished manuscript.
Statistical Analysis
Survey respondents were first characterized using simple univariable and bivariable methods. When appropriate, groups were compared based on chi‐square, Mann‐Whitney U test, or t test. Additionally, a series of multivariable analyses was performed, which sought to understand structural factors associated with the presence of higher‐intensity models, as well as use of hospitalists or intensivists. Results of the multivariate analysis are reported as odds ratios (ORs) and 95% confidence intervals (CIs). The critical region was defined as an alpha of 0.05. Statistical analysis was performed using SAS (version 9.1; SAS Institute, Inc., Cary, NC).
Results
Response Rate
Ninety‐seven responses were received, including at least 1 response from every Keystone ICU hospital located in Michigan. Because our goal was to describe the organization of ICU physician services in non‐Federal hospitals, 1 Michigan VA hospital was eliminated from further consideration. Four hospitals with more than 1 ICU, which delivered care identically in all of their ICUs, provided 1 response and were counted as 1 site. As a result, 96 survey responses representing 115 ICUs in 72 Michigan hospitals were each counted as 1 site in the analysis. This included responses from ICUs not included in earlier analyses, which joined Keystone ICU after earlier work had been underway.15
Baseline Demographics
The mean (standard deviation [SD]) hospital size represented in the survey was 280 (22) beds, with a median of 249 (range, 40‐1031) beds. The mean size (SD) of the ICU was 13.3 (7.0) beds, median 12 beds, range 4 to 42 beds. There were 16 ICUs dedicated exclusively to the care of medicine patients, 14 dedicated surgical units, 8 dedicated cardiac ICUs, and 3 dedicated Neuro ICUs. The remainder had a mixed patient population. Seventy‐one ICUs (74%) cared for medical patients, 69 (72%) cared for surgical patients, 64 (67%) cared for cardiac patients, and 52 (53%) cared for neurological patients.
ICU Staffing Models
To better understand the role of intensivists in critical care delivery in Michigan, we examined differences in sites where patients are managed as closed sites exclusively by intensivists (closed ICU sites) in comparison to ICUs that had multiple attending specialties (open ICU sites). In addition, ICU sites where intensivists made most clinical decisionsa circumstance likely reflecting a high‐intensity staffing model of care5were compared with ICUs sites where decision‐making was made by nonintensivists or was shared (Table 1). Twenty‐four of 96 (25%) ICU sites were closed, and only intensivists served as the attending of record. Hospitals with closed ICUs or in which intensivists made most clinical decisions were larger and had larger ICUs than sites with open ICUs or with nonintensivist decision‐making (P < 0.05). These 24 closed sites represented 17 of 72 hospitals (24%), with the remainder of hospitals (76%) not having closed ICUs. Intensivists participated in rounds in 43 of 72 sites (60%) that were not closed. House officer participation in the care of ICU patients was not related to the presence or absence of intensivists (2 = 0.04; P = 0.847), although the average size of hospitals with house officers was larger than those without house officers (P < 0.0001).
| Closed ICUs (n = 24) [n (%)] | Open ICUs (n = 72) [n (%)] | Intensivist Decision‐making (n = 30) [n (%)] | Shared Decision‐making (n = 31) [n (%)] | Nonintensivist Decision‐making (n = 34) [n (%)] | |
|---|---|---|---|---|---|
| |||||
| ICU beds (mean SD) | 21.8 15.3* | 15.2 13.0* | 21.3 18.7* | 19.2 13.4 | 10.5 5.2* |
| Hospital beds (mean SD) | 489.8 295.3* | 326.3 222.6* | 460.8 222.3* | 408.6 259.7 | 247.8 230.0* |
| Nonintensivist attendings | |||||
| Hospitalist | 34 (47.2) | 9 (30) | 14 (45.1) | 13 (38.2) | |
| Primary care physician | 55 (76.4) | 11 (36.7) | 23 (74.2) | 27 (79.4) | |
| Cardiologist | 54 (75) | 10 (33.3) | 25 (80.6) | 23 (67.6) | |
| Pulmonologist | 34 (47.2) | 9 (30) | 15 (48.3) | 15 (44.1) | |
| Other IM specialist | 48 (66.7) | 11 (36.7) | 25 (80.6) | 17 (50) | |
| Surgeon | 59 (81.9) | 14 (46.7) | 25 (80.6) | 27 (79.4) | |
| Critical care board certification (% of attending physicians) | (n = 28) | (n = 31) | (n = 33) | ||
| 100 | 11 (45.8) | 7 (10.1) | 11 (39.3) | 6 (19.4) | 0 (0) |
| 75 | 3 (12.5) | 6 (8.7) | 7 (25.0) | 2 (6.5) | 0 (0) |
| 50 | 2 (8.3) | 4 (5.8) | 3 (10.7) | 2 (6.5) | 1 (3.0) |
| <50 | 8 (33.3) | 52 (75.4) | 7 (25.0) | 21 (67.7) | 32 (97.0) |
| ICU administration | |||||
| ICU director financial support | 18 (75.0) | 49 (68.1) | 25 (83.3) | 23 (74.2) | 18 (52.9) |
| Meeting with ICU team | 21 (87.5) | 56 (77.8) | 26 (86.7) | 27 (87.1) | 23 (67.7) |
| M&M sessions | 9 (37.5) | 33 (45.8) | 16 (53.3) | 12 (38.7) | 14 (41.2) |
Multivariate analysis determined that the presence of hospitalists serving as attending physicians was strongly associated with an open ICU (OR = 12.2; 95%CI = 2.5‐60.2), as was the absence of intensivists at the site (OR = 12.2; 95%CI = 1.4‐105.8), while ICU and hospital size were not associated. When the analyses were limited to hospitals with intensivists (n = 69), decision‐making by intensivists was not associated with ICU or hospital size (OR = 1.0; 95%CI = 1.0‐1.0); or whether hospitalists acted as attendings (OR = 0.7; 95%CI = 0.2‐2.0).
Board Certification and ICU Administration
Only 18 sites (20%) acknowledged that 100% of their ICU attending physicians were board‐certified in critical care, with nearly two‐thirds of sites having fewer than 50% critical‐care board‐certified attending physicians (Table 1). The medical director of the ICU met for an administrative meeting with the ICU team of nurses, respiratory therapists, and other personnel on a regular (ie, at least quarterly) basis at 77 sites (80%) and held regular morbidity and mortality sessions to discuss ICU care with other physicians who work in the ICU at 43 sites (45%). The majority of sites (n = 67; 70%) provided salary support for the ICU medical director.
Critical‐care board‐certification was more common at sites with closed ICUs and at sites where decision‐making was performed by intensivists (P < 0.001). However, board‐certification was not uniform in closed ICUs (100% certification = 46%, >50% certification = 67%) or in ICUs where intensivists made most decisions (100% certification = 39%, >50% certification = 75%).
Hospitals in which hospitalists served as attending physicians were less likely to have 50% or greater critical‐care board‐certification in their ICU (OR = 0.13; 95%CI = 0.03‐0.50). ICU size, hospital size, and years in practice were not associated with critical‐care board‐certification. Hospital size, ICU size, and the presence of intensivists or hospitalists were not associated with whether the medical director receives support from the hospital.
Physician Extenders
Nineteen sites (20%) reported the utilization of advanced practice nurses; 15 sites (16%) reported use of physician assistants; and 7 sites (7%) reported use of both advance practice nurses and physician assistants to provide intensive care. Physician extenders were not more likely to work in closed ICUs (10/24) than in open ICUs (14/72) (2 = 3.63; P = 0.57).
Of the 27 sites reporting use of advanced practice nurses or physician assistants, the role of physician extenders was described as being similar to physicians in 8 sites (30%), somewhat autonomous but with limitations in 18 (67%), and in a role closer to a ward clerk or assistant in 1 site (4%). The activities of physician extenders included writing orders at 24 of these 27 sites (89%); writing progress notes at 25 sites (92%); communicating with consultants at 24 (89%) and with primary care physicians at 22 sites (82%); and coordinating discharge plans at 20 sites (74%). Physician extenders rounded alone at 16 sites (33%).
Clinical Activities
Intensivists participated in daily rounds at most sites (n = 67; 70%). Nonintensivists served as attending of record in 72 (75%) sites. Nonintensivist physicians participating in daily patient rounds were: surgeons (n = 66; 68% of sites), primary care physicians (n = 61; 64%), nonpulmonary internal medicine specialists (n = 53; 55%), cardiologists (n = 58; 60%), non‐critical‐care pulmonologists (n = 39; 41%), and hospitalists (n = 36; 38%). Intensivists were the primary decision‐makers at 30 sites (31%), nonintensivists at 34 (35%), and decision making was shared at 31 (32%).
At more than one‐half of sites, decisions regarding mechanical ventilation, the use of sedatives or paralytics, and the choice of vasopressor agents were made by intensivists, with other decisionssuch as the decision to call consultants, choice of antibiotics, or family meetingsshared between intensivists and nonintensivists more than 40% of the time (Table 2). During regular working hours, invasive procedures were performed by multiple clinicians, including house officers, intensivists, surgeons, and anesthesiologists and were not the province of any particular type of clinician (Table 3).
| Decision‐making | |||
|---|---|---|---|
| Intensivist n (%) | Nonintensivist n (%) | Shared n (%) | |
| |||
| Ventilator management | 62 (66.7) | 24 (25.8) | 7 (7.5) |
| Choice of ventilator weaning strategies | 64 (68.8) | 24 (25.8) | 5 (5.4) |
| Decision to extubate | 63 (68.5) | 24 (26.1) | 5 (5.4) |
| Choice of sedation or paralytic agents | 56 (65.1) | 24 (27.9) | 6 (7.0) |
| Choice of vasopressor agents | 47 (51.1) | 25 (27.1) | 20 (21.7) |
| Decision to call other consultants (eg, cardiology, infectious diseases) | 19 (20.4) | 31 (33.3) | 43 (46.2) |
| Choices related to more general medical management (eg, antibiotics, diabetes management) | 30 (32.2) | 25 (26.9) | 38 (40.1) |
| Family meetings, code status discussions | 26 (28.6) | 26 (28.6) | 39 (42.8) |
| Procedure | Hospitalist n (%) | Intensivist n (%) | Surgeon n (%) | Anesthesiologist n (%) | House Officer or Other MD n (%) | Other non‐MD n (%) |
|---|---|---|---|---|---|---|
| Arterial line placement | 15 (15.6) | 50 (52.1) | 40 (41.7) | 31 (32.3) | 59 (61.4) | 7 (7.3) |
| Femoral venous line placement | 14 (14.6) | 54 (56.3) | 42 (43.8) | 17 (17.7) | 55 (57.3) | 4 (4.2) |
| Subclavian or internal jugular line placement | 14 (14.6) | 54 (56.2) | 47 (49.0) | 25 (26.0) | 62 (64.6) | 5 (5.2) |
| Pulmonary artery catheterization | 8 (8.3) | 56 (58.3) | 24 (25.0) | 21 (21.9) | 54 (56.2) | 2 (2.1) |
| Intubation | 14 (14.6) | 47 (49.0) | 14 (14.6) | 74 (77.1) | 42 (43.8) | 15 (15.6) |
| Bronchoscopy | 2 (2.1) | 67 (69.8) | 17 (17.7) | 5 (5.2) | 29 (30.2) | 0 (0) |
Regardless of the staffing model employed, the majority of sites (88%) provided care on a call‐based, rather than shift‐based system. Nighttime admissions and cross‐coverage issues were handled by house officers at more than one‐third of sites, with nonintensivist house physicians performing these tasks at 15% of sites (Table 4). Intensivists managed cross‐coverage issues by telephone at 29% of sites, and saw new admissions in person after hours at 8% of sites. Intensivists did not deliver care in scheduled shifts at any of these sites.
| Care Provider | Nighttime Admissions n (%) | Cross‐coverage n (%) |
|---|---|---|
| ||
| Emergency room physician | 13 (13.5) | 8 (8.3) |
| House physician | 15 (15.6) | 17 (17.7) |
| House officer | 42 (43.8) | 37 (38.5) |
| ICU nurse | 5 (5.2) | 10 (10.4) |
| PA or NP | 8 (8.3) | 5 (5.2) |
| Intensivist in person | 8 (8.3) | |
| Intensivist by telephone | 28 (29.2) | |
| Other | 9 (9.4) | 9 (9.4) |
Discussion
As all Keystone ICU participating sites responded to the questionnaire, we believe these results to be representative of critical care practice in the state of Michigan at the present time. Michigan ICU staffing structures are variable. Only a minority (25%) of Michigan Keystone ICU sites operated in an environment where intensivists are the only attending physicians of record. Although intensivists rounded in 60% of sites not utilizing a closed model, 75% of sites had nonintensivist attending physicians, with primary care physicians and hospitalists commonly providing ICU services. The utilization of hospitalists to provide critical care services was found in the absence of intensivists, regardless of hospital or ICU size.
Closed ICUs were seen in larger hospitals and in larger ICUs. This finding is similar to data obtained on a national level.8‐16 A high‐intensity model of care was also uncommon, although decision‐making was at least shared between intensivists and nonintensivists at two‐thirds of sites. These findings are in keeping with the observation that intensivist‐directed care advocated by the Leapfrog Group has not been widely implemented,17 including in Michigan, a regional rollout leader for the Leapfrog Group.
Fewer ICUs reported utilizing a nonintensivist model than was reported in the survey by Angus et al.,8 where approximately one‐half of ICUs delivered care in this manner. This survey was performed in 1997, prior to the launch of the Leapfrog Group effort, and may have reflected a relative over representation of smaller, general ICUs. Our study is the first statewide analysis of critical care practices in the postLeapfrog Group era. Our finding that an array of approaches to critical care delivery existed in Michigan, even when intensivists rounded on patients, is similar to that found among Leapfrog‐compliant hospitals sampled from several regions of the United States.18
Other than intensivists, surgeons, primary care, and hospitalist physicians provided care in Michigan ICUs. The hospitalist movement is relatively new.19 However, in our survey 37.5% of sites had hospitalists serving as attending physicians. Although the closed ICU model was more prevalent in larger ICUs and hospitals, the use of a hospitalist model to staff ICUs was not related to hospital size, but was instead a function of whether or not intensivists were present in a given setting. In lieu of a projected shortage of intensivists, we believe this confirms the crucial role that hospitalists will play in the provision of critical care services in the future.
The attributes of intensivist care that led to improved outcomes in previous studies1‐4 are unknown. To the extent that the involvement of intensivists on an elective rather than mandatory consultative basis may explain the higher mortality found in 1 recent study,1011 we hypothesize that having a knowledgeable physician present who communicates with clinicians and families and manages at the unit level is an important factor leading to improved outcomes. While hospitalists can have these attributes, their knowledge of specific critical care therapies and technologies may vary with the extent of their ICU training and experience. Further research should seek to quantify the attributes by which intensivists are associated with improved outcomes and seek ways to foster those attributes among hospitalists who participate in critical care delivery. Central to this will be ensuring that training programs ensure competency in critical care therapies and technologies among hospitalists and other non‐ICU physicians.
We recognize several limitations in this study. First, the validity of the survey may introduce misclassification of ICU staffing. However, the survey instrument was informed by previously‐validated instruments and experts in ICU physician staffing and hospitalist care. Second, we did not link variation in staffing to outcomes. While such analysis is important, it is beyond the scope of this survey. Third, our study was conducted in 1 state and the results may not be generalizable across the United States. Nevertheless, Michigan is a large state with a diverse array of hospitals, and as our study sample broadly represented this diversity, we believe our results are likely to be generalizable.
In conclusion, few ICUs in Michigan are closed and many utilize nonintensivist critical‐care providers such as hospitalists, primary care providers, and physician extenders to deliver clinical care. Our findings have significant implications for future efforts at a national level that involve the training of hospitalists and their acceptance as critical care practitioners. We suggest future research involving intensive care delivery focus on the feasibility of training sufficient hospitalists to satisfy a growing need for critical care that cannot be filled by intensivists, along with strategic planning to insure the model of care provided is commensurate with the complexity of illness. Although this approach appears to be occurring in Michigan on an ad hoc basis, we believe coordination between larger, intensivist‐run ICUs and smaller, nonintensivist‐run ICUs should be formalized in order to optimize the delivery of intensive care.25
- ,,, et al.;the members of the American College of Critical Care Medicine Task Force on Models for the Definition of an Intensivist and the Practice of Critical Care Medicine. Critical care delivery in the intensive care unit: defining clinical roles and the best practice model.Crit Care Med.2001;29;2007–2019.
- ,,, et al.Effects of organizational change in the medical intensive care unit of a teaching hospital: a comparison of “open” and “closed” formats.JAMA.1996;276:24–31.
- ,,, et al.A “closed” medical intensive care unit (MICU) improves resource utilization when compared with an “open” MICU.Am J Respir Crit Care Med.1998;157:1468–1473.
- ,,, et al.Effects of an organized critical care service on outcomes and resource utilization: a cohort study.Crit Care Med.1999;27:270–274.
- ,,,,,.Physician staffing patterns and clinical outcomes in critically ill patients.JAMA.2002;288:2151–2162.
- Leapfrog Group. Leapfrog Group Factsheet: ICU physician staffing (IPS). Available at: http://www.leapfroggroup.org/media/file/Leapfrog‐ICU_ Physician_Staffing_Fact_Sheet.pdf. Accessed June 2009.
- National Quality Forum. Safe Practices for Better Healthcare. Available at: http://www.qualityforum.org/pdf/reports/safe_practices.pdf. Accessed June 2009.
- ,,,,,; on behalf of the Committee on Manpower for Pulmonary and Critical Care Societies (COMPACCS).Critical care delivery in the United States: distribution of services and compliance with Leapfrog recommendations.Crit Care Med.2006;34:1016–1024.
- ,,, et al.Team care: beyond open and closed intensive care units.Curr Opin Crit Care.2006;12:604–608.
- ,,,,,.Association between critical care physician management and patient mortality in the intensive care unit.Ann Intern Med.2008;148:801–809.
- ,.Are intensivists safe?Ann Intern Med.2008;148:877–878.
- ,,,,,.Implementation of a voluntary hospitalist service at a community teaching hospital: improved clinical efficiency and patient outcomes.Ann Intern Med.2002;137:859–865.
- ,,, et al.Effects of physician experience on costs and outcomes on an academic general medicine service: results of a trial of hospitalists.Ann Intern Med.2002;137:866–874.
- ,,,,,.Outcomes of care by hospitalists, general internists and family physicians.N Engl J Med.2007;357:2589–2600.
- ,,, et al.An intervention to decrease catheter‐related bloodstream infections in the ICU.N Engl J Med.2006;355:2725–2732.
- ,,, et al.Descriptive analysis of critical care units in the United States.Crit Care Med.1992;20:846–863.
- .Leapfrog and critical care: evidence‐ and reality‐based intensive care for the 21st century.Am J Med.2004;116:188–193.
- ,,,,.The organization of intensive care unit physician services.Crit Care Med.2007;35:2256–2261.
- ,.The evolution of the hospitalist movement in the USA.Clin Med.2002;2:327–330.
- ,,, et al.Guidelines on critical care services and personnel: recommendations based on a system of categorization of three levels of care.Crit Care Med.2003;31:2677–2683.
Organization of physician services in intensive care units (ICUs) varies widely and influences mortality, morbidity, and costs of care. Intensive care provided by intensivists in a high‐intensity physician staffing model, in which intensivists are the sole attending physicians or consult on all patients, has been associated with desirable outcomes such as decreased length of stay, resource utilization, and mortality.1‐4 As a result, higher intensity ICU models have been recommended by various healthcare agencies, including the National Quality Forum and the Leapfrog Group.5‐7
One national survey indicated that 47% of ICUs surveyed had some intensivist coverage and only 4% of intensive care units met Leapfrog high‐intensity model standards.8 However, only one‐third of ICUs responded to this survey, smaller ICUs were overrepresented, and the survey may not have reflected the influence of newer policy initiatives because it was conducted in 1997. Though the attributes by which intensivists improve patient outcomes is unknown, researchers have suggested it is by having a knowledgeable physician present in the ICU, having a physician communicate with other clinicians and families, and by having a physician who manages the ICU by writing policies and procedures and administrative activities.9
Results have been conflicting as patients managed by intensivists have also been found to have an increased mortality, particularly when managed on an elective consultation basis in an open ICU, where patient orders are written by several physician specialties.10, 11 Alternative ICU staffing models, such as the use of hospitalists, have been utilized to compensate for the intensivist workforce shortage. Hospitalists often provide ICU care, although they are seldom board‐certified in critical care. Hospitalist care has been shown to provide clinical and efficiency benefits such as decreased length of hospital stay.12‐14
Understanding the manner in which critical care is currently delivered, particularly the utilization of intensivist and nonintensivist care providers, can provide insights into subsequent allocation of a limited intensivist workforce as nonintensivist care providers such as hospitalists become more available. To understand how intensivists and other practitioners, such as hospitalists, deliver critical care in Michigan, we performed a cross‐sectional survey of Michigan hospitals participating in the Keystone ICU project, a statewide quality‐improvement initiative.
Methods
The hospitals involved and the methods of Keystone ICU have been published previously.15 The Keystone ICU project is a collaborative quality improvement initiative first organized in October 2003 by the Michigan Health and Hospitals Association (MHA) Keystone Center for Patient Safety and Quality. At its inception, 103 ICUs voluntarily agreed to participate in Keystone ICU and reported data representing 85% of ICU beds in Michigan. Nonparticipating hospitals (n = 37) were smaller, 79% having fewer than 100 beds, many of which did not have ICUs. All ICUs from the 72 hospitals participating in the Keystone ICU project as of July 2005 were asked to complete surveys as part of ongoing data collection.
Keystone ICU sought to improve safety culture, increase adherence to evidence‐based practices among patients receiving mechanical ventilation, and reduce central lineassociated bloodstream infections and ventilator‐associated pneumonia through a number of interventions. Keystone also encouraged teams to standardize their physician staffing, and presented teams with evidence regarding the benefits of ICU physician staffing. Because many of the ICUs were small and believed it was not practical to staff their ICUs with intensivists, Keystone encouraged ICUs to create as many of the attributes of intensivist staffing as possible: having someone present who is knowledgeable, able to manage at the unit level, and who communicates well with clinicians and families.9 As part of this project, we developed a survey to describe the physician staffing in Michigan ICUs. Additional elements of the survey sought to ascertain how medical decision‐making occurred, which decisions were made by what types of clinicians, and who performed various procedures in the ICU.
Survey Development
The survey for this study was developed based on expert opinion and on previous work by the research team (A.D.A., P.J.P., S.A.F.). The survey was pilot tested in a small group of non‐Michigan hospitals and found to be understandable and readable. The survey was then revised and disseminated to all hospitals participating in the Keystone ICU project. Construct validity was determined by review of literature and discussion with the research team (A.D.A., P.J.P., S.A.F., R.C.H.). Content validity was determined by the pilot test, which included interviews with the individuals who pilot‐tested the survey. The survey sought to describe the organization of ICU physician services (including both intensivist and nonintensivist). A copy of the survey is available upon request.
Survey Protocol
Surveys were sent by e‐mail to the official nurse and/or physician project leader at each site in July 2005 from contact information provided by MHA. Another copy of the survey was emailed to ICUs that did not respond to the initial survey after 3 months and, if needed, a third survey was sent at 6 months with a follow‐up telephone call by 1 of the investigators (R.C.H.). The completed surveys were returned to MHA for compilation and analysis. The research project was reviewed by the University of Michigan Institutional Review Board and determined to be exempt from ongoing IRB review per federal exemption category 45 CFR 46.101.(b). The funder was not involved in the design of the study, collection, analysis, and interpretation of the data, or the decision to approve publication of the finished manuscript.
Statistical Analysis
Survey respondents were first characterized using simple univariable and bivariable methods. When appropriate, groups were compared based on chi‐square, Mann‐Whitney U test, or t test. Additionally, a series of multivariable analyses was performed, which sought to understand structural factors associated with the presence of higher‐intensity models, as well as use of hospitalists or intensivists. Results of the multivariate analysis are reported as odds ratios (ORs) and 95% confidence intervals (CIs). The critical region was defined as an alpha of 0.05. Statistical analysis was performed using SAS (version 9.1; SAS Institute, Inc., Cary, NC).
Results
Response Rate
Ninety‐seven responses were received, including at least 1 response from every Keystone ICU hospital located in Michigan. Because our goal was to describe the organization of ICU physician services in non‐Federal hospitals, 1 Michigan VA hospital was eliminated from further consideration. Four hospitals with more than 1 ICU, which delivered care identically in all of their ICUs, provided 1 response and were counted as 1 site. As a result, 96 survey responses representing 115 ICUs in 72 Michigan hospitals were each counted as 1 site in the analysis. This included responses from ICUs not included in earlier analyses, which joined Keystone ICU after earlier work had been underway.15
Baseline Demographics
The mean (standard deviation [SD]) hospital size represented in the survey was 280 (22) beds, with a median of 249 (range, 40‐1031) beds. The mean size (SD) of the ICU was 13.3 (7.0) beds, median 12 beds, range 4 to 42 beds. There were 16 ICUs dedicated exclusively to the care of medicine patients, 14 dedicated surgical units, 8 dedicated cardiac ICUs, and 3 dedicated Neuro ICUs. The remainder had a mixed patient population. Seventy‐one ICUs (74%) cared for medical patients, 69 (72%) cared for surgical patients, 64 (67%) cared for cardiac patients, and 52 (53%) cared for neurological patients.
ICU Staffing Models
To better understand the role of intensivists in critical care delivery in Michigan, we examined differences in sites where patients are managed as closed sites exclusively by intensivists (closed ICU sites) in comparison to ICUs that had multiple attending specialties (open ICU sites). In addition, ICU sites where intensivists made most clinical decisionsa circumstance likely reflecting a high‐intensity staffing model of care5were compared with ICUs sites where decision‐making was made by nonintensivists or was shared (Table 1). Twenty‐four of 96 (25%) ICU sites were closed, and only intensivists served as the attending of record. Hospitals with closed ICUs or in which intensivists made most clinical decisions were larger and had larger ICUs than sites with open ICUs or with nonintensivist decision‐making (P < 0.05). These 24 closed sites represented 17 of 72 hospitals (24%), with the remainder of hospitals (76%) not having closed ICUs. Intensivists participated in rounds in 43 of 72 sites (60%) that were not closed. House officer participation in the care of ICU patients was not related to the presence or absence of intensivists (2 = 0.04; P = 0.847), although the average size of hospitals with house officers was larger than those without house officers (P < 0.0001).
| Closed ICUs (n = 24) [n (%)] | Open ICUs (n = 72) [n (%)] | Intensivist Decision‐making (n = 30) [n (%)] | Shared Decision‐making (n = 31) [n (%)] | Nonintensivist Decision‐making (n = 34) [n (%)] | |
|---|---|---|---|---|---|
| |||||
| ICU beds (mean SD) | 21.8 15.3* | 15.2 13.0* | 21.3 18.7* | 19.2 13.4 | 10.5 5.2* |
| Hospital beds (mean SD) | 489.8 295.3* | 326.3 222.6* | 460.8 222.3* | 408.6 259.7 | 247.8 230.0* |
| Nonintensivist attendings | |||||
| Hospitalist | 34 (47.2) | 9 (30) | 14 (45.1) | 13 (38.2) | |
| Primary care physician | 55 (76.4) | 11 (36.7) | 23 (74.2) | 27 (79.4) | |
| Cardiologist | 54 (75) | 10 (33.3) | 25 (80.6) | 23 (67.6) | |
| Pulmonologist | 34 (47.2) | 9 (30) | 15 (48.3) | 15 (44.1) | |
| Other IM specialist | 48 (66.7) | 11 (36.7) | 25 (80.6) | 17 (50) | |
| Surgeon | 59 (81.9) | 14 (46.7) | 25 (80.6) | 27 (79.4) | |
| Critical care board certification (% of attending physicians) | (n = 28) | (n = 31) | (n = 33) | ||
| 100 | 11 (45.8) | 7 (10.1) | 11 (39.3) | 6 (19.4) | 0 (0) |
| 75 | 3 (12.5) | 6 (8.7) | 7 (25.0) | 2 (6.5) | 0 (0) |
| 50 | 2 (8.3) | 4 (5.8) | 3 (10.7) | 2 (6.5) | 1 (3.0) |
| <50 | 8 (33.3) | 52 (75.4) | 7 (25.0) | 21 (67.7) | 32 (97.0) |
| ICU administration | |||||
| ICU director financial support | 18 (75.0) | 49 (68.1) | 25 (83.3) | 23 (74.2) | 18 (52.9) |
| Meeting with ICU team | 21 (87.5) | 56 (77.8) | 26 (86.7) | 27 (87.1) | 23 (67.7) |
| M&M sessions | 9 (37.5) | 33 (45.8) | 16 (53.3) | 12 (38.7) | 14 (41.2) |
Multivariate analysis determined that the presence of hospitalists serving as attending physicians was strongly associated with an open ICU (OR = 12.2; 95%CI = 2.5‐60.2), as was the absence of intensivists at the site (OR = 12.2; 95%CI = 1.4‐105.8), while ICU and hospital size were not associated. When the analyses were limited to hospitals with intensivists (n = 69), decision‐making by intensivists was not associated with ICU or hospital size (OR = 1.0; 95%CI = 1.0‐1.0); or whether hospitalists acted as attendings (OR = 0.7; 95%CI = 0.2‐2.0).
Board Certification and ICU Administration
Only 18 sites (20%) acknowledged that 100% of their ICU attending physicians were board‐certified in critical care, with nearly two‐thirds of sites having fewer than 50% critical‐care board‐certified attending physicians (Table 1). The medical director of the ICU met for an administrative meeting with the ICU team of nurses, respiratory therapists, and other personnel on a regular (ie, at least quarterly) basis at 77 sites (80%) and held regular morbidity and mortality sessions to discuss ICU care with other physicians who work in the ICU at 43 sites (45%). The majority of sites (n = 67; 70%) provided salary support for the ICU medical director.
Critical‐care board‐certification was more common at sites with closed ICUs and at sites where decision‐making was performed by intensivists (P < 0.001). However, board‐certification was not uniform in closed ICUs (100% certification = 46%, >50% certification = 67%) or in ICUs where intensivists made most decisions (100% certification = 39%, >50% certification = 75%).
Hospitals in which hospitalists served as attending physicians were less likely to have 50% or greater critical‐care board‐certification in their ICU (OR = 0.13; 95%CI = 0.03‐0.50). ICU size, hospital size, and years in practice were not associated with critical‐care board‐certification. Hospital size, ICU size, and the presence of intensivists or hospitalists were not associated with whether the medical director receives support from the hospital.
Physician Extenders
Nineteen sites (20%) reported the utilization of advanced practice nurses; 15 sites (16%) reported use of physician assistants; and 7 sites (7%) reported use of both advance practice nurses and physician assistants to provide intensive care. Physician extenders were not more likely to work in closed ICUs (10/24) than in open ICUs (14/72) (2 = 3.63; P = 0.57).
Of the 27 sites reporting use of advanced practice nurses or physician assistants, the role of physician extenders was described as being similar to physicians in 8 sites (30%), somewhat autonomous but with limitations in 18 (67%), and in a role closer to a ward clerk or assistant in 1 site (4%). The activities of physician extenders included writing orders at 24 of these 27 sites (89%); writing progress notes at 25 sites (92%); communicating with consultants at 24 (89%) and with primary care physicians at 22 sites (82%); and coordinating discharge plans at 20 sites (74%). Physician extenders rounded alone at 16 sites (33%).
Clinical Activities
Intensivists participated in daily rounds at most sites (n = 67; 70%). Nonintensivists served as attending of record in 72 (75%) sites. Nonintensivist physicians participating in daily patient rounds were: surgeons (n = 66; 68% of sites), primary care physicians (n = 61; 64%), nonpulmonary internal medicine specialists (n = 53; 55%), cardiologists (n = 58; 60%), non‐critical‐care pulmonologists (n = 39; 41%), and hospitalists (n = 36; 38%). Intensivists were the primary decision‐makers at 30 sites (31%), nonintensivists at 34 (35%), and decision making was shared at 31 (32%).
At more than one‐half of sites, decisions regarding mechanical ventilation, the use of sedatives or paralytics, and the choice of vasopressor agents were made by intensivists, with other decisionssuch as the decision to call consultants, choice of antibiotics, or family meetingsshared between intensivists and nonintensivists more than 40% of the time (Table 2). During regular working hours, invasive procedures were performed by multiple clinicians, including house officers, intensivists, surgeons, and anesthesiologists and were not the province of any particular type of clinician (Table 3).
| Decision‐making | |||
|---|---|---|---|
| Intensivist n (%) | Nonintensivist n (%) | Shared n (%) | |
| |||
| Ventilator management | 62 (66.7) | 24 (25.8) | 7 (7.5) |
| Choice of ventilator weaning strategies | 64 (68.8) | 24 (25.8) | 5 (5.4) |
| Decision to extubate | 63 (68.5) | 24 (26.1) | 5 (5.4) |
| Choice of sedation or paralytic agents | 56 (65.1) | 24 (27.9) | 6 (7.0) |
| Choice of vasopressor agents | 47 (51.1) | 25 (27.1) | 20 (21.7) |
| Decision to call other consultants (eg, cardiology, infectious diseases) | 19 (20.4) | 31 (33.3) | 43 (46.2) |
| Choices related to more general medical management (eg, antibiotics, diabetes management) | 30 (32.2) | 25 (26.9) | 38 (40.1) |
| Family meetings, code status discussions | 26 (28.6) | 26 (28.6) | 39 (42.8) |
| Procedure | Hospitalist n (%) | Intensivist n (%) | Surgeon n (%) | Anesthesiologist n (%) | House Officer or Other MD n (%) | Other non‐MD n (%) |
|---|---|---|---|---|---|---|
| Arterial line placement | 15 (15.6) | 50 (52.1) | 40 (41.7) | 31 (32.3) | 59 (61.4) | 7 (7.3) |
| Femoral venous line placement | 14 (14.6) | 54 (56.3) | 42 (43.8) | 17 (17.7) | 55 (57.3) | 4 (4.2) |
| Subclavian or internal jugular line placement | 14 (14.6) | 54 (56.2) | 47 (49.0) | 25 (26.0) | 62 (64.6) | 5 (5.2) |
| Pulmonary artery catheterization | 8 (8.3) | 56 (58.3) | 24 (25.0) | 21 (21.9) | 54 (56.2) | 2 (2.1) |
| Intubation | 14 (14.6) | 47 (49.0) | 14 (14.6) | 74 (77.1) | 42 (43.8) | 15 (15.6) |
| Bronchoscopy | 2 (2.1) | 67 (69.8) | 17 (17.7) | 5 (5.2) | 29 (30.2) | 0 (0) |
Regardless of the staffing model employed, the majority of sites (88%) provided care on a call‐based, rather than shift‐based system. Nighttime admissions and cross‐coverage issues were handled by house officers at more than one‐third of sites, with nonintensivist house physicians performing these tasks at 15% of sites (Table 4). Intensivists managed cross‐coverage issues by telephone at 29% of sites, and saw new admissions in person after hours at 8% of sites. Intensivists did not deliver care in scheduled shifts at any of these sites.
| Care Provider | Nighttime Admissions n (%) | Cross‐coverage n (%) |
|---|---|---|
| ||
| Emergency room physician | 13 (13.5) | 8 (8.3) |
| House physician | 15 (15.6) | 17 (17.7) |
| House officer | 42 (43.8) | 37 (38.5) |
| ICU nurse | 5 (5.2) | 10 (10.4) |
| PA or NP | 8 (8.3) | 5 (5.2) |
| Intensivist in person | 8 (8.3) | |
| Intensivist by telephone | 28 (29.2) | |
| Other | 9 (9.4) | 9 (9.4) |
Discussion
As all Keystone ICU participating sites responded to the questionnaire, we believe these results to be representative of critical care practice in the state of Michigan at the present time. Michigan ICU staffing structures are variable. Only a minority (25%) of Michigan Keystone ICU sites operated in an environment where intensivists are the only attending physicians of record. Although intensivists rounded in 60% of sites not utilizing a closed model, 75% of sites had nonintensivist attending physicians, with primary care physicians and hospitalists commonly providing ICU services. The utilization of hospitalists to provide critical care services was found in the absence of intensivists, regardless of hospital or ICU size.
Closed ICUs were seen in larger hospitals and in larger ICUs. This finding is similar to data obtained on a national level.8‐16 A high‐intensity model of care was also uncommon, although decision‐making was at least shared between intensivists and nonintensivists at two‐thirds of sites. These findings are in keeping with the observation that intensivist‐directed care advocated by the Leapfrog Group has not been widely implemented,17 including in Michigan, a regional rollout leader for the Leapfrog Group.
Fewer ICUs reported utilizing a nonintensivist model than was reported in the survey by Angus et al.,8 where approximately one‐half of ICUs delivered care in this manner. This survey was performed in 1997, prior to the launch of the Leapfrog Group effort, and may have reflected a relative over representation of smaller, general ICUs. Our study is the first statewide analysis of critical care practices in the postLeapfrog Group era. Our finding that an array of approaches to critical care delivery existed in Michigan, even when intensivists rounded on patients, is similar to that found among Leapfrog‐compliant hospitals sampled from several regions of the United States.18
Other than intensivists, surgeons, primary care, and hospitalist physicians provided care in Michigan ICUs. The hospitalist movement is relatively new.19 However, in our survey 37.5% of sites had hospitalists serving as attending physicians. Although the closed ICU model was more prevalent in larger ICUs and hospitals, the use of a hospitalist model to staff ICUs was not related to hospital size, but was instead a function of whether or not intensivists were present in a given setting. In lieu of a projected shortage of intensivists, we believe this confirms the crucial role that hospitalists will play in the provision of critical care services in the future.
The attributes of intensivist care that led to improved outcomes in previous studies1‐4 are unknown. To the extent that the involvement of intensivists on an elective rather than mandatory consultative basis may explain the higher mortality found in 1 recent study,1011 we hypothesize that having a knowledgeable physician present who communicates with clinicians and families and manages at the unit level is an important factor leading to improved outcomes. While hospitalists can have these attributes, their knowledge of specific critical care therapies and technologies may vary with the extent of their ICU training and experience. Further research should seek to quantify the attributes by which intensivists are associated with improved outcomes and seek ways to foster those attributes among hospitalists who participate in critical care delivery. Central to this will be ensuring that training programs ensure competency in critical care therapies and technologies among hospitalists and other non‐ICU physicians.
We recognize several limitations in this study. First, the validity of the survey may introduce misclassification of ICU staffing. However, the survey instrument was informed by previously‐validated instruments and experts in ICU physician staffing and hospitalist care. Second, we did not link variation in staffing to outcomes. While such analysis is important, it is beyond the scope of this survey. Third, our study was conducted in 1 state and the results may not be generalizable across the United States. Nevertheless, Michigan is a large state with a diverse array of hospitals, and as our study sample broadly represented this diversity, we believe our results are likely to be generalizable.
In conclusion, few ICUs in Michigan are closed and many utilize nonintensivist critical‐care providers such as hospitalists, primary care providers, and physician extenders to deliver clinical care. Our findings have significant implications for future efforts at a national level that involve the training of hospitalists and their acceptance as critical care practitioners. We suggest future research involving intensive care delivery focus on the feasibility of training sufficient hospitalists to satisfy a growing need for critical care that cannot be filled by intensivists, along with strategic planning to insure the model of care provided is commensurate with the complexity of illness. Although this approach appears to be occurring in Michigan on an ad hoc basis, we believe coordination between larger, intensivist‐run ICUs and smaller, nonintensivist‐run ICUs should be formalized in order to optimize the delivery of intensive care.25
- ,,, et al.;the members of the American College of Critical Care Medicine Task Force on Models for the Definition of an Intensivist and the Practice of Critical Care Medicine. Critical care delivery in the intensive care unit: defining clinical roles and the best practice model.Crit Care Med.2001;29;2007–2019.
- ,,, et al.Effects of organizational change in the medical intensive care unit of a teaching hospital: a comparison of “open” and “closed” formats.JAMA.1996;276:24–31.
- ,,, et al.A “closed” medical intensive care unit (MICU) improves resource utilization when compared with an “open” MICU.Am J Respir Crit Care Med.1998;157:1468–1473.
- ,,, et al.Effects of an organized critical care service on outcomes and resource utilization: a cohort study.Crit Care Med.1999;27:270–274.
- ,,,,,.Physician staffing patterns and clinical outcomes in critically ill patients.JAMA.2002;288:2151–2162.
- Leapfrog Group. Leapfrog Group Factsheet: ICU physician staffing (IPS). Available at: http://www.leapfroggroup.org/media/file/Leapfrog‐ICU_ Physician_Staffing_Fact_Sheet.pdf. Accessed June 2009.
- National Quality Forum. Safe Practices for Better Healthcare. Available at: http://www.qualityforum.org/pdf/reports/safe_practices.pdf. Accessed June 2009.
- ,,,,,; on behalf of the Committee on Manpower for Pulmonary and Critical Care Societies (COMPACCS).Critical care delivery in the United States: distribution of services and compliance with Leapfrog recommendations.Crit Care Med.2006;34:1016–1024.
- ,,, et al.Team care: beyond open and closed intensive care units.Curr Opin Crit Care.2006;12:604–608.
- ,,,,,.Association between critical care physician management and patient mortality in the intensive care unit.Ann Intern Med.2008;148:801–809.
- ,.Are intensivists safe?Ann Intern Med.2008;148:877–878.
- ,,,,,.Implementation of a voluntary hospitalist service at a community teaching hospital: improved clinical efficiency and patient outcomes.Ann Intern Med.2002;137:859–865.
- ,,, et al.Effects of physician experience on costs and outcomes on an academic general medicine service: results of a trial of hospitalists.Ann Intern Med.2002;137:866–874.
- ,,,,,.Outcomes of care by hospitalists, general internists and family physicians.N Engl J Med.2007;357:2589–2600.
- ,,, et al.An intervention to decrease catheter‐related bloodstream infections in the ICU.N Engl J Med.2006;355:2725–2732.
- ,,, et al.Descriptive analysis of critical care units in the United States.Crit Care Med.1992;20:846–863.
- .Leapfrog and critical care: evidence‐ and reality‐based intensive care for the 21st century.Am J Med.2004;116:188–193.
- ,,,,.The organization of intensive care unit physician services.Crit Care Med.2007;35:2256–2261.
- ,.The evolution of the hospitalist movement in the USA.Clin Med.2002;2:327–330.
- ,,, et al.Guidelines on critical care services and personnel: recommendations based on a system of categorization of three levels of care.Crit Care Med.2003;31:2677–2683.
Copyright © 2010 Society of Hospital Medicine