User login
Project BOOST
Enactment of federal legislation imposing hospital reimbursement penalties for excess rates of rehospitalizations among Medicare fee for service beneficiaries markedly increased interest in hospital quality improvement (QI) efforts to reduce the observed 30‐day rehospitalization of 19.6% in this elderly population.[1, 2] The Congressional Budget Office estimated that reimbursement penalties to hospitals for high readmission rates are expected to save the Medicare program approximately $7 billion between 2010 and 2019.[3] These penalties are complemented by resources from the Center for Medicare and Medicaid Innovation aiming to reduce hospital readmissions by 20% by the end of 2013 through the Partnership for Patients campaign.[4] Although potential financial penalties and provision of resources for QI intensified efforts to enhance the quality of the hospital discharge transition, patient safety risks associated with hospital discharge are well documented.[5, 6] Approximately 20% of patients discharged from the hospital may suffer adverse events,[7, 8] of which up to three‐quarters (72%) are medication related,[9] and over one‐third of required follow‐up testing after discharge is not completed.[10] Such findings indicate opportunities for improvement in the discharge process.[11]
Numerous publications describe studies aiming to improve the hospital discharge process and mitigate these hazards, though a systematic review of interventions to reduce 30‐day rehospitalization indicated that the existing evidence base for the effectiveness of transition interventions demonstrates irregular effectiveness and limitations to generalizability.[12] Most studies showing effectiveness are confined to single academic medical centers. Existing evidence supports multifaceted interventions implemented in both the pre‐ and postdischarge periods and focused on risk assessment and tailored, patient‐centered application of interventions to mitigate risk. For example Project RED (Re‐Engineered Discharge) applied a bundled intervention consisting of intensified patient education and discharge planning, improved medication reconciliation and discharge instructions, and longitudinal patient contact with follow‐up phone calls and a dedicated discharge advocate.[13] However, the mean age of patients participating in the study was 50 years, and it excluded patients admitted from or discharged to skilled nursing facilities, making generalizability to the geriatric population uncertain.
An integral aspect of QI projects is the contribution of local context to translation of best practices to disparate settings.[14, 15, 16] Most available reports of successful interventions to reduce rehospitalization have not fully described the specifics of either the intervention context or design. Moreover, the available evidence base for common interventions to reduce rehospitalization was developed in the academic setting. Validation of single academic center studies in a broader healthcare context is necessary.
Project BOOST (Better Outcomes for Older adults through Safe Transitions) recruited a diverse national cohort of both academic and nonacademic hospitals to participate in a QI effort to implement best practices for hospital discharge care transitions using a national collaborative approach facilitated by external expert mentorship. This study aimed to determine the effectiveness of BOOST in lowering hospital readmission rates and impact on length of stay.
METHODS
The study of Project BOOST was undertaken in accordance with the SQUIRE (Standards for Quality Improvement Reporting Excellence) Guidelines.[17]
Participants
The unit of observation for the prospective cohort study was the clinical acute‐care unit within hospitals. Sites were instructed to designate a pilot unit for the intervention that cared for medical or mixed medicalsurgical patient populations. Sites were also asked to provide outcome data for a clinically and organizationally similar non‐BOOST unit to provide a site‐matched control. Control units were matched by local site leadership based on comparable patient demographics, clinical mix, and extent of housestaff presence. An initial cohort of 6 hospitals in 2008 was followed by a second cohort of 24 hospitals initiated in 2009. All hospitals were invited to participate in the national effectiveness analysis, which required submission of readmission and length of stay data for both a BOOST intervention unit and a clinically matched control unit.
Description of the Intervention
The BOOST intervention consisted of 2 major sequential processes, planning and implementation, both facilitated by external site mentorsphysicians expert in QI and care transitionsfor a period of 12 months. Extensive background on the planning and implementation components is available at
| Enrollment Sites, n=30 | Sites Reporting Outcome Data, n=11 | Sites Not Reporting Outcome Data, n=19 | P Value for Comparison of Outcome Data Sites Compared to Othersa | |
|---|---|---|---|---|
| ||||
| Region, n (%) | 0.194 | |||
| Northeast | 8 (26.7) | 2 (18.2) | 6 (31.6) | |
| West | 7 (23.4) | 2 (18.2) | 5 (26.3) | |
| South | 7 (23.4) | 3 (27.3) | 4 (21.1) | |
| Midwest | 8 (26.7) | 4 (36.4) | 4 (21.1) | |
| Urban location, n (%) | 25 (83.3) | 11 (100) | 15 (78.9) | 0.035 |
| Teaching status, n (%) | 0.036 | |||
| Academic medical center | 10 (33.4) | 5 (45.5) | 5 (26.3) | |
| Community teaching | 8 (26.7) | 3 (27.3) | 5 (26.3) | |
| Community nonteaching | 12 (40) | 3 (27.3) | 9 (47.4) | |
| Beds number, mean (SD) | 426.6 (220.6) | 559.2 (187.8) | 349.79 (204.48) | 0.003 |
| Number of tools implemented, n (%) | 0.194 | |||
| 0 | 2 (6.7) | 0 | 2 (10.5) | |
| 1 | 2 (6.7) | 0 | 2 (10.5) | |
| 2 | 4 (13.3) | 2 (18.2) | 2 (10.5) | |
| 3 | 12 (40.0) | 3 (27.3) | 8 (42.1) | |
| 4 | 9 (30.0) | 5 (45.5) | 4 (21.1) | |
| 5 | 1 (3.3) | 1 (9.1) | 1 (5.3) | |
Mentor engagement with sites consisted of a 2‐day kickoff training on the BOOST tools, where site teams met their mentor and initiated development of structured action plans, followed by 5 to 6 scheduled phone calls in the subsequent 12 months. During these conference calls, mentors gauged progress and sought to help troubleshoot barriers to implementation. Some mentors also conducted a site visit with participant sites. Project BOOST provided sites with several collaborative activities including online webinars and an online listserv. Sites also received a quarterly newsletter.
Outcome Measures
The primary outcome was 30‐day rehospitalization defined as same hospital, all‐cause rehospitalization. Home discharges as well as discharges or transfers to other healthcare facilities were included in the discharge calculation. Elective or scheduled rehospitalizations as well as multiple rehospitalizations in the same 30‐day window were considered individual rehospitalization events. Rehospitalization was reported as a ratio of 30‐day rehospitalizations divided by live discharges in a calendar month. Length of stay was reported as the mean length of stay among live discharges in a calendar month. Outcomes were calculated at the participant site and then uploaded as overall monthly unit outcomes to a Web‐based research database.
To account for seasonal trends as well as marked variation in month‐to‐month rehospitalization rates identified in longitudinal data, we elected to compare 3‐month year‐over‐year averages to determine relative changes in readmission rates from the period prior to BOOST implementation to the period after BOOST implementation. We calculated averages for rehospitalization and length of stay in the 3‐month period preceding the sites' first reported month of front‐line implementation and in the corresponding 3‐month period in the subsequent calendar year. For example, if a site reported implementing its first tool in April 2010, the average readmission rate in the unit for January 2011 through March 2011 was subtracted from the average readmission rate for January 2010 through March 2010.
Sites were surveyed regarding tool implementation rates 6 months and 24 months after the 2009 kickoff training session. Surveys were electronically completed by site leaders in consultation with site team members. The survey identified new tool implementation as well as modification of existing care processes using the BOOST tools (admission risk assessment, discharge readiness checklist, teach back use, mandate regarding discharge summary completion, follow‐up phone calls to >80% of discharges). Use of a sixth tool, creation of individualized written discharge instructions, was not measured. We credited sites with tool implementation if they reported either de novo tool use or alteration of previous care processes influenced by BOOST tools.
Clinical outcome reporting was voluntary, and sites did not receive compensation and were not subject to penalty for the degree of implementation or outcome reporting. No patient‐level information was collected for the analysis, which was approved by the Northwestern University institutional review board.
Data Sources and Methods
Readmission and length of stay data, including the unit level readmission rate, as collected from administrative sources at each hospital, were collected using templated spreadsheet software between December 2008 and June 2010, after which data were loaded directly to a Web‐based data‐tracking platform. Sites were asked to load data as they became available. Sites were asked to report the number of study unit discharges as well as the number of those discharges readmitted within 30 days; however, reporting of the number of patient discharges was inconsistent across sites. Serial outreach consisting of monthly phone calls or email messaging to site leaders was conducted throughout 2011 to increase site participation in the project analysis.
Implementation date information was collected from 2 sources. The first was through online surveys distributed in November 2009 and April 2011. The second was through fields in the Web‐based data tracking platform to which sites uploaded data. In cases where disagreement was found between these 2 sources, the site leader was contacted for clarification.
Practice setting (community teaching, community nonteaching, academic medical center) was determined by site‐leader report within the Web‐based data tracking platform. Data for hospital characteristics (number of licensed beds and geographic region) were obtained from the American Hospital Association's Annual Survey of Hospitals.[18] Hospital region was characterized as West, South, Midwest, or Northeast.
Analysis
The null hypothesis was that no prepost difference existed in readmission rates within BOOST units, and no difference existed in the prepost change in readmission rates in BOOST units when compared to site‐matched control units. The Wilcoxon rank sum test was used to test whether observed changes described above were significantly different from 0, supporting rejection of the null hypotheses. We performed similar tests to determine the significance of observed changes in length of stay. We performed our analysis using SAS 9.3 (SAS Institute Inc., Cary, NC).
RESULTS
Eleven hospitals provided rehospitalization and length‐of‐stay outcome data for both a BOOST and control unit for the pre‐ and postimplementation periods. Compared to the 19 sites that did not participate in the analysis, these 11 sites were significantly larger (559188 beds vs 350205 beds, P=0.003), more likely to be located in an urban area (100.0% [n=11] vs 78.9% [n=15], P=0.035), and more likely to be academic medical centers (45.5% [n=5] vs 26.3% [n=5], P=0.036) (Table 1).
The mean number of tools implemented by sites participating in the analysis was 3.50.9. All sites implemented at least 2 tools. The duration between attendance at the BOOST kickoff event and first tool implementation ranged from 3 months (first tool implemented prior to attending the kickoff) and 9 months (mean duration, 3.34.3 months) (Table 2).
| Hospital | Region | Hospital Type | No. Licensed Beds | Kickoff Implementationa | Risk Assessment | Discharge Checklist | Teach Back | Discharge Summary Completion | Follow‐up Phone Call | Total |
|---|---|---|---|---|---|---|---|---|---|---|
| ||||||||||
| 1 | Midwest | Community teaching | <300 | 8 | 3 | |||||
| 2 | West | Community teaching | >600 | 0 | 4 | |||||
| 3 | Northeast | Academic medical center | >600 | 2 | 4 | |||||
| 4 | Northeast | Community nonteaching | <300 | 9 | 2 | |||||
| 5 | South | Community nonteaching | >600 | 6 | 3 | |||||
| 6 | South | Community nonteaching | >600 | 3 | 4 | |||||
| 7 | Midwest | Community teaching | 300600 | 1 | 5 | |||||
| 8 | West | Academic medical center | 300600 | 1 | 4 | |||||
| 9 | South | Academic medical center | >600 | 4 | 4 | |||||
| 10 | Midwest | Academic medical center | 300600 | 3 | 3 | |||||
| 11 | Midwest | Academic medical center | >600 | 9 | 2 | |||||
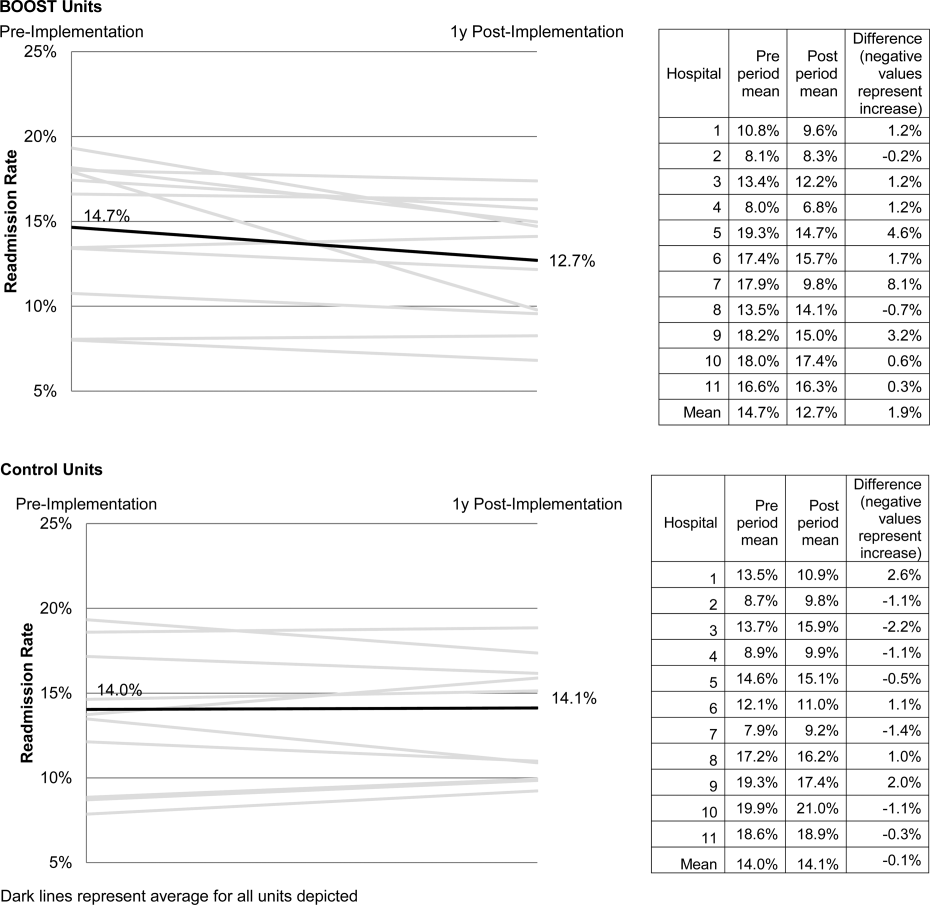
The average rate of 30‐day rehospitalization among BOOST units was 14.7% in the preimplementation period and 12.7% during the postimplementation period (P=0.010) (Figure 1). Rehospitalization rates for matched control units were 14.0% in the preintervention period and 14.1% in the postintervention period (P=0.831). The mean absolute reduction in readmission rates over the 1‐year study period in BOOST units compared to control units was 2.0%, or a relative reduction of 13.6% (P=0.054 for signed rank test comparing differences in readmission rate reduction in BOOST units compared to site‐matched control units). Length of stay in BOOST and control units decreased an average of 0.5 days and 0.3 days, respectively. There was no difference in length of stay change between BOOST units and control units (P=0.966).
DISCUSSION
As hospitals strive to reduce their readmission rates to avoid Centers for Medicare and Medicaid Services penalties, Project BOOST may be a viable QI approach to achieve their goals. This initial evaluation of participation in Project BOOST by 11 hospitals of varying sizes across the United States showed an associated reduction in rehospitalization rates (absolute=2.0% and relative=13.6%, P=0.054). We did not find any significant change in length of stay among these hospitals implementing BOOST tools.
The tools provided to participating hospitals were developed from evidence found in peer‐reviewed literature established through experimental methods in well‐controlled academic settings. Further tool development was informed by recommendations of an advisory board consisting of expert representatives and advocates involved in the hospital discharge process: patients, caregivers, physicians, nurses, case managers, social workers, insurers, and regulatory and research agencies.[19] The toolkit components address multiple aspects of hospital discharge and follow‐up with the goal of improving health by optimizing the safety of care transitions. Our observation that readmission rates appeared to improve in a diverse hospital sample including nonacademic and community hospitals engaged in Project BOOST is reassuring that the benefits seen in existing research literature, developed in distinctly academic settings, can be replicated in diverse acute‐care settings.
The effect size observed in our study was modest but consistent with several studies identified in a recent review of trials measuring interventions to reduce rehospitalization, where 7 of 16 studies showing a significant improvement registered change in the 0% to 5% absolute range.[12] Impact of this project may have been tempered by the need to translate external QI content to the local setting. Additionally, in contrast to experimental studies that are limited in scope and timing and often scaled to a research budget, BOOST sites were encouraged to implement Project BOOST in the clinical setting even if no new funds were available to support the effort.[12]
The recruitment of a national sample of both academic and nonacademic hospital participants imposed several limitations on our study and analysis. We recognize that intervention units selected by hospitals may have had unmeasured unit and patient characteristics that facilitated successful change and contributed to the observed improvements. However, because external pressure to reduce readmission is present across all hospitals independent of the BOOST intervention, we felt site‐matched controls were essential to understanding effects attributable to the BOOST tools. Differences between units would be expected to be stable over the course of the study period, and comparison of outcome differences between 2 different time periods would be reasonable. Additionally, we could not collect data on readmissions to other hospitals. Theoretically, patients discharged from BOOST units might be more likely to have been rehospitalized elsewhere, but the fraction of rehospitalizations occurring at alternate facilities would also be expected to be similar on the matched control unit.
We report findings from a voluntary cohort willing and capable of designating a comparison clinical unit and contributing the requested data outcomes. Pilot sites that did not report outcomes were not analyzed, but comparison of hospital characteristics shows that participating hospitals were more likely to be large, urban, academic medical centers. Although barriers to data submission were not formally analyzed, reports from nonparticipating sites describe data submission limited by local implementation design (no geographic rollout or simultaneous rollout on all appropriate clinical units), site specific inability to generate unit level outcome statistics, and competing organizational priorities for data analyst time (electronic medical record deployment, alternative QI initiatives). The external validity of our results may be limited to organizations capable of analytics at the level of the individual clinical unit as well as those with sufficient QI resources to support reporting to a national database in the absence of a payer mandate. It is possible that additional financial support for on‐site data collection would have bolstered participation, making the example of participation rates we present potentially informative to organizations hoping to widely disseminate a QI agenda.
Nonetheless, the effectiveness demonstrated in the 11 sites that did participate is encouraging, and ongoing collaboration with subsequent BOOST cohorts has been designed to further facilitate data collection. Among the insights gained from this pilot experience, and incorporated into ongoing BOOST cohorts, is the importance of intensive mentor engagement to foster accountability among participant sites, assist with implementation troubleshooting, and offer expertise that is often particularly effective in gaining local support. We now encourage sites to have 2 mentor site visits to further these roles and more frequent conference calls. Further research to understand the marginal benefit of the mentored implementation approach is ongoing.
The limitations in data submission we experienced with the pilot cohort likely reflect resource constraints not uncommon at many hospitals. Increasing pressure placed on hospitals as a result of the Readmission Reduction Program within the Affordable Care Act as well as increasing interest from private and Medicaid payors to incorporate similar readmission‐based penalties provide encouragement for hospitals to enhance their data and analytic skills. National incentives for implementation of electronic health records (EHR) should also foster such capabilities, though we often saw EHRs as a barrier to QI, especially rapid cycle trials. Fortunately, hospitals are increasingly being afforded access to comprehensive claims databases to assist in tracking readmission rates to other facilities, and these data are becoming available in a more timely fashion. This more robust data collection, facilitated by private payors, state QI organizations, and state hospital associations, will support additional analytic methods such as multivariate regression models and interrupted time series designs to appreciate the experience of current BOOST participants.
Additional research is needed to understand the role of organizational context in the effectiveness of Project BOOST. Differences in rates of tool implementation and changes in clinical outcomes are likely dependent on local implementation context at the level of the healthcare organization and individual clinical unit.[20] Progress reports from site mentors and previously described experiences of QI implementation indicate that successful implementation of a multidimensional bundle of interventions may have reflected a higher level of institutional support, more robust team engagement in the work of reducing readmissions, increased clinical staff support for change, the presence of an effective project champion, or a key facilitating role of external mentorship.[21, 22] Ongoing data collection will continue to measure the sustainability of tool use and observed outcome changes to inform strategies to maintain gains associated with implementation. The role of mentored implementation in facilitating gains also requires further study.
Increasing attention to the problem of avoidable rehospitalization is driving hospitals, insurers, and policy makers to pursue QI efforts that favorably impact readmission rates. Our analysis of the BOOST intervention suggests that modest gains can be achieved following evidence‐based hospital process change facilitated by a mentored implementation model. However, realization of the goal of a 20% reduction in rehospitalization proposed by the Center for Medicare and Medicaid Services' Partnership for Patients initiative may be difficult to achieve on a national scale,[23] especially if efforts focus on just the hospital.
Acknowledgments
The authors acknowledge the contributions of Amanda Creden, BA (data collection), Julia Lee (biostatistical support), and the support of Amy Berman, BS, RN, Senior Program Officer at The John A. Hartford Foundation.
Disclosures
Project BOOST was funded by a grant from The John A. Hartford Foundation. Project BOOST is administered by the Society of Hospital Medicine (SHM). The development of the Project BOOST toolkit, recruitment of sites for this study, mentorship of the pilot cohort, project evaluation planning, and collection of pilot data were funded by a grant from The John A. Harford Foundation. Additional funding for continued data collection and analysis was funded by the SHM through funds from hospitals to participate in Project BOOST, specifically with funding support for Dr. Hansen. Dr. Williams has received funding to serve as Principal Investigator for Project BOOST. Since the time of initial cohort participation, approximately 125 additional hospitals have participated in the mentored implementation of Project BOOST. This participation was funded through a combination of site‐based tuition, third‐party payor support from private insurers, foundations, and federal funding through the Center for Medicare and Medicaid Innovation Partnership for Patients program. Drs. Greenwald, Hansen, and Williams are Project BOOST mentors for current Project BOOST sites and receive financial support through the SHM for this work. Dr. Howell has previously received funding as a Project BOOST mentor. Ms. Budnitz is the BOOST Project Director and is Chief Strategy and Development Officer for the HM. Dr. Maynard is the Senior Vice President of the SHM's Center for Hospital Innovation and Improvement.
References
- , , . Rehospitalizations among patients in the Medicare fee‐for‐service program. N Engl J Med. 2009;360(14):1418–1428.
- United States Congress. House Committee on Education and Labor. Coe on Ways and Means, Committee on Energy and Commerce, Compilation of Patient Protection and Affordable Care Act: as amended through November 1, 2010 including Patient Protection and Affordable Care Act health‐related portions of the Health Care and Education Reconciliation Act of 2010. Washington, DC: US Government Printing Office; 2010.
- Cost estimate for the amendment in the nature of a substitute to H.R. 3590, as proposed in the Senate on November 18, 2009. Washington, DC: Congressional Budget Office; 2009.
- Partnership for Patients, Center for Medicare and Medicaid Innovation. Available at: http://www.innovations.cms.gov/initiatives/Partnership‐for‐Patients/index.html. Accessed December 12, 2012.
- , . Providers have failed to work for continuity. Hospitals. 1979;53(10):79.
- , . Executing high‐quality care transitions: a call to do it right. J Hosp Med. 2007;2(5):287–290.
- , , , , . The incidence and severity of adverse events affecting patients after discharge from the hospital. Ann Intern Med. 2003;138(3):161–167.
- , , , et al. Adverse events among medical patients after discharge from hospital. CMAJ. 2004;170(3):345–349.
- , , , et al. Making inpatient medication reconciliation patient centered, clinically relevant and implementable: a consensus statement on key principles and necessary first steps. J Hosp Med. 2010;5(8):477–485.
- , , . Tying up loose ends: discharging patients with unresolved medical issues. Arch Intern Med. 2007;167(12):1305.
- , , , , , . Deficits in communication and information transfer between hospital‐based and primary care physicians. JAMA. 2007;297(8):831–841.
- , , , , . Interventions to reduce 30‐day rehospitalization: a systematic review. Ann Intern Med. 2011;155(8):520–528.
- , , , et al. A reengineered hospital discharge program to decrease rehospitalization: a randomized trial. Ann Intern Med. 2009;150(3):178.
- , , , et al. Advancing the science of patient safety. Ann Intern Med. 2011;154(10):693–696.
- , . From best evidence to best practice: effective implementation of change in patients' care. Lancet. 2003;362(9391):1225–1230.
- , , , et al. Quality improvement projects targeting health care‐associated infections: comparing virtual collaborative and toolkit approaches. J Hosp Med. 2011;6(5):271–278.
- , , , , . Publication guidelines for improvement studies in health care: evolution of the SQUIRE project. Ann Intern Med. 2008;149(9):670–676.
- , , , . Risk stratification and therapeutic decision making in acute coronary syndromes. JAMA. 2000;284(7):876–878.
- , , . Are diagnosis specific outcome indicators based on administrative data useful in assessing quality of hospital care? BMJ. 2004;13(1):32.
- , , , et al. What distinguishes top‐performing hospitals in acute myocardial infarction mortality rates? Ann Intern Med. 2011;154(6):384–390.
- , , , . The Model for Understanding Success in Quality (MUSIQ): building a theory of context in healthcare quality improvement. BMJ Qual Saf. 2012;21(1):13–20.
- , . Evidence‐based quality improvement: the state of the science. Health Aff (Millwood). 2005;24(1):138–150.
- Center for Medicare and Medicaid Innovation. Partnership for patients. Available at: http://www.innovations.cms.gov/initiatives/Partnership‐for‐Patients/index.html. Accessed April 2, 2012.
Enactment of federal legislation imposing hospital reimbursement penalties for excess rates of rehospitalizations among Medicare fee for service beneficiaries markedly increased interest in hospital quality improvement (QI) efforts to reduce the observed 30‐day rehospitalization of 19.6% in this elderly population.[1, 2] The Congressional Budget Office estimated that reimbursement penalties to hospitals for high readmission rates are expected to save the Medicare program approximately $7 billion between 2010 and 2019.[3] These penalties are complemented by resources from the Center for Medicare and Medicaid Innovation aiming to reduce hospital readmissions by 20% by the end of 2013 through the Partnership for Patients campaign.[4] Although potential financial penalties and provision of resources for QI intensified efforts to enhance the quality of the hospital discharge transition, patient safety risks associated with hospital discharge are well documented.[5, 6] Approximately 20% of patients discharged from the hospital may suffer adverse events,[7, 8] of which up to three‐quarters (72%) are medication related,[9] and over one‐third of required follow‐up testing after discharge is not completed.[10] Such findings indicate opportunities for improvement in the discharge process.[11]
Numerous publications describe studies aiming to improve the hospital discharge process and mitigate these hazards, though a systematic review of interventions to reduce 30‐day rehospitalization indicated that the existing evidence base for the effectiveness of transition interventions demonstrates irregular effectiveness and limitations to generalizability.[12] Most studies showing effectiveness are confined to single academic medical centers. Existing evidence supports multifaceted interventions implemented in both the pre‐ and postdischarge periods and focused on risk assessment and tailored, patient‐centered application of interventions to mitigate risk. For example Project RED (Re‐Engineered Discharge) applied a bundled intervention consisting of intensified patient education and discharge planning, improved medication reconciliation and discharge instructions, and longitudinal patient contact with follow‐up phone calls and a dedicated discharge advocate.[13] However, the mean age of patients participating in the study was 50 years, and it excluded patients admitted from or discharged to skilled nursing facilities, making generalizability to the geriatric population uncertain.
An integral aspect of QI projects is the contribution of local context to translation of best practices to disparate settings.[14, 15, 16] Most available reports of successful interventions to reduce rehospitalization have not fully described the specifics of either the intervention context or design. Moreover, the available evidence base for common interventions to reduce rehospitalization was developed in the academic setting. Validation of single academic center studies in a broader healthcare context is necessary.
Project BOOST (Better Outcomes for Older adults through Safe Transitions) recruited a diverse national cohort of both academic and nonacademic hospitals to participate in a QI effort to implement best practices for hospital discharge care transitions using a national collaborative approach facilitated by external expert mentorship. This study aimed to determine the effectiveness of BOOST in lowering hospital readmission rates and impact on length of stay.
METHODS
The study of Project BOOST was undertaken in accordance with the SQUIRE (Standards for Quality Improvement Reporting Excellence) Guidelines.[17]
Participants
The unit of observation for the prospective cohort study was the clinical acute‐care unit within hospitals. Sites were instructed to designate a pilot unit for the intervention that cared for medical or mixed medicalsurgical patient populations. Sites were also asked to provide outcome data for a clinically and organizationally similar non‐BOOST unit to provide a site‐matched control. Control units were matched by local site leadership based on comparable patient demographics, clinical mix, and extent of housestaff presence. An initial cohort of 6 hospitals in 2008 was followed by a second cohort of 24 hospitals initiated in 2009. All hospitals were invited to participate in the national effectiveness analysis, which required submission of readmission and length of stay data for both a BOOST intervention unit and a clinically matched control unit.
Description of the Intervention
The BOOST intervention consisted of 2 major sequential processes, planning and implementation, both facilitated by external site mentorsphysicians expert in QI and care transitionsfor a period of 12 months. Extensive background on the planning and implementation components is available at
| Enrollment Sites, n=30 | Sites Reporting Outcome Data, n=11 | Sites Not Reporting Outcome Data, n=19 | P Value for Comparison of Outcome Data Sites Compared to Othersa | |
|---|---|---|---|---|
| ||||
| Region, n (%) | 0.194 | |||
| Northeast | 8 (26.7) | 2 (18.2) | 6 (31.6) | |
| West | 7 (23.4) | 2 (18.2) | 5 (26.3) | |
| South | 7 (23.4) | 3 (27.3) | 4 (21.1) | |
| Midwest | 8 (26.7) | 4 (36.4) | 4 (21.1) | |
| Urban location, n (%) | 25 (83.3) | 11 (100) | 15 (78.9) | 0.035 |
| Teaching status, n (%) | 0.036 | |||
| Academic medical center | 10 (33.4) | 5 (45.5) | 5 (26.3) | |
| Community teaching | 8 (26.7) | 3 (27.3) | 5 (26.3) | |
| Community nonteaching | 12 (40) | 3 (27.3) | 9 (47.4) | |
| Beds number, mean (SD) | 426.6 (220.6) | 559.2 (187.8) | 349.79 (204.48) | 0.003 |
| Number of tools implemented, n (%) | 0.194 | |||
| 0 | 2 (6.7) | 0 | 2 (10.5) | |
| 1 | 2 (6.7) | 0 | 2 (10.5) | |
| 2 | 4 (13.3) | 2 (18.2) | 2 (10.5) | |
| 3 | 12 (40.0) | 3 (27.3) | 8 (42.1) | |
| 4 | 9 (30.0) | 5 (45.5) | 4 (21.1) | |
| 5 | 1 (3.3) | 1 (9.1) | 1 (5.3) | |
Mentor engagement with sites consisted of a 2‐day kickoff training on the BOOST tools, where site teams met their mentor and initiated development of structured action plans, followed by 5 to 6 scheduled phone calls in the subsequent 12 months. During these conference calls, mentors gauged progress and sought to help troubleshoot barriers to implementation. Some mentors also conducted a site visit with participant sites. Project BOOST provided sites with several collaborative activities including online webinars and an online listserv. Sites also received a quarterly newsletter.
Outcome Measures
The primary outcome was 30‐day rehospitalization defined as same hospital, all‐cause rehospitalization. Home discharges as well as discharges or transfers to other healthcare facilities were included in the discharge calculation. Elective or scheduled rehospitalizations as well as multiple rehospitalizations in the same 30‐day window were considered individual rehospitalization events. Rehospitalization was reported as a ratio of 30‐day rehospitalizations divided by live discharges in a calendar month. Length of stay was reported as the mean length of stay among live discharges in a calendar month. Outcomes were calculated at the participant site and then uploaded as overall monthly unit outcomes to a Web‐based research database.
To account for seasonal trends as well as marked variation in month‐to‐month rehospitalization rates identified in longitudinal data, we elected to compare 3‐month year‐over‐year averages to determine relative changes in readmission rates from the period prior to BOOST implementation to the period after BOOST implementation. We calculated averages for rehospitalization and length of stay in the 3‐month period preceding the sites' first reported month of front‐line implementation and in the corresponding 3‐month period in the subsequent calendar year. For example, if a site reported implementing its first tool in April 2010, the average readmission rate in the unit for January 2011 through March 2011 was subtracted from the average readmission rate for January 2010 through March 2010.
Sites were surveyed regarding tool implementation rates 6 months and 24 months after the 2009 kickoff training session. Surveys were electronically completed by site leaders in consultation with site team members. The survey identified new tool implementation as well as modification of existing care processes using the BOOST tools (admission risk assessment, discharge readiness checklist, teach back use, mandate regarding discharge summary completion, follow‐up phone calls to >80% of discharges). Use of a sixth tool, creation of individualized written discharge instructions, was not measured. We credited sites with tool implementation if they reported either de novo tool use or alteration of previous care processes influenced by BOOST tools.
Clinical outcome reporting was voluntary, and sites did not receive compensation and were not subject to penalty for the degree of implementation or outcome reporting. No patient‐level information was collected for the analysis, which was approved by the Northwestern University institutional review board.
Data Sources and Methods
Readmission and length of stay data, including the unit level readmission rate, as collected from administrative sources at each hospital, were collected using templated spreadsheet software between December 2008 and June 2010, after which data were loaded directly to a Web‐based data‐tracking platform. Sites were asked to load data as they became available. Sites were asked to report the number of study unit discharges as well as the number of those discharges readmitted within 30 days; however, reporting of the number of patient discharges was inconsistent across sites. Serial outreach consisting of monthly phone calls or email messaging to site leaders was conducted throughout 2011 to increase site participation in the project analysis.
Implementation date information was collected from 2 sources. The first was through online surveys distributed in November 2009 and April 2011. The second was through fields in the Web‐based data tracking platform to which sites uploaded data. In cases where disagreement was found between these 2 sources, the site leader was contacted for clarification.
Practice setting (community teaching, community nonteaching, academic medical center) was determined by site‐leader report within the Web‐based data tracking platform. Data for hospital characteristics (number of licensed beds and geographic region) were obtained from the American Hospital Association's Annual Survey of Hospitals.[18] Hospital region was characterized as West, South, Midwest, or Northeast.
Analysis
The null hypothesis was that no prepost difference existed in readmission rates within BOOST units, and no difference existed in the prepost change in readmission rates in BOOST units when compared to site‐matched control units. The Wilcoxon rank sum test was used to test whether observed changes described above were significantly different from 0, supporting rejection of the null hypotheses. We performed similar tests to determine the significance of observed changes in length of stay. We performed our analysis using SAS 9.3 (SAS Institute Inc., Cary, NC).
RESULTS
Eleven hospitals provided rehospitalization and length‐of‐stay outcome data for both a BOOST and control unit for the pre‐ and postimplementation periods. Compared to the 19 sites that did not participate in the analysis, these 11 sites were significantly larger (559188 beds vs 350205 beds, P=0.003), more likely to be located in an urban area (100.0% [n=11] vs 78.9% [n=15], P=0.035), and more likely to be academic medical centers (45.5% [n=5] vs 26.3% [n=5], P=0.036) (Table 1).
The mean number of tools implemented by sites participating in the analysis was 3.50.9. All sites implemented at least 2 tools. The duration between attendance at the BOOST kickoff event and first tool implementation ranged from 3 months (first tool implemented prior to attending the kickoff) and 9 months (mean duration, 3.34.3 months) (Table 2).
| Hospital | Region | Hospital Type | No. Licensed Beds | Kickoff Implementationa | Risk Assessment | Discharge Checklist | Teach Back | Discharge Summary Completion | Follow‐up Phone Call | Total |
|---|---|---|---|---|---|---|---|---|---|---|
| ||||||||||
| 1 | Midwest | Community teaching | <300 | 8 | 3 | |||||
| 2 | West | Community teaching | >600 | 0 | 4 | |||||
| 3 | Northeast | Academic medical center | >600 | 2 | 4 | |||||
| 4 | Northeast | Community nonteaching | <300 | 9 | 2 | |||||
| 5 | South | Community nonteaching | >600 | 6 | 3 | |||||
| 6 | South | Community nonteaching | >600 | 3 | 4 | |||||
| 7 | Midwest | Community teaching | 300600 | 1 | 5 | |||||
| 8 | West | Academic medical center | 300600 | 1 | 4 | |||||
| 9 | South | Academic medical center | >600 | 4 | 4 | |||||
| 10 | Midwest | Academic medical center | 300600 | 3 | 3 | |||||
| 11 | Midwest | Academic medical center | >600 | 9 | 2 | |||||
The average rate of 30‐day rehospitalization among BOOST units was 14.7% in the preimplementation period and 12.7% during the postimplementation period (P=0.010) (Figure 1). Rehospitalization rates for matched control units were 14.0% in the preintervention period and 14.1% in the postintervention period (P=0.831). The mean absolute reduction in readmission rates over the 1‐year study period in BOOST units compared to control units was 2.0%, or a relative reduction of 13.6% (P=0.054 for signed rank test comparing differences in readmission rate reduction in BOOST units compared to site‐matched control units). Length of stay in BOOST and control units decreased an average of 0.5 days and 0.3 days, respectively. There was no difference in length of stay change between BOOST units and control units (P=0.966).
DISCUSSION
As hospitals strive to reduce their readmission rates to avoid Centers for Medicare and Medicaid Services penalties, Project BOOST may be a viable QI approach to achieve their goals. This initial evaluation of participation in Project BOOST by 11 hospitals of varying sizes across the United States showed an associated reduction in rehospitalization rates (absolute=2.0% and relative=13.6%, P=0.054). We did not find any significant change in length of stay among these hospitals implementing BOOST tools.
The tools provided to participating hospitals were developed from evidence found in peer‐reviewed literature established through experimental methods in well‐controlled academic settings. Further tool development was informed by recommendations of an advisory board consisting of expert representatives and advocates involved in the hospital discharge process: patients, caregivers, physicians, nurses, case managers, social workers, insurers, and regulatory and research agencies.[19] The toolkit components address multiple aspects of hospital discharge and follow‐up with the goal of improving health by optimizing the safety of care transitions. Our observation that readmission rates appeared to improve in a diverse hospital sample including nonacademic and community hospitals engaged in Project BOOST is reassuring that the benefits seen in existing research literature, developed in distinctly academic settings, can be replicated in diverse acute‐care settings.
The effect size observed in our study was modest but consistent with several studies identified in a recent review of trials measuring interventions to reduce rehospitalization, where 7 of 16 studies showing a significant improvement registered change in the 0% to 5% absolute range.[12] Impact of this project may have been tempered by the need to translate external QI content to the local setting. Additionally, in contrast to experimental studies that are limited in scope and timing and often scaled to a research budget, BOOST sites were encouraged to implement Project BOOST in the clinical setting even if no new funds were available to support the effort.[12]
The recruitment of a national sample of both academic and nonacademic hospital participants imposed several limitations on our study and analysis. We recognize that intervention units selected by hospitals may have had unmeasured unit and patient characteristics that facilitated successful change and contributed to the observed improvements. However, because external pressure to reduce readmission is present across all hospitals independent of the BOOST intervention, we felt site‐matched controls were essential to understanding effects attributable to the BOOST tools. Differences between units would be expected to be stable over the course of the study period, and comparison of outcome differences between 2 different time periods would be reasonable. Additionally, we could not collect data on readmissions to other hospitals. Theoretically, patients discharged from BOOST units might be more likely to have been rehospitalized elsewhere, but the fraction of rehospitalizations occurring at alternate facilities would also be expected to be similar on the matched control unit.
We report findings from a voluntary cohort willing and capable of designating a comparison clinical unit and contributing the requested data outcomes. Pilot sites that did not report outcomes were not analyzed, but comparison of hospital characteristics shows that participating hospitals were more likely to be large, urban, academic medical centers. Although barriers to data submission were not formally analyzed, reports from nonparticipating sites describe data submission limited by local implementation design (no geographic rollout or simultaneous rollout on all appropriate clinical units), site specific inability to generate unit level outcome statistics, and competing organizational priorities for data analyst time (electronic medical record deployment, alternative QI initiatives). The external validity of our results may be limited to organizations capable of analytics at the level of the individual clinical unit as well as those with sufficient QI resources to support reporting to a national database in the absence of a payer mandate. It is possible that additional financial support for on‐site data collection would have bolstered participation, making the example of participation rates we present potentially informative to organizations hoping to widely disseminate a QI agenda.
Nonetheless, the effectiveness demonstrated in the 11 sites that did participate is encouraging, and ongoing collaboration with subsequent BOOST cohorts has been designed to further facilitate data collection. Among the insights gained from this pilot experience, and incorporated into ongoing BOOST cohorts, is the importance of intensive mentor engagement to foster accountability among participant sites, assist with implementation troubleshooting, and offer expertise that is often particularly effective in gaining local support. We now encourage sites to have 2 mentor site visits to further these roles and more frequent conference calls. Further research to understand the marginal benefit of the mentored implementation approach is ongoing.
The limitations in data submission we experienced with the pilot cohort likely reflect resource constraints not uncommon at many hospitals. Increasing pressure placed on hospitals as a result of the Readmission Reduction Program within the Affordable Care Act as well as increasing interest from private and Medicaid payors to incorporate similar readmission‐based penalties provide encouragement for hospitals to enhance their data and analytic skills. National incentives for implementation of electronic health records (EHR) should also foster such capabilities, though we often saw EHRs as a barrier to QI, especially rapid cycle trials. Fortunately, hospitals are increasingly being afforded access to comprehensive claims databases to assist in tracking readmission rates to other facilities, and these data are becoming available in a more timely fashion. This more robust data collection, facilitated by private payors, state QI organizations, and state hospital associations, will support additional analytic methods such as multivariate regression models and interrupted time series designs to appreciate the experience of current BOOST participants.
Additional research is needed to understand the role of organizational context in the effectiveness of Project BOOST. Differences in rates of tool implementation and changes in clinical outcomes are likely dependent on local implementation context at the level of the healthcare organization and individual clinical unit.[20] Progress reports from site mentors and previously described experiences of QI implementation indicate that successful implementation of a multidimensional bundle of interventions may have reflected a higher level of institutional support, more robust team engagement in the work of reducing readmissions, increased clinical staff support for change, the presence of an effective project champion, or a key facilitating role of external mentorship.[21, 22] Ongoing data collection will continue to measure the sustainability of tool use and observed outcome changes to inform strategies to maintain gains associated with implementation. The role of mentored implementation in facilitating gains also requires further study.
Increasing attention to the problem of avoidable rehospitalization is driving hospitals, insurers, and policy makers to pursue QI efforts that favorably impact readmission rates. Our analysis of the BOOST intervention suggests that modest gains can be achieved following evidence‐based hospital process change facilitated by a mentored implementation model. However, realization of the goal of a 20% reduction in rehospitalization proposed by the Center for Medicare and Medicaid Services' Partnership for Patients initiative may be difficult to achieve on a national scale,[23] especially if efforts focus on just the hospital.
Acknowledgments
The authors acknowledge the contributions of Amanda Creden, BA (data collection), Julia Lee (biostatistical support), and the support of Amy Berman, BS, RN, Senior Program Officer at The John A. Hartford Foundation.
Disclosures
Project BOOST was funded by a grant from The John A. Hartford Foundation. Project BOOST is administered by the Society of Hospital Medicine (SHM). The development of the Project BOOST toolkit, recruitment of sites for this study, mentorship of the pilot cohort, project evaluation planning, and collection of pilot data were funded by a grant from The John A. Harford Foundation. Additional funding for continued data collection and analysis was funded by the SHM through funds from hospitals to participate in Project BOOST, specifically with funding support for Dr. Hansen. Dr. Williams has received funding to serve as Principal Investigator for Project BOOST. Since the time of initial cohort participation, approximately 125 additional hospitals have participated in the mentored implementation of Project BOOST. This participation was funded through a combination of site‐based tuition, third‐party payor support from private insurers, foundations, and federal funding through the Center for Medicare and Medicaid Innovation Partnership for Patients program. Drs. Greenwald, Hansen, and Williams are Project BOOST mentors for current Project BOOST sites and receive financial support through the SHM for this work. Dr. Howell has previously received funding as a Project BOOST mentor. Ms. Budnitz is the BOOST Project Director and is Chief Strategy and Development Officer for the HM. Dr. Maynard is the Senior Vice President of the SHM's Center for Hospital Innovation and Improvement.
References
- , , . Rehospitalizations among patients in the Medicare fee‐for‐service program. N Engl J Med. 2009;360(14):1418–1428.
- United States Congress. House Committee on Education and Labor. Coe on Ways and Means, Committee on Energy and Commerce, Compilation of Patient Protection and Affordable Care Act: as amended through November 1, 2010 including Patient Protection and Affordable Care Act health‐related portions of the Health Care and Education Reconciliation Act of 2010. Washington, DC: US Government Printing Office; 2010.
- Cost estimate for the amendment in the nature of a substitute to H.R. 3590, as proposed in the Senate on November 18, 2009. Washington, DC: Congressional Budget Office; 2009.
- Partnership for Patients, Center for Medicare and Medicaid Innovation. Available at: http://www.innovations.cms.gov/initiatives/Partnership‐for‐Patients/index.html. Accessed December 12, 2012.
- , . Providers have failed to work for continuity. Hospitals. 1979;53(10):79.
- , . Executing high‐quality care transitions: a call to do it right. J Hosp Med. 2007;2(5):287–290.
- , , , , . The incidence and severity of adverse events affecting patients after discharge from the hospital. Ann Intern Med. 2003;138(3):161–167.
- , , , et al. Adverse events among medical patients after discharge from hospital. CMAJ. 2004;170(3):345–349.
- , , , et al. Making inpatient medication reconciliation patient centered, clinically relevant and implementable: a consensus statement on key principles and necessary first steps. J Hosp Med. 2010;5(8):477–485.
- , , . Tying up loose ends: discharging patients with unresolved medical issues. Arch Intern Med. 2007;167(12):1305.
- , , , , , . Deficits in communication and information transfer between hospital‐based and primary care physicians. JAMA. 2007;297(8):831–841.
- , , , , . Interventions to reduce 30‐day rehospitalization: a systematic review. Ann Intern Med. 2011;155(8):520–528.
- , , , et al. A reengineered hospital discharge program to decrease rehospitalization: a randomized trial. Ann Intern Med. 2009;150(3):178.
- , , , et al. Advancing the science of patient safety. Ann Intern Med. 2011;154(10):693–696.
- , . From best evidence to best practice: effective implementation of change in patients' care. Lancet. 2003;362(9391):1225–1230.
- , , , et al. Quality improvement projects targeting health care‐associated infections: comparing virtual collaborative and toolkit approaches. J Hosp Med. 2011;6(5):271–278.
- , , , , . Publication guidelines for improvement studies in health care: evolution of the SQUIRE project. Ann Intern Med. 2008;149(9):670–676.
- , , , . Risk stratification and therapeutic decision making in acute coronary syndromes. JAMA. 2000;284(7):876–878.
- , , . Are diagnosis specific outcome indicators based on administrative data useful in assessing quality of hospital care? BMJ. 2004;13(1):32.
- , , , et al. What distinguishes top‐performing hospitals in acute myocardial infarction mortality rates? Ann Intern Med. 2011;154(6):384–390.
- , , , . The Model for Understanding Success in Quality (MUSIQ): building a theory of context in healthcare quality improvement. BMJ Qual Saf. 2012;21(1):13–20.
- , . Evidence‐based quality improvement: the state of the science. Health Aff (Millwood). 2005;24(1):138–150.
- Center for Medicare and Medicaid Innovation. Partnership for patients. Available at: http://www.innovations.cms.gov/initiatives/Partnership‐for‐Patients/index.html. Accessed April 2, 2012.
Copyright © 2013 Society of Hospital Medicine

Redefining Readmission Risk Factors
Within Medicare recipients, an astounding one in five medical patients (19.6%) is readmitted within 30 days, accounting for $15 billion in spending.1, 2 Amidst the current healthcare system crisis, reducing these hospital readmissions has risen to the highest priority. Reducing readmissions is the newest addition to multiple quality dashboards, both institutional and national, as a measure of the care delivered during hospitalization.3 One of the most notable of these reporting entities, Hospital Compare, now publicly reports Medicare readmission rates for a few common diagnoses.4 While Medicare already withholds payment to hospitals for readmissions within 24 hours for the same diagnosis, Medicare may soon reduce payment to hospitals with the highest rates of readmission within 30 days, a powerful incentive for hospitals to intervene. Readmissions have also reached the radar of additional stakeholders, even making its way onto Obama's budget considerations, given the potential cost savings to the system overall.5
To develop systems which reduce readmissions, one must first gain understanding of the characteristics of readmissions. A few clinical risk factors (such as age, number of prior admissions, and comorbidities) have been well defined in subgroups of general medicine inpatients.612 Likewise, interventions aiming to reduce readmissions have also focused on subgroups, excluding a large portion of hospitalized patients (for example, non‐English speakers and younger patients).1320 Other data have been derived in veterans or within non‐US populations that have inherently different payer, race, ethnicity, and primary language composition, and may not be applicable outside those settings.7, 8, 10, 11, 21 Lastly, little is known regarding risk that may be associated with operational factors, such as weekend discharge or admission source. As a result, there are few data describing the clinical, operational, and demographic factors associated with readmission in a heterogeneous population of hospitalized general medicine patientsthe patient population of most generalists in the United States.
To understand the impact of a variety of risk factors in a diverse general medicine population, we evaluated the characteristics of readmitted patients in a large urban university medical center over a 2‐year period. We hypothesized that a number of clinical, operational, and sociodemographic factors would be associated with readmission.
Methods
Sites and Subjects
Our data were collected on general medicine patients during hospitalization between June 1, 2006 and May 31, 2008, at the University of California San Francisco. The University of California, San Francisco (UCSF) Medical Center is composed of Moffitt‐Long Hospital (a 400‐bed center) and UCSF‐Mount Zion Hospital (a 200‐bed facility) located in San Francisco, CA.
Medical patients at Moffitt‐Long Hospital are admitted to 1 of 8 medical teams composed of a resident, 1 to 2 interns, and 0 to 3 medical students, supervised by an attending physician who is most often a hospitalist. At Moffitt‐Long Hospital, housestaff write all orders and provide 24‐hour coverage to inpatients. Mount Zion medical patients are cared for by 1 of 2 teams and staffed by a hospitalist on each team who is responsible for all elements of care. Both services care for common inpatient diagnoses, as well as specialty‐associated diagnoses such as cancer, pneumonia, and chronic obstructive pulmonary disease (COPD). Of note, at Moffitt‐Long Hospital, those patients with primary cardiac diagnoses are cared for by a separate team composed of housestaff and students supervised by a cardiologist.
The discharge process at both sites utilizes a multidisciplinary teamincluding physicians, case managers, nurses, pharmacists, and discharge coordinatorsworking in concert. Key components include arranging follow‐up care, faxing the discharge summary to the primary care provider, and educating the patient and caregivers, especially regarding medications. While these goals are clearly delineated, significant variability exists in how these tasks are actually accomplished. The multidisciplinary approach, components of the discharge process, and lack of a systematic approach are representative of the discharge process around the country.22
Data
Data regarding patient demographics, age, comorbidities, and insurance status were collected from administrative data systems at UCSF, reflecting the patient's status at the time of index admission. These same systems were used to collect a date‐stamped log of all medications (eg, anticoagulants) for which the patient was billed during the last 48 hours of hospitalization. Specifically, data were obtained for medications previously shown to cause adverse drug events following hospital discharge.23, 24 These medication groups include corticosteroids, anticoagulants, antibiotics, narcotics, nonsteroidal anti‐inflammatory drugs (NSAIDs), cardiovascular medications, antiepileptics, anticholinergics, antidepressants, and antidiabetics. Operational factors that we hypothesized would affect readmission risk included admission source, discharge disposition, and weekday vs. weekend discharge. Case management, social work, and pharmacy services operate with limited staffing on weekends. Likewise, resident and intern physicians are more likely to be off on a weekend day than a weekday; covering attending physicians care for about half of patients during the weekend. Data were obtained from Transition Systems International (TSI, Boston, MA) administrative databases, a cost‐accounting system that collects data abstracted from patient charts upon discharge from UCSF.
Definition of Readmission Measure
Using TSI, we detected readmission to UCSF by screening for any inpatient encounters on any service (not just medicine) within the 30 days following discharge from the general medicine service at the 2 UCSF campuses. We excluded elective readmissions, such as for scheduled chemotherapy. Patients who died at the index admission were excluded from the cohort.
Adjustment Variables
Age, gender, payer status and APR risk of mortality (3M Health Information Systems, St. Paul, MN) were collected from administrative data. The All Patient Refined (APR) risk of mortality is the all patients risk of mortality score developed by 3M which divides patients into 4 subclasses of risk based on clinical problems and comorbidities.25 We used secondary diagnosis codes in administrative data to classify comorbidities using the method of Elixhauser.26
Using the log of medication charges, we grouped high‐risk medications according to the classification scheme of Forster et al.23 and Hanlon et al.24 We then created a count representing the total number of medications administered to patients within the final 48 hours of stay.
Analysis
We first described study patients and hospitals using univariable methods. Multivariable generalized estimating equations (SAS PROC GENMOD) were used to account for clustering of patients within physicians and calculate adjusted odds ratios (ORs). As there were 2 sites within UCSF Medical Center (Moffitt‐Long and Mount Zion hospitals), we included site as a fixed effect in our model. Models were constructed using manual variable selection methods with final selection being made based on whether the covariate was associated with readmission at P < 0.05. All analyses were carried out using SAS version 9.2 (SAS Institute, Inc. Cary, NC).
Results
Baseline Characteristics
During the 2‐year accrual period, 295 attending physicians admitted 6805 unique patients for a total of 10,359 admissions. Seventeen percent of these 10,359 admissions were readmitted within 30 days. The cohort of all patients had a mean age of 59.6 years 19.5 standard deviation (SD), with 52.8% women. The mean length of stay was 5.6 days 10.4 SD. Medicare was the payer source for approximately half of the admissions. The majority of admissions (90.4%) were billed for at least 1 high risk medication, with narcotics, cardiac medications, and antibiotics being the most common. Regarding disposition, 79.5% of admissions were discharged to home; 9.1% were discharged to a skilled nursing facility (SNF).
Baseline sociodemographic, operational, and clinical characteristics for patients readmitted and not readmitted are shown in Table 1. Demographic characteristics with significant differences (P < 0.05) between readmitted and nonreadmitted groups included mean age, race, payer status, and primary language other than English. Regarding operational characteristics, readmitted patients had a higher median length of stay and were more likely to be admitted through the emergency room during their index admission. Discharge to an SNF was higher in the readmitted group versus the nonreadmitted group (9.7% vs. 9.0%). Several clinical factors were more prevalent in the readmitted group: high‐risk medications, specifically steroids, narcotics, and cardiovascular medications; high‐risk medication count of 3 or greater; and comorbidities including congestive heart failure, renal disease, cancer, anemia, and depression.
| Characteristic | Patients Readmitted (n = 1762 17.0%), n (%) | Patients Not Readmitted (n = 8597 83.0%), n (%) | P Value |
|---|---|---|---|
| |||
| Mean age (years) (SD) | 58.8 (19.3) | 59.8 (19.6) | 0.0491 |
| Female | 930 (52.8) | 4548 (52.9) | 0.9260 |
| Race* | |||
| White | 785 (44.6) | 4166 (48.8) | <0.0001 |
| Black | 442 (25.1) | 1401 (16.4) | |
| Asian | 323 (18.4) | 1726 (20.2) | |
| Other | 209 (11.9) | 1240 (14.5) | |
| Hispanic ethnicity | 140 (8.1) | 734 (8.9) | 0.2737 |
| Payer status | |||
| Medicare | 905 (51.4) | 4266 (49.6) | <0.0001 |
| Medicaid/Medi‐cal | 458 (26.0) | 1578 (18.4) | |
| Private | 370 (21.0) | 2092 (24.3) | |
| Other | 29 (1.7) | 661 (7.7) | |
| Primary language other than English | 242 (17.1) | 1394 (19.5) | 0.0359 |
| Median length of stay (days) (interquartile range) | 4 (2, 7) | 3 (2, 6) | <0.0001 |
| Admit source | |||
| Emergency room | 1506 (85.5) | 6898 (80.2) | <0.0001 |
| Outside hospital | 38 (2.2) | 271 (3.2) | |
| Direct admission/other (jail) | 218 (12.4) | 1428 (16.6) | |
| Discharge to | |||
| Home | 1461 (82.9) | 6773 (78.8) | <0.0001 |
| SNF | 170 (9.7) | 774 (9.0) | |
| Other | 131 (7.4) | 1050 (12.2) | |
| Discharged on weekend | 381 (21.6) | 1904 (22.1) | 0.6288 |
| Patient medications | |||
| Any high‐risk medication | 1679 (95.3) | 7684 (89.4) | <0.0001 |
| High‐risk medication count | |||
| 02 | 577 (32.8) | 3666 (42.6) | <0.0001 |
| 34 | 692 (39.3) | 2968 (34.5) | |
| 5 | 493 (28) | 1963 (22.8) | |
| Any corticosteroids | 399 (22.6) | 1571 (18.3) | <0.0001 |
| Anticoagulant | 120 (6.8) | 559 (6.5) | 0.6340 |
| Any antibiotic | 904 (51.3) | 4203 (48.9) | 0.0646 |
| Any narcotic | 1036 (58.8) | 4206 (48.9) | <0.0001 |
| Any NSAID | 68 (3.9) | 320 (3.7) | 0.7826 |
| Any cardiovascular med | 887 (50.3) | 3806 (44.3) | <0.0001 |
| Any antiepileptic | 93 (5.3) | 470 (5.5) | 0.7500 |
| Any anticholinergic | 47 (2.7) | 354 (4.1) | 0.0040 |
| Any antidepressant | 455 (25.8) | 1863 (25.8) | 0.0001 |
| Any antidiabetic | 198 (11.2) | 994 (11.6) | 0.6970 |
| Elixhauser comorbidities | |||
| Congestive heart failure | 219 (12.4) | 795 (9.3) | <0.0001 |
| Pulmonary circulation disease | 72 (4.1) | 178 (2.1) | <0.0001 |
| Peripheral vascular disease | 84 (4.8) | 331 (3.9) | 0.0737 |
| Hypertension | 745 (42.3) | 3741 (43.5) | 0.3411 |
| Other neurological disease | 101 (5.7) | 696 (8.1) | 0.0007 |
| Chronic pulmonary disease | 317 (18.0) | 1442 (16.8) | 0.2149 |
| Diabetes | 303 (17.2) | 1333 (15.5) | 0.0762 |
| Renal failure | 339 (19.2) | 1286 (15.0) | <0.0001 |
| Liver disease | 188 (10.7) | 774 (9.0) | 0.0281 |
| Metastatic cancer | 160 (9.1) | 530 (6.2) | <0.0001 |
| Solid tumor w/o metastases | 100 (5.7) | 277 (3.2) | <0.0001 |
| Rheumatoid arthritis/collagen vas | 81 (4.6) | 303 (3.5) | 0.0299 |
| Weight loss | 153 (8.7) | 584 (6.8) | 0.0449 |
| Deficiency anemia | 522 (29.6) | 1979 (23.0) | <0.0001 |
| Alcohol abuse | 101 (5.7) | 428 (5.0) | 0.1905 |
| Drug abuse | 148 (8.4) | 619 (7.2) | 0.0798 |
| Depression | 244 (13.9) | 963 (11.2) | 0.0016 |
| APR risk of mortality | |||
| 1 | 451 (25.6) | 3101 (36.1) | <0.0001 |
| 2 | 619 (35.1) | 2797 (32.5) | |
| 3 | 536 (30.4) | 1907 (22.2) | |
| 4 | 156 (8.9) | 792 (9.2) | |
Frequency of Readmission
The 30‐day readmission rate was 17.0% (1762 patients), with 49.7% (875 patients) of the readmissions occurring within 10 days of discharge. Of patients readmitted, the general medicine service was the readmitting team in 78.2%. A quarter of readmissions (26.2%) had the same primary diagnosis on initial and repeat admission.
Factors Associated With Readmission
Factors associated with readmission were categorized as sociodemographic, operational, and clinical. Factors associated with readmission with P < 0.05 and present in at least 5% of admissions are presented in Table 2. Of the sociodemographic factors, black race was significantly associated with readmission. Within the Medicare cohort, risk for readmission was similar for white vs. nonwhite race, with relative risk of 1.0 (95% confidence interval [CI], 0.86‐1.18). Medicaid as payer status was significantly associated in the unadjusted model, and in the adjusted model showed a trend toward readmission. Mean age was significantly different in the readmitted and nonreadmitted groups, but the difference was small (1.0 year). Moreover, when we evaluated age in 5‐year categories (ex. 65‐70, 71‐75, etc.), age was not associated with readmission. In the adjusted model, none of the operational factors were significantly associated with readmission, including discharge to SNF, weekend discharge, or admit source.
| Covariate | Unadjusted OR (95% CI) | Adjusted OR (95% CI) |
|---|---|---|
| ||
| Age | 1.00 (0.991.00) | 1.00 (0.991.00) |
| Race | ||
| White | Referent | Referent |
| Black | 1.67 (1.471.91) | 1.43 (1.241.65) |
| Asian | 0.99 (0.861.14) | 0.95 (0.821.11) |
| Other | 0.89 (0.761.06) | 0.84 (0.671.06) |
| Payer | ||
| Medicare | Referent | Referent |
| Medicaid/medical | 1.37 (1.211.55) | 1.15 (0.971.36) |
| Private | 0.83 (0.730.95) | 0.78 (0.650.95) |
| Other | 0.21 (0.140.30) | 0.23 (0.110.45) |
| Disposition | ||
| To home | Referent | Referent |
| SNF | 1.02 (0.851.21) | 0.98 (0.821.18) |
| Other | 0.58 (0.480.70) | 0.53 (0.430.66) |
| Highrisk medications | ||
| Corticosteroids | 1.31 (1.161.48) | 1.24 (1.091.42) |
| Narcotics | 1.49 (1.341.65) | 1.33 (1.161.53) |
| Anticholinergics | 0.64 (0.470.87) | 0.66 (0.480.90) |
| Comorbidities | ||
| Congestive heart failure | 1.39 (1.191.63) | 1.30 (1.091.56) |
| Neurological disorders | 0.69 (0.560.86) | 0.70 (0.570.87) |
| Renal failure | 1.35 (1.191.55) | 1.19 (1.051.36) |
| Metastatic cancer | 1.52 (1.261.83) | 1.61 (1.331.95) |
| Solid tumor w/o metastasis | 1.81 (1.432.29) | 1.95 (1.542.47) |
| Deficiency anemia | 1.41 (1.261.58) | 1.27 (1.131.44) |
| Weight loss | 1.30 (1.081.57) | 1.26 (1.091.47) |
Of the clinical factors, high‐risk medications and 6 comorbidities were associated with readmission. High‐risk medication categories associated with readmission were steroids and narcotics; anticholinergics medications were protective. The 6 comorbidities associated with readmission were congestive heart failure, renal disease, cancer (with and without metastasis), weight loss, and iron deficiency anemia. While APR risk of mortality was associated with readmission at P < 0.05, including APR in our final model did not alter which other factors were significantly associated with readmission. When site (Moffitt‐Long vs. Mount Zion Hospitals) was added to the model, the ORs for factors associated with readmission did not change appreciably (0.01).
Discussion
In this retrospective observational study of hospitalized patients, we found that readmission was common and associated with a number of risk factors that could be easily identified early in hospitalization. Nonclinical factors associated with readmission were black race and Medicaid payer status (in the unadjusted model). Clinical factors were high risk medications including steroids and narcotics; and comorbidities including congestive heart failure, renal disease, cancer, anemia, and weight loss. In contrast, other potential riskssuch as discharge on a weekend and discharge to an SNFwere not independently associated with readmission. This cohortwith a mix of clinical scenarios, payers, age, etc.represents the inherently heterogeneous population of inpatient general medicine across the country and abroad. Hospitalists provided care for over 65% of the general medicine service, again representative of the trend in US inpatient medicine.27, 28 Lastly, our cohort did not have the benefit of a systematic and consistent discharge process with interventions focused on reducing readmissions. This gap, which is common across hospitals, highlights the utility of this data in targeting quality improvement efforts.
Reducing risks for readmission requires identification of patient populations at highest risk; in those patients, one can further identify factors which are potentially modifiable via education or patient‐engagement interventions. While in the hospital, more intensive predischarge counseling and efforts to increase mobility may be most useful if targeted early and often on those at highest risk.15, 16, 29, 30 Finally, broader‐based support in the form of better home services, more access to longitudinal care, or targeted postdischarge efforts may be required.14, 31
Though current strategies focus largely on clinical risk factors, this study shows that nonclinical factors play an equally important but underappreciated role in contributing to readmission. While prior studies have shown variable results on association of black race with readmission,2, 9, 11 none have evaluated or linked Medicaid to readmission, which just missed statistical significance in this study (OR, 1.15; 95% CI, 0.971.36). Both black race and Medicaid as payer are proxies for the underlying root cause aspects leading to readmission, such as access to longitudinal care. Following this trail to the root cause will require in‐depth qualitative evaluation that includes the patient perspective as a source of data.32 For example, risk for readmission may not stem solely from being on warfarin, but in combination with not having transportation to get an international normalized ratio (INR) checked, a suboptimal understanding of how to take the medication, or not recognizing potential side effects until too late to avoid inpatient admission.
Several of the strongest associations, and perhaps most conducive to targeted interventions, were high‐risk medications at discharge. Risk related to medications and adverse drug events following discharge have been a consistent theme in readmission literature.24, 33 Our current system, which includes mandated inpatient medicine reconciliation, does not encourage discontinuation of unnecessary medications to combat polypharmacy, address affordability of medications, provide consistent medication counseling, or focus on the highest risk medications. In fact, bundled interventions which implement pharmacists to focus on these measures have been successful in decreasing readmission,14, 16, 29 but unfortunately are not yet part of the standard of care. The challenge remains transforming a mandatory policy such as medicine reconciliation into a valuable and systematic tool in the discharge process.
Two factors were surprisingly protective against readmission: neurologic diagnosis and anticholinergic medications. This first may be explained by the presence of a separate neurology service at our institution which skews our data. For example, a patient with acute stroke, who has a 20% rate of bounce‐back to a higher level of care within 30 days of discharge,34 would be admitted to the neurology service, not general medicine, and therefore would not nr part of our cohort. Regarding anticholinergics, several factors may explain this unexpected result. First, use of anticholinergics was relatively rare in our sample (2.7% in readmitted patients, 4.1% in patients not readmitted), possibly creating a false positive result. Second, Hanlon et al.24 showed only a weak association at best between anticholinergics and postdischarge adverse drug reactions (hazard ratio, 1.11; 95% CI, 0.86‐1.43). Lastly, anticholinergics include a varied group of medications, therefore diluting possible relative risk of specific medications.
While this study allows providers to identify patients at increased risk of readmission, the identified factors do not fully account for readmission risk; we did not aim to produce a risk‐prediction rule with our study. Prior readmission studies have been unable to create a tool to predict which patients will be readmitted with much success.3537 These results underscore the complexities and variability of readmission, which often lack a clear single cause and effect relationship. Given the breadth of risk factors we identified, it seems likely that more intensive interventions will require a multidisciplinary approach, one which might be costly if applied broadly. Our study does not attempt to predict who will be readmitted and who will not, but rather provides a list of risk factors which might be used to deploy resources more efficiently.
This study had several limitations. We did not capture readmissions to outside hospitals, which account for 22% to 24% of all readmissions in prior studies, and therefore have underestimated the readmission rate in our population.2, 8 However, by limiting our data to 2 hospitals within 1 institution, we were able to include more detailed patient level data, which is not accurately available in other large databases. Also, while studies of risk factors in a managed care population (such as within Medicare, the Veterans Affairs medical centers, or countries with national integrated medical records) are able to capture all readmissions, this study is the first to evaluate readmissions risk factors in a truly heterogeneous U.S. inpatient medicine population without limitation by age or payer status. Second, we did not have access to outpatient medications lists; however use of these same medications within the last 48 hours of admission is likely a reasonable proxy for outpatient use and more conducive to potential interventions (such as medication reconciliation or patient education) that could flag patients prior to discharge. Payer data was limited to only the primary payer, so patients who were dual eligible (ie, have both Medicare and Medicaid) were categorized as Medicare. Regarding sociodemographic factors, while primary language other than English was not associated with readmission, language data was missing in 17.4% of admissions, thereby limiting our ability to evaluate this factor. Our data did not include access to outpatient or primary care, and therefore we were unable to evaluate access to postdischarge follow‐up care as a risk factor for readmission. Lastly, while this study did not include outpatient deaths, we did exclude patients who died in the hospital.
Conclusions
Readmission is common among general medicine patients, with approximately 1 in 5 patients being readmitted within 30 days. While the identified associated factors do not account for all the potential reasons for readmission, our study suggests a spectrum of risk factors which might be used to target more intensive multidisciplinary interventions. Specifically, the nonclinical factors of race and payer status merit further in depth research incorporating the patient experience to truly determine causation of readmission. Hospitalists, who are at nexus of the discharge process and uniquely invested in quality inpatient care, are ideally positioned to lead efforts to reduce readmissions. How to use our study's results to develop and implement effective interventions to reduce readmissions remains a subject for future studies.
- A path to bundled payment around a rehospitalization.: Medicare payment Advisory Commission; June2005.
- ,,.Rehospitalizations among patients in the Medicare fee‐for‐service program.N Engl J Med.2009;360(14):1418–1428.
- University HealthSystem Consortium. Available at: https://www.uhc.edu. Accessed May2010.
- U.S. Department of Health 15(5):599–606.
- ,,,.Development and validation of a model for predicting emergency admissions over the next year (PEONY): a UK historical cohort study.Arch Intern Med.2008;168(13):1416–1422.
- ,,, et al.Incidence and main factors associated with early unplanned hospital readmission among French medical inpatients aged 75 and over admitted through emergency units.Age Ageing.2008;37(4):416–422.
- ,,,,,.Factors associated with unplanned hospital readmission among patients 65 years of age and older in a Medicare managed care plan.Am J Med.1999;107(1):13–17.
- ,,.Risk factors for early unplanned hospital readmission in the elderly.J Gen Intern Med.1991;6(3):223–228.
- ,,, et al.Predicting non‐elective hospital readmissions: a multi‐site study. Department of Veterans Affairs Cooperative Study Group on Primary Care and Readmissions.J Clin Epidemiol.2000;53(11):1113–1118.
- ,.Effect of gender, ethnicity, pulmonary disease, and symptom stability on rehospitalization in patients with heart failure.Am J Cardiol.2007;100(7):1139–1144.
- ,,,.The care transitions intervention: results of a randomized controlled trial.Arch Intern Med.2006;166(17):1822–1828.
- ,,,.The impact of follow‐up telephone calls to patients after hospitalization.Am J Med.2001;111(9B):26S–30S.
- ,,, et al.A reengineered hospital discharge program to decrease rehospitalization: a randomized trial.Ann Intern Med.2009;150(3):178–187.
- ,,, et al.Reduction of 30‐day postdischarge hospital readmission or emergency department (ED) visit rates in high‐risk elderly medical patients through delivery of a targeted care bundle.J Hosp Med.2009;4(4):211–218.
- ,,,,,.Comprehensive discharge planning with postdischarge support for older patients with congestive heart failure: a meta‐analysis.JAMA.2004;291(11):1358–1367.
- ,.Home‐based intervention in congestive heart failure: long‐term implications on readmission and survival.Circulation.2002;105(24):2861–2866.
- ,,,,,.Effect of a standardized nurse case‐management telephone intervention on resource use in patients with chronic heart failure.Arch Intern Med.2002;162(6):705–712.
- ,,,.The impact of follow‐up physician visits on emergency readmissions for patients with asthma and chronic obstructive pulmonary disease: a population‐based study.Am J Med.2002;112(2):120–125.
- ,.Factors predicting readmission of older general medicine patients.J Gen Intern Med.1991;6(5):389–393.
- BOOSTing Care Transitions. Available at: http://www.hospitalmedicine.org/ResourceRoomRedesign/RR_CareTransitions/CT_Home.cfm. Accessed May2010.
- ,,,,.Adverse drug events occurring following hospital discharge.J Gen Intern Med.2005;20(4):317–323.
- ,,, et al.Incidence and predictors of all and preventable adverse drug reactions in frail elderly persons after hospital stay.J Gerontol A Biol Sci Med Sci.2006;61(5):511–515.
- . Development of the 3M™ All Patient Refined Diagnosis Related Groups (APR DRGs). Available at: http://www.ahrq.gov/qual/mortality/Hughes.htm. Accessed May2010.
- ,,.Volume thresholds and hospital characteristics in the United States.Health Aff (Millwood).2003;22(2):167–177.
- ,,,.The status of hospital medicine groups in the United States.J Hosp Med.2006;1(2):75–80.
- ,,,.Growth in the care of older patients by hospitalists in the United States.N Engl J Med.2009;360(11):1102–1112.
- ,,, et al.Role of pharmacist counseling in preventing adverse drug events after hospitalization.Arch Intern Med.2006;166(5):565–571.
- ,,, et al.Effects of a multicomponent intervention on functional outcomes and process of care in hospitalized older patients: a randomized controlled trial of Acute Care for Elders (ACE) in a community hospital.J Am Geriatr Soc.2000;48(12):1572–1581.
- ,,,,,.Telehome monitoring in patients with cardiac disease who are at high risk of readmission.Heart Lung.2008;37(1):36–45.
- ,,.Understanding rehospitalization risk: can hospital discharge be modified to reduce recurrent hospitalization?J Hosp Med.2007;2(5):297–304.
- ,,,,.The incidence and severity of adverse events affecting patients after discharge from the hospital.Ann Intern Med.2003;138(3):161–167.
- ,,,.Bouncing back: patterns and predictors of complicated transitions 30 days after hospitalization for acute ischemic stroke.J Am Geriatr Soc.2007;55(3):365–373.
- ,,,.Case finding for patients at risk of readmission to hospital: development of algorithm to identify high risk patients.BMJ.2006;333(7563):327.
- ,,,,,.Screening elders for risk of hospital admission.J Am Geriatr Soc.1993;41(8):811–817.
- ,,,.Using routine inpatient data to identify patients at risk of hospital readmission.BMC Health Serv Res.2009;9:96.
Within Medicare recipients, an astounding one in five medical patients (19.6%) is readmitted within 30 days, accounting for $15 billion in spending.1, 2 Amidst the current healthcare system crisis, reducing these hospital readmissions has risen to the highest priority. Reducing readmissions is the newest addition to multiple quality dashboards, both institutional and national, as a measure of the care delivered during hospitalization.3 One of the most notable of these reporting entities, Hospital Compare, now publicly reports Medicare readmission rates for a few common diagnoses.4 While Medicare already withholds payment to hospitals for readmissions within 24 hours for the same diagnosis, Medicare may soon reduce payment to hospitals with the highest rates of readmission within 30 days, a powerful incentive for hospitals to intervene. Readmissions have also reached the radar of additional stakeholders, even making its way onto Obama's budget considerations, given the potential cost savings to the system overall.5
To develop systems which reduce readmissions, one must first gain understanding of the characteristics of readmissions. A few clinical risk factors (such as age, number of prior admissions, and comorbidities) have been well defined in subgroups of general medicine inpatients.612 Likewise, interventions aiming to reduce readmissions have also focused on subgroups, excluding a large portion of hospitalized patients (for example, non‐English speakers and younger patients).1320 Other data have been derived in veterans or within non‐US populations that have inherently different payer, race, ethnicity, and primary language composition, and may not be applicable outside those settings.7, 8, 10, 11, 21 Lastly, little is known regarding risk that may be associated with operational factors, such as weekend discharge or admission source. As a result, there are few data describing the clinical, operational, and demographic factors associated with readmission in a heterogeneous population of hospitalized general medicine patientsthe patient population of most generalists in the United States.
To understand the impact of a variety of risk factors in a diverse general medicine population, we evaluated the characteristics of readmitted patients in a large urban university medical center over a 2‐year period. We hypothesized that a number of clinical, operational, and sociodemographic factors would be associated with readmission.
Methods
Sites and Subjects
Our data were collected on general medicine patients during hospitalization between June 1, 2006 and May 31, 2008, at the University of California San Francisco. The University of California, San Francisco (UCSF) Medical Center is composed of Moffitt‐Long Hospital (a 400‐bed center) and UCSF‐Mount Zion Hospital (a 200‐bed facility) located in San Francisco, CA.
Medical patients at Moffitt‐Long Hospital are admitted to 1 of 8 medical teams composed of a resident, 1 to 2 interns, and 0 to 3 medical students, supervised by an attending physician who is most often a hospitalist. At Moffitt‐Long Hospital, housestaff write all orders and provide 24‐hour coverage to inpatients. Mount Zion medical patients are cared for by 1 of 2 teams and staffed by a hospitalist on each team who is responsible for all elements of care. Both services care for common inpatient diagnoses, as well as specialty‐associated diagnoses such as cancer, pneumonia, and chronic obstructive pulmonary disease (COPD). Of note, at Moffitt‐Long Hospital, those patients with primary cardiac diagnoses are cared for by a separate team composed of housestaff and students supervised by a cardiologist.
The discharge process at both sites utilizes a multidisciplinary teamincluding physicians, case managers, nurses, pharmacists, and discharge coordinatorsworking in concert. Key components include arranging follow‐up care, faxing the discharge summary to the primary care provider, and educating the patient and caregivers, especially regarding medications. While these goals are clearly delineated, significant variability exists in how these tasks are actually accomplished. The multidisciplinary approach, components of the discharge process, and lack of a systematic approach are representative of the discharge process around the country.22
Data
Data regarding patient demographics, age, comorbidities, and insurance status were collected from administrative data systems at UCSF, reflecting the patient's status at the time of index admission. These same systems were used to collect a date‐stamped log of all medications (eg, anticoagulants) for which the patient was billed during the last 48 hours of hospitalization. Specifically, data were obtained for medications previously shown to cause adverse drug events following hospital discharge.23, 24 These medication groups include corticosteroids, anticoagulants, antibiotics, narcotics, nonsteroidal anti‐inflammatory drugs (NSAIDs), cardiovascular medications, antiepileptics, anticholinergics, antidepressants, and antidiabetics. Operational factors that we hypothesized would affect readmission risk included admission source, discharge disposition, and weekday vs. weekend discharge. Case management, social work, and pharmacy services operate with limited staffing on weekends. Likewise, resident and intern physicians are more likely to be off on a weekend day than a weekday; covering attending physicians care for about half of patients during the weekend. Data were obtained from Transition Systems International (TSI, Boston, MA) administrative databases, a cost‐accounting system that collects data abstracted from patient charts upon discharge from UCSF.
Definition of Readmission Measure
Using TSI, we detected readmission to UCSF by screening for any inpatient encounters on any service (not just medicine) within the 30 days following discharge from the general medicine service at the 2 UCSF campuses. We excluded elective readmissions, such as for scheduled chemotherapy. Patients who died at the index admission were excluded from the cohort.
Adjustment Variables
Age, gender, payer status and APR risk of mortality (3M Health Information Systems, St. Paul, MN) were collected from administrative data. The All Patient Refined (APR) risk of mortality is the all patients risk of mortality score developed by 3M which divides patients into 4 subclasses of risk based on clinical problems and comorbidities.25 We used secondary diagnosis codes in administrative data to classify comorbidities using the method of Elixhauser.26
Using the log of medication charges, we grouped high‐risk medications according to the classification scheme of Forster et al.23 and Hanlon et al.24 We then created a count representing the total number of medications administered to patients within the final 48 hours of stay.
Analysis
We first described study patients and hospitals using univariable methods. Multivariable generalized estimating equations (SAS PROC GENMOD) were used to account for clustering of patients within physicians and calculate adjusted odds ratios (ORs). As there were 2 sites within UCSF Medical Center (Moffitt‐Long and Mount Zion hospitals), we included site as a fixed effect in our model. Models were constructed using manual variable selection methods with final selection being made based on whether the covariate was associated with readmission at P < 0.05. All analyses were carried out using SAS version 9.2 (SAS Institute, Inc. Cary, NC).
Results
Baseline Characteristics
During the 2‐year accrual period, 295 attending physicians admitted 6805 unique patients for a total of 10,359 admissions. Seventeen percent of these 10,359 admissions were readmitted within 30 days. The cohort of all patients had a mean age of 59.6 years 19.5 standard deviation (SD), with 52.8% women. The mean length of stay was 5.6 days 10.4 SD. Medicare was the payer source for approximately half of the admissions. The majority of admissions (90.4%) were billed for at least 1 high risk medication, with narcotics, cardiac medications, and antibiotics being the most common. Regarding disposition, 79.5% of admissions were discharged to home; 9.1% were discharged to a skilled nursing facility (SNF).
Baseline sociodemographic, operational, and clinical characteristics for patients readmitted and not readmitted are shown in Table 1. Demographic characteristics with significant differences (P < 0.05) between readmitted and nonreadmitted groups included mean age, race, payer status, and primary language other than English. Regarding operational characteristics, readmitted patients had a higher median length of stay and were more likely to be admitted through the emergency room during their index admission. Discharge to an SNF was higher in the readmitted group versus the nonreadmitted group (9.7% vs. 9.0%). Several clinical factors were more prevalent in the readmitted group: high‐risk medications, specifically steroids, narcotics, and cardiovascular medications; high‐risk medication count of 3 or greater; and comorbidities including congestive heart failure, renal disease, cancer, anemia, and depression.
| Characteristic | Patients Readmitted (n = 1762 17.0%), n (%) | Patients Not Readmitted (n = 8597 83.0%), n (%) | P Value |
|---|---|---|---|
| |||
| Mean age (years) (SD) | 58.8 (19.3) | 59.8 (19.6) | 0.0491 |
| Female | 930 (52.8) | 4548 (52.9) | 0.9260 |
| Race* | |||
| White | 785 (44.6) | 4166 (48.8) | <0.0001 |
| Black | 442 (25.1) | 1401 (16.4) | |
| Asian | 323 (18.4) | 1726 (20.2) | |
| Other | 209 (11.9) | 1240 (14.5) | |
| Hispanic ethnicity | 140 (8.1) | 734 (8.9) | 0.2737 |
| Payer status | |||
| Medicare | 905 (51.4) | 4266 (49.6) | <0.0001 |
| Medicaid/Medi‐cal | 458 (26.0) | 1578 (18.4) | |
| Private | 370 (21.0) | 2092 (24.3) | |
| Other | 29 (1.7) | 661 (7.7) | |
| Primary language other than English | 242 (17.1) | 1394 (19.5) | 0.0359 |
| Median length of stay (days) (interquartile range) | 4 (2, 7) | 3 (2, 6) | <0.0001 |
| Admit source | |||
| Emergency room | 1506 (85.5) | 6898 (80.2) | <0.0001 |
| Outside hospital | 38 (2.2) | 271 (3.2) | |
| Direct admission/other (jail) | 218 (12.4) | 1428 (16.6) | |
| Discharge to | |||
| Home | 1461 (82.9) | 6773 (78.8) | <0.0001 |
| SNF | 170 (9.7) | 774 (9.0) | |
| Other | 131 (7.4) | 1050 (12.2) | |
| Discharged on weekend | 381 (21.6) | 1904 (22.1) | 0.6288 |
| Patient medications | |||
| Any high‐risk medication | 1679 (95.3) | 7684 (89.4) | <0.0001 |
| High‐risk medication count | |||
| 02 | 577 (32.8) | 3666 (42.6) | <0.0001 |
| 34 | 692 (39.3) | 2968 (34.5) | |
| 5 | 493 (28) | 1963 (22.8) | |
| Any corticosteroids | 399 (22.6) | 1571 (18.3) | <0.0001 |
| Anticoagulant | 120 (6.8) | 559 (6.5) | 0.6340 |
| Any antibiotic | 904 (51.3) | 4203 (48.9) | 0.0646 |
| Any narcotic | 1036 (58.8) | 4206 (48.9) | <0.0001 |
| Any NSAID | 68 (3.9) | 320 (3.7) | 0.7826 |
| Any cardiovascular med | 887 (50.3) | 3806 (44.3) | <0.0001 |
| Any antiepileptic | 93 (5.3) | 470 (5.5) | 0.7500 |
| Any anticholinergic | 47 (2.7) | 354 (4.1) | 0.0040 |
| Any antidepressant | 455 (25.8) | 1863 (25.8) | 0.0001 |
| Any antidiabetic | 198 (11.2) | 994 (11.6) | 0.6970 |
| Elixhauser comorbidities | |||
| Congestive heart failure | 219 (12.4) | 795 (9.3) | <0.0001 |
| Pulmonary circulation disease | 72 (4.1) | 178 (2.1) | <0.0001 |
| Peripheral vascular disease | 84 (4.8) | 331 (3.9) | 0.0737 |
| Hypertension | 745 (42.3) | 3741 (43.5) | 0.3411 |
| Other neurological disease | 101 (5.7) | 696 (8.1) | 0.0007 |
| Chronic pulmonary disease | 317 (18.0) | 1442 (16.8) | 0.2149 |
| Diabetes | 303 (17.2) | 1333 (15.5) | 0.0762 |
| Renal failure | 339 (19.2) | 1286 (15.0) | <0.0001 |
| Liver disease | 188 (10.7) | 774 (9.0) | 0.0281 |
| Metastatic cancer | 160 (9.1) | 530 (6.2) | <0.0001 |
| Solid tumor w/o metastases | 100 (5.7) | 277 (3.2) | <0.0001 |
| Rheumatoid arthritis/collagen vas | 81 (4.6) | 303 (3.5) | 0.0299 |
| Weight loss | 153 (8.7) | 584 (6.8) | 0.0449 |
| Deficiency anemia | 522 (29.6) | 1979 (23.0) | <0.0001 |
| Alcohol abuse | 101 (5.7) | 428 (5.0) | 0.1905 |
| Drug abuse | 148 (8.4) | 619 (7.2) | 0.0798 |
| Depression | 244 (13.9) | 963 (11.2) | 0.0016 |
| APR risk of mortality | |||
| 1 | 451 (25.6) | 3101 (36.1) | <0.0001 |
| 2 | 619 (35.1) | 2797 (32.5) | |
| 3 | 536 (30.4) | 1907 (22.2) | |
| 4 | 156 (8.9) | 792 (9.2) | |
Frequency of Readmission
The 30‐day readmission rate was 17.0% (1762 patients), with 49.7% (875 patients) of the readmissions occurring within 10 days of discharge. Of patients readmitted, the general medicine service was the readmitting team in 78.2%. A quarter of readmissions (26.2%) had the same primary diagnosis on initial and repeat admission.
Factors Associated With Readmission
Factors associated with readmission were categorized as sociodemographic, operational, and clinical. Factors associated with readmission with P < 0.05 and present in at least 5% of admissions are presented in Table 2. Of the sociodemographic factors, black race was significantly associated with readmission. Within the Medicare cohort, risk for readmission was similar for white vs. nonwhite race, with relative risk of 1.0 (95% confidence interval [CI], 0.86‐1.18). Medicaid as payer status was significantly associated in the unadjusted model, and in the adjusted model showed a trend toward readmission. Mean age was significantly different in the readmitted and nonreadmitted groups, but the difference was small (1.0 year). Moreover, when we evaluated age in 5‐year categories (ex. 65‐70, 71‐75, etc.), age was not associated with readmission. In the adjusted model, none of the operational factors were significantly associated with readmission, including discharge to SNF, weekend discharge, or admit source.
| Covariate | Unadjusted OR (95% CI) | Adjusted OR (95% CI) |
|---|---|---|
| ||
| Age | 1.00 (0.991.00) | 1.00 (0.991.00) |
| Race | ||
| White | Referent | Referent |
| Black | 1.67 (1.471.91) | 1.43 (1.241.65) |
| Asian | 0.99 (0.861.14) | 0.95 (0.821.11) |
| Other | 0.89 (0.761.06) | 0.84 (0.671.06) |
| Payer | ||
| Medicare | Referent | Referent |
| Medicaid/medical | 1.37 (1.211.55) | 1.15 (0.971.36) |
| Private | 0.83 (0.730.95) | 0.78 (0.650.95) |
| Other | 0.21 (0.140.30) | 0.23 (0.110.45) |
| Disposition | ||
| To home | Referent | Referent |
| SNF | 1.02 (0.851.21) | 0.98 (0.821.18) |
| Other | 0.58 (0.480.70) | 0.53 (0.430.66) |
| Highrisk medications | ||
| Corticosteroids | 1.31 (1.161.48) | 1.24 (1.091.42) |
| Narcotics | 1.49 (1.341.65) | 1.33 (1.161.53) |
| Anticholinergics | 0.64 (0.470.87) | 0.66 (0.480.90) |
| Comorbidities | ||
| Congestive heart failure | 1.39 (1.191.63) | 1.30 (1.091.56) |
| Neurological disorders | 0.69 (0.560.86) | 0.70 (0.570.87) |
| Renal failure | 1.35 (1.191.55) | 1.19 (1.051.36) |
| Metastatic cancer | 1.52 (1.261.83) | 1.61 (1.331.95) |
| Solid tumor w/o metastasis | 1.81 (1.432.29) | 1.95 (1.542.47) |
| Deficiency anemia | 1.41 (1.261.58) | 1.27 (1.131.44) |
| Weight loss | 1.30 (1.081.57) | 1.26 (1.091.47) |
Of the clinical factors, high‐risk medications and 6 comorbidities were associated with readmission. High‐risk medication categories associated with readmission were steroids and narcotics; anticholinergics medications were protective. The 6 comorbidities associated with readmission were congestive heart failure, renal disease, cancer (with and without metastasis), weight loss, and iron deficiency anemia. While APR risk of mortality was associated with readmission at P < 0.05, including APR in our final model did not alter which other factors were significantly associated with readmission. When site (Moffitt‐Long vs. Mount Zion Hospitals) was added to the model, the ORs for factors associated with readmission did not change appreciably (0.01).
Discussion
In this retrospective observational study of hospitalized patients, we found that readmission was common and associated with a number of risk factors that could be easily identified early in hospitalization. Nonclinical factors associated with readmission were black race and Medicaid payer status (in the unadjusted model). Clinical factors were high risk medications including steroids and narcotics; and comorbidities including congestive heart failure, renal disease, cancer, anemia, and weight loss. In contrast, other potential riskssuch as discharge on a weekend and discharge to an SNFwere not independently associated with readmission. This cohortwith a mix of clinical scenarios, payers, age, etc.represents the inherently heterogeneous population of inpatient general medicine across the country and abroad. Hospitalists provided care for over 65% of the general medicine service, again representative of the trend in US inpatient medicine.27, 28 Lastly, our cohort did not have the benefit of a systematic and consistent discharge process with interventions focused on reducing readmissions. This gap, which is common across hospitals, highlights the utility of this data in targeting quality improvement efforts.
Reducing risks for readmission requires identification of patient populations at highest risk; in those patients, one can further identify factors which are potentially modifiable via education or patient‐engagement interventions. While in the hospital, more intensive predischarge counseling and efforts to increase mobility may be most useful if targeted early and often on those at highest risk.15, 16, 29, 30 Finally, broader‐based support in the form of better home services, more access to longitudinal care, or targeted postdischarge efforts may be required.14, 31
Though current strategies focus largely on clinical risk factors, this study shows that nonclinical factors play an equally important but underappreciated role in contributing to readmission. While prior studies have shown variable results on association of black race with readmission,2, 9, 11 none have evaluated or linked Medicaid to readmission, which just missed statistical significance in this study (OR, 1.15; 95% CI, 0.971.36). Both black race and Medicaid as payer are proxies for the underlying root cause aspects leading to readmission, such as access to longitudinal care. Following this trail to the root cause will require in‐depth qualitative evaluation that includes the patient perspective as a source of data.32 For example, risk for readmission may not stem solely from being on warfarin, but in combination with not having transportation to get an international normalized ratio (INR) checked, a suboptimal understanding of how to take the medication, or not recognizing potential side effects until too late to avoid inpatient admission.
Several of the strongest associations, and perhaps most conducive to targeted interventions, were high‐risk medications at discharge. Risk related to medications and adverse drug events following discharge have been a consistent theme in readmission literature.24, 33 Our current system, which includes mandated inpatient medicine reconciliation, does not encourage discontinuation of unnecessary medications to combat polypharmacy, address affordability of medications, provide consistent medication counseling, or focus on the highest risk medications. In fact, bundled interventions which implement pharmacists to focus on these measures have been successful in decreasing readmission,14, 16, 29 but unfortunately are not yet part of the standard of care. The challenge remains transforming a mandatory policy such as medicine reconciliation into a valuable and systematic tool in the discharge process.
Two factors were surprisingly protective against readmission: neurologic diagnosis and anticholinergic medications. This first may be explained by the presence of a separate neurology service at our institution which skews our data. For example, a patient with acute stroke, who has a 20% rate of bounce‐back to a higher level of care within 30 days of discharge,34 would be admitted to the neurology service, not general medicine, and therefore would not nr part of our cohort. Regarding anticholinergics, several factors may explain this unexpected result. First, use of anticholinergics was relatively rare in our sample (2.7% in readmitted patients, 4.1% in patients not readmitted), possibly creating a false positive result. Second, Hanlon et al.24 showed only a weak association at best between anticholinergics and postdischarge adverse drug reactions (hazard ratio, 1.11; 95% CI, 0.86‐1.43). Lastly, anticholinergics include a varied group of medications, therefore diluting possible relative risk of specific medications.
While this study allows providers to identify patients at increased risk of readmission, the identified factors do not fully account for readmission risk; we did not aim to produce a risk‐prediction rule with our study. Prior readmission studies have been unable to create a tool to predict which patients will be readmitted with much success.3537 These results underscore the complexities and variability of readmission, which often lack a clear single cause and effect relationship. Given the breadth of risk factors we identified, it seems likely that more intensive interventions will require a multidisciplinary approach, one which might be costly if applied broadly. Our study does not attempt to predict who will be readmitted and who will not, but rather provides a list of risk factors which might be used to deploy resources more efficiently.
This study had several limitations. We did not capture readmissions to outside hospitals, which account for 22% to 24% of all readmissions in prior studies, and therefore have underestimated the readmission rate in our population.2, 8 However, by limiting our data to 2 hospitals within 1 institution, we were able to include more detailed patient level data, which is not accurately available in other large databases. Also, while studies of risk factors in a managed care population (such as within Medicare, the Veterans Affairs medical centers, or countries with national integrated medical records) are able to capture all readmissions, this study is the first to evaluate readmissions risk factors in a truly heterogeneous U.S. inpatient medicine population without limitation by age or payer status. Second, we did not have access to outpatient medications lists; however use of these same medications within the last 48 hours of admission is likely a reasonable proxy for outpatient use and more conducive to potential interventions (such as medication reconciliation or patient education) that could flag patients prior to discharge. Payer data was limited to only the primary payer, so patients who were dual eligible (ie, have both Medicare and Medicaid) were categorized as Medicare. Regarding sociodemographic factors, while primary language other than English was not associated with readmission, language data was missing in 17.4% of admissions, thereby limiting our ability to evaluate this factor. Our data did not include access to outpatient or primary care, and therefore we were unable to evaluate access to postdischarge follow‐up care as a risk factor for readmission. Lastly, while this study did not include outpatient deaths, we did exclude patients who died in the hospital.
Conclusions
Readmission is common among general medicine patients, with approximately 1 in 5 patients being readmitted within 30 days. While the identified associated factors do not account for all the potential reasons for readmission, our study suggests a spectrum of risk factors which might be used to target more intensive multidisciplinary interventions. Specifically, the nonclinical factors of race and payer status merit further in depth research incorporating the patient experience to truly determine causation of readmission. Hospitalists, who are at nexus of the discharge process and uniquely invested in quality inpatient care, are ideally positioned to lead efforts to reduce readmissions. How to use our study's results to develop and implement effective interventions to reduce readmissions remains a subject for future studies.
- A path to bundled payment around a rehospitalization.: Medicare payment Advisory Commission; June2005.
- ,,.Rehospitalizations among patients in the Medicare fee‐for‐service program.N Engl J Med.2009;360(14):1418–1428.
- University HealthSystem Consortium. Available at: https://www.uhc.edu. Accessed May2010.
- U.S. Department of Health 15(5):599–606.
- ,,,.Development and validation of a model for predicting emergency admissions over the next year (PEONY): a UK historical cohort study.Arch Intern Med.2008;168(13):1416–1422.
- ,,, et al.Incidence and main factors associated with early unplanned hospital readmission among French medical inpatients aged 75 and over admitted through emergency units.Age Ageing.2008;37(4):416–422.
- ,,,,,.Factors associated with unplanned hospital readmission among patients 65 years of age and older in a Medicare managed care plan.Am J Med.1999;107(1):13–17.
- ,,.Risk factors for early unplanned hospital readmission in the elderly.J Gen Intern Med.1991;6(3):223–228.
- ,,, et al.Predicting non‐elective hospital readmissions: a multi‐site study. Department of Veterans Affairs Cooperative Study Group on Primary Care and Readmissions.J Clin Epidemiol.2000;53(11):1113–1118.
- ,.Effect of gender, ethnicity, pulmonary disease, and symptom stability on rehospitalization in patients with heart failure.Am J Cardiol.2007;100(7):1139–1144.
- ,,,.The care transitions intervention: results of a randomized controlled trial.Arch Intern Med.2006;166(17):1822–1828.
- ,,,.The impact of follow‐up telephone calls to patients after hospitalization.Am J Med.2001;111(9B):26S–30S.
- ,,, et al.A reengineered hospital discharge program to decrease rehospitalization: a randomized trial.Ann Intern Med.2009;150(3):178–187.
- ,,, et al.Reduction of 30‐day postdischarge hospital readmission or emergency department (ED) visit rates in high‐risk elderly medical patients through delivery of a targeted care bundle.J Hosp Med.2009;4(4):211–218.
- ,,,,,.Comprehensive discharge planning with postdischarge support for older patients with congestive heart failure: a meta‐analysis.JAMA.2004;291(11):1358–1367.
- ,.Home‐based intervention in congestive heart failure: long‐term implications on readmission and survival.Circulation.2002;105(24):2861–2866.
- ,,,,,.Effect of a standardized nurse case‐management telephone intervention on resource use in patients with chronic heart failure.Arch Intern Med.2002;162(6):705–712.
- ,,,.The impact of follow‐up physician visits on emergency readmissions for patients with asthma and chronic obstructive pulmonary disease: a population‐based study.Am J Med.2002;112(2):120–125.
- ,.Factors predicting readmission of older general medicine patients.J Gen Intern Med.1991;6(5):389–393.
- BOOSTing Care Transitions. Available at: http://www.hospitalmedicine.org/ResourceRoomRedesign/RR_CareTransitions/CT_Home.cfm. Accessed May2010.
- ,,,,.Adverse drug events occurring following hospital discharge.J Gen Intern Med.2005;20(4):317–323.
- ,,, et al.Incidence and predictors of all and preventable adverse drug reactions in frail elderly persons after hospital stay.J Gerontol A Biol Sci Med Sci.2006;61(5):511–515.
- . Development of the 3M™ All Patient Refined Diagnosis Related Groups (APR DRGs). Available at: http://www.ahrq.gov/qual/mortality/Hughes.htm. Accessed May2010.
- ,,.Volume thresholds and hospital characteristics in the United States.Health Aff (Millwood).2003;22(2):167–177.
- ,,,.The status of hospital medicine groups in the United States.J Hosp Med.2006;1(2):75–80.
- ,,,.Growth in the care of older patients by hospitalists in the United States.N Engl J Med.2009;360(11):1102–1112.
- ,,, et al.Role of pharmacist counseling in preventing adverse drug events after hospitalization.Arch Intern Med.2006;166(5):565–571.
- ,,, et al.Effects of a multicomponent intervention on functional outcomes and process of care in hospitalized older patients: a randomized controlled trial of Acute Care for Elders (ACE) in a community hospital.J Am Geriatr Soc.2000;48(12):1572–1581.
- ,,,,,.Telehome monitoring in patients with cardiac disease who are at high risk of readmission.Heart Lung.2008;37(1):36–45.
- ,,.Understanding rehospitalization risk: can hospital discharge be modified to reduce recurrent hospitalization?J Hosp Med.2007;2(5):297–304.
- ,,,,.The incidence and severity of adverse events affecting patients after discharge from the hospital.Ann Intern Med.2003;138(3):161–167.
- ,,,.Bouncing back: patterns and predictors of complicated transitions 30 days after hospitalization for acute ischemic stroke.J Am Geriatr Soc.2007;55(3):365–373.
- ,,,.Case finding for patients at risk of readmission to hospital: development of algorithm to identify high risk patients.BMJ.2006;333(7563):327.
- ,,,,,.Screening elders for risk of hospital admission.J Am Geriatr Soc.1993;41(8):811–817.
- ,,,.Using routine inpatient data to identify patients at risk of hospital readmission.BMC Health Serv Res.2009;9:96.
Copyright © 2010 Society of Hospital Medicine