User login
Do group visits improve HbA1c more than individual visits in patients with T2DM?
EVIDENCE SUMMARY
A 2012 systematic review of 21 RCTs examined the effect of group-based diabetes education on HbA1c in 2833 adults with T2DM.1 Intervention groups participated in at least 1 group session lasting an hour led by a health professional or team (eg, physician, nurse, diabetes educator); controls received usual care. Most trials involved 6 to 20 hours of group-based education delivered over 1 to 10 months, although some trials continued the intervention for as long as 24 months. The mean HbA1c at baseline across all patients was 8.23%.
Professional-led group visitsimprove HbA1c
Group education resulted in a significant reduction in HbA1c compared with controls at 6 months (13 trials; 1883 patients; mean difference [MD]=−0.44%; 95% confidence interval [CI], −0.69 to −0.19), 12 months (11 studies; 1503 patients; MD=−0.46%; 95% CI, −0.74 to −0.18), and 24 months (3 studies; 397 patients; MD=−0.87%; 95% CI, −1.25 to −0.49). The trials had high heterogeneity, except for the 3 trials with a 24-month end-point (I2 = 0). Most studies had a moderate or high risk of bias.
A larger 2017 meta-analysis enrolling 8533 adults with T2DM came to similar conclusions, although it included a small number of nonrandomized trials (40 RCTs, 3 cluster RCTs, and 4 controlled clinical trials).2 Thirteen of the RCTs overlapped with the previously described systematic review.1 Interventions had to include at least 1 group session with 4 or more adult patients lasting at least 1 hour. In most studies, interventions continued between 4 and 12 months, although some ran 60 months. Controls received usual care. The mean HbA1c at baseline across all patients was 8.3%.
Group-based education compared with controls reduced HbA1c at 6 to 10 months (30 trials, N not given; MD=−0.3%; 95% CI, −0.48 to −0.15), 12 to 14 months (27 trials, N not given; MD=−0.3%; 95% CI, −0.49 to −0.17), and 36 to 48 months (5 trials, N not given; MD=−0.9%; 95% CI, −1.52 to −0.34). In a subgroup analysis, peer-led group visits had no effect (5 trials, 1066 patients; MD=−0.02%; 95% CI, −0.12 to 0.16).
Patients on oral agents alone showed a larger benefit than patients using insulin (38 trials, 5871 patients; −0.81 vs −0.19; P < .0001). Authors of the meta-analysis classified most studies as having a moderate to high risk of bias, with only 4 having low risk.
Duration of intervention: Longer is better for HbA1c values
Another systematic review analyzed 13 RCTs with 4652 patients 16 years and older with T2DM or type 1 diabetes to assess the effect of group visits on HbA1c.3 The review excluded studies that didn’t include a health care provider who could prescribe, diagnose, assess, and refer patients when appropriate.
Most interventions ran 3 to 12 months, although one lasted 36 months. (Two RCTs overlapped with the 2012 review, and 2 others with the 2017 review.) Group medical visits resulted in a significant decrease in HbA1c at the end of the intervention period (MD=−0.46%; 95% CI, −0.80 to −0.13) compared with controls. A meta-regression analysis suggested that ongoing treatment (for as long as 3 years) decreased HbA1c more than a shorter treatment duration (by 0.25% per year of treatment), whereas the frequency of treatments didn’t alter the effect. Overall, the trials were heterogenous and most had a high risk of bias.
Continue to: RECOMMENDATIONS
RECOMMENDATIONS
The 2015 National Institute for Health and Care Excellence guideline for the management of T2DM in adults calls group education programs “the preferred option” for diabetes education, suggesting that clinicians reserve individual education for patients unable or unwilling to participate in group programs.4
The 2017 diabetes self-management education and support policy endorsed by the American Diabetes Association recommends using interprofessional teams and “creative solutions” to increase patient engagement and endorses group meetings as an effective option for patients who choose them.5
Editor’s takeaway
Moderate-quality evidence demonstrates that group visits can significantly reduce HbA1c levels. We should consider them for our patients with diabetes who are willing to attend group sessions.
1. Steinsbekk A, Rygg LO, Lisulo M, et al. Group based diabetes self-management education compared to routine treatment for people with type 2 diabetes mellitus. a systematic review with meta-analysis. BMC Health Serv Res. 2012;12:213.
2. Odgers-Jewell K, Ball LE, Kelly JT, et al. Effectiveness of group-based self-management education for individuals with Type 2 diabetes: a systematic review with meta-analyses and meta-regression. Diabet Med. 2017;34:1027-1039.
3. Housden L, Wong ST, Dawes M. Effectiveness of group medical visits for improving diabetes care: a systematic review and meta-analysis. CMAJ. 2013;185:e635–e644.
4. National Institute for Health and Care Excellence. Type 2 diabetes in adults: management. NICE guideline [NG 28]. December 2015. Updated May 2017. https://www.nice.org.uk/guidance/ng28/chapter/1-Recommendations#individualised-care. Accessed January 24, 2020.
5. Beck J, Greenwood DA, Blanton L. et al. 2017 National standards for diabetes self-management, education and support. Diabetes Care. 2017; 40:1409–1419.
EVIDENCE SUMMARY
A 2012 systematic review of 21 RCTs examined the effect of group-based diabetes education on HbA1c in 2833 adults with T2DM.1 Intervention groups participated in at least 1 group session lasting an hour led by a health professional or team (eg, physician, nurse, diabetes educator); controls received usual care. Most trials involved 6 to 20 hours of group-based education delivered over 1 to 10 months, although some trials continued the intervention for as long as 24 months. The mean HbA1c at baseline across all patients was 8.23%.
Professional-led group visitsimprove HbA1c
Group education resulted in a significant reduction in HbA1c compared with controls at 6 months (13 trials; 1883 patients; mean difference [MD]=−0.44%; 95% confidence interval [CI], −0.69 to −0.19), 12 months (11 studies; 1503 patients; MD=−0.46%; 95% CI, −0.74 to −0.18), and 24 months (3 studies; 397 patients; MD=−0.87%; 95% CI, −1.25 to −0.49). The trials had high heterogeneity, except for the 3 trials with a 24-month end-point (I2 = 0). Most studies had a moderate or high risk of bias.
A larger 2017 meta-analysis enrolling 8533 adults with T2DM came to similar conclusions, although it included a small number of nonrandomized trials (40 RCTs, 3 cluster RCTs, and 4 controlled clinical trials).2 Thirteen of the RCTs overlapped with the previously described systematic review.1 Interventions had to include at least 1 group session with 4 or more adult patients lasting at least 1 hour. In most studies, interventions continued between 4 and 12 months, although some ran 60 months. Controls received usual care. The mean HbA1c at baseline across all patients was 8.3%.
Group-based education compared with controls reduced HbA1c at 6 to 10 months (30 trials, N not given; MD=−0.3%; 95% CI, −0.48 to −0.15), 12 to 14 months (27 trials, N not given; MD=−0.3%; 95% CI, −0.49 to −0.17), and 36 to 48 months (5 trials, N not given; MD=−0.9%; 95% CI, −1.52 to −0.34). In a subgroup analysis, peer-led group visits had no effect (5 trials, 1066 patients; MD=−0.02%; 95% CI, −0.12 to 0.16).
Patients on oral agents alone showed a larger benefit than patients using insulin (38 trials, 5871 patients; −0.81 vs −0.19; P < .0001). Authors of the meta-analysis classified most studies as having a moderate to high risk of bias, with only 4 having low risk.
Duration of intervention: Longer is better for HbA1c values
Another systematic review analyzed 13 RCTs with 4652 patients 16 years and older with T2DM or type 1 diabetes to assess the effect of group visits on HbA1c.3 The review excluded studies that didn’t include a health care provider who could prescribe, diagnose, assess, and refer patients when appropriate.
Most interventions ran 3 to 12 months, although one lasted 36 months. (Two RCTs overlapped with the 2012 review, and 2 others with the 2017 review.) Group medical visits resulted in a significant decrease in HbA1c at the end of the intervention period (MD=−0.46%; 95% CI, −0.80 to −0.13) compared with controls. A meta-regression analysis suggested that ongoing treatment (for as long as 3 years) decreased HbA1c more than a shorter treatment duration (by 0.25% per year of treatment), whereas the frequency of treatments didn’t alter the effect. Overall, the trials were heterogenous and most had a high risk of bias.
Continue to: RECOMMENDATIONS
RECOMMENDATIONS
The 2015 National Institute for Health and Care Excellence guideline for the management of T2DM in adults calls group education programs “the preferred option” for diabetes education, suggesting that clinicians reserve individual education for patients unable or unwilling to participate in group programs.4
The 2017 diabetes self-management education and support policy endorsed by the American Diabetes Association recommends using interprofessional teams and “creative solutions” to increase patient engagement and endorses group meetings as an effective option for patients who choose them.5
Editor’s takeaway
Moderate-quality evidence demonstrates that group visits can significantly reduce HbA1c levels. We should consider them for our patients with diabetes who are willing to attend group sessions.
1. Steinsbekk A, Rygg LO, Lisulo M, et al. Group based diabetes self-management education compared to routine treatment for people with type 2 diabetes mellitus. a systematic review with meta-analysis. BMC Health Serv Res. 2012;12:213.
2. Odgers-Jewell K, Ball LE, Kelly JT, et al. Effectiveness of group-based self-management education for individuals with Type 2 diabetes: a systematic review with meta-analyses and meta-regression. Diabet Med. 2017;34:1027-1039.
3. Housden L, Wong ST, Dawes M. Effectiveness of group medical visits for improving diabetes care: a systematic review and meta-analysis. CMAJ. 2013;185:e635–e644.
4. National Institute for Health and Care Excellence. Type 2 diabetes in adults: management. NICE guideline [NG 28]. December 2015. Updated May 2017. https://www.nice.org.uk/guidance/ng28/chapter/1-Recommendations#individualised-care. Accessed January 24, 2020.
5. Beck J, Greenwood DA, Blanton L. et al. 2017 National standards for diabetes self-management, education and support. Diabetes Care. 2017; 40:1409–1419.
EVIDENCE-BASED ANSWER:
Yes. In patients with type 2 diabetes mellitus (T2DM), group visits led by health professionals or teams improved glycosylated hemoglobin (HbA1c) by 0.3% to 0.9% over usual care (strength of recommendation [SOR]: B, meta-analyses of randomized clinical trials [RCTs] with moderate to high risk of bias).
Patients taking oral antidiabetic agents alone appear to benefit more than patients on insulin. Peer-led group visits likely have no effect (SOR: B, subgroup analysis within a meta-analysis).
Treatment durations as long as 3 years are associated with larger decreases in HbA1c (by 0.25% per year) than treatment lasting less than a year (SOR: B, meta-analysis of RCTs involving patents with type 1 diabetes and T2DM).
Patients with T2DM should be offered group visits for diabetes education when available (SOR: C, expert opinion).

Do statins alter the risk or progression of dementia?
EVIDENCE SUMMARY
A 2016 Cochrane systematic review identified 2 double-blind RCTs that evaluated statins for preventing cognitive decline and dementia in patients with either risk factors or a history of vascular disease.1 The authors couldn’t perform a meta-analysis because of heterogeneity.
Statins don’t prevent dementia
The first RCT found that 5804 patients (70-82 years old with pre-existing vascular disease or increased risk because of smoking, hypertension, or diabetes) manifested equivalent cognitive decline at 3.5 years after random assignment to pravastatin 40 mg/d or placebo.2 Investigators measured cognition with the Mini-Mental State Exam (MMSE), which scores cognitive function on a scale of 0 to 30, with higher numbers indicating better function (mean difference [MD] at follow-up=0.06 points; 95% confidence interval [CI], −0.04 to 0.16).
A second RCT evaluated simvastatin 40 mg/d or placebo for as long as 5 years in 20,536 patients 40 to 80 years of age with a history of coronary artery disease or diabetes.3 The study excluded patients with dementia at baseline. The odds of developing dementia didn’t differ between groups (odds ratio=1.0; 95% CI, 0.61-1.65).
Both studies were originally designed to measure cardiovascular outcomes. The authors rated both as high quality with a low risk of bias.
A contrast to earlier, lower-quality studies
These results contrast with an earlier meta-analysis based on one of the previously described RCTs and lower-quality evidence (16 cohort studies and 3 case-control studies) that found using statins to be associated with lower relative risk (RR) of dementia than not using a statin (all-type dementia RR=0.82; 95% CI, 0.69-0.97; Alzheimer’s disease RR=0.70; 95% CI, 0.60-0.83).3,4
The total patient population was more than 2 million and varied widely. Duration of statin use and type of statin (simvastatin, atorvastatin, fluvastatin, pravastatin, rosuvastatin) also varied. The authors noted potential bias in results for 2 reasons: Cross-sectional studies included patients with impaired cognition who were less likely to be prescribed statins, and statin use was determined by patient self-report.
Statins don’t treat dementia
A Cochrane review that included 4 RCTs with 1154 patients, 50 to 90 years old, assessed the effect of ≥6 months of statin therapy (atorvastatin 80 mg/d or simvastatin 40-80 mg/d) on the course of Alzheimer’s disease and vascular dementia.5 Most patients had mild to moderate dementia and most were also taking an anticholinesterase inhibitor.
Continue to: All studies reported...
All studies reported outcomes using the Alzheimer’s Disease Assessment Scale-Cognitive Subscale (ADAS-Cog), scored 0 to 70, with lower numbers indicating better function, and the MMSE. Results of statin use were equivalent to placebo (ADAS-Cog MD= −0.26; 95% CI, −1.05 to 0.52; MMSE MD= −0.32; 95% CI, −0.71 to 0.06).
But do they slow its progression?
In contrast, a case-control study of 6431 patients with mild-to-moderate Alzheimer’s disease concluded that statin use was associated with slower progression of AD.6 Using cholinesterase inhibitor discontinuation as a proxy for worsening dementia, researchers noted that patients with early statin exposure (719 patients) had a lower rate of cholinesterase discontinuation than patients who didn’t receive early statin therapy (RR=0.85; 95% CI, 0.76-0.95).
A 2016 systematic review attempted to identify randomized clinical trials evaluating the effects of statin withdrawal in dementia.7 None were found.
RECOMMENDATIONS
Based primarily on post-marketing surveillance data, the US Food and Drug Administration (FDA) has warned that memory loss and confusion are occasionally associated with statin use from within one day to several years of initiation.8 The FDA indicated that such symptoms are rare, not associated with dementia or clinically significant cognitive decline, and resolve with discontinuation of the medication.
1. McGuinness B, Craig D, Bullock R, et al. Statins for the prevention of dementia. Cochrane Database Syst Rev. 2016;(1):CD003160.
2. Trompet S, van Vliet P, de Craen AJ, et al. Pravastatin and cognitive function in the elderly. Results of the PROSPER study. J Neurol. 2010;257:85-90.
3. Heart Protection Study Collaborative Group. MRC/BHF Heart Protection Study of cholesterol lowering with simvastatin in 20,536 high-risk individuals: a randomised placebo-controlled trial. Lancet. 2002;360:7-22.
4. Wong WB, Lin VW, Boudreau D, et al. Statins in the prevention of dementia and Alzheimer’s disease: a meta-analysis of observational studies and an assessment of confounding. Pharmacoepidemiol Drug Saf. 2013;22:345-358.
5. McGuinness B, Craig D, Bullock R, et al. Statins for the treatment of dementia. Cochrane Database Syst Rev. 2014;(7):CD007514.
6. Lin FC, Chuang YS, Hsieh HM, et al. Early statin use and the progression of Alzheimer disease: a total population-based case-control study. Medicine. 2015;94:e2143.
7. McGuinness B, Cardwell CR, Passmore P. Statin withdrawal in people with dementia. Cochrane Database Syst Rev. 2016;(9):CD012050.
8. US Food and Drug Administration. FDA Drug Safety Communication: Important safety label changes to cholesterol-lowering statin drugs. Available at: www.fda.gov/Drugs/DrugSafety/ucm293101.htm. Accessed August 24, 2018.
EVIDENCE SUMMARY
A 2016 Cochrane systematic review identified 2 double-blind RCTs that evaluated statins for preventing cognitive decline and dementia in patients with either risk factors or a history of vascular disease.1 The authors couldn’t perform a meta-analysis because of heterogeneity.
Statins don’t prevent dementia
The first RCT found that 5804 patients (70-82 years old with pre-existing vascular disease or increased risk because of smoking, hypertension, or diabetes) manifested equivalent cognitive decline at 3.5 years after random assignment to pravastatin 40 mg/d or placebo.2 Investigators measured cognition with the Mini-Mental State Exam (MMSE), which scores cognitive function on a scale of 0 to 30, with higher numbers indicating better function (mean difference [MD] at follow-up=0.06 points; 95% confidence interval [CI], −0.04 to 0.16).
A second RCT evaluated simvastatin 40 mg/d or placebo for as long as 5 years in 20,536 patients 40 to 80 years of age with a history of coronary artery disease or diabetes.3 The study excluded patients with dementia at baseline. The odds of developing dementia didn’t differ between groups (odds ratio=1.0; 95% CI, 0.61-1.65).
Both studies were originally designed to measure cardiovascular outcomes. The authors rated both as high quality with a low risk of bias.
A contrast to earlier, lower-quality studies
These results contrast with an earlier meta-analysis based on one of the previously described RCTs and lower-quality evidence (16 cohort studies and 3 case-control studies) that found using statins to be associated with lower relative risk (RR) of dementia than not using a statin (all-type dementia RR=0.82; 95% CI, 0.69-0.97; Alzheimer’s disease RR=0.70; 95% CI, 0.60-0.83).3,4
The total patient population was more than 2 million and varied widely. Duration of statin use and type of statin (simvastatin, atorvastatin, fluvastatin, pravastatin, rosuvastatin) also varied. The authors noted potential bias in results for 2 reasons: Cross-sectional studies included patients with impaired cognition who were less likely to be prescribed statins, and statin use was determined by patient self-report.
Statins don’t treat dementia
A Cochrane review that included 4 RCTs with 1154 patients, 50 to 90 years old, assessed the effect of ≥6 months of statin therapy (atorvastatin 80 mg/d or simvastatin 40-80 mg/d) on the course of Alzheimer’s disease and vascular dementia.5 Most patients had mild to moderate dementia and most were also taking an anticholinesterase inhibitor.
Continue to: All studies reported...
All studies reported outcomes using the Alzheimer’s Disease Assessment Scale-Cognitive Subscale (ADAS-Cog), scored 0 to 70, with lower numbers indicating better function, and the MMSE. Results of statin use were equivalent to placebo (ADAS-Cog MD= −0.26; 95% CI, −1.05 to 0.52; MMSE MD= −0.32; 95% CI, −0.71 to 0.06).
But do they slow its progression?
In contrast, a case-control study of 6431 patients with mild-to-moderate Alzheimer’s disease concluded that statin use was associated with slower progression of AD.6 Using cholinesterase inhibitor discontinuation as a proxy for worsening dementia, researchers noted that patients with early statin exposure (719 patients) had a lower rate of cholinesterase discontinuation than patients who didn’t receive early statin therapy (RR=0.85; 95% CI, 0.76-0.95).
A 2016 systematic review attempted to identify randomized clinical trials evaluating the effects of statin withdrawal in dementia.7 None were found.
RECOMMENDATIONS
Based primarily on post-marketing surveillance data, the US Food and Drug Administration (FDA) has warned that memory loss and confusion are occasionally associated with statin use from within one day to several years of initiation.8 The FDA indicated that such symptoms are rare, not associated with dementia or clinically significant cognitive decline, and resolve with discontinuation of the medication.
1. McGuinness B, Craig D, Bullock R, et al. Statins for the prevention of dementia. Cochrane Database Syst Rev. 2016;(1):CD003160.
2. Trompet S, van Vliet P, de Craen AJ, et al. Pravastatin and cognitive function in the elderly. Results of the PROSPER study. J Neurol. 2010;257:85-90.
3. Heart Protection Study Collaborative Group. MRC/BHF Heart Protection Study of cholesterol lowering with simvastatin in 20,536 high-risk individuals: a randomised placebo-controlled trial. Lancet. 2002;360:7-22.
4. Wong WB, Lin VW, Boudreau D, et al. Statins in the prevention of dementia and Alzheimer’s disease: a meta-analysis of observational studies and an assessment of confounding. Pharmacoepidemiol Drug Saf. 2013;22:345-358.
5. McGuinness B, Craig D, Bullock R, et al. Statins for the treatment of dementia. Cochrane Database Syst Rev. 2014;(7):CD007514.
6. Lin FC, Chuang YS, Hsieh HM, et al. Early statin use and the progression of Alzheimer disease: a total population-based case-control study. Medicine. 2015;94:e2143.
7. McGuinness B, Cardwell CR, Passmore P. Statin withdrawal in people with dementia. Cochrane Database Syst Rev. 2016;(9):CD012050.
8. US Food and Drug Administration. FDA Drug Safety Communication: Important safety label changes to cholesterol-lowering statin drugs. Available at: www.fda.gov/Drugs/DrugSafety/ucm293101.htm. Accessed August 24, 2018.
EVIDENCE-BASED SUMMARY:
Neither moderate- nor high-intensity statin therapy (with simvastatin or atorvastatin, respectively) improves existing mild to moderately severe Alzheimer’s or vascular dementia (SOR: A, RCTs).
Although statin use is associated with a mild, rare, reversible delirium, it isn’t linked to permanent cognitive decline (SOR: C, expert opinion).

Does breastfeeding affect the risk of childhood obesity?
EVIDENCE SUMMARY
A systematic review and meta-analysis of prospective cohort studies evaluating infant risk factors for childhood obesity found that breastfeeding was associated with a lower risk of obesity.1 The authors identified 10 trials (primarily from the United States and Europe) with more than 76,000 infants that compared the effect of some breastfeeding in the first year to no breastfeeding. Follow-up ranged from 2 to 14 years (median 6 years).
Having ever breastfed decreased the odds of future overweight (BMI >85th percentile) or obesity (BMI >95th percentile) by 15% (adjusted odds ratio [AOR]=0.85; 95% confidence interval [CI], 0.74-0.99).
Subsequent studies suggest increased risk with formula feeding
Three large, prospective, longitudinal cohort studies have been published since the meta-analysis. One, which followed 43,367 term infants in Japan, found that formula feeding before 6 months was associated with increased risk of obesity compared with continuous breastfeeding for 6 months.2 Researchers evaluated weight at 7 years and adjusted for child and maternal factors associated with weight gain (AOR for obesity, formula-fed infants=1.8; 95% CI, 1.3-2.6).
A similar prospective longitudinal cohort study of 2868 infants in Australia analyzed maternal breastfeeding diaries and followed children’s weight to age 20 years.3 Introducing a milk other than breast milk before 6 months of age was linked to increased risk of obesity at age 20 (odds ratio [OR]=1.5; 95% CI, 1.1-1.9).
Finally, in a prospective cohort of 568 children in India, 17% of children who breastfed for fewer than 6 months were above the 90th percentile for weight at age 5 years, compared with 10% of children who were breastfed for at least 18 months.4 The result didn’t reach statistical significance, however (P=.08).
Interventions that increase breastfeeding don’t seem to have an impact
An RCT of an intervention to promote breastfeeding didn’t find any effect on subsequent obesity rates. Researchers in Belarus randomized 17,046 mother-infant pairs to breastfeeding promotion, modeled on the UNICEF Baby-Friendly Hospital Initiative, or usual care. The intervention increased the prevalence of exclusive breastfeeding (at 3 months, 43% vs 6%; at 6 months, 7% vs 0.6%; P values not given).
When researchers evaluated 13,879 children at 11 or 12 years by intention-to-treat analysis, however, they found no difference in mean BMI between the children whose mothers received the intervention and those whose mothers didn’t (BMI difference=0.16; 95% CI, -0.02 to 0.35).5
Introduction of solid foods: Later is better
A systematic review investigated the association between the timing of introducing complementary (solid) foods and childhood obesity in 23 primarily cross-sectional and cohort studies (17 from the United States, Canada, and Europe) with more than 33,000 patients. Follow-up ranged from 4 to 19 years.
Eight of the 21 studies that used BMI as an outcome found that early introduction of complementary foods was associated with a higher childhood BMI. In the largest study (a cohort of 17,561 infants), introducing complementary foods before 3 months was associated with higher risk of obesity at age 5 years than introducing them thereafter (OR=1.3; 95% CI, 1.1-1.6).6 Introduction of solids after 4 months was not associated with childhood obesity.
A systematic review of 10 primarily cross-sectional and cohort studies with more than 3000 infants evaluated associations between the types of complementary foods given and the development of childhood obesity.7 Six of the 10 studies were from Europe and none were from the United States. Follow-up ages ranged from 4 to 11 years.
Outcomes were heterogeneous, and no meta-analysis could be performed. The authors cited 3 studies (total 1174 infants) that found various positive associations between total caloric intake during complementary feeding and childhood obesity. No consistent evidence pointed to increased risk from specific foods or food groups.
Scheduled feeding is linked to rapid infant weight gain
A cohort study evaluated the baseline data of an Australian RCT (on an intervention to promote proper nutrition) in 612 infants, mean age 4.3 months.8 Researchers looked at the relationship between feeding on demand vs scheduled feeding (assessed by parental report) and weight gain in infancy. “Rapid weight gain” was defined as >0.67 change in weight-for-age Z-score between birth and enrollment.
Scheduled feeding was associated with rapid weight gain at a higher rate than feeding on demand (OR=2.3; 95% CI, 1.1-4.6). This study didn’t use childhood obesity as an outcome.
1. Weng SF, Redsell SA, Swift JA, et al. Systematic review and meta-analyses of risk factors for childhood overweight identifiable during infancy. Arch Dis Child. 2012;97:1019-1026.
2. Yamakawa M, Yorifuji T, Inoue S, et al. Breastfeeding and obesity among schoolchildren: a national longitudinal survey in Japan. JAMA Pediatr. 2013;167:919-925.
3. Oddy WH, Mari TA, Huang RC, et al. Early infant feeding and adiposity risk: from infancy to adulthood. Ann Nutr Metab. 2014;64:262-270.
4. Caleyachetty A, Krishnaveni GV, Veena SR, et al. Breast-feeding duration, age of starting solids, and high BMI risk and adiposity in Indian children. Matern Child Nutr. 2013;9:199-216.
5. Martin RM, Patel, R, Kramer MS, et al. Effects of promoting longer-term and exclusive breastfeeding on adiposity and insulin-like growth factor-I at age 11.5 years: a randomized trial. JAMA. 2013;309:1005-1013.
6. Pearce J, Taylor MA, Langley-Evans SC. Timing of the introduction of complementary feeding and risk of childhood obesity: a systematic review. Int J Obes (Lond). 2013;37:1295-1306.
7. Pearce J, Langley-Evans. The types of food introduced during complementary feeding and risk of childhood obesity: a systematic review. Int J Obes (Lond). 2013;37:477-485.
8. Mihrshahi S, Battistutta D, Magarey A, et al. Determinants of rapid weight gain during infancy: baseline results from the NOURISH randomised controlled trial. BMC Pediatr. 2011;11:99.
EVIDENCE SUMMARY
A systematic review and meta-analysis of prospective cohort studies evaluating infant risk factors for childhood obesity found that breastfeeding was associated with a lower risk of obesity.1 The authors identified 10 trials (primarily from the United States and Europe) with more than 76,000 infants that compared the effect of some breastfeeding in the first year to no breastfeeding. Follow-up ranged from 2 to 14 years (median 6 years).
Having ever breastfed decreased the odds of future overweight (BMI >85th percentile) or obesity (BMI >95th percentile) by 15% (adjusted odds ratio [AOR]=0.85; 95% confidence interval [CI], 0.74-0.99).
Subsequent studies suggest increased risk with formula feeding
Three large, prospective, longitudinal cohort studies have been published since the meta-analysis. One, which followed 43,367 term infants in Japan, found that formula feeding before 6 months was associated with increased risk of obesity compared with continuous breastfeeding for 6 months.2 Researchers evaluated weight at 7 years and adjusted for child and maternal factors associated with weight gain (AOR for obesity, formula-fed infants=1.8; 95% CI, 1.3-2.6).
A similar prospective longitudinal cohort study of 2868 infants in Australia analyzed maternal breastfeeding diaries and followed children’s weight to age 20 years.3 Introducing a milk other than breast milk before 6 months of age was linked to increased risk of obesity at age 20 (odds ratio [OR]=1.5; 95% CI, 1.1-1.9).
Finally, in a prospective cohort of 568 children in India, 17% of children who breastfed for fewer than 6 months were above the 90th percentile for weight at age 5 years, compared with 10% of children who were breastfed for at least 18 months.4 The result didn’t reach statistical significance, however (P=.08).
Interventions that increase breastfeeding don’t seem to have an impact
An RCT of an intervention to promote breastfeeding didn’t find any effect on subsequent obesity rates. Researchers in Belarus randomized 17,046 mother-infant pairs to breastfeeding promotion, modeled on the UNICEF Baby-Friendly Hospital Initiative, or usual care. The intervention increased the prevalence of exclusive breastfeeding (at 3 months, 43% vs 6%; at 6 months, 7% vs 0.6%; P values not given).
When researchers evaluated 13,879 children at 11 or 12 years by intention-to-treat analysis, however, they found no difference in mean BMI between the children whose mothers received the intervention and those whose mothers didn’t (BMI difference=0.16; 95% CI, -0.02 to 0.35).5
Introduction of solid foods: Later is better
A systematic review investigated the association between the timing of introducing complementary (solid) foods and childhood obesity in 23 primarily cross-sectional and cohort studies (17 from the United States, Canada, and Europe) with more than 33,000 patients. Follow-up ranged from 4 to 19 years.
Eight of the 21 studies that used BMI as an outcome found that early introduction of complementary foods was associated with a higher childhood BMI. In the largest study (a cohort of 17,561 infants), introducing complementary foods before 3 months was associated with higher risk of obesity at age 5 years than introducing them thereafter (OR=1.3; 95% CI, 1.1-1.6).6 Introduction of solids after 4 months was not associated with childhood obesity.
A systematic review of 10 primarily cross-sectional and cohort studies with more than 3000 infants evaluated associations between the types of complementary foods given and the development of childhood obesity.7 Six of the 10 studies were from Europe and none were from the United States. Follow-up ages ranged from 4 to 11 years.
Outcomes were heterogeneous, and no meta-analysis could be performed. The authors cited 3 studies (total 1174 infants) that found various positive associations between total caloric intake during complementary feeding and childhood obesity. No consistent evidence pointed to increased risk from specific foods or food groups.
Scheduled feeding is linked to rapid infant weight gain
A cohort study evaluated the baseline data of an Australian RCT (on an intervention to promote proper nutrition) in 612 infants, mean age 4.3 months.8 Researchers looked at the relationship between feeding on demand vs scheduled feeding (assessed by parental report) and weight gain in infancy. “Rapid weight gain” was defined as >0.67 change in weight-for-age Z-score between birth and enrollment.
Scheduled feeding was associated with rapid weight gain at a higher rate than feeding on demand (OR=2.3; 95% CI, 1.1-4.6). This study didn’t use childhood obesity as an outcome.
1. Weng SF, Redsell SA, Swift JA, et al. Systematic review and meta-analyses of risk factors for childhood overweight identifiable during infancy. Arch Dis Child. 2012;97:1019-1026.
2. Yamakawa M, Yorifuji T, Inoue S, et al. Breastfeeding and obesity among schoolchildren: a national longitudinal survey in Japan. JAMA Pediatr. 2013;167:919-925.
3. Oddy WH, Mari TA, Huang RC, et al. Early infant feeding and adiposity risk: from infancy to adulthood. Ann Nutr Metab. 2014;64:262-270.
4. Caleyachetty A, Krishnaveni GV, Veena SR, et al. Breast-feeding duration, age of starting solids, and high BMI risk and adiposity in Indian children. Matern Child Nutr. 2013;9:199-216.
5. Martin RM, Patel, R, Kramer MS, et al. Effects of promoting longer-term and exclusive breastfeeding on adiposity and insulin-like growth factor-I at age 11.5 years: a randomized trial. JAMA. 2013;309:1005-1013.
6. Pearce J, Taylor MA, Langley-Evans SC. Timing of the introduction of complementary feeding and risk of childhood obesity: a systematic review. Int J Obes (Lond). 2013;37:1295-1306.
7. Pearce J, Langley-Evans. The types of food introduced during complementary feeding and risk of childhood obesity: a systematic review. Int J Obes (Lond). 2013;37:477-485.
8. Mihrshahi S, Battistutta D, Magarey A, et al. Determinants of rapid weight gain during infancy: baseline results from the NOURISH randomised controlled trial. BMC Pediatr. 2011;11:99.
Evidence-based answers from the Family Physicians Inquiries Network
EVIDENCE-BASED ANSWER:
Yes. Ever having breastfed during the first year of life is associated with a 15% lower risk of overweight or obesity over the next 2 to 14 years compared with never having breastfed. Breastfeeding exclusively for 6 months is associated with a 30% to 50% reduction in risk (strength of recommendation [SOR]: B, meta-analysis of cohort studies and subsequent cohort studies). However, interventions that increase breastfeeding rates during the first 3 to 6 months of life don’t appear to alter body mass index (BMI) at 11 to 12 years of age (SOR: B, randomized clinical trial [RCT]).
Introducing complementary (solid) foods before 3 months is associated with a 30% greater risk of childhood obesity than later introduction; starting solid foods after 4 months isn’t linked to increased obesity. High caloric density of complementary feedings may be associated with greater childhood obesity (SOR: C, systematic reviews of heterogeneous cohort studies).
Scheduled feeding doubles the risk of rapid infant weight gain compared with on-demand feeding, although it’s unclear whether a direct relationship exists between rapid infant weight gain and childhood obesity (SOR: B, cohort study).

Is red-yeast rice a safe and effective alternative to statins?
Yes, but perhaps not the red-yeast rice extracts available in the United States.
In patients with known coronary artery disease and dyslipidemia (secondary prevention), therapy with red-yeast rice extract containing naturally-occurring lovastatin is associated with a 30% reduction in coronary heart disease (CHD) mortality and a 60% reduction in myocardial infarction (MI), similar to the effect of statin medications (strength of recommendation [SOR]: B, randomized controlled trials [RCTs] in China).
In patients older than 65 years with hypertension and a previous MI, the rate of adverse effects from lovastatin-containing red-yeast rice is 2.1% (SOR: B, RCT in China).
In patients with previous statin intolerance, the rates of myalgias and treatment discontinuation with lovastatin-containing red-yeast rice therapy are similar to either placebo or another statin (SOR: C, low-powered RCTs).
The US Food and Drug Administration (FDA) doesn’t allow lovastatin-containing red-yeast rice products on the US market; physicians should be aware that products purchased by patients online contain variable amounts of lovastatin.
EVIDENCE SUMMARY
Red-yeast rice is a Chinese dietary and medicinal product of yeast (Monascus purpureus) grown on rice. It contains a wide range of biologically active compounds, including lovastatin (monacolin K). The FDA has banned the sale of red-yeast rice products with more than trace amounts of lovastatin.1
Red-yeast rice beats placebo, similar to statins
A systematic review of 22 RCTs (N=6520), primarily conducted in China using 600 to 2400 mg red-yeast rice extract daily (lovastatin content 5-20 mg), assessed outcomes in patients with known CHD and dyslipidemia.2 In one trial of 4870 patients, users of red-yeast rice had significant reductions in CHD mortality (relative risk [RR]=0.69; 95% confidence interval [CI], 0.54-0.89), incidence of MI (RR=0.39; 95% CI, 0.28-0.55), and revascularization (RR=0.67; 95% CI, 0.50-0.89) compared with placebo users.
However, when compared with statin therapy, red-yeast rice didn’t yield statistically significant differences in CHD mortality (2 trials, N=220; RR=0.26; 95% CI, 0.06-1.21), incidence of MI (1 trial, N=84; RR=0.95; 95% CI, 0.30-3.05) or revascularization (1 trial, N=84; RR=1.14; 95% CI, 0.38-3.46).
Red-yeast rice outperforms placebo in CHD and MI—but not stroke
A secondary analysis of an RCT evaluated the impact of red-yeast rice extract (600 mg twice a day) for 4.5 years on cardiovascular events and mortality in 1530 Chinese patients 60 years of age and older with hypertension and a previous MI.3 The lovastatin content of the red-yeast rice was 5 to 6.4 mg/d.
Compared with placebo, red-yeast rice was associated with a lower incidence of CHD events (RR=0.63; 95% CI, 0.36-0.83), nonfatal MI (RR=0.48; 95% CI, 0.37-0.71), and all-cause mortality (RR=0.65; 95% CI, 0.49-0.83) but not with a statistically significant difference in stroke (RR=0.63; 95% CI, 0.47-1.09) or cardiac revascularization (RR=0.68; 95% CI, 0.52-1.19).
Total adverse events in this study were similar for red-yeast rice and placebo (2.1% vs 1.2%, respectively; P>.05). They included gastrointestinal discomfort, allergic reactions, myalgias, edema, erectile dysfunction, and neuropsychological symptoms.
Red-yeast rice is similar to placebo or another statin in statin-induced myalgia
In a small community-based trial of 62 adults with dyslipidemia and a history of statin-induced myalgia, investigators randomized patients to receive either red-yeast rice extract at 1800 mg (with 3.1 mg lovastatin) or placebo twice daily for 24 weeks.4 Patients’ weekly self-reports of pain (on a 10-point scale) were skewed at baseline (1.4 in the red-yeast rice group vs 2.6 in the placebo group; P=.026) but similar at 12 weeks (1.4 with red-yeast rice vs 1.9 with placebo; P=.30) and 24 weeks (1.2 with red-yeast rice vs 2.0 with placebo; P=.120).
An RCT of 43 adults with dyslipidemia and history of statin intolerance compared red-yeast rice extract (2400 mg, with 10 mg lovastatin) with pravastatin (20 mg) dosed twice a day.5 At the end of 12 weeks, mean self-reported pain scores (on a 10-point scale) were similar (1.4 with red-yeast rice vs 1.1 with pravastatin; P=.82), as were discontinuation rates because of myalgia (5% with red-yeast rice vs 9% with pravastatin; P=.99).
RECOMMENDATIONS
A narrative review of alternative therapies for heart failure and hypercholesterolemia states that red yeast rice may be a cost-saving option for hypercholesterolemia in patients who can’t afford other medications (purchased mostly online, cost $8-$20/month for a dosage equivalent to lovastatin 20 mg/d).6
A ConsumerLab review of red yeast rice products available since the FDA ban in 2011 tested products marketed in the United States and found variable amounts of lovastatin.1,7 The group determined that labeling was a poor guide to lovastatin content, which ranged from 0 to 20 mg per daily dose, and that the products may not have been standardized. The group concluded that therapeutic effects weren’t predictable.
1. National Institutes of Health. Red yeast rice: An introduction. National Center for Complementary and Integrative Health Web site. Available at: http://nccam.nih.gov/health/redyeastrice. Accessed October 28, 2013.
2. Shang Q, Liu Z, Chen K, et al. A systematic review of xuezhikang, an extract from red yeast rice, for coronary heart disease complicated by dyslipidemia. Evid Based Complement Alternat Med. 2012;2012:636547.
3. Li JJ, Lu ZL, Kou WR, et al. Beneficial impact of xuezhikang on cardiovascular events and mortality in elderly hypertensive patients with previous myocardial infarction from the China Coronary Secondary Prevention Study (CCSPS). J Clin Pharmacol. 2009;49:947-956.
4. Becker DJ, Gordon RY, Halbert SC, et al. Red yeast rice for dyslipidemia in statin-intolerant patients: a randomized trial. Ann Intern Med. 2009;150:830-839,
W147-W149.
5. Halbert SC, French B, Gordon RY, et al. Tolerability of red yeast rice (2,400 mg twice daily) versus pravastatin (20 mg twice daily) in patients with previous statin intolerance. Am J Cardiol. 2010;105:198-204.
6. Morelli V, Zoorob RJ. Alternative therapies: Part II. Congestive heart failure and hypercholesterolemia. Am Fam Physician. 2000;62:1325-1330.
7. Consumerlab.com. Product Review: Red yeast rice supplements review. ConsumerLab Web site. Available at: https://www.consumerlab.com/reviews/Red-Yeast-Rice-Supplements-Review/Red_Yeast_Rice. Accessed January 20, 2015.
Yes, but perhaps not the red-yeast rice extracts available in the United States.
In patients with known coronary artery disease and dyslipidemia (secondary prevention), therapy with red-yeast rice extract containing naturally-occurring lovastatin is associated with a 30% reduction in coronary heart disease (CHD) mortality and a 60% reduction in myocardial infarction (MI), similar to the effect of statin medications (strength of recommendation [SOR]: B, randomized controlled trials [RCTs] in China).
In patients older than 65 years with hypertension and a previous MI, the rate of adverse effects from lovastatin-containing red-yeast rice is 2.1% (SOR: B, RCT in China).
In patients with previous statin intolerance, the rates of myalgias and treatment discontinuation with lovastatin-containing red-yeast rice therapy are similar to either placebo or another statin (SOR: C, low-powered RCTs).
The US Food and Drug Administration (FDA) doesn’t allow lovastatin-containing red-yeast rice products on the US market; physicians should be aware that products purchased by patients online contain variable amounts of lovastatin.
EVIDENCE SUMMARY
Red-yeast rice is a Chinese dietary and medicinal product of yeast (Monascus purpureus) grown on rice. It contains a wide range of biologically active compounds, including lovastatin (monacolin K). The FDA has banned the sale of red-yeast rice products with more than trace amounts of lovastatin.1
Red-yeast rice beats placebo, similar to statins
A systematic review of 22 RCTs (N=6520), primarily conducted in China using 600 to 2400 mg red-yeast rice extract daily (lovastatin content 5-20 mg), assessed outcomes in patients with known CHD and dyslipidemia.2 In one trial of 4870 patients, users of red-yeast rice had significant reductions in CHD mortality (relative risk [RR]=0.69; 95% confidence interval [CI], 0.54-0.89), incidence of MI (RR=0.39; 95% CI, 0.28-0.55), and revascularization (RR=0.67; 95% CI, 0.50-0.89) compared with placebo users.
However, when compared with statin therapy, red-yeast rice didn’t yield statistically significant differences in CHD mortality (2 trials, N=220; RR=0.26; 95% CI, 0.06-1.21), incidence of MI (1 trial, N=84; RR=0.95; 95% CI, 0.30-3.05) or revascularization (1 trial, N=84; RR=1.14; 95% CI, 0.38-3.46).
Red-yeast rice outperforms placebo in CHD and MI—but not stroke
A secondary analysis of an RCT evaluated the impact of red-yeast rice extract (600 mg twice a day) for 4.5 years on cardiovascular events and mortality in 1530 Chinese patients 60 years of age and older with hypertension and a previous MI.3 The lovastatin content of the red-yeast rice was 5 to 6.4 mg/d.
Compared with placebo, red-yeast rice was associated with a lower incidence of CHD events (RR=0.63; 95% CI, 0.36-0.83), nonfatal MI (RR=0.48; 95% CI, 0.37-0.71), and all-cause mortality (RR=0.65; 95% CI, 0.49-0.83) but not with a statistically significant difference in stroke (RR=0.63; 95% CI, 0.47-1.09) or cardiac revascularization (RR=0.68; 95% CI, 0.52-1.19).
Total adverse events in this study were similar for red-yeast rice and placebo (2.1% vs 1.2%, respectively; P>.05). They included gastrointestinal discomfort, allergic reactions, myalgias, edema, erectile dysfunction, and neuropsychological symptoms.
Red-yeast rice is similar to placebo or another statin in statin-induced myalgia
In a small community-based trial of 62 adults with dyslipidemia and a history of statin-induced myalgia, investigators randomized patients to receive either red-yeast rice extract at 1800 mg (with 3.1 mg lovastatin) or placebo twice daily for 24 weeks.4 Patients’ weekly self-reports of pain (on a 10-point scale) were skewed at baseline (1.4 in the red-yeast rice group vs 2.6 in the placebo group; P=.026) but similar at 12 weeks (1.4 with red-yeast rice vs 1.9 with placebo; P=.30) and 24 weeks (1.2 with red-yeast rice vs 2.0 with placebo; P=.120).
An RCT of 43 adults with dyslipidemia and history of statin intolerance compared red-yeast rice extract (2400 mg, with 10 mg lovastatin) with pravastatin (20 mg) dosed twice a day.5 At the end of 12 weeks, mean self-reported pain scores (on a 10-point scale) were similar (1.4 with red-yeast rice vs 1.1 with pravastatin; P=.82), as were discontinuation rates because of myalgia (5% with red-yeast rice vs 9% with pravastatin; P=.99).
RECOMMENDATIONS
A narrative review of alternative therapies for heart failure and hypercholesterolemia states that red yeast rice may be a cost-saving option for hypercholesterolemia in patients who can’t afford other medications (purchased mostly online, cost $8-$20/month for a dosage equivalent to lovastatin 20 mg/d).6
A ConsumerLab review of red yeast rice products available since the FDA ban in 2011 tested products marketed in the United States and found variable amounts of lovastatin.1,7 The group determined that labeling was a poor guide to lovastatin content, which ranged from 0 to 20 mg per daily dose, and that the products may not have been standardized. The group concluded that therapeutic effects weren’t predictable.
1. National Institutes of Health. Red yeast rice: An introduction. National Center for Complementary and Integrative Health Web site. Available at: http://nccam.nih.gov/health/redyeastrice. Accessed October 28, 2013.
2. Shang Q, Liu Z, Chen K, et al. A systematic review of xuezhikang, an extract from red yeast rice, for coronary heart disease complicated by dyslipidemia. Evid Based Complement Alternat Med. 2012;2012:636547.
3. Li JJ, Lu ZL, Kou WR, et al. Beneficial impact of xuezhikang on cardiovascular events and mortality in elderly hypertensive patients with previous myocardial infarction from the China Coronary Secondary Prevention Study (CCSPS). J Clin Pharmacol. 2009;49:947-956.
4. Becker DJ, Gordon RY, Halbert SC, et al. Red yeast rice for dyslipidemia in statin-intolerant patients: a randomized trial. Ann Intern Med. 2009;150:830-839,
W147-W149.
5. Halbert SC, French B, Gordon RY, et al. Tolerability of red yeast rice (2,400 mg twice daily) versus pravastatin (20 mg twice daily) in patients with previous statin intolerance. Am J Cardiol. 2010;105:198-204.
6. Morelli V, Zoorob RJ. Alternative therapies: Part II. Congestive heart failure and hypercholesterolemia. Am Fam Physician. 2000;62:1325-1330.
7. Consumerlab.com. Product Review: Red yeast rice supplements review. ConsumerLab Web site. Available at: https://www.consumerlab.com/reviews/Red-Yeast-Rice-Supplements-Review/Red_Yeast_Rice. Accessed January 20, 2015.
Evidence-based answers from the Family Physicians Inquiries Network
What is the best imaging method for patients with a presumed acute stroke?
It depends on whether the stroke is schemic or hemorrhagic. For early detection of ischemic stroke, magnetic resonance imaging (MRI) using diffusion-weighted imaging (DWI) is highly sensitive and specific, whereas computed tomography (CT) is less sensitive but about as specific (strength of recommendation [SOR]: B, a meta-analysis of lower quality RCTs). MRI using DWI and CT are probably comparable for detecting acute hemorrhagic stroke (SOR: B, a cohort study).
When thrombolysis is being considered and hemorrhage must be ruled out rapidly, either test is acceptable if it can be performed and interpreted within 45 minutes of patient arrival, although MRI typically costs about twice as much as CT (SOR: C, expert opinion).
EVIDENCE SUMMARY
Clinical A Cochrane review identified 7 studies that compared MRI with CT for detecting ischemic stroke in a total of 226 patients, average age 65 years, with stroke-like symptoms.1 Investigators performed imaging within 12 hours of symptom onset in all patients, including those whose final diagnosis was transient ischemic attack (TIA). They identified 161 patients with ischemic stroke based on a combination of imaging and clinical examination. MRI with DWI was more sensitive than CT (0.99; 95% confidence interval [CI], 0.23-1.00 vs 0.39; 95% CI, 0.16-0.69); both techniques had comparable specificity (0.92; 95% CI, 0.83-0.97 and 1.00; 95% CI, 0.94-1.00, respectively).
Many issues could have affected the ischemic stroke analysis: All studies included some retrospective data collection; in all but one study, the MRI was performed a mean of one hour after the CT; and in 4 studies, the physicians reading the scans weren’t blinded to the clinical outcome. The Cochrane authors also found evidence of “prescreening” that appeared to select for patients with middle-cerebral artery infarcts. They concluded that the reliability and generalizability of the results “were questionable.”
MRI and CT have similar sensitivity and specificity for hemorrhagic stroke
A prospective cohort study of 27 patients (mean age 76 years) who had an acute hemorrhagic stroke that was imaged using both MRI with DWI and CT within 3 hours of symptom onset found that both imaging studies had comparable sensitivity (0.81; 95% CI, 0.61-0.93 vs 0.89; 95% CI, 0.70-0.97, respectively) and specificity (1.0; 95% CI, 0.98-1.0 for both).2
A retrospective case-control study evaluated the ability of DWI to detect hemorrhagic stroke in 86 patients who presented with symptoms consistent with acute stroke.3 Investigators compared the sensitivity and specificity of DWI against the pooled results of 5 different MRI sequences. Both case and control imaging was performed within 6 hours of symptom onset. Half of the patients in the study had hemorrhagic strokes (43); the rest had ischemic strokes (41) or a TIA and postictal deficit (2). The sensitivity and specificity of DWI for hemorrhagic stroke were both 1.0. However, there was no independent reference standard.
MRI costs more than CT
Although costs vary widely, one textbook put the national average charge for a head CT at about $1000.4 MRI neuroimaging charges ranged from $1000 to $4700, with an average of about $2300. Medicare reimbursements were significantly less, although the cost of MRIs was still about double that of CTs.
Recommendations
The Therapeutics and Technology Assessment Subcommittee of the American Academy of Neurology says that DWI is more useful than noncontrast CT for diagnosing acute ischemic stroke in patients presenting within 12 hours of symptom onset.5 The subcommittee made no recommendation for imaging hemorrhagic stroke.
American Heart Association and American Stroke Association guidelines for early management of adults with ischemic stroke recommend neuroimaging with either DWI or CT within 45 minutes of arrival in candidates for tissue plasminogen activator.6 They also recommend neuroimaging with either CT or MRI to distinguish ischemic from hemorrhagic stroke.7 The guidelines state that other imaging methods (including CT angiography, contrast-enhanced MRI, and magnetic resonance angiography) “may be considered” to evaluate for clinically suspected underlying structural lesions, including vascular malformations and tumors.
1. Brazeli M, Sandercock PA, Chappell FM, et al. Magnetic resonance imaging versus computed tomography for detection of acute vascular lesions in patients presenting with stroke symptoms. Cochrane Database Syst Rev. 2009;(4):CD007424.
2. Chelela JA, Kidwell CS, Nentwich LM, et al. Magnetic resonance imaging and computed tomography in emergency assessment of patients with suspected acute stroke: a prospective comparison. Lancet. 2007;369:293-298.
3. Oppenheim C, Touzé E, Hernalsteen D, et al. Comparison of five MR sequences for the detection of acute intracranial hemorrhage. Cerebrovasc Dis. 2005;20:388-394.
4. Broder J, Preston R. Imaging the head and brain. In: Broder J, ed. Diagnostic Imaging for the Emergency Physician. Philadelphia, Pa: Elsevier/Saunders; 2011:26-27.
5. Shellinger PD, Bryan RN, Caplan LR, et al; Therapeutics and Technology Assessment Subcommittee of the American Academy of Neurology. Evidence based guideline: the role of diffusion and perfusion MRI for the diagnosis of acute ischemic stroke. Report of the Therapeutics and Technology Assessment Subcommittee of the American Academy of Neurology. Neurology. 2010;75:177-185.
6. Latchaw RE, Alberts MJ, Lev MH, et al. Recommendations for imaging of acute stroke: a scientific statement from the American Heart Association. Stroke. 2009;40:3646-3678.
7. Morgenstern LB, Hemphill III JC, Anderson C, et al. Guidelines for the management of spontaneous intracerebral hemorrhage: a guideline for health care professionals from the American Heart Association/American Stroke Association. Stroke. 2010;41:2108-2129.
It depends on whether the stroke is schemic or hemorrhagic. For early detection of ischemic stroke, magnetic resonance imaging (MRI) using diffusion-weighted imaging (DWI) is highly sensitive and specific, whereas computed tomography (CT) is less sensitive but about as specific (strength of recommendation [SOR]: B, a meta-analysis of lower quality RCTs). MRI using DWI and CT are probably comparable for detecting acute hemorrhagic stroke (SOR: B, a cohort study).
When thrombolysis is being considered and hemorrhage must be ruled out rapidly, either test is acceptable if it can be performed and interpreted within 45 minutes of patient arrival, although MRI typically costs about twice as much as CT (SOR: C, expert opinion).
EVIDENCE SUMMARY
Clinical A Cochrane review identified 7 studies that compared MRI with CT for detecting ischemic stroke in a total of 226 patients, average age 65 years, with stroke-like symptoms.1 Investigators performed imaging within 12 hours of symptom onset in all patients, including those whose final diagnosis was transient ischemic attack (TIA). They identified 161 patients with ischemic stroke based on a combination of imaging and clinical examination. MRI with DWI was more sensitive than CT (0.99; 95% confidence interval [CI], 0.23-1.00 vs 0.39; 95% CI, 0.16-0.69); both techniques had comparable specificity (0.92; 95% CI, 0.83-0.97 and 1.00; 95% CI, 0.94-1.00, respectively).
Many issues could have affected the ischemic stroke analysis: All studies included some retrospective data collection; in all but one study, the MRI was performed a mean of one hour after the CT; and in 4 studies, the physicians reading the scans weren’t blinded to the clinical outcome. The Cochrane authors also found evidence of “prescreening” that appeared to select for patients with middle-cerebral artery infarcts. They concluded that the reliability and generalizability of the results “were questionable.”
MRI and CT have similar sensitivity and specificity for hemorrhagic stroke
A prospective cohort study of 27 patients (mean age 76 years) who had an acute hemorrhagic stroke that was imaged using both MRI with DWI and CT within 3 hours of symptom onset found that both imaging studies had comparable sensitivity (0.81; 95% CI, 0.61-0.93 vs 0.89; 95% CI, 0.70-0.97, respectively) and specificity (1.0; 95% CI, 0.98-1.0 for both).2
A retrospective case-control study evaluated the ability of DWI to detect hemorrhagic stroke in 86 patients who presented with symptoms consistent with acute stroke.3 Investigators compared the sensitivity and specificity of DWI against the pooled results of 5 different MRI sequences. Both case and control imaging was performed within 6 hours of symptom onset. Half of the patients in the study had hemorrhagic strokes (43); the rest had ischemic strokes (41) or a TIA and postictal deficit (2). The sensitivity and specificity of DWI for hemorrhagic stroke were both 1.0. However, there was no independent reference standard.
MRI costs more than CT
Although costs vary widely, one textbook put the national average charge for a head CT at about $1000.4 MRI neuroimaging charges ranged from $1000 to $4700, with an average of about $2300. Medicare reimbursements were significantly less, although the cost of MRIs was still about double that of CTs.
Recommendations
The Therapeutics and Technology Assessment Subcommittee of the American Academy of Neurology says that DWI is more useful than noncontrast CT for diagnosing acute ischemic stroke in patients presenting within 12 hours of symptom onset.5 The subcommittee made no recommendation for imaging hemorrhagic stroke.
American Heart Association and American Stroke Association guidelines for early management of adults with ischemic stroke recommend neuroimaging with either DWI or CT within 45 minutes of arrival in candidates for tissue plasminogen activator.6 They also recommend neuroimaging with either CT or MRI to distinguish ischemic from hemorrhagic stroke.7 The guidelines state that other imaging methods (including CT angiography, contrast-enhanced MRI, and magnetic resonance angiography) “may be considered” to evaluate for clinically suspected underlying structural lesions, including vascular malformations and tumors.
1. Brazeli M, Sandercock PA, Chappell FM, et al. Magnetic resonance imaging versus computed tomography for detection of acute vascular lesions in patients presenting with stroke symptoms. Cochrane Database Syst Rev. 2009;(4):CD007424.
2. Chelela JA, Kidwell CS, Nentwich LM, et al. Magnetic resonance imaging and computed tomography in emergency assessment of patients with suspected acute stroke: a prospective comparison. Lancet. 2007;369:293-298.
3. Oppenheim C, Touzé E, Hernalsteen D, et al. Comparison of five MR sequences for the detection of acute intracranial hemorrhage. Cerebrovasc Dis. 2005;20:388-394.
4. Broder J, Preston R. Imaging the head and brain. In: Broder J, ed. Diagnostic Imaging for the Emergency Physician. Philadelphia, Pa: Elsevier/Saunders; 2011:26-27.
5. Shellinger PD, Bryan RN, Caplan LR, et al; Therapeutics and Technology Assessment Subcommittee of the American Academy of Neurology. Evidence based guideline: the role of diffusion and perfusion MRI for the diagnosis of acute ischemic stroke. Report of the Therapeutics and Technology Assessment Subcommittee of the American Academy of Neurology. Neurology. 2010;75:177-185.
6. Latchaw RE, Alberts MJ, Lev MH, et al. Recommendations for imaging of acute stroke: a scientific statement from the American Heart Association. Stroke. 2009;40:3646-3678.
7. Morgenstern LB, Hemphill III JC, Anderson C, et al. Guidelines for the management of spontaneous intracerebral hemorrhage: a guideline for health care professionals from the American Heart Association/American Stroke Association. Stroke. 2010;41:2108-2129.
Evidence-based answers from the Family Physicians Inquiries Network
Do dietary choices alone alter the risk of developing metabolic syndrome?
YES, but not in the short term. In studies of patient populations controlled for differences in dietary content alone, independent of weight loss or exercise changes, diets with high glycemic index foods, low whole grain and fiber content, and low fruit and vegetable content are associated with an increased incidence of metabolic syndrome (strength of recommendation [SOR]: B, multiple large cohort studies).
In the short term, however, switching patients at high risk for metabolic syndrome from a high- to low-glycemic index diet doesn’t improve serum markers of metabolic syndrome (SOR: C, a small randomized controlled trial).
Evidence summary
Six studies (5 cohort studies and one randomized crossover study) attempted to isolate specific dietary components as risk factors for metabolic syndrome, by performing multivariate analyses to control for weight and exercise habits. The cohort studies all used the National Cholesterol Education Program Adult Treatment Panel III definition of metabolic syndrome. Overall, consumption of foods with a high glycemic index was associated with an increased risk of metabolic syndrome.
A cohort study that evaluated the diet, body habitus, and serum metabolic parameters of 2834 US adults using a validated, interviewer-administered food frequency questionnaire found that the rate of metabolic syndrome was significantly higher in patients with the highest glycemic index diets (highest vs lowest quintile adjusted odds ratio [aOR]=1.4; 95% confidence interval [CI], 1.04-1.9).1 Conversely, metabolic syndrome was less common in subjects who ate diets rich in whole grains (aOR=0.67; 95% CI, 0.48-0.91) and cereal fiber (aOR=0.62; 95% CI, 0.45-0.86).
A second cohort study evaluated the diet, body habitus, and metabolic parameters in 2043 Asian women using the same food frequency questionnaire to obtain dietary history.2 Metabolic syndrome was significantly more common among the women with a high refined carbohydrate intake (highest vs lowest quartile aOR=7.8; 95% CI, 4.7-13).
“Western” diet, lack of diversity associated with metabolic syndrome
Two studies from Iran evaluated the rates of metabolic syndrome according to different dietary patterns. The first evaluated a cohort of 486 female teachers 40 to 60 years of age.3 Investigators characterized dietary patterns as “healthy” (rich in fruits, vegetables, and whole grains) or “Western” (more meat and refined grains). The more “Western” the dietary pattern became, the more often metabolic syndrome was diagnosed (highest vs lowest quintile aOR=1.7; 95% CI, 1.1-1.9).
In the second study, 581 healthy adults received dietary surveys and were tested for metabolic syndrome.4 Diets were assessed and scored for their diversity. High levels of dietary diversity were inversely associated with metabolic syndrome (highest vs lowest quartile aOR=0.77; 95% CI, 0.59-0.93).
No short-term gain in switching to foods with low glycemic index
Switching to foods with a low glycemic index, however, may not provide much benefit, at least in the short term. An 11-week prospective, double-blind, crossover trial in which 15 overweight patients at risk of developing metabolic syndrome alternated eating foods with high and low glycemic indexes found no significant difference in the serum markers associated with metabolic syndrome (fasting glucose, insulin, and triglyceride levels).5
Recommendations
The 2010 Dietary Guidelines for Americans, jointly issued by the US Department of Agriculture and Health and Human Services, recommend increasing fruit and vegetable intake, eating a variety of vegetables, and consuming at least half of all grains as whole grains.6 The guidelines further recommend limiting consumption of foods that contain refined grains, “especially refined grain foods that contain solid fats, added sugars, and sodium.”
The American Diabetes Association (ADA) encourages consumption of low-glycemic index foods, especially foods rich in fiber and other nutrients. However, the ADA also states that there are “not sufficient, consistent” data to conclude that low-glycemic index diets reduce the risk of diabetes.7
1. McKown NM, Meigs JB, Liu S, et al. Carbohydrate nutrition, insulin resistance, and the prevalence of the metabolic syndrome in the Framingham offspring cohort. Diabetes Care. 2004;27:538-546.
2. Radhika G, Van Dam RM, Sudha V, et al. Refined grain consumption and the metabolic syndrome in urban Asian Indians (Chennai urban rural epidemiology study 57). Metabolism. 2009;58:675-681.
3. Esmaillzadeh A, Kimiagar M, Mehrabi Y, et al. Dietary patterns, insulin resistance, and prevalence of the metabolic syndrome in women. Am J Clin Nutr. 2007;85:910-918.
4. Azadbakht L, Mirmiran P, Azizi F. Dietary diversity score is favorably associated with the metabolic syndrome in Tehranian adults. Int J Obes (Lond). 2005;29:1361-1367.
5. Vrolix R, Mensink RP. Effects of glycemic load on metabolic risk markers in subjects at increased risk of developing metabolic syndrome. Am J Clin Nutr. 2010;92:366-374.
6. US Department of Agriculture and US Department of Health and Human Services. Dietary Guidelines for Americans, 2010. 7th ed. Washington, DC: US Government Printing Office; 2010. Available at: http://www.cnpp.usda.gov/dietaryguidelines. htm. Accessed August 19, 2013.
7. American Diabetes Association. Nutrition recommendations and interventions for diabetes: a position statement of the American Diabetes Association. Diabetes Care. 2008;31(suppl 1): S61-S78.
YES, but not in the short term. In studies of patient populations controlled for differences in dietary content alone, independent of weight loss or exercise changes, diets with high glycemic index foods, low whole grain and fiber content, and low fruit and vegetable content are associated with an increased incidence of metabolic syndrome (strength of recommendation [SOR]: B, multiple large cohort studies).
In the short term, however, switching patients at high risk for metabolic syndrome from a high- to low-glycemic index diet doesn’t improve serum markers of metabolic syndrome (SOR: C, a small randomized controlled trial).
Evidence summary
Six studies (5 cohort studies and one randomized crossover study) attempted to isolate specific dietary components as risk factors for metabolic syndrome, by performing multivariate analyses to control for weight and exercise habits. The cohort studies all used the National Cholesterol Education Program Adult Treatment Panel III definition of metabolic syndrome. Overall, consumption of foods with a high glycemic index was associated with an increased risk of metabolic syndrome.
A cohort study that evaluated the diet, body habitus, and serum metabolic parameters of 2834 US adults using a validated, interviewer-administered food frequency questionnaire found that the rate of metabolic syndrome was significantly higher in patients with the highest glycemic index diets (highest vs lowest quintile adjusted odds ratio [aOR]=1.4; 95% confidence interval [CI], 1.04-1.9).1 Conversely, metabolic syndrome was less common in subjects who ate diets rich in whole grains (aOR=0.67; 95% CI, 0.48-0.91) and cereal fiber (aOR=0.62; 95% CI, 0.45-0.86).
A second cohort study evaluated the diet, body habitus, and metabolic parameters in 2043 Asian women using the same food frequency questionnaire to obtain dietary history.2 Metabolic syndrome was significantly more common among the women with a high refined carbohydrate intake (highest vs lowest quartile aOR=7.8; 95% CI, 4.7-13).
“Western” diet, lack of diversity associated with metabolic syndrome
Two studies from Iran evaluated the rates of metabolic syndrome according to different dietary patterns. The first evaluated a cohort of 486 female teachers 40 to 60 years of age.3 Investigators characterized dietary patterns as “healthy” (rich in fruits, vegetables, and whole grains) or “Western” (more meat and refined grains). The more “Western” the dietary pattern became, the more often metabolic syndrome was diagnosed (highest vs lowest quintile aOR=1.7; 95% CI, 1.1-1.9).
In the second study, 581 healthy adults received dietary surveys and were tested for metabolic syndrome.4 Diets were assessed and scored for their diversity. High levels of dietary diversity were inversely associated with metabolic syndrome (highest vs lowest quartile aOR=0.77; 95% CI, 0.59-0.93).
No short-term gain in switching to foods with low glycemic index
Switching to foods with a low glycemic index, however, may not provide much benefit, at least in the short term. An 11-week prospective, double-blind, crossover trial in which 15 overweight patients at risk of developing metabolic syndrome alternated eating foods with high and low glycemic indexes found no significant difference in the serum markers associated with metabolic syndrome (fasting glucose, insulin, and triglyceride levels).5
Recommendations
The 2010 Dietary Guidelines for Americans, jointly issued by the US Department of Agriculture and Health and Human Services, recommend increasing fruit and vegetable intake, eating a variety of vegetables, and consuming at least half of all grains as whole grains.6 The guidelines further recommend limiting consumption of foods that contain refined grains, “especially refined grain foods that contain solid fats, added sugars, and sodium.”
The American Diabetes Association (ADA) encourages consumption of low-glycemic index foods, especially foods rich in fiber and other nutrients. However, the ADA also states that there are “not sufficient, consistent” data to conclude that low-glycemic index diets reduce the risk of diabetes.7
1. McKown NM, Meigs JB, Liu S, et al. Carbohydrate nutrition, insulin resistance, and the prevalence of the metabolic syndrome in the Framingham offspring cohort. Diabetes Care. 2004;27:538-546.
2. Radhika G, Van Dam RM, Sudha V, et al. Refined grain consumption and the metabolic syndrome in urban Asian Indians (Chennai urban rural epidemiology study 57). Metabolism. 2009;58:675-681.
3. Esmaillzadeh A, Kimiagar M, Mehrabi Y, et al. Dietary patterns, insulin resistance, and prevalence of the metabolic syndrome in women. Am J Clin Nutr. 2007;85:910-918.
4. Azadbakht L, Mirmiran P, Azizi F. Dietary diversity score is favorably associated with the metabolic syndrome in Tehranian adults. Int J Obes (Lond). 2005;29:1361-1367.
5. Vrolix R, Mensink RP. Effects of glycemic load on metabolic risk markers in subjects at increased risk of developing metabolic syndrome. Am J Clin Nutr. 2010;92:366-374.
6. US Department of Agriculture and US Department of Health and Human Services. Dietary Guidelines for Americans, 2010. 7th ed. Washington, DC: US Government Printing Office; 2010. Available at: http://www.cnpp.usda.gov/dietaryguidelines. htm. Accessed August 19, 2013.
7. American Diabetes Association. Nutrition recommendations and interventions for diabetes: a position statement of the American Diabetes Association. Diabetes Care. 2008;31(suppl 1): S61-S78.
Evidence-based answers from the Family Physicians Inquiries Network
Does metformin prevent diabetes in at-risk adults?
Yes. Metformin therapy reduces the risk of developing diabetes for adults with one or more risk factors for at least 5 years (strength of recommendation[SOR]: A, consistent meta-analyses) and perhaps as long as 10 years (SOR: B, randomized clinical trial[RCT]).
Lifestyle modification with diet and exercise is approximately twice as effective as metformin for preventing diabetes, especially in older patients (SOR:B,RCTs).
Evidence summary
Three meta-analyses of studies lasting from 2 months to 5 years found that metformin reduced the risk of developing overt diabetes in at-risk adults when compared with placebo (TABLE).1-3
Metformin is likely effective for as long as 10 years, based on long-term follow-up of patients in the Diabetes Prevention Program (DPP). In this trial, investigators randomized 3234 at-risk patients to 3 groups: metformin 850 mg twice daily; lifestyle modification (7% weight loss, 150 minutes of physical activity per week, and a one-to-one 16-lesson curriculum covering diet, exercise, and behavior modification); or placebo.4 At a mean 2.8-year follow-up, the incidence of diabetes was 31% lower in the metformin group (95% confidence interval [CI], 17%-43%) and 58% lower in the lifestyle modification group than in the placebo group (95% CI, 48%-66%; P<.001 for both comparisons).
At the close of the DPP trial, investigators offered lifestyle intervention to all 3 groups. Patients in the original metformin group continued to take metformin (with participants unblinded to assignment); patients in the original lifestyle intervention group were offered additional lifestyle support.5 At a median follow-up of 10 years after initial enrollment in the DPP trial, metformin reduced the incidence of overt diabetes by 18% compared with placebo (95% CI, 7%-28%), and lifestyle intervention reduced it by 34% (95% CI, 24%-42%; no statistic of comparison supplied).
Lifestyle modification works better than metformin in older adults
Another analysis found that metformin was equally effective in preventing diabetes in older and younger patients, whereas lifestyle modification was more effective in older patients. Investigators followed the patients in the DPP trial for an additional 5 months and stratified the effect of metformin and lifestyle modification by age.6
Metformin’s effectiveness didn’t change significantly in older adults compared with younger adults (hazard ratio [HR] for developing diabetes at age 60-85 years vs 25-44 years=1.45; 95% CI, 0.98-2.16; P=.06). In contrast, lifestyle modification worked better in older adults than younger adults (HR at age 60-85 years vs 25-44 years=0.47; 95% CI, 0.28- 0.78;P<.01).
Recommendations
The American Diabetes Association says that physicians may consider using metformin to prevent type 2 diabetes in patients at the highest risk, such as patients with multiple risk factors, especially if they show progression of hyperglycemia (HbA1c ≥6%, for example) despite lifestyle intervention.7
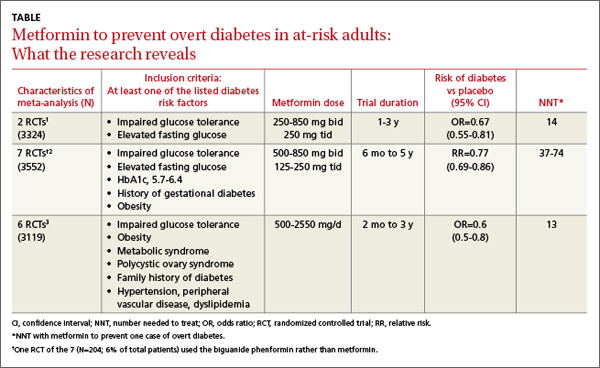
1. Lilly M, Godwin M. Treating prediabetes with metformin. Can Fam Physician. 2009;55:363-369.
2. Phung OJ, Sood A, Sill BE, et al. Oral anti-diabetic drugs for the prevention of type 2 diabetes. Diabet Med. 2011;28:948-964.
3. Salpeter SR, Buckley NS, Kahn JA, et al. Meta-analysis: met- formin treatment in persons at risk for diabetes mellitus. Am J Med. 2008;121:149-157.
4. Knowler W, Barrett-Connor E, Fowler SE, et al. Reduction in the incidence of type 2 diabetes with lifestyle intervention or metformin. N Engl J Med. 2002;346:393-403.
5. Knowler WC, Fowler SE, Hamman RF, et al. 10-year follow- up of diabetes incidence and weight loss in the diabetes prevention program outcomes study. Lancet. 2009;374: 1677-1686.
6. Crandall J, Schade D, Ma Y, et al. The influence of age on the effects of lifestyle modification and metformin in prevention of diabetes. J Gerontol A Biol Sci Med Sci. 2006;61:1075-1081.
7. American Diabetes Association. Executive summary: stan- dards of medical care in diabetes—2011. Diabetes Care. 2011;34(suppl 1):S4-S10.
Yes. Metformin therapy reduces the risk of developing diabetes for adults with one or more risk factors for at least 5 years (strength of recommendation[SOR]: A, consistent meta-analyses) and perhaps as long as 10 years (SOR: B, randomized clinical trial[RCT]).
Lifestyle modification with diet and exercise is approximately twice as effective as metformin for preventing diabetes, especially in older patients (SOR:B,RCTs).
Evidence summary
Three meta-analyses of studies lasting from 2 months to 5 years found that metformin reduced the risk of developing overt diabetes in at-risk adults when compared with placebo (TABLE).1-3
Metformin is likely effective for as long as 10 years, based on long-term follow-up of patients in the Diabetes Prevention Program (DPP). In this trial, investigators randomized 3234 at-risk patients to 3 groups: metformin 850 mg twice daily; lifestyle modification (7% weight loss, 150 minutes of physical activity per week, and a one-to-one 16-lesson curriculum covering diet, exercise, and behavior modification); or placebo.4 At a mean 2.8-year follow-up, the incidence of diabetes was 31% lower in the metformin group (95% confidence interval [CI], 17%-43%) and 58% lower in the lifestyle modification group than in the placebo group (95% CI, 48%-66%; P<.001 for both comparisons).
At the close of the DPP trial, investigators offered lifestyle intervention to all 3 groups. Patients in the original metformin group continued to take metformin (with participants unblinded to assignment); patients in the original lifestyle intervention group were offered additional lifestyle support.5 At a median follow-up of 10 years after initial enrollment in the DPP trial, metformin reduced the incidence of overt diabetes by 18% compared with placebo (95% CI, 7%-28%), and lifestyle intervention reduced it by 34% (95% CI, 24%-42%; no statistic of comparison supplied).
Lifestyle modification works better than metformin in older adults
Another analysis found that metformin was equally effective in preventing diabetes in older and younger patients, whereas lifestyle modification was more effective in older patients. Investigators followed the patients in the DPP trial for an additional 5 months and stratified the effect of metformin and lifestyle modification by age.6
Metformin’s effectiveness didn’t change significantly in older adults compared with younger adults (hazard ratio [HR] for developing diabetes at age 60-85 years vs 25-44 years=1.45; 95% CI, 0.98-2.16; P=.06). In contrast, lifestyle modification worked better in older adults than younger adults (HR at age 60-85 years vs 25-44 years=0.47; 95% CI, 0.28- 0.78;P<.01).
Recommendations
The American Diabetes Association says that physicians may consider using metformin to prevent type 2 diabetes in patients at the highest risk, such as patients with multiple risk factors, especially if they show progression of hyperglycemia (HbA1c ≥6%, for example) despite lifestyle intervention.7
1. Lilly M, Godwin M. Treating prediabetes with metformin. Can Fam Physician. 2009;55:363-369.
2. Phung OJ, Sood A, Sill BE, et al. Oral anti-diabetic drugs for the prevention of type 2 diabetes. Diabet Med. 2011;28:948-964.
3. Salpeter SR, Buckley NS, Kahn JA, et al. Meta-analysis: met- formin treatment in persons at risk for diabetes mellitus. Am J Med. 2008;121:149-157.
4. Knowler W, Barrett-Connor E, Fowler SE, et al. Reduction in the incidence of type 2 diabetes with lifestyle intervention or metformin. N Engl J Med. 2002;346:393-403.
5. Knowler WC, Fowler SE, Hamman RF, et al. 10-year follow- up of diabetes incidence and weight loss in the diabetes prevention program outcomes study. Lancet. 2009;374: 1677-1686.
6. Crandall J, Schade D, Ma Y, et al. The influence of age on the effects of lifestyle modification and metformin in prevention of diabetes. J Gerontol A Biol Sci Med Sci. 2006;61:1075-1081.
7. American Diabetes Association. Executive summary: stan- dards of medical care in diabetes—2011. Diabetes Care. 2011;34(suppl 1):S4-S10.
Evidence-based answers from the Family Physicians Inquiries Network
Does antepartum perineal massage reduce intrapartum lacerations?
Yes—to a point. Antepartum perineal massage reduces both the incidence of perineal trauma requiring suturing and the likelihood of episiotomy in women who have never given birth vaginally. It reduces the incidence of postpartum perineal pain in women who have given birth vaginally. Perineal massage doesn’t reduce the frequency of first- or second-degree lacerations or third- and fourth-degree perineal trauma. (Strength of recommendation [SOR]: A, systematic review of randomized controlled trials [RCTs].)
Raise the subject, then let the patient decide
Timothy E. Huber, MD
Oroville, Calif
Perineal massage is relatively easy to describe and do, but its intimate nature can make physicians and patients alike feel uncomfortable. The benefit for primigravid women justifies asking appropriate patients at least an exploratory question or 2 during early and second-trimester visits.
A question such as, “How much do you know about the process of having a vaginal delivery?” often prompts inquiries about pain control, delivery techniques, episiotomy, and tears. These inquiries can provide an opportunity to discuss perineal massage as a safe, effective technique to reduce the chance of an episiotomy, need for suturing, and long-term postpartum pain. Letting the patient make up her own mind can give her more confidence as the big day approaches.
Evidence summary
A systematic review evaluating whether antepartum perineal massage reduced perineal trauma included 3 RCTs with a total of 1941 primagravidas and 493 multigravidas.1 Women were randomized to receive either instruction in perineal massage or no instruction.
Beginning at 34 weeks, women or their partners performed perineal massage for 4 minutes, 3 to 4 times a week,2 or once a day for 10 minutes.3,4 Massage was performed by inserting 1 or 2 fingers 3 to 5 cm into the vagina and sweeping downward and from side to side, using almond oil for lubrication.
Birth attendants were blinded to patients’ assignments. All studies evaluated immediate postpartum outcomes; 1 study included a 3-month follow-up questionnaire.3
Massage reduces trauma, but less is more
Massage reduced perineal trauma requiring suturing by 10% among primigravid patients, compared with controls (relative risk [RR]=0.90; 95% confidence interval [CI], 0.84-0.96; number needed to treat [NNT]=14). Subgroup analysis revealed an inverse relationship between reduced trauma and frequency of massage: Primagravidas who massaged fewer than 1.5 times a week showed a 17% reduction (RR=0.83; 95% CI, 0.75-0.92; NNT=9), compared with an 8% reduction for women who massaged 1.5 to 3.4 times a week (RR=0.92; 95% CI, 0.85-1.00; NNT=22) and a statistically insignificant 7% reduction for the group that massaged more than 3.5 times a week (RR=0.93; 95% CI, 0.86-1.02).
Perineal massage reduced the incidence of episiotomy by 15% among primigravidas compared with controls (RR=0.85; 95% CI, 0.74-0.97; NNT=20); the largest reduction occurred in primagravidas who massaged as often as 1.5 times per week (RR=0.72; 95% CI, 0.57-0.91). This effect was not seen in primagravidas who massaged more often. Multigravid patients didn’t experience a statistically significant reduction in episiotomy.
Perineal massage didn’t affect the overall incidence of first- and second-degree perineal lacerations (first-degree laceration: RR=0.95; 95% CI, 0.78-1.16; second-degree laceration: RR=0.98; 95% CI, 0.84-1.15), nor the incidence of third- or fourth-degree lacerations (RR=0.81; 95% CI, 0.56-1.15). No difference was noted in the incidence of instrument delivery (RR=0.94; 95% CI, 0.81-1.08).
Massage means less pain for multigravidas
Massage reduced postpartum perineal pain in multigravidas, according to a questionnaire administered at 3 months in 1 study, to which 376 of 493 women (76%) responded (RR=0.45; 95% CI, 0.02-0.87; NNT=13).3 A subgroup of women who massaged more often than 3.5 times a week had a larger reduction in pain (RR=0.51; 95% CI, 0.33-0.79; NNT=11). At 3 months, massage produced no difference in rates of dyspareunia, sexual satisfaction, or incontinence of urine or feces when compared with standard care.
Recommendations
We found no expert or advocacy group guidelines on this topic.
1. Beckmann MM, Garrett AJ. Antenatal perineal massage for reducing perineal trauma. Cochrane Database Syst Rev. 2006;(1):CD005123.-
2. Shipman MK, Boniface DR, Tefft ME, et al. Antenatal perineal massage and subsequent perineal outcomes: a randomised controlled trial. BJOG. 1997;104:787-791.
3. Labrecque M, Eason E, Marcoux S, et al. Randomized controlled trial of prevention of perineal trauma by perineal massage during pregnancy. Am J Obstet Gynecol. 1999;180:593-600.
4. Labrecque M, Marcoux S, Pinault JJ, et al. Prevention of perineal trauma by perineal massage during pregnancy: a pilot study. Birth. 1994;21:20-25.
Yes—to a point. Antepartum perineal massage reduces both the incidence of perineal trauma requiring suturing and the likelihood of episiotomy in women who have never given birth vaginally. It reduces the incidence of postpartum perineal pain in women who have given birth vaginally. Perineal massage doesn’t reduce the frequency of first- or second-degree lacerations or third- and fourth-degree perineal trauma. (Strength of recommendation [SOR]: A, systematic review of randomized controlled trials [RCTs].)
Raise the subject, then let the patient decide
Timothy E. Huber, MD
Oroville, Calif
Perineal massage is relatively easy to describe and do, but its intimate nature can make physicians and patients alike feel uncomfortable. The benefit for primigravid women justifies asking appropriate patients at least an exploratory question or 2 during early and second-trimester visits.
A question such as, “How much do you know about the process of having a vaginal delivery?” often prompts inquiries about pain control, delivery techniques, episiotomy, and tears. These inquiries can provide an opportunity to discuss perineal massage as a safe, effective technique to reduce the chance of an episiotomy, need for suturing, and long-term postpartum pain. Letting the patient make up her own mind can give her more confidence as the big day approaches.
Evidence summary
A systematic review evaluating whether antepartum perineal massage reduced perineal trauma included 3 RCTs with a total of 1941 primagravidas and 493 multigravidas.1 Women were randomized to receive either instruction in perineal massage or no instruction.
Beginning at 34 weeks, women or their partners performed perineal massage for 4 minutes, 3 to 4 times a week,2 or once a day for 10 minutes.3,4 Massage was performed by inserting 1 or 2 fingers 3 to 5 cm into the vagina and sweeping downward and from side to side, using almond oil for lubrication.
Birth attendants were blinded to patients’ assignments. All studies evaluated immediate postpartum outcomes; 1 study included a 3-month follow-up questionnaire.3
Massage reduces trauma, but less is more
Massage reduced perineal trauma requiring suturing by 10% among primigravid patients, compared with controls (relative risk [RR]=0.90; 95% confidence interval [CI], 0.84-0.96; number needed to treat [NNT]=14). Subgroup analysis revealed an inverse relationship between reduced trauma and frequency of massage: Primagravidas who massaged fewer than 1.5 times a week showed a 17% reduction (RR=0.83; 95% CI, 0.75-0.92; NNT=9), compared with an 8% reduction for women who massaged 1.5 to 3.4 times a week (RR=0.92; 95% CI, 0.85-1.00; NNT=22) and a statistically insignificant 7% reduction for the group that massaged more than 3.5 times a week (RR=0.93; 95% CI, 0.86-1.02).
Perineal massage reduced the incidence of episiotomy by 15% among primigravidas compared with controls (RR=0.85; 95% CI, 0.74-0.97; NNT=20); the largest reduction occurred in primagravidas who massaged as often as 1.5 times per week (RR=0.72; 95% CI, 0.57-0.91). This effect was not seen in primagravidas who massaged more often. Multigravid patients didn’t experience a statistically significant reduction in episiotomy.
Perineal massage didn’t affect the overall incidence of first- and second-degree perineal lacerations (first-degree laceration: RR=0.95; 95% CI, 0.78-1.16; second-degree laceration: RR=0.98; 95% CI, 0.84-1.15), nor the incidence of third- or fourth-degree lacerations (RR=0.81; 95% CI, 0.56-1.15). No difference was noted in the incidence of instrument delivery (RR=0.94; 95% CI, 0.81-1.08).
Massage means less pain for multigravidas
Massage reduced postpartum perineal pain in multigravidas, according to a questionnaire administered at 3 months in 1 study, to which 376 of 493 women (76%) responded (RR=0.45; 95% CI, 0.02-0.87; NNT=13).3 A subgroup of women who massaged more often than 3.5 times a week had a larger reduction in pain (RR=0.51; 95% CI, 0.33-0.79; NNT=11). At 3 months, massage produced no difference in rates of dyspareunia, sexual satisfaction, or incontinence of urine or feces when compared with standard care.
Recommendations
We found no expert or advocacy group guidelines on this topic.
1. Beckmann MM, Garrett AJ. Antenatal perineal massage for reducing perineal trauma. Cochrane Database Syst Rev. 2006;(1):CD005123.-
2. Shipman MK, Boniface DR, Tefft ME, et al. Antenatal perineal massage and subsequent perineal outcomes: a randomised controlled trial. BJOG. 1997;104:787-791.
3. Labrecque M, Eason E, Marcoux S, et al. Randomized controlled trial of prevention of perineal trauma by perineal massage during pregnancy. Am J Obstet Gynecol. 1999;180:593-600.
4. Labrecque M, Marcoux S, Pinault JJ, et al. Prevention of perineal trauma by perineal massage during pregnancy: a pilot study. Birth. 1994;21:20-25.
Evidence-based answers from the Family Physicians Inquiries Network
What is the best medical therapy for new-onset type 2 diabetes?
Sulfonylureas, metformin, thiazolidinediones, and non-sulfonylurea secretagogues differ little in their ability to decrease glycosylated hemoglobin (HbA1c) levels when used as initial monotherapy for diabetes mellitus type 2 (strength of recommendation [SOR]: A, based on systematic reviews); α-glucosidase inhibitors may also be as effective (SOR: B, based on systematic reviews with inconsistent results). Metformin is generally indicated in obese patients because it improves all-cause mortality and diabetes related outcomes (SOR: B, based on a single high-quality randomized controlled trial [RCT]). Insulin is generally not recommended as an initial agent (SOR: C, expert opinion).
Consider the advantages of each class to best meet your patient’s goals
Vincent Lo, MD
San Joaquin Family Medicine Residency, French Camp, Calif
Lifestyle modification is the cornerstone of initial treatment of type 2 diabetes. However, in clinical practice, medications (monotherapy or combination therapy) are often started along with diet and exercise recommendations. Physicians and patients should clearly understand the treatment goals before initiating therapy. Multiple factors often influence treatment goals, such as presence or absence of symptoms, age-related risks from potential hypoglycemia, degree of hyperglycemia, presence of morbidities (renal insufficiency, heart failure, obesity), cost of the medication, as well as patient or physician preferences. Despite their comparable efficacy in the reduction of HbA1c level, each class of oral hypoglycemic medication has a different mechanism of action and adverse side-effect profile. Therefore, physicians must consider the advantages and disadvantages of each class to choose a medication regimen that best meets their patient’s individual treatment goals.
Evidence summary
Oral agents are commonly prescribed for patients with diabetes mellitus type 2 when diet and exercise fail. Options for initiating therapy include sulfonylureas, metformin (Glucophage), α-glucosidase inhibitors, thiazolidinediones, and nonsulfonylurea secretagogues (repaglinide [Prandin] and nateglinide [Starlix]).
A systematic review with 31 placebo-controlled randomized trials (total n=12,185 patients) evaluated changes in HbA1c with monotherapy using 5 different classes of oral agents ( TABLE ).1 Except for the α-glucosidase inhibitor acarbose (Precose), which was less effective, all agents typically reduced HbA1c by 1% to 2%. However, in an additional 19 out of 23 randomized head-to-head studies (total n=5396) included in the same systematic review, all classes showed equal efficacy.
Head-to-head studies are difficult to compare since hypoglycemic medications may reach peak effects at different times. An RCT compared glimepiride (Amaryl), pioglitazone (Actos), and metformin over 12 months of use by 114 patients with diabetes.3 There was no difference among the groups in overall HbA1c reduction. However, glimepiride decreased HbA1c rapidly over 1 month and reached a nadir at 4 months. Pioglitazone did not reduce HbA1c until 6 months and reached its nadir at 7 to 9 months. Metformin produced an intermediate response.
A meta-analysis of head to head studies involving α-glucosidase inhibitors included 8 trials comparing acarbose with sulfonylureas. In pooled results, sulfonylureas trended towards greater HbA1c reduction but did not reach significance (additional HbA1c decrease 0.4%; 95% confidence interval [CI], 0%–0.8%).4
A meta-analysis of head-to-head studies involving metformin showed equal efficacy compared with injected insulin (2 trials, 811 participants), α-glucosidase inhibitors (2 trials, 223 participants), and non-sulfonylurea secretagogues (2 trials, 413 participants).5 In 12 trials with 2067 patients, metformin decreased HbA1c more than sulfonylureas did (standardized mean difference [SMD] –0.14; 95% CI, –0.28 to –0.01). In 3 trials with 246 patients, metformin also produced greater HbA1c decreases than thiazolidinediones (SMD –0.28; 95% CI, –0.52 to –0.03). In the United Kingdom Prospective Diabetes Study (UKPDS), metformin improved diabetes-related outcomes and all-cause mortality in obese patients (relative risk of mortality=0.73; 95% CI, 0.55–0.97; P=.03; number needed to treat [NNT]=19).6
A systematic review with 22 RCTs (total n=7370), ranging in length from 12 weeks to 3 years, compared 2 oral agents with a single oral agent or placebo.1 Combinations of oral agents produced statistically significant additional improvement in HbA1c in 21 of 22 studies. The magnitude of this effect across the studies was on the order of a 1% change in HbA1c, although the data were not subject to a formal meta-analysis.
Inhaled insulin may expand the list of initial therapies for type 2 diabetes. A 12-week manufacturer-sponsored RCT with 134 patients (mean HbA1c=9.5) compared inhaled insulin with rosiglitazone (Avandia).7 More patients using inhaled insulin achieved an HbA1c <8.0 (82.7% vs 58.2%; P=.0003); however, inhaled insulin produced more adverse effects, including cough and hypoglycemia.
TABLE
Oral medications as monotherapy in type 2 diabetes mellitus1,2
| CLASS | DOSING INTERVAL | TYPICAL HBA1C REDUCTION | COST * PER MONTH† | CONTRAINDICATIONS/CAUTIONS |
|---|---|---|---|---|
| Sulfonylureas | 1x daily | 1.4%–1.8% | $ | DKA, caution in hepatic or renal disease |
| Metformin | 1–2x daily | 1.1%–2.0% | $$ | Congestive heart failure, acute or chronic metabolic acidosis, Cr ≥1.5 male, Cr ≥1.4 female, COPD, severe hepatic disease, alcoholism. Use caution in the elderly. |
| α-glucosidase inhibitors | 3x daily | 0.6%–1.0% | $$$ | Cr ≥2.0, abnormal baseline liver function tests, inflammatory bowel disease |
| Thiazolidinediones | 1–2x daily | 1.5%–1.6% | $$$–$$$$ | Class III to IV heart failure, baseline ALT >2.5 |
| Non-sulfonylurea secretagogues | 3x daily | 1.8%–1.9% | $$–$$$ | Caution with liver disease |
| * The “typical” range excludes the studies with the highest and lowest measured effects. | ||||
| † $ = $0 to $25; $$ = $25 to $60; $$$ = $60 to $120; $$$$ = $120 to $180. | ||||
| DKA, diabetic ketoacidosis; Cr, chromium; COPD, chronic obstructive pulmonary disease; ALT, alanine transaminease. | ||||
Recommendations from others
The International Diabetes Federation (IDF) recommends metformin as the initial oral agent unless contraindicated.8 A sulfonylurea is an acceptable alternative in patients who are not overweight. The IDF states that insulin should be added when oral agents fail.
The Institute for Clinical Systems Improvement (ICSI) says that the “single best choice drug for oral agent therapy for type 2 diabetes has not been determined” and must be chosen in the context of age, weight, and other comorbidities.9 The ICSI suggests metformin as an appropriate first agent for obese patients and recommends sulfonylureas or metformin as monotherapy for others because they are both economical and well tolerated. The American Diabetes Association does not specifically recommend a best initial agent or combination of agents for type 2 diabetes.10
1. Inzucchi SE. Oral antihyperglycemic therapy for type 2 diabetes. JAMA 2002;287:360-372.
2. Epocrates Drug Database. Available at: www2.epocrates.com/index.html. Accessed on May 18, 2006.
3. Yamanouchi T, Sakai T, Igarashi K, Ichiyanagi K, Watanabe H, Kawasaki T. Comparison of metabolic effects of pioglitazone, metformin, and glimepiride over 1 year in Japanese patients with newly diagnosed Type 2 diabetes. Diabetic Med 2005;22:980-985.
4. Van de Laar FA, Lucassen PLBJ, Akkermans RP, Van de Lisdonk EH, Rutten GEHM, Can Weel C. Alpha-glucosidase inhibitors for type 2 diabetes mellitus. Cochrane Database Syst Rev 2005, Issue 2.
5. Saenz A, Fernandez-Esteban I, Mataix A, Ausejo M, Roque M, Moher D. Metformin monotherapy for type 2 diabetes mellitus. Cochrane Database Syst Rev 2005, Issue 3.
6. UK Prospective Diabetes Study (UKPDS) Group. Effect of intensive blood-glucose control with metformin on complications in overweight patients with type 2 diabetes (UKPDS34). Lancet 1998;352:854-865.
7. DeFronzo RA, Bergenstal RM, Cefalu WT, et al. Efficacy of inhaled insulin in patients with type 2 diabetes not controlled with diet and exercise. Diabetes Care 2005;28:1922-1928.
8. IDF Clinical Guidelines Task Force. Global guideline for Type 2 diabetes. Brussels: International Diabetes Federation, 2005.
9. Institute for Clinical Systems Improvement (ICSI). Management of type 2 diabetes mellitus. Bloomington, Minn: Institute for Clinical Systems Improvement (ICSI); 2005 Nov. 79 p.
10. American Diabetes Association. Standard of medical care in diabetes-2006. Diabetes Care 2006;29:S4-S42.
Sulfonylureas, metformin, thiazolidinediones, and non-sulfonylurea secretagogues differ little in their ability to decrease glycosylated hemoglobin (HbA1c) levels when used as initial monotherapy for diabetes mellitus type 2 (strength of recommendation [SOR]: A, based on systematic reviews); α-glucosidase inhibitors may also be as effective (SOR: B, based on systematic reviews with inconsistent results). Metformin is generally indicated in obese patients because it improves all-cause mortality and diabetes related outcomes (SOR: B, based on a single high-quality randomized controlled trial [RCT]). Insulin is generally not recommended as an initial agent (SOR: C, expert opinion).
Consider the advantages of each class to best meet your patient’s goals
Vincent Lo, MD
San Joaquin Family Medicine Residency, French Camp, Calif
Lifestyle modification is the cornerstone of initial treatment of type 2 diabetes. However, in clinical practice, medications (monotherapy or combination therapy) are often started along with diet and exercise recommendations. Physicians and patients should clearly understand the treatment goals before initiating therapy. Multiple factors often influence treatment goals, such as presence or absence of symptoms, age-related risks from potential hypoglycemia, degree of hyperglycemia, presence of morbidities (renal insufficiency, heart failure, obesity), cost of the medication, as well as patient or physician preferences. Despite their comparable efficacy in the reduction of HbA1c level, each class of oral hypoglycemic medication has a different mechanism of action and adverse side-effect profile. Therefore, physicians must consider the advantages and disadvantages of each class to choose a medication regimen that best meets their patient’s individual treatment goals.
Evidence summary
Oral agents are commonly prescribed for patients with diabetes mellitus type 2 when diet and exercise fail. Options for initiating therapy include sulfonylureas, metformin (Glucophage), α-glucosidase inhibitors, thiazolidinediones, and nonsulfonylurea secretagogues (repaglinide [Prandin] and nateglinide [Starlix]).
A systematic review with 31 placebo-controlled randomized trials (total n=12,185 patients) evaluated changes in HbA1c with monotherapy using 5 different classes of oral agents ( TABLE ).1 Except for the α-glucosidase inhibitor acarbose (Precose), which was less effective, all agents typically reduced HbA1c by 1% to 2%. However, in an additional 19 out of 23 randomized head-to-head studies (total n=5396) included in the same systematic review, all classes showed equal efficacy.
Head-to-head studies are difficult to compare since hypoglycemic medications may reach peak effects at different times. An RCT compared glimepiride (Amaryl), pioglitazone (Actos), and metformin over 12 months of use by 114 patients with diabetes.3 There was no difference among the groups in overall HbA1c reduction. However, glimepiride decreased HbA1c rapidly over 1 month and reached a nadir at 4 months. Pioglitazone did not reduce HbA1c until 6 months and reached its nadir at 7 to 9 months. Metformin produced an intermediate response.
A meta-analysis of head to head studies involving α-glucosidase inhibitors included 8 trials comparing acarbose with sulfonylureas. In pooled results, sulfonylureas trended towards greater HbA1c reduction but did not reach significance (additional HbA1c decrease 0.4%; 95% confidence interval [CI], 0%–0.8%).4
A meta-analysis of head-to-head studies involving metformin showed equal efficacy compared with injected insulin (2 trials, 811 participants), α-glucosidase inhibitors (2 trials, 223 participants), and non-sulfonylurea secretagogues (2 trials, 413 participants).5 In 12 trials with 2067 patients, metformin decreased HbA1c more than sulfonylureas did (standardized mean difference [SMD] –0.14; 95% CI, –0.28 to –0.01). In 3 trials with 246 patients, metformin also produced greater HbA1c decreases than thiazolidinediones (SMD –0.28; 95% CI, –0.52 to –0.03). In the United Kingdom Prospective Diabetes Study (UKPDS), metformin improved diabetes-related outcomes and all-cause mortality in obese patients (relative risk of mortality=0.73; 95% CI, 0.55–0.97; P=.03; number needed to treat [NNT]=19).6
A systematic review with 22 RCTs (total n=7370), ranging in length from 12 weeks to 3 years, compared 2 oral agents with a single oral agent or placebo.1 Combinations of oral agents produced statistically significant additional improvement in HbA1c in 21 of 22 studies. The magnitude of this effect across the studies was on the order of a 1% change in HbA1c, although the data were not subject to a formal meta-analysis.
Inhaled insulin may expand the list of initial therapies for type 2 diabetes. A 12-week manufacturer-sponsored RCT with 134 patients (mean HbA1c=9.5) compared inhaled insulin with rosiglitazone (Avandia).7 More patients using inhaled insulin achieved an HbA1c <8.0 (82.7% vs 58.2%; P=.0003); however, inhaled insulin produced more adverse effects, including cough and hypoglycemia.
TABLE
Oral medications as monotherapy in type 2 diabetes mellitus1,2
| CLASS | DOSING INTERVAL | TYPICAL HBA1C REDUCTION | COST * PER MONTH† | CONTRAINDICATIONS/CAUTIONS |
|---|---|---|---|---|
| Sulfonylureas | 1x daily | 1.4%–1.8% | $ | DKA, caution in hepatic or renal disease |
| Metformin | 1–2x daily | 1.1%–2.0% | $$ | Congestive heart failure, acute or chronic metabolic acidosis, Cr ≥1.5 male, Cr ≥1.4 female, COPD, severe hepatic disease, alcoholism. Use caution in the elderly. |
| α-glucosidase inhibitors | 3x daily | 0.6%–1.0% | $$$ | Cr ≥2.0, abnormal baseline liver function tests, inflammatory bowel disease |
| Thiazolidinediones | 1–2x daily | 1.5%–1.6% | $$$–$$$$ | Class III to IV heart failure, baseline ALT >2.5 |
| Non-sulfonylurea secretagogues | 3x daily | 1.8%–1.9% | $$–$$$ | Caution with liver disease |
| * The “typical” range excludes the studies with the highest and lowest measured effects. | ||||
| † $ = $0 to $25; $$ = $25 to $60; $$$ = $60 to $120; $$$$ = $120 to $180. | ||||
| DKA, diabetic ketoacidosis; Cr, chromium; COPD, chronic obstructive pulmonary disease; ALT, alanine transaminease. | ||||
Recommendations from others
The International Diabetes Federation (IDF) recommends metformin as the initial oral agent unless contraindicated.8 A sulfonylurea is an acceptable alternative in patients who are not overweight. The IDF states that insulin should be added when oral agents fail.
The Institute for Clinical Systems Improvement (ICSI) says that the “single best choice drug for oral agent therapy for type 2 diabetes has not been determined” and must be chosen in the context of age, weight, and other comorbidities.9 The ICSI suggests metformin as an appropriate first agent for obese patients and recommends sulfonylureas or metformin as monotherapy for others because they are both economical and well tolerated. The American Diabetes Association does not specifically recommend a best initial agent or combination of agents for type 2 diabetes.10
1. Inzucchi SE. Oral antihyperglycemic therapy for type 2 diabetes. JAMA 2002;287:360-372.
2. Epocrates Drug Database. Available at: www2.epocrates.com/index.html. Accessed on May 18, 2006.
3. Yamanouchi T, Sakai T, Igarashi K, Ichiyanagi K, Watanabe H, Kawasaki T. Comparison of metabolic effects of pioglitazone, metformin, and glimepiride over 1 year in Japanese patients with newly diagnosed Type 2 diabetes. Diabetic Med 2005;22:980-985.
4. Van de Laar FA, Lucassen PLBJ, Akkermans RP, Van de Lisdonk EH, Rutten GEHM, Can Weel C. Alpha-glucosidase inhibitors for type 2 diabetes mellitus. Cochrane Database Syst Rev 2005, Issue 2.
5. Saenz A, Fernandez-Esteban I, Mataix A, Ausejo M, Roque M, Moher D. Metformin monotherapy for type 2 diabetes mellitus. Cochrane Database Syst Rev 2005, Issue 3.
6. UK Prospective Diabetes Study (UKPDS) Group. Effect of intensive blood-glucose control with metformin on complications in overweight patients with type 2 diabetes (UKPDS34). Lancet 1998;352:854-865.
7. DeFronzo RA, Bergenstal RM, Cefalu WT, et al. Efficacy of inhaled insulin in patients with type 2 diabetes not controlled with diet and exercise. Diabetes Care 2005;28:1922-1928.
8. IDF Clinical Guidelines Task Force. Global guideline for Type 2 diabetes. Brussels: International Diabetes Federation, 2005.
9. Institute for Clinical Systems Improvement (ICSI). Management of type 2 diabetes mellitus. Bloomington, Minn: Institute for Clinical Systems Improvement (ICSI); 2005 Nov. 79 p.
10. American Diabetes Association. Standard of medical care in diabetes-2006. Diabetes Care 2006;29:S4-S42.
Evidence-based answers from the Family Physicians Inquiries Network