User login
Discharge Before Return to Respiratory Baseline in Children with Neurologic Impairment
Children with neurologic impairment (NI; eg, hypoxic-ischemic encephalopathy, muscular dystrophy) are characterized by functional and/or intellectual impairments resulting from a variety of neurologic diseases.1 These children commonly have respiratory comorbidities, including central hypoventilation, impaired cough, and oromotor dysfunction, that may lead to chronic respiratory insufficiency and a need for chronic respiratory support at baseline.2,3 Baseline respiratory support modalities can include supplemental oxygen, noninvasive positive pressure ventilation, or invasive mechanical ventilation.
Acute respiratory infections (ARI; eg, pneumonia, bronchiolitis) are the most common cause of hospitalization, intensive care unit (ICU) admission, and death for children with NI.1,3 Discharge criteria for otherwise healthy children admitted to the hospital with ARI often include return to respiratory baseline.4 Children with complex chronic conditions have longer hospitalizations when hospitalized with respiratory infections,5-7 because, in part, comorbidities and complications prolong the time to return to baseline. This prolonged return to respiratory baseline in combination with family knowledge, comfort, and skill in managing respiratory support and other complexities at home may alter discharge practices in the population of children with NI. In our clinical experience, discharge before return to baseline respiratory support occurs more frequently in children with NI than in otherwise healthy children when hospitalized with ARI. However, the consequences of discharging children with NI prior to return to respiratory baseline are unknown.
In this study, we sought to determine if discharge prior to return to baseline respiratory support is associated with reutilization among children with NI hospitalized with ARI. We hypothesized that patients discharged prior to return to respiratory baseline would have higher rates of 30-day hospital reutilization.
METHODS
Study Design and Data Source
This single-center, retrospective cohort study of children hospitalized at Cincinnati Children’s Hospital Medical Center (CCHMC) used data from the Pediatric Health Information System (PHIS) and the electronic medical record (EMR). PHIS, an administrative database of 45 not-for-profit, tertiary care, US pediatric hospitals managed by Children’s Hospital Association (Lenexa, Kansas), was used to identify eligible children, examine demographic and clinical variables, and define outcomes. PHIS contains data regarding patient demographics, inpatient resource utilization, and diagnoses. Encrypted medical record numbers in PHIS allowed for local identification of patients’ medical records to complete EMR review to confirm eligibility and obtain detailed patient-level clinical information (eg, respiratory support needs) not available in PHIS.
Pilot medical record reviews allowed for standardized study definitions and procedures. All study staff underwent training with the primary investigator, including detailed review of 10 initial abstractions. Two investigators (K.M. and S.C.) performed repeat abstractions from 40 randomly selected records to enable assessment of interrater reliability. Average reliability, indicated by the κ statistic, indicated substantial to near-perfect reliability8 (κ = 0.97, 95% CI 0.90-1.00) for the primary exposure. EMR data were managed using Research Electronic Data Capture (REDCap, Nashville, Tennessee)9 and subsequently merged with PHIS data.
Study Population
Hospitalizations of children with NI aged 1 to 18 years at CCHMC between January 2010 and September 2015 were eligible for inclusion if they had a principal discharge diagnosis indicative of ARI and required increased respiratory support from baseline during hospitalization. NI was defined as a high-intensity, chronic neurological diagnosis with substantial functional impairments according to previously defined diagnosis codes.1,10 ARI was identified using codes in the Clinical Classification Software (Agency for Healthcare Research and Quality, Rockville, MD) respiratory group indicative of ARI (eg, pneumonia, bronchiolitis, influenza; Appendix Table).
Children transferred to CCHMC were excluded because records from their initial illness presentation and management were not available. Because of expected differences in management and outcomes, children with a known diagnosis of tuberculosis or human immunodeficiency virus were excluded. Because exposure criteria were dependent on hospital discharge status, hospitalizations for children who died during admission (4 of 632 hospitalizations, 0.63%) were excluded from the final cohort (Appendix Figure).
Study Definitions
Baseline respiratory support (ie, “respiratory baseline”) was defined as the child’s highest level of respiratory support needed prior to admission when well (ie, no support, supplemental oxygen, continuous positive airway pressure [CPAP] or bilevel positive airway pressure [BiPAP], or ventilator support), and further characterized by night or day/night requirement. Respiratory baseline was identified using EMR documentation of home respiratory support use at the time of index admission. Return to respiratory baseline was defined as the date on which the child achieved documented home respiratory support settings, regardless of clinical symptoms.
Children may have required increased respiratory support from baseline at any time during hospitalization. Maximum respiratory support required was categorized as one of the following: (1) initiation of supplemental oxygen or increase in oxygen flow or duration; (2) initiation of CPAP or BiPAP; (3) increase in pressure settings or duration of pressure support for those with baseline CPAP, BiPAP, or ventilator use; and (4) initiation of full mechanical ventilation. Respiratory support categories were mutually exclusive: children requiring multiple types of increased respiratory support were classified for analysis by the most invasive form of respiratory support used (eg, a child requiring increase in both oxygen flow and pressure settings was categorized as an increase in pressure settings). Children who received heated high-flow nasal cannula therapy as maximum support were categorized as initiation or increase in oxygen support.
Time to return to respiratory baseline was defined as the difference in days between date of return to respiratory baseline and date of admission. Time to return to respiratory baseline was determined only for children who were discharged at respiratory baseline.
Primary Exposure and Outcome Measures
The primary exposure was hospital discharge before return to respiratory baseline (ie, discharge on higher respiratory support than at baseline settings). At our institution, standardized discharge criteria for children with NI do not exist. The primary outcome was all-cause, 30-day hospital reutilization, including hospital readmissions and emergency department (ED) revisits. Secondary outcomes included 30-day reutilization for ARI and hospital length of stay (LOS) in days.
Patient Demographics and Clinical Characteristics
Demographic and patient characteristics that might influence hospital discharge before return to respiratory baseline or readmission were obtained from PHIS (eg, demographic information, age, insurance type, measures of clinical complexity, illness severity) and by EMR review (eg, baseline respiratory support needs, maximum respiratory support during hospitalization). Measures of clinical complexity included comorbid complex chronic conditions (CCCs)11-14 and technology dependence14-16 using previously defined diagnostic codes. Measures of illness severity included sepsis17 and ICU-level care. At our institution, children with baseline ventilator use do not require admission to the ICU unless they are clinically unstable.
Statistical Analysis
Continuous variables were described using medians and interquartile ranges (IQR). Categorical variables were described using counts and percentages. Patient characteristics and outcomes were stratified by primary exposure and compared using chi-square test or Fisher exact test for categorical variables and Wilcoxon rank sum test for continuous variables.
To examine the independent association between discharge before return to respiratory baseline and hospital reutilization, a generalized estimating equation was used that included potential confounders while accounting for within-patient clustering. Patient demographics included age, race, ethnicity, and insurance type; measures of clinical complexity included number of CCCs, technology dependence, and baseline respiratory support; and measures of acute illness severity included ARI diagnosis, degree of increase in respiratory support during hospitalization, and ICU-level care. LOS was also included in the model as a covariate because of its expected association with both exposure and outcome.
Secondary analyses were conducted using the outcome of 30-day reutilization for ARI. Subgroup analysis excluding hospitalizations of children lost to follow-up (ie, no encounters in the 6 months after hospital discharge) was also conducted. All analyses were performed with SAS v9.3 (SAS Institute, Cary, North Carolina). P values < .05 were considered statistically significant. This study was approved by the Institutional Review Board.
RESULTS
Study Cohort
A total of 632 hospitalizations experienced by 366 children with NI who were admitted with ARI were included (Appendix Figure). Most children (66.4%) in the cohort experienced only one hospitalization, 17.5% had two hospitalizations, 7.9% had three hospitalizations, and 8.2% had four or more hospitalizations. The median age at hospitalization was 5.0 years (IQR 2.8-10.5) and most hospitalizations were for children who were male (56.6%), white (78.3%), non-Hispanic (96.0%), and publicly insured (51.7%; Table 1). More than one-quarter (28.6%) of hospitalizations were for children with four or more CCCs, and in 73.4% of hospitalizations, children were technology dependent (Table 1). Baseline respiratory support was common (46.8%), including home mechanical ventilation in 11.1% of hospitalizations (Table 1). Bacterial pneumonia, including aspiration pneumonia, was the most common discharge diagnosis (50.5%, Table 1).

Demographic and Clinical Characteristics
Children were discharged before return to respiratory baseline in 30.4% of hospitalizations (Appendix Figure). Children discharged before return to respiratory baseline were older (median age 5.7 years, IQR 3.1-11.0, vs 4.9 years, IQR 2.6-9.7; P = .04) and more likely to be privately insured (54.2% vs 43.4%; P = .04), compared with children discharged at respiratory baseline (Table 1). Children discharged before return to respiratory baseline were also more likely to have a respiratory CCC (59.9% vs 30.9%; P < .001), have a respiratory technology dependence diagnosis code (44.8% vs 24.1%; P < .001), and have baseline respiratory support needs on EMR review (67.7% vs 37.7%; P < .001), compared with children discharged at baseline (Table 1).
Children discharged before return to respiratory baseline required significantly greater escalation in respiratory support during hospitalization, compared with children discharged at respiratory baseline, including higher rates of initiation of CPAP or BiPAP, increased pressure settings from baseline (for home CPAP, BiPAP, or ventilator users), and initiation of full mechanical ventilation (Table 1). Hospitalizations in which children were discharged before return to respiratory baseline were also more likely to include ICU care than were those for children discharged at baseline (52.1% vs 35.2%; P < .001; Table 1).
Clinical Outcomes and Utilization
Reutilization within 30 days occurred after 32.1% of hospitalizations, with 26.1% requiring hospital readmission and 6.0% requiring ED revisit (Table 2). There was no statistical association in either unadjusted (Table 2) or adjusted (Table 3) analysis between children discharged before return to respiratory baseline and 30-day all-cause hospital reutilizations, hospital readmissions, or ED revisits.

In analysis of secondary outcomes, 30-day reutilization because of ARI occurred after 21.5% of hospitalizations, with 19.0% requiring hospital readmission and 2.5% requiring ED revisit. Median hospital LOS for the cohort was 4 days (IQR 2-8; Table 2). Hospitalizations in which children were discharged before return to respiratory baseline were longer than in those discharged at baseline (median 6 days, IQR 3-11, vs 4 days, IQR 2-7; P < .001; Table 2).

For hospitalizations of children discharged at respiratory baseline, the median time to return to respiratory baseline was 3 days (IQR 1-5, complete range 0-80). In these encounters, discharge occurred soon after return to respiratory baseline (median 1 day, IQR 0-1.5, complete range 0-54).
In subgroup analysis excluding the 18 hospitalizations in which children were lost to follow-up (2.8% of the total cohort), discharge before return to respiratory baseline was not associated with 30-day all-cause hospital reutilization (Table 4).

DISCUSSION
In this retrospective cohort study, children with NI hospitalized with ARI were frequently discharged using increased respiratory support from baseline. However, those discharged before return to respiratory baseline, despite their greater clinical complexity and acute illness severity, did not have increased hospital reutilization, compared with children discharged at respiratory baseline. Our findings suggest that discharge before return to baseline respiratory support after ARI may be clinically appropriate in some children with NI.
With the growing emphasis on decreasing hospital costs, concern exists that patients are being discharged from hospitals “quicker and sicker,”18,19 with shortening lengths of stay and higher patient instability at discharge. Clinical instability at discharge has been associated with adverse postdischarge outcomes in adults with pneumonia20-23; however, studies evaluating discharge readiness have not examined the population of children with NI. Our findings of no difference in reutilization for children with NI discharged before return to respiratory baseline, which would be expected to approximate one or more clinical instabilities, contrast these concerns.
Clinicians caring for children with NI hospitalized with ARI may find it difficult to determine a child’s discharge readiness, in part because many children with NI have longer times to return to respiratory baseline and some never return to their pre-illness baseline.24 In otherwise healthy children hospitalized with respiratory infections such as pneumonia, discharge criteria typically include complete wean from respiratory support prior to discharge.4,25 In our study’s more complex children, whose parents already manage respiratory support at home, we hypothesize that discharging providers may be comfortable with discharge when the child has certain types of increased respiratory support compatible with home equipment, a parent skilled with monitoring the child’s respiratory status, and the support of an experienced outpatient provider and home nursing providers. At our institution, outpatient respiratory support weans are primarily performed by pediatric pulmonologists and, for isolated weaning of supplemental oxygen or time using support, by parents and outpatient pediatricians.
Another important factor in determining a child’s discharge readiness is the perspective of the child’s parent. Berry et al found that children whose parents believe they are not healthy enough for discharge are more likely to experience unplanned hospital readmissions,24 signaling the role of child- and family-specific factors in safe discharge decisions. Therefore, parents of children with NI should be proactively involved throughout the multidisciplinary discharge process,26,27 including the decision to discharge before return to respiratory baseline. Parents have identified ongoing provider support, opportunities to practice home care skills, and written instructions with contingency plans as important components of discharge readiness.28 Further work to create partnerships with these highly skilled caregivers in discharge decision making and transition planning are needed to promote safe discharge practices in this complex population.
In our study, children discharged before return to respiratory baseline were more likely to be older and privately insured compared with children discharged at respiratory baseline. Prior studies have found that social factors including low socioeconomic status influence ED provider admissions decisions for children with pneumonia.29,30 However, the role of socioeconomic factors in provider discharge decisions for children with NI has not been assessed. These traits may also be proxy markers of other sociodemographic factors, such as parent education level, financial hardship influencing ability to participate in a child’s care at the bedside, access to comprehensive outpatient primary care, and availability of private home nursing. We hypothesize that these related characteristics directly and indirectly influence provider discharge decisions.
Discharging providers are likely more comfortable with discharge prior to return to respiratory baseline when the family has private duty nursing in the home. Home nurses can assist families in providing increased respiratory support and recognizing respiratory problems that may arise following discharge. However, home nursing shortages are common nationwide.31,32 Low-income children, children with respiratory technology use, and children without Medicaid have been found to have larger gaps in home nursing availability.31,32 Further studies are needed to understand the role of home nursing availability in provider discharge decisions in this population.
This study has several limitations. The retrospective design of this study creates the potential for residual confounding; there may be other clinical or demographic factors influencing hospital discharge decisions that we are unable to capture using EMR review, including parental knowledge and comfort managing illness, quality of discharge instructions, frequency of follow-up visits, and presence of skilled home nursing services. Categorization of children based on respiratory support status at discharge lends potential for misclassification of exposure; however, our substantial interrater reliability suggests that misclassification bias is small. This study’s primary finding indicated no difference between exposure groups; although we may be unable to detect small differences, we had sufficient power with our sample size to detect meaningful differences in reutilization outcomes.
This study was not designed to capture outpatient time to return to respiratory baseline; prospective studies are needed to identify rates of return to respiratory baseline following ARI in children with NI. We did not measure the level of respiratory support used by children at the time of discharge and, therefore, are unable to estimate the amount of respiratory support weaning needed following discharge or the compatibility of support with home equipment using our data. In addition, this study focused on respiratory support modalities and, thus, did not measure inpatient utilization of mucociliary clearance technologies that might be hypothesized to decrease the time to return to baseline respiratory support. Next steps in evaluating treatment of ARI include investigating the effect of mucociliary clearance on both exposure and outcome in this population.
There may be other clinically meaningful outcomes for this population apart from reutilization that we have not assessed in this study, including increased respiratory support required following discharge, primary care reutilization, healthcare costs, or parent satisfaction with timing of and outcomes after discharge. Finally, although our hospital has reutilization rates for children with NI that are similar to other institutions in the United States,33 our results may not be generalizable to children with NI hospitalized at other institutions because local discharge processes and systems of care may be different. Prospective, multicenter investigation is needed to evaluate the clinical consequences of discharge before return to respiratory baseline more broadly.
CONCLUSION
At our institution, approximately one-quarter of children with NI hospitalized with ARI were discharged before return to respiratory baseline, but these children were not at increased risk of reutilization, compared with children discharged at respiratory baseline. Our findings suggest that return to baseline respiratory support might not be a necessary component of hospital discharge criteria. In otherwise clinically stable children with NI, discharge before return to respiratory baseline may be reasonable if their parents are comfortable managing respiratory support at home.
Acknowledgments
The authors thank Jonathan Rodean of the Children’s Hospital Association for his assistance with abstraction of PHIS data.
1. Berry JG, Poduri A, Bonkowsky JL, et al. Trends in resource utilization by children with neurological impairment in the United States inpatient health care system: a repeat cross-sectional study. PLoS Med. 2012;9(1):e1001158. https://doi.org/10.1371/journal.pmed.1001158.
2. Srivastava R, Jackson WD, Barnhart DC. Dysphagia and gastroesophageal reflux disease: dilemmas in diagnosis and management in children with neurological impairment. Pediatr Ann. 2010;39(4):225-231. https://doi.org/10.3928/00904481-20100318-07.
3. Seddon PC, Khan Y. Respiratory problems in children with neurological impairment. Arch Dis Child. 2003;88(1):75-78. https://doi.org/10.1136/adc.88.1.75.
4. White CM, Statile AM, White DL, et al. Using quality improvement to optimise paediatric discharge efficiency. BMJ Qual Saf. 2014;23(5):428-436. https://doi.org/10.1136/bmjqs-2013-002556.
5. Leyenaar JK, Lagu T, Shieh MS, Pekow PS, Lindenauer PK. Management and outcomes of pneumonia among children with complex chronic conditions. Pediatr Infect Dis J. 2014;33(9):907-911. https://doi.org/10.1097/INF.0000000000000317.
6. Stagliano DR, Nylund CM, Eide MB, Eberly MD. Children with Down syndrome are high-risk for severe respiratory syncytial virus disease. J Pediatr. 2015;166(3):703-709.e702. https://doi.org/10.1016/j.jpeds.2014.11.058.
7. Kaiser SV, Bakel LA, Okumura MJ, Auerbach AD, Rosenthal J, Cabana MD. Risk factors for prolonged length of stay or complications during pediatric respiratory hospitalizations. Hosp Pediatr. 2015;5(9):461-473. https://doi.org/10.1542/hpeds.2014-0246.
8. Landis JR, Koch GG. The measurement of observer agreement for categorical data. Biometrics. 1977;33(1):159-174.
9. Harris PA, Taylor R, Thielke R, Payne J, Gonzalez N, Conde JG. Research electronic data capture (REDCap)—a metadata-driven methodology and workflow process for providing translational research informatics support. J Biomed Inform. 2009;42(2):377-381. https://doi.org/10.1016/j.jbi.2008.08.010.
10. Thomson JE, Feinstein JA, Hall M, Gay JC, Butts B, Berry JG. Identification of children with high-intensity neurological impairment. JAMA Pediatr. 2019. https://doi.org/10.1001/jamapediatrics.2019.2672.
11. Feudtner C, Christakis DA, Connell FA. Pediatric deaths attributable to complex chronic conditions: a population-based study of Washington state, 1980-1997. Pediatrics. 2000;106(1 Pt 2):205-209.
12. Feudtner C, Hays RM, Haynes G, Geyer JR, Neff JM, Koepsell TD. Deaths attributed to pediatric complex chronic conditions: national trends and implications for supportive care services. Pediatrics. 2001;107(6):e99. https://doi.org/10.1542/peds.107.6.e99.
13. Feudtner C, Christakis DA, Zimmerman FJ, Muldoon JH, Neff JM, Koepsell TD.
14. Feudtner C, Feinstein JA, Zhong W, Hall M, Dai D. Pediatric complex chronic conditions classification system version 2: updated for ICD-10 and complex medical technology dependence and transplantation. BMC Pediatr. 2014;14:199. https://doi.org//10.1186/1471-2431-14-199.
15. Berry JG HD, Kuo DZ, Cohen E, et al. Hospital utilization and characteristics of patients experiencing recurrent readmissions within children’s hospitals. JAMA. 2011;305(7):682-690. https://doi.org/10.1001/jama.2011.122.
16. Feudtner C, Villareale NL, Morray B, Sharp V, Hays RM, Neff JM. Technology-dependency among patients discharged from a children’s hospital: a retrospective cohort study. BMC Pediatr. 2005;5(1):8. https://doi.org/10.1186/1471-2431-5-8.
17. Balamuth F, Weiss SL, Hall M, et al. Identifying pediatric severe sepsis and septic shock: accuracy of diagnosis codes. J Pediatr. 2015;167(6):1295-1300.e4. https://doi.org/10.1016/j.jpeds.2015.09.027.
18. Kosecoff J, Kahn KL, Rogers WH, et al. Prospective payment system and impairment at discharge. The ‘quicker-and-sicker’ story revisited. JAMA. 1990;264(15):1980-1983.
19. Qian X, Russell LB, Valiyeva E, Miller JE. “Quicker and sicker” under Medicare’s prospective payment system for hospitals: new evidence on an old issue from a national longitudinal survey. Bull Econ Res. 2011;63(1):1-27. https://doi.org/10.1111/j.1467-8586.2010.00369.x.
20. Halm EA, Fine MJ, Marrie TJ, et al. Time to clinical stability in patients hospitalized with community-acquired pneumonia: implications for practice guidelines. JAMA. 1998;279(18):1452-1457. https://doi.org/10.1001/jama.279.18.1452.
21. Halm EA, Fine MJ, Kapoor WN, Singer DE, Marrie TJ, Siu AL. Instability on hospital discharge and the risk of adverse outcomes in patients with pneumonia. Arch Intern Med. 2002;162(11):1278-1284. https://doi.org/10.1001/archinte.162.11.1278.
22. Wolf RB, Edwards K, Grijalva CG, et al. Time to clinical stability among children hospitalized with pneumonia. J Hosp Med. 2015;10(6):380-383. https://doi.org/10.1002/jhm.2370.
23. Capelastegui A, España PP, Bilbao A, et al. Pneumonia: criteria for patient instability on hospital discharge. Chest. 2008;134(3):595-600. https://doi.org/10.1378/chest.07-3039.
24. Berry JG, Ziniel SI, Freeman L, et al. Hospital readmission and parent perceptions of their child’s hospital discharge. Int J Qual Health Care. 2013;25(5):573-581. https://doi.org/10.1093/intqhc/mzt051.
25. Bradley JS, Byington CL, Shah SS, et al. The management of community-acquired pneumonia in infants and children older than 3 months of age: clinical practice guidelines by the Pediatric Infectious Diseases Society and the Infectious Diseases Society of America. Clin Infect Dis. 2011;53(7):e25-76. https://doi.org/10.1093/cid/cir531.
26. Statile AM, Schondelmeyer AC, Thomson JE, et al. Improving discharge efficiency in medically complex pediatric patients. Pediatrics. 2016;138(2):e20153832. https://doi.org/10.1542/peds.2015-3832.
27. Desai AD, Popalisky J, Simon TD, Mangione-Smith RM. The effectiveness of family-centered transition processes from hospital settings to home: a review of the literature. Hosp Pediatr. 2015;5(4):219-231. https://doi.org10.1542/hpeds.2014-0097.
28. Desai AD, Durkin LK, Jacob-Files EA, Mangione-Smith R. Caregiver perceptions of hospital to home transitions according to medical complexity: a qualitative study. Acad Pediatr. 2016;16(2):136-144. https://doi.org/10.1016/j.acap.2015.08.003.
29. Agha MM, Glazier RH, Guttmann A. Relationship between social inequalities and ambulatory care-sensitive hospitalizations persists for up to 9 years among children born in a major Canadian urban center. Ambul Pediatr. 2007;7(3):258-262. https://doi.org/10.1016/j.ambp.2007.02.005.
30. Flores G, Abreu M, Chaisson CE, Sun D. Keeping children out of hospitals: parents’ and physicians’ perspectives on how pediatric hospitalizations for ambulatory care-sensitive conditions can be avoided. Pediatrics. 2003;112(5):1021-1030. https://doi.org/10.1542/peds.112.5.1021.
31. Weaver MS, Wichman B, Bace S, et al. Measuring the impact of the home health nursing shortage on family caregivers of children receiving palliative care. J Hosp Palliat Nurs. 2018;20(3):260-265. https://doi.org/10.1097/NJH.0000000000000436.
32. Leonard BJ, Brust JD, Sielaff BH. Determinants of home care nursing hours for technology-assisted children. Public Health Nurs. 1991;8(4):239-244. https://doi.org/10.1111/j.1525-1446.1991.tb00663.x.
33. Cohen E, Berry JG, Camacho X, Anderson G, Wodchis W, Guttmann A. Patterns and costs of health care use of children with medical complexity. Pediatrics. 2012;130(6):e1463-1470. https://doi.org/10.1542/peds.2012-0175.
Children with neurologic impairment (NI; eg, hypoxic-ischemic encephalopathy, muscular dystrophy) are characterized by functional and/or intellectual impairments resulting from a variety of neurologic diseases.1 These children commonly have respiratory comorbidities, including central hypoventilation, impaired cough, and oromotor dysfunction, that may lead to chronic respiratory insufficiency and a need for chronic respiratory support at baseline.2,3 Baseline respiratory support modalities can include supplemental oxygen, noninvasive positive pressure ventilation, or invasive mechanical ventilation.
Acute respiratory infections (ARI; eg, pneumonia, bronchiolitis) are the most common cause of hospitalization, intensive care unit (ICU) admission, and death for children with NI.1,3 Discharge criteria for otherwise healthy children admitted to the hospital with ARI often include return to respiratory baseline.4 Children with complex chronic conditions have longer hospitalizations when hospitalized with respiratory infections,5-7 because, in part, comorbidities and complications prolong the time to return to baseline. This prolonged return to respiratory baseline in combination with family knowledge, comfort, and skill in managing respiratory support and other complexities at home may alter discharge practices in the population of children with NI. In our clinical experience, discharge before return to baseline respiratory support occurs more frequently in children with NI than in otherwise healthy children when hospitalized with ARI. However, the consequences of discharging children with NI prior to return to respiratory baseline are unknown.
In this study, we sought to determine if discharge prior to return to baseline respiratory support is associated with reutilization among children with NI hospitalized with ARI. We hypothesized that patients discharged prior to return to respiratory baseline would have higher rates of 30-day hospital reutilization.
METHODS
Study Design and Data Source
This single-center, retrospective cohort study of children hospitalized at Cincinnati Children’s Hospital Medical Center (CCHMC) used data from the Pediatric Health Information System (PHIS) and the electronic medical record (EMR). PHIS, an administrative database of 45 not-for-profit, tertiary care, US pediatric hospitals managed by Children’s Hospital Association (Lenexa, Kansas), was used to identify eligible children, examine demographic and clinical variables, and define outcomes. PHIS contains data regarding patient demographics, inpatient resource utilization, and diagnoses. Encrypted medical record numbers in PHIS allowed for local identification of patients’ medical records to complete EMR review to confirm eligibility and obtain detailed patient-level clinical information (eg, respiratory support needs) not available in PHIS.
Pilot medical record reviews allowed for standardized study definitions and procedures. All study staff underwent training with the primary investigator, including detailed review of 10 initial abstractions. Two investigators (K.M. and S.C.) performed repeat abstractions from 40 randomly selected records to enable assessment of interrater reliability. Average reliability, indicated by the κ statistic, indicated substantial to near-perfect reliability8 (κ = 0.97, 95% CI 0.90-1.00) for the primary exposure. EMR data were managed using Research Electronic Data Capture (REDCap, Nashville, Tennessee)9 and subsequently merged with PHIS data.
Study Population
Hospitalizations of children with NI aged 1 to 18 years at CCHMC between January 2010 and September 2015 were eligible for inclusion if they had a principal discharge diagnosis indicative of ARI and required increased respiratory support from baseline during hospitalization. NI was defined as a high-intensity, chronic neurological diagnosis with substantial functional impairments according to previously defined diagnosis codes.1,10 ARI was identified using codes in the Clinical Classification Software (Agency for Healthcare Research and Quality, Rockville, MD) respiratory group indicative of ARI (eg, pneumonia, bronchiolitis, influenza; Appendix Table).
Children transferred to CCHMC were excluded because records from their initial illness presentation and management were not available. Because of expected differences in management and outcomes, children with a known diagnosis of tuberculosis or human immunodeficiency virus were excluded. Because exposure criteria were dependent on hospital discharge status, hospitalizations for children who died during admission (4 of 632 hospitalizations, 0.63%) were excluded from the final cohort (Appendix Figure).
Study Definitions
Baseline respiratory support (ie, “respiratory baseline”) was defined as the child’s highest level of respiratory support needed prior to admission when well (ie, no support, supplemental oxygen, continuous positive airway pressure [CPAP] or bilevel positive airway pressure [BiPAP], or ventilator support), and further characterized by night or day/night requirement. Respiratory baseline was identified using EMR documentation of home respiratory support use at the time of index admission. Return to respiratory baseline was defined as the date on which the child achieved documented home respiratory support settings, regardless of clinical symptoms.
Children may have required increased respiratory support from baseline at any time during hospitalization. Maximum respiratory support required was categorized as one of the following: (1) initiation of supplemental oxygen or increase in oxygen flow or duration; (2) initiation of CPAP or BiPAP; (3) increase in pressure settings or duration of pressure support for those with baseline CPAP, BiPAP, or ventilator use; and (4) initiation of full mechanical ventilation. Respiratory support categories were mutually exclusive: children requiring multiple types of increased respiratory support were classified for analysis by the most invasive form of respiratory support used (eg, a child requiring increase in both oxygen flow and pressure settings was categorized as an increase in pressure settings). Children who received heated high-flow nasal cannula therapy as maximum support were categorized as initiation or increase in oxygen support.
Time to return to respiratory baseline was defined as the difference in days between date of return to respiratory baseline and date of admission. Time to return to respiratory baseline was determined only for children who were discharged at respiratory baseline.
Primary Exposure and Outcome Measures
The primary exposure was hospital discharge before return to respiratory baseline (ie, discharge on higher respiratory support than at baseline settings). At our institution, standardized discharge criteria for children with NI do not exist. The primary outcome was all-cause, 30-day hospital reutilization, including hospital readmissions and emergency department (ED) revisits. Secondary outcomes included 30-day reutilization for ARI and hospital length of stay (LOS) in days.
Patient Demographics and Clinical Characteristics
Demographic and patient characteristics that might influence hospital discharge before return to respiratory baseline or readmission were obtained from PHIS (eg, demographic information, age, insurance type, measures of clinical complexity, illness severity) and by EMR review (eg, baseline respiratory support needs, maximum respiratory support during hospitalization). Measures of clinical complexity included comorbid complex chronic conditions (CCCs)11-14 and technology dependence14-16 using previously defined diagnostic codes. Measures of illness severity included sepsis17 and ICU-level care. At our institution, children with baseline ventilator use do not require admission to the ICU unless they are clinically unstable.
Statistical Analysis
Continuous variables were described using medians and interquartile ranges (IQR). Categorical variables were described using counts and percentages. Patient characteristics and outcomes were stratified by primary exposure and compared using chi-square test or Fisher exact test for categorical variables and Wilcoxon rank sum test for continuous variables.
To examine the independent association between discharge before return to respiratory baseline and hospital reutilization, a generalized estimating equation was used that included potential confounders while accounting for within-patient clustering. Patient demographics included age, race, ethnicity, and insurance type; measures of clinical complexity included number of CCCs, technology dependence, and baseline respiratory support; and measures of acute illness severity included ARI diagnosis, degree of increase in respiratory support during hospitalization, and ICU-level care. LOS was also included in the model as a covariate because of its expected association with both exposure and outcome.
Secondary analyses were conducted using the outcome of 30-day reutilization for ARI. Subgroup analysis excluding hospitalizations of children lost to follow-up (ie, no encounters in the 6 months after hospital discharge) was also conducted. All analyses were performed with SAS v9.3 (SAS Institute, Cary, North Carolina). P values < .05 were considered statistically significant. This study was approved by the Institutional Review Board.
RESULTS
Study Cohort
A total of 632 hospitalizations experienced by 366 children with NI who were admitted with ARI were included (Appendix Figure). Most children (66.4%) in the cohort experienced only one hospitalization, 17.5% had two hospitalizations, 7.9% had three hospitalizations, and 8.2% had four or more hospitalizations. The median age at hospitalization was 5.0 years (IQR 2.8-10.5) and most hospitalizations were for children who were male (56.6%), white (78.3%), non-Hispanic (96.0%), and publicly insured (51.7%; Table 1). More than one-quarter (28.6%) of hospitalizations were for children with four or more CCCs, and in 73.4% of hospitalizations, children were technology dependent (Table 1). Baseline respiratory support was common (46.8%), including home mechanical ventilation in 11.1% of hospitalizations (Table 1). Bacterial pneumonia, including aspiration pneumonia, was the most common discharge diagnosis (50.5%, Table 1).
Demographic and Clinical Characteristics
Children were discharged before return to respiratory baseline in 30.4% of hospitalizations (Appendix Figure). Children discharged before return to respiratory baseline were older (median age 5.7 years, IQR 3.1-11.0, vs 4.9 years, IQR 2.6-9.7; P = .04) and more likely to be privately insured (54.2% vs 43.4%; P = .04), compared with children discharged at respiratory baseline (Table 1). Children discharged before return to respiratory baseline were also more likely to have a respiratory CCC (59.9% vs 30.9%; P < .001), have a respiratory technology dependence diagnosis code (44.8% vs 24.1%; P < .001), and have baseline respiratory support needs on EMR review (67.7% vs 37.7%; P < .001), compared with children discharged at baseline (Table 1).
Children discharged before return to respiratory baseline required significantly greater escalation in respiratory support during hospitalization, compared with children discharged at respiratory baseline, including higher rates of initiation of CPAP or BiPAP, increased pressure settings from baseline (for home CPAP, BiPAP, or ventilator users), and initiation of full mechanical ventilation (Table 1). Hospitalizations in which children were discharged before return to respiratory baseline were also more likely to include ICU care than were those for children discharged at baseline (52.1% vs 35.2%; P < .001; Table 1).
Clinical Outcomes and Utilization
Reutilization within 30 days occurred after 32.1% of hospitalizations, with 26.1% requiring hospital readmission and 6.0% requiring ED revisit (Table 2). There was no statistical association in either unadjusted (Table 2) or adjusted (Table 3) analysis between children discharged before return to respiratory baseline and 30-day all-cause hospital reutilizations, hospital readmissions, or ED revisits.
In analysis of secondary outcomes, 30-day reutilization because of ARI occurred after 21.5% of hospitalizations, with 19.0% requiring hospital readmission and 2.5% requiring ED revisit. Median hospital LOS for the cohort was 4 days (IQR 2-8; Table 2). Hospitalizations in which children were discharged before return to respiratory baseline were longer than in those discharged at baseline (median 6 days, IQR 3-11, vs 4 days, IQR 2-7; P < .001; Table 2).
For hospitalizations of children discharged at respiratory baseline, the median time to return to respiratory baseline was 3 days (IQR 1-5, complete range 0-80). In these encounters, discharge occurred soon after return to respiratory baseline (median 1 day, IQR 0-1.5, complete range 0-54).
In subgroup analysis excluding the 18 hospitalizations in which children were lost to follow-up (2.8% of the total cohort), discharge before return to respiratory baseline was not associated with 30-day all-cause hospital reutilization (Table 4).
DISCUSSION
In this retrospective cohort study, children with NI hospitalized with ARI were frequently discharged using increased respiratory support from baseline. However, those discharged before return to respiratory baseline, despite their greater clinical complexity and acute illness severity, did not have increased hospital reutilization, compared with children discharged at respiratory baseline. Our findings suggest that discharge before return to baseline respiratory support after ARI may be clinically appropriate in some children with NI.
With the growing emphasis on decreasing hospital costs, concern exists that patients are being discharged from hospitals “quicker and sicker,”18,19 with shortening lengths of stay and higher patient instability at discharge. Clinical instability at discharge has been associated with adverse postdischarge outcomes in adults with pneumonia20-23; however, studies evaluating discharge readiness have not examined the population of children with NI. Our findings of no difference in reutilization for children with NI discharged before return to respiratory baseline, which would be expected to approximate one or more clinical instabilities, contrast these concerns.
Clinicians caring for children with NI hospitalized with ARI may find it difficult to determine a child’s discharge readiness, in part because many children with NI have longer times to return to respiratory baseline and some never return to their pre-illness baseline.24 In otherwise healthy children hospitalized with respiratory infections such as pneumonia, discharge criteria typically include complete wean from respiratory support prior to discharge.4,25 In our study’s more complex children, whose parents already manage respiratory support at home, we hypothesize that discharging providers may be comfortable with discharge when the child has certain types of increased respiratory support compatible with home equipment, a parent skilled with monitoring the child’s respiratory status, and the support of an experienced outpatient provider and home nursing providers. At our institution, outpatient respiratory support weans are primarily performed by pediatric pulmonologists and, for isolated weaning of supplemental oxygen or time using support, by parents and outpatient pediatricians.
Another important factor in determining a child’s discharge readiness is the perspective of the child’s parent. Berry et al found that children whose parents believe they are not healthy enough for discharge are more likely to experience unplanned hospital readmissions,24 signaling the role of child- and family-specific factors in safe discharge decisions. Therefore, parents of children with NI should be proactively involved throughout the multidisciplinary discharge process,26,27 including the decision to discharge before return to respiratory baseline. Parents have identified ongoing provider support, opportunities to practice home care skills, and written instructions with contingency plans as important components of discharge readiness.28 Further work to create partnerships with these highly skilled caregivers in discharge decision making and transition planning are needed to promote safe discharge practices in this complex population.
In our study, children discharged before return to respiratory baseline were more likely to be older and privately insured compared with children discharged at respiratory baseline. Prior studies have found that social factors including low socioeconomic status influence ED provider admissions decisions for children with pneumonia.29,30 However, the role of socioeconomic factors in provider discharge decisions for children with NI has not been assessed. These traits may also be proxy markers of other sociodemographic factors, such as parent education level, financial hardship influencing ability to participate in a child’s care at the bedside, access to comprehensive outpatient primary care, and availability of private home nursing. We hypothesize that these related characteristics directly and indirectly influence provider discharge decisions.
Discharging providers are likely more comfortable with discharge prior to return to respiratory baseline when the family has private duty nursing in the home. Home nurses can assist families in providing increased respiratory support and recognizing respiratory problems that may arise following discharge. However, home nursing shortages are common nationwide.31,32 Low-income children, children with respiratory technology use, and children without Medicaid have been found to have larger gaps in home nursing availability.31,32 Further studies are needed to understand the role of home nursing availability in provider discharge decisions in this population.
This study has several limitations. The retrospective design of this study creates the potential for residual confounding; there may be other clinical or demographic factors influencing hospital discharge decisions that we are unable to capture using EMR review, including parental knowledge and comfort managing illness, quality of discharge instructions, frequency of follow-up visits, and presence of skilled home nursing services. Categorization of children based on respiratory support status at discharge lends potential for misclassification of exposure; however, our substantial interrater reliability suggests that misclassification bias is small. This study’s primary finding indicated no difference between exposure groups; although we may be unable to detect small differences, we had sufficient power with our sample size to detect meaningful differences in reutilization outcomes.
This study was not designed to capture outpatient time to return to respiratory baseline; prospective studies are needed to identify rates of return to respiratory baseline following ARI in children with NI. We did not measure the level of respiratory support used by children at the time of discharge and, therefore, are unable to estimate the amount of respiratory support weaning needed following discharge or the compatibility of support with home equipment using our data. In addition, this study focused on respiratory support modalities and, thus, did not measure inpatient utilization of mucociliary clearance technologies that might be hypothesized to decrease the time to return to baseline respiratory support. Next steps in evaluating treatment of ARI include investigating the effect of mucociliary clearance on both exposure and outcome in this population.
There may be other clinically meaningful outcomes for this population apart from reutilization that we have not assessed in this study, including increased respiratory support required following discharge, primary care reutilization, healthcare costs, or parent satisfaction with timing of and outcomes after discharge. Finally, although our hospital has reutilization rates for children with NI that are similar to other institutions in the United States,33 our results may not be generalizable to children with NI hospitalized at other institutions because local discharge processes and systems of care may be different. Prospective, multicenter investigation is needed to evaluate the clinical consequences of discharge before return to respiratory baseline more broadly.
CONCLUSION
At our institution, approximately one-quarter of children with NI hospitalized with ARI were discharged before return to respiratory baseline, but these children were not at increased risk of reutilization, compared with children discharged at respiratory baseline. Our findings suggest that return to baseline respiratory support might not be a necessary component of hospital discharge criteria. In otherwise clinically stable children with NI, discharge before return to respiratory baseline may be reasonable if their parents are comfortable managing respiratory support at home.
Acknowledgments
The authors thank Jonathan Rodean of the Children’s Hospital Association for his assistance with abstraction of PHIS data.
1. Berry JG, Poduri A, Bonkowsky JL, et al. Trends in resource utilization by children with neurological impairment in the United States inpatient health care system: a repeat cross-sectional study. PLoS Med. 2012;9(1):e1001158. https://doi.org/10.1371/journal.pmed.1001158.
2. Srivastava R, Jackson WD, Barnhart DC. Dysphagia and gastroesophageal reflux disease: dilemmas in diagnosis and management in children with neurological impairment. Pediatr Ann. 2010;39(4):225-231. https://doi.org/10.3928/00904481-20100318-07.
3. Seddon PC, Khan Y. Respiratory problems in children with neurological impairment. Arch Dis Child. 2003;88(1):75-78. https://doi.org/10.1136/adc.88.1.75.
4. White CM, Statile AM, White DL, et al. Using quality improvement to optimise paediatric discharge efficiency. BMJ Qual Saf. 2014;23(5):428-436. https://doi.org/10.1136/bmjqs-2013-002556.
5. Leyenaar JK, Lagu T, Shieh MS, Pekow PS, Lindenauer PK. Management and outcomes of pneumonia among children with complex chronic conditions. Pediatr Infect Dis J. 2014;33(9):907-911. https://doi.org/10.1097/INF.0000000000000317.
6. Stagliano DR, Nylund CM, Eide MB, Eberly MD. Children with Down syndrome are high-risk for severe respiratory syncytial virus disease. J Pediatr. 2015;166(3):703-709.e702. https://doi.org/10.1016/j.jpeds.2014.11.058.
7. Kaiser SV, Bakel LA, Okumura MJ, Auerbach AD, Rosenthal J, Cabana MD. Risk factors for prolonged length of stay or complications during pediatric respiratory hospitalizations. Hosp Pediatr. 2015;5(9):461-473. https://doi.org/10.1542/hpeds.2014-0246.
8. Landis JR, Koch GG. The measurement of observer agreement for categorical data. Biometrics. 1977;33(1):159-174.
9. Harris PA, Taylor R, Thielke R, Payne J, Gonzalez N, Conde JG. Research electronic data capture (REDCap)—a metadata-driven methodology and workflow process for providing translational research informatics support. J Biomed Inform. 2009;42(2):377-381. https://doi.org/10.1016/j.jbi.2008.08.010.
10. Thomson JE, Feinstein JA, Hall M, Gay JC, Butts B, Berry JG. Identification of children with high-intensity neurological impairment. JAMA Pediatr. 2019. https://doi.org/10.1001/jamapediatrics.2019.2672.
11. Feudtner C, Christakis DA, Connell FA. Pediatric deaths attributable to complex chronic conditions: a population-based study of Washington state, 1980-1997. Pediatrics. 2000;106(1 Pt 2):205-209.
12. Feudtner C, Hays RM, Haynes G, Geyer JR, Neff JM, Koepsell TD. Deaths attributed to pediatric complex chronic conditions: national trends and implications for supportive care services. Pediatrics. 2001;107(6):e99. https://doi.org/10.1542/peds.107.6.e99.
13. Feudtner C, Christakis DA, Zimmerman FJ, Muldoon JH, Neff JM, Koepsell TD.
14. Feudtner C, Feinstein JA, Zhong W, Hall M, Dai D. Pediatric complex chronic conditions classification system version 2: updated for ICD-10 and complex medical technology dependence and transplantation. BMC Pediatr. 2014;14:199. https://doi.org//10.1186/1471-2431-14-199.
15. Berry JG HD, Kuo DZ, Cohen E, et al. Hospital utilization and characteristics of patients experiencing recurrent readmissions within children’s hospitals. JAMA. 2011;305(7):682-690. https://doi.org/10.1001/jama.2011.122.
16. Feudtner C, Villareale NL, Morray B, Sharp V, Hays RM, Neff JM. Technology-dependency among patients discharged from a children’s hospital: a retrospective cohort study. BMC Pediatr. 2005;5(1):8. https://doi.org/10.1186/1471-2431-5-8.
17. Balamuth F, Weiss SL, Hall M, et al. Identifying pediatric severe sepsis and septic shock: accuracy of diagnosis codes. J Pediatr. 2015;167(6):1295-1300.e4. https://doi.org/10.1016/j.jpeds.2015.09.027.
18. Kosecoff J, Kahn KL, Rogers WH, et al. Prospective payment system and impairment at discharge. The ‘quicker-and-sicker’ story revisited. JAMA. 1990;264(15):1980-1983.
19. Qian X, Russell LB, Valiyeva E, Miller JE. “Quicker and sicker” under Medicare’s prospective payment system for hospitals: new evidence on an old issue from a national longitudinal survey. Bull Econ Res. 2011;63(1):1-27. https://doi.org/10.1111/j.1467-8586.2010.00369.x.
20. Halm EA, Fine MJ, Marrie TJ, et al. Time to clinical stability in patients hospitalized with community-acquired pneumonia: implications for practice guidelines. JAMA. 1998;279(18):1452-1457. https://doi.org/10.1001/jama.279.18.1452.
21. Halm EA, Fine MJ, Kapoor WN, Singer DE, Marrie TJ, Siu AL. Instability on hospital discharge and the risk of adverse outcomes in patients with pneumonia. Arch Intern Med. 2002;162(11):1278-1284. https://doi.org/10.1001/archinte.162.11.1278.
22. Wolf RB, Edwards K, Grijalva CG, et al. Time to clinical stability among children hospitalized with pneumonia. J Hosp Med. 2015;10(6):380-383. https://doi.org/10.1002/jhm.2370.
23. Capelastegui A, España PP, Bilbao A, et al. Pneumonia: criteria for patient instability on hospital discharge. Chest. 2008;134(3):595-600. https://doi.org/10.1378/chest.07-3039.
24. Berry JG, Ziniel SI, Freeman L, et al. Hospital readmission and parent perceptions of their child’s hospital discharge. Int J Qual Health Care. 2013;25(5):573-581. https://doi.org/10.1093/intqhc/mzt051.
25. Bradley JS, Byington CL, Shah SS, et al. The management of community-acquired pneumonia in infants and children older than 3 months of age: clinical practice guidelines by the Pediatric Infectious Diseases Society and the Infectious Diseases Society of America. Clin Infect Dis. 2011;53(7):e25-76. https://doi.org/10.1093/cid/cir531.
26. Statile AM, Schondelmeyer AC, Thomson JE, et al. Improving discharge efficiency in medically complex pediatric patients. Pediatrics. 2016;138(2):e20153832. https://doi.org/10.1542/peds.2015-3832.
27. Desai AD, Popalisky J, Simon TD, Mangione-Smith RM. The effectiveness of family-centered transition processes from hospital settings to home: a review of the literature. Hosp Pediatr. 2015;5(4):219-231. https://doi.org10.1542/hpeds.2014-0097.
28. Desai AD, Durkin LK, Jacob-Files EA, Mangione-Smith R. Caregiver perceptions of hospital to home transitions according to medical complexity: a qualitative study. Acad Pediatr. 2016;16(2):136-144. https://doi.org/10.1016/j.acap.2015.08.003.
29. Agha MM, Glazier RH, Guttmann A. Relationship between social inequalities and ambulatory care-sensitive hospitalizations persists for up to 9 years among children born in a major Canadian urban center. Ambul Pediatr. 2007;7(3):258-262. https://doi.org/10.1016/j.ambp.2007.02.005.
30. Flores G, Abreu M, Chaisson CE, Sun D. Keeping children out of hospitals: parents’ and physicians’ perspectives on how pediatric hospitalizations for ambulatory care-sensitive conditions can be avoided. Pediatrics. 2003;112(5):1021-1030. https://doi.org/10.1542/peds.112.5.1021.
31. Weaver MS, Wichman B, Bace S, et al. Measuring the impact of the home health nursing shortage on family caregivers of children receiving palliative care. J Hosp Palliat Nurs. 2018;20(3):260-265. https://doi.org/10.1097/NJH.0000000000000436.
32. Leonard BJ, Brust JD, Sielaff BH. Determinants of home care nursing hours for technology-assisted children. Public Health Nurs. 1991;8(4):239-244. https://doi.org/10.1111/j.1525-1446.1991.tb00663.x.
33. Cohen E, Berry JG, Camacho X, Anderson G, Wodchis W, Guttmann A. Patterns and costs of health care use of children with medical complexity. Pediatrics. 2012;130(6):e1463-1470. https://doi.org/10.1542/peds.2012-0175.
© 2020 Society of Hospital Medicine
Finding the Value in Personal Protective Equipment for Hospitalized Patients During a Pandemic and Beyond
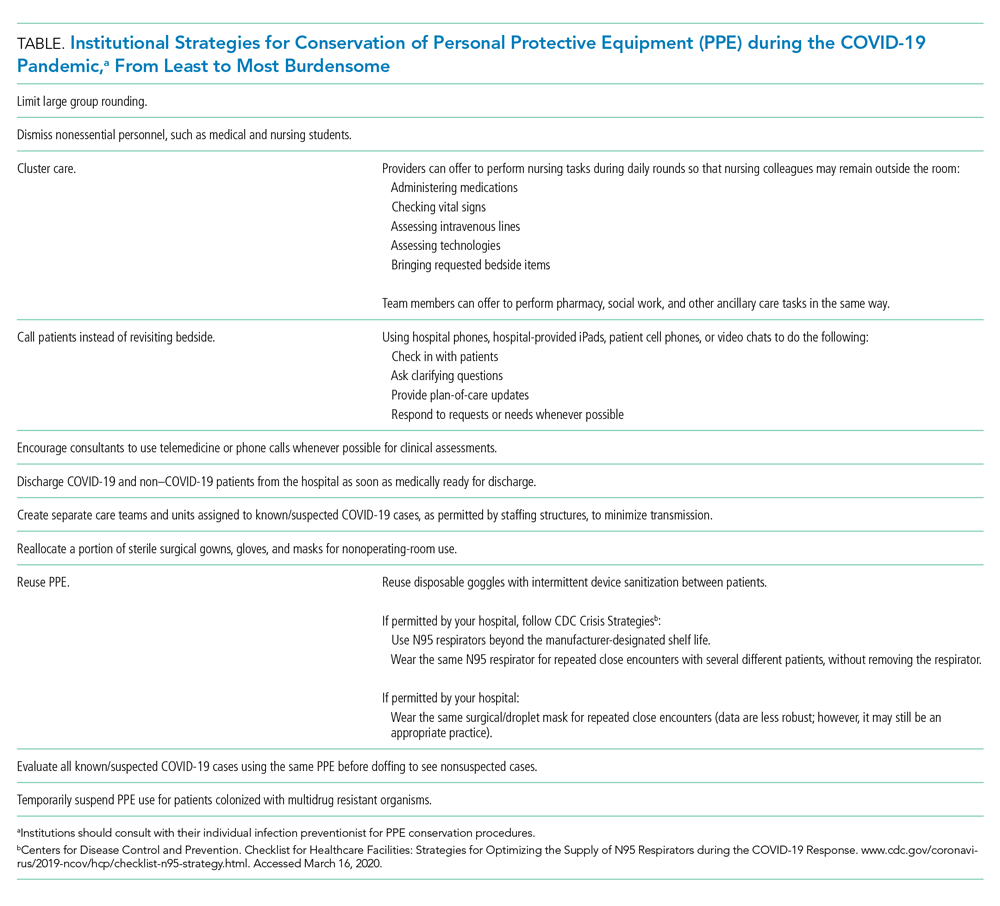
Due to the pandemic spread of the severe acute respiratory syndrome coronavirus 2 (SARS-CoV-2), the cause of COVID-19 infection, there is significant disruption to the global supply of PPE.2 Order volumes of PPE have increased, prices have surged, and distributors are experiencing challenges meeting order demands.3 With decreased overseas exports, suppliers have placed hospitals on PPE allocations, and many hospitals’ orders for PPE have been only partially filled.3,4 Unless hospitals have established stockpiles, most only have supplies for 3-7 days of routine use, leaving them vulnerable to exhausting PPE supplies. At the onset of the pandemic, 86% of United States hospitals reported concerns about their PPE supply.4
The potential for PPE shortages has led both the Centers for Disease Control and Prevention (CDC) and the World Health Organization to call for the rational and appropriate use of PPE in order to conserve supplies.2,3 By the time COVID-19 was declared a pandemic, 54% of hospitals had imposed PPE conservation protocols,4 with more expected to follow in the weeks and months to come. Innovative protocols have been conceptualized and used to conserve PPE in hospitals (Table).
Yet these conservation protocols often fail to identify missed opportunities to improve the value of PPE that already exist in hospital care. By defining the value of inpatient PPE, hospitals can identify opportunities for value improvement. Changes implemented now will maximize PPE value and preserve supply during this pandemic and beyond.
THE VALUE OF PPE
In order to conserve PPE supply, hospitals might consider limiting PPE to cases in which clear evidence exists to support its use. However, evidence for PPE use can be challenging to interpret because the impact of preventing nosocomial infections (an outcome that did not occur) is inherently problematic to measure. This makes assessing the value of PPE in preventing nosocomial transmission in specific situations difficult.
The basis of using PPE is its effectiveness in controlling outbreaks.1 A meta-analysis of 6 case-control studies from the SARS outbreak of 2003, which disproportionately infected healthcare workers, suggested that handwashing and PPE were effective in preventing disease transmission. Handwashing alone reduced transmission by 55%, wearing gloves by 57%, and wearing facemasks by 68%; the cumulative effect of handwashing, masks, gloves, and gowns reduced transmission by 91%.5 A cohort study of healthcare workers exposed to H1N1 influenza A in 2009 found that use of a facemask or an N95 respirator was associated with negative viral serology suggesting noninfected status.6 With respiratory syncytial virus (RSV) outbreaks, a narrative synthesis of 4 studies examining transmission also suggested gowns, facemasks, and eye protection are effective, with eye protection perhaps more effective than gowns and masks.7 Yet these studies’ conclusions are limited by study design differences and small sample sizes.
The evidence supporting PPE use for routine hospital conditions is more challenging to interpret. One pediatric study of seasonal respiratory viruses showed that adding droplet precautions to an existing policy of contact precautions alone decreased nosocomial infections for most viruses evaluated.8 Yet this study, like many of PPE use, is limited by sample size and possible misclassification of exposure and outcome biases. Because PPE is always utilized in conjunction with other preventive measures, isolating the impact of PPE is challenging, let alone isolating the individual effects of PPE components. In the absence of strong empirical evidence, hospitals must rely on the inherent rationale of PPE use for patient and healthcare worker safety in assessing its value.
In order to protect patients from disease transmission during a pandemic, hospitals might also reconsider whether to use PPE in cases in which evidence is absent, such as routine prevention for colonized but noninfected patients. However, evidence of the possible patient harms of PPE are emerging. Healthcare providers spend less time with isolated patients9,10 and document fewer vital signs.11 Patients in PPE may experience delays in admission12 and discharge,13 and have higher rates of falls, pressure ulcers, and medication errors.14,15 They may also experience higher rates of anxiety and depression.16 Yet no evidence suggests PPE use for noninfected patients prevents transmission to patients or to healthcare workers. Using PPE when it is not indicated deemphasizes the value of other preventative precautions (eg, handwashing), unnecessarily depletes PPE supply, and may create patient harm without added benefit. High-value PPE, both during a pandemic and beyond, is defined by a system designed so that healthcare workers use PPE when they need it, and do not use PPE when not indicated.
ORDERING PPE IN A COMPLEX HEALTHCARE ENVIRONMENT
While all hospitalized patients are admitted using standard precautions, decisions surrounding PPE can be nuanced for even experienced clinicians. Although the CDC does provide guidance for PPE use based on symptoms that correlate with potential for transmission (eg, patients with cough should be placed in at least droplet precautions),1 guidelines must rely on provider evaluation and interpretation. For instance, three etiologies of cough—pneumococcal pneumonia, RSV bronchiolitis, and pulmonary tuberculosis—would all require different PPE. The clinician must weigh the probabilities of each pathogen and assess the harm of not protecting against certain pathogens in his or her decision.
Amidst the stress and cognitive burdens placed on clinicians, accuracy in PPE decisions is easily deprioritized. Clinicians may not completely consider patient-specific indications for PPE, implications for patients and staff, and supply shortages. Although the CDC and many hospitals have PPE initiation and discontinuation criteria, clinicians may favor educated guesswork and reliance on past experience when guidelines are poorly accessible or poorly searchable. Such individual, nonstandardized decisions likely lead to variability in practice patterns, inaccuracies in PPE decisions, and ultimately waste of PPE resources.
WHERE OUR HOSPITAL USES PPE IN A LOW-VALUE WAY
At our institution, the inconveniences, cognitive burden, and perceived benefit of routine PPE interventions have created a system in which PPE is regularly overused. On our hospital medicine wards, we found that PPE was both over-ordered upon admission (eg, contact/droplet precautions ordered for influenza when droplet precautions only would have sufficed) and unnecessarily continued even after children met discontinuation criteria.
On discharge review from our general pediatric ward in 2019, 18% of children discharged with PPE orders no longer met criteria for PPE. Two conditions—community-acquired bacterial pneumonia and skin and soft-tissue infections—accounted for 47% of discharges with unnecessary PPE orders. At an estimated cost of $0.13-$0.53 for droplet precautions per use, $0.69 for contact precautions, and $0.82-$1.22 for both, the absolute cost of continuing PPE without indication could be as high as $61/day per patient when estimating 50 uses per day. This direct cost represents healthcare spending without added value when PPE are not necessary. Furthermore, the additional emotional cost to the patient and family in their hospitalization experience, the cost of clinician time donning and doffing, the environmental cost of PPE waste, and the cost to the limited PPE supply are not considered in these calculations.
During a pandemic characterized by PPE shortages nationwide, allowing missed opportunities for PPE discontinuation to persist is not only wasteful, but inattentive to public health.
OPPORTUNITIES FOR HOSPITALS TO MAXIMIZE THE VALUE OF PPE
For individual clinicians, opportunities exist to improve PPE usage in daily patient care. Clinicians should not overlook PPE decisions; instead they should make it a practice to review PPE orders daily during rounds as they would lab orders. Clinicians and nursing staff should work together to identify PPE discontinuation opportunities, leveraging the electronic medical record when possible. For the benefit of patients and families, clinicians and bedside staff should recognize and assist in managing patient expectations of PPE.
Hospitals should work to make PPE references easily accessible and interpretable by frontline clinicians. To minimize variability of use, PPE ordering for routine conditions should be standardized and streamlined, including discontinuation criteria. Hospitals should invest in behavioral health programs to support patients with conditions necessitating PPE and develop policies to ensure ancillary services are equally available to all patients. To alleviate concerns about limited clinician time spent with isolated patients, hospitals should assign clinician workloads while accounting for the known increased time needed to care for patients with PPE.
For hospitals with extreme supply shortages, conservation might include decreased use of PPE for conditions in which its use is controversial (eg, patients colonized with methicillin-resistant Staphylococcus aureus or multidrug resistant organisms) as has been trialed in institutions prior to this pandemic.17,18 Such PPE policy changes might occur in addition to, or in conjunction with, the conservation strategies suggested by other institutions (Table).
Healthcare systems should continually reassess the value of PPE for their hospitals and make changes accordingly. In the midst of difficulties directly demonstrating PPE’s value, hospitals must rely on the inherent rationale of PPE use in assessing value decisions weighed against harms while balancing healthcare worker protection regulations. Decisions should always occur while continuing other sensible infection-control procedures, such as handwashing and environmental hygiene measures.
To effect maximal change, healthcare systems should invest in redesigning PPE ordering systems at the highest level. This should include harnessing existing technologies to streamline PPE ordering decisions to meet clinicians’ cognitive needs. Decision support and auditing technologies could automate and monitor PPE orders efficiently. Likely to be most effective, an investment in creating and maintaining centralized PPE expert management teams to assess, order, and discontinue PPE would minimize individual ordering variation, minimize cost, and maximize value to patients, staff, and hospitals.
CONCLUSION
In this pandemic, we have the opportunity to rethink how we understand and use PPE in hospitalized patients. It is vitally important now more than ever to consciously conserve the limited supply of PPE resources. As we seek to increase healthcare value while limiting overuse and waste, PPE is a prime target for value improvement efforts as the effective but also burdensome tool that it is. Hospitalists are well-positioned to lead the redesign of how, when, and why PPE is used and to create a more optimized, lasting system that provides maximal value to patients, families, and healthcare workers during this current crisis and beyond.
1. Siegel JD, Rhinehart E, Jackson M, Chiarello L. 2007 Guideline for isolation precautions: preventing transmission of infectious agents in health care settings. Am J Infect Control. 2007;35(10 Suppl 2):S65-164. https://doi.org/10.1016/j.ajic.2007.10.007.
2. World Health Organization. Shortage of personal protective equipment endangering health workers worldwide. https://www.who.int/news-room/detail/03-03-2020-shortage-of-personal-protective-equipment-endangering-health-workers-worldwide. Accessed March 12, 2020.
3. Centers for Disease Control and Prevention. Coronavirus disease 2019 (COVID-19): healthcare supply of personal protective equipment. https://www.cdc.gov/coronavirus/2019-ncov/hcp/healthcare-supply-ppe.html. Accessed March 12, 2020.
4. Premier Inc. Premier Inc survey finds 86 percent of health systems are concerned about personal protective equipment shortages due to coronavirus. https://www.premierinc.com/newsroom/press-releases/premier-inc-survey-finds-86-percent-of-health-systems-are-concerned-about-personal-protective-equipment-shortages-due-to-coronavirus. Accessed March 22, 2020.
5. Jefferson T, Foxlee R, Del Mar C, et al. Physical interventions to interrupt or reduce the spread of respiratory viruses: systematic review. BMJ. 2008;336(7635):77-80. https://doi.org/10.1136/bmj.39393.510347.BE.
6. Jaeger JL, Patel M, Dharan N, et al. Transmission of 2009 pandemic influenza A (H1N1) virus among healthcare personnel-Southern California, 2009. Infect Control Hosp Epidemiol. 2011;32(12):1149-1157. https://doi.org/10.1086/662709.
7. French CE, McKenzie BC, Coope C, et al. Risk of nosocomial respiratory syncytial virus infection and effectiveness of control measures to prevent transmission events: a systematic review. Influenza Other Respir Viruses. 2016;10(4):268-290. https://doi.org/10.1111/irv.12379.
8. Rubin LG, Kohn N, Nullet S, Hill M. Reduction in rate of nosocomial respiratory virus infections in a children’s hospital associated with enhanced isolation precautions. Infect Control Hosp Epidemiol. 2018;39(2):152-156. https://doi.org/10.1017/ice.2017.282.
9. Dashiell-Earp CN, Bell DS, Ang AO, Uslan DZ. Do physicians spend less time with patients in contact isolation?: A time-motion study of internal medicine interns. JAMA Intern Med. 2014;174(5):814-815. https://doi.org/10.1001/jamainternmed.2014.537.
10. Saint S, Higgins LA, Nallamothu BK, Chenoweth C. Do physicians examine patients in contact isolation less frequently? A brief report. Am J Infect Control. 2003;31(6):354-356. https://doi.org/10.1016/S0196-6553(02)48250-8.
11. Kirkland KB, Weinstein JM. Adverse effects of contact isolation. Lancet. 1999(354):1177-1178. https://doi.org/10.1016/S0140-6736(99)04196-3.
12. McLemore A, Bearman G, Edmond MB. Effect of contact precautions on wait time from emergency room disposition to inpatient admission. Infect Control Hosp Epidemiol. 2011;32(3):298-299. https://doi.org/10.1086/658913.
13. Tran K, Bell C, Stall N, et al. The effect of hospital isolation precautions on patient outcomes and cost of care: a multi-site, retrospective, propensity score-matched cohort study. J Gen Intern Med. 2017;32(3):262-268. https://doi.org/10.1007/s11606-016-3862-4.
14. Karki S, Leder K, Cheng AC. Patients under contact precautions have an increased risk of injuries and medication errors: a retrospective cohort study. Infect Control Hosp Epidemiol. 2013;34(10):1118-1120. https://doi.org/10.1086/673153.
15. Stelfox HT, Bates DW, Redelmeier DA. Safety of patients isolated for infection control. JAMA. 2003;290(14):1899-1905. https://doi.org/10.1001/jama.290.14.1899.
16. Catalano G, Houston SH, Catalano MC, et al. Anxiety and depression in hospitalized patients in resistant organism isolation. South Med J. 2003;96(2):141-145. https://doi.org/10.1097/01.SMJ.0000050683.36014.2E.
17. Young K, Doernberg SB, Snedecor RF, Mallin E. Things we do for no reason: contact precautions for MRSA and VRE. J Hosp Med. 2019;14(3):178-180. https://doi.org/10.12788/jhm.3126.
18. Bearman G, Abbas S, Masroor N, et al. Impact of discontinuing contact precautions for methicillin-resistant Staphylococcus aureus and vancomycin-resistant Enterococcus: an interrupted time series analysis. Infect Control Hosp Epidemiol. 2018;39(6):676-682. https://doi.org/10.1017/ice.2018.57.
Due to the pandemic spread of the severe acute respiratory syndrome coronavirus 2 (SARS-CoV-2), the cause of COVID-19 infection, there is significant disruption to the global supply of PPE.2 Order volumes of PPE have increased, prices have surged, and distributors are experiencing challenges meeting order demands.3 With decreased overseas exports, suppliers have placed hospitals on PPE allocations, and many hospitals’ orders for PPE have been only partially filled.3,4 Unless hospitals have established stockpiles, most only have supplies for 3-7 days of routine use, leaving them vulnerable to exhausting PPE supplies. At the onset of the pandemic, 86% of United States hospitals reported concerns about their PPE supply.4
The potential for PPE shortages has led both the Centers for Disease Control and Prevention (CDC) and the World Health Organization to call for the rational and appropriate use of PPE in order to conserve supplies.2,3 By the time COVID-19 was declared a pandemic, 54% of hospitals had imposed PPE conservation protocols,4 with more expected to follow in the weeks and months to come. Innovative protocols have been conceptualized and used to conserve PPE in hospitals (Table).
Yet these conservation protocols often fail to identify missed opportunities to improve the value of PPE that already exist in hospital care. By defining the value of inpatient PPE, hospitals can identify opportunities for value improvement. Changes implemented now will maximize PPE value and preserve supply during this pandemic and beyond.
THE VALUE OF PPE
In order to conserve PPE supply, hospitals might consider limiting PPE to cases in which clear evidence exists to support its use. However, evidence for PPE use can be challenging to interpret because the impact of preventing nosocomial infections (an outcome that did not occur) is inherently problematic to measure. This makes assessing the value of PPE in preventing nosocomial transmission in specific situations difficult.
The basis of using PPE is its effectiveness in controlling outbreaks.1 A meta-analysis of 6 case-control studies from the SARS outbreak of 2003, which disproportionately infected healthcare workers, suggested that handwashing and PPE were effective in preventing disease transmission. Handwashing alone reduced transmission by 55%, wearing gloves by 57%, and wearing facemasks by 68%; the cumulative effect of handwashing, masks, gloves, and gowns reduced transmission by 91%.5 A cohort study of healthcare workers exposed to H1N1 influenza A in 2009 found that use of a facemask or an N95 respirator was associated with negative viral serology suggesting noninfected status.6 With respiratory syncytial virus (RSV) outbreaks, a narrative synthesis of 4 studies examining transmission also suggested gowns, facemasks, and eye protection are effective, with eye protection perhaps more effective than gowns and masks.7 Yet these studies’ conclusions are limited by study design differences and small sample sizes.
The evidence supporting PPE use for routine hospital conditions is more challenging to interpret. One pediatric study of seasonal respiratory viruses showed that adding droplet precautions to an existing policy of contact precautions alone decreased nosocomial infections for most viruses evaluated.8 Yet this study, like many of PPE use, is limited by sample size and possible misclassification of exposure and outcome biases. Because PPE is always utilized in conjunction with other preventive measures, isolating the impact of PPE is challenging, let alone isolating the individual effects of PPE components. In the absence of strong empirical evidence, hospitals must rely on the inherent rationale of PPE use for patient and healthcare worker safety in assessing its value.
In order to protect patients from disease transmission during a pandemic, hospitals might also reconsider whether to use PPE in cases in which evidence is absent, such as routine prevention for colonized but noninfected patients. However, evidence of the possible patient harms of PPE are emerging. Healthcare providers spend less time with isolated patients9,10 and document fewer vital signs.11 Patients in PPE may experience delays in admission12 and discharge,13 and have higher rates of falls, pressure ulcers, and medication errors.14,15 They may also experience higher rates of anxiety and depression.16 Yet no evidence suggests PPE use for noninfected patients prevents transmission to patients or to healthcare workers. Using PPE when it is not indicated deemphasizes the value of other preventative precautions (eg, handwashing), unnecessarily depletes PPE supply, and may create patient harm without added benefit. High-value PPE, both during a pandemic and beyond, is defined by a system designed so that healthcare workers use PPE when they need it, and do not use PPE when not indicated.
ORDERING PPE IN A COMPLEX HEALTHCARE ENVIRONMENT
While all hospitalized patients are admitted using standard precautions, decisions surrounding PPE can be nuanced for even experienced clinicians. Although the CDC does provide guidance for PPE use based on symptoms that correlate with potential for transmission (eg, patients with cough should be placed in at least droplet precautions),1 guidelines must rely on provider evaluation and interpretation. For instance, three etiologies of cough—pneumococcal pneumonia, RSV bronchiolitis, and pulmonary tuberculosis—would all require different PPE. The clinician must weigh the probabilities of each pathogen and assess the harm of not protecting against certain pathogens in his or her decision.
Amidst the stress and cognitive burdens placed on clinicians, accuracy in PPE decisions is easily deprioritized. Clinicians may not completely consider patient-specific indications for PPE, implications for patients and staff, and supply shortages. Although the CDC and many hospitals have PPE initiation and discontinuation criteria, clinicians may favor educated guesswork and reliance on past experience when guidelines are poorly accessible or poorly searchable. Such individual, nonstandardized decisions likely lead to variability in practice patterns, inaccuracies in PPE decisions, and ultimately waste of PPE resources.
WHERE OUR HOSPITAL USES PPE IN A LOW-VALUE WAY
At our institution, the inconveniences, cognitive burden, and perceived benefit of routine PPE interventions have created a system in which PPE is regularly overused. On our hospital medicine wards, we found that PPE was both over-ordered upon admission (eg, contact/droplet precautions ordered for influenza when droplet precautions only would have sufficed) and unnecessarily continued even after children met discontinuation criteria.
On discharge review from our general pediatric ward in 2019, 18% of children discharged with PPE orders no longer met criteria for PPE. Two conditions—community-acquired bacterial pneumonia and skin and soft-tissue infections—accounted for 47% of discharges with unnecessary PPE orders. At an estimated cost of $0.13-$0.53 for droplet precautions per use, $0.69 for contact precautions, and $0.82-$1.22 for both, the absolute cost of continuing PPE without indication could be as high as $61/day per patient when estimating 50 uses per day. This direct cost represents healthcare spending without added value when PPE are not necessary. Furthermore, the additional emotional cost to the patient and family in their hospitalization experience, the cost of clinician time donning and doffing, the environmental cost of PPE waste, and the cost to the limited PPE supply are not considered in these calculations.
During a pandemic characterized by PPE shortages nationwide, allowing missed opportunities for PPE discontinuation to persist is not only wasteful, but inattentive to public health.
OPPORTUNITIES FOR HOSPITALS TO MAXIMIZE THE VALUE OF PPE
For individual clinicians, opportunities exist to improve PPE usage in daily patient care. Clinicians should not overlook PPE decisions; instead they should make it a practice to review PPE orders daily during rounds as they would lab orders. Clinicians and nursing staff should work together to identify PPE discontinuation opportunities, leveraging the electronic medical record when possible. For the benefit of patients and families, clinicians and bedside staff should recognize and assist in managing patient expectations of PPE.
Hospitals should work to make PPE references easily accessible and interpretable by frontline clinicians. To minimize variability of use, PPE ordering for routine conditions should be standardized and streamlined, including discontinuation criteria. Hospitals should invest in behavioral health programs to support patients with conditions necessitating PPE and develop policies to ensure ancillary services are equally available to all patients. To alleviate concerns about limited clinician time spent with isolated patients, hospitals should assign clinician workloads while accounting for the known increased time needed to care for patients with PPE.
For hospitals with extreme supply shortages, conservation might include decreased use of PPE for conditions in which its use is controversial (eg, patients colonized with methicillin-resistant Staphylococcus aureus or multidrug resistant organisms) as has been trialed in institutions prior to this pandemic.17,18 Such PPE policy changes might occur in addition to, or in conjunction with, the conservation strategies suggested by other institutions (Table).
Healthcare systems should continually reassess the value of PPE for their hospitals and make changes accordingly. In the midst of difficulties directly demonstrating PPE’s value, hospitals must rely on the inherent rationale of PPE use in assessing value decisions weighed against harms while balancing healthcare worker protection regulations. Decisions should always occur while continuing other sensible infection-control procedures, such as handwashing and environmental hygiene measures.
To effect maximal change, healthcare systems should invest in redesigning PPE ordering systems at the highest level. This should include harnessing existing technologies to streamline PPE ordering decisions to meet clinicians’ cognitive needs. Decision support and auditing technologies could automate and monitor PPE orders efficiently. Likely to be most effective, an investment in creating and maintaining centralized PPE expert management teams to assess, order, and discontinue PPE would minimize individual ordering variation, minimize cost, and maximize value to patients, staff, and hospitals.
CONCLUSION
In this pandemic, we have the opportunity to rethink how we understand and use PPE in hospitalized patients. It is vitally important now more than ever to consciously conserve the limited supply of PPE resources. As we seek to increase healthcare value while limiting overuse and waste, PPE is a prime target for value improvement efforts as the effective but also burdensome tool that it is. Hospitalists are well-positioned to lead the redesign of how, when, and why PPE is used and to create a more optimized, lasting system that provides maximal value to patients, families, and healthcare workers during this current crisis and beyond.
1. Siegel JD, Rhinehart E, Jackson M, Chiarello L. 2007 Guideline for isolation precautions: preventing transmission of infectious agents in health care settings. Am J Infect Control. 2007;35(10 Suppl 2):S65-164. https://doi.org/10.1016/j.ajic.2007.10.007.
2. World Health Organization. Shortage of personal protective equipment endangering health workers worldwide. https://www.who.int/news-room/detail/03-03-2020-shortage-of-personal-protective-equipment-endangering-health-workers-worldwide. Accessed March 12, 2020.
3. Centers for Disease Control and Prevention. Coronavirus disease 2019 (COVID-19): healthcare supply of personal protective equipment. https://www.cdc.gov/coronavirus/2019-ncov/hcp/healthcare-supply-ppe.html. Accessed March 12, 2020.
4. Premier Inc. Premier Inc survey finds 86 percent of health systems are concerned about personal protective equipment shortages due to coronavirus. https://www.premierinc.com/newsroom/press-releases/premier-inc-survey-finds-86-percent-of-health-systems-are-concerned-about-personal-protective-equipment-shortages-due-to-coronavirus. Accessed March 22, 2020.
5. Jefferson T, Foxlee R, Del Mar C, et al. Physical interventions to interrupt or reduce the spread of respiratory viruses: systematic review. BMJ. 2008;336(7635):77-80. https://doi.org/10.1136/bmj.39393.510347.BE.
6. Jaeger JL, Patel M, Dharan N, et al. Transmission of 2009 pandemic influenza A (H1N1) virus among healthcare personnel-Southern California, 2009. Infect Control Hosp Epidemiol. 2011;32(12):1149-1157. https://doi.org/10.1086/662709.
7. French CE, McKenzie BC, Coope C, et al. Risk of nosocomial respiratory syncytial virus infection and effectiveness of control measures to prevent transmission events: a systematic review. Influenza Other Respir Viruses. 2016;10(4):268-290. https://doi.org/10.1111/irv.12379.
8. Rubin LG, Kohn N, Nullet S, Hill M. Reduction in rate of nosocomial respiratory virus infections in a children’s hospital associated with enhanced isolation precautions. Infect Control Hosp Epidemiol. 2018;39(2):152-156. https://doi.org/10.1017/ice.2017.282.
9. Dashiell-Earp CN, Bell DS, Ang AO, Uslan DZ. Do physicians spend less time with patients in contact isolation?: A time-motion study of internal medicine interns. JAMA Intern Med. 2014;174(5):814-815. https://doi.org/10.1001/jamainternmed.2014.537.
10. Saint S, Higgins LA, Nallamothu BK, Chenoweth C. Do physicians examine patients in contact isolation less frequently? A brief report. Am J Infect Control. 2003;31(6):354-356. https://doi.org/10.1016/S0196-6553(02)48250-8.
11. Kirkland KB, Weinstein JM. Adverse effects of contact isolation. Lancet. 1999(354):1177-1178. https://doi.org/10.1016/S0140-6736(99)04196-3.
12. McLemore A, Bearman G, Edmond MB. Effect of contact precautions on wait time from emergency room disposition to inpatient admission. Infect Control Hosp Epidemiol. 2011;32(3):298-299. https://doi.org/10.1086/658913.
13. Tran K, Bell C, Stall N, et al. The effect of hospital isolation precautions on patient outcomes and cost of care: a multi-site, retrospective, propensity score-matched cohort study. J Gen Intern Med. 2017;32(3):262-268. https://doi.org/10.1007/s11606-016-3862-4.
14. Karki S, Leder K, Cheng AC. Patients under contact precautions have an increased risk of injuries and medication errors: a retrospective cohort study. Infect Control Hosp Epidemiol. 2013;34(10):1118-1120. https://doi.org/10.1086/673153.
15. Stelfox HT, Bates DW, Redelmeier DA. Safety of patients isolated for infection control. JAMA. 2003;290(14):1899-1905. https://doi.org/10.1001/jama.290.14.1899.
16. Catalano G, Houston SH, Catalano MC, et al. Anxiety and depression in hospitalized patients in resistant organism isolation. South Med J. 2003;96(2):141-145. https://doi.org/10.1097/01.SMJ.0000050683.36014.2E.
17. Young K, Doernberg SB, Snedecor RF, Mallin E. Things we do for no reason: contact precautions for MRSA and VRE. J Hosp Med. 2019;14(3):178-180. https://doi.org/10.12788/jhm.3126.
18. Bearman G, Abbas S, Masroor N, et al. Impact of discontinuing contact precautions for methicillin-resistant Staphylococcus aureus and vancomycin-resistant Enterococcus: an interrupted time series analysis. Infect Control Hosp Epidemiol. 2018;39(6):676-682. https://doi.org/10.1017/ice.2018.57.
© 2020 Society of Hospital Medicine
Antibiotics for Aspiration Pneumonia in Neurologically Impaired Children
Neurologic impairment (NI) encompasses static and progressive diseases of the central and/or peripheral nervous systems that result in functional and intellectual impairments.1 While a variety of neurologic diseases are responsible for NI (eg, hypoxic-ischemic encephalopathy, muscular dystrophy), consequences of these diseases extend beyond neurologic manifestations.1 These children are at an increased risk for aspiration of oral and gastric contents given their common comorbidities of dysphagia, gastroesophageal reflux, impaired cough, and respiratory muscle weakness.2 While aspiration may manifest as a self-resolving pneumonitis, the presence of oral or enteric bacteria in aspirated material may result in the development of bacterial pneumonia. Children with NI hospitalized with aspiration pneumonia have higher complication rates, longer and costlier hospitalizations, and higher readmission rates when compared with children with nonaspiration pneumonia.3
While pediatric aspiration pneumonia is commonly attributed to anaerobic bacteria, this is largely based on extrapolation from epidemiologic studies that were conducted in past decades.4-8 A single randomized controlled trial found that penicillin and clindamycin, antimicrobials with similar antimicrobial activity against anaerobes, to be equally effective.9 However, the recent literature emphasizes the polymicrobial nature of aspiration pneumonia in adults, with the common isolation of Gram-negative enteric bacteria.10 Further, while Pseudomonas aeruginosa is often identified in respiratory cultures from children with NI and chronic respiratory insufficiency,11,12 the significance of P. aeruginosa in lower airways remains unclear.
We designed this study to compare hospital outcomes associated with the most commonly prescribed empiric antimicrobial therapies for aspiration pneumonia in children with NI.
MATERIALS AND METHODS
Study Design and Data Source
This multicenter, retrospective cohort study used the Pediatric Health Information System (PHIS) database. PHIS, an administrative database of 50 not-for-profit tertiary care pediatric hospitals, contains data regarding patient demographics, diagnoses and procedures, and daily billed resource utilization, including laboratory and imaging studies. Data quality and reliability are assured through the Children’s Hospital Association (CHA; Lenexa, Kansas) and participating hospitals. Due to incomplete data through the study period and data quality issues, six hospitals were excluded.
STUDY POPULATION
Inclusion Criteria
Children 1-18 years of age who were discharged between July 1, 2007 and June 30, 2015 were included if they had a NI diagnosis,1 a principal diagnosis indicative of aspiration pneumonia (507.x),3,13,14 and received antibiotics in the first two calendar days of admission. NI was determined using previously defined International Classification of Diseases, Ninth Revision-Clinical Modification (ICD-9-CM) diagnosis codes.1 We only included children who received antibiotics in the first two calendar days of admission to minimize the likelihood of including children admitted for other reasons who acquired aspiration pneumonia after hospitalization. For children with multiple hospitalizations, one admission was randomly selected for inclusion to minimize weighting results toward repeat visits.
Exclusion Criteria
Children transferred from another hospital were excluded as records from their initial presentation, including treatment and outcomes, were not available. We also excluded children with tracheostomy15,16 or chronic ventilator dependence,17 those with a diagnosis of human immunodeficiency virus or tuberculosis, and children who received chemotherapy during hospitalization given expected differences in etiology, treatment, and outcomes.18
Exposure
The primary exposure was antibiotic therapy received in the first two days of admission. Antibiotics were classified by their antimicrobial spectra of activity as defined by The Sanford Guide to Antimicrobial Therapy19 against the most commonly recognized pathogens of aspiration pneumonia: anaerobes, Gram-negatives, and P. aeruginosa (Appendix Table 1).10,20 For example, penicillin G and clindamycin were among the antibiotics classified as providing anaerobic coverage alone, whereas ceftriaxone was classified as providing Gram-negative coverage alone and ampicillin-sulbactam or as combination therapy with clindamycin and ceftriaxone were classified as providing anaerobic and Gram-negative coverage. Piperacillin-tazobactam and meropenem were classified as providing anaerobic, Gram-negative, and P. aeruginosa coverage. We excluded antibiotics that do not provide coverage against anaerobes, Gram-negative, or P. aeruginosa (eg, ampicillin, azithromycin) or that provide coverage against Gram-negative and P. aeruginosa, but not anaerobes (eg, cefepime, tobramycin), as these therapies were prescribed for <5% of the cohort. We chose not to examine the coverage for Streptococcus pneumonia or Staphylococcus aureus as antibiotics included in this analysis covered these bacteria for 99.9% of our cohort.
OUTCOMES
Outcomes included acute respiratory failure during hospitalization, intensive care unit (ICU) transfer, and hospital length of stay (LOS). Acute respiratory failure during hospitalization was defined as the presence of Clinical Transaction Classification (CTC) or ICD-9 procedure code for noninvasive or invasive mechanical ventilation on day two or later of hospitalization, with or without the need for respiratory support on day 0 or day 1 (Appendix Table 2). Given the variability in hospital policies that may drive ICU admission criteria for complex patients, our outcome of ICU transfer was defined as the requirement for ICU level care on day two or later of hospitalization without ICU admission. Acute respiratory failure and ICU care occurring within the first two hospital days were not classified as outcomes because these early events likely reflect illness severity at presentation rather than outcomes attributable to treatment failure; these were included as markers of severity in the models.
Patient Demographics and Clinical Characteristics
Demographic and clinical characteristics that might influence antibiotic choice and/or hospital outcomes were assessed. Clinical characteristics included complex chronic conditions,21-23 medical technology assistance,24 performance of diagnostic testing, and markers of severe illness on presentation. Diagnostic testing included bacterial cultures (blood, respiratory, urine) and chest radiograph performance in the first two days of hospitalization. Results of diagnostic testing are not available in the PHIS. Illness severity on presentation included acute respiratory failure, pleural drainage, receipt of vasoactive agents, and transfusion of blood products in the first two days of hospitalization (Appendix Table 2).17,25,26
STASTICAL ANALYSIS
Continuous data were described with median and interquartile ranges (IQR) due to nonnormal distribution. Categorical data were described with frequencies and percentages. Patient demographics, clinical characteristics, and hospital outcomes were stratified by empiric antimicrobial coverage and compared using chi-square and Kruskal–Wallis tests as appropriate.
Generalized linear mixed-effects models with random hospital intercepts were derived to assess the independent effect of antimicrobial spectra of activity on outcomes of acute respiratory failure, ICU transfer, and LOS while adjusting for important differences in demographic and clinical characteristics. LOS had a nonnormal distribution. Thus, we used an exponential distribution. Covariates were chosen a priori given the clinical and biological relevance to exposure and outcomes—age, presence of complex chronic condition diagnoses, the number of complex chronic conditions, technology dependence, the performance of diagnostic tests on presentation, and illness severity on presentation. ICU admission was included as a covariate in acute respiratory failure and LOS outcome models. The results of the model for acute respiratory failure and ICU transfer are presented as adjusted odds ratios (OR) with a 95% CI. LOS results are presented as adjusted rate ratios (RR) with 95% CI.
All analyses were performed with SAS 9.3 (SAS Institute, Cary, North Carolina). P values <.05 were considered statistically significant. Cincinnati Children’s Hospital Medical Center Institutional Review Board considered this deidentified dataset study as not human subjects research.
RESULTS
Study Cohort
At the 44 hospitals included, 4,812 children with NI hospitalized with the diagnosis of aspiration pneumonia met the eligibility criteria. However, 79 received antibiotics with the spectra of activity not examined, leaving 4,733 children in our final analysis (Appendix Figure). Demographic and clinical characteristics of the study cohort are shown in Table 1. Median age was five years (interquartile range [IQR]: 2-11 years). Most subjects were male (53.9%), non-Hispanic white (47.9%), and publicly insured (63.6%). There was a slight variation in the distribution of admissions across seasons (spring 31.6%, summer 19.2%, fall 21.3%, and winter 27.9%). One-third of children had four or more comorbid CCCs (complex chronic conditions; 34.2%). The three most common nonneurologic CCC diagnosis categories were gastrointestinal (63.1%), congenital and/or genetic defects (36.9%), and respiratory (8.9%). Assistance with medical technologies was also common (82%)—particularly gastrointestinal (63.1%) and neurologic/neuromuscular (9.8%) technologies. The vast majority of children (92.5%) had either a chest radiograph (90.5%), respiratory viral study (33.7%), or respiratory culture (10.0%) obtained on presentation. A minority required noninvasive or invasive respiratory support (25.4%), vasoactive agents (8.9%), blood products (1.2%), or pleural drainage (0.3%) in the first two hospital days.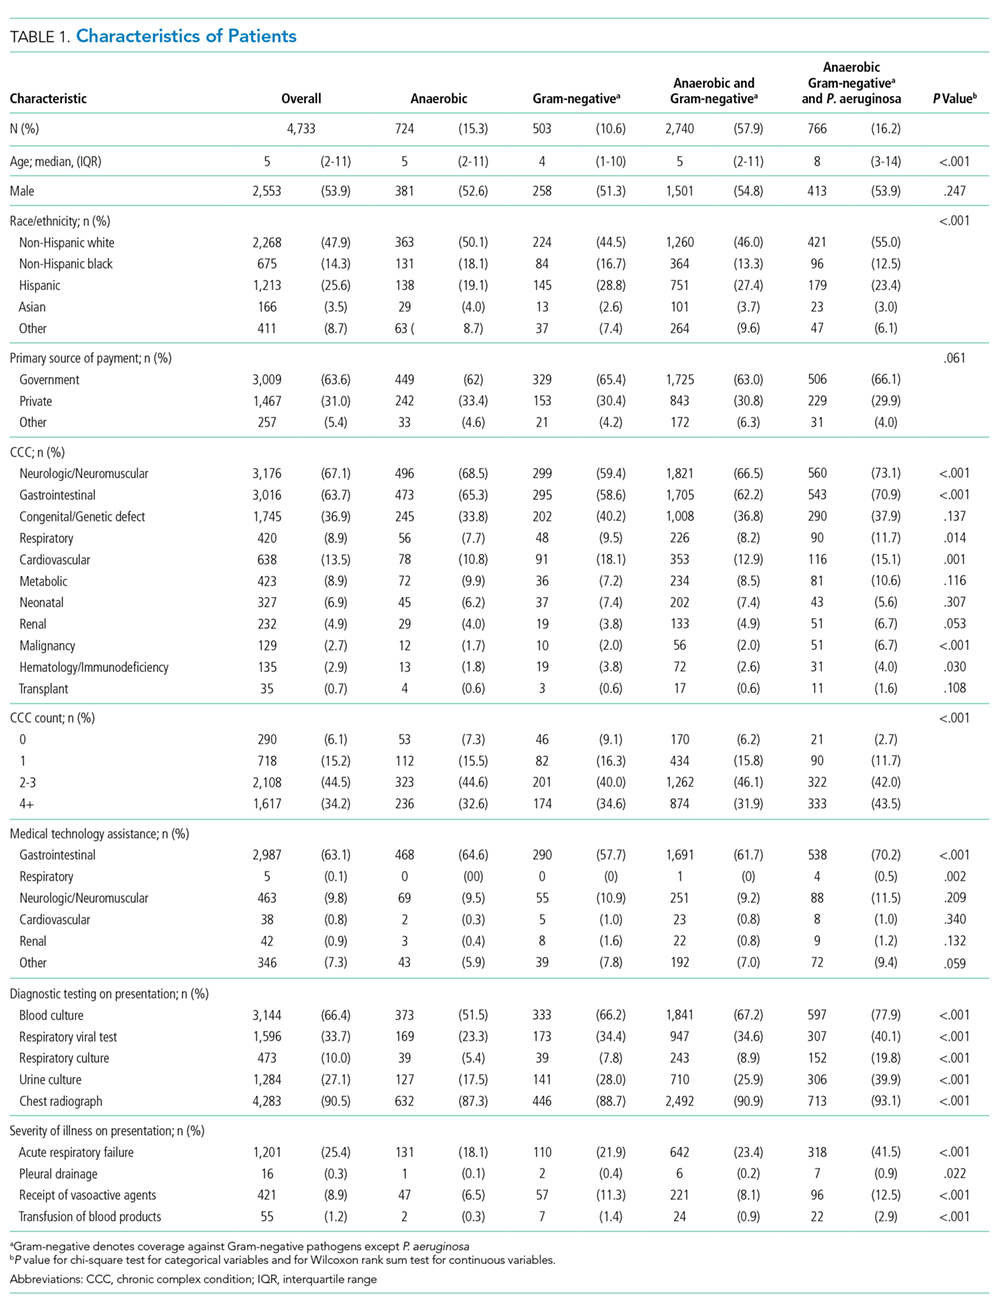
Spectrum of Antimicrobial Coverage
Most children (57.9%) received anaerobic and Gram-negative coverage; 16.2% received anaerobic, Gram-negative and P. aeruginosa coverage; 15.3% received anaerobic coverage alone; and 10.6% received Gram-negative coverage alone. Empiric antimicrobial coverage varied substantially across hospitals: anaerobic coverage was prescribed for 0%-44% of patients; Gram-negative coverage was prescribed for 3%-26% of patients; anaerobic and Gram-negative coverage was prescribed for 25%-90% of patients; and anaerobic, Gram-negative, and P. aeruginosa coverage was prescribed for 0%-65% of patients (Figure 1).
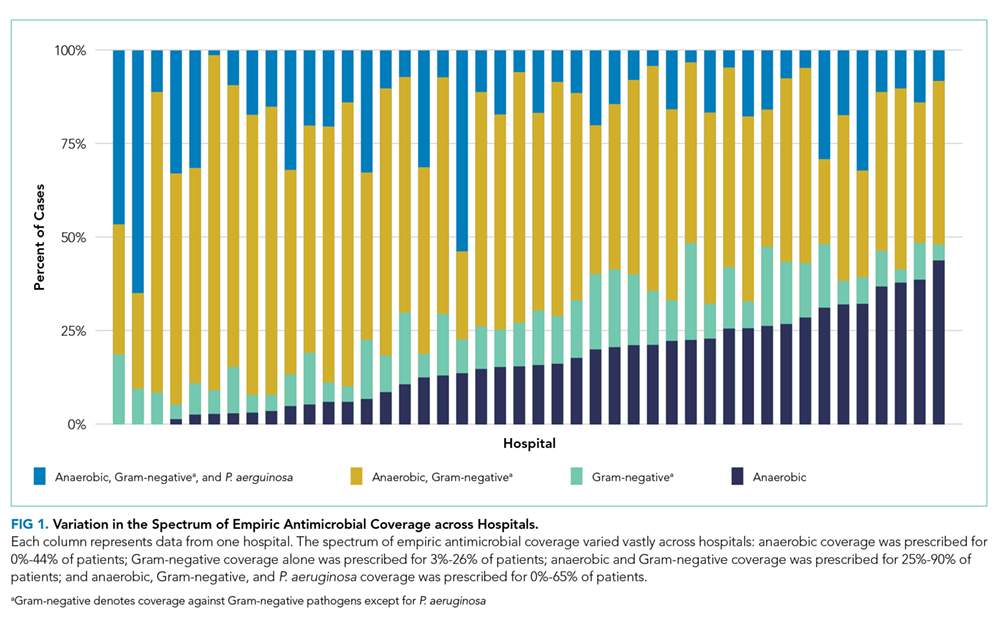
Outcomes
Acute Respiratory Failure
One-quarter (25.4%) of patients had acute respiratory failure on presentation; 22.5% required respiratory support (continued from presentation or were new) on day two or later of hospitalization (Table 2). In the adjusted analysis, children receiving Gram-negative coverage alone had two-fold greater odds (OR 2.15, 95% CI: 1.41-3.27) and children receiving anaerobic and Gram-negative coverage had 1.6-fold greater odds (OR 1.65, 95% CI: 1.19-2.28), of respiratory failure during hospitalization compared with those receiving anaerobic coverage alone (Figure 2). Odds of respiratory failure during hospitalization did not significantly differ for children receiving anaerobic, Gram-negative, and P. aeruginosa coverage compared with those receiving anaerobic coverage alone.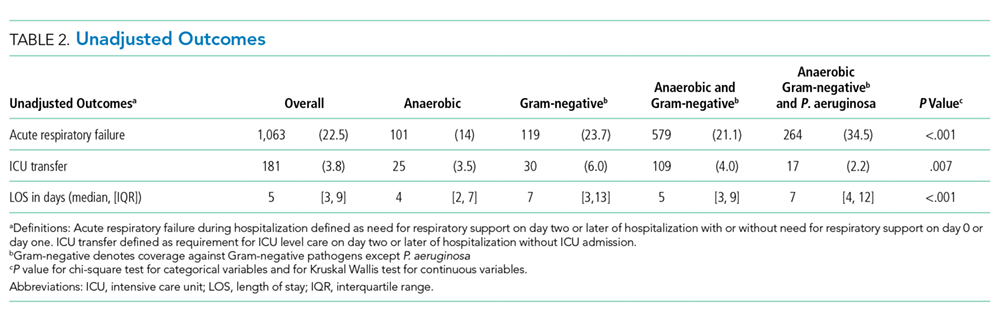
ICU Transfer
Nearly thirty percent (29.0%) of children required ICU admission, with an additional 3.8% requiring ICU transfer following admission (Table 2). In the multivariable analysis, the odds of an ICU transfer were greater for children receiving Gram-negative coverage alone (OR 1.80, 95% CI: 1.03-3.14) compared with those receiving anaerobic coverage alone. There was no statistical difference in ICU transfer for those receiving anaerobic and Gram-negative coverage (with or without P. aeruginosa coverage) compared with those receiving anaerobic coverage alone (Figure 2).
Length of Stay
Median hospital LOS for the total cohort was five days (IQR: 3-9 days; Table 2). In the multivariable analysis, children receiving Gram-negative coverage alone had a longer LOS (RR 1.28; 95% CI: 1.16-1.41) compared with those receiving anaerobic coverage alone, whereas children receiving anaerobic, Gram-negative, and P. aeruginosa coverage had a shorter LOS (RR 0.83; 95% CI: 0.76-0.90) than those receiving anaerobic coverage alone (Figure 2). There was no statistical difference in the LOS between children receiving anaerobic and Gram-negative coverage and those receiving anaerobic coverage alone.
DISCUSSION
In this multicenter study of children with NI hospitalized with aspiration pneumonia, we found substantial variation in empiric antimicrobial coverage for children with aspiration pneumonia. When comparing outcomes across groups, children who received anaerobic and Gram-negative coverage had outcomes similar to children who received anaerobic therapy alone. However, children who did not receive anaerobic coverage (ie, Gram-negative coverage alone) had worse outcomes, most notably a greater than two-fold increase in the odds of experiencing acute respiratory failure during hospitalization when compared with children receiving anaerobic therapy. These findings support prior literature that has highlighted the importance of anaerobic therapy in the treatment of aspiration pneumonia. The benefit of antibiotics targeting Gram-negative organisms, in addition to anaerobes, remains uncertain.
The variability in empiric antimicrobial coverage likely reflects the paucity of available information on oral and/or enteric bacteria required to identify them as causative organisms in aspiration pneumonia. In part, this problem is due to the difficulty in obtaining adequate sputum for culture from pediatric patients.27 While it may be more feasible to obtain tracheal aspirates for respiratory culture in children with a tracheostomy, interpretation of culture results remains challenging because the lower airways of children with tracheostomy are commonly colonized with bacterial pathogens.28 Thus, physicians are often left to choose empiric antimicrobial coverage with inadequate supporting evidence.29 Although the polymicrobial nature of aspiration pneumonia is well recognized in adult and pediatric literature,10,30 it is less clear which organisms are of pathological significance and require treatment.
The treatment standard for aspiration pneumonia has long included anaerobic therapy.29 The worse outcomes of children not receiving anaerobic therapy (ie, Gram-negative coverage alone) compared with children who received anaerobic therapy support the continued importance of anaerobic therapy in the treatment of aspiration pneumonia for hospitalized children with NI. The role of antibiotics covering Gram-negative organisms is less clear. Recent studies suggest the role of anaerobes is overemphasized in the etiology and treatment of aspiration pneumonia.10,29,31-38 Multiple studies on aspiration pneumonia bacteriology in hospitalized adults have demonstrated a predominance of Gram-negative organisms (ranging from 37%-71% of isolates identified on respiratory culture) and a relative scarcity of anaerobes (ranging from 0%-16% of isolates).31-37 A prospective study of 50 children hospitalized with clinical and radiographic evidence of pneumonia with known aspiration risk (eg, neuromuscular disease or dysphagia) found that ~80% of 163 bacterial isolates were Gram-negative.38 However, this study included repeat cultures from the same children, and thus, may overestimate the prevalence of Gram-negative organisms. In our study, children who received both anaerobic and Gram-negative therapy had no differences in ICU transfer or LOS but did experience higher odds of acute respiratory failure. As these results may be due to unmeasured confounding, future studies should further explore the necessity of Gram-negative coverage in addition to anaerobic coverage in this population.
While these recent studies may seem to suggest that anaerobic coverage is not necessary for aspiration pneumonia, there are important limitations worth noting. First, these studies used a variety of sampling techniques. While organisms grown from samples obtained via bronchoalveolar lavage31-34,36 are likely pathogenic, those grown from tracheal or oral samples obtained via percutaneous transtracheal aspiration,34 a protected specimen brush,34,36,37 or expectorated sputum35,38 may not represent lower airway organisms. Second, anaerobic cultures were not obtained in all studies.31,34,38 Anaerobic organisms are difficult to isolate using traditional clinical specimen collection techniques and aerobic culture media.18 Furthermore, anaerobes are not easily recovered from lung infections after the receipt of antibiotic therapy.39 Details regarding pretreatment, which are largely lacking from these studies, are necessary to interpret the relative scarcity of anaerobes on respiratory culture. Finally, caution should be taken when extrapolating the results of studies focused on the etiology and treatment of aspiration pneumonia in elderly adults to children. Our results, particularly in the context of the limitation of these more recent studies, suggest that the role of anaerobes has been underestimated.
Recent studies examining populations of children with cerebral palsy and/or tracheostomy have emphasized the high rates of carriage and infection rates with Gram-negative and drug-resistant bacteria; in particular, P. aeruginosa accounts for 50%-72% of pathogenic bacteria.11,12,38,40
Our multicenter observational study has several limitations. We used diagnosis codes to identify patients with aspiration pneumonia. As validated clinical criteria for the diagnosis of aspiration pneumonia do not exist, clinicians may assign a diagnosis of and treatment for aspiration pneumonia by subjective suspicion based on a child’s severe NI or illness severity on presentation leading to selection bias. Although administrative data are not able to verify pneumonia type with absolute certainty, we previously demonstrated that the differences in the outcomes of children with aspiration and nonaspiration pneumonia diagnosis codes persist after accounting for the complexity that might influence the diagnosis.3
Frthermore, we were unable to account for laboratory, microbiology, or radiology test results, and other management practices (eg, frequency of airway clearance, previous antimicrobial therapy) that may influence outcomes. Future studies should certainly include an examination of the concordance of the antibiotics prescribed with causative organisms, as this undoubtedly affects patient outcomes. Other outcomes are important to examine (eg, time to return to respiratory baseline), but we were unable to do so, given the lack of clinical detail in our database. We randomly selected a single hospitalization for children with multiple admissions; alternative methods could have different results. Although children with NI predominately use children’s hospitals,1 results may not be generalizable.
CONCLUSION
These findings support prior literature that has highlighted the important role anaerobic therapy plays in the treatment of aspiration pneumonia in children with NI. In light of the limitations of our study design, we believe that rigorous clinical trials comparing anaerobic with anaerobic and Gram-negative therapy are an important and necessary next step to determine the optimal treatment for aspiration pneumonia in this population.
Disclosures
The authors do not have any financial relationships relevant to this article to disclose.
Funding
Dr. Thomson was supported by the Agency for Healthcare Research and Quality (AHRQ) under award number K08HS025138. Dr. Ambroggio was supported by the National Institute for Allergy and Infectious Diseases (NIAID) under award number K01AI125413. The content is solely the responsibility of the authors and does not necessarily represent the official views of the AHRQ or NIAID.
1. Berry JG, Poduri A, Bonkowsky JL, et al. Trends in resource utilization by children with neurological impairment in the United States inpatient health care system: a repeat cross-sectional study. PLoS Med. 2012;9(1):e1001158. https://doi.org/10.1371/journal.pmed.1001158.
2. Seddon PC, Khan Y. Respiratory problems in children with neurological impairment. Arch Dis Child. 2003;88(1):75-78. https://doi.org/10.1136/adc.88.1.75.
3. Thomson J, Hall M, Ambroggio L, et al. Aspiration and non-aspiration pneumonia in hospitalized children with neurologic impairment. Pediatrics. 2016;137(2):e20151612. https://doi.org/10.1542/peds.2015-1612.
4. Brook I. Anaerobic pulmonary infections in children. Pediatr Emerg Care. 2004;20(9):636-640. https://doi.org/10.1097/01.pec.0000139751.63624.0b.
5. Bartlett JG, Gorbach SL. Treatment of aspiration pneumonia and primary lung abscess. Penicillin G vs clindamycin. JAMA. 1975;234(9):935-937. https://doi.org/10.1001/jamadermatol.2017.0297.
6. Bartlett JG, Gorbach SL, Finegold SM. The bacteriology of aspiration pneumonia. Am J Med. 1974;56(2):202-207. https://doi.org/10.1016/0002-9343(74)90598-1.
7. Lode H. Microbiological and clinical aspects of aspiration pneumonia. J Antimicrob Chemother. 1988;21:83-90. https://doi.org/10.1093/jac/21.suppl_c.83.
8. Brook I. Treatment of aspiration or tracheostomy-associated pneumonia in neurologically impaired children: effect of antimicrobials effective against anaerobic bacteria. Int J Pediatr Otorhinolaryngol. 1996;35(2):171-177. https://doi.org/10.1016/0165-5876(96)01332-8.
9. Jacobson SJ, Griffiths K, Diamond S, et al. A randomized controlled trial of penicillin vs clindamycin for the treatment of aspiration pneumonia in children. Arch Pediatr Adolesc Med. 1997;151(7):701-704. https://doi.org/10.1001/archpedi.1997.02170440063011.
10. DiBardino DM, Wunderink RG. Aspiration pneumonia: a review of modern trends. J Crit Care. 2015;30(1):40-48. https://doi.org/10.1016/j.jcrc.2014.07.011.
11. Gerdung CA, Tsang A, Yasseen AS, 3rd, Armstrong K, McMillan HJ, Kovesi T. Association between chronic aspiration and chronic airway infection with Pseudomonas aeruginosa and other Gram-negative bacteria in children with cerebral palsy. Lung. 2016;194(2):307-314. https://doi.org/10.1007/s00408-016-9856-5.
12. Thorburn K, Jardine M, Taylor N, Reilly N, Sarginson RE, van Saene HK. Antibiotic-resistant bacteria and infection in children with cerebral palsy requiring mechanical ventilation. Pedr Crit Care Med. 2009;10(2):222-226. https://doi.org/10.1097/PCC.0b013e31819368ac.
13. Lanspa MJ, Jones BE, Brown SM, Dean NC. Mortality, morbidity, and disease severity of patients with aspiration pneumonia. J Hosp Med. 2013;8(2):83-90. https://doi.org/10.1002/jhm.1996.
14. Lanspa MJ, Peyrani P, Wiemken T, Wilson EL, Ramirez JA, Dean NC. Characteristics associated with clinician diagnosis of aspiration pneumonia: a descriptive study of afflicted patients and their outcomes. J Hosp Med. 2015;10(2):90-96. https://doi.org/10.1002/jhm.2280.
15. Berry JG, Graham RJ, Roberson DW, et al. Patient characteristics associated with in-hospital mortality in children following tracheotomy. Arch Dis Child. 2010;95(9):703-710.
16. Berry JG, Graham DA, Graham RJ, et al. Predictors of clinical outcomes and hospital resource use of children after tracheotomy. Pediatrics. 2009;124(2):563-572. https://doi.org/10.1136/adc.2009.180836.
17. Balamuth F, Weiss SL, Hall M, et al. Identifying pediatric severe sepsis and septic shock: Accuracy of diagnosis codes. J Pediatr. 2015;167(6):1295-1300 e1294. https://doi.org/10.1016/j.jpeds.2015.09.027.
18. American Academy of Pediatrics., Pickering LK, American Academy of Pediatrics. Committee on Infectious Diseases. In: Red book : 2012 report of the Committee on Infectious Diseases. 29th ed. Elk Grove Village: American Academy of Pediatrics; 2012.
19. Gilbert DN. The Sanford Guide to Antimicrobial Therapy 2014. 44th ed. Sperryville: Antimicrobial Therapy, Inc; 2011.
20. Marik PE. Aspiration pneumonitis and aspiration pneumonia. N Engl J Med. 2001;344(9):665-671. https://doi.org/10.1056/NEJM200103013440908.
21. Feudtner C, Feinstein JA, Zhong W, Hall M, Dai D. Pediatric complex chronic conditions classification system version 2: updated for ICD-10 and complex medical technology dependence and transplantation. BMC Pediatrics. 2014;14:199. https://doi.org/10.1186/1471-2431-14-199.
22. Feudtner C, Hays RM, Haynes G, Geyer JR, Neff JM, Koepsell TD. Deaths attributed to pediatric complex chronic conditions: national trends and implications for supportive care services. Pediatrics. 2001;107(6):E99. https://doi.org/10.1542/peds.107.6.e99.
23. Feinstein JA, Russell S, DeWitt PE, Feudtner C, Dai D, Bennett TD. R package for pediatric complex chronic condition classification. JAMA Pediatr. 2018;172(6):596-598. https://doi.org/10.1001/jamapediatrics.2018.0256.
24. Berry JG, Hall DE, Kuo DZ, Cohen E, Agrawal R, Feudtner C, Hall M, Kueser J, Kaplan W, Neff J. Hospital utilization and characteristics of patients experiencing recurrent readmissions within children’s hospitals. JAMA. 2011;305(7):682-690. https://doi.org/10.1001/jama.2011.122.
25. Shah SS, Hall M, Newland JG, et al. Comparative effectiveness of pleural drainage procedures for the treatment of complicated pneumonia in childhood. J Hosp Med. 2011;6(5):256-263. https://doi.org/10.1002/jhm.872.
26. Child Health Corporation of America. CTC™ 2010 Code Structure: Module 5 Clinical Services. 2010 January 4; Available at https://sharepoint.chca.com/CHCAForums/PerformanceImprovement/PHIS/Reference Library/CTC Resources/Forms/AllItems.aspx Version: Modified.
27. Bradley JS, Byington CL, Shah SS, et al. The management of community-acquired pneumonia in infants and children older than 3 months of age: clinical practice guidelines by the Pediatric Infectious Diseases Society and the Infectious Diseases Society of America. Clin Infect Dis. 2011;53(7):e25-76. https://doi.org/10.1093/cid/cir531.
28. Brook I. Bacterial colonization, tracheobronchitis, and pneumonia following tracheostomy and long-term intubation in pediatric patients. Chest. 1979;76(4):420-424.
29. Waybright RA, Coolidge W, Johnson TJ. Treatment of clinical aspiration: a reappraisal. Am J Health Syst Pharm. 2013;70(15):1291-1300. https://doi.org/10.2146/ajhp120319.
30. Brook I, Finegold SM. Bacteriology of aspiration pneumonia in children. Pediatrics. 1980;65(6):1115-1120.
31. Wei C, Cheng Z, Zhang L, Yang J. Microbiology and prognostic factors of hospital- and community-acquired aspiration pneumonia in respiratory intensive care unit. Am J Infect Control. 2013;41(10):880-884. https://doi.org/10.1016/j.ajic.2013.01.007.
32. El-Solh AA, Pietrantoni C, Bhat A, et al. Microbiology of severe aspiration pneumonia in institutionalized elderly. Am J Respir Crit Care Med. 2003;167(12):1650-1654. https://doi.org/10.1164/rccm.200212-1543OC.
33. Tokuyasu H, Harada T, Watanabe E, et al. Effectiveness of meropenem for the treatment of aspiration pneumonia in elderly patients. Intern Med. 2009;48(3):129-135. https://doi.org/10.2169/internalmedicine.48.1308.
34. Ott SR, Allewelt M, Lorenz J, Reimnitz P, Lode H, German Lung Abscess Study Group. Moxifloxacin vs ampicillin/sulbactam in aspiration pneumonia and primary lung abscess. Infection. 2008;36(1):23-30. https://doi.org/10.1007/s15010-007-7043-6.
35. Kadowaki M, Demura Y, Mizuno S, et al. Reappraisal of clindamycin IV monotherapy for treatment of mild-to-moderate aspiration pneumonia in elderly patients. Chest. 2005;127(4):1276-1282. https://doi.org/10.1016/j.chest.2017.05.019.
36. Marik PE, Careau P. The role of anaerobes in patients with ventilator-associated pneumonia and aspiration pneumonia: a prospective study. Chest. 1999;115(1):178-183. https://doi.org/10.1378/chest.115.1.178.
37. Mier L, Dreyfuss D, Darchy B, et al. Is penicillin G an adequate initial treatment for aspiration pneumonia? A prospective evaluation using a protected specimen brush and quantitative cultures. Intensive Care Med. 1993;19(5):279-284. https://doi.org/10.1007/bf01690548.
38. Ashkenazi-Hoffnung L, Ari A, Bilavsky E, Scheuerman O, Amir J, Prais D. Pseudomonas aeruginosa identified as a key pathogen in hospitalised children with aspiration pneumonia and a high aspiration risk. Acta Paediatr. 2016;105(12):e588-e592. https://doi.org/10.1111/apa.13523.
39. Bartlett JG, Gorbach SL, Tally FP, Finegold SM. Bacteriology and treatment of primary lung abscess. Am Rev Respir Dis. 1974;109(5):510-518. https://doi.org/10.1164/arrd.1974.109.5.510.
40. Russell CJ, Simon TD, Mamey MR, Newth CJL, Neely MN. Pseudomonas aeruginosa and post-tracheotomy bacterial respiratory tract infection readmissions. Pediatr Pulmonol. 2017;52(9):1212-1218. https://doi.org/10.1002/ppul.23716.
41. Russell CJ, Mamey MR, Koh JY, Schrager SM, Neely MN, Wu S. Length of stay and hospital revisit after bacterial tracheostomy-associated respiratory tract infection hospitalizations. Hosp Pediatr. Hosp Pediatr. 2018;8(2):72-80. https://doi.org/10.1542/hpeds.2017-0106.
42. Russell CJ, Mack WJ, Schrager SM, Wu S. Care variations and outcomes for children hospitalized with bacterial tracheostomy-associated respiratory infections. Hosp Pediatr. 2017;7(1):16-23. https://doi.org/10.1542/hpeds.2016-0104.
Neurologic impairment (NI) encompasses static and progressive diseases of the central and/or peripheral nervous systems that result in functional and intellectual impairments.1 While a variety of neurologic diseases are responsible for NI (eg, hypoxic-ischemic encephalopathy, muscular dystrophy), consequences of these diseases extend beyond neurologic manifestations.1 These children are at an increased risk for aspiration of oral and gastric contents given their common comorbidities of dysphagia, gastroesophageal reflux, impaired cough, and respiratory muscle weakness.2 While aspiration may manifest as a self-resolving pneumonitis, the presence of oral or enteric bacteria in aspirated material may result in the development of bacterial pneumonia. Children with NI hospitalized with aspiration pneumonia have higher complication rates, longer and costlier hospitalizations, and higher readmission rates when compared with children with nonaspiration pneumonia.3
While pediatric aspiration pneumonia is commonly attributed to anaerobic bacteria, this is largely based on extrapolation from epidemiologic studies that were conducted in past decades.4-8 A single randomized controlled trial found that penicillin and clindamycin, antimicrobials with similar antimicrobial activity against anaerobes, to be equally effective.9 However, the recent literature emphasizes the polymicrobial nature of aspiration pneumonia in adults, with the common isolation of Gram-negative enteric bacteria.10 Further, while Pseudomonas aeruginosa is often identified in respiratory cultures from children with NI and chronic respiratory insufficiency,11,12 the significance of P. aeruginosa in lower airways remains unclear.
We designed this study to compare hospital outcomes associated with the most commonly prescribed empiric antimicrobial therapies for aspiration pneumonia in children with NI.
MATERIALS AND METHODS
Study Design and Data Source
This multicenter, retrospective cohort study used the Pediatric Health Information System (PHIS) database. PHIS, an administrative database of 50 not-for-profit tertiary care pediatric hospitals, contains data regarding patient demographics, diagnoses and procedures, and daily billed resource utilization, including laboratory and imaging studies. Data quality and reliability are assured through the Children’s Hospital Association (CHA; Lenexa, Kansas) and participating hospitals. Due to incomplete data through the study period and data quality issues, six hospitals were excluded.
STUDY POPULATION
Inclusion Criteria
Children 1-18 years of age who were discharged between July 1, 2007 and June 30, 2015 were included if they had a NI diagnosis,1 a principal diagnosis indicative of aspiration pneumonia (507.x),3,13,14 and received antibiotics in the first two calendar days of admission. NI was determined using previously defined International Classification of Diseases, Ninth Revision-Clinical Modification (ICD-9-CM) diagnosis codes.1 We only included children who received antibiotics in the first two calendar days of admission to minimize the likelihood of including children admitted for other reasons who acquired aspiration pneumonia after hospitalization. For children with multiple hospitalizations, one admission was randomly selected for inclusion to minimize weighting results toward repeat visits.
Exclusion Criteria
Children transferred from another hospital were excluded as records from their initial presentation, including treatment and outcomes, were not available. We also excluded children with tracheostomy15,16 or chronic ventilator dependence,17 those with a diagnosis of human immunodeficiency virus or tuberculosis, and children who received chemotherapy during hospitalization given expected differences in etiology, treatment, and outcomes.18
Exposure
The primary exposure was antibiotic therapy received in the first two days of admission. Antibiotics were classified by their antimicrobial spectra of activity as defined by The Sanford Guide to Antimicrobial Therapy19 against the most commonly recognized pathogens of aspiration pneumonia: anaerobes, Gram-negatives, and P. aeruginosa (Appendix Table 1).10,20 For example, penicillin G and clindamycin were among the antibiotics classified as providing anaerobic coverage alone, whereas ceftriaxone was classified as providing Gram-negative coverage alone and ampicillin-sulbactam or as combination therapy with clindamycin and ceftriaxone were classified as providing anaerobic and Gram-negative coverage. Piperacillin-tazobactam and meropenem were classified as providing anaerobic, Gram-negative, and P. aeruginosa coverage. We excluded antibiotics that do not provide coverage against anaerobes, Gram-negative, or P. aeruginosa (eg, ampicillin, azithromycin) or that provide coverage against Gram-negative and P. aeruginosa, but not anaerobes (eg, cefepime, tobramycin), as these therapies were prescribed for <5% of the cohort. We chose not to examine the coverage for Streptococcus pneumonia or Staphylococcus aureus as antibiotics included in this analysis covered these bacteria for 99.9% of our cohort.
OUTCOMES
Outcomes included acute respiratory failure during hospitalization, intensive care unit (ICU) transfer, and hospital length of stay (LOS). Acute respiratory failure during hospitalization was defined as the presence of Clinical Transaction Classification (CTC) or ICD-9 procedure code for noninvasive or invasive mechanical ventilation on day two or later of hospitalization, with or without the need for respiratory support on day 0 or day 1 (Appendix Table 2). Given the variability in hospital policies that may drive ICU admission criteria for complex patients, our outcome of ICU transfer was defined as the requirement for ICU level care on day two or later of hospitalization without ICU admission. Acute respiratory failure and ICU care occurring within the first two hospital days were not classified as outcomes because these early events likely reflect illness severity at presentation rather than outcomes attributable to treatment failure; these were included as markers of severity in the models.
Patient Demographics and Clinical Characteristics
Demographic and clinical characteristics that might influence antibiotic choice and/or hospital outcomes were assessed. Clinical characteristics included complex chronic conditions,21-23 medical technology assistance,24 performance of diagnostic testing, and markers of severe illness on presentation. Diagnostic testing included bacterial cultures (blood, respiratory, urine) and chest radiograph performance in the first two days of hospitalization. Results of diagnostic testing are not available in the PHIS. Illness severity on presentation included acute respiratory failure, pleural drainage, receipt of vasoactive agents, and transfusion of blood products in the first two days of hospitalization (Appendix Table 2).17,25,26
STASTICAL ANALYSIS
Continuous data were described with median and interquartile ranges (IQR) due to nonnormal distribution. Categorical data were described with frequencies and percentages. Patient demographics, clinical characteristics, and hospital outcomes were stratified by empiric antimicrobial coverage and compared using chi-square and Kruskal–Wallis tests as appropriate.
Generalized linear mixed-effects models with random hospital intercepts were derived to assess the independent effect of antimicrobial spectra of activity on outcomes of acute respiratory failure, ICU transfer, and LOS while adjusting for important differences in demographic and clinical characteristics. LOS had a nonnormal distribution. Thus, we used an exponential distribution. Covariates were chosen a priori given the clinical and biological relevance to exposure and outcomes—age, presence of complex chronic condition diagnoses, the number of complex chronic conditions, technology dependence, the performance of diagnostic tests on presentation, and illness severity on presentation. ICU admission was included as a covariate in acute respiratory failure and LOS outcome models. The results of the model for acute respiratory failure and ICU transfer are presented as adjusted odds ratios (OR) with a 95% CI. LOS results are presented as adjusted rate ratios (RR) with 95% CI.
All analyses were performed with SAS 9.3 (SAS Institute, Cary, North Carolina). P values <.05 were considered statistically significant. Cincinnati Children’s Hospital Medical Center Institutional Review Board considered this deidentified dataset study as not human subjects research.
RESULTS
Study Cohort
At the 44 hospitals included, 4,812 children with NI hospitalized with the diagnosis of aspiration pneumonia met the eligibility criteria. However, 79 received antibiotics with the spectra of activity not examined, leaving 4,733 children in our final analysis (Appendix Figure). Demographic and clinical characteristics of the study cohort are shown in Table 1. Median age was five years (interquartile range [IQR]: 2-11 years). Most subjects were male (53.9%), non-Hispanic white (47.9%), and publicly insured (63.6%). There was a slight variation in the distribution of admissions across seasons (spring 31.6%, summer 19.2%, fall 21.3%, and winter 27.9%). One-third of children had four or more comorbid CCCs (complex chronic conditions; 34.2%). The three most common nonneurologic CCC diagnosis categories were gastrointestinal (63.1%), congenital and/or genetic defects (36.9%), and respiratory (8.9%). Assistance with medical technologies was also common (82%)—particularly gastrointestinal (63.1%) and neurologic/neuromuscular (9.8%) technologies. The vast majority of children (92.5%) had either a chest radiograph (90.5%), respiratory viral study (33.7%), or respiratory culture (10.0%) obtained on presentation. A minority required noninvasive or invasive respiratory support (25.4%), vasoactive agents (8.9%), blood products (1.2%), or pleural drainage (0.3%) in the first two hospital days.
Spectrum of Antimicrobial Coverage
Most children (57.9%) received anaerobic and Gram-negative coverage; 16.2% received anaerobic, Gram-negative and P. aeruginosa coverage; 15.3% received anaerobic coverage alone; and 10.6% received Gram-negative coverage alone. Empiric antimicrobial coverage varied substantially across hospitals: anaerobic coverage was prescribed for 0%-44% of patients; Gram-negative coverage was prescribed for 3%-26% of patients; anaerobic and Gram-negative coverage was prescribed for 25%-90% of patients; and anaerobic, Gram-negative, and P. aeruginosa coverage was prescribed for 0%-65% of patients (Figure 1).
Outcomes
Acute Respiratory Failure
One-quarter (25.4%) of patients had acute respiratory failure on presentation; 22.5% required respiratory support (continued from presentation or were new) on day two or later of hospitalization (Table 2). In the adjusted analysis, children receiving Gram-negative coverage alone had two-fold greater odds (OR 2.15, 95% CI: 1.41-3.27) and children receiving anaerobic and Gram-negative coverage had 1.6-fold greater odds (OR 1.65, 95% CI: 1.19-2.28), of respiratory failure during hospitalization compared with those receiving anaerobic coverage alone (Figure 2). Odds of respiratory failure during hospitalization did not significantly differ for children receiving anaerobic, Gram-negative, and P. aeruginosa coverage compared with those receiving anaerobic coverage alone.
ICU Transfer
Nearly thirty percent (29.0%) of children required ICU admission, with an additional 3.8% requiring ICU transfer following admission (Table 2). In the multivariable analysis, the odds of an ICU transfer were greater for children receiving Gram-negative coverage alone (OR 1.80, 95% CI: 1.03-3.14) compared with those receiving anaerobic coverage alone. There was no statistical difference in ICU transfer for those receiving anaerobic and Gram-negative coverage (with or without P. aeruginosa coverage) compared with those receiving anaerobic coverage alone (Figure 2).
Length of Stay
Median hospital LOS for the total cohort was five days (IQR: 3-9 days; Table 2). In the multivariable analysis, children receiving Gram-negative coverage alone had a longer LOS (RR 1.28; 95% CI: 1.16-1.41) compared with those receiving anaerobic coverage alone, whereas children receiving anaerobic, Gram-negative, and P. aeruginosa coverage had a shorter LOS (RR 0.83; 95% CI: 0.76-0.90) than those receiving anaerobic coverage alone (Figure 2). There was no statistical difference in the LOS between children receiving anaerobic and Gram-negative coverage and those receiving anaerobic coverage alone.
DISCUSSION
In this multicenter study of children with NI hospitalized with aspiration pneumonia, we found substantial variation in empiric antimicrobial coverage for children with aspiration pneumonia. When comparing outcomes across groups, children who received anaerobic and Gram-negative coverage had outcomes similar to children who received anaerobic therapy alone. However, children who did not receive anaerobic coverage (ie, Gram-negative coverage alone) had worse outcomes, most notably a greater than two-fold increase in the odds of experiencing acute respiratory failure during hospitalization when compared with children receiving anaerobic therapy. These findings support prior literature that has highlighted the importance of anaerobic therapy in the treatment of aspiration pneumonia. The benefit of antibiotics targeting Gram-negative organisms, in addition to anaerobes, remains uncertain.
The variability in empiric antimicrobial coverage likely reflects the paucity of available information on oral and/or enteric bacteria required to identify them as causative organisms in aspiration pneumonia. In part, this problem is due to the difficulty in obtaining adequate sputum for culture from pediatric patients.27 While it may be more feasible to obtain tracheal aspirates for respiratory culture in children with a tracheostomy, interpretation of culture results remains challenging because the lower airways of children with tracheostomy are commonly colonized with bacterial pathogens.28 Thus, physicians are often left to choose empiric antimicrobial coverage with inadequate supporting evidence.29 Although the polymicrobial nature of aspiration pneumonia is well recognized in adult and pediatric literature,10,30 it is less clear which organisms are of pathological significance and require treatment.
The treatment standard for aspiration pneumonia has long included anaerobic therapy.29 The worse outcomes of children not receiving anaerobic therapy (ie, Gram-negative coverage alone) compared with children who received anaerobic therapy support the continued importance of anaerobic therapy in the treatment of aspiration pneumonia for hospitalized children with NI. The role of antibiotics covering Gram-negative organisms is less clear. Recent studies suggest the role of anaerobes is overemphasized in the etiology and treatment of aspiration pneumonia.10,29,31-38 Multiple studies on aspiration pneumonia bacteriology in hospitalized adults have demonstrated a predominance of Gram-negative organisms (ranging from 37%-71% of isolates identified on respiratory culture) and a relative scarcity of anaerobes (ranging from 0%-16% of isolates).31-37 A prospective study of 50 children hospitalized with clinical and radiographic evidence of pneumonia with known aspiration risk (eg, neuromuscular disease or dysphagia) found that ~80% of 163 bacterial isolates were Gram-negative.38 However, this study included repeat cultures from the same children, and thus, may overestimate the prevalence of Gram-negative organisms. In our study, children who received both anaerobic and Gram-negative therapy had no differences in ICU transfer or LOS but did experience higher odds of acute respiratory failure. As these results may be due to unmeasured confounding, future studies should further explore the necessity of Gram-negative coverage in addition to anaerobic coverage in this population.
While these recent studies may seem to suggest that anaerobic coverage is not necessary for aspiration pneumonia, there are important limitations worth noting. First, these studies used a variety of sampling techniques. While organisms grown from samples obtained via bronchoalveolar lavage31-34,36 are likely pathogenic, those grown from tracheal or oral samples obtained via percutaneous transtracheal aspiration,34 a protected specimen brush,34,36,37 or expectorated sputum35,38 may not represent lower airway organisms. Second, anaerobic cultures were not obtained in all studies.31,34,38 Anaerobic organisms are difficult to isolate using traditional clinical specimen collection techniques and aerobic culture media.18 Furthermore, anaerobes are not easily recovered from lung infections after the receipt of antibiotic therapy.39 Details regarding pretreatment, which are largely lacking from these studies, are necessary to interpret the relative scarcity of anaerobes on respiratory culture. Finally, caution should be taken when extrapolating the results of studies focused on the etiology and treatment of aspiration pneumonia in elderly adults to children. Our results, particularly in the context of the limitation of these more recent studies, suggest that the role of anaerobes has been underestimated.
Recent studies examining populations of children with cerebral palsy and/or tracheostomy have emphasized the high rates of carriage and infection rates with Gram-negative and drug-resistant bacteria; in particular, P. aeruginosa accounts for 50%-72% of pathogenic bacteria.11,12,38,40
Our multicenter observational study has several limitations. We used diagnosis codes to identify patients with aspiration pneumonia. As validated clinical criteria for the diagnosis of aspiration pneumonia do not exist, clinicians may assign a diagnosis of and treatment for aspiration pneumonia by subjective suspicion based on a child’s severe NI or illness severity on presentation leading to selection bias. Although administrative data are not able to verify pneumonia type with absolute certainty, we previously demonstrated that the differences in the outcomes of children with aspiration and nonaspiration pneumonia diagnosis codes persist after accounting for the complexity that might influence the diagnosis.3
Frthermore, we were unable to account for laboratory, microbiology, or radiology test results, and other management practices (eg, frequency of airway clearance, previous antimicrobial therapy) that may influence outcomes. Future studies should certainly include an examination of the concordance of the antibiotics prescribed with causative organisms, as this undoubtedly affects patient outcomes. Other outcomes are important to examine (eg, time to return to respiratory baseline), but we were unable to do so, given the lack of clinical detail in our database. We randomly selected a single hospitalization for children with multiple admissions; alternative methods could have different results. Although children with NI predominately use children’s hospitals,1 results may not be generalizable.
CONCLUSION
These findings support prior literature that has highlighted the important role anaerobic therapy plays in the treatment of aspiration pneumonia in children with NI. In light of the limitations of our study design, we believe that rigorous clinical trials comparing anaerobic with anaerobic and Gram-negative therapy are an important and necessary next step to determine the optimal treatment for aspiration pneumonia in this population.
Disclosures
The authors do not have any financial relationships relevant to this article to disclose.
Funding
Dr. Thomson was supported by the Agency for Healthcare Research and Quality (AHRQ) under award number K08HS025138. Dr. Ambroggio was supported by the National Institute for Allergy and Infectious Diseases (NIAID) under award number K01AI125413. The content is solely the responsibility of the authors and does not necessarily represent the official views of the AHRQ or NIAID.
1. Berry JG, Poduri A, Bonkowsky JL, et al. Trends in resource utilization by children with neurological impairment in the United States inpatient health care system: a repeat cross-sectional study. PLoS Med. 2012;9(1):e1001158. https://doi.org/10.1371/journal.pmed.1001158.
2. Seddon PC, Khan Y. Respiratory problems in children with neurological impairment. Arch Dis Child. 2003;88(1):75-78. https://doi.org/10.1136/adc.88.1.75.
3. Thomson J, Hall M, Ambroggio L, et al. Aspiration and non-aspiration pneumonia in hospitalized children with neurologic impairment. Pediatrics. 2016;137(2):e20151612. https://doi.org/10.1542/peds.2015-1612.
4. Brook I. Anaerobic pulmonary infections in children. Pediatr Emerg Care. 2004;20(9):636-640. https://doi.org/10.1097/01.pec.0000139751.63624.0b.
5. Bartlett JG, Gorbach SL. Treatment of aspiration pneumonia and primary lung abscess. Penicillin G vs clindamycin. JAMA. 1975;234(9):935-937. https://doi.org/10.1001/jamadermatol.2017.0297.
6. Bartlett JG, Gorbach SL, Finegold SM. The bacteriology of aspiration pneumonia. Am J Med. 1974;56(2):202-207. https://doi.org/10.1016/0002-9343(74)90598-1.
7. Lode H. Microbiological and clinical aspects of aspiration pneumonia. J Antimicrob Chemother. 1988;21:83-90. https://doi.org/10.1093/jac/21.suppl_c.83.
8. Brook I. Treatment of aspiration or tracheostomy-associated pneumonia in neurologically impaired children: effect of antimicrobials effective against anaerobic bacteria. Int J Pediatr Otorhinolaryngol. 1996;35(2):171-177. https://doi.org/10.1016/0165-5876(96)01332-8.
9. Jacobson SJ, Griffiths K, Diamond S, et al. A randomized controlled trial of penicillin vs clindamycin for the treatment of aspiration pneumonia in children. Arch Pediatr Adolesc Med. 1997;151(7):701-704. https://doi.org/10.1001/archpedi.1997.02170440063011.
10. DiBardino DM, Wunderink RG. Aspiration pneumonia: a review of modern trends. J Crit Care. 2015;30(1):40-48. https://doi.org/10.1016/j.jcrc.2014.07.011.
11. Gerdung CA, Tsang A, Yasseen AS, 3rd, Armstrong K, McMillan HJ, Kovesi T. Association between chronic aspiration and chronic airway infection with Pseudomonas aeruginosa and other Gram-negative bacteria in children with cerebral palsy. Lung. 2016;194(2):307-314. https://doi.org/10.1007/s00408-016-9856-5.
12. Thorburn K, Jardine M, Taylor N, Reilly N, Sarginson RE, van Saene HK. Antibiotic-resistant bacteria and infection in children with cerebral palsy requiring mechanical ventilation. Pedr Crit Care Med. 2009;10(2):222-226. https://doi.org/10.1097/PCC.0b013e31819368ac.
13. Lanspa MJ, Jones BE, Brown SM, Dean NC. Mortality, morbidity, and disease severity of patients with aspiration pneumonia. J Hosp Med. 2013;8(2):83-90. https://doi.org/10.1002/jhm.1996.
14. Lanspa MJ, Peyrani P, Wiemken T, Wilson EL, Ramirez JA, Dean NC. Characteristics associated with clinician diagnosis of aspiration pneumonia: a descriptive study of afflicted patients and their outcomes. J Hosp Med. 2015;10(2):90-96. https://doi.org/10.1002/jhm.2280.
15. Berry JG, Graham RJ, Roberson DW, et al. Patient characteristics associated with in-hospital mortality in children following tracheotomy. Arch Dis Child. 2010;95(9):703-710.
16. Berry JG, Graham DA, Graham RJ, et al. Predictors of clinical outcomes and hospital resource use of children after tracheotomy. Pediatrics. 2009;124(2):563-572. https://doi.org/10.1136/adc.2009.180836.
17. Balamuth F, Weiss SL, Hall M, et al. Identifying pediatric severe sepsis and septic shock: Accuracy of diagnosis codes. J Pediatr. 2015;167(6):1295-1300 e1294. https://doi.org/10.1016/j.jpeds.2015.09.027.
18. American Academy of Pediatrics., Pickering LK, American Academy of Pediatrics. Committee on Infectious Diseases. In: Red book : 2012 report of the Committee on Infectious Diseases. 29th ed. Elk Grove Village: American Academy of Pediatrics; 2012.
19. Gilbert DN. The Sanford Guide to Antimicrobial Therapy 2014. 44th ed. Sperryville: Antimicrobial Therapy, Inc; 2011.
20. Marik PE. Aspiration pneumonitis and aspiration pneumonia. N Engl J Med. 2001;344(9):665-671. https://doi.org/10.1056/NEJM200103013440908.
21. Feudtner C, Feinstein JA, Zhong W, Hall M, Dai D. Pediatric complex chronic conditions classification system version 2: updated for ICD-10 and complex medical technology dependence and transplantation. BMC Pediatrics. 2014;14:199. https://doi.org/10.1186/1471-2431-14-199.
22. Feudtner C, Hays RM, Haynes G, Geyer JR, Neff JM, Koepsell TD. Deaths attributed to pediatric complex chronic conditions: national trends and implications for supportive care services. Pediatrics. 2001;107(6):E99. https://doi.org/10.1542/peds.107.6.e99.
23. Feinstein JA, Russell S, DeWitt PE, Feudtner C, Dai D, Bennett TD. R package for pediatric complex chronic condition classification. JAMA Pediatr. 2018;172(6):596-598. https://doi.org/10.1001/jamapediatrics.2018.0256.
24. Berry JG, Hall DE, Kuo DZ, Cohen E, Agrawal R, Feudtner C, Hall M, Kueser J, Kaplan W, Neff J. Hospital utilization and characteristics of patients experiencing recurrent readmissions within children’s hospitals. JAMA. 2011;305(7):682-690. https://doi.org/10.1001/jama.2011.122.
25. Shah SS, Hall M, Newland JG, et al. Comparative effectiveness of pleural drainage procedures for the treatment of complicated pneumonia in childhood. J Hosp Med. 2011;6(5):256-263. https://doi.org/10.1002/jhm.872.
26. Child Health Corporation of America. CTC™ 2010 Code Structure: Module 5 Clinical Services. 2010 January 4; Available at https://sharepoint.chca.com/CHCAForums/PerformanceImprovement/PHIS/Reference Library/CTC Resources/Forms/AllItems.aspx Version: Modified.
27. Bradley JS, Byington CL, Shah SS, et al. The management of community-acquired pneumonia in infants and children older than 3 months of age: clinical practice guidelines by the Pediatric Infectious Diseases Society and the Infectious Diseases Society of America. Clin Infect Dis. 2011;53(7):e25-76. https://doi.org/10.1093/cid/cir531.
28. Brook I. Bacterial colonization, tracheobronchitis, and pneumonia following tracheostomy and long-term intubation in pediatric patients. Chest. 1979;76(4):420-424.
29. Waybright RA, Coolidge W, Johnson TJ. Treatment of clinical aspiration: a reappraisal. Am J Health Syst Pharm. 2013;70(15):1291-1300. https://doi.org/10.2146/ajhp120319.
30. Brook I, Finegold SM. Bacteriology of aspiration pneumonia in children. Pediatrics. 1980;65(6):1115-1120.
31. Wei C, Cheng Z, Zhang L, Yang J. Microbiology and prognostic factors of hospital- and community-acquired aspiration pneumonia in respiratory intensive care unit. Am J Infect Control. 2013;41(10):880-884. https://doi.org/10.1016/j.ajic.2013.01.007.
32. El-Solh AA, Pietrantoni C, Bhat A, et al. Microbiology of severe aspiration pneumonia in institutionalized elderly. Am J Respir Crit Care Med. 2003;167(12):1650-1654. https://doi.org/10.1164/rccm.200212-1543OC.
33. Tokuyasu H, Harada T, Watanabe E, et al. Effectiveness of meropenem for the treatment of aspiration pneumonia in elderly patients. Intern Med. 2009;48(3):129-135. https://doi.org/10.2169/internalmedicine.48.1308.
34. Ott SR, Allewelt M, Lorenz J, Reimnitz P, Lode H, German Lung Abscess Study Group. Moxifloxacin vs ampicillin/sulbactam in aspiration pneumonia and primary lung abscess. Infection. 2008;36(1):23-30. https://doi.org/10.1007/s15010-007-7043-6.
35. Kadowaki M, Demura Y, Mizuno S, et al. Reappraisal of clindamycin IV monotherapy for treatment of mild-to-moderate aspiration pneumonia in elderly patients. Chest. 2005;127(4):1276-1282. https://doi.org/10.1016/j.chest.2017.05.019.
36. Marik PE, Careau P. The role of anaerobes in patients with ventilator-associated pneumonia and aspiration pneumonia: a prospective study. Chest. 1999;115(1):178-183. https://doi.org/10.1378/chest.115.1.178.
37. Mier L, Dreyfuss D, Darchy B, et al. Is penicillin G an adequate initial treatment for aspiration pneumonia? A prospective evaluation using a protected specimen brush and quantitative cultures. Intensive Care Med. 1993;19(5):279-284. https://doi.org/10.1007/bf01690548.
38. Ashkenazi-Hoffnung L, Ari A, Bilavsky E, Scheuerman O, Amir J, Prais D. Pseudomonas aeruginosa identified as a key pathogen in hospitalised children with aspiration pneumonia and a high aspiration risk. Acta Paediatr. 2016;105(12):e588-e592. https://doi.org/10.1111/apa.13523.
39. Bartlett JG, Gorbach SL, Tally FP, Finegold SM. Bacteriology and treatment of primary lung abscess. Am Rev Respir Dis. 1974;109(5):510-518. https://doi.org/10.1164/arrd.1974.109.5.510.
40. Russell CJ, Simon TD, Mamey MR, Newth CJL, Neely MN. Pseudomonas aeruginosa and post-tracheotomy bacterial respiratory tract infection readmissions. Pediatr Pulmonol. 2017;52(9):1212-1218. https://doi.org/10.1002/ppul.23716.
41. Russell CJ, Mamey MR, Koh JY, Schrager SM, Neely MN, Wu S. Length of stay and hospital revisit after bacterial tracheostomy-associated respiratory tract infection hospitalizations. Hosp Pediatr. Hosp Pediatr. 2018;8(2):72-80. https://doi.org/10.1542/hpeds.2017-0106.
42. Russell CJ, Mack WJ, Schrager SM, Wu S. Care variations and outcomes for children hospitalized with bacterial tracheostomy-associated respiratory infections. Hosp Pediatr. 2017;7(1):16-23. https://doi.org/10.1542/hpeds.2016-0104.
© 2019 Society of Hospital Medicine
Things We Do for No Reason: Systemic Corticosteroids for Wheezing in Preschool-Aged Children
Inspired by the ABIM Foundation’s Choosing Wisely® campaign, the “Things We Do for No Reason” series reviews practices which have become common parts of hospital care but which may provide little value to our patients. Practices reviewed in the TWDFNR series do not represent “black and white” conclusions or clinical practice standards, but are meant as a starting place for research and active discussions among hospitalists and patients. We invite you to be part of that discussion.
CASE PRESENTATION
A four-year-old girl, with a history of one wheezing episode, presents to the emergency department (ED) with wheezing, tachypnea, and respiratory distress. She receives three successive treatments of short-acting bronchodilators and is given one dose of dexamethasone, after which she improves significantly. Because of persistent tachypnea and wheezing, she is admitted for further management. By the next day she is much improved, now requiring bronchodilator treatment every four hours. She receives a second dose of dexamethasone to complete her steroid burst. Was the trajectory of this patient’s illness altered by treatment with systemic corticosteroids (SCS)? Is there any benefit to SCS treatment in a wheezing preschool-aged patient?
BACKGROUND
Wheezing is common in preschool-aged children (ages 2-5 years), with up to half in this age group having experienced a wheezing episode and up to one-third, recurrent wheezing.1,2 Young children with wheezing require ED visits and hospitalizations at much higher rates than older children and adults.3 Several studies have also demonstrated that children in this age group have higher rates of SCS prescriptions compared with older children.4,5 Despite the high prevalence of wheezing in this age group, there is great heterogeneity in the etiology and clinical progression of early childhood wheezing, with up to six described phenotypes each with varying levels of association with the development of asthma.6 Given the high frequency of asthma, preschool-aged children admitted with wheezing are often treated with SCS, as this is the standard of care for an acute asthma exacerbation.7
WHY YOU MIGHT THINK SYSTEMIC CORTICOSTEROIDS WOULD BE HELPFUL IN TREATING PRESCHOOL WHEEZE
The benefit of SCS in school-aged children and adolescents with multitrigger asthma exacerbation is well established and includes shorter time to resolution of acute illness and reduction in relapses.8 Because of these benefits, expert panels and regulatory agencies often include preschool-aged children in treatment recommendations for the older age groups.7,9,10 Consequently, apart from infants diagnosed with bronchiolitis, SCS remain a common and accepted treatment for young children presenting with asthma-like symptoms.4,5
Some data suggest that there may be clinical benefit from treatment with SCS in preschool children who wheeze. A recent trial by Foster et al. included 605 children, aged 24-72 months, presenting to a pediatric ED with wheeze plus viral upper respiratory symptoms.11 Patients were randomized to receive a three-day course of prednisolone (1 mg/kg) or placebo. The primary outcome was length of hospital stay until ready for discharge, which they found was significantly longer for placebo-treated patients (540 minutes) versus prednisolone (370 minutes).
WHY SYSTEMIC CORTICOSTEROIDS ARE NOT ROUTINELY HELPFUL IN PRESCHOOL CHILDREN WHO WHEEZE
There are few randomized controlled trials evaluating the efficacy of SCS in preschool-aged children with viral-induced wheezing, and these children are often grouped with younger or older children in studies. While limited in number, these studies have evaluated SCS efficacy with acute wheezing in preschool-aged children in outpatient, ED, and inpatient settings (Appendix Table).12-16 The majority of trials of SCS in this age group have shown mixed or negative results.
Admission rates for preschoolers with viral wheezing were not statistically different in those receiving oral prednisolone versus placebo in a study conducted by Oomen et al. evaluating outpatient, parent-initiated prednisolone.14 Tal et al. found overall benefit with reduced admission rate for patients treated in the ED with methylprednisolone versus placebo; however, this finding was not statistically significant in patients 24-54 months old.16
For those requiring hospitalization, length of hospital stay and time until readiness to discharge were the primary outcomes assessed by Panickar et al. and Jartti et al. Neither study found a statistically significant difference between groups who received oral prednisolone versus placebo for 3 or 5 days. Secondary outcomes such as symptom scores, symptom duration, albuterol use, and 60-day relapse rate were also not improved in those taking oral prednisolone compared with placebo.14,15
The mixed results of studies assessing the efficacy of SCS in preschool-aged wheezing children may be attributed to the fact that wheezing in this age group likely represents multiple underlying processes. Most acute wheezing at this age is not associated with atopy and is often triggered by viral respiratory tract infections.17 Furthermore, 90% of wheezing in children under the age of five years does not persist to the asthma phenotype (recurrent episodes with multiple triggers, airway obstruction, and hyper-responsiveness) once they reach school age.18
While SCS are generally not expensive, their use is not without cost. Studies of oral corticosteroid use in children with asthma have shown adverse effects including vomiting, hypertension, and impaired growth.19 Children with recurrent wheeze receiving SCS may demonstrate biochemical hypothalamic-pituitary-axis dysfunction.20 Given the high utilization and SCS prescription rates in this age group, reducing the use of SCS with wheezing episodes could have a large clinical and financial impact.3,4 These medications should be used judiciously in order to balance benefit with potential risks.
WHEN MIGHT SYSTEMIC CORTICOSTEROIDS BE HELPFUL IN WHEEZING PRESCHOOLERS
Given that there is diversity in the phenotype of preschool-aged children who wheeze, it is possible that a subset of these children would benefit from SCS. Some studies have shown that certain groups of patients derive benefit, including those with rhinovirus infection, eczema, and children at higher risk for multitrigger asthma.11,13 Children who have atopic wheeze are more likely to have persistent symptoms that may eventually be diagnosed as asthma.18 These children will have airway inflammation secondary to eosinophilic infiltration and may be responsive to SCS at times of exacerbation. However, attempts to classify preschool children based on risk of asthma have not shown consistent results.
The Asthma Predictive Index (API), a tool developed as a part of the Tucson Children’s Respiratory Study, uses clinical factors including history of wheeze, atopic dermatitis, and allergic rhinitis to determine a young child’s risk of having asthma symptoms after age six years.21 Jartti et al. and Panickar et al. used the API to stratify patients based on future asthma risk.13,15 The high risk group in the Jartti et al. study showed the benefit of SCS, while there was no benefit in the Panickar et al. study. When Oommen et al. also attempted to stratify asthma risk using levels of blood eosinophil proteins, which when elevated, are predictive of persistent wheeze.14 There was no difference in drug efficacy between patients with high and low blood eosinophil proteins. Although Foster et al. demonstrated shorter length of stay (LOS) with SCS overall, this was only seen in the subgroup with a previous diagnosis of asthma.
Patients presenting with severe disease (including those requiring critical care or with the highest symptom scores) have mostly been excluded from these studies. Although patients with severe disease often receive steroids, there is insufficient evidence of the efficacy of SCS in this population.12,13,15,22 Foster et al. did include patients with high symptom scores (although they excluded patients with “critical wheeze”) and found that the efficacy of SCS was clearest for those with severe presentations.11
Finally, some studies have demonstrated a virus-specific effect, with a reduction in time to readiness for discharge and reduction in recurrent wheeze in children treated with prednisolone who were positive for rhinovirus.12,23 Rhinovirus infection has also been associated with allergic sensitization and recurrent wheezing.23,24 However, rhinovirus-specific steroid responsiveness has not been consistently replicated by other investigators.11
WHAT YOU SHOULD DO INSTEAD
The majority of preschool-aged children presenting with wheeze in the care of hospitalists have mild to moderate symptoms, triggered by viral infections.22 It can be helpful to categorize the wheezing child as atopic or nonatopic. Laboratory studies such as allergen-specific IgE, peripheral eosinophil count, and exhaled nitric oxide can aid in predicting response to asthma medications and progression to the classic asthma phenotype.25 In the absence of these diagnostic studies, which are often costly and challenging to obtain in young children, a clinical score such as the API, or the recently validated Pediatric Asthma Risk Score (PARS), can help to assess future risk of developing multitrigger asthma.21,26 A positive API requires a history of more than three episodes of wheeze over the past year as well as one major (physician-diagnosed atopic dermatitis or parental asthma) or two minor (peripheral blood eosinophilia, physician-diagnosed allergic rhinitis, or wheezing apart from colds) criteria.17 It has a sensitivity of 57% and specificity of 81%.26 The PARS uses the presence of parental asthma, eczema, early wheezing, wheezing apart from colds, African-American race, and ≥2 positive skin prick tests to predict asthma. The sensitivity and specificity of PARS are similar to the API at 68% and 79%, respectively.26
Given the mixed results from studies evaluating the benefit of SCS in preschoolers with atopic symptoms and/or a positive API, evidence is lacking to guide decision-making in these children.13-15 However, it is reasonable to treat those at higher risk for future multitrigger asthma with SCS. There is also insufficient evidence to determine whether those with more severe disease or those infected with particular viral pathogens may benefit. Therefore, for the majority of children presenting with viral-induced wheezing, with a negative API or low PARS, there is no evidence that treatment with an SCS provides benefit in the form of reduced LOS, reduction in clinical symptoms, treatment failure, or relapse rate.
RECOMMENDATIONS
- Do not routinely treat with SCS preschool-aged children who have episodic wheezing triggered by viral respiratory tract infections and who do not have risk factors for persistent asthma.
- For preschool-aged children with a history of atopy, a positive API, or elevated PARS, SCS can be considered during admissions for respiratory distress and wheezing.
- Preschool-aged children presenting with severe disease or requiring intensive care may benefit from SCS, but there is insufficient evidence to conclude whether this practice provides benefit.
CONCLUSIONS
Current evidence does not support the routine use of SCS for preschool-aged children admitted for mild to moderate wheezing episodes. The majority of these children have viral episodic wheeze that does not develop into the asthma phenotype. For children with severe disease or at higher risk for asthma, SCS may be considered, although there remains insufficient evidence as to their efficacy. The patient in the introductory case lacks risk factors that would suggest SCS responsiveness (eg, positive API, previous asthma diagnosis, inhaled corticosteroid use, or severe disease) and would likely receive no clinical benefit from dexamethasone treatment.
Do you think this is a low-value practice? Is this truly a “Thing We Do for No Reason?” Share what you do in your practice and join in the conversation online by retweeting it on Twitter (#TWDFNR) and liking it on Facebook. We invite you to propose ideas for other “Things We Do for No Reason” topics by emailing TWDFNR@hospitalmedicine.org.
Disclosures
Dr. Jennifer O’Toole consulted with and received honoraria payment from the I-PASS Patient Safety Institute. She also holds stock options in the I-PASS Patient Safety Institute, a nonpublicly traded company. Drs. Jones and Hubbell have nothing to disclose.
Funding
Dr. Thomson was supported by the Agency for Healthcare Research and Quality under award number K08HS025138.
1. Mallol J, Garcia-Marcos L, Sole D, Brand P, EISL Study Group. International prevalence of recurrent wheezing during the first year of life: variability, treatment patterns and use of health resources. Thorax. 2010;65(11):1004-1009. https://doi.org/10.1136/thx.2009.115188.
2. Bisgaard H, Szefler S. Prevalence of asthma-like symptoms in young children. Pediatric Pulmonol. 2007;48(8):723-728. https://doi.org/10.1002/ppul.20644.
3. Zahran HS, Bailey CM, Damon SA, Garbe PL, Breysse PN. Vital signs: asthma in children - United States, 2001-2016. MMWR Morb Mortal Wkly Rep. 2018;67(5):149-155. https://doi.org/10.15585/mmwr.mm6705e1.
4. Arabkhazaeli A, Vijverberg SJ, van der Ent CK, Raaijmakers JA, Maitland-van der Zee AH. High incidence of oral corticosteroids prescriptions in children with asthma in early childhood. J Asthma. 2016;53(10):1012-1017. https://doi.org/10.1080/02770903.2016.1185439.
5. Farber HJ, Silveira EA, Vicere DR, Kothari VD, Giardino AP. Oral corticosteroid prescribing for children with asthma in a medicaid managed care program. Pediatrics. 2017;139(5):139. https://doi.org/10.1542/peds.2016-4146.
6. Henderson J, Granell R, Heron J, et al. Associations of wheezing phenotypes in the first 6 years of life with atopy, lung function and airway responsiveness in mid-childhood. Thorax. 2008;63(11):974-980. https://doi.org/10.1136/thx.2007.093187.
7. National Asthma Education and Prevention Program. Expert Panel Report 3(EPR-3): Guidelines for the Diagnosis and Management of Asthma- Summary Report 2007. J Allergy Clin Immunol. 2007;120(5):S94-S138. https://doi.org/10.1016/j.jaci.2007.09.043.
8. Smith M, Iqbal S, Elliott TM, Everard M, Rowe BH. Corticosteroids for hospitalised children with acute asthma. Cochrane Database Syst Rev. 2003(2):CD002886. https://doi.org/10.1002/14651858.CD002886.
9. Pedersen SE, Hurd SS, Lemanske Rf Jr., et al. Global strategy for the diagnosis and management of asthma in children 5 years and younger. Pediatr Pulmonol. 2011;46(1):1-7. https://doi.org/10.1002/ppul.21321.
10. Bacharier LB, Boner A, Carlsen KH, et al. Diagnosis and treatment of asthma in childhood: a PRACTALL consensus report. Allergy. 2008;63(1):5-34. https://doi.org/10.1111/j.1398-9995.2007.01586.x.
11. Foster SJ, Cooper MN, Oosterhof S, Borland ML. Oral prednisolone in preschool children with virus-associated wheeze: a prospective, randomised, double-blind, placebo-controlled trial. Lancet Respir Med. 2018;6(2):97-106. https://doi.org/10.1016/S2213-2600(18)30008-0.
12. Jartti T, Lehtinen P, Vanto T, et al. Evaluation of the efficacy of prednisolone in early wheezing induced by rhinovirus or respiratory syncytial virus. Pediatr Infect Dis J. 2006;25(6):482-488. https://doi.org/10.1097/01.inf.0000215226.69696.0c.
13. Jartti T, Lehtinen P, Vanto T, et al. Atopic characteristics of wheezing children and responses to prednisolone. Pediatr Pulmonol. 2007;42(12):1125-1133. https://doi.org/10.1002/ppul.20706.
14. Oommen A, Lambert PC, Grigg J. Efficacy of a short course of parent-initiated oral prednisolone for viral wheeze in children aged 1–5 years: randomised controlled trial. Lancet. 2003;362(9394):1433-1438. https://doi.org/10.1016/S0140-6736(03)14685-5.
15. Panickar J, Lakhanpaul M, Lambert PC, et al. Oral prednisolone for preschool children with acute virus-induced wheezing. N Engl J Med. 2009;360(4):329-338. https://doi.org/10.1056/NEJMoa0804897.
16. Tal A, Levy N, Bearman JE. Methylprednisolone therapy for acute asthma in infants and toddlers: a controlled clinical trial. Pediatrics. 1990;86(3):350-356 .
17. Taussig LM, Wright AL, Holberg CJ, Halonen M, Morgan WJ, Martinez FD. Tucson children’s respiratory study: 1980 to present. J Allergy Clin Immunol. 2003;111(4):661-675. https://doi.org/10.1067/mai.2003.162.
18. Illi S, von Mutius E, Lau S, Niggemann B, Grüber C, Wahn U, Multicentre Allergy Study (MAS) group. Perennial allergen sensitisation early in life and chronic asthma in children: a birth cohort study. Lancet. 2006;368(9537):763-770. https://doi.org/10.1016/S0140-6736(06)69286-6.
19. Manson SC, Brown RE, Cerulli A, Vidaurre CF. The cumulative burden of oral corticosteroid side effects and the economic implications of steroid use. Respir Med. 2009;103(7):975-994. https://doi.org/10.1016/j.rmed.2009.01.003.
20. Barra CB, Fontes MJF, Cintra MTG, et al. Oral corticosteroids for asthma exacerbations might be associated with adrenal suppression: are physicians aware of that? Rev Assoc Med Bras. 2017;63(10):899-903. https://doi.org/10.1590/1806-9282.63.10.899..
21. Castro-Rodriguez JA, Holberg CJ, Wright AL, Martinez FD. A clinical index to define risk of asthma in young children with recurrent wheezing. Am J Respir Crit Care Med. 2000;162(4):1403-1406. https://doi.org/10.1164/ajrccm.162.4.9912111.
22. Bush A, Grigg J, Saglani S. Managing wheeze in preschool children. BMJ. 2014;348:g15. https://doi.org/10.1136/bmj.g15.
23. Lukkarinen M, Lukkarinen H, Lehtinen P, Vuorinen T, Ruuskanen O, Jartti T. Prednisolone reduces recurrent wheezing after first rhinovirus wheeze: a 7-year follow-up. Pediatr Allergy Immunol. 2013;24(3):237-243. (1399-3038. https://doi.org/10.1111/pai.12046.
24. Jartti T, Kuusipalo H, Vuorinen T, et al. Allergic sensitization is associated with rhinovirus-, but not other virus-, induced wheezing in children. Pediatr Allergy Immunol. 2010;21(7):1008-1014. https://doi.org/10.1111/j.1399-3038.2010.01059.x.
25. Burbank AJ, Szefler SJ. Current and future management of the young child with early onset wheezing. Curr Opin Allergy Clin Immunol. 2017;17(2):146-152. https://doi.org/10.1097/ACI.0000000000000341
26. Myers JM, Schauberger E, He H, et al. A Pediatric Asthma Risk Score (PARS) to better predict asthma development in young children. J Allergy Clin Immunol. 2018;143(5):1803-1810.e2. https://doi.org/10.1016/j.jaci.2018.09.037.
Inspired by the ABIM Foundation’s Choosing Wisely® campaign, the “Things We Do for No Reason” series reviews practices which have become common parts of hospital care but which may provide little value to our patients. Practices reviewed in the TWDFNR series do not represent “black and white” conclusions or clinical practice standards, but are meant as a starting place for research and active discussions among hospitalists and patients. We invite you to be part of that discussion.
CASE PRESENTATION
A four-year-old girl, with a history of one wheezing episode, presents to the emergency department (ED) with wheezing, tachypnea, and respiratory distress. She receives three successive treatments of short-acting bronchodilators and is given one dose of dexamethasone, after which she improves significantly. Because of persistent tachypnea and wheezing, she is admitted for further management. By the next day she is much improved, now requiring bronchodilator treatment every four hours. She receives a second dose of dexamethasone to complete her steroid burst. Was the trajectory of this patient’s illness altered by treatment with systemic corticosteroids (SCS)? Is there any benefit to SCS treatment in a wheezing preschool-aged patient?
BACKGROUND
Wheezing is common in preschool-aged children (ages 2-5 years), with up to half in this age group having experienced a wheezing episode and up to one-third, recurrent wheezing.1,2 Young children with wheezing require ED visits and hospitalizations at much higher rates than older children and adults.3 Several studies have also demonstrated that children in this age group have higher rates of SCS prescriptions compared with older children.4,5 Despite the high prevalence of wheezing in this age group, there is great heterogeneity in the etiology and clinical progression of early childhood wheezing, with up to six described phenotypes each with varying levels of association with the development of asthma.6 Given the high frequency of asthma, preschool-aged children admitted with wheezing are often treated with SCS, as this is the standard of care for an acute asthma exacerbation.7
WHY YOU MIGHT THINK SYSTEMIC CORTICOSTEROIDS WOULD BE HELPFUL IN TREATING PRESCHOOL WHEEZE
The benefit of SCS in school-aged children and adolescents with multitrigger asthma exacerbation is well established and includes shorter time to resolution of acute illness and reduction in relapses.8 Because of these benefits, expert panels and regulatory agencies often include preschool-aged children in treatment recommendations for the older age groups.7,9,10 Consequently, apart from infants diagnosed with bronchiolitis, SCS remain a common and accepted treatment for young children presenting with asthma-like symptoms.4,5
Some data suggest that there may be clinical benefit from treatment with SCS in preschool children who wheeze. A recent trial by Foster et al. included 605 children, aged 24-72 months, presenting to a pediatric ED with wheeze plus viral upper respiratory symptoms.11 Patients were randomized to receive a three-day course of prednisolone (1 mg/kg) or placebo. The primary outcome was length of hospital stay until ready for discharge, which they found was significantly longer for placebo-treated patients (540 minutes) versus prednisolone (370 minutes).
WHY SYSTEMIC CORTICOSTEROIDS ARE NOT ROUTINELY HELPFUL IN PRESCHOOL CHILDREN WHO WHEEZE
There are few randomized controlled trials evaluating the efficacy of SCS in preschool-aged children with viral-induced wheezing, and these children are often grouped with younger or older children in studies. While limited in number, these studies have evaluated SCS efficacy with acute wheezing in preschool-aged children in outpatient, ED, and inpatient settings (Appendix Table).12-16 The majority of trials of SCS in this age group have shown mixed or negative results.
Admission rates for preschoolers with viral wheezing were not statistically different in those receiving oral prednisolone versus placebo in a study conducted by Oomen et al. evaluating outpatient, parent-initiated prednisolone.14 Tal et al. found overall benefit with reduced admission rate for patients treated in the ED with methylprednisolone versus placebo; however, this finding was not statistically significant in patients 24-54 months old.16
For those requiring hospitalization, length of hospital stay and time until readiness to discharge were the primary outcomes assessed by Panickar et al. and Jartti et al. Neither study found a statistically significant difference between groups who received oral prednisolone versus placebo for 3 or 5 days. Secondary outcomes such as symptom scores, symptom duration, albuterol use, and 60-day relapse rate were also not improved in those taking oral prednisolone compared with placebo.14,15
The mixed results of studies assessing the efficacy of SCS in preschool-aged wheezing children may be attributed to the fact that wheezing in this age group likely represents multiple underlying processes. Most acute wheezing at this age is not associated with atopy and is often triggered by viral respiratory tract infections.17 Furthermore, 90% of wheezing in children under the age of five years does not persist to the asthma phenotype (recurrent episodes with multiple triggers, airway obstruction, and hyper-responsiveness) once they reach school age.18
While SCS are generally not expensive, their use is not without cost. Studies of oral corticosteroid use in children with asthma have shown adverse effects including vomiting, hypertension, and impaired growth.19 Children with recurrent wheeze receiving SCS may demonstrate biochemical hypothalamic-pituitary-axis dysfunction.20 Given the high utilization and SCS prescription rates in this age group, reducing the use of SCS with wheezing episodes could have a large clinical and financial impact.3,4 These medications should be used judiciously in order to balance benefit with potential risks.
WHEN MIGHT SYSTEMIC CORTICOSTEROIDS BE HELPFUL IN WHEEZING PRESCHOOLERS
Given that there is diversity in the phenotype of preschool-aged children who wheeze, it is possible that a subset of these children would benefit from SCS. Some studies have shown that certain groups of patients derive benefit, including those with rhinovirus infection, eczema, and children at higher risk for multitrigger asthma.11,13 Children who have atopic wheeze are more likely to have persistent symptoms that may eventually be diagnosed as asthma.18 These children will have airway inflammation secondary to eosinophilic infiltration and may be responsive to SCS at times of exacerbation. However, attempts to classify preschool children based on risk of asthma have not shown consistent results.
The Asthma Predictive Index (API), a tool developed as a part of the Tucson Children’s Respiratory Study, uses clinical factors including history of wheeze, atopic dermatitis, and allergic rhinitis to determine a young child’s risk of having asthma symptoms after age six years.21 Jartti et al. and Panickar et al. used the API to stratify patients based on future asthma risk.13,15 The high risk group in the Jartti et al. study showed the benefit of SCS, while there was no benefit in the Panickar et al. study. When Oommen et al. also attempted to stratify asthma risk using levels of blood eosinophil proteins, which when elevated, are predictive of persistent wheeze.14 There was no difference in drug efficacy between patients with high and low blood eosinophil proteins. Although Foster et al. demonstrated shorter length of stay (LOS) with SCS overall, this was only seen in the subgroup with a previous diagnosis of asthma.
Patients presenting with severe disease (including those requiring critical care or with the highest symptom scores) have mostly been excluded from these studies. Although patients with severe disease often receive steroids, there is insufficient evidence of the efficacy of SCS in this population.12,13,15,22 Foster et al. did include patients with high symptom scores (although they excluded patients with “critical wheeze”) and found that the efficacy of SCS was clearest for those with severe presentations.11
Finally, some studies have demonstrated a virus-specific effect, with a reduction in time to readiness for discharge and reduction in recurrent wheeze in children treated with prednisolone who were positive for rhinovirus.12,23 Rhinovirus infection has also been associated with allergic sensitization and recurrent wheezing.23,24 However, rhinovirus-specific steroid responsiveness has not been consistently replicated by other investigators.11
WHAT YOU SHOULD DO INSTEAD
The majority of preschool-aged children presenting with wheeze in the care of hospitalists have mild to moderate symptoms, triggered by viral infections.22 It can be helpful to categorize the wheezing child as atopic or nonatopic. Laboratory studies such as allergen-specific IgE, peripheral eosinophil count, and exhaled nitric oxide can aid in predicting response to asthma medications and progression to the classic asthma phenotype.25 In the absence of these diagnostic studies, which are often costly and challenging to obtain in young children, a clinical score such as the API, or the recently validated Pediatric Asthma Risk Score (PARS), can help to assess future risk of developing multitrigger asthma.21,26 A positive API requires a history of more than three episodes of wheeze over the past year as well as one major (physician-diagnosed atopic dermatitis or parental asthma) or two minor (peripheral blood eosinophilia, physician-diagnosed allergic rhinitis, or wheezing apart from colds) criteria.17 It has a sensitivity of 57% and specificity of 81%.26 The PARS uses the presence of parental asthma, eczema, early wheezing, wheezing apart from colds, African-American race, and ≥2 positive skin prick tests to predict asthma. The sensitivity and specificity of PARS are similar to the API at 68% and 79%, respectively.26
Given the mixed results from studies evaluating the benefit of SCS in preschoolers with atopic symptoms and/or a positive API, evidence is lacking to guide decision-making in these children.13-15 However, it is reasonable to treat those at higher risk for future multitrigger asthma with SCS. There is also insufficient evidence to determine whether those with more severe disease or those infected with particular viral pathogens may benefit. Therefore, for the majority of children presenting with viral-induced wheezing, with a negative API or low PARS, there is no evidence that treatment with an SCS provides benefit in the form of reduced LOS, reduction in clinical symptoms, treatment failure, or relapse rate.
RECOMMENDATIONS
- Do not routinely treat with SCS preschool-aged children who have episodic wheezing triggered by viral respiratory tract infections and who do not have risk factors for persistent asthma.
- For preschool-aged children with a history of atopy, a positive API, or elevated PARS, SCS can be considered during admissions for respiratory distress and wheezing.
- Preschool-aged children presenting with severe disease or requiring intensive care may benefit from SCS, but there is insufficient evidence to conclude whether this practice provides benefit.
CONCLUSIONS
Current evidence does not support the routine use of SCS for preschool-aged children admitted for mild to moderate wheezing episodes. The majority of these children have viral episodic wheeze that does not develop into the asthma phenotype. For children with severe disease or at higher risk for asthma, SCS may be considered, although there remains insufficient evidence as to their efficacy. The patient in the introductory case lacks risk factors that would suggest SCS responsiveness (eg, positive API, previous asthma diagnosis, inhaled corticosteroid use, or severe disease) and would likely receive no clinical benefit from dexamethasone treatment.
Do you think this is a low-value practice? Is this truly a “Thing We Do for No Reason?” Share what you do in your practice and join in the conversation online by retweeting it on Twitter (#TWDFNR) and liking it on Facebook. We invite you to propose ideas for other “Things We Do for No Reason” topics by emailing TWDFNR@hospitalmedicine.org.
Disclosures
Dr. Jennifer O’Toole consulted with and received honoraria payment from the I-PASS Patient Safety Institute. She also holds stock options in the I-PASS Patient Safety Institute, a nonpublicly traded company. Drs. Jones and Hubbell have nothing to disclose.
Funding
Dr. Thomson was supported by the Agency for Healthcare Research and Quality under award number K08HS025138.
1. Mallol J, Garcia-Marcos L, Sole D, Brand P, EISL Study Group. International prevalence of recurrent wheezing during the first year of life: variability, treatment patterns and use of health resources. Thorax. 2010;65(11):1004-1009. https://doi.org/10.1136/thx.2009.115188.
2. Bisgaard H, Szefler S. Prevalence of asthma-like symptoms in young children. Pediatric Pulmonol. 2007;48(8):723-728. https://doi.org/10.1002/ppul.20644.
3. Zahran HS, Bailey CM, Damon SA, Garbe PL, Breysse PN. Vital signs: asthma in children - United States, 2001-2016. MMWR Morb Mortal Wkly Rep. 2018;67(5):149-155. https://doi.org/10.15585/mmwr.mm6705e1.
4. Arabkhazaeli A, Vijverberg SJ, van der Ent CK, Raaijmakers JA, Maitland-van der Zee AH. High incidence of oral corticosteroids prescriptions in children with asthma in early childhood. J Asthma. 2016;53(10):1012-1017. https://doi.org/10.1080/02770903.2016.1185439.
5. Farber HJ, Silveira EA, Vicere DR, Kothari VD, Giardino AP. Oral corticosteroid prescribing for children with asthma in a medicaid managed care program. Pediatrics. 2017;139(5):139. https://doi.org/10.1542/peds.2016-4146.
6. Henderson J, Granell R, Heron J, et al. Associations of wheezing phenotypes in the first 6 years of life with atopy, lung function and airway responsiveness in mid-childhood. Thorax. 2008;63(11):974-980. https://doi.org/10.1136/thx.2007.093187.
7. National Asthma Education and Prevention Program. Expert Panel Report 3(EPR-3): Guidelines for the Diagnosis and Management of Asthma- Summary Report 2007. J Allergy Clin Immunol. 2007;120(5):S94-S138. https://doi.org/10.1016/j.jaci.2007.09.043.
8. Smith M, Iqbal S, Elliott TM, Everard M, Rowe BH. Corticosteroids for hospitalised children with acute asthma. Cochrane Database Syst Rev. 2003(2):CD002886. https://doi.org/10.1002/14651858.CD002886.
9. Pedersen SE, Hurd SS, Lemanske Rf Jr., et al. Global strategy for the diagnosis and management of asthma in children 5 years and younger. Pediatr Pulmonol. 2011;46(1):1-7. https://doi.org/10.1002/ppul.21321.
10. Bacharier LB, Boner A, Carlsen KH, et al. Diagnosis and treatment of asthma in childhood: a PRACTALL consensus report. Allergy. 2008;63(1):5-34. https://doi.org/10.1111/j.1398-9995.2007.01586.x.
11. Foster SJ, Cooper MN, Oosterhof S, Borland ML. Oral prednisolone in preschool children with virus-associated wheeze: a prospective, randomised, double-blind, placebo-controlled trial. Lancet Respir Med. 2018;6(2):97-106. https://doi.org/10.1016/S2213-2600(18)30008-0.
12. Jartti T, Lehtinen P, Vanto T, et al. Evaluation of the efficacy of prednisolone in early wheezing induced by rhinovirus or respiratory syncytial virus. Pediatr Infect Dis J. 2006;25(6):482-488. https://doi.org/10.1097/01.inf.0000215226.69696.0c.
13. Jartti T, Lehtinen P, Vanto T, et al. Atopic characteristics of wheezing children and responses to prednisolone. Pediatr Pulmonol. 2007;42(12):1125-1133. https://doi.org/10.1002/ppul.20706.
14. Oommen A, Lambert PC, Grigg J. Efficacy of a short course of parent-initiated oral prednisolone for viral wheeze in children aged 1–5 years: randomised controlled trial. Lancet. 2003;362(9394):1433-1438. https://doi.org/10.1016/S0140-6736(03)14685-5.
15. Panickar J, Lakhanpaul M, Lambert PC, et al. Oral prednisolone for preschool children with acute virus-induced wheezing. N Engl J Med. 2009;360(4):329-338. https://doi.org/10.1056/NEJMoa0804897.
16. Tal A, Levy N, Bearman JE. Methylprednisolone therapy for acute asthma in infants and toddlers: a controlled clinical trial. Pediatrics. 1990;86(3):350-356 .
17. Taussig LM, Wright AL, Holberg CJ, Halonen M, Morgan WJ, Martinez FD. Tucson children’s respiratory study: 1980 to present. J Allergy Clin Immunol. 2003;111(4):661-675. https://doi.org/10.1067/mai.2003.162.
18. Illi S, von Mutius E, Lau S, Niggemann B, Grüber C, Wahn U, Multicentre Allergy Study (MAS) group. Perennial allergen sensitisation early in life and chronic asthma in children: a birth cohort study. Lancet. 2006;368(9537):763-770. https://doi.org/10.1016/S0140-6736(06)69286-6.
19. Manson SC, Brown RE, Cerulli A, Vidaurre CF. The cumulative burden of oral corticosteroid side effects and the economic implications of steroid use. Respir Med. 2009;103(7):975-994. https://doi.org/10.1016/j.rmed.2009.01.003.
20. Barra CB, Fontes MJF, Cintra MTG, et al. Oral corticosteroids for asthma exacerbations might be associated with adrenal suppression: are physicians aware of that? Rev Assoc Med Bras. 2017;63(10):899-903. https://doi.org/10.1590/1806-9282.63.10.899..
21. Castro-Rodriguez JA, Holberg CJ, Wright AL, Martinez FD. A clinical index to define risk of asthma in young children with recurrent wheezing. Am J Respir Crit Care Med. 2000;162(4):1403-1406. https://doi.org/10.1164/ajrccm.162.4.9912111.
22. Bush A, Grigg J, Saglani S. Managing wheeze in preschool children. BMJ. 2014;348:g15. https://doi.org/10.1136/bmj.g15.
23. Lukkarinen M, Lukkarinen H, Lehtinen P, Vuorinen T, Ruuskanen O, Jartti T. Prednisolone reduces recurrent wheezing after first rhinovirus wheeze: a 7-year follow-up. Pediatr Allergy Immunol. 2013;24(3):237-243. (1399-3038. https://doi.org/10.1111/pai.12046.
24. Jartti T, Kuusipalo H, Vuorinen T, et al. Allergic sensitization is associated with rhinovirus-, but not other virus-, induced wheezing in children. Pediatr Allergy Immunol. 2010;21(7):1008-1014. https://doi.org/10.1111/j.1399-3038.2010.01059.x.
25. Burbank AJ, Szefler SJ. Current and future management of the young child with early onset wheezing. Curr Opin Allergy Clin Immunol. 2017;17(2):146-152. https://doi.org/10.1097/ACI.0000000000000341
26. Myers JM, Schauberger E, He H, et al. A Pediatric Asthma Risk Score (PARS) to better predict asthma development in young children. J Allergy Clin Immunol. 2018;143(5):1803-1810.e2. https://doi.org/10.1016/j.jaci.2018.09.037.
© 2019 Society of Hospital Medicine
LOS in Children With Medical Complexity
Children with medical complexity (CMC) have complex and chronic health conditions that often involve multiple organ systems and severely affect cognitive and physical functioning. Although the prevalence of CMC is low (1% of all children), they account for nearly one‐fifth of all pediatric admissions and one‐half of all hospital days and charges in the United States.[1] Over the last decade, CMC have had a particularly large and increasing impact in tertiary‐care children's hospitals.[1, 2] The Institute of Medicine has identified CMC as a priority population for a revised healthcare system.[3]
Medical homes, hospitals, health plans, states, federal agencies, and others are striving to reduce excessive hospital use in CMC because of its high cost.[4, 5, 6] Containing length of stay (LOS)an increasingly used indicator of the time sensitiveness and efficiency of hospital careis a common aim across these initiatives. CMC have longer hospitalizations than children without medical complexity. Speculated reasons for this are that CMC tend to have (1) higher severity of acute illnesses (eg, pneumonia, cellulitis), (2) prolonged recovery time in the hospital, and (3) higher risk of adverse events in the hospital. Moreover, hospital clinicians caring for CMC often find it difficult to determine discharge readiness, given that many CMC do not return to a completely healthy baseline.[7]
Little is known about long LOS in CMC, including which CMC have the highest risk of experiencing such stays and which stays might have the greatest opportunity to be shortened. Patient characteristics associated with prolonged length of stay have been studied extensively for many pediatric conditions (eg, asthma).[8, 9, 10, 11, 12, 13, 14] However, most of these studies excluded CMC. Therefore, the objectives of this study were to examine (1) the prevalence of long LOS in CMC, (2) patient characteristics associated with long LOS, and (3) hospital‐to‐hospital variation in prevalence of long LOS hospitalizations.
METHODS
Study Design and Data Source
This study is a multicenter, retrospective cohort analysis of the Pediatric Health Information System (PHIS). PHIS is an administrative database of 44 not for profit, tertiary care pediatric hospitals affiliated with the Children's Hospital Association (CHA) (Overland Park, KS). PHIS contains data regarding patient demographics, diagnoses, and procedures (with International Classification of Diseases, 9th Revision, Clinical Modification [ICD‐9‐CM] codes), All‐Patient Refined Diagnostic Related Groups version 30 (APR‐DRGs) (3M Health Information Systems, Salt Lake City, UT), and service lines that aggregate the APR‐DRGs into 38 distinct groups. Data quality and reliability are assured through CHA and participating hospitals. In accordance with the policies of the Cincinnati Children's Hospital Medical Center Institutional Review Board, this study of deidentified data was not considered human subjects research.
Study Population
Inclusion Criteria
Children discharged following an observation or inpatient admission from a hospital participating in the PHIS database between January 1, 2013 and December 31, 2014 were eligible for inclusion if they were considered medically complex. Medical complexity was defined using Clinical Risk Groups (CRGs) version 1.8, developed by 3M Health Information Systems and the National Association of Children's Hospitals and Related Institutions. CRGs were used to assign each hospitalized patient to 1 of 9 mutually exclusive chronicity groups according to the presence, type, and severity of chronic conditions.[15, 16, 17, 18] Each patient's CRG designation was based on 2 years of previous hospital encounters.
As defined in prior studies and definitional frameworks of CMC,[1] patients belonging to CRG group 6 (significant chronic disease in 2 organ systems), CRG group 7 (dominant chronic disease in 3 organ systems), and CRG group 9 (catastrophic condition) were considered medically complex.[17, 19] Patients with malignancies (CRG group 8) were not included for analysis because they are a unique population with anticipated, long hospital stays. Patients with CRG group 5, representing those with chronic conditions affecting a single body system, were also not included because most do not have attributes consistent with medical complexity.
Exclusion Criteria
We used the APR‐DRG system, which leverages ICD‐9‐CM codes to identify the health problem most responsible for the hospitalization, to refine the study cohort. We excluded hospitalizations that were classified by the APR‐DRG system as neonatal, as we did not wish to focus on LOS in the neonatal intensive care unit (ICU) or for birth admissions. Similarly, hospitalizations for chemotherapy (APR‐DRG 693) or malignancy (identified with previously used ICD‐9‐CM codes)[20] were also excluded because long LOS is anticipated. We also excluded hospitalizations for medical rehabilitation (APR‐DRG 860).
Outcome Measures
The primary outcome measure was long LOS, defined as LOS 10 days. The cut point of LOS 10 days represents the 90th percentile of LOS for all children, with and without medical complexity, hospitalized during 2013 to 2014. LOS 10 days has previously been used as a threshold of long LOS.[21] For hospitalizations involving transfer at admission from another acute care facility, LOS was measured from the date of transfer. We also assessed hospitals' cost attributable to long LOS admissions.
Patient Demographics and Clinical Characteristics
We measured demographic characteristics including age, gender, race/ethnicity, insurance type, and distance traveled (the linear distance between the centroid of the patient's home ZIP code and the centroid of the hospital's ZIP code). Clinical characteristics included CRG classification, complex chronic condition (CCC), and dependence on medical technology. CCCs are defined as any medical condition that can be reasonably expected to last at least 12 months (unless death intervenes) and to involve either several different organ systems or 1 system severely enough to require specialty pediatric care and probably some period of hospitalization in a tertiary care center.[20] Medical technology included devices used to optimize the health and functioning of the child (eg, gastrostomy, tracheostomy, cerebrospinal fluid shunt).[22]
Hospitalization Characteristics
Characteristics of the hospitalization included transfer from an outside facility, ICU admission, surgical procedure (using surgical APR‐DRGs), and discharge disposition (home, skilled nursing facility, home health services, death, other). Cost of the hospitalization was estimated in the PHIS from charges using hospital and year‐specific ratios of cost to charge.
Statistical Analysis
Continuous data (eg, distance from hospital to home residence) were described with median and interquartile ranges (IQR) because they were not normally distributed. Categorical data (eg, type of chronic condition) were described with counts and frequencies. In bivariate analyses, demographic, clinical, and hospitalization characteristics were stratified by LOS (long LOS vs LOS <10 days), and compared using 2 statistics or Wilcoxon rank sum tests as appropriate.
We modeled the likelihood of experiencing a long LOS using generalized linear mixed effects models with a random hospital intercept and discharge‐level fixed effects for age, gender, payor, CCC type, ICU utilization, transfer status, a medical/surgical admission indicator derived from the APR‐DRG, and CRG assigned to each hospitalization. To examine hospital‐to‐hospital variability, we generated hospital risk‐adjusted rates of long LOS from these models. Similar models and hospital risk‐adjusted rates were built for a post hoc correlational analysis of 30‐day all cause readmission, where hospitals' rates and percent of long LOS were compared with a Pearson correlation coefficient. Also, for our multivariable models, we performed a sensitivity analysis using an alternative definition of long LOS as 4 days (the 75th percentile of LOS for all children, with and without medical complexity, hospitalized during 20132014). All analyses were performed using SAS version 9.4 (SAS Institute, Cary, NC), and P values <0.05 were considered statistically significant.
RESULTS
Study Population
There were 954,018 hospitalizations of 217,163 CMC at 44 children's hospitals included for analysis. Forty‐seven percent of hospitalizations were for females, 49.4% for non‐Hispanic whites, and 61.1% for children with government insurance. Fifteen percent (n = 142,082) had a long LOS of 10 days. The median (IQR) LOS of hospitalizations <10 days versus 10 days were 2 (IQR, 14) and 16 days (IQR, 1226), respectively. Long LOS hospitalizations accounted for 61.1% (3.7 million) hospital days and 61.8% ($13.7 billion) of total hospitalization costs for all CMC in the cohort (Table 1).
| Characteristic | Overall (n = 954,018) | Length of Stay | |
|---|---|---|---|
| <10 Days (n = 811,936) | 10 Days (n = 142,082) | ||
| |||
| Age at admission, y, % | |||
| <1 | 14.6 | 12.7 | 25.7 |
| 14 | 27.1 | 27.9 | 22.4 |
| 59 | 20.1 | 21.0 | 14.9 |
| 1018 | 33.6 | 34.0 | 31.7 |
| 18+ | 4.6 | 4.4 | 5.4 |
| Gender, % | |||
| Female | 47.0 | 46.9 | 47.5 |
| Race/ethnicity, % | |||
| Non‐Hispanic white | 49.4 | 49.4 | 49.4 |
| Non‐Hispanic black | 23.1 | 23.8 | 19.3 |
| Hispanic | 18.2 | 17.8 | 20.4 |
| Asian | 2.0 | 1.9 | 2.3 |
| Other | 7.4 | 7.1 | 8.6 |
| Complex chronic condition, % | |||
| Any | 79.5 | 77.3 | 91.8 |
| Technology assistance | 37.1 | 34.1 | 54.2 |
| Gastrointestinal | 30.0 | 27.2 | 45.9 |
| Neuromuscular | 28.2 | 27.7 | 30.9 |
| Cardiovascular | 16.8 | 14.5 | 29.9 |
| Respiratory | 14.1 | 11.5 | 29.4 |
| Congenital/genetic defect | 17.2 | 16.7 | 20.2 |
| Metabolic | 9.9 | 8.9 | 15.4 |
| Renal | 10.1 | 9.5 | 13.8 |
| Hematology/emmmunodeficiency | 11.7 | 12.0 | 10.0 |
| Neonatal | 3.8 | 3.1 | 7.7 |
| Transplantation | 4.5 | 4.2 | 6.7 |
| Clinical risk group, % | |||
| Chronic condition in 2 systems | 68.4 | 71.2 | 53.9 |
| Catastrophic chronic condition | 31.4 | 28.8 | 46.1 |
| Distance from hospital to home residence in miles, median [IQR] | 16.2 [7.440.4] | 15.8 [7.338.7] | 19.1 [8.552.6] |
| Transferred from outside hospital (%) | 6.5 | 5.3 | 13.6 |
| Admitted for surgery, % | 23.4 | 20.7 | 38.7 |
| Use of intensive care, % | 19.6 | 14.9 | 46.5 |
| Discharge disposition, % | |||
| Home | 91.2 | 92.9 | 81.4 |
| Home healthcare | 4.5 | 3.5 | 9.9 |
| Other | 2.9 | 2.6 | 4.5 |
| Postacute care facility | 1.1 | 0.8 | 3.1 |
| Died | 0.4 | 0.3 | 1.1 |
| Payor, % | |||
| Government | 61.1 | 60.6 | 63.5 |
| Private | 33.2 | 33.6 | 30.9 |
| Other | 5.7 | 5.7 | 5.7 |
| Hospital resource use | |||
| Median length of stay [IQR] | 3 [16] | 2 [14] | 16 [1226] |
| Median hospital cost [IQR] | $8,144 [$4,122$18,447] | $6,689 [$3,685$12,395] | $49,207 [$29,444$95,738] |
| Total hospital cost, $, billions | $22.2 | $8.5 | $13.7 |
Demographics and Clinical Characteristics of Children With and Without Long LOS
Compared with hospitalized CMC with LOS <10 days, a higher percentage of hospitalizations with LOS 10 days were CMC age <1 year (25.7% vs 12.7%, P < 0.001) and Hispanic (20.4% vs 17.8%, P < 0.001). CMC hospitalizations with a long LOS had a higher percentage of any CCC (91.8% vs 77.3%, P < 0.001); the most common CCCs were gastrointestinal (45.9%), neuromuscular (30.9%), and cardiovascular (29.9%). Hospitalizations of CMC with a long LOS had a higher percentage of a catastrophic chronic condition (46.1% vs 28.8%, P < 0.001) and technology dependence (46.1% vs 28.8%, P < 0.001) (Table 1).
Hospitalization Characteristics of Children With and Without Long LOS
Compared with hospitalizations of CMC with LOS <10 days, hospitalizations of CMC with a long LOS more often involved transfer in from another hospital at admission (13.6% vs 5.3%, P < 0.001). CMC hospital stays with a long LOS more often involved surgery (38.7% vs 20.7%, P < 0.001) and use of intensive care (46.5% vs 14.9%; P < 0.001). A higher percentage of CMC with long LOS were discharged with home health services (9.9% vs 3.5%; P < 0.001) (Table 1).
The most common admitting diagnoses and CCCs for hospitalizations of CMC with long LOS are presented in Table 2. The two most prevalent APR‐DRGs in CMC hospitalizations lasting 10 days or longer were cystic fibrosis (10.7%) and respiratory system disease with ventilator support (5.5%). The two most common chronic condition characteristics represented among long CMC hospitalizations were gastrointestinal devices (eg, gastrostomy tube) (39.7%) and heart and great vessel malformations (eg, tetralogy of Fallot) (12.8%). The 5 most common CCC subcategories, as listed in Table 2, account for nearly 100% of the patients with long LOS hospitalizations.
| |
| Most common reason for admission* | |
| Cystic fibrosis | 10.7% |
| Respiratory system diagnosis with ventilator support 96+ hours | 5.5% |
| Malfunction, reaction, and complication of cardiac or vascular device or procedure | 2.8% |
| Craniotomy except for trauma | 2.6% |
| Major small and large bowel procedures | 2.3% |
| Most common complex chronic condition | |
| Gastrointestinal devices | 39.7% |
| Heart and great vessel malformations | 12.8% |
| Cystic fibrosis | 12.5% |
| Dysrhythmias | 11.0% |
| Respiratory devices | 10.7% |
Multivariable Analysis of Characteristics Associated With Long LOS
In multivariable analysis, the highest likelihood of long LOS was experienced by children who received care in the ICU (odds ratio [OR]: 3.5, 95% confidence interval [CI]: 3.43.5), who had a respiratory CCC (OR: 2.7, 95% CI: 2.62.7), and who were transferred from another acute care hospital at admission (OR: 2.1, 95% CI: 2.0, 2.1). The likelihood of long LOS was also higher in children <1 year of age (OR: 1.2, 95% CI: 1.21.3), and Hispanic children (OR: 1.1, 95% CI 1.0‐1.10) (Table 3). Similar multivariable findings were observed in sensitivity analysis using the 75th percentile of LOS (4 days) as the model outcome.
| Characteristic | Odds Ratio (95% CI) of LOS 10 Days | P Value |
|---|---|---|
| ||
| Use of intensive care | 3.5 (3.4‐3.5) | <0.001 |
| Transfer from another acute‐care hospital | 2.1 (2.0‐2.1) | <0.001 |
| Procedure/surgery | 1.8 (1.8‐1.9) | <0.001 |
| Complex chronic condition | ||
| Respiratory | 2.7 (2.6‐2.7) | <0.001 |
| Gastrointestinal | 1.8 (1.8‐1.8) | <0.001 |
| Metabolic | 1.7 (1.7‐1.7) | <0.001 |
| Cardiovascular | 1.6 (1.5‐1.6) | <0.001 |
| Neonatal | 1.5 (1.5‐1.5) | <0.001 |
| Renal | 1.4 (1.4‐1.4) | <0.001 |
| Transplant | 1.4 (1.4‐1.4) | <0.001 |
| Hematology and immunodeficiency | 1.3 (1.3‐1.3) | <0.001 |
| Technology assistance | 1.1 (1.1, 1.1) | <0.001 |
| Neuromuscular | 0.9 (0.9‐0.9) | <0.001 |
| Congenital or genetic defect | 0.8 (0.8‐0.8) | <0.001 |
| Age at admission, y | ||
| <1 | 1.2 (1.2‐1.3) | <0.001 |
| 14 | 0.5 (0.5‐0.5) | <0.001 |
| 59 | 0.6 (0.6‐0.6) | <0.001 |
| 1018 | 0.9 (0.9‐0.9) | <0.001 |
| 18+ | Reference | |
| Male | 0.9 (0.9‐0.9) | <0.001 |
| Race/ethnicity | ||
| Non‐Hispanic black | 0.9 (0.9‐0.9) | <0.001 |
| Hispanic | 1.1 (1.0‐1.1) | <0.001 |
| Asian | 1.0 (1.0‐1.1) | 0.3 |
| Other | 1.1 (1.1‐1.1) | <0.001 |
| Non‐Hispanic white | Reference | |
| Payor | ||
| Private | 0.9 (0.8 0.9) | <0.001 |
| Other | 1.0 (1.0‐1.0) | 0.4 |
| Government | Reference | |
| Season | ||
| Spring | 1.0 (1.0 1.0) | <0.001 |
| Summer | 0.9 (0.9‐0.9) | <0.001 |
| Fall | 1.0 (0.9‐1.0) | <0.001 |
| Winter | Reference | |
Variation in the Prevalence of Long LOS Across Children's Hospitals
After controlling for demographic, clinical, and hospital characteristics associated with long LOS, there was significant (P < 0.001) variation in the prevalence of long LOS for CMC across children's hospitals in the cohort (range, 10.3%21.8%) (Figure 1). Twelve (27%) hospitals had a significantly (P < 0.001) higher prevalence of long LOS for their hospitalized CMC, compared to the mean. Eighteen (41%) had a significantly (P < 0.001) lower prevalence of long LOS for their hospitalized CMC. There was also significant variation across hospitals with respect to cost, with 49.7% to 73.7% of all hospital costs of CMC attributed to long LOS hospitalizations. Finally, there was indirect correlation with the prevalence of LOS across hospitals and the hospitals' 30‐day readmission rate ( = 0.3; P = 0.04). As the prevalence of long LOS increased, the readmission rate decreased.
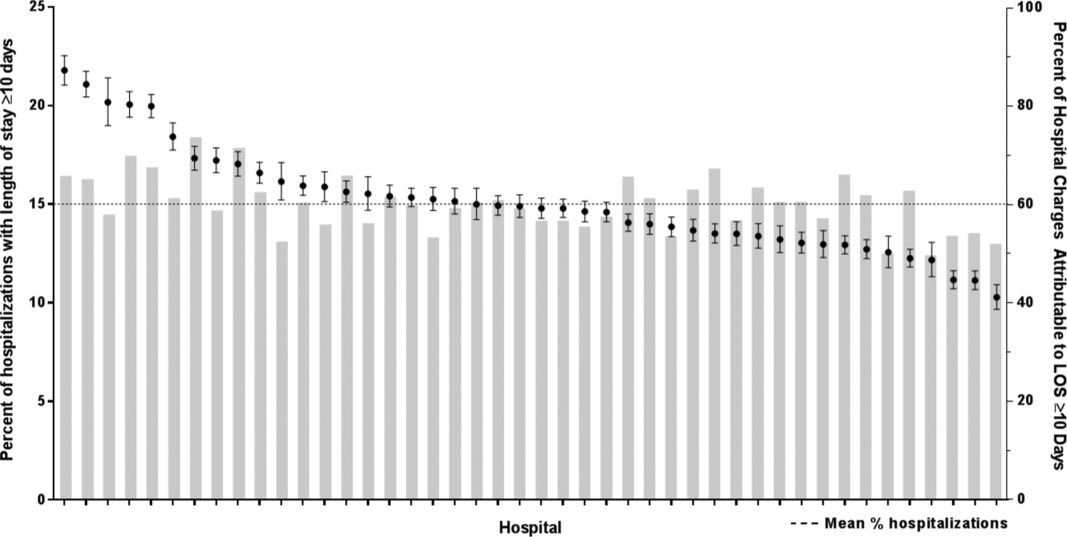
DISCUSSION
The main findings from this study suggest that a small percentage of CMC experiencing long LOS account for the majority of hospital bed days and cost of all hospitalized CMC in children's hospitals. The likelihood of long LOS varies significantly by CMC's age, race/ethnicity, and payor as well as by type and number of chronic conditions. Among CMC with long LOS, the use of gastrointestinal devices such as gastrostomy tubes, as well as congenital heart disease, were highly prevalent. In multivariable analysis, the characteristics most strongly associated with LOS 10 days were use of the ICU, respiratory complex chronic condition, and transfer from another medical facility at admission. After adjusting for these factors, there was significant variation in the prevalence of LOS 10 days for CMC across children's hospitals.
Although it is well known that CMC as a whole have a major impact on resource use in children's hospitals, this study reveals that 15% of hospitalizations of CMC account for 62% of all hospital costs of CMC. That is, a small fraction of hospitalizations of CMC is largely responsible for the significant financial impact of hospital resource use. To date, most clinical efforts and policies striving to reduce hospital use in CMC have focused on avoiding readmissions or index hospital admissions entirely, rather than improving the efficiency of hospital care after admission occurs.[23, 24, 25, 26] In the adult population, the impact of long LOS on hospital costs has been recognized, and several Medicare incentive programs have focused on in‐hospital timeliness and efficiency. As a result, LOS in Medicare beneficiaries has decreased dramatically over the past 2 decades.[27, 28, 29, 30] Optimizing the efficiency of hospital care for CMC may be an important goal to pursue, especially with precedent set in the adult literature.
Perhaps the substantial variation across hospitals in the prevalence of long LOS in CMC indicates opportunity to improve the efficiency of their inpatient care. This variation was not due to differences across hospitals' case mix of CMC. Further investigation is needed to determine how much of it is due to differences in quality of care. Clinical practice guidelines for hospital treatment of common illnesses usually exclude CMC. In our clinical experience across 9 children's hospitals, we have experienced varying approaches to setting discharge goals (ie, parameters on how healthy the child needs to be to ensure a successful hospital discharge) for CMC.[31] When the goals are absent or not clearly articulated, they can contribute to a prolonged hospitalization. Some families of CMC report significant issues when working with pediatric hospital staff to assess their child's discharge readiness.[7, 32, 33] In addition, there is significant variation across states and regions in access to and quality of post‐discharge health services (eg, home nursing, postacute care, durable medical equipment).[34, 35] In some areas, many CMC are not actively involved with their primary care physician.[5] These issues might also influence the ability of some children's hospitals to efficiently discharge CMC to a safe and supportive post‐discharge environment. Further examination of hospital outliersthose with the lowest and highest percentage of CMC hospitalizations with long LOSmay reveal opportunities to identify and spread best practices.
The demographic and clinical factors associated with long LOS in the present study, including age, ICU use, and transfer from another hospital, might help hospitals target which CMC have the greatest risk for experiencing long LOS. We found that infants age <1 year had longer LOS when compared with older children. Similar to our findings, younger‐aged children hospitalized with bronchiolitis have longer LOS.[36] Certainly, infants with medical complexity, in general, are a high‐acuity population with the potential for rapid clinical deterioration during an acute illness. Prolonged hospitalization for treatment and stabilization may be expected for many of them. Additional investigation is warranted to examine ICU use in CMC, and whether ICU admission or duration can be safely prevented or abbreviated. Opportunities to assess the quality of transfers into children's hospitals of CMC admitted to outside hospitals may be necessary. A study of pediatric burn patients reported that patients initially stabilized at a facility that was not a burn center and subsequently transferred to a burn center had a longer LOS than patients solely treated at a designated burn center.[37] Furthermore, events during transport itself may adversely impact the stability of an already fragile patient. Interventions to optimize the quality of care provided by transport teams have resulted in decreased LOS at the receiving hospital.[38]
This study's findings should be considered in the context of several limitations. Absent a gold‐standard definition of long LOS, we used the distribution of LOS across patients to inform our methods; LOS at the 90th percentile was selected as long. Although our sensitivity analysis using LOS at the 75th percentile produced similar findings, other cut points in LOS might be associated with different results. The study is not positioned to determine how much of the reported LOS was excessive, unnecessary, or preventable. The study findings may not generalize to types of hospitals not contained in PHIS (eg, nonchildren's hospitals and community hospitals). We did not focus on the impact of a new diagnosis (eg, new chronic illness) or acute in‐hospital event (eg, nosocomial infection) on prolonged LOS; future studies should investigate these clinical events with LOS.
PHIS does not contain information regarding characteristics that could influence LOS, including the children's social and familial attributes, transportation availability, home equipment needs, and local availability of postacute care facilities. Moreover, PHIS does not contain information about the hospital discharge procedures, process, or personnel across hospitals, which could influence LOS. Future studies on prolonged LOS should consider assessing this information. Because of the large sample size of hospitalizations included, the statistical power for the analyses was strong, rendering it possible that some findings that were statistically significant might have modest clinical significance (eg, relationship of Hispanic ethnicity with prolonged LOS). We could not determine why a positive correlation was not observed between hospitals' long LOS prevalence and their percentage of cost associated with long LOS; future studies should investigate the reasons for this finding.
Despite these limitations, the findings of the present study highlight the significance of long LOS in hospitalized CMC. These long hospitalizations account for a significant proportion of all hospital costs for this important population of children. The prevalence of long LOS for CMC varies considerably across children's hospitals, even after accounting for the case mix. Efforts to curtail hospital resource use and costs for CMC may benefit from focus on long LOS.
- , , , et al. Inpatient growth and resource use in 28 children's hospitals: a longitudinal, multi‐institutional study. JAMA Pediatr. 2013;167(2):170–177.
- , , , et al. Children with complex chronic conditions in inpatient hospital settings in the united states. Pediatrics. 2010;126(4):647–655.
- , . Meeting the health care needs of persons with disabilities. Milbank Q. 2002;80(2):381–391.
- , , , et al. Effect of an enhanced medical home on serious illness and cost of care among high‐risk children with chronic illness: a randomized clinical trial. JAMA. 2014;312(24):2640–2648.
- , , , et al. Children with medical complexity and Medicaid: spending and cost savings. Health Aff Proj Hope. 2014;33(12):2199–2206.
- Children's Hospital Association. CARE Award. Available at: https://www.childrenshospitals.org/Programs‐and‐Services/Quality‐Improvement‐and‐Measurement/CARE‐Award. Accessed December 18, 2015.
- , , , et al. Hospital readmission and parent perceptions of their child's hospital discharge. Int J Qual Health Care. 2013;25(5):573–581.
- , , , et al. Weekend matters: Friday and Saturday admissions are associated with prolonged hospitalization of children. Clin Pediatr (Phila). 2013;52(9):875–878.
- , , , . Attributable cost and length of stay for central line‐associated bloodstream infections. Pediatrics. 2014;133(6):e1525–e1532.
- , , , et al. Effect of healthcare‐acquired infection on length of hospital stay and cost. Infect Control Hosp Epidemiol. 2007;28(3):280–292.
- , , , , . Hospital utilization and costs among children with influenza, 2003. Am J Prev Med. 2009;36(4):292–296.
- , , , . Charges and lengths of stay attributable to adverse patient‐care events using pediatric‐specific quality indicators: a multicenter study of freestanding children's hospitals. Pediatrics. 2008;121(6):e1653–e1659.
- , , , , . Variation in resource utilization for the management of uncomplicated community‐acquired pneumonia across community and children's hospitals. J Pediatr. 2014;165(3):585–591.
- , , , , . Variation and outcomes associated with direct hospital admission among children with pneumonia in the United States. JAMA Pediatr. 2014;168(9):829–836.
- , , , et al. Clinical Risk Groups (CRGs): a classification system for risk‐adjusted capitation‐based payment and health care management. Med Care. 2004;42(1):81–90.
- , , , et al. Identifying children with lifelong chronic conditions for care coordination by using hospital discharge data. Acad Pediatr. 2010;10(6):417–423.
- , , , , . Profile of medical charges for children by health status group and severity level in a Washington State Health Plan. Health Serv Res. 2004;39(1):73–89.
- , , , . Using medical billing data to evaluate chronically ill children over time. J Ambulatory Care Manage. 2006;29(4):283–290.
- , , , , , . Medical complexity and pediatric emergency department and inpatient utilization. Pediatrics. 2013;131(2):e559–e565.
- , , , , . Pediatric complex chronic conditions classification system version 2: updated for ICD‐10 and complex medical technology dependence and transplantation. BMC Pediatr. 2014;14:199.
- . Analyzing intensive care unit length of stay data: problems and possible solutions. Crit Care Med. 1997;25(9):1594–1600.
- , , , et al. Hospital utilization and characteristics of patients experiencing recurrent readmissions within children's hospitals. JAMA. 2011;305(7):682–690.
- . Hospital readmissions and repeat emergency department visits among children with medical complexity: an integrative review. J Pediatr Nurs. 2013;28(4):316–339.
- , , , . Hospital readmission in children with complex chronic conditions discharged from subacute care. Hosp Pediatr. 2014;4(3):153–158.
- , , , et al. Preventing hospitalizations in children with medical complexity: a systematic review. Pediatrics. 2014;134(6):e1628–e1647.
- , , , . Hospital readmissions for newly discharged pediatric home mechanical ventilation patients. Pediatr Pulmonol. 2012;47(4):409–414.
- , , , et al. Clinical characteristics and outcomes of Medicare patients undergoing total hip arthroplasty, 1991–2008. JAMA. 2011;305(15):1560–1567.
- , , , et al. Trends in length of stay and short‐term outcomes among Medicare patients hospitalized for heart failure, 1993–2006. JAMA. 2010;303(21):2141–2147.
- U.S. Department of Health and Human Services. CMS Statistics 2013. Available at: https://www.cms.gov/Research‐Statistics‐Data‐and‐Systems/Statistics‐Trends‐and‐Reports/CMS‐Statistics‐Reference‐Booklet/Downloads/CMS_Stats_2013_final.pdf. Published August 2013. Accessed October 6, 2015.
- Centers for Medicare and Medicaid Services. Evaluation of the premier hospital quality incentive demonstration. Available at: https://www.cms.gov/Research‐Statistics‐Data‐and‐Systems/Statistics‐Trends‐and‐Reports/Reports/downloads/Premier_ExecSum_2010.pdf. Published March 3, 2009. Accessed September 18, 2015.
- , , , et al. A framework of pediatric hospital discharge care informed by legislation, research, and practice. JAMA Pediatr. 2014;168(10):955–962; quiz 965–966.
- , , , , . Parent and provider perspectives on pediatric readmissions: what can we learn about readiness for discharge? Hosp Pediatr. 2015;5(11):559–565.
- , . Preventing readmissions in children: how do we do that? Hosp Pediatr. 2015;5(11):602–604.
- , , . Pediatric post‐acute hospital care: striving for identity and value. Hosp Pediatr. 2015;5(10):548–551.
- , , , et al. Pediatric hospital discharges to home health and postacute facility care: a national study. JAMA Pediatr. 2016;170(4):326–333.
- , , , et al. Bronchiolitis: clinical characteristics associated with hospitalization and length of stay. Pediatr Emerg Care. 2012;28(2):99–103.
- , , , , . The effect of transfers between health care facilities on costs and length of stay for pediatric burn patients. J Burn Care Res. 2015;36(1):178–183.
- , , , et al. Goal‐directed resuscitative interventions during pediatric interfacility transport. Crit Care Med. 2015;43(8):1692–1698.
Children with medical complexity (CMC) have complex and chronic health conditions that often involve multiple organ systems and severely affect cognitive and physical functioning. Although the prevalence of CMC is low (1% of all children), they account for nearly one‐fifth of all pediatric admissions and one‐half of all hospital days and charges in the United States.[1] Over the last decade, CMC have had a particularly large and increasing impact in tertiary‐care children's hospitals.[1, 2] The Institute of Medicine has identified CMC as a priority population for a revised healthcare system.[3]
Medical homes, hospitals, health plans, states, federal agencies, and others are striving to reduce excessive hospital use in CMC because of its high cost.[4, 5, 6] Containing length of stay (LOS)an increasingly used indicator of the time sensitiveness and efficiency of hospital careis a common aim across these initiatives. CMC have longer hospitalizations than children without medical complexity. Speculated reasons for this are that CMC tend to have (1) higher severity of acute illnesses (eg, pneumonia, cellulitis), (2) prolonged recovery time in the hospital, and (3) higher risk of adverse events in the hospital. Moreover, hospital clinicians caring for CMC often find it difficult to determine discharge readiness, given that many CMC do not return to a completely healthy baseline.[7]
Little is known about long LOS in CMC, including which CMC have the highest risk of experiencing such stays and which stays might have the greatest opportunity to be shortened. Patient characteristics associated with prolonged length of stay have been studied extensively for many pediatric conditions (eg, asthma).[8, 9, 10, 11, 12, 13, 14] However, most of these studies excluded CMC. Therefore, the objectives of this study were to examine (1) the prevalence of long LOS in CMC, (2) patient characteristics associated with long LOS, and (3) hospital‐to‐hospital variation in prevalence of long LOS hospitalizations.
METHODS
Study Design and Data Source
This study is a multicenter, retrospective cohort analysis of the Pediatric Health Information System (PHIS). PHIS is an administrative database of 44 not for profit, tertiary care pediatric hospitals affiliated with the Children's Hospital Association (CHA) (Overland Park, KS). PHIS contains data regarding patient demographics, diagnoses, and procedures (with International Classification of Diseases, 9th Revision, Clinical Modification [ICD‐9‐CM] codes), All‐Patient Refined Diagnostic Related Groups version 30 (APR‐DRGs) (3M Health Information Systems, Salt Lake City, UT), and service lines that aggregate the APR‐DRGs into 38 distinct groups. Data quality and reliability are assured through CHA and participating hospitals. In accordance with the policies of the Cincinnati Children's Hospital Medical Center Institutional Review Board, this study of deidentified data was not considered human subjects research.
Study Population
Inclusion Criteria
Children discharged following an observation or inpatient admission from a hospital participating in the PHIS database between January 1, 2013 and December 31, 2014 were eligible for inclusion if they were considered medically complex. Medical complexity was defined using Clinical Risk Groups (CRGs) version 1.8, developed by 3M Health Information Systems and the National Association of Children's Hospitals and Related Institutions. CRGs were used to assign each hospitalized patient to 1 of 9 mutually exclusive chronicity groups according to the presence, type, and severity of chronic conditions.[15, 16, 17, 18] Each patient's CRG designation was based on 2 years of previous hospital encounters.
As defined in prior studies and definitional frameworks of CMC,[1] patients belonging to CRG group 6 (significant chronic disease in 2 organ systems), CRG group 7 (dominant chronic disease in 3 organ systems), and CRG group 9 (catastrophic condition) were considered medically complex.[17, 19] Patients with malignancies (CRG group 8) were not included for analysis because they are a unique population with anticipated, long hospital stays. Patients with CRG group 5, representing those with chronic conditions affecting a single body system, were also not included because most do not have attributes consistent with medical complexity.
Exclusion Criteria
We used the APR‐DRG system, which leverages ICD‐9‐CM codes to identify the health problem most responsible for the hospitalization, to refine the study cohort. We excluded hospitalizations that were classified by the APR‐DRG system as neonatal, as we did not wish to focus on LOS in the neonatal intensive care unit (ICU) or for birth admissions. Similarly, hospitalizations for chemotherapy (APR‐DRG 693) or malignancy (identified with previously used ICD‐9‐CM codes)[20] were also excluded because long LOS is anticipated. We also excluded hospitalizations for medical rehabilitation (APR‐DRG 860).
Outcome Measures
The primary outcome measure was long LOS, defined as LOS 10 days. The cut point of LOS 10 days represents the 90th percentile of LOS for all children, with and without medical complexity, hospitalized during 2013 to 2014. LOS 10 days has previously been used as a threshold of long LOS.[21] For hospitalizations involving transfer at admission from another acute care facility, LOS was measured from the date of transfer. We also assessed hospitals' cost attributable to long LOS admissions.
Patient Demographics and Clinical Characteristics
We measured demographic characteristics including age, gender, race/ethnicity, insurance type, and distance traveled (the linear distance between the centroid of the patient's home ZIP code and the centroid of the hospital's ZIP code). Clinical characteristics included CRG classification, complex chronic condition (CCC), and dependence on medical technology. CCCs are defined as any medical condition that can be reasonably expected to last at least 12 months (unless death intervenes) and to involve either several different organ systems or 1 system severely enough to require specialty pediatric care and probably some period of hospitalization in a tertiary care center.[20] Medical technology included devices used to optimize the health and functioning of the child (eg, gastrostomy, tracheostomy, cerebrospinal fluid shunt).[22]
Hospitalization Characteristics
Characteristics of the hospitalization included transfer from an outside facility, ICU admission, surgical procedure (using surgical APR‐DRGs), and discharge disposition (home, skilled nursing facility, home health services, death, other). Cost of the hospitalization was estimated in the PHIS from charges using hospital and year‐specific ratios of cost to charge.
Statistical Analysis
Continuous data (eg, distance from hospital to home residence) were described with median and interquartile ranges (IQR) because they were not normally distributed. Categorical data (eg, type of chronic condition) were described with counts and frequencies. In bivariate analyses, demographic, clinical, and hospitalization characteristics were stratified by LOS (long LOS vs LOS <10 days), and compared using 2 statistics or Wilcoxon rank sum tests as appropriate.
We modeled the likelihood of experiencing a long LOS using generalized linear mixed effects models with a random hospital intercept and discharge‐level fixed effects for age, gender, payor, CCC type, ICU utilization, transfer status, a medical/surgical admission indicator derived from the APR‐DRG, and CRG assigned to each hospitalization. To examine hospital‐to‐hospital variability, we generated hospital risk‐adjusted rates of long LOS from these models. Similar models and hospital risk‐adjusted rates were built for a post hoc correlational analysis of 30‐day all cause readmission, where hospitals' rates and percent of long LOS were compared with a Pearson correlation coefficient. Also, for our multivariable models, we performed a sensitivity analysis using an alternative definition of long LOS as 4 days (the 75th percentile of LOS for all children, with and without medical complexity, hospitalized during 20132014). All analyses were performed using SAS version 9.4 (SAS Institute, Cary, NC), and P values <0.05 were considered statistically significant.
RESULTS
Study Population
There were 954,018 hospitalizations of 217,163 CMC at 44 children's hospitals included for analysis. Forty‐seven percent of hospitalizations were for females, 49.4% for non‐Hispanic whites, and 61.1% for children with government insurance. Fifteen percent (n = 142,082) had a long LOS of 10 days. The median (IQR) LOS of hospitalizations <10 days versus 10 days were 2 (IQR, 14) and 16 days (IQR, 1226), respectively. Long LOS hospitalizations accounted for 61.1% (3.7 million) hospital days and 61.8% ($13.7 billion) of total hospitalization costs for all CMC in the cohort (Table 1).
| Characteristic | Overall (n = 954,018) | Length of Stay | |
|---|---|---|---|
| <10 Days (n = 811,936) | 10 Days (n = 142,082) | ||
| |||
| Age at admission, y, % | |||
| <1 | 14.6 | 12.7 | 25.7 |
| 14 | 27.1 | 27.9 | 22.4 |
| 59 | 20.1 | 21.0 | 14.9 |
| 1018 | 33.6 | 34.0 | 31.7 |
| 18+ | 4.6 | 4.4 | 5.4 |
| Gender, % | |||
| Female | 47.0 | 46.9 | 47.5 |
| Race/ethnicity, % | |||
| Non‐Hispanic white | 49.4 | 49.4 | 49.4 |
| Non‐Hispanic black | 23.1 | 23.8 | 19.3 |
| Hispanic | 18.2 | 17.8 | 20.4 |
| Asian | 2.0 | 1.9 | 2.3 |
| Other | 7.4 | 7.1 | 8.6 |
| Complex chronic condition, % | |||
| Any | 79.5 | 77.3 | 91.8 |
| Technology assistance | 37.1 | 34.1 | 54.2 |
| Gastrointestinal | 30.0 | 27.2 | 45.9 |
| Neuromuscular | 28.2 | 27.7 | 30.9 |
| Cardiovascular | 16.8 | 14.5 | 29.9 |
| Respiratory | 14.1 | 11.5 | 29.4 |
| Congenital/genetic defect | 17.2 | 16.7 | 20.2 |
| Metabolic | 9.9 | 8.9 | 15.4 |
| Renal | 10.1 | 9.5 | 13.8 |
| Hematology/emmmunodeficiency | 11.7 | 12.0 | 10.0 |
| Neonatal | 3.8 | 3.1 | 7.7 |
| Transplantation | 4.5 | 4.2 | 6.7 |
| Clinical risk group, % | |||
| Chronic condition in 2 systems | 68.4 | 71.2 | 53.9 |
| Catastrophic chronic condition | 31.4 | 28.8 | 46.1 |
| Distance from hospital to home residence in miles, median [IQR] | 16.2 [7.440.4] | 15.8 [7.338.7] | 19.1 [8.552.6] |
| Transferred from outside hospital (%) | 6.5 | 5.3 | 13.6 |
| Admitted for surgery, % | 23.4 | 20.7 | 38.7 |
| Use of intensive care, % | 19.6 | 14.9 | 46.5 |
| Discharge disposition, % | |||
| Home | 91.2 | 92.9 | 81.4 |
| Home healthcare | 4.5 | 3.5 | 9.9 |
| Other | 2.9 | 2.6 | 4.5 |
| Postacute care facility | 1.1 | 0.8 | 3.1 |
| Died | 0.4 | 0.3 | 1.1 |
| Payor, % | |||
| Government | 61.1 | 60.6 | 63.5 |
| Private | 33.2 | 33.6 | 30.9 |
| Other | 5.7 | 5.7 | 5.7 |
| Hospital resource use | |||
| Median length of stay [IQR] | 3 [16] | 2 [14] | 16 [1226] |
| Median hospital cost [IQR] | $8,144 [$4,122$18,447] | $6,689 [$3,685$12,395] | $49,207 [$29,444$95,738] |
| Total hospital cost, $, billions | $22.2 | $8.5 | $13.7 |
Demographics and Clinical Characteristics of Children With and Without Long LOS
Compared with hospitalized CMC with LOS <10 days, a higher percentage of hospitalizations with LOS 10 days were CMC age <1 year (25.7% vs 12.7%, P < 0.001) and Hispanic (20.4% vs 17.8%, P < 0.001). CMC hospitalizations with a long LOS had a higher percentage of any CCC (91.8% vs 77.3%, P < 0.001); the most common CCCs were gastrointestinal (45.9%), neuromuscular (30.9%), and cardiovascular (29.9%). Hospitalizations of CMC with a long LOS had a higher percentage of a catastrophic chronic condition (46.1% vs 28.8%, P < 0.001) and technology dependence (46.1% vs 28.8%, P < 0.001) (Table 1).
Hospitalization Characteristics of Children With and Without Long LOS
Compared with hospitalizations of CMC with LOS <10 days, hospitalizations of CMC with a long LOS more often involved transfer in from another hospital at admission (13.6% vs 5.3%, P < 0.001). CMC hospital stays with a long LOS more often involved surgery (38.7% vs 20.7%, P < 0.001) and use of intensive care (46.5% vs 14.9%; P < 0.001). A higher percentage of CMC with long LOS were discharged with home health services (9.9% vs 3.5%; P < 0.001) (Table 1).
The most common admitting diagnoses and CCCs for hospitalizations of CMC with long LOS are presented in Table 2. The two most prevalent APR‐DRGs in CMC hospitalizations lasting 10 days or longer were cystic fibrosis (10.7%) and respiratory system disease with ventilator support (5.5%). The two most common chronic condition characteristics represented among long CMC hospitalizations were gastrointestinal devices (eg, gastrostomy tube) (39.7%) and heart and great vessel malformations (eg, tetralogy of Fallot) (12.8%). The 5 most common CCC subcategories, as listed in Table 2, account for nearly 100% of the patients with long LOS hospitalizations.
| |
| Most common reason for admission* | |
| Cystic fibrosis | 10.7% |
| Respiratory system diagnosis with ventilator support 96+ hours | 5.5% |
| Malfunction, reaction, and complication of cardiac or vascular device or procedure | 2.8% |
| Craniotomy except for trauma | 2.6% |
| Major small and large bowel procedures | 2.3% |
| Most common complex chronic condition | |
| Gastrointestinal devices | 39.7% |
| Heart and great vessel malformations | 12.8% |
| Cystic fibrosis | 12.5% |
| Dysrhythmias | 11.0% |
| Respiratory devices | 10.7% |
Multivariable Analysis of Characteristics Associated With Long LOS
In multivariable analysis, the highest likelihood of long LOS was experienced by children who received care in the ICU (odds ratio [OR]: 3.5, 95% confidence interval [CI]: 3.43.5), who had a respiratory CCC (OR: 2.7, 95% CI: 2.62.7), and who were transferred from another acute care hospital at admission (OR: 2.1, 95% CI: 2.0, 2.1). The likelihood of long LOS was also higher in children <1 year of age (OR: 1.2, 95% CI: 1.21.3), and Hispanic children (OR: 1.1, 95% CI 1.0‐1.10) (Table 3). Similar multivariable findings were observed in sensitivity analysis using the 75th percentile of LOS (4 days) as the model outcome.
| Characteristic | Odds Ratio (95% CI) of LOS 10 Days | P Value |
|---|---|---|
| ||
| Use of intensive care | 3.5 (3.4‐3.5) | <0.001 |
| Transfer from another acute‐care hospital | 2.1 (2.0‐2.1) | <0.001 |
| Procedure/surgery | 1.8 (1.8‐1.9) | <0.001 |
| Complex chronic condition | ||
| Respiratory | 2.7 (2.6‐2.7) | <0.001 |
| Gastrointestinal | 1.8 (1.8‐1.8) | <0.001 |
| Metabolic | 1.7 (1.7‐1.7) | <0.001 |
| Cardiovascular | 1.6 (1.5‐1.6) | <0.001 |
| Neonatal | 1.5 (1.5‐1.5) | <0.001 |
| Renal | 1.4 (1.4‐1.4) | <0.001 |
| Transplant | 1.4 (1.4‐1.4) | <0.001 |
| Hematology and immunodeficiency | 1.3 (1.3‐1.3) | <0.001 |
| Technology assistance | 1.1 (1.1, 1.1) | <0.001 |
| Neuromuscular | 0.9 (0.9‐0.9) | <0.001 |
| Congenital or genetic defect | 0.8 (0.8‐0.8) | <0.001 |
| Age at admission, y | ||
| <1 | 1.2 (1.2‐1.3) | <0.001 |
| 14 | 0.5 (0.5‐0.5) | <0.001 |
| 59 | 0.6 (0.6‐0.6) | <0.001 |
| 1018 | 0.9 (0.9‐0.9) | <0.001 |
| 18+ | Reference | |
| Male | 0.9 (0.9‐0.9) | <0.001 |
| Race/ethnicity | ||
| Non‐Hispanic black | 0.9 (0.9‐0.9) | <0.001 |
| Hispanic | 1.1 (1.0‐1.1) | <0.001 |
| Asian | 1.0 (1.0‐1.1) | 0.3 |
| Other | 1.1 (1.1‐1.1) | <0.001 |
| Non‐Hispanic white | Reference | |
| Payor | ||
| Private | 0.9 (0.8 0.9) | <0.001 |
| Other | 1.0 (1.0‐1.0) | 0.4 |
| Government | Reference | |
| Season | ||
| Spring | 1.0 (1.0 1.0) | <0.001 |
| Summer | 0.9 (0.9‐0.9) | <0.001 |
| Fall | 1.0 (0.9‐1.0) | <0.001 |
| Winter | Reference | |
Variation in the Prevalence of Long LOS Across Children's Hospitals
After controlling for demographic, clinical, and hospital characteristics associated with long LOS, there was significant (P < 0.001) variation in the prevalence of long LOS for CMC across children's hospitals in the cohort (range, 10.3%21.8%) (Figure 1). Twelve (27%) hospitals had a significantly (P < 0.001) higher prevalence of long LOS for their hospitalized CMC, compared to the mean. Eighteen (41%) had a significantly (P < 0.001) lower prevalence of long LOS for their hospitalized CMC. There was also significant variation across hospitals with respect to cost, with 49.7% to 73.7% of all hospital costs of CMC attributed to long LOS hospitalizations. Finally, there was indirect correlation with the prevalence of LOS across hospitals and the hospitals' 30‐day readmission rate ( = 0.3; P = 0.04). As the prevalence of long LOS increased, the readmission rate decreased.
DISCUSSION
The main findings from this study suggest that a small percentage of CMC experiencing long LOS account for the majority of hospital bed days and cost of all hospitalized CMC in children's hospitals. The likelihood of long LOS varies significantly by CMC's age, race/ethnicity, and payor as well as by type and number of chronic conditions. Among CMC with long LOS, the use of gastrointestinal devices such as gastrostomy tubes, as well as congenital heart disease, were highly prevalent. In multivariable analysis, the characteristics most strongly associated with LOS 10 days were use of the ICU, respiratory complex chronic condition, and transfer from another medical facility at admission. After adjusting for these factors, there was significant variation in the prevalence of LOS 10 days for CMC across children's hospitals.
Although it is well known that CMC as a whole have a major impact on resource use in children's hospitals, this study reveals that 15% of hospitalizations of CMC account for 62% of all hospital costs of CMC. That is, a small fraction of hospitalizations of CMC is largely responsible for the significant financial impact of hospital resource use. To date, most clinical efforts and policies striving to reduce hospital use in CMC have focused on avoiding readmissions or index hospital admissions entirely, rather than improving the efficiency of hospital care after admission occurs.[23, 24, 25, 26] In the adult population, the impact of long LOS on hospital costs has been recognized, and several Medicare incentive programs have focused on in‐hospital timeliness and efficiency. As a result, LOS in Medicare beneficiaries has decreased dramatically over the past 2 decades.[27, 28, 29, 30] Optimizing the efficiency of hospital care for CMC may be an important goal to pursue, especially with precedent set in the adult literature.
Perhaps the substantial variation across hospitals in the prevalence of long LOS in CMC indicates opportunity to improve the efficiency of their inpatient care. This variation was not due to differences across hospitals' case mix of CMC. Further investigation is needed to determine how much of it is due to differences in quality of care. Clinical practice guidelines for hospital treatment of common illnesses usually exclude CMC. In our clinical experience across 9 children's hospitals, we have experienced varying approaches to setting discharge goals (ie, parameters on how healthy the child needs to be to ensure a successful hospital discharge) for CMC.[31] When the goals are absent or not clearly articulated, they can contribute to a prolonged hospitalization. Some families of CMC report significant issues when working with pediatric hospital staff to assess their child's discharge readiness.[7, 32, 33] In addition, there is significant variation across states and regions in access to and quality of post‐discharge health services (eg, home nursing, postacute care, durable medical equipment).[34, 35] In some areas, many CMC are not actively involved with their primary care physician.[5] These issues might also influence the ability of some children's hospitals to efficiently discharge CMC to a safe and supportive post‐discharge environment. Further examination of hospital outliersthose with the lowest and highest percentage of CMC hospitalizations with long LOSmay reveal opportunities to identify and spread best practices.
The demographic and clinical factors associated with long LOS in the present study, including age, ICU use, and transfer from another hospital, might help hospitals target which CMC have the greatest risk for experiencing long LOS. We found that infants age <1 year had longer LOS when compared with older children. Similar to our findings, younger‐aged children hospitalized with bronchiolitis have longer LOS.[36] Certainly, infants with medical complexity, in general, are a high‐acuity population with the potential for rapid clinical deterioration during an acute illness. Prolonged hospitalization for treatment and stabilization may be expected for many of them. Additional investigation is warranted to examine ICU use in CMC, and whether ICU admission or duration can be safely prevented or abbreviated. Opportunities to assess the quality of transfers into children's hospitals of CMC admitted to outside hospitals may be necessary. A study of pediatric burn patients reported that patients initially stabilized at a facility that was not a burn center and subsequently transferred to a burn center had a longer LOS than patients solely treated at a designated burn center.[37] Furthermore, events during transport itself may adversely impact the stability of an already fragile patient. Interventions to optimize the quality of care provided by transport teams have resulted in decreased LOS at the receiving hospital.[38]
This study's findings should be considered in the context of several limitations. Absent a gold‐standard definition of long LOS, we used the distribution of LOS across patients to inform our methods; LOS at the 90th percentile was selected as long. Although our sensitivity analysis using LOS at the 75th percentile produced similar findings, other cut points in LOS might be associated with different results. The study is not positioned to determine how much of the reported LOS was excessive, unnecessary, or preventable. The study findings may not generalize to types of hospitals not contained in PHIS (eg, nonchildren's hospitals and community hospitals). We did not focus on the impact of a new diagnosis (eg, new chronic illness) or acute in‐hospital event (eg, nosocomial infection) on prolonged LOS; future studies should investigate these clinical events with LOS.
PHIS does not contain information regarding characteristics that could influence LOS, including the children's social and familial attributes, transportation availability, home equipment needs, and local availability of postacute care facilities. Moreover, PHIS does not contain information about the hospital discharge procedures, process, or personnel across hospitals, which could influence LOS. Future studies on prolonged LOS should consider assessing this information. Because of the large sample size of hospitalizations included, the statistical power for the analyses was strong, rendering it possible that some findings that were statistically significant might have modest clinical significance (eg, relationship of Hispanic ethnicity with prolonged LOS). We could not determine why a positive correlation was not observed between hospitals' long LOS prevalence and their percentage of cost associated with long LOS; future studies should investigate the reasons for this finding.
Despite these limitations, the findings of the present study highlight the significance of long LOS in hospitalized CMC. These long hospitalizations account for a significant proportion of all hospital costs for this important population of children. The prevalence of long LOS for CMC varies considerably across children's hospitals, even after accounting for the case mix. Efforts to curtail hospital resource use and costs for CMC may benefit from focus on long LOS.
- , , , et al. Inpatient growth and resource use in 28 children's hospitals: a longitudinal, multi‐institutional study. JAMA Pediatr. 2013;167(2):170–177.
- , , , et al. Children with complex chronic conditions in inpatient hospital settings in the united states. Pediatrics. 2010;126(4):647–655.
- , . Meeting the health care needs of persons with disabilities. Milbank Q. 2002;80(2):381–391.
- , , , et al. Effect of an enhanced medical home on serious illness and cost of care among high‐risk children with chronic illness: a randomized clinical trial. JAMA. 2014;312(24):2640–2648.
- , , , et al. Children with medical complexity and Medicaid: spending and cost savings. Health Aff Proj Hope. 2014;33(12):2199–2206.
- Children's Hospital Association. CARE Award. Available at: https://www.childrenshospitals.org/Programs‐and‐Services/Quality‐Improvement‐and‐Measurement/CARE‐Award. Accessed December 18, 2015.
- , , , et al. Hospital readmission and parent perceptions of their child's hospital discharge. Int J Qual Health Care. 2013;25(5):573–581.
- , , , et al. Weekend matters: Friday and Saturday admissions are associated with prolonged hospitalization of children. Clin Pediatr (Phila). 2013;52(9):875–878.
- , , , . Attributable cost and length of stay for central line‐associated bloodstream infections. Pediatrics. 2014;133(6):e1525–e1532.
- , , , et al. Effect of healthcare‐acquired infection on length of hospital stay and cost. Infect Control Hosp Epidemiol. 2007;28(3):280–292.
- , , , , . Hospital utilization and costs among children with influenza, 2003. Am J Prev Med. 2009;36(4):292–296.
- , , , . Charges and lengths of stay attributable to adverse patient‐care events using pediatric‐specific quality indicators: a multicenter study of freestanding children's hospitals. Pediatrics. 2008;121(6):e1653–e1659.
- , , , , . Variation in resource utilization for the management of uncomplicated community‐acquired pneumonia across community and children's hospitals. J Pediatr. 2014;165(3):585–591.
- , , , , . Variation and outcomes associated with direct hospital admission among children with pneumonia in the United States. JAMA Pediatr. 2014;168(9):829–836.
- , , , et al. Clinical Risk Groups (CRGs): a classification system for risk‐adjusted capitation‐based payment and health care management. Med Care. 2004;42(1):81–90.
- , , , et al. Identifying children with lifelong chronic conditions for care coordination by using hospital discharge data. Acad Pediatr. 2010;10(6):417–423.
- , , , , . Profile of medical charges for children by health status group and severity level in a Washington State Health Plan. Health Serv Res. 2004;39(1):73–89.
- , , , . Using medical billing data to evaluate chronically ill children over time. J Ambulatory Care Manage. 2006;29(4):283–290.
- , , , , , . Medical complexity and pediatric emergency department and inpatient utilization. Pediatrics. 2013;131(2):e559–e565.
- , , , , . Pediatric complex chronic conditions classification system version 2: updated for ICD‐10 and complex medical technology dependence and transplantation. BMC Pediatr. 2014;14:199.
- . Analyzing intensive care unit length of stay data: problems and possible solutions. Crit Care Med. 1997;25(9):1594–1600.
- , , , et al. Hospital utilization and characteristics of patients experiencing recurrent readmissions within children's hospitals. JAMA. 2011;305(7):682–690.
- . Hospital readmissions and repeat emergency department visits among children with medical complexity: an integrative review. J Pediatr Nurs. 2013;28(4):316–339.
- , , , . Hospital readmission in children with complex chronic conditions discharged from subacute care. Hosp Pediatr. 2014;4(3):153–158.
- , , , et al. Preventing hospitalizations in children with medical complexity: a systematic review. Pediatrics. 2014;134(6):e1628–e1647.
- , , , . Hospital readmissions for newly discharged pediatric home mechanical ventilation patients. Pediatr Pulmonol. 2012;47(4):409–414.
- , , , et al. Clinical characteristics and outcomes of Medicare patients undergoing total hip arthroplasty, 1991–2008. JAMA. 2011;305(15):1560–1567.
- , , , et al. Trends in length of stay and short‐term outcomes among Medicare patients hospitalized for heart failure, 1993–2006. JAMA. 2010;303(21):2141–2147.
- U.S. Department of Health and Human Services. CMS Statistics 2013. Available at: https://www.cms.gov/Research‐Statistics‐Data‐and‐Systems/Statistics‐Trends‐and‐Reports/CMS‐Statistics‐Reference‐Booklet/Downloads/CMS_Stats_2013_final.pdf. Published August 2013. Accessed October 6, 2015.
- Centers for Medicare and Medicaid Services. Evaluation of the premier hospital quality incentive demonstration. Available at: https://www.cms.gov/Research‐Statistics‐Data‐and‐Systems/Statistics‐Trends‐and‐Reports/Reports/downloads/Premier_ExecSum_2010.pdf. Published March 3, 2009. Accessed September 18, 2015.
- , , , et al. A framework of pediatric hospital discharge care informed by legislation, research, and practice. JAMA Pediatr. 2014;168(10):955–962; quiz 965–966.
- , , , , . Parent and provider perspectives on pediatric readmissions: what can we learn about readiness for discharge? Hosp Pediatr. 2015;5(11):559–565.
- , . Preventing readmissions in children: how do we do that? Hosp Pediatr. 2015;5(11):602–604.
- , , . Pediatric post‐acute hospital care: striving for identity and value. Hosp Pediatr. 2015;5(10):548–551.
- , , , et al. Pediatric hospital discharges to home health and postacute facility care: a national study. JAMA Pediatr. 2016;170(4):326–333.
- , , , et al. Bronchiolitis: clinical characteristics associated with hospitalization and length of stay. Pediatr Emerg Care. 2012;28(2):99–103.
- , , , , . The effect of transfers between health care facilities on costs and length of stay for pediatric burn patients. J Burn Care Res. 2015;36(1):178–183.
- , , , et al. Goal‐directed resuscitative interventions during pediatric interfacility transport. Crit Care Med. 2015;43(8):1692–1698.

Pneumonia Guideline Therapy Outcomes
Community‐acquired pneumonia (CAP) is a common and serious infection in children. With more than 150,000 children requiring hospitalization annually, CAP is the fifth most prevalent and the second most costly diagnosis of all pediatric hospitalizations in the United States.[1, 2, 3]
In August 2011, the Pediatric Infectious Diseases Society (PIDS) and the Infectious Diseases Society of America (IDSA) published an evidence‐based guideline for the management of CAP in children. This guideline recommended that fully immunized children without underlying complications who require hospitalization receive an aminopenicillin as first‐line antibiotic therapy.[4] Additionally, the guideline recommends empirically adding a macrolide to an aminopenicillin when atypical pneumonia is a diagnostic consideration.
This recommendation was a substantial departure from practice for hospitals nationwide, as a multicenter study of children's hospitals (20052010) demonstrated that <10% of patients diagnosed with CAP received aminopenicillins as empiric therapy.[5] Since publication of the PIDS/IDSA guidelines, the use of aminopenicillins has increased significantly across institutions, but the majority of hospitalized patients still receive broad‐spectrum cephalosporin therapy for CAP.[6]
At baseline, 30% of patients hospitalized with CAP received guideline‐recommended antibiotic therapy at our institution. Through the use of quality‐improvement methods, the proportion of patients receiving guideline‐recommended therapy increased to 100%.[7] The objective of this study was to ensure that there were not unintended negative consequences to guideline implementation. Specifically, we sought to identify changes in length of stay (LOS), hospital costs, and treatment failures associated with use of guideline‐recommended antibiotic therapy for children hospitalized with uncomplicated CAP.
METHODS
Study Design and Study Population
This retrospective cohort study included children age 3 months to 18 years, hospitalized with CAP, between May 2, 2011 and July 30, 2012, at Cincinnati Children's Hospital Medical Center (CCHMC), a 512‐bed free‐standing children's hospital. The CCHMC Institutional Review Board approved this study with a waiver of informed consent.
Patients were eligible for inclusion if they were admitted to the hospital for inpatient or observation level care with a primary or secondary International Classification of Disease, 9th Revision discharge diagnosis code of pneumonia (480.02, 480.89, 481, 482.0, 482.30‐2, 482.41‐2, 482.83, 482.8990, 483.8, 484.3, 485, 486, 487.0) or effusion/empyema (510.0, 510.9, 511.01, 511.89, 513).[8] Patients with complex chronic conditions[9] were excluded. Medical records of eligible patients (n=260) were reviewed by 2 members of the study team to ensure that patients fell into the purview of the guideline. Patients who did not receive antibiotics (n=11) or for whom there was documented concern for aspiration (n=1) were excluded. Additionally, patients with immunodeficiency (n=1) or who had not received age‐appropriate vaccinations (n=2), and patients who required intensive care unit admission on presentation (n=17) or who had a complicated pneumonia, defined by presence of moderate or large pleural effusion at time of admission (n=8), were also excluded.[7] Finally, for patients with multiple pneumonia admissions, only the index visit was included; subsequent visits occurring within 30 days of discharge were considered readmissions.
Treatment Measure
The primary exposure of interest was empiric antibiotic therapy upon hospital admission. Antibiotic therapy was classified as guideline recommended or nonguideline recommended. Guideline‐recommended therapy was defined as follows:
- For children without drug allergies: ampicillin (200 mg/kg/day intravenously) or amoxicillin (90 mg/kg/day orally);
- For children with penicillin allergy: ceftriaxone (50100 mg/kg/day intravenously or intramuscularly) or cefdinir (14 mg/kg/day orally);
- For children with penicillin and cephalosporin allergy: clindamycin (40 mg/kg/day orally or intravenously); and
- Or azithromycin (10 mg/kg/day orally or intravenously on day 1) in combination with antibiotic category 1 or 2 or 3 above.
Outcome Measures
The primary outcomes examined were hospital LOS, total cost of hospitalization, and inpatient pharmacy costs. LOS was measured in hours and defined as the difference in time between departure from and arrival to the inpatient unit. Total cost of index hospitalization included both direct and indirect costs, obtained from the Centers for Medicare & Medicaid Services' Relative Value Units data for Current Procedural Terminology codes.[10]
Secondary outcomes included broadening of antibiotic therapy during the hospital course, pneumonia‐related emergency department (ED) revisits within 30 days, and pneumonia‐related inpatient readmissions within 30 days. Broadening of antibiotic therapy was defined as addition of a second antibiotic (eg, adding azithromycin on day 3 of hospitalization) or change in empiric antibiotic to a class with broader antimicrobial activity (eg, ampicillin to ceftriaxone) at any time during hospitalization. As our study population included only patients with uncomplicated pneumonia at the time of admission, this outcome was used to capture possible treatment failure. ED revisits and inpatient readmissions were reviewed by 3 investigators to identify pneumonia‐related visits. To encompass all possible treatment failures, all respiratory‐related complaints (eg, wheezing, respiratory distress) were considered as pneumonia‐related. Disagreements were resolved by group discussion.
Covariates
Severity of illness on presentation was evaluated using the Emergency Severity Index version 4,[11] abnormal vital signs on presentation (as defined by Pediatric Advanced Life Support age‐specific criteria[12]), and need for oxygen in the first 24 hours of hospitalization. Supplemental oxygen is administered for saturations <91% per protocol at our institution. The patient's highest Pediatric Early Warning Scale score[13] during hospitalization was used as a proxy for disease severity. Exam findings on presentation (eg, increased respiratory effort, rales, wheezing) were determined through chart review. Laboratory tests and radiologic imaging variables included complete blood cell count, blood culture, chest radiograph, chest ultrasound, and chest computed tomography. Abnormal white blood cell count was defined as <5000 or >15,000 cells/mL, the defined reference range for the CCHMC clinical laboratory.
Data Analysis
Continuous variables were described using median and interquartile range (IQR) and compared across groups using Wilcoxon rank sum test due to non‐normal distributions. Categorical variables were described by counts and frequencies and compared using the 2 test.
Multivariable linear regression analysis was performed to assess the independent effect of receipt of empiric guideline‐recommended antibiotic therapy on outcomes of LOS and costs while adjusting for covariates. As LOS and costs were non‐normally distributed, we logarithmically transformed these values to use as the dependent variables in our models. The resulting coefficients were back‐transformed to reflect the percent change in LOS and costs incurred between subjects who received empiric guideline therapy compared with those who did not.[14] Covariates were chosen a priori due to their clinical and biological relevance to the outcomes of LOS (eg, wheezing on presentation and need for supplemental oxygen), total cost of hospitalization (eg, LOS and need for repeat imaging), and inpatient pharmacy costs (eg, LOS and wheezing on presentation) (Table 1).
| Characteristic | Overall Cohort, n=220 | Guideline Therapy, n=166 | Nonguideline Therapy, n=54 | P Value |
|---|---|---|---|---|
| ||||
| Age, y, median (IQR) | 2.9 (1.36.3) | 2.5 (1.35.2) | 5.6 (2.38.8) | <0.01* |
| Male, no. (%) | 122 (55.5%) | 89 (53.6%) | 33 (61.1%) | 0.34 |
| Emergency Severity Index, no. (%) | 0.11 | |||
| 2 | 90 (40.9%) | 73 (44.0%) | 17 (31.5%) | |
| 3 | 116 (52.7%) | 85 (51.2%) | 31 (57.4%) | |
| 4 | 14 (6.4%) | 8 (4.8%) | 6 (11.1%) | |
| Abnormal vital signs on presentation, no. (%) | ||||
| Fever | 99 (45.0%) | 80 (48.2%) | 19 (35.2%) | 0.10 |
| Tachycardia | 100 (45.5%) | 76 (45.8%) | 24 (44.4%) | 0.86 |
| Tachypnea | 124 (56.4%) | 100 (60.2%) | 24 (44.4%) | 0.04* |
| Hypotension | 0 | 0 | 0 | |
| Hypoxia | 27 (12.3%) | 24 (14.5%) | 3 (5.6%) | 0.08 |
| Physical exam on presentation, no. (%) | ||||
| Increased respiratory effort | 146 (66.4%) | 111 (66.9%) | 35 (64.8%) | 0.78 |
| Distressed | 110 (50.0%) | 86 (51.8%) | 24 (44.4%) | 0.35 |
| Retraction | 103 (46.8%) | 81 (48.8%) | 22 (40.7%) | 0.30 |
| Grunting | 17 (7.7%) | 14 (8.4%) | 3 (5.6%) | 0.49 |
| Nasal flaring | 19 (8.6%) | 17 (10.2%) | 2 (3.7%) | 0.14 |
| Rales | 135 (61.4%) | 99 (59.6%) | 36 (66.7%) | 0.36 |
| Wheeze | 91 (41.4%) | 66 (39.8%) | 25 (46.3%) | 0.40 |
| Decreased breath sounds | 89 (40.5%) | 65 (39.2%) | 24 (44.4%) | 0.49 |
| Dehydration | 21 (9.6%) | 13 (7.8%) | 8 (14.8%) | 0.13 |
| PEWS 5 during admission, no. (%) | 43 (19.6%) | 34 (20.5%) | 9 (16.7%) | 0.54 |
| Oxygen requirement in first 24 hours, no. (%) | 114 (51.8%) | 90 (53.6%) | 24 (46.2%) | 0.35 |
| Complete blood count obtained, no. (%) | 99 (45.0%) | 72 (43.4%) | 27 (50.0%) | 0.40 |
| Abnormal white blood cell count | 35 (35.7%) | 23 (32.4%) | 12 (44.4%) | 0.27 |
| Blood culture obtained, no. (%) | 104 (47.3%) | 80 (48.2%) | 24 (44.4%) | 0.63 |
| Positive | 2 (1.9%) | 1 (1.3%) | 1 (4.2%) | 0.36 |
| Chest radiograph available, no. (%) | 214 (97.3%) | 161 (97.0%) | 53 (98.2%) | 0.65 |
| Infiltrate | 178 (83.2%) | 139 (86.3%) | 39 (73.6%) | 0.03* |
| Bilateral | 29 (16.3%) | 20 (14.4%) | 9 (23.1%) | 0.19 |
| Multilobar | 46 (25.8%) | 33 (23.7%) | 13 (33.3%) | 0.23 |
| Effusion | 24 (11.2%) | 16 (9.9%) | 8 (15.1%) | 0.30 |
| Additional imaging, no. (%) | ||||
| Repeat chest radiograph | 26 (11.8%) | 17 (10.2%) | 9 (16.7%) | 0.20 |
| Chest ultrasound | 4 (1.8%) | 3 (1.8%) | 1 (1.9%) | 0.98 |
| Chest CT | 2 (0.9%) | 1 (0.6%) | 1 (1.9%) | 0.40 |
| Antibiotic, no. (%) | <0.01* | |||
| Aminopenicillin | 140 (63.6%) | 140 (84.3%) | 0 (0%) | |
| Third‐generation cephalosporin | 37 (16.8%) | 8 (4.8%) | 29 (53.7%) | |
| Macrolide monotherapy | 18 (8.2%) | 0 (0%) | 18 (33.3%) | |
| Clindamycin | 2 (0.9%) | 1 (0.6%) | 1 (1.9%) | |
| Levofloxacin | 1 (0.5%) | 0 (0%) | 1 (1.9%) | |
| Aminopenicillin+macrolide | 16 (7.3%) | 16 (9.6%) | 0 (0%) | |
| Cephalosporin+macrolide | 6 (2.7%) | 1 (0.6%) | 5 (9.3%) | |
Secondary outcomes of broadened antibiotic therapy, ED revisits, and hospital readmissions were assessed using the Fisher exact test. Due to the small number of events, we were unable to evaluate these associations in models adjusted for potential confounders.
All analyses were performed with SAS version 9.3 (SAS Institute, Cary, NC), and P values <0.05 were considered significant.
RESULTS
Of the 220 unique patients included, 122 (55%) were male. The median age was 2.9 years (IQR: 1.36.3 years). Empiric guideline‐recommended therapy was prescribed to 168 (76%) patients (Table 1). Aminopenicillins were the most common guideline‐recommended therapy, accounting for 84% of guideline‐recommended antibiotics. An additional 10% of patients received the guideline‐recommended combination therapy with an aminopenicillin and a macrolide. Nonguideline‐recommended therapy included third‐generation cephalosporin antibiotics (54%) and macrolide monotherapy (33%).
Those who received empiric guideline‐recommended antibiotic therapy were similar to those who received nonguideline‐recommended therapy with respect to sex, Emergency Severity Index, physical exam findings on presentation, oxygen requirement in the first 24 hours, abnormal laboratory findings, presence of effusion on chest radiograph, and need for additional imaging (Table 1). However, patients in the guideline‐recommended therapy group were significantly younger (median 2.5 years vs 5.6 years, P0.01), more likely to have elevated respiratory rate on presentation (60.2% vs 44.4%, P=0.04), and more likely to have an infiltrate on chest radiograph (86.3% vs 73.6%, P=0.03) (Table 1). Patients who received nonguideline‐recommended macrolide monotherapy had a median age of 7.4 years (IQR: 5.89.8 years).
Median hospital LOS for the total cohort was 1.3 days (IQR: 0.91.9 days) (Table 2). There were no differences in LOS between patients who received and did not receive guideline‐recommended therapy in the unadjusted or the adjusted model (Table 3).
| Outcome | Guideline Therapy, n=166 | Nonguideline Therapy, n=54 | P Value |
|---|---|---|---|
| |||
| Length of stay, d, median (IQR) | 1.3 (0.91.9) | 1.3 (0.92.0) | 0.74 |
| Total costs, median, (IQR) | $4118 ($2,647$6,004) | $4045 ($2,829$6,200) | 0.44 |
| Pharmacy total costs, median, (IQR) | $84 ($40$179) | $106 ($58$217) | 0.12 |
| Broadened therapy, no. (%) | 10 (6.0%) | 4 (7.4%) | 0.75 |
| Emergency department revisit, no. (%) | 7 (4.2%) | 2 (3.7%) | 1.00 |
| Readmission, no. (%) | 1 (0.6%) | 1 (1.9%) | 0.43 |
| Outcome | Unadjusted Coefficient (95% CI) | Adjusted Coefficient (95% CI) | Adjusted % Change in Outcome (95% CI)* |
|---|---|---|---|
| |||
| Length of stay | 0.06 (0.27 to 0.15) | 0.06 (0.25 to 0.12) | 5.8 (22.1 to 12.8) |
| Total costs | 0.18 (0.40 to 0.04) | 0.11 (0.32 to 0.09) | 10.9 (27.4 to 9.4) |
| Pharmacy total costs | 0.44 (0.46 to 0.02) | 0.16 (0.57 to 0.24) | 14.8 (43.4 to 27.1) |
Median total costs of the index hospitalization for the total cohort were $4097 (IQR: $2657$6054), with median inpatient pharmacy costs of $92 (IQR: $40$183) (Table 2). There were no differences in total or inpatient pharmacy costs for patients who received guideline‐recommended therapy compared with those who did not in unadjusted or adjusted analyses. Fourteen patients (6.4%) had antibiotic therapy broadened during hospitalization, 10 were initially prescribed guideline‐recommended therapy, and 4 were initially prescribed nonguideline‐recommended therapy (Table 4).
| Initial Therapy | Reasons for Antibiotic Change Identified From Chart Review |
|---|---|
| Guideline=10 | Ampicillin to ceftriaxone: |
| 1 patient with clinical worsening | |
| 1 patient with coincident urinary tract infection due to resistant organism | |
| 4 patients without evidence of clinical worsening or documentation of rationale | |
| Addition of a macrolide: | |
| 3 patients without evidence of clinical worsening or documentation of rationale | |
| Addition of clindamycin: | |
| 1 patient with clinical worsening | |
| Nonguideline=4 | Ceftriaxone to clindamycin: |
| 1 patient with clinical worsening | |
| Addition of a macrolide: | |
| 1 patient with clinical worsening | |
| 1 patients without evidence of clinical worsening or documentation of rationale | |
| Addition of clindamycin: | |
| 1 patient with clinical worsening |
Of the 9 pneumonia‐related ED revisits within 30 days of discharge, 7 occurred in patients prescribed empiric guideline‐recommended therapy (Table 5). No ED revisit resulted in hospital readmission or antibiotic change related to pneumonia. Two ED revisits resulted in new antibiotic prescriptions for diagnoses other than pneumonia.
| Revisit | Initial Therapy | Day Postdischarge | Clinical Symptoms at Return Visit | Clinical Diagnosis | Antibiotic Prescription |
|---|---|---|---|---|---|
| |||||
| ED | Guideline | 3 | Poor oral intake and fever | Pneumonia | Continued prior antibiotic |
| ED | Guideline | 8 | Recurrent cough and fever | Resolving pneumonia | Continued prior antibiotic |
| ED | Guideline | 13 | Follow‐up | Resolved pneumonia | No further antibiotic |
| ED | Guideline | 16 | Increased work of breathing | Reactive airway disease | No antibiotic |
| ED | Guideline | 20 | Persistent cough | Viral illness | No antibiotic |
| ED | Guideline | 22 | Recurrent cough and congestion | Sinusitis | Augmentin |
| ED | Guideline | 26 | Increased work of breathing | Reactive airway disease | No antibiotic |
| ED | Nonguideline | 16 | Recurrent fever | Acute otitis media | Amoxicillin |
| ED | Nonguideline | 20 | Recurrent cough and fever | Viral illness | No antibiotic |
| Admission | Guideline | 3 | Increased work of breathing | Pneumonia | IV ampicillin |
| Admission | Nonguideline | 9 | Refusal to take oral clindamycin | Pneumonia | IV clindamycin |
Two patients were readmitted for a pneumonia‐related illness within 30 days of discharge; 1 had received guideline‐recommended therapy (Table 5). Both patients were directly admitted to the inpatient ward without an associated ED visit. Antibiotic class was not changed for either patient upon readmission, despite the decision to convert to intravenous form.
DISCUSSION
In this retrospective cohort study, patients who received empiric guideline‐recommended antibiotic therapy on admission for CAP had no difference in LOS, total cost of hospitalization, or inpatient pharmacy costs compared with those who received therapy that varied from guideline recommendations. Our study suggests that prescribing narrow‐spectrum therapy and, in some circumstances, combination therapy, as recommended by the 2011 PIDS/IDSA pneumonia guideline, did not result in negative unintended consequences.
In our study, children receiving guideline‐recommended therapy were younger, more likely to have elevated respiratory rate on presentation, and more likely to have an infiltrate on chest radiograph. We hypothesize the age difference is a reflection of common use of nonguideline macrolide monotherapy in the older, school‐age child, as macrolides are commonly used for coverage of Mycoplasma pneumonia in older children with CAP.[15] Children receiving macrolide monotherapy were older than those receiving guideline‐recommended therapy (median age of 7.4 years and 2.5 years, respectively). We also hypothesize that some providers may prescribe macrolide monotherapy to children deemed less ill than expected for CAP (eg, normal percutaneous oxygen saturation). This hypothesis is supported by the finding that 60% of patients who had a normal respiratory rate and received nonguideline therapy were prescribed macrolide monotherapy. We did control for the characteristics that varied between the two treatment groups in our models to eliminate potential confounding.
One prior study evaluated the effects of guideline implementation in CAP. In evaluation of a clinical practice guideline that recommended ampicillin as first‐line therapy for CAP, no significant difference was found following guideline introduction in the number of treatment failures (defined as the need to broaden therapy or development of complicated pneumonia within 48 hours or 30‐day inpatient readmission).[16] Our study builds on these findings by directly comparing outcomes between recipients of guideline and nonguideline therapy, which was not done in the prestudy or poststudy design of prior work.[16] We believe that classifying patients based on empiric therapy received rather than timing of guideline introduction thoroughly examines the effect of following guideline recommendations. Additionally, outcomes other than treatment failures were examined in our study including LOS, costs, and ED revisits.
Our results are similar to other observational studies that compared narrow‐ and broad‐spectrum antibiotics for children hospitalized with CAP. Using administrative data, Williams et al. found no significant difference in LOS or cost between narrow‐ and broad‐spectrum intravenous antibiotic recipients ages 6 months to 18 years at 43 children's hospitals.[17] Queen et al. compared narrow‐ and broad‐spectrum antibiotic therapy for children ages 2 months to 18 years at 4 children's hospitals.[18] Differences in average daily cost were not significant, but children who received narrow‐spectrum antibiotics had a significantly shorter LOS. Finally, an observational study of 319 Israeli children <2 years of age found no significant difference in duration of oxygen requirement, LOS, or need for change in antibiotic therapy between the 66 children prescribed aminopenicillins and the 253 children prescribed cefuroxime.[19] These studies suggest that prescribing narrow‐spectrum antimicrobial therapy, as per the guideline recommendations, results in similar outcomes to broad‐spectrum antimicrobial therapy.
Our study adds to prior studies that compared narrow‐ and broad‐spectrum therapy by comparing outcomes associated with guideline‐recommended therapy to nonguideline therapy. We considered antibiotic therapy as guideline recommended if appropriately chosen per the guideline, not just by simple classification of antibiotic. For example, the use of a cephalosporin in a patient with aminopenicillin allergy was considered guideline‐recommended therapy. We chose to classify the exposure of empiric antibiotic therapy in this manner to reflect true clinical application of the guideline, as not all children are able to receive aminopenicillins. Additionally, as our study stemmed from our prior improvement work aimed at increasing guideline adherent therapy,[7] we have a higher frequency of narrow‐spectrum antibiotic use than prior studies. In our study, almost two‐thirds of patients received narrow‐spectrum therapy, whereas narrow‐spectrum use in prior studies ranged from 10% to 33%.[17, 18, 19] Finally, we were able to confirm the diagnosis of pneumonia via medical record review and to adjust for severity of illness using clinical variables including vital signs, physical exam findings, and laboratory and radiologic study results.
This study must be interpreted in the context of several limitations. First, our study population was defined through discharge diagnosis codes, and therefore dependent on the accuracy of coding. However, we minimized potential for misclassification through use of a previously validated approach to identify patients with CAP and through medical record review to confirm the diagnosis. Second, we may be unable to detect very small differences in outcomes given limited power, specifically for outcomes of LOS, ED revisits, hospital readmissions, and need to broaden antibiotic therapy. Third, residual confounding may be present. Although we controlled for many clinical variables in our analyses, antibiotic prescribing practices may be influenced by unmeasured factors. The potential of system level confounding is mitigated by standardized care for patients with CAP at our institution. Prior system‐level changes using quality‐improvement science have resulted in a high level of adherence with guideline‐recommended antimicrobials as well as standardized medical discharge criteria.[7, 20] Additionally, nonmedical factors may influence LOS, limiting its use as an outcome measure. This limitation was minimized in our study by standardizing medical discharge criteria. Prior work at our institution demonstrated that the majority of patients, including those with CAP, were discharged within 2 hours of meeting medical discharge criteria.[20] Fourth, discharged patients who experienced adverse outcomes may have received care at a nearby adult emergency department or at their pediatrician's office. Although these events would not have been captured in our electronic health record, serious complications due to treatment failure (eg, empyema) would require hospitalization. As our hospital is the only children's hospital in the Greater Cincinnati metropolitan area, these patents would receive care at our institution. Therefore, any misclassification of revisits or readmissions is likely to be minimal. Finally, study patients were admitted to a large tertiary academic children's hospital, warranting further investigation to determine if these findings can be translated to smaller community settings.
In conclusion, receipt of guideline‐recommended antibiotic therapy for patients hospitalized with CAP was not associated with increases in LOS, total costs of hospitalization, or inpatient pharmacy costs. Our findings highlight the importance of changing antibiotic prescribing practices to reflect guideline recommendations, as there was no evidence of negative unintended consequences with our local practice change.
Acknowledgments
Disclosures: Dr. Ambroggio and Dr. Thomson were supported by funds from the NRSA T32HP10027‐14. Dr. Shah was supported by funds from NIAID K01A173729. The authors report no conflicts of interest.
- , , , , , . Ambulatory visit rates and antibiotic prescribing for children with pneumonia, 1994–2007. Pediatrics. 2011;127(3):411–418.
- , , , , . National hospitalization trends for pediatric pneumonia and associated complications. Pediatrics. 2010;126(2):204–213.
- , , , et al. Prioritization of comparative effectiveness research topics in hospital pediatrics. Arch Pediatr Adolesc Med. 2012;166(12):1155–1164.
- , , , et al. The management of community‐acquired pneumonia in infants and children older than 3 months of age: clinical practice guidelines by the Pediatric Infectious Diseases Society and the Infectious Diseases Society of America. Clin Infect Dis. 2011;53(7):e25–e76.
- , , , et al. Variability in processes of care and outcomes among children hospitalized with community‐acquired pneumonia. Pediatr Infect Dis J. 2012;31(10):1036–1041.
- , , , et al. Impact of IDSA/PIDS guidelines on treatment of community‐acquired pneumonia in hospitalized children. Clin Infect Dis. 2014;58(6):834–838.
- , , , et al. Quality improvement methods increase appropriate antibiotic prescribing for childhood pneumonia. Pediatrics. 2013;131(5):e1623–e1631.
- , , , et al. Identifying pediatric community‐acquired pneumonia hospitalizations: accuracy of administrative billing codes. JAMA Pediatr. 2013;167(9):851–858.
- , , , , , . Deaths attributed to pediatric complex chronic conditions: national trends and implications for supportive care services. Pediatrics. 2001;107(6):E99.
- Centers for Medicare 2011.
- , , , et al. Pediatric advanced life support: 2010 American Heart Association guidelines for cardiopulmonary resuscitation and emergency cardiovascular care. Pediatrics. 2010;126(5):e1361–e1399.
- , , , , . Prospective evaluation of a pediatric inpatient early warning scoring system. J Spec Pediatr Nurs. 2009;14(2):79–85.
- , , , . Regression Methods in Biostatistics: Linear, Logistic, Survival, and Repeated Measures Models. New York, NY: Springer; 2005.
- , , , , . Treatment of mycoplasma pneumonia: a systematic review. Pediatrics. 2014;133(6):1081–1090.
- , , , , , . Impact of a guideline on management of children hospitalized with community‐acquired pneumonia. Pediatrics. 2012;129(3):e597–e604.
- , , , et al. Narrow vs broad‐spectrum antimicrobial therapy for children hospitalized with pneumonia. Pediatrics. 2013;132(5):e1141–e1148.
- , , , et al. Comparative effectiveness of empiric antibiotics for community‐acquired pneumonia. Pediatrics. 2014;133(1):e23–e29.
- , , , et al. Antibiotic treatment of children with community‐acquired pneumonia: comparison of penicillin or ampicillin versus cefuroxime. Pediatr Pulmonol. 2013;48(1):52–58.
- , , , et al. Using quality improvement to optimise paediatric discharge efficiency. BMJ Qual Saf. 2014;23(5):428–436.
Community‐acquired pneumonia (CAP) is a common and serious infection in children. With more than 150,000 children requiring hospitalization annually, CAP is the fifth most prevalent and the second most costly diagnosis of all pediatric hospitalizations in the United States.[1, 2, 3]
In August 2011, the Pediatric Infectious Diseases Society (PIDS) and the Infectious Diseases Society of America (IDSA) published an evidence‐based guideline for the management of CAP in children. This guideline recommended that fully immunized children without underlying complications who require hospitalization receive an aminopenicillin as first‐line antibiotic therapy.[4] Additionally, the guideline recommends empirically adding a macrolide to an aminopenicillin when atypical pneumonia is a diagnostic consideration.
This recommendation was a substantial departure from practice for hospitals nationwide, as a multicenter study of children's hospitals (20052010) demonstrated that <10% of patients diagnosed with CAP received aminopenicillins as empiric therapy.[5] Since publication of the PIDS/IDSA guidelines, the use of aminopenicillins has increased significantly across institutions, but the majority of hospitalized patients still receive broad‐spectrum cephalosporin therapy for CAP.[6]
At baseline, 30% of patients hospitalized with CAP received guideline‐recommended antibiotic therapy at our institution. Through the use of quality‐improvement methods, the proportion of patients receiving guideline‐recommended therapy increased to 100%.[7] The objective of this study was to ensure that there were not unintended negative consequences to guideline implementation. Specifically, we sought to identify changes in length of stay (LOS), hospital costs, and treatment failures associated with use of guideline‐recommended antibiotic therapy for children hospitalized with uncomplicated CAP.
METHODS
Study Design and Study Population
This retrospective cohort study included children age 3 months to 18 years, hospitalized with CAP, between May 2, 2011 and July 30, 2012, at Cincinnati Children's Hospital Medical Center (CCHMC), a 512‐bed free‐standing children's hospital. The CCHMC Institutional Review Board approved this study with a waiver of informed consent.
Patients were eligible for inclusion if they were admitted to the hospital for inpatient or observation level care with a primary or secondary International Classification of Disease, 9th Revision discharge diagnosis code of pneumonia (480.02, 480.89, 481, 482.0, 482.30‐2, 482.41‐2, 482.83, 482.8990, 483.8, 484.3, 485, 486, 487.0) or effusion/empyema (510.0, 510.9, 511.01, 511.89, 513).[8] Patients with complex chronic conditions[9] were excluded. Medical records of eligible patients (n=260) were reviewed by 2 members of the study team to ensure that patients fell into the purview of the guideline. Patients who did not receive antibiotics (n=11) or for whom there was documented concern for aspiration (n=1) were excluded. Additionally, patients with immunodeficiency (n=1) or who had not received age‐appropriate vaccinations (n=2), and patients who required intensive care unit admission on presentation (n=17) or who had a complicated pneumonia, defined by presence of moderate or large pleural effusion at time of admission (n=8), were also excluded.[7] Finally, for patients with multiple pneumonia admissions, only the index visit was included; subsequent visits occurring within 30 days of discharge were considered readmissions.
Treatment Measure
The primary exposure of interest was empiric antibiotic therapy upon hospital admission. Antibiotic therapy was classified as guideline recommended or nonguideline recommended. Guideline‐recommended therapy was defined as follows:
- For children without drug allergies: ampicillin (200 mg/kg/day intravenously) or amoxicillin (90 mg/kg/day orally);
- For children with penicillin allergy: ceftriaxone (50100 mg/kg/day intravenously or intramuscularly) or cefdinir (14 mg/kg/day orally);
- For children with penicillin and cephalosporin allergy: clindamycin (40 mg/kg/day orally or intravenously); and
- Or azithromycin (10 mg/kg/day orally or intravenously on day 1) in combination with antibiotic category 1 or 2 or 3 above.
Outcome Measures
The primary outcomes examined were hospital LOS, total cost of hospitalization, and inpatient pharmacy costs. LOS was measured in hours and defined as the difference in time between departure from and arrival to the inpatient unit. Total cost of index hospitalization included both direct and indirect costs, obtained from the Centers for Medicare & Medicaid Services' Relative Value Units data for Current Procedural Terminology codes.[10]
Secondary outcomes included broadening of antibiotic therapy during the hospital course, pneumonia‐related emergency department (ED) revisits within 30 days, and pneumonia‐related inpatient readmissions within 30 days. Broadening of antibiotic therapy was defined as addition of a second antibiotic (eg, adding azithromycin on day 3 of hospitalization) or change in empiric antibiotic to a class with broader antimicrobial activity (eg, ampicillin to ceftriaxone) at any time during hospitalization. As our study population included only patients with uncomplicated pneumonia at the time of admission, this outcome was used to capture possible treatment failure. ED revisits and inpatient readmissions were reviewed by 3 investigators to identify pneumonia‐related visits. To encompass all possible treatment failures, all respiratory‐related complaints (eg, wheezing, respiratory distress) were considered as pneumonia‐related. Disagreements were resolved by group discussion.
Covariates
Severity of illness on presentation was evaluated using the Emergency Severity Index version 4,[11] abnormal vital signs on presentation (as defined by Pediatric Advanced Life Support age‐specific criteria[12]), and need for oxygen in the first 24 hours of hospitalization. Supplemental oxygen is administered for saturations <91% per protocol at our institution. The patient's highest Pediatric Early Warning Scale score[13] during hospitalization was used as a proxy for disease severity. Exam findings on presentation (eg, increased respiratory effort, rales, wheezing) were determined through chart review. Laboratory tests and radiologic imaging variables included complete blood cell count, blood culture, chest radiograph, chest ultrasound, and chest computed tomography. Abnormal white blood cell count was defined as <5000 or >15,000 cells/mL, the defined reference range for the CCHMC clinical laboratory.
Data Analysis
Continuous variables were described using median and interquartile range (IQR) and compared across groups using Wilcoxon rank sum test due to non‐normal distributions. Categorical variables were described by counts and frequencies and compared using the 2 test.
Multivariable linear regression analysis was performed to assess the independent effect of receipt of empiric guideline‐recommended antibiotic therapy on outcomes of LOS and costs while adjusting for covariates. As LOS and costs were non‐normally distributed, we logarithmically transformed these values to use as the dependent variables in our models. The resulting coefficients were back‐transformed to reflect the percent change in LOS and costs incurred between subjects who received empiric guideline therapy compared with those who did not.[14] Covariates were chosen a priori due to their clinical and biological relevance to the outcomes of LOS (eg, wheezing on presentation and need for supplemental oxygen), total cost of hospitalization (eg, LOS and need for repeat imaging), and inpatient pharmacy costs (eg, LOS and wheezing on presentation) (Table 1).
| Characteristic | Overall Cohort, n=220 | Guideline Therapy, n=166 | Nonguideline Therapy, n=54 | P Value |
|---|---|---|---|---|
| ||||
| Age, y, median (IQR) | 2.9 (1.36.3) | 2.5 (1.35.2) | 5.6 (2.38.8) | <0.01* |
| Male, no. (%) | 122 (55.5%) | 89 (53.6%) | 33 (61.1%) | 0.34 |
| Emergency Severity Index, no. (%) | 0.11 | |||
| 2 | 90 (40.9%) | 73 (44.0%) | 17 (31.5%) | |
| 3 | 116 (52.7%) | 85 (51.2%) | 31 (57.4%) | |
| 4 | 14 (6.4%) | 8 (4.8%) | 6 (11.1%) | |
| Abnormal vital signs on presentation, no. (%) | ||||
| Fever | 99 (45.0%) | 80 (48.2%) | 19 (35.2%) | 0.10 |
| Tachycardia | 100 (45.5%) | 76 (45.8%) | 24 (44.4%) | 0.86 |
| Tachypnea | 124 (56.4%) | 100 (60.2%) | 24 (44.4%) | 0.04* |
| Hypotension | 0 | 0 | 0 | |
| Hypoxia | 27 (12.3%) | 24 (14.5%) | 3 (5.6%) | 0.08 |
| Physical exam on presentation, no. (%) | ||||
| Increased respiratory effort | 146 (66.4%) | 111 (66.9%) | 35 (64.8%) | 0.78 |
| Distressed | 110 (50.0%) | 86 (51.8%) | 24 (44.4%) | 0.35 |
| Retraction | 103 (46.8%) | 81 (48.8%) | 22 (40.7%) | 0.30 |
| Grunting | 17 (7.7%) | 14 (8.4%) | 3 (5.6%) | 0.49 |
| Nasal flaring | 19 (8.6%) | 17 (10.2%) | 2 (3.7%) | 0.14 |
| Rales | 135 (61.4%) | 99 (59.6%) | 36 (66.7%) | 0.36 |
| Wheeze | 91 (41.4%) | 66 (39.8%) | 25 (46.3%) | 0.40 |
| Decreased breath sounds | 89 (40.5%) | 65 (39.2%) | 24 (44.4%) | 0.49 |
| Dehydration | 21 (9.6%) | 13 (7.8%) | 8 (14.8%) | 0.13 |
| PEWS 5 during admission, no. (%) | 43 (19.6%) | 34 (20.5%) | 9 (16.7%) | 0.54 |
| Oxygen requirement in first 24 hours, no. (%) | 114 (51.8%) | 90 (53.6%) | 24 (46.2%) | 0.35 |
| Complete blood count obtained, no. (%) | 99 (45.0%) | 72 (43.4%) | 27 (50.0%) | 0.40 |
| Abnormal white blood cell count | 35 (35.7%) | 23 (32.4%) | 12 (44.4%) | 0.27 |
| Blood culture obtained, no. (%) | 104 (47.3%) | 80 (48.2%) | 24 (44.4%) | 0.63 |
| Positive | 2 (1.9%) | 1 (1.3%) | 1 (4.2%) | 0.36 |
| Chest radiograph available, no. (%) | 214 (97.3%) | 161 (97.0%) | 53 (98.2%) | 0.65 |
| Infiltrate | 178 (83.2%) | 139 (86.3%) | 39 (73.6%) | 0.03* |
| Bilateral | 29 (16.3%) | 20 (14.4%) | 9 (23.1%) | 0.19 |
| Multilobar | 46 (25.8%) | 33 (23.7%) | 13 (33.3%) | 0.23 |
| Effusion | 24 (11.2%) | 16 (9.9%) | 8 (15.1%) | 0.30 |
| Additional imaging, no. (%) | ||||
| Repeat chest radiograph | 26 (11.8%) | 17 (10.2%) | 9 (16.7%) | 0.20 |
| Chest ultrasound | 4 (1.8%) | 3 (1.8%) | 1 (1.9%) | 0.98 |
| Chest CT | 2 (0.9%) | 1 (0.6%) | 1 (1.9%) | 0.40 |
| Antibiotic, no. (%) | <0.01* | |||
| Aminopenicillin | 140 (63.6%) | 140 (84.3%) | 0 (0%) | |
| Third‐generation cephalosporin | 37 (16.8%) | 8 (4.8%) | 29 (53.7%) | |
| Macrolide monotherapy | 18 (8.2%) | 0 (0%) | 18 (33.3%) | |
| Clindamycin | 2 (0.9%) | 1 (0.6%) | 1 (1.9%) | |
| Levofloxacin | 1 (0.5%) | 0 (0%) | 1 (1.9%) | |
| Aminopenicillin+macrolide | 16 (7.3%) | 16 (9.6%) | 0 (0%) | |
| Cephalosporin+macrolide | 6 (2.7%) | 1 (0.6%) | 5 (9.3%) | |
Secondary outcomes of broadened antibiotic therapy, ED revisits, and hospital readmissions were assessed using the Fisher exact test. Due to the small number of events, we were unable to evaluate these associations in models adjusted for potential confounders.
All analyses were performed with SAS version 9.3 (SAS Institute, Cary, NC), and P values <0.05 were considered significant.
RESULTS
Of the 220 unique patients included, 122 (55%) were male. The median age was 2.9 years (IQR: 1.36.3 years). Empiric guideline‐recommended therapy was prescribed to 168 (76%) patients (Table 1). Aminopenicillins were the most common guideline‐recommended therapy, accounting for 84% of guideline‐recommended antibiotics. An additional 10% of patients received the guideline‐recommended combination therapy with an aminopenicillin and a macrolide. Nonguideline‐recommended therapy included third‐generation cephalosporin antibiotics (54%) and macrolide monotherapy (33%).
Those who received empiric guideline‐recommended antibiotic therapy were similar to those who received nonguideline‐recommended therapy with respect to sex, Emergency Severity Index, physical exam findings on presentation, oxygen requirement in the first 24 hours, abnormal laboratory findings, presence of effusion on chest radiograph, and need for additional imaging (Table 1). However, patients in the guideline‐recommended therapy group were significantly younger (median 2.5 years vs 5.6 years, P0.01), more likely to have elevated respiratory rate on presentation (60.2% vs 44.4%, P=0.04), and more likely to have an infiltrate on chest radiograph (86.3% vs 73.6%, P=0.03) (Table 1). Patients who received nonguideline‐recommended macrolide monotherapy had a median age of 7.4 years (IQR: 5.89.8 years).
Median hospital LOS for the total cohort was 1.3 days (IQR: 0.91.9 days) (Table 2). There were no differences in LOS between patients who received and did not receive guideline‐recommended therapy in the unadjusted or the adjusted model (Table 3).
| Outcome | Guideline Therapy, n=166 | Nonguideline Therapy, n=54 | P Value |
|---|---|---|---|
| |||
| Length of stay, d, median (IQR) | 1.3 (0.91.9) | 1.3 (0.92.0) | 0.74 |
| Total costs, median, (IQR) | $4118 ($2,647$6,004) | $4045 ($2,829$6,200) | 0.44 |
| Pharmacy total costs, median, (IQR) | $84 ($40$179) | $106 ($58$217) | 0.12 |
| Broadened therapy, no. (%) | 10 (6.0%) | 4 (7.4%) | 0.75 |
| Emergency department revisit, no. (%) | 7 (4.2%) | 2 (3.7%) | 1.00 |
| Readmission, no. (%) | 1 (0.6%) | 1 (1.9%) | 0.43 |
| Outcome | Unadjusted Coefficient (95% CI) | Adjusted Coefficient (95% CI) | Adjusted % Change in Outcome (95% CI)* |
|---|---|---|---|
| |||
| Length of stay | 0.06 (0.27 to 0.15) | 0.06 (0.25 to 0.12) | 5.8 (22.1 to 12.8) |
| Total costs | 0.18 (0.40 to 0.04) | 0.11 (0.32 to 0.09) | 10.9 (27.4 to 9.4) |
| Pharmacy total costs | 0.44 (0.46 to 0.02) | 0.16 (0.57 to 0.24) | 14.8 (43.4 to 27.1) |
Median total costs of the index hospitalization for the total cohort were $4097 (IQR: $2657$6054), with median inpatient pharmacy costs of $92 (IQR: $40$183) (Table 2). There were no differences in total or inpatient pharmacy costs for patients who received guideline‐recommended therapy compared with those who did not in unadjusted or adjusted analyses. Fourteen patients (6.4%) had antibiotic therapy broadened during hospitalization, 10 were initially prescribed guideline‐recommended therapy, and 4 were initially prescribed nonguideline‐recommended therapy (Table 4).
| Initial Therapy | Reasons for Antibiotic Change Identified From Chart Review |
|---|---|
| Guideline=10 | Ampicillin to ceftriaxone: |
| 1 patient with clinical worsening | |
| 1 patient with coincident urinary tract infection due to resistant organism | |
| 4 patients without evidence of clinical worsening or documentation of rationale | |
| Addition of a macrolide: | |
| 3 patients without evidence of clinical worsening or documentation of rationale | |
| Addition of clindamycin: | |
| 1 patient with clinical worsening | |
| Nonguideline=4 | Ceftriaxone to clindamycin: |
| 1 patient with clinical worsening | |
| Addition of a macrolide: | |
| 1 patient with clinical worsening | |
| 1 patients without evidence of clinical worsening or documentation of rationale | |
| Addition of clindamycin: | |
| 1 patient with clinical worsening |
Of the 9 pneumonia‐related ED revisits within 30 days of discharge, 7 occurred in patients prescribed empiric guideline‐recommended therapy (Table 5). No ED revisit resulted in hospital readmission or antibiotic change related to pneumonia. Two ED revisits resulted in new antibiotic prescriptions for diagnoses other than pneumonia.
| Revisit | Initial Therapy | Day Postdischarge | Clinical Symptoms at Return Visit | Clinical Diagnosis | Antibiotic Prescription |
|---|---|---|---|---|---|
| |||||
| ED | Guideline | 3 | Poor oral intake and fever | Pneumonia | Continued prior antibiotic |
| ED | Guideline | 8 | Recurrent cough and fever | Resolving pneumonia | Continued prior antibiotic |
| ED | Guideline | 13 | Follow‐up | Resolved pneumonia | No further antibiotic |
| ED | Guideline | 16 | Increased work of breathing | Reactive airway disease | No antibiotic |
| ED | Guideline | 20 | Persistent cough | Viral illness | No antibiotic |
| ED | Guideline | 22 | Recurrent cough and congestion | Sinusitis | Augmentin |
| ED | Guideline | 26 | Increased work of breathing | Reactive airway disease | No antibiotic |
| ED | Nonguideline | 16 | Recurrent fever | Acute otitis media | Amoxicillin |
| ED | Nonguideline | 20 | Recurrent cough and fever | Viral illness | No antibiotic |
| Admission | Guideline | 3 | Increased work of breathing | Pneumonia | IV ampicillin |
| Admission | Nonguideline | 9 | Refusal to take oral clindamycin | Pneumonia | IV clindamycin |
Two patients were readmitted for a pneumonia‐related illness within 30 days of discharge; 1 had received guideline‐recommended therapy (Table 5). Both patients were directly admitted to the inpatient ward without an associated ED visit. Antibiotic class was not changed for either patient upon readmission, despite the decision to convert to intravenous form.
DISCUSSION
In this retrospective cohort study, patients who received empiric guideline‐recommended antibiotic therapy on admission for CAP had no difference in LOS, total cost of hospitalization, or inpatient pharmacy costs compared with those who received therapy that varied from guideline recommendations. Our study suggests that prescribing narrow‐spectrum therapy and, in some circumstances, combination therapy, as recommended by the 2011 PIDS/IDSA pneumonia guideline, did not result in negative unintended consequences.
In our study, children receiving guideline‐recommended therapy were younger, more likely to have elevated respiratory rate on presentation, and more likely to have an infiltrate on chest radiograph. We hypothesize the age difference is a reflection of common use of nonguideline macrolide monotherapy in the older, school‐age child, as macrolides are commonly used for coverage of Mycoplasma pneumonia in older children with CAP.[15] Children receiving macrolide monotherapy were older than those receiving guideline‐recommended therapy (median age of 7.4 years and 2.5 years, respectively). We also hypothesize that some providers may prescribe macrolide monotherapy to children deemed less ill than expected for CAP (eg, normal percutaneous oxygen saturation). This hypothesis is supported by the finding that 60% of patients who had a normal respiratory rate and received nonguideline therapy were prescribed macrolide monotherapy. We did control for the characteristics that varied between the two treatment groups in our models to eliminate potential confounding.
One prior study evaluated the effects of guideline implementation in CAP. In evaluation of a clinical practice guideline that recommended ampicillin as first‐line therapy for CAP, no significant difference was found following guideline introduction in the number of treatment failures (defined as the need to broaden therapy or development of complicated pneumonia within 48 hours or 30‐day inpatient readmission).[16] Our study builds on these findings by directly comparing outcomes between recipients of guideline and nonguideline therapy, which was not done in the prestudy or poststudy design of prior work.[16] We believe that classifying patients based on empiric therapy received rather than timing of guideline introduction thoroughly examines the effect of following guideline recommendations. Additionally, outcomes other than treatment failures were examined in our study including LOS, costs, and ED revisits.
Our results are similar to other observational studies that compared narrow‐ and broad‐spectrum antibiotics for children hospitalized with CAP. Using administrative data, Williams et al. found no significant difference in LOS or cost between narrow‐ and broad‐spectrum intravenous antibiotic recipients ages 6 months to 18 years at 43 children's hospitals.[17] Queen et al. compared narrow‐ and broad‐spectrum antibiotic therapy for children ages 2 months to 18 years at 4 children's hospitals.[18] Differences in average daily cost were not significant, but children who received narrow‐spectrum antibiotics had a significantly shorter LOS. Finally, an observational study of 319 Israeli children <2 years of age found no significant difference in duration of oxygen requirement, LOS, or need for change in antibiotic therapy between the 66 children prescribed aminopenicillins and the 253 children prescribed cefuroxime.[19] These studies suggest that prescribing narrow‐spectrum antimicrobial therapy, as per the guideline recommendations, results in similar outcomes to broad‐spectrum antimicrobial therapy.
Our study adds to prior studies that compared narrow‐ and broad‐spectrum therapy by comparing outcomes associated with guideline‐recommended therapy to nonguideline therapy. We considered antibiotic therapy as guideline recommended if appropriately chosen per the guideline, not just by simple classification of antibiotic. For example, the use of a cephalosporin in a patient with aminopenicillin allergy was considered guideline‐recommended therapy. We chose to classify the exposure of empiric antibiotic therapy in this manner to reflect true clinical application of the guideline, as not all children are able to receive aminopenicillins. Additionally, as our study stemmed from our prior improvement work aimed at increasing guideline adherent therapy,[7] we have a higher frequency of narrow‐spectrum antibiotic use than prior studies. In our study, almost two‐thirds of patients received narrow‐spectrum therapy, whereas narrow‐spectrum use in prior studies ranged from 10% to 33%.[17, 18, 19] Finally, we were able to confirm the diagnosis of pneumonia via medical record review and to adjust for severity of illness using clinical variables including vital signs, physical exam findings, and laboratory and radiologic study results.
This study must be interpreted in the context of several limitations. First, our study population was defined through discharge diagnosis codes, and therefore dependent on the accuracy of coding. However, we minimized potential for misclassification through use of a previously validated approach to identify patients with CAP and through medical record review to confirm the diagnosis. Second, we may be unable to detect very small differences in outcomes given limited power, specifically for outcomes of LOS, ED revisits, hospital readmissions, and need to broaden antibiotic therapy. Third, residual confounding may be present. Although we controlled for many clinical variables in our analyses, antibiotic prescribing practices may be influenced by unmeasured factors. The potential of system level confounding is mitigated by standardized care for patients with CAP at our institution. Prior system‐level changes using quality‐improvement science have resulted in a high level of adherence with guideline‐recommended antimicrobials as well as standardized medical discharge criteria.[7, 20] Additionally, nonmedical factors may influence LOS, limiting its use as an outcome measure. This limitation was minimized in our study by standardizing medical discharge criteria. Prior work at our institution demonstrated that the majority of patients, including those with CAP, were discharged within 2 hours of meeting medical discharge criteria.[20] Fourth, discharged patients who experienced adverse outcomes may have received care at a nearby adult emergency department or at their pediatrician's office. Although these events would not have been captured in our electronic health record, serious complications due to treatment failure (eg, empyema) would require hospitalization. As our hospital is the only children's hospital in the Greater Cincinnati metropolitan area, these patents would receive care at our institution. Therefore, any misclassification of revisits or readmissions is likely to be minimal. Finally, study patients were admitted to a large tertiary academic children's hospital, warranting further investigation to determine if these findings can be translated to smaller community settings.
In conclusion, receipt of guideline‐recommended antibiotic therapy for patients hospitalized with CAP was not associated with increases in LOS, total costs of hospitalization, or inpatient pharmacy costs. Our findings highlight the importance of changing antibiotic prescribing practices to reflect guideline recommendations, as there was no evidence of negative unintended consequences with our local practice change.
Acknowledgments
Disclosures: Dr. Ambroggio and Dr. Thomson were supported by funds from the NRSA T32HP10027‐14. Dr. Shah was supported by funds from NIAID K01A173729. The authors report no conflicts of interest.
- , , , , , . Ambulatory visit rates and antibiotic prescribing for children with pneumonia, 1994–2007. Pediatrics. 2011;127(3):411–418.
- , , , , . National hospitalization trends for pediatric pneumonia and associated complications. Pediatrics. 2010;126(2):204–213.
- , , , et al. Prioritization of comparative effectiveness research topics in hospital pediatrics. Arch Pediatr Adolesc Med. 2012;166(12):1155–1164.
- , , , et al. The management of community‐acquired pneumonia in infants and children older than 3 months of age: clinical practice guidelines by the Pediatric Infectious Diseases Society and the Infectious Diseases Society of America. Clin Infect Dis. 2011;53(7):e25–e76.
- , , , et al. Variability in processes of care and outcomes among children hospitalized with community‐acquired pneumonia. Pediatr Infect Dis J. 2012;31(10):1036–1041.
- , , , et al. Impact of IDSA/PIDS guidelines on treatment of community‐acquired pneumonia in hospitalized children. Clin Infect Dis. 2014;58(6):834–838.
- , , , et al. Quality improvement methods increase appropriate antibiotic prescribing for childhood pneumonia. Pediatrics. 2013;131(5):e1623–e1631.
- , , , et al. Identifying pediatric community‐acquired pneumonia hospitalizations: accuracy of administrative billing codes. JAMA Pediatr. 2013;167(9):851–858.
- , , , , , . Deaths attributed to pediatric complex chronic conditions: national trends and implications for supportive care services. Pediatrics. 2001;107(6):E99.
- Centers for Medicare 2011.
- , , , et al. Pediatric advanced life support: 2010 American Heart Association guidelines for cardiopulmonary resuscitation and emergency cardiovascular care. Pediatrics. 2010;126(5):e1361–e1399.
- , , , , . Prospective evaluation of a pediatric inpatient early warning scoring system. J Spec Pediatr Nurs. 2009;14(2):79–85.
- , , , . Regression Methods in Biostatistics: Linear, Logistic, Survival, and Repeated Measures Models. New York, NY: Springer; 2005.
- , , , , . Treatment of mycoplasma pneumonia: a systematic review. Pediatrics. 2014;133(6):1081–1090.
- , , , , , . Impact of a guideline on management of children hospitalized with community‐acquired pneumonia. Pediatrics. 2012;129(3):e597–e604.
- , , , et al. Narrow vs broad‐spectrum antimicrobial therapy for children hospitalized with pneumonia. Pediatrics. 2013;132(5):e1141–e1148.
- , , , et al. Comparative effectiveness of empiric antibiotics for community‐acquired pneumonia. Pediatrics. 2014;133(1):e23–e29.
- , , , et al. Antibiotic treatment of children with community‐acquired pneumonia: comparison of penicillin or ampicillin versus cefuroxime. Pediatr Pulmonol. 2013;48(1):52–58.
- , , , et al. Using quality improvement to optimise paediatric discharge efficiency. BMJ Qual Saf. 2014;23(5):428–436.
© 2014 Society of Hospital Medicine