User login
Do Bedside Visual Tools Improve Patient and Caregiver Satisfaction? A Systematic Review of the Literature
Patient satisfaction with medical care during hospitalization is a common quality metric.1,2 Studies showing higher patient satisfaction have reported lower 30-day hospital readmissions3 and improved overall health.4,5 Conversely, communication failures are associated with dissatisfaction among hospitalized patients and adverse outcomes.6,7 A lack of familiarity with hospital providers weakens collaborative decision making and prevents high-quality patient care.8,9
Bedside visual tools, such as whiteboards and pictures of medical staff, have been widely used to enhance communication between patients, families, and providers.10,11 Results of studies evaluating these tools are varied. For example, 1 study found that 98% of patients were better able to identify physicians when their names were written on whiteboards.12 Yet in another, only 21.1% of patients were more likely to correctly identify ≥1 physicians using pictures.13 Thus, despite widespread use,11 whether visual tools improve patient satisfaction and patient care more broadly remains unclear.14,15
We performed a systematic review to answer the following 3 questions: first, what is the effect of visual tools on outcomes (ie, provider identification, understanding of providers’ roles, patient–provider communication, and satisfaction); second, does impact vary by type of visual tool (eg, whiteboards vs pictures of providers); and third, what factors (eg, study design, patient population) are associated with provider identification, communication, and patient satisfaction?
METHODS
Search Strategy
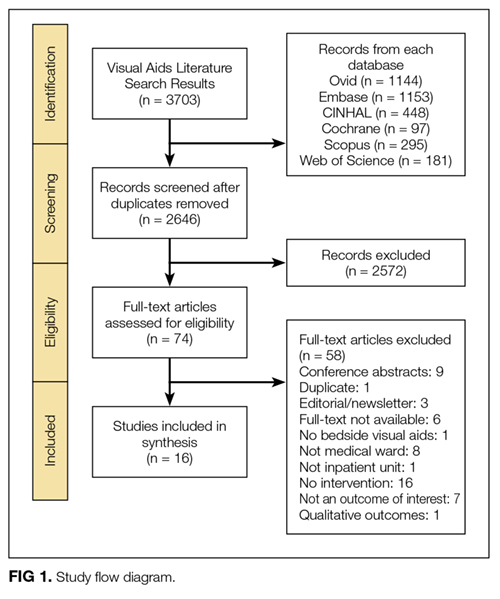
We used the Preferred Reporting Items for Systematic Reviews and Meta-Analysis when performing this review.16 A research librarian (WT) conducted serial searches for studies reporting the use of bedside visual tools for hospitalized patients in Medline (via OVID), Embase, SCOPUS, Web of Science, CINAHL, and Cochrane DSR and CENTRAL. Controlled vocabularies (ie, Medical Subject Headings terms) were used to identify synonyms for visual tools of interest. Additional studies were identified manually through bibliographies and meeting abstracts. No study design, publication date, or language restrictions were placed on the search, which was conducted between April 2016 and February 2017 (see supplementary Appendix A).
Study Selection
Two reviewers (AG and KT) independently assessed study eligibility; discrepancies were resolved by a third reviewer (VC). We included all adult or pediatric English language studies in which the effect of visual tool(s) on patient outcomes was reported. Visual tools were defined as the bedside display of information or an instrument given to patients to convey information regarding providers or medical care. Patient-reported outcomes included the following: (a) physician identification, (b) understanding of provider roles, (c) patient–provider communication, and (d) patient satisfaction with care. Providers were defined as physicians, residents, interns, medical students, nurse practitioners, or nurses. We excluded studies that were not original research (eg, conference abstracts, not peer reviewed), reported qualitative data without quantitative outcomes, or did not include a bedside visual tool. Given our interest in hospitalized general medicine patients, studies conducted in emergency departments, surgical units, obstetrics and gynecology wards, and intensive care units were excluded.
Data Extraction and Analysis
Data were extracted independently and in duplicate from all studies by using a template adapted from the Cochrane Collaboration.17 For all studies, we abstracted study design, type of visual tool (eg, whiteboards), unit setting (eg, medical), population studied (eg, adult vs pediatric), and outcomes reported (ie, physician identification, understanding of provider roles, communication, and satisfaction with care). Reviewers independently assessed and categorized the impact of tools on reported outcomes.
To standardize and compare outcomes across studies, the following were used to denote a positive association between visual tools and relevant outcomes: a greater number of physicians correctly identified by name/picture or title/role; the use of terms such as “high,” “agreed,” or “significant” on surveys; or ≥4 Likert scores for domains of identification, understanding of roles, communication, and satisfaction with care. Conversely, the inability to identify providers compared to the control/baseline; poor recall of titles/roles; lower Likert-scale scores (ie, ≤2); or survey terms such as “poor,” “disagreed,” or “insignificant” were considered to connote negative impact. Studies in which Likert scores were rated neither high nor low (ie, 3), or in which patients neither agreed nor disagreed on value were considered neutral.
Owing to clinical heterogeneity within studies, meta-analyses were not performed. Descriptive statistics were used to describe study outcomes. A priori18 studies were evaluated according to the following categories: design (eg, randomized vs observational), outcomes (eg, patient satisfaction), intervention (type of visual tool), and patient population (adult or pediatric). Because pediatric patients have underdeveloped communication skills and include parents and/or guardians, data from pediatric studies were tabulated and reported separately to those from adult studies.
Quality Assessment
As recommended by the Cochrane Collaboration, 2 reviewers (AG, KT) assessed the risk of study bias by using the Downs and Black Scale.17,19 Discrepancies in assessment were resolved by a third reviewer (VC). This instrument uses a point-based system to estimate the quality of a study by rating domains such as internal and external validity, bias, and confounding. In keeping with prior systematic reviews,18,20,21 studies with a score of ≥18 were considered high quality. Interrater agreement for the adjudication of study quality was calculated using the Cohen κ statistic.
RESULTS


STUDIES OF ADULT HOSPITALIZED PATIENTS
Eleven studies were conducted on adult hospitalized patients 12-14,22-24,26,27,29,30,33 and included 3 randomized controlled studies.14,27,33
Results by Outcomes Provider Identification Nine studies measured patients’ ability to identify providers with the use of visual aids, and all 9 reported improvements in this outcome. Visual tools used to measure provider identification included pictures (n = 5),13,14,23,27,33 whiteboards (n = 3),12,22,30 and patient portals (n = 1).26 Within studies that used pictures, individual pictures (n = 2)13,23 and handouts with pictures of multiple providers (n = 3) were used.14,27,33 In 2 studies, care team members such as a dietitian, physiotherapist or pharmacist, were included when measuring identification.14,33
Understanding Providers’ RolesSix studies assessed the effect of visual tools on patients’ understanding of provider roles.13,14,22,26,27,33 Four studies reported a positive effect with the use of pictures,27,33 whiteboards,22 and patient portals.26 However, 2 studies reported either no difference or negative impressions. Appel et al.14 reported no difference in the understanding of physician roles using a handout of providers’ pictures and titles. Arora et al.13 used individual pictures of physicians with descriptions of roles and found a negative association, as demonstrated by fewer patients rating their understanding of physicians’ roles as excellent or very good in the intervention period (45.6%) compared with the baseline (55.3%).
Patient–Provider Communication
Three studies evaluated the influence of visual tools on communication.14,24,29 Using pictures, Appel et al.14 found no difference in the perceived quality of communication. Singh et al.29 used whiteboards and reported improved communication scores for physicians and nurses. With notepads, patients surveyed by Farberg et al.24 stated that the tool improved provider communication.
Patient Satisfaction
Five studies assessed patient satisfaction related to the use of visual tools. 22,23,27,30,33 One study reported satisfaction as positive with the use of individual pictures.23 Two studies that used handouts with pictures of all team members reported either a positive33 or neutral27 impact on satisfaction. Studies that used whiteboards reported a positive association with satisfaction22,30 despite differences in content, such as the inclusion of prewritten prompts for writing goals of care and scheduled tests30 versus the name of the nurse and their education level.22
Results by Type of Visual Tool Pictures
Five studies that used pictures reported a positive effect on provider identification.13,14,23,27,33 Two27,33 of 4 studies13,14,27,33 that assessed patients’ understanding of team member roles reported a positive influence, while 1 reported no difference.14 A fourth study demonstrated a negative association, perhaps due to differences in the description of providers’ roles listed on the tool.13 Only 1 study examined the influence of pictures on patient–provider communication, and this study found no difference.14 Satisfaction with care via the use of pictures varied between positive (2 studies)23,33 and neutral (1 study).27
Whiteboards
Four studies tested the use of whiteboards; of these, 3 reported a positive influence on provider identification.12,22,30 One study reported a positive impact on patient–provider communication.29 Two studies noted a positive effect on patient satisfaction.22,30 Notably, the responsibility for updating whiteboards differed between the studies (ie, nurses only22 vs residents, medical students, and nurses).30
Patient Portal
In 1 study, an electronic portal that included names with pictures of providers, descriptions of their roles, lists of medications, and scheduled tests and/or procedures was used as a visual tool. The portal improved patients’ identification of physicians and patients’ understanding of roles. However, improvements in the knowledge of medication changes and planned tests and/or procedures during hospitalization were not observed.26 This finding would suggest limitations in the hospitalized patient’s knowledge of the plan of care, which could potentially weaken patient–provider communication.
Notepads
Only 1 study assessed the use of formatted notepads on patient–provider communication and noted a positive association. Notepads used prompts for different categories (eg, diagnosis/treatment, medications, etc) to encourage patient questions for providers.24
STUDIES OF PEDIATRIC HOSPITALIZED PATIENTS
Five studies were conducted on hospitalized pediatric units.15,25,28,31,32 All studies surveyed the parents, guardians, or caregivers of pediatric patients. One study excluded patients ≥12 years of age because of legal differences in access to adolescent health information,32 while another interviewed parents and/or guardians of teenagers.15
Results by Outcomes Provider Identification and Understanding of Physicians’ Roles
Four studies that assessed the influence of visual tools on provider identification and understanding of roles reported a positive association.15,25,28,31 Visual tools varied between pictures (n = 2),15,31 patient portal (n = 1),28 and whiteboards and pictures combined (n = 1).25 The measurement of outcomes varied between surveys with free text responses,28 multiple choice questions,25 and 1-5 Likert scales.15,31
Patient–Provider Communication
Two studies assessed the impact of patient portal use on communication and reported a positive association.28,32 The 2 portals autopopulated names, pictures, and roles of providers from electronic medical records. Singh et al.28 used a portal that was also available in Spanish and accommodated for non-English speakers. Kelly et al.32 reported that 90% of parents perceived that portal use was associated with reduced errors in care, with 8% finding errors in their child’s medication list.
Patient Satisfaction
Three studies assessed patient satisfaction via the use of visual tools.15,28,31 Singh et al.28 noted a positive influence on satisfaction via a patient portal. Dudas et al.15 used a single-page handout with names and pictures of each provider, along with information regarding the training and roles of each provider. Distribution of these handouts to patients by investigators led to a positive influence on satisfaction. While Unaka et al.31 used a similar handout, they asked residents to distribute them and found no significant difference in satisfaction scores between the intervention (66%) and control group (62%).
Results by Type of Visual Tool Pictures
Two studies reported a positive impact on provider identification and understanding of roles with the use of pictures.15,31 Dudas et al.15 demonstrated a 4.8-fold increase in the odds of parents identifying a medical student, as compared with the control. Similarly, after adjusting for length of stay and prior hospitalization, Unaka et al.31 reported that a higher percentage of patients correctly identified providers using this approach.
Whiteboard and Picture
One study evaluated the simultaneous use of whiteboards and pictures to improve the identification of providers. The study noted improved identification of supervising doctors and increased recognition of roles for supervising doctors, residents, and medical students.25
Patient Portal
Two studies used patient portals as visual tools. Singh et al.28 assessed the use of a patient portal with names, roles, and pictures of treatment team members. Use of this tool was positively associated with provider identification, understanding of roles, communication, and satisfaction. Kelly et al.32 noted that 60% of parents felt that portal use improved healthcare team communication.
RISK OF STUDY BIAS
The risk of bias was assessed for both adult and pediatric studies in aggregate. The average risk of bias using the Downs and Black Scale was 17.81 (range 14-22, standard deviation [SD] 2.20). Of the 16 included studies, 9 were rated at a low risk of bias (score
- >
18).13-15,26-31 Risk of bias was greatest for measures of external validity (mean 2.88, range 2-3, SD 0.34), internal validity (mean 4.06, range 3-6, SD 1.00), and confounding (mean 2.69, range 1-6, SD 1.35). Two of 3 randomized controlled trials had a low risk of bias.14,27 Interrater reliability for study quality adjudication was 0.90, suggesting excellent agreement (see supplementary Appendix B).
DISCUSSION
In this systematic review, the effects of visual tools on outcomes, such as provider identification, understanding of roles, patient–provider communication, and satisfaction with care, were variable. The majority of included studies were conducted on adult patients (n = 11).12-14,22-24,26,27,29,30,33 Pictures were the most frequently used tool (n = 7)13-15,23,27,31,33 and consequently had the greatest sample size across the review (n = 1297). While pictures had a positive influence on provider identification in all studies, comprehension of provider roles and satisfaction were variable. Although the content of whiteboards varied between studies, they showed favorable effects on provider identification (3 of 4 studies)12,22,30 and satisfaction (2 of 2 studies).22,30 While electronic medical record-based tools had a positive influence on outcomes,26,28 only 1 accounted for language preferences.28 Formatted notepads positively influenced patient–provider communication, but their use was limited by literacy.24 Collectively, these data suggest that visual tools have varying effects on patient-reported outcomes, likely owing to differences in study design, interventions, and evaluation methods.
Theoretically, visual tools should facilitate easier identification of providers and engender collaborative relationships. However, such tools do not replace face-to-face patient–provider and family discussions. Rather, these enhancements best serve as a medium to asynchronously display information to patients and family members. Indeed, within the included studies, we found that the use of visual tools was effective in improving satisfaction (6/8 studies), identification (13/13 studies), and understanding of provider roles (8/10 studies). Thus, it is reasonable to say that, in conjunction with excellent clinical care, these tools have an important role in improving care delivery in the hospital.
Despite this promise, we noted that the effectiveness of individual tools varied, a fact that may relate to differences across studies. First, inconsistencies in the format and/or content of the tools were noted. For example, within studies using pictures, tools varied from individual photographs of each team member13,23 to 1-page handouts with pictures of all team members.14,15,31 Such differences in presentation could affect spatial recognition in identifying providers, as single photos are known to be easier to process than multiple images at the same time.34 Second, no study evaluated patient preference of a visual tool. Thus, personal preferences for pictures versus whiteboards versus electronic modalities or a combination of tools might affect outcomes. Additionally, the utility of visual tools in visually impaired, confused, or non-English-speaking patients may limit effectiveness. Future studies that address these aspects and account for patient preferences may better elucidate the role of visual tools in hospitals.
Our results should be considered in the context of several limitations. First, only 3 studies used randomized trial designs; thus, confounding from unmeasured variables inherent to observational designs is possible. Second, none of the interventions tested were blinded to providers, raising the possibility of a Hawthorne effect (ie, alteration of provider behavior in response to awareness of being observed).35 Third, all studies were conducted at single centers, and only 9 of 16 studies were rated at a low risk of bias; thus, caution in broad extrapolations of this literature is necessary.
However, our study has several strengths, including a thorough search of heterogeneous literature, inclusion of both adult and pediatric populations, and a focus on myriad patient-reported outcomes. Second, by contrasting outcomes and measurement strategies across studies, our review helps explicate differences in results related to variation in outcome measurement or presentation of visual data. Third, because we frame results by outcome and type of visual tool used, we are able to identify strengths and weaknesses of individual tools in novel ways. Finally, our data suggest that the use of picture-based techniques and whiteboards are among the most promising visual interventions. Future studies that pair graphic designers with patients to improve the layout of these tools might prove valuable. Additionally, because the measurement of outcomes is confounded by aspects such as lack of controls, severity of illness, and language barriers, a randomized design would help provide greater clarity regarding effectiveness.
In conclusion, we found that visual tools appear to foster recognition of providers and understanding of their roles. However, variability of format, content, and measurement of outcomes hinders the identification of a single optimal approach. Future work using randomized controlled trial designs and standardized tools and measurements would be welcomed.
Acknowledgments
The authors thank Laura Appel, Kevin O’Leary, and Siddharth Singh for providing unpublished data and clarifications to help these analyses.
Disclosure
Anupama Goyal is the guarantor. Anupama Goyal and Komalpreet Tur performed primary data abstraction and analysis. Anupama Goyal, Scott Flanders, Jason Mann, and Vineet Chopra drafted the manuscript. All authors contributed to the development of the selection criteria, the risk of bias assessment strategy, and the data extraction criteria. Anupama Goyal, Jason Mann, Whitney Townsend, and Vineet Chopra developed the search strategy. Vineet Chopra provided systematic review expertise. All authors read, provided feedback, and approved the final manuscript. The authors declare that they have no conflicts of interest.
1. Berwick DM. A user’s manual for the IOM’s ‘Quality Chasm’ report. Health Aff (Millwood). 2002;21(3):80-90. PubMed
2. Jha AK, Orav EJ, Zheng J, Epstein AM. Patients’ perception of hospital care in the United States. N Engl J Med. 2008;359(18):1921-1931. PubMed
3. Boulding W, Glickman SW, Manary MP, Schulman KA, Staelin R. Relationship between patient satisfaction with inpatient care and hospital readmission within 30 days. Am J Manag Care. 2011;17(1):41-48. PubMed
4. Little P, Everitt H, Williamson I, et al. Observational study of effect of patient centredness and positive approach on outcomes of general practice consultations. BMJ. 2001;323(7318):908-911. PubMed
5. Stewart MA. Effective physician-patient communication and health outcomes: a review. CMAJ. 1995;152(9):1422-1433. PubMed
6. Arora V, Johnson J, Lovinger D, Humphrey HJ, Meltzer DO. Communication failures in patient sign-out and suggestions for improvement: a critical incident analysis. Qual Saf Health Care. 2005;14(6):401-407. PubMed
7. Leonard M, Graham S, Bonacum D. The human factor: the critical importance of effective teamwork and communication in providing safe care. Qual Saf Health Care. 2004;13 Suppl 1:i85-i90. PubMed
8. Alam M, Lee A, Ibrahimi OA, et al. A multistep approach to improving biopsy site identification in dermatology: physician, staff, and patient roles based on a Delphi consensus. JAMA Dermatol. 2014;150(5):550-558. PubMed
9. Arora V, Gangireddy S, Mehrotra A, Ginde R, Tormey M, Meltzer D. Ability of hospitalized patients to identify their in-hospital physicians. Arch Intern Med. 2009;169(2):199-201. PubMed
10. Makaryus AN, Friedman EA. Does your patient know your name? An approach to enhancing patients’ awareness of their caretaker’s name. J Healthc Qual. 2005;27(4):53-56. PubMed
11. Sehgal NL, Green A, Vidyarthi AR, Blegen MA, Wachter RM. Patient whiteboards as a communication tool in the hospital setting: a survey of practices and recommendations. J Hosp Med. 2010;5(4):234-239. PubMed
12. Maniaci MJ, Heckman MG, Dawson NL. Increasing a patient’s ability to identify his or her attending physician using a patient room display. Arch Intern Med. 2010;170:1084-1085. PubMed
13. Arora VM, Schaninger C, D’Arcy M, et al. Improving inpatients’ identification of their doctors: Use of FACE™ cards. Jt Comm J Qual Patient Saf. 2009;35(12):613-619. PubMed
14. Appel L, Abrams H, Morra D, Wu RC. Put a face to a name: a randomized controlled trial evaluating the impact of providing clinician photographs on inpatients’ recall. Am J Med. 2015;128(1):82-89. PubMed
15. Dudas RA, Lemerman H, Barone M, Serwint JR. PHACES (Photographs of Academic Clinicians and Their Educational Status): a tool to improve delivery of family-centered care. Acad Pediatr. 2010;10(2):138-145. PubMed
16. Moher D, Liberati A, Tetzlaff J, Altman DG, PRISMA Group. Preferred reporting items for systematic reviews and meta-analyses: the PRISMA statement. Ann Intern Med. 2009;151(4):264-269. PubMed
17. Higgins JP, Green S, editors. Cochrane handbook for systematic reviews of interventions. West Sussex, UK: The Cochrane Collaboration and Wiley Online Library; 2008.
18. Petrilli CM, Mack M, Petrilli JJ, Hickner A, Saint S, Chopra V. Understanding the role of physician attire on patient perceptions: a systematic review of the literature—targeting attire to improve likelihood of rapport (TAILOR) investigators. BMJ Open. 2015;5(1):e006578. PubMed
19. Downs SH, Black N. The feasibility of creating a checklist for the assessment of the methodological quality both of randomised and non-randomised studies of health care interventions. J Epidemiol Community Health. 1998;52(6):377-384. PubMed
20. Seyffert M, Lagisetty P, Landgraf J, et al. Internet-delivered cognitive behavioral therapy to treat insomnia: a systematic review and meta-analysis. PLoS One. 2016;11(2):e0149139. PubMed
21. Patel R, Chang T, Greysen SR, Chopra V. Social media use in chronic disease: a systematic review and novel taxonomy. Am J Med. 2015;128(12):1335-1350. PubMed
22. Carlin BJ. Using whiteboards: fixed identities. Am J Nurs. 2008;108(11):72A-72B, 72D-72E. PubMed
23. Francis JJ, Pankratz VS, Huddleston JM. Patient satisfaction associated with correct identification of physician’s photographs. Mayo Clin Proc. 2001;76(6):604-608. PubMed
24. Farberg AS, Lin AM, Kuhn L, Flanders SA, Kim CS. Dear Doctor: a tool to facilitate patient-centered communication. J Hosp Med. 2013;8(10):553-558. PubMed
25. Hayes RM, Wickline A, Hensley C, et al. A quality improvement project to improve family recognition of medical team member roles. Hosp Pediatr. 2015;5(9):480-486. PubMed
26. O’Leary KJ, Lohman ME, Culver E, Killarney A, Randy Smith G Jr, Liebovitz DM. The effect of tablet computers with a mobile patient portal application on hospitalized patients’ knowledge and activation. J Am Med Inform Assoc. 2016;23(1):159-165. PubMed
27. Simons Y, Caprio T, Furiasse N, Kriss M, Williams MV, O’Leary KJ. The impact of facecards on patients’ knowledge, satisfaction, trust, and agreement with hospital physicians: a pilot study. J Hosp Med. 2014;9(3):137-141. PubMed
28. Singh A, Rhee KE, Brennan JJ, Kuelbs C, El-Kareh R, Fisher ES. Who’s my doctor? Using an electronic tool to improve team member identification on an inpatient pediatrics team. Hosp Pediatr. 2016;6(3):157-165. PubMed
29. Singh S, Fletcher KE, Pandl GJ, et al. It’s the writing on the wall: whiteboards improve inpatient satisfaction with provider communication. Am J Med Qual. 2011;26(2):127-131. PubMed
30. Tan M, Hooper Evans K, Braddock CH 3rd, Shieh L. Patient whiteboards to improve patient-centred care in the hospital. Postgrad Med J. 2013;89(1056):604-609. PubMed
31. Unaka NI, White CM, Sucharew HJ, Yau C, Clark SL, Brady PW. Effect of a face sheet tool on medical team provider identification and family satisfaction. J Hosp Med. 2014;9(3):186-188. PubMed
32. Kelly MM, Hoonakker PL, Dean SM. Using an inpatient portal to engage families in pediatric hospital care. J Am Med Inform Assoc. 2017;24(1):153-161. PubMed
33. Brener MI, Epstein JA, Cho J, Yeh HC, Dudas RA, Feldman L. Faces of all clinically engaged staff: a quality improvement project that enhances the hospitalised patient experience. Int J Clin Pract. 2016;70(11):923-929. PubMed
34. De Valois RL, De Valois KK. Spatial vision. Annu Rev Psychol. 1980;31:309-341. PubMed
Patient satisfaction with medical care during hospitalization is a common quality metric.1,2 Studies showing higher patient satisfaction have reported lower 30-day hospital readmissions3 and improved overall health.4,5 Conversely, communication failures are associated with dissatisfaction among hospitalized patients and adverse outcomes.6,7 A lack of familiarity with hospital providers weakens collaborative decision making and prevents high-quality patient care.8,9
Bedside visual tools, such as whiteboards and pictures of medical staff, have been widely used to enhance communication between patients, families, and providers.10,11 Results of studies evaluating these tools are varied. For example, 1 study found that 98% of patients were better able to identify physicians when their names were written on whiteboards.12 Yet in another, only 21.1% of patients were more likely to correctly identify ≥1 physicians using pictures.13 Thus, despite widespread use,11 whether visual tools improve patient satisfaction and patient care more broadly remains unclear.14,15
We performed a systematic review to answer the following 3 questions: first, what is the effect of visual tools on outcomes (ie, provider identification, understanding of providers’ roles, patient–provider communication, and satisfaction); second, does impact vary by type of visual tool (eg, whiteboards vs pictures of providers); and third, what factors (eg, study design, patient population) are associated with provider identification, communication, and patient satisfaction?
METHODS
Search Strategy
We used the Preferred Reporting Items for Systematic Reviews and Meta-Analysis when performing this review.16 A research librarian (WT) conducted serial searches for studies reporting the use of bedside visual tools for hospitalized patients in Medline (via OVID), Embase, SCOPUS, Web of Science, CINAHL, and Cochrane DSR and CENTRAL. Controlled vocabularies (ie, Medical Subject Headings terms) were used to identify synonyms for visual tools of interest. Additional studies were identified manually through bibliographies and meeting abstracts. No study design, publication date, or language restrictions were placed on the search, which was conducted between April 2016 and February 2017 (see supplementary Appendix A).
Study Selection
Two reviewers (AG and KT) independently assessed study eligibility; discrepancies were resolved by a third reviewer (VC). We included all adult or pediatric English language studies in which the effect of visual tool(s) on patient outcomes was reported. Visual tools were defined as the bedside display of information or an instrument given to patients to convey information regarding providers or medical care. Patient-reported outcomes included the following: (a) physician identification, (b) understanding of provider roles, (c) patient–provider communication, and (d) patient satisfaction with care. Providers were defined as physicians, residents, interns, medical students, nurse practitioners, or nurses. We excluded studies that were not original research (eg, conference abstracts, not peer reviewed), reported qualitative data without quantitative outcomes, or did not include a bedside visual tool. Given our interest in hospitalized general medicine patients, studies conducted in emergency departments, surgical units, obstetrics and gynecology wards, and intensive care units were excluded.
Data Extraction and Analysis
Data were extracted independently and in duplicate from all studies by using a template adapted from the Cochrane Collaboration.17 For all studies, we abstracted study design, type of visual tool (eg, whiteboards), unit setting (eg, medical), population studied (eg, adult vs pediatric), and outcomes reported (ie, physician identification, understanding of provider roles, communication, and satisfaction with care). Reviewers independently assessed and categorized the impact of tools on reported outcomes.
To standardize and compare outcomes across studies, the following were used to denote a positive association between visual tools and relevant outcomes: a greater number of physicians correctly identified by name/picture or title/role; the use of terms such as “high,” “agreed,” or “significant” on surveys; or ≥4 Likert scores for domains of identification, understanding of roles, communication, and satisfaction with care. Conversely, the inability to identify providers compared to the control/baseline; poor recall of titles/roles; lower Likert-scale scores (ie, ≤2); or survey terms such as “poor,” “disagreed,” or “insignificant” were considered to connote negative impact. Studies in which Likert scores were rated neither high nor low (ie, 3), or in which patients neither agreed nor disagreed on value were considered neutral.
Owing to clinical heterogeneity within studies, meta-analyses were not performed. Descriptive statistics were used to describe study outcomes. A priori18 studies were evaluated according to the following categories: design (eg, randomized vs observational), outcomes (eg, patient satisfaction), intervention (type of visual tool), and patient population (adult or pediatric). Because pediatric patients have underdeveloped communication skills and include parents and/or guardians, data from pediatric studies were tabulated and reported separately to those from adult studies.
Quality Assessment
As recommended by the Cochrane Collaboration, 2 reviewers (AG, KT) assessed the risk of study bias by using the Downs and Black Scale.17,19 Discrepancies in assessment were resolved by a third reviewer (VC). This instrument uses a point-based system to estimate the quality of a study by rating domains such as internal and external validity, bias, and confounding. In keeping with prior systematic reviews,18,20,21 studies with a score of ≥18 were considered high quality. Interrater agreement for the adjudication of study quality was calculated using the Cohen κ statistic.
RESULTS
STUDIES OF ADULT HOSPITALIZED PATIENTS
Eleven studies were conducted on adult hospitalized patients 12-14,22-24,26,27,29,30,33 and included 3 randomized controlled studies.14,27,33
Results by Outcomes Provider Identification Nine studies measured patients’ ability to identify providers with the use of visual aids, and all 9 reported improvements in this outcome. Visual tools used to measure provider identification included pictures (n = 5),13,14,23,27,33 whiteboards (n = 3),12,22,30 and patient portals (n = 1).26 Within studies that used pictures, individual pictures (n = 2)13,23 and handouts with pictures of multiple providers (n = 3) were used.14,27,33 In 2 studies, care team members such as a dietitian, physiotherapist or pharmacist, were included when measuring identification.14,33
Understanding Providers’ RolesSix studies assessed the effect of visual tools on patients’ understanding of provider roles.13,14,22,26,27,33 Four studies reported a positive effect with the use of pictures,27,33 whiteboards,22 and patient portals.26 However, 2 studies reported either no difference or negative impressions. Appel et al.14 reported no difference in the understanding of physician roles using a handout of providers’ pictures and titles. Arora et al.13 used individual pictures of physicians with descriptions of roles and found a negative association, as demonstrated by fewer patients rating their understanding of physicians’ roles as excellent or very good in the intervention period (45.6%) compared with the baseline (55.3%).
Patient–Provider Communication
Three studies evaluated the influence of visual tools on communication.14,24,29 Using pictures, Appel et al.14 found no difference in the perceived quality of communication. Singh et al.29 used whiteboards and reported improved communication scores for physicians and nurses. With notepads, patients surveyed by Farberg et al.24 stated that the tool improved provider communication.
Patient Satisfaction
Five studies assessed patient satisfaction related to the use of visual tools. 22,23,27,30,33 One study reported satisfaction as positive with the use of individual pictures.23 Two studies that used handouts with pictures of all team members reported either a positive33 or neutral27 impact on satisfaction. Studies that used whiteboards reported a positive association with satisfaction22,30 despite differences in content, such as the inclusion of prewritten prompts for writing goals of care and scheduled tests30 versus the name of the nurse and their education level.22
Results by Type of Visual Tool Pictures
Five studies that used pictures reported a positive effect on provider identification.13,14,23,27,33 Two27,33 of 4 studies13,14,27,33 that assessed patients’ understanding of team member roles reported a positive influence, while 1 reported no difference.14 A fourth study demonstrated a negative association, perhaps due to differences in the description of providers’ roles listed on the tool.13 Only 1 study examined the influence of pictures on patient–provider communication, and this study found no difference.14 Satisfaction with care via the use of pictures varied between positive (2 studies)23,33 and neutral (1 study).27
Whiteboards
Four studies tested the use of whiteboards; of these, 3 reported a positive influence on provider identification.12,22,30 One study reported a positive impact on patient–provider communication.29 Two studies noted a positive effect on patient satisfaction.22,30 Notably, the responsibility for updating whiteboards differed between the studies (ie, nurses only22 vs residents, medical students, and nurses).30
Patient Portal
In 1 study, an electronic portal that included names with pictures of providers, descriptions of their roles, lists of medications, and scheduled tests and/or procedures was used as a visual tool. The portal improved patients’ identification of physicians and patients’ understanding of roles. However, improvements in the knowledge of medication changes and planned tests and/or procedures during hospitalization were not observed.26 This finding would suggest limitations in the hospitalized patient’s knowledge of the plan of care, which could potentially weaken patient–provider communication.
Notepads
Only 1 study assessed the use of formatted notepads on patient–provider communication and noted a positive association. Notepads used prompts for different categories (eg, diagnosis/treatment, medications, etc) to encourage patient questions for providers.24
STUDIES OF PEDIATRIC HOSPITALIZED PATIENTS
Five studies were conducted on hospitalized pediatric units.15,25,28,31,32 All studies surveyed the parents, guardians, or caregivers of pediatric patients. One study excluded patients ≥12 years of age because of legal differences in access to adolescent health information,32 while another interviewed parents and/or guardians of teenagers.15
Results by Outcomes Provider Identification and Understanding of Physicians’ Roles
Four studies that assessed the influence of visual tools on provider identification and understanding of roles reported a positive association.15,25,28,31 Visual tools varied between pictures (n = 2),15,31 patient portal (n = 1),28 and whiteboards and pictures combined (n = 1).25 The measurement of outcomes varied between surveys with free text responses,28 multiple choice questions,25 and 1-5 Likert scales.15,31
Patient–Provider Communication
Two studies assessed the impact of patient portal use on communication and reported a positive association.28,32 The 2 portals autopopulated names, pictures, and roles of providers from electronic medical records. Singh et al.28 used a portal that was also available in Spanish and accommodated for non-English speakers. Kelly et al.32 reported that 90% of parents perceived that portal use was associated with reduced errors in care, with 8% finding errors in their child’s medication list.
Patient Satisfaction
Three studies assessed patient satisfaction via the use of visual tools.15,28,31 Singh et al.28 noted a positive influence on satisfaction via a patient portal. Dudas et al.15 used a single-page handout with names and pictures of each provider, along with information regarding the training and roles of each provider. Distribution of these handouts to patients by investigators led to a positive influence on satisfaction. While Unaka et al.31 used a similar handout, they asked residents to distribute them and found no significant difference in satisfaction scores between the intervention (66%) and control group (62%).
Results by Type of Visual Tool Pictures
Two studies reported a positive impact on provider identification and understanding of roles with the use of pictures.15,31 Dudas et al.15 demonstrated a 4.8-fold increase in the odds of parents identifying a medical student, as compared with the control. Similarly, after adjusting for length of stay and prior hospitalization, Unaka et al.31 reported that a higher percentage of patients correctly identified providers using this approach.
Whiteboard and Picture
One study evaluated the simultaneous use of whiteboards and pictures to improve the identification of providers. The study noted improved identification of supervising doctors and increased recognition of roles for supervising doctors, residents, and medical students.25
Patient Portal
Two studies used patient portals as visual tools. Singh et al.28 assessed the use of a patient portal with names, roles, and pictures of treatment team members. Use of this tool was positively associated with provider identification, understanding of roles, communication, and satisfaction. Kelly et al.32 noted that 60% of parents felt that portal use improved healthcare team communication.
RISK OF STUDY BIAS
The risk of bias was assessed for both adult and pediatric studies in aggregate. The average risk of bias using the Downs and Black Scale was 17.81 (range 14-22, standard deviation [SD] 2.20). Of the 16 included studies, 9 were rated at a low risk of bias (score
- >
18).13-15,26-31 Risk of bias was greatest for measures of external validity (mean 2.88, range 2-3, SD 0.34), internal validity (mean 4.06, range 3-6, SD 1.00), and confounding (mean 2.69, range 1-6, SD 1.35). Two of 3 randomized controlled trials had a low risk of bias.14,27 Interrater reliability for study quality adjudication was 0.90, suggesting excellent agreement (see supplementary Appendix B).
DISCUSSION
In this systematic review, the effects of visual tools on outcomes, such as provider identification, understanding of roles, patient–provider communication, and satisfaction with care, were variable. The majority of included studies were conducted on adult patients (n = 11).12-14,22-24,26,27,29,30,33 Pictures were the most frequently used tool (n = 7)13-15,23,27,31,33 and consequently had the greatest sample size across the review (n = 1297). While pictures had a positive influence on provider identification in all studies, comprehension of provider roles and satisfaction were variable. Although the content of whiteboards varied between studies, they showed favorable effects on provider identification (3 of 4 studies)12,22,30 and satisfaction (2 of 2 studies).22,30 While electronic medical record-based tools had a positive influence on outcomes,26,28 only 1 accounted for language preferences.28 Formatted notepads positively influenced patient–provider communication, but their use was limited by literacy.24 Collectively, these data suggest that visual tools have varying effects on patient-reported outcomes, likely owing to differences in study design, interventions, and evaluation methods.
Theoretically, visual tools should facilitate easier identification of providers and engender collaborative relationships. However, such tools do not replace face-to-face patient–provider and family discussions. Rather, these enhancements best serve as a medium to asynchronously display information to patients and family members. Indeed, within the included studies, we found that the use of visual tools was effective in improving satisfaction (6/8 studies), identification (13/13 studies), and understanding of provider roles (8/10 studies). Thus, it is reasonable to say that, in conjunction with excellent clinical care, these tools have an important role in improving care delivery in the hospital.
Despite this promise, we noted that the effectiveness of individual tools varied, a fact that may relate to differences across studies. First, inconsistencies in the format and/or content of the tools were noted. For example, within studies using pictures, tools varied from individual photographs of each team member13,23 to 1-page handouts with pictures of all team members.14,15,31 Such differences in presentation could affect spatial recognition in identifying providers, as single photos are known to be easier to process than multiple images at the same time.34 Second, no study evaluated patient preference of a visual tool. Thus, personal preferences for pictures versus whiteboards versus electronic modalities or a combination of tools might affect outcomes. Additionally, the utility of visual tools in visually impaired, confused, or non-English-speaking patients may limit effectiveness. Future studies that address these aspects and account for patient preferences may better elucidate the role of visual tools in hospitals.
Our results should be considered in the context of several limitations. First, only 3 studies used randomized trial designs; thus, confounding from unmeasured variables inherent to observational designs is possible. Second, none of the interventions tested were blinded to providers, raising the possibility of a Hawthorne effect (ie, alteration of provider behavior in response to awareness of being observed).35 Third, all studies were conducted at single centers, and only 9 of 16 studies were rated at a low risk of bias; thus, caution in broad extrapolations of this literature is necessary.
However, our study has several strengths, including a thorough search of heterogeneous literature, inclusion of both adult and pediatric populations, and a focus on myriad patient-reported outcomes. Second, by contrasting outcomes and measurement strategies across studies, our review helps explicate differences in results related to variation in outcome measurement or presentation of visual data. Third, because we frame results by outcome and type of visual tool used, we are able to identify strengths and weaknesses of individual tools in novel ways. Finally, our data suggest that the use of picture-based techniques and whiteboards are among the most promising visual interventions. Future studies that pair graphic designers with patients to improve the layout of these tools might prove valuable. Additionally, because the measurement of outcomes is confounded by aspects such as lack of controls, severity of illness, and language barriers, a randomized design would help provide greater clarity regarding effectiveness.
In conclusion, we found that visual tools appear to foster recognition of providers and understanding of their roles. However, variability of format, content, and measurement of outcomes hinders the identification of a single optimal approach. Future work using randomized controlled trial designs and standardized tools and measurements would be welcomed.
Acknowledgments
The authors thank Laura Appel, Kevin O’Leary, and Siddharth Singh for providing unpublished data and clarifications to help these analyses.
Disclosure
Anupama Goyal is the guarantor. Anupama Goyal and Komalpreet Tur performed primary data abstraction and analysis. Anupama Goyal, Scott Flanders, Jason Mann, and Vineet Chopra drafted the manuscript. All authors contributed to the development of the selection criteria, the risk of bias assessment strategy, and the data extraction criteria. Anupama Goyal, Jason Mann, Whitney Townsend, and Vineet Chopra developed the search strategy. Vineet Chopra provided systematic review expertise. All authors read, provided feedback, and approved the final manuscript. The authors declare that they have no conflicts of interest.
1. Berwick DM. A user’s manual for the IOM’s ‘Quality Chasm’ report. Health Aff (Millwood). 2002;21(3):80-90. PubMed
2. Jha AK, Orav EJ, Zheng J, Epstein AM. Patients’ perception of hospital care in the United States. N Engl J Med. 2008;359(18):1921-1931. PubMed
3. Boulding W, Glickman SW, Manary MP, Schulman KA, Staelin R. Relationship between patient satisfaction with inpatient care and hospital readmission within 30 days. Am J Manag Care. 2011;17(1):41-48. PubMed
4. Little P, Everitt H, Williamson I, et al. Observational study of effect of patient centredness and positive approach on outcomes of general practice consultations. BMJ. 2001;323(7318):908-911. PubMed
5. Stewart MA. Effective physician-patient communication and health outcomes: a review. CMAJ. 1995;152(9):1422-1433. PubMed
6. Arora V, Johnson J, Lovinger D, Humphrey HJ, Meltzer DO. Communication failures in patient sign-out and suggestions for improvement: a critical incident analysis. Qual Saf Health Care. 2005;14(6):401-407. PubMed
7. Leonard M, Graham S, Bonacum D. The human factor: the critical importance of effective teamwork and communication in providing safe care. Qual Saf Health Care. 2004;13 Suppl 1:i85-i90. PubMed
8. Alam M, Lee A, Ibrahimi OA, et al. A multistep approach to improving biopsy site identification in dermatology: physician, staff, and patient roles based on a Delphi consensus. JAMA Dermatol. 2014;150(5):550-558. PubMed
9. Arora V, Gangireddy S, Mehrotra A, Ginde R, Tormey M, Meltzer D. Ability of hospitalized patients to identify their in-hospital physicians. Arch Intern Med. 2009;169(2):199-201. PubMed
10. Makaryus AN, Friedman EA. Does your patient know your name? An approach to enhancing patients’ awareness of their caretaker’s name. J Healthc Qual. 2005;27(4):53-56. PubMed
11. Sehgal NL, Green A, Vidyarthi AR, Blegen MA, Wachter RM. Patient whiteboards as a communication tool in the hospital setting: a survey of practices and recommendations. J Hosp Med. 2010;5(4):234-239. PubMed
12. Maniaci MJ, Heckman MG, Dawson NL. Increasing a patient’s ability to identify his or her attending physician using a patient room display. Arch Intern Med. 2010;170:1084-1085. PubMed
13. Arora VM, Schaninger C, D’Arcy M, et al. Improving inpatients’ identification of their doctors: Use of FACE™ cards. Jt Comm J Qual Patient Saf. 2009;35(12):613-619. PubMed
14. Appel L, Abrams H, Morra D, Wu RC. Put a face to a name: a randomized controlled trial evaluating the impact of providing clinician photographs on inpatients’ recall. Am J Med. 2015;128(1):82-89. PubMed
15. Dudas RA, Lemerman H, Barone M, Serwint JR. PHACES (Photographs of Academic Clinicians and Their Educational Status): a tool to improve delivery of family-centered care. Acad Pediatr. 2010;10(2):138-145. PubMed
16. Moher D, Liberati A, Tetzlaff J, Altman DG, PRISMA Group. Preferred reporting items for systematic reviews and meta-analyses: the PRISMA statement. Ann Intern Med. 2009;151(4):264-269. PubMed
17. Higgins JP, Green S, editors. Cochrane handbook for systematic reviews of interventions. West Sussex, UK: The Cochrane Collaboration and Wiley Online Library; 2008.
18. Petrilli CM, Mack M, Petrilli JJ, Hickner A, Saint S, Chopra V. Understanding the role of physician attire on patient perceptions: a systematic review of the literature—targeting attire to improve likelihood of rapport (TAILOR) investigators. BMJ Open. 2015;5(1):e006578. PubMed
19. Downs SH, Black N. The feasibility of creating a checklist for the assessment of the methodological quality both of randomised and non-randomised studies of health care interventions. J Epidemiol Community Health. 1998;52(6):377-384. PubMed
20. Seyffert M, Lagisetty P, Landgraf J, et al. Internet-delivered cognitive behavioral therapy to treat insomnia: a systematic review and meta-analysis. PLoS One. 2016;11(2):e0149139. PubMed
21. Patel R, Chang T, Greysen SR, Chopra V. Social media use in chronic disease: a systematic review and novel taxonomy. Am J Med. 2015;128(12):1335-1350. PubMed
22. Carlin BJ. Using whiteboards: fixed identities. Am J Nurs. 2008;108(11):72A-72B, 72D-72E. PubMed
23. Francis JJ, Pankratz VS, Huddleston JM. Patient satisfaction associated with correct identification of physician’s photographs. Mayo Clin Proc. 2001;76(6):604-608. PubMed
24. Farberg AS, Lin AM, Kuhn L, Flanders SA, Kim CS. Dear Doctor: a tool to facilitate patient-centered communication. J Hosp Med. 2013;8(10):553-558. PubMed
25. Hayes RM, Wickline A, Hensley C, et al. A quality improvement project to improve family recognition of medical team member roles. Hosp Pediatr. 2015;5(9):480-486. PubMed
26. O’Leary KJ, Lohman ME, Culver E, Killarney A, Randy Smith G Jr, Liebovitz DM. The effect of tablet computers with a mobile patient portal application on hospitalized patients’ knowledge and activation. J Am Med Inform Assoc. 2016;23(1):159-165. PubMed
27. Simons Y, Caprio T, Furiasse N, Kriss M, Williams MV, O’Leary KJ. The impact of facecards on patients’ knowledge, satisfaction, trust, and agreement with hospital physicians: a pilot study. J Hosp Med. 2014;9(3):137-141. PubMed
28. Singh A, Rhee KE, Brennan JJ, Kuelbs C, El-Kareh R, Fisher ES. Who’s my doctor? Using an electronic tool to improve team member identification on an inpatient pediatrics team. Hosp Pediatr. 2016;6(3):157-165. PubMed
29. Singh S, Fletcher KE, Pandl GJ, et al. It’s the writing on the wall: whiteboards improve inpatient satisfaction with provider communication. Am J Med Qual. 2011;26(2):127-131. PubMed
30. Tan M, Hooper Evans K, Braddock CH 3rd, Shieh L. Patient whiteboards to improve patient-centred care in the hospital. Postgrad Med J. 2013;89(1056):604-609. PubMed
31. Unaka NI, White CM, Sucharew HJ, Yau C, Clark SL, Brady PW. Effect of a face sheet tool on medical team provider identification and family satisfaction. J Hosp Med. 2014;9(3):186-188. PubMed
32. Kelly MM, Hoonakker PL, Dean SM. Using an inpatient portal to engage families in pediatric hospital care. J Am Med Inform Assoc. 2017;24(1):153-161. PubMed
33. Brener MI, Epstein JA, Cho J, Yeh HC, Dudas RA, Feldman L. Faces of all clinically engaged staff: a quality improvement project that enhances the hospitalised patient experience. Int J Clin Pract. 2016;70(11):923-929. PubMed
34. De Valois RL, De Valois KK. Spatial vision. Annu Rev Psychol. 1980;31:309-341. PubMed
© 2017 Society of Hospital Medicine