User login
How well do POLST forms assure that patients get the end-of-life care they requested?
EVIDENCE SUMMARY
The POLST form offers choices within 4 treatment areas: “attempt CPR” or “allow natural death” if the patient is in cardiopulmonary arrest; “comfort,” “limited,” or “full” medical interventions if pulse or breathing is present; choices of additional orders, including intravenous fluids, feeding tubes, and antibiotics; and additional written orders. Most POLST studies used cross-sectional and retrospective cohort designs and assessed whether CPR was attempted. Fewer studies also evaluated adherence to orders in the other treatment areas.
Community settings: Patients with POLST more likely to die out of hospital
The largest study of POLST use in community settings evaluated deaths in Oregon over one year.1 It found that patients who indicated “do not attempt CPR” on a POLST form were 6 times more likely to die a natural, out-of-hospital death than those who had no POLST form (TABLE1-10).

A West Virginia study found that patients with POLST forms had 30% higher out-of-hospital death rates than those with traditional advanced directives and no POLST.2 In a Wisconsin study, no decedents who indicated DNR on their POLST forms received CPR.3

One study that evaluated the consistency of actual medical interventions with POLST orders in all 4 treatment areas found it to be good in most areas (“feeding tubes,” “attempting CPR.” “antibiotics,” and “IV fluids”) except “additional written orders.4
Skilled nursing facilities: Generally high adherence to POLST orders
The largest study to evaluate the consistency of treatments with POLST orders among nursing home residents found high adherence overall (94%).5 Caregivers performed CPR on none of 299 residents who selected “DNR.” However, they did not administer CPR to 6 of 7 who chose “attempt CPR” and administered antibiotics to 32% of patients who specified “no antibiotics” on their POLST forms.5
A second study of nursing home residents who selected “comfort measures only” also found high consistency for attempting CPR, intensive care admission, and ventilator support, although physicians hospitalized 2% of patients to extend life.6 Similarly, treatments matched POLST orders well overall in a Washington state study, although one patient got a feeding tube against orders.7
POLST adherence is good, but can EMS workers find the form?
A study comparing emergency medical services (EMS) management with POLST orders in an Oregon registry found good consistency.8 EMS providers didn’t attempt or halted CPR in most patients with DNR orders who were found in cardiac arrest and initiated CPR in most patients who chose “attempt CPR.” EMS providers initiated CPR in the field on 11 patients (22%) with a DNR order but discontinued resuscitation en route to the hospital.
In a smaller study, EMS providers never located paper POLST forms at the scene in most cases.9
Hospice: POLST orders prevent unwanted Tx, except maybe antibiotics
A study evaluating management in hospice programs in 3 states found that care providers followed POLST orders for limited treatment in 98% of cases.10 No patients received unwanted CPR, intubation, or feeding tubes. POLST orders didn’t predict whether patients were treated with antibiotics, however.
1. Fromme EK, Zive D, Schmidt TA, et al. Association between physician orders for life-sustaining treatment for scope of treatment and in-hospital death in Oregon. J Am Geriatr Soc. 2014;62:1246-1251.
2. Pedraza SL, Culp S, Falkenstine EC, et al. POST forms more than advance directives associated with out-of-hospital death: insights from a state registry. J Pain Symptom Manage. 2016; 51:240-246.
3. Hammes B, Rooney BL, Gundrum JD, et al. The POLST program: a retrospective review of the demographics of use and outcomes in one community where advance directives are prevalent. J Palliative Med. 2012;15:77-85.
4. Lee MA, Brummel-Smith K, Meyer J, et al. Physician orders for life-sustaining treatment (POLST): outcomes in a PACE program. J Am Geriatr Soc. 2000;48:1219-1225.
5. Hickman SE, Nelson CA, Moss AH, et al. The consistency between treatments provided to nursing facility residents and orders on the physician orders for life-sustaining treatment form. J Am Geriatr Soc. 2011;59:2091-2099.
6. Tolle SW, Tilden VP, Nelson CA, et al. A prospective study of the efficacy of the physician order form for life sustaining treatment. J Am Ger Soc.1998;46:1097-1102.
7. Meyers J, Moore C, McGrory A, et al. Physician orders for life-sustaining treatment form: honoring end-of-life directives for nursing home residents. J Geron Nursing. 2004;30:37-46.
8. Richardson DK, Fromme E, Zive D, et al. Concordance of out-of-hospital and emergency department cardiac arrest resuscitation with documented end-of-life choices in Oregon. Ann Emerg Med. 2014;63:375-383.
9. Schmidt T, Olszewski EA, Zive D, et al. The Oregon physician orders for life-sustaining treatment registry: a preliminary study of emergency medical services utilization. J Emerg Med. 2013;44:796-805.
10. Hickman SE, Nelson CA, Moss AH, et al. Use of the physician orders for life-sustaining treatment (POLST) paradigm program in the hospice setting. J Palliat Med. 2009;12:133-141.
EVIDENCE SUMMARY
The POLST form offers choices within 4 treatment areas: “attempt CPR” or “allow natural death” if the patient is in cardiopulmonary arrest; “comfort,” “limited,” or “full” medical interventions if pulse or breathing is present; choices of additional orders, including intravenous fluids, feeding tubes, and antibiotics; and additional written orders. Most POLST studies used cross-sectional and retrospective cohort designs and assessed whether CPR was attempted. Fewer studies also evaluated adherence to orders in the other treatment areas.
Community settings: Patients with POLST more likely to die out of hospital
The largest study of POLST use in community settings evaluated deaths in Oregon over one year.1 It found that patients who indicated “do not attempt CPR” on a POLST form were 6 times more likely to die a natural, out-of-hospital death than those who had no POLST form (TABLE1-10).
A West Virginia study found that patients with POLST forms had 30% higher out-of-hospital death rates than those with traditional advanced directives and no POLST.2 In a Wisconsin study, no decedents who indicated DNR on their POLST forms received CPR.3
One study that evaluated the consistency of actual medical interventions with POLST orders in all 4 treatment areas found it to be good in most areas (“feeding tubes,” “attempting CPR.” “antibiotics,” and “IV fluids”) except “additional written orders.4
Skilled nursing facilities: Generally high adherence to POLST orders
The largest study to evaluate the consistency of treatments with POLST orders among nursing home residents found high adherence overall (94%).5 Caregivers performed CPR on none of 299 residents who selected “DNR.” However, they did not administer CPR to 6 of 7 who chose “attempt CPR” and administered antibiotics to 32% of patients who specified “no antibiotics” on their POLST forms.5
A second study of nursing home residents who selected “comfort measures only” also found high consistency for attempting CPR, intensive care admission, and ventilator support, although physicians hospitalized 2% of patients to extend life.6 Similarly, treatments matched POLST orders well overall in a Washington state study, although one patient got a feeding tube against orders.7
POLST adherence is good, but can EMS workers find the form?
A study comparing emergency medical services (EMS) management with POLST orders in an Oregon registry found good consistency.8 EMS providers didn’t attempt or halted CPR in most patients with DNR orders who were found in cardiac arrest and initiated CPR in most patients who chose “attempt CPR.” EMS providers initiated CPR in the field on 11 patients (22%) with a DNR order but discontinued resuscitation en route to the hospital.
In a smaller study, EMS providers never located paper POLST forms at the scene in most cases.9
Hospice: POLST orders prevent unwanted Tx, except maybe antibiotics
A study evaluating management in hospice programs in 3 states found that care providers followed POLST orders for limited treatment in 98% of cases.10 No patients received unwanted CPR, intubation, or feeding tubes. POLST orders didn’t predict whether patients were treated with antibiotics, however.
1. Fromme EK, Zive D, Schmidt TA, et al. Association between physician orders for life-sustaining treatment for scope of treatment and in-hospital death in Oregon. J Am Geriatr Soc. 2014;62:1246-1251.
2. Pedraza SL, Culp S, Falkenstine EC, et al. POST forms more than advance directives associated with out-of-hospital death: insights from a state registry. J Pain Symptom Manage. 2016; 51:240-246.
3. Hammes B, Rooney BL, Gundrum JD, et al. The POLST program: a retrospective review of the demographics of use and outcomes in one community where advance directives are prevalent. J Palliative Med. 2012;15:77-85.
4. Lee MA, Brummel-Smith K, Meyer J, et al. Physician orders for life-sustaining treatment (POLST): outcomes in a PACE program. J Am Geriatr Soc. 2000;48:1219-1225.
5. Hickman SE, Nelson CA, Moss AH, et al. The consistency between treatments provided to nursing facility residents and orders on the physician orders for life-sustaining treatment form. J Am Geriatr Soc. 2011;59:2091-2099.
6. Tolle SW, Tilden VP, Nelson CA, et al. A prospective study of the efficacy of the physician order form for life sustaining treatment. J Am Ger Soc.1998;46:1097-1102.
7. Meyers J, Moore C, McGrory A, et al. Physician orders for life-sustaining treatment form: honoring end-of-life directives for nursing home residents. J Geron Nursing. 2004;30:37-46.
8. Richardson DK, Fromme E, Zive D, et al. Concordance of out-of-hospital and emergency department cardiac arrest resuscitation with documented end-of-life choices in Oregon. Ann Emerg Med. 2014;63:375-383.
9. Schmidt T, Olszewski EA, Zive D, et al. The Oregon physician orders for life-sustaining treatment registry: a preliminary study of emergency medical services utilization. J Emerg Med. 2013;44:796-805.
10. Hickman SE, Nelson CA, Moss AH, et al. Use of the physician orders for life-sustaining treatment (POLST) paradigm program in the hospice setting. J Palliat Med. 2009;12:133-141.
Evidence-based answers from the Family Physicians Inquiries Network
EVIDENCE-BASED ANSWER:
Quite well, for cardiopulmonary resuscitation (CPR). Most patients (91%-100%) who select “do not resuscitate” (DNR) on their physician’s orders for life-sustaining treatment (POLST) forms are allowed a natural death without attempted CPR across a variety of settings (community, skilled nursing facilities, emergency medical services, and hospice). Few patients (6%) who select “comfort measures only” die in the hospital, whereas more (22%) who choose “limited interventions,” and still more (34%) without a POLST form, die in the hospital (strength of recommendation [SOR]: B, large, consistent cross-sectional and cohort studies).
Most patients (84%) who select “attempt resuscitation” receive resuscitation for out-of-hospital cardiac arrest in emergency services settings (SOR: B, small retrospective cohort study).
POLST orders declining other services (intravenous fluids, intensive care, intubation, feeding tubes) are carried out in most (84%-100%) cases. POLST orders regarding antibiotic treatments are less effectively implemented (SOR: B, moderate-sized retrospective chart review).

What effects—if any—does marijuana use during pregnancy have on the fetus or child?
EVIDENCE SUMMARY
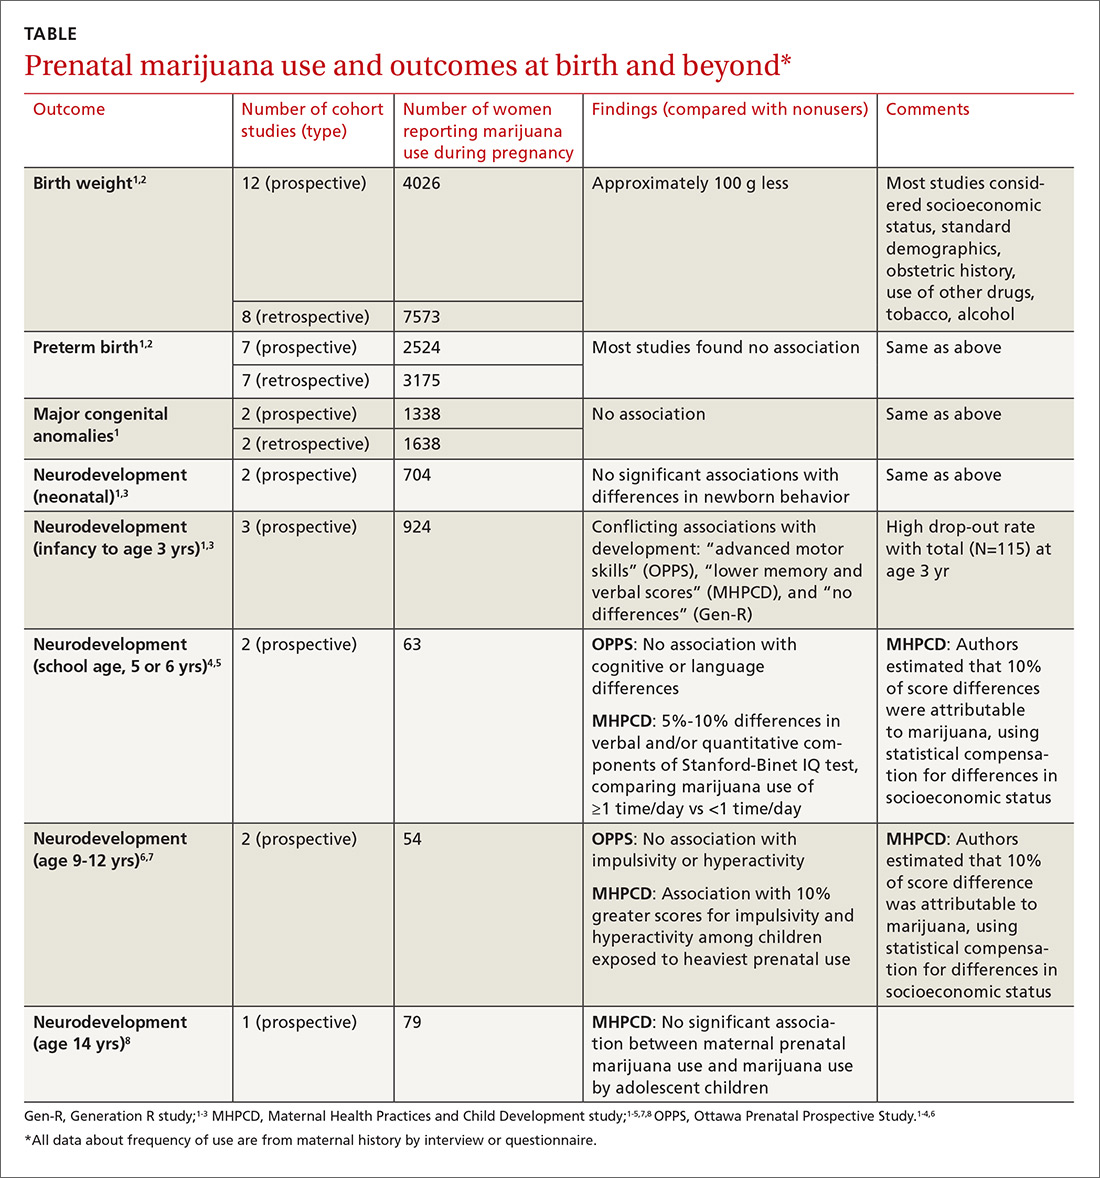
A large systematic review of prospective and retrospective cohort studies found little or no effect of maternal marijuana use on birth weight, stillbirths, preterm births, or congenital anomalies (TABLE1-8). Some studies found lower birth weights and some found higher birth weights. The authors couldn’t perform a meta-analysis because of heterogeneity, but estimated a clinically insignificant difference of 100 g. Most studies were limited by failure to account for concurrent maternal tobacco smoking.
Moreover, all studies used interview data to determine maternal prenatal marijuana use, which can be subject to large recall bias. A multicenter prospective study of 585 pregnant women that compared interview data with serum screening to identify tetrahydrocannabinol (THC) found poor correlation between history and laboratory validation, for example.1 Only 31% of pregnant women with positive THC testing self-reported marijuana use (31% sensitivity), and only 43% of women who reported marijuana use had a positive THC screen (43% specificity). Most studies didn’t quantify marijuana use well and didn’t associate use with trimester of exposure.
The authors also point out that marijuana potency has increased substantially since the 1980s when many of the studies were done (THC content was 3.2% in 1983 and 13% in 2008); prenatal marijuana use in the present day may expose the fetus to larger amounts of THC.1
A 2016 retrospective cohort study of 56 mothers who reported prenatal marijuana use found no differences in preterm birth, low birth weight, or Apgar scores.2
Neurodevelopmental effects on infants, long-term effects on children, teens
Three prospective cohort studies evaluated neurodevelopmental outcomes in neonates and infants, and 2 studies continued to follow children into adolescence.1,3 All found essentially no differences associated with prenatal marijuana at birth, throughout infancy, and through age 3 years. The studies had the same limitations as those described previously (potential recall bias for identifying which children were exposed to marijuana prenatally and poorly quantified marijuana use not well-associated with trimester of exposure).
The Ottawa Prenatal Prospective Study (OPPS) examined 140 low-risk pregnancies in white women of higher socioeconomic status who used marijuana during pregnancy.1,3-7 Investigators considered: socioeconomic status, standard demographics, obstetric history, and use of other drugs, tobacco, and alcohol. Using a standardized newborn assessment scale, they found subtle behavioral differences at one week but not 9 days. Investigators evaluated children again at 3 years of age, school entry (5 or 6 years), and 9 to 12 years.
The Maternal Health Practices and Child Development study (MHPCD) of 564 high-risk pregnancies in predominantly minority women of low socioeconomic status followed infants from birth through 14 years of age.1,3-5,7,8 It found some small differences in outcomes among children exposed to marijuana prenatally. Of note, when investigators evaluated marijuana use at age 14 years, they compared adolescent self-report history with urine THC testing (specificity 78%).
The MHPCD study was limited because, compared with the nonusing group, mothers who used marijuana were also 20% to 25% more likely to be single and poor, to live in poorer quality homes, and to use alcohol, tobacco, and other drugs. Investigators used statistical modeling to account for these environmental differences and estimated that 10% of the difference in outcomes was attributable to prenatal marijuana exposure.
The Generation R study (Gen R) enrolled 220 lower-risk pregnancies in multiethnic European women of higher socioeconomic status, followed children to 3 years of age, and found no marijuana-associated differences in any parameter.1,3,4 The final assessment included only 51 children.
RECOMMENDATIONS
The American College of Obstetricians and Gynecologists (ACOG) recommends screening all women for tobacco, alcohol, and drug use (including marijuana) during early pregnancy.9 Women who report marijuana use should be counseled regarding potential adverse consequences to fetal health and be encouraged to discontinue use.
ACOG says that insufficient data exist to evaluate the effects of marijuana use on infants during lactation and breastfeeding and recommends against it.
The American Society of Addiction Medicine also recommends screening pregnant women for drug use and making appropriate referrals for substance use treatment.10
1. Metz TD, Stickrath EH. Marijuana use in pregnancy and lactation: a review of the evidence. Am J Obstet Gynecol. 2015;213:761-778.
2. Chabarria KC, Racusin DA, Antony KM, et al. Marijuana use and its effects in pregnancy. Am J Obstet Gynecol. 2016;215:506.e1-e7.
3. Warner TD, Roussos-Ross D, Behnke M. It’s not your mother’s marijuana: effects on maternal-fetal health and the developing child. Clinical Perinatology. 2014;41:877-894.
4. Huizink AC. Prenatal cannabis exposure and infant outcomes: overview of studies. Prog Neuro-Psychopharmacol Biol Psychiatry. 2014;52:45-52.
5. Goldschmidt L, Richardson GA, Willford J, et al. Prenatal marijuana exposure and intelligence test performance at age 6. J Am Acad Child Adolesc Psychiatry. 2008;47:254-263.
6. Fried PA. The Ottawa Prenatal Prospective Study (OPPS): methodological issues and findings—it’s easy to throw the baby out with the bath water. Life Sci. 1995;56:2159-2168.
7. Goldschmidt L, Day NL, Richardson GA. Effects of prenatal marijuana exposure on child behavior problems at age 10. Neurotoxicol Teratol. 2000;22:325-336.
8. Day NL, Goldschmidt L, Thomas CA. Prenatal marijuana exposure contributes to the prediction of marijuana use at age 14. Addiction. 2006;101:1313-1322.
9. American College of Obstetricians and Gynecologists Committee on Obstetric Practice. Committee Opinion No. 637: Marijuana use during pregnancy and lactation. Obstet Gynecol. 2015;126:234-238.
10. American Society of Addiction Medicine. Public policy statement on women, alcohol and other drugs, and pregnancy. Chevy Chase MD: American Society of Addiction Medicine; 2011. Available at: http://www.asam.org/docs/default-source/public-policy-statements/1womenandpregnancy_7-11.pdf. Accessed July 5, 2016.
EVIDENCE SUMMARY
A large systematic review of prospective and retrospective cohort studies found little or no effect of maternal marijuana use on birth weight, stillbirths, preterm births, or congenital anomalies (TABLE1-8). Some studies found lower birth weights and some found higher birth weights. The authors couldn’t perform a meta-analysis because of heterogeneity, but estimated a clinically insignificant difference of 100 g. Most studies were limited by failure to account for concurrent maternal tobacco smoking.
Moreover, all studies used interview data to determine maternal prenatal marijuana use, which can be subject to large recall bias. A multicenter prospective study of 585 pregnant women that compared interview data with serum screening to identify tetrahydrocannabinol (THC) found poor correlation between history and laboratory validation, for example.1 Only 31% of pregnant women with positive THC testing self-reported marijuana use (31% sensitivity), and only 43% of women who reported marijuana use had a positive THC screen (43% specificity). Most studies didn’t quantify marijuana use well and didn’t associate use with trimester of exposure.
The authors also point out that marijuana potency has increased substantially since the 1980s when many of the studies were done (THC content was 3.2% in 1983 and 13% in 2008); prenatal marijuana use in the present day may expose the fetus to larger amounts of THC.1
A 2016 retrospective cohort study of 56 mothers who reported prenatal marijuana use found no differences in preterm birth, low birth weight, or Apgar scores.2
Neurodevelopmental effects on infants, long-term effects on children, teens
Three prospective cohort studies evaluated neurodevelopmental outcomes in neonates and infants, and 2 studies continued to follow children into adolescence.1,3 All found essentially no differences associated with prenatal marijuana at birth, throughout infancy, and through age 3 years. The studies had the same limitations as those described previously (potential recall bias for identifying which children were exposed to marijuana prenatally and poorly quantified marijuana use not well-associated with trimester of exposure).
The Ottawa Prenatal Prospective Study (OPPS) examined 140 low-risk pregnancies in white women of higher socioeconomic status who used marijuana during pregnancy.1,3-7 Investigators considered: socioeconomic status, standard demographics, obstetric history, and use of other drugs, tobacco, and alcohol. Using a standardized newborn assessment scale, they found subtle behavioral differences at one week but not 9 days. Investigators evaluated children again at 3 years of age, school entry (5 or 6 years), and 9 to 12 years.
The Maternal Health Practices and Child Development study (MHPCD) of 564 high-risk pregnancies in predominantly minority women of low socioeconomic status followed infants from birth through 14 years of age.1,3-5,7,8 It found some small differences in outcomes among children exposed to marijuana prenatally. Of note, when investigators evaluated marijuana use at age 14 years, they compared adolescent self-report history with urine THC testing (specificity 78%).
The MHPCD study was limited because, compared with the nonusing group, mothers who used marijuana were also 20% to 25% more likely to be single and poor, to live in poorer quality homes, and to use alcohol, tobacco, and other drugs. Investigators used statistical modeling to account for these environmental differences and estimated that 10% of the difference in outcomes was attributable to prenatal marijuana exposure.
The Generation R study (Gen R) enrolled 220 lower-risk pregnancies in multiethnic European women of higher socioeconomic status, followed children to 3 years of age, and found no marijuana-associated differences in any parameter.1,3,4 The final assessment included only 51 children.
RECOMMENDATIONS
The American College of Obstetricians and Gynecologists (ACOG) recommends screening all women for tobacco, alcohol, and drug use (including marijuana) during early pregnancy.9 Women who report marijuana use should be counseled regarding potential adverse consequences to fetal health and be encouraged to discontinue use.
ACOG says that insufficient data exist to evaluate the effects of marijuana use on infants during lactation and breastfeeding and recommends against it.
The American Society of Addiction Medicine also recommends screening pregnant women for drug use and making appropriate referrals for substance use treatment.10
1. Metz TD, Stickrath EH. Marijuana use in pregnancy and lactation: a review of the evidence. Am J Obstet Gynecol. 2015;213:761-778.
2. Chabarria KC, Racusin DA, Antony KM, et al. Marijuana use and its effects in pregnancy. Am J Obstet Gynecol. 2016;215:506.e1-e7.
3. Warner TD, Roussos-Ross D, Behnke M. It’s not your mother’s marijuana: effects on maternal-fetal health and the developing child. Clinical Perinatology. 2014;41:877-894.
4. Huizink AC. Prenatal cannabis exposure and infant outcomes: overview of studies. Prog Neuro-Psychopharmacol Biol Psychiatry. 2014;52:45-52.
5. Goldschmidt L, Richardson GA, Willford J, et al. Prenatal marijuana exposure and intelligence test performance at age 6. J Am Acad Child Adolesc Psychiatry. 2008;47:254-263.
6. Fried PA. The Ottawa Prenatal Prospective Study (OPPS): methodological issues and findings—it’s easy to throw the baby out with the bath water. Life Sci. 1995;56:2159-2168.
7. Goldschmidt L, Day NL, Richardson GA. Effects of prenatal marijuana exposure on child behavior problems at age 10. Neurotoxicol Teratol. 2000;22:325-336.
8. Day NL, Goldschmidt L, Thomas CA. Prenatal marijuana exposure contributes to the prediction of marijuana use at age 14. Addiction. 2006;101:1313-1322.
9. American College of Obstetricians and Gynecologists Committee on Obstetric Practice. Committee Opinion No. 637: Marijuana use during pregnancy and lactation. Obstet Gynecol. 2015;126:234-238.
10. American Society of Addiction Medicine. Public policy statement on women, alcohol and other drugs, and pregnancy. Chevy Chase MD: American Society of Addiction Medicine; 2011. Available at: http://www.asam.org/docs/default-source/public-policy-statements/1womenandpregnancy_7-11.pdf. Accessed July 5, 2016.
Evidence-based answers from the Family Physicians Inquiries Network
EVIDENCE-BASED ANSWER:
The effects are unclear. Marijuana use during pregnancy is associated with clinically unimportant lower birth weights (growth differences of approximately 100 g), but no differences in preterm births or congenital anomalies (strength of recommendation [SOR]: B, prospective and retrospective cohort studies with methodologic flaws).
Similarly, prenatal marijuana use isn’t associated with differences in neurodevelopmental outcomes (behavior problems, intellect, visual perception, language, or sustained attention and memory tasks) at birth, in the neonatal period, or in childhood through age 3 years. However, it may be associated with minimally lower verbal/quantitative IQ scores (1%) at age 6 years and increased impulsivity and hyperactivity (1%) at 10 years. Prenatal use isn’t linked to increased substance use at age 14 years (SOR: B, conflicting long-term prospective and retrospective cohort studies with methodologic flaws).

Which patients with metabolic syndrome benefit from metformin?
EVIDENCE-BASED ANSWER:
Patients at highest risk for progression to diabetes benefit from metformin.
In patients with metabolic syndrome who are in the highest-risk quartile for progression to diabetes (predicted mean 3-year risk, 60%), metformin, 850 mg twice daily, reduces the absolute risk by about 20% over a 3-year period. Metformin doesn’t reduce the incidence in patients at lower risk of progression (strength of recommendation [SOR]: C, post-hoc analysis of a randomized controlled trial [RCT]).
Intensive lifestyle modification reduces absolute risk in all patients proportionate to risk quartile (from 5% reduction for the lowest quartile to 28% for the highest). Over a 10-year period, intensive lifestyle modification reduces the absolute risk of diabetes by 34% and metformin reduces the risk by 18% for all patients at increased risk (considered as a group)—that is, not separated by risk quartile (SOR: A, large prospective RCTs).
Lower doses or shorter courses of metformin reduce fasting plasma glucose (SOR: C, RCTs with laboratory outcomes) and may reduce the risk of developing diabetes by a smaller amount (SOR: C, flawed RCT).
EVIDENCE SUMMARY
A post-hoc analysis of a prospective RCT (the Diabetes Prevention Program) comprising 3081 patients with impaired glucose metabolism who received metformin, a lifestyle modification program, or no intervention (placebo) found that metformin reduced the risk of developing diabetes only for patients in the highest risk quartile over 2.8 years. Lifestyle modification reduced diabetes risk in all patients.1
Investigators stratified patients who met National Cholesterol Education Program Adult Treatment Panel III (NCEP ATP III) criteria for metabolic syndrome into risk quartiles for progression to diabetes using a model they developed based on 7 parameters: fasting plasma glucose, hemoglobin A1c, history of high blood glucose, waist:hip ratio, waist circumference, triglycerides, and height (TABLE1). The model reasonably fit outcomes—the percentage of patients in each quartile who developed diabetes—with an area under the receiver operator characteristic curve of 0.73 (a measure of diagnostic accuracy where 1 is a perfect predictor and 0.5 is random).
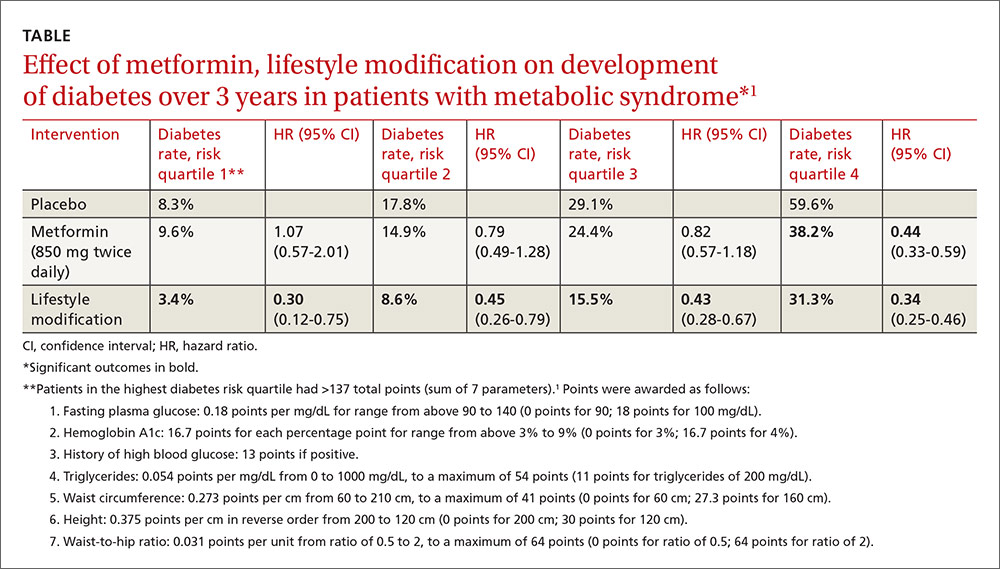
Lifestyle modification reduced risk in all quartiles with progressively greater effect as risk increased (lowest risk quartile: ARR=4.9%, 3-year NNT=20.4; highest risk quartile: ARR=28.3%; 3-year NNT=3.5).
There were 2 key weaknesses of the risk model: It wasn’t validated in a separate population and the true incidence of diabetes among patients taking placebo was higher than predicted. The investigators compared their risk prediction model results with the Framingham Risk Score (FRS) for diabetes and found that they correlated well, although the FRS results were consistently about 6% (absolute) higher when corrected for duration. (The FRS calculator is available online at www.framinghamheartstudy.org/risk-functions/diabetes/.)
Lifestyle change reduces diabetes risk more than metformin
The original Diabetes Prevention Program found that intensive lifestyle intervention and metformin reduced the number of diabetes cases over 2.8 years among 3234 patients at risk for developing diabetes.2
Compared with no intervention, fewer patients developed diabetes with either metformin or lifestyle improvement, although lifestyle change had the larger effect (no intervention: 11 cases per 100 person-years; metformin: 7.8 cases; 95% confidence interval [CI], 6.8-8.8; ARR=3.2% per year vs no intervention; lifestyle improvements: 4.8 cases; 95% CI, 4.1-5.7; ARR=6.2% per year vs no intervention).
The effect of metformin and lifestyle change persists at 10 years
A 10-year follow-up study to the Diabetes Prevention Program found that, compared with no intervention, both metformin and lifestyle interventions continued to be associated with a lower incidence of diabetes (no intervention: 7.8 cases per 100 person-years; 95% CI, 4.8-6.5; metformin: 6.4 cases; 95% CI, 4.2-5.7; ARR=1.4% per year; lifestyle interventions: 5.3 cases; 95% CI, 5.1-6.8; ARR=2.5% per year).3
Researchers originally randomized 3234 patients with body mass index ≥24 kg/m2, fasting blood sugar 95 to 125 mg/dL, and 2-hour post 75-gm glucose value of 149 to 199 mg/dL to 3 groups: intensive lifestyle modification (weight loss goal of 7%, 150 minutes a week of exercise), metformin (850 mg twice daily), and no intervention. After the 2.8-year follow-up period, 2766 patients continued for another 5.7 years of follow-up. Investigators offered group lifestyle counseling to all patients and continued metformin at the same dose in the second group.
Earlier study shows an effect for metformin, but with a caveat
An earlier RCT found that metformin reduced the risk of developing diabetes in patients with metabolic syndrome.4 Investigators randomized 70 patients to metformin (250 mg 3 times daily) or placebo for a year. Fewer patients developed diabetes with metformin (3% vs 16.2%, P=.011; NNT=7.6) and more had a normal glucose tolerance test result (84.9% vs 51.4%, P=.011; NNT=3). However, by current American Diabetes Association criteria, half of the subjects had early diabetes at baseline.
Metformin lowers fasting blood sugar, but may not reverse metabolic syndrome
A post-hoc analysis of another RCT found that metformin reduced fasting plasma glucose (FPG) levels in patients with upper-body obesity and metabolic syndrome (by 1999 World Health Organization criteria but not NCEP ATP III criteria).5
Investigators randomized 457 patients to metformin 850 mg once daily or placebo and followed them for a year. FPG levels decreased with metformin but increased with placebo (reduction FPG 5.9 mg/dL vs increase FPG 12.3 mg/dL; P<.04). The investigators didn’t report whether any patients developed diabetes.
However, another RCT (155 patients) that compared metformin 850 mg twice daily with placebo in subjects with metabolic syndrome but without diabetes found greater normalization of FPG (5% vs 0%; P=.005), but no reversal of metabolic syndrome or change in Framingham 10-year risk score after 12 weeks.6
1. Sussman JB, Kent DM, Nelson JP, et al. Improving diabetes prevention with benefit based tailored treatment: risk based reanalysis of Diabetes Prevention Program. BMJ. 2015;350:h454.
2. Diabetes Prevention Program Research Group. Reduction in the incidence of type 2 diabetes with lifestyle intervention or metformin. N Engl J Med. 2002;346:393-403.
3. Diabetes Prevention Program Research Group. 10-year follow-up of diabetes incidence and weight loss in the Diabetes Prevention Outcomes Study. Lancet. 2009:374:1677-1686.
4. Li CL, Pan CY, Lu JM, et al. Effect of metformin on patients with impaired glucose tolerance. Diabetes Med. 1999;16:477-481.
5. Fontbonne A, Diouf I, Baccara-Dinet M, et al. Effects of 1-year treatment with metformin on metabolic and cardiovascular risk factors in non-diabetic upper-body obese subjects with mild glucose anomalies: a post-hoc analysis of the BIGPRO1 trial. Diabetes Metab. 2009;35:385-391.
6. Nieuwdorp M, Stroes ESG, Kastelein JJP. Normalization of metabolic syndrome using fenofibrate, metformin or their combination. Diabetes Obesity Metab. 2007;9:869-878.
EVIDENCE-BASED ANSWER:
Patients at highest risk for progression to diabetes benefit from metformin.
In patients with metabolic syndrome who are in the highest-risk quartile for progression to diabetes (predicted mean 3-year risk, 60%), metformin, 850 mg twice daily, reduces the absolute risk by about 20% over a 3-year period. Metformin doesn’t reduce the incidence in patients at lower risk of progression (strength of recommendation [SOR]: C, post-hoc analysis of a randomized controlled trial [RCT]).
Intensive lifestyle modification reduces absolute risk in all patients proportionate to risk quartile (from 5% reduction for the lowest quartile to 28% for the highest). Over a 10-year period, intensive lifestyle modification reduces the absolute risk of diabetes by 34% and metformin reduces the risk by 18% for all patients at increased risk (considered as a group)—that is, not separated by risk quartile (SOR: A, large prospective RCTs).
Lower doses or shorter courses of metformin reduce fasting plasma glucose (SOR: C, RCTs with laboratory outcomes) and may reduce the risk of developing diabetes by a smaller amount (SOR: C, flawed RCT).
EVIDENCE SUMMARY
A post-hoc analysis of a prospective RCT (the Diabetes Prevention Program) comprising 3081 patients with impaired glucose metabolism who received metformin, a lifestyle modification program, or no intervention (placebo) found that metformin reduced the risk of developing diabetes only for patients in the highest risk quartile over 2.8 years. Lifestyle modification reduced diabetes risk in all patients.1
Investigators stratified patients who met National Cholesterol Education Program Adult Treatment Panel III (NCEP ATP III) criteria for metabolic syndrome into risk quartiles for progression to diabetes using a model they developed based on 7 parameters: fasting plasma glucose, hemoglobin A1c, history of high blood glucose, waist:hip ratio, waist circumference, triglycerides, and height (TABLE1). The model reasonably fit outcomes—the percentage of patients in each quartile who developed diabetes—with an area under the receiver operator characteristic curve of 0.73 (a measure of diagnostic accuracy where 1 is a perfect predictor and 0.5 is random).
Lifestyle modification reduced risk in all quartiles with progressively greater effect as risk increased (lowest risk quartile: ARR=4.9%, 3-year NNT=20.4; highest risk quartile: ARR=28.3%; 3-year NNT=3.5).
There were 2 key weaknesses of the risk model: It wasn’t validated in a separate population and the true incidence of diabetes among patients taking placebo was higher than predicted. The investigators compared their risk prediction model results with the Framingham Risk Score (FRS) for diabetes and found that they correlated well, although the FRS results were consistently about 6% (absolute) higher when corrected for duration. (The FRS calculator is available online at www.framinghamheartstudy.org/risk-functions/diabetes/.)
Lifestyle change reduces diabetes risk more than metformin
The original Diabetes Prevention Program found that intensive lifestyle intervention and metformin reduced the number of diabetes cases over 2.8 years among 3234 patients at risk for developing diabetes.2
Compared with no intervention, fewer patients developed diabetes with either metformin or lifestyle improvement, although lifestyle change had the larger effect (no intervention: 11 cases per 100 person-years; metformin: 7.8 cases; 95% confidence interval [CI], 6.8-8.8; ARR=3.2% per year vs no intervention; lifestyle improvements: 4.8 cases; 95% CI, 4.1-5.7; ARR=6.2% per year vs no intervention).
The effect of metformin and lifestyle change persists at 10 years
A 10-year follow-up study to the Diabetes Prevention Program found that, compared with no intervention, both metformin and lifestyle interventions continued to be associated with a lower incidence of diabetes (no intervention: 7.8 cases per 100 person-years; 95% CI, 4.8-6.5; metformin: 6.4 cases; 95% CI, 4.2-5.7; ARR=1.4% per year; lifestyle interventions: 5.3 cases; 95% CI, 5.1-6.8; ARR=2.5% per year).3
Researchers originally randomized 3234 patients with body mass index ≥24 kg/m2, fasting blood sugar 95 to 125 mg/dL, and 2-hour post 75-gm glucose value of 149 to 199 mg/dL to 3 groups: intensive lifestyle modification (weight loss goal of 7%, 150 minutes a week of exercise), metformin (850 mg twice daily), and no intervention. After the 2.8-year follow-up period, 2766 patients continued for another 5.7 years of follow-up. Investigators offered group lifestyle counseling to all patients and continued metformin at the same dose in the second group.
Earlier study shows an effect for metformin, but with a caveat
An earlier RCT found that metformin reduced the risk of developing diabetes in patients with metabolic syndrome.4 Investigators randomized 70 patients to metformin (250 mg 3 times daily) or placebo for a year. Fewer patients developed diabetes with metformin (3% vs 16.2%, P=.011; NNT=7.6) and more had a normal glucose tolerance test result (84.9% vs 51.4%, P=.011; NNT=3). However, by current American Diabetes Association criteria, half of the subjects had early diabetes at baseline.
Metformin lowers fasting blood sugar, but may not reverse metabolic syndrome
A post-hoc analysis of another RCT found that metformin reduced fasting plasma glucose (FPG) levels in patients with upper-body obesity and metabolic syndrome (by 1999 World Health Organization criteria but not NCEP ATP III criteria).5
Investigators randomized 457 patients to metformin 850 mg once daily or placebo and followed them for a year. FPG levels decreased with metformin but increased with placebo (reduction FPG 5.9 mg/dL vs increase FPG 12.3 mg/dL; P<.04). The investigators didn’t report whether any patients developed diabetes.
However, another RCT (155 patients) that compared metformin 850 mg twice daily with placebo in subjects with metabolic syndrome but without diabetes found greater normalization of FPG (5% vs 0%; P=.005), but no reversal of metabolic syndrome or change in Framingham 10-year risk score after 12 weeks.6
1. Sussman JB, Kent DM, Nelson JP, et al. Improving diabetes prevention with benefit based tailored treatment: risk based reanalysis of Diabetes Prevention Program. BMJ. 2015;350:h454.
2. Diabetes Prevention Program Research Group. Reduction in the incidence of type 2 diabetes with lifestyle intervention or metformin. N Engl J Med. 2002;346:393-403.
3. Diabetes Prevention Program Research Group. 10-year follow-up of diabetes incidence and weight loss in the Diabetes Prevention Outcomes Study. Lancet. 2009:374:1677-1686.
4. Li CL, Pan CY, Lu JM, et al. Effect of metformin on patients with impaired glucose tolerance. Diabetes Med. 1999;16:477-481.
5. Fontbonne A, Diouf I, Baccara-Dinet M, et al. Effects of 1-year treatment with metformin on metabolic and cardiovascular risk factors in non-diabetic upper-body obese subjects with mild glucose anomalies: a post-hoc analysis of the BIGPRO1 trial. Diabetes Metab. 2009;35:385-391.
6. Nieuwdorp M, Stroes ESG, Kastelein JJP. Normalization of metabolic syndrome using fenofibrate, metformin or their combination. Diabetes Obesity Metab. 2007;9:869-878.
Evidence-based answers from the Family Physicians Inquiries Network
Does knuckle popping lead to arthritis?
EVIDENCE-BASED ANSWER:
No, habitual knuckle popping, or cracking (over the course of several decades) isn’t associated with clinical or radiographic evidence of osteoarthritis (strength of recommendation [SOR]: B, retrospective cohort and case control studies). However, attempting to pop the knuckles can produce acute soft tissue injury (SOR: C, case reports).
Evidence summary
A cross-sectional study found no correlation between knuckle popping and osteoarthritis (OA) of the hand.1 Investigators recruited 300 consecutive patients (ages 45 years and older, mean age 63 years) and evaluated them for a history of habitual knuckle popping (74 of 300 patients, mean duration 35 years) and hand arthritis or dysfunction. Investigators excluded patients with neuromuscular, inflammatory, or malignant diseases.
Investigators found OA equally in both patients who did and didn’t pop their knuckles (12 of 74 vs 36 of 226, respectively; P nonsignificant); joint swelling was more common in participants with a history of knuckle popping (84% vs 6%; P<.01). Investigators didn’t describe how OA was diagnosed or specify which joints were affected.
Another cross-sectional study also found no correlation between habitual knuckle popping of the metacarpal phalangeal joint and the prevalence of OA in that joint.2 Investigators recruited 28 patients (mean age 78.5 years; 23 women and 5 men) from a Jewish home for the aged and asked them whether they had habitually cracked their knuckles during their lifetime. They then performed clinical and radiographic hand examinations (excluding patients with a history of traumatic injury, rheumatoid arthritis, gout, chondrocalcinosis, and hemochromatosis).
Knuckle popping didn’t correlate with OA of the metacarpal phalanges (1 of 15 knuckle popping patients vs 5 of 13 patients who didn’t pop their knuckles; P=.06). All 6 patients with radiographic evidence of OA showed involvement at the metacarpal phalangeal and distal interphalangeal joints, whether or not they popped their knuckles.
Years spent cracking knuckles doesn’t predict OA
A case control study found no correlation between OA in the hands and habitual knuckle popping.3 Investigators recruited 215 patients 50 to 89 years old who had received a radiograph of their right hand during the previous 5 years and divided them into cases with OA (135 patients), and controls without OA (80 patients). Patients completed questionnaires assessing the prevalence (20%), frequency (1 to 20 times per day), and duration (26 to 36 years) of knuckle popping.
Patients most commonly popped proximal interphalangeal joints (15.9%) followed by metacarpal phalangeal joints (13.5%), distal interphalangeal joints (6.1%), and first carpal metacarpal joints (2.3%). OA most often affected the distal interphalangeal joint (68.4%), followed by the first carpal metacarpal (57.1%), proximal interphalangeal (54.1%), and metacarpal phalangeal joints (28.6%). Investigators found no difference in the prevalence of knuckle popping between cases and controls (18% in cases vs 23.2% in controls; P=.361).
When investigators evaluated total knuckle popping exposure in “crack years” (number of times per day multiplied by years) in the distal interphalangeal or metacarpal phalangeal joints, they found no significant association between crack years and OA (distal interphalangeal joint, mean 108 crack years; metacarpal phalangeal joint, mean 75 crack years).
50 years of knuckle popping without ill effects
An n-of-1 case control study found similar results.4 The researcher, a physician, popped only the knuckles of his left hand, twice a day, for 50 years. He compared his hands at the end of the trial and found no arthritis in either hand and no visible differences.
But knuckle popping does have a downside
A paper described 2 case reports of acute injuries sustained during attempted knuckle popping—a partial tear of the ulnar collateral ligament of the thumb and subluxation of the extensor tendon of the fifth digit.5 Both injuries were associated with forceful manipulation of the digits, and both resolved with conservative management within 4 weeks.
1. Castellanos J, Axelrod D. Effect of habitual knuckle cracking on hand function. Ann Rheum Dis. 1990;49:308-309.
2. Swezey RL, Swezey SE. The consequences of habitual knuckle cracking. West J Med. 1975;122:377-379.
3. Deweber K, Olszewski M, Ortolano R. Knuckle cracking and hand osteoarthritis. J Am Board Fam Med. 2011;24:169-174.
4. Unger DL. Does knuckle cracking lead to arthritis of the fingers? Arthritis Rheum. 1998;41:949-950.
5. Chan PS, Steinberg DR, Bozentka DJ. Consequences of knuckle cracking: a report of two acute injuries. Am J Orthop (Belle Mead NJ). 1999;28:113-114.
EVIDENCE-BASED ANSWER:
No, habitual knuckle popping, or cracking (over the course of several decades) isn’t associated with clinical or radiographic evidence of osteoarthritis (strength of recommendation [SOR]: B, retrospective cohort and case control studies). However, attempting to pop the knuckles can produce acute soft tissue injury (SOR: C, case reports).
Evidence summary
A cross-sectional study found no correlation between knuckle popping and osteoarthritis (OA) of the hand.1 Investigators recruited 300 consecutive patients (ages 45 years and older, mean age 63 years) and evaluated them for a history of habitual knuckle popping (74 of 300 patients, mean duration 35 years) and hand arthritis or dysfunction. Investigators excluded patients with neuromuscular, inflammatory, or malignant diseases.
Investigators found OA equally in both patients who did and didn’t pop their knuckles (12 of 74 vs 36 of 226, respectively; P nonsignificant); joint swelling was more common in participants with a history of knuckle popping (84% vs 6%; P<.01). Investigators didn’t describe how OA was diagnosed or specify which joints were affected.
Another cross-sectional study also found no correlation between habitual knuckle popping of the metacarpal phalangeal joint and the prevalence of OA in that joint.2 Investigators recruited 28 patients (mean age 78.5 years; 23 women and 5 men) from a Jewish home for the aged and asked them whether they had habitually cracked their knuckles during their lifetime. They then performed clinical and radiographic hand examinations (excluding patients with a history of traumatic injury, rheumatoid arthritis, gout, chondrocalcinosis, and hemochromatosis).
Knuckle popping didn’t correlate with OA of the metacarpal phalanges (1 of 15 knuckle popping patients vs 5 of 13 patients who didn’t pop their knuckles; P=.06). All 6 patients with radiographic evidence of OA showed involvement at the metacarpal phalangeal and distal interphalangeal joints, whether or not they popped their knuckles.
Years spent cracking knuckles doesn’t predict OA
A case control study found no correlation between OA in the hands and habitual knuckle popping.3 Investigators recruited 215 patients 50 to 89 years old who had received a radiograph of their right hand during the previous 5 years and divided them into cases with OA (135 patients), and controls without OA (80 patients). Patients completed questionnaires assessing the prevalence (20%), frequency (1 to 20 times per day), and duration (26 to 36 years) of knuckle popping.
Patients most commonly popped proximal interphalangeal joints (15.9%) followed by metacarpal phalangeal joints (13.5%), distal interphalangeal joints (6.1%), and first carpal metacarpal joints (2.3%). OA most often affected the distal interphalangeal joint (68.4%), followed by the first carpal metacarpal (57.1%), proximal interphalangeal (54.1%), and metacarpal phalangeal joints (28.6%). Investigators found no difference in the prevalence of knuckle popping between cases and controls (18% in cases vs 23.2% in controls; P=.361).
When investigators evaluated total knuckle popping exposure in “crack years” (number of times per day multiplied by years) in the distal interphalangeal or metacarpal phalangeal joints, they found no significant association between crack years and OA (distal interphalangeal joint, mean 108 crack years; metacarpal phalangeal joint, mean 75 crack years).
50 years of knuckle popping without ill effects
An n-of-1 case control study found similar results.4 The researcher, a physician, popped only the knuckles of his left hand, twice a day, for 50 years. He compared his hands at the end of the trial and found no arthritis in either hand and no visible differences.
But knuckle popping does have a downside
A paper described 2 case reports of acute injuries sustained during attempted knuckle popping—a partial tear of the ulnar collateral ligament of the thumb and subluxation of the extensor tendon of the fifth digit.5 Both injuries were associated with forceful manipulation of the digits, and both resolved with conservative management within 4 weeks.
1. Castellanos J, Axelrod D. Effect of habitual knuckle cracking on hand function. Ann Rheum Dis. 1990;49:308-309.
2. Swezey RL, Swezey SE. The consequences of habitual knuckle cracking. West J Med. 1975;122:377-379.
3. Deweber K, Olszewski M, Ortolano R. Knuckle cracking and hand osteoarthritis. J Am Board Fam Med. 2011;24:169-174.
4. Unger DL. Does knuckle cracking lead to arthritis of the fingers? Arthritis Rheum. 1998;41:949-950.
5. Chan PS, Steinberg DR, Bozentka DJ. Consequences of knuckle cracking: a report of two acute injuries. Am J Orthop (Belle Mead NJ). 1999;28:113-114.
Evidence-based answers from the Family Physicians Inquiries Network

Which SSRIs most effectively treat depression in adolescents?
EVIDENCE-BASED ANSWER:
We don’t know which selective serotonin reuptake inhibitors (SSRIs) are the most effective and safe because no studies have compared these antidepressants with each other.
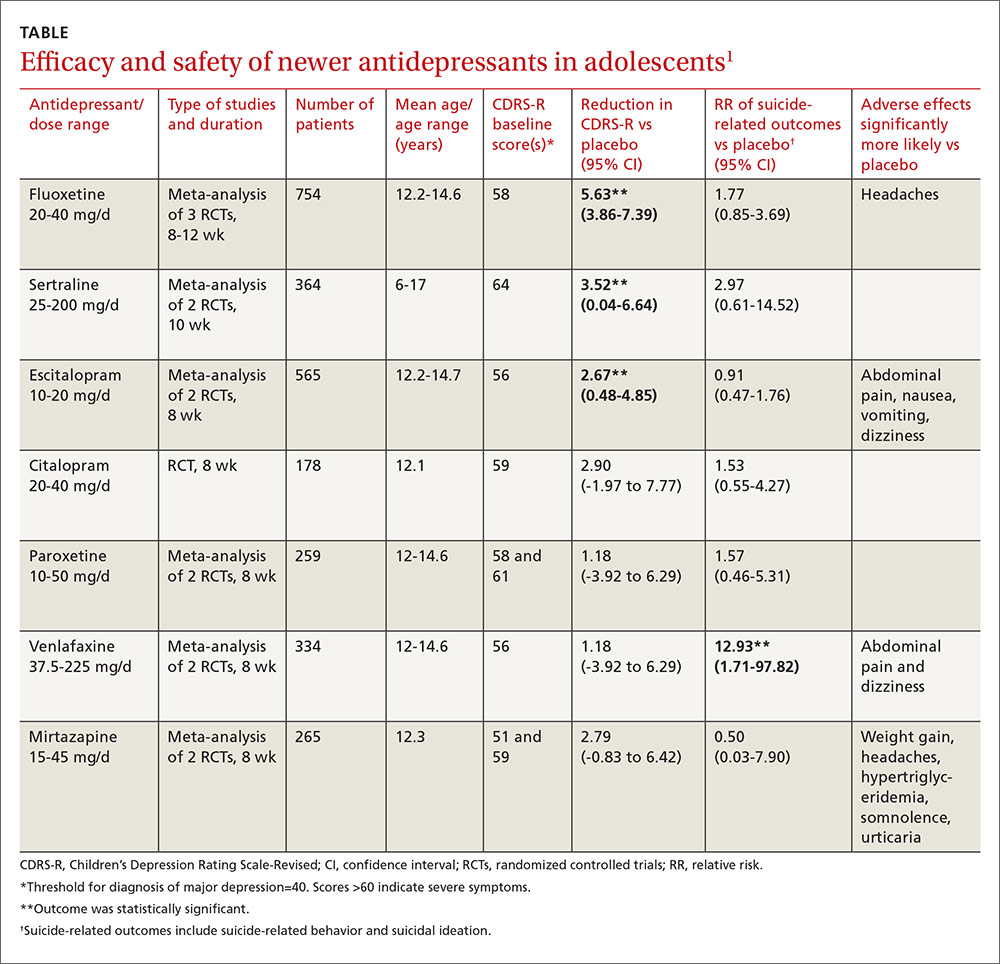
Three SSRI antidepressant medications—fluoxetine, sertraline, and escitalopram—produce modest improvements (about 5% to 10%) in standardized depression scores without a significant increase in the risk of suicide-related outcomes (suicidal behavior or ideation) in adolescent patients with major depression of moderate severity. As a group, however, the newer-generation antidepressants, including SSRIs, increase suicide-related outcomes by 50%. Citalopram, paroxetine, venlafaxine, and mirtazapine don’t improve depression scores (strength of recommendation [SOR]: A, meta-analyses of randomized controlled trials [RCTs]).
An updated national guideline recommends specific psychological therapy for adolescents with mild depression and combined psychotherapy and fluoxetine for moderate or severe depression, with sertraline or citalopram as second-line agents (SOR: A, RCTs).
EVIDENCE SUMMARY
A Cochrane systematic review (19 RCTs; 3335 patients, total) of newer-generation antidepressants for treating depression in adolescents found that, overall, they produced both a small decrease in symptom severity scores and an increased risk of suicide-related outcomes.1
Three SSRIs slightly lower one symptom severity score
Investigators performed a meta-analysis of all trials (14 RCTs; 2490 patients, total) that used the same standardized symptom severity score (the Children’s Depression Rating Scale—Revised [CDRS-R], range 17 to 113 points) to evaluate the following medications: fluoxetine, sertraline, escitalopram, citalopram, paroxetine, venlafaxine, and mirtazapine.1
All participants were outpatients who met criteria for a primary diagnosis of major depression, excluding comorbid conditions. The CDRS-R scores were evaluated by clinicians; the mean baseline score was 57 (40 is considered a threshold score for diagnosis, and above 60 indicates severe symptoms). Only 5 trials reported patients’ self-rated depression symptom severity (in patients taking fluoxetine and paroxetine) and none reported improvement. Treatment courses ranged from 8 to 12 weeks.
As a group, the newer antidepressants slightly reduced CDRS-R scores in adolescents (by 4.21 points, 95% confidence interval [CI], 0.41-5.95) but increased suicide-related outcomes (relative risk [RR]=1.47; 95% CI, 0.99-2.19). The individual antidepressants fluoxetine, sertraline, and escitalopram each produced statistically significant but clinically small reductions in CDRS-R scores of 5% to 10% without significantly increasing suicide-related outcomes (TABLE1). The other medications evaluated individually didn’t improve CDRS-R scores, and only venlafaxine increased suicide-related outcomes.
Other symptom severity scores show no improvement with SSRIs
Five additional RCTs not included in the meta-analysis that used standardized symptom severity scores other than the CDRS-R (Schedule for Affective Disorders and Schizophrenia for School-Aged Children [K-SADS], Montgomery-Asberg Depression Rating Scale [MADR], and Hamilton Depression Rating Scale [HAM-D]) found no improvement with fluoxetine (2 RCTs; 63 patients, total), citalopram (one RCT, 233 patients), or paroxetine (2 RCTs; 466 patients, total).
Certain drugs cause significantly more adverse events than placebo
Ten RCTs evaluated adverse events in adolescents treated with fluoxetine, escitalopram, citalopram, and paroxetine and reported a small increase over placebo when all medications were combined as a group (RR=1.11; 95% CI, 1.05-1.17). Investigators reported that the individual antidepressants fluoxetine, escitalopram, venlafaxine, and mirtazapine produced significantly more adverse events than placebo (P values not given). No studies compared antidepressant medications against each other for either efficacy or potential harms.
RECOMMENDATIONS
A newly revised expert guideline recommends treating mildly depressed adolescents with a specific psychological therapy—individual cognitive behavioral therapy, interpersonal therapy, family therapy, or psychodynamic psychotherapy—for at least 3 months.2
For adolescents with moderate to severe depression, the guideline advocates psychotherapy with the option of adding fluoxetine, although using antidepressants in adolescents who haven’t at least tried psychotherapy is outside of the drug’s indications.
The guideline also recommends careful monitoring for adverse effects and close review of mental state—weekly for the first 4 weeks of treatment, for example. If fluoxetine doesn’t help, sertraline and citalopram are recommended as alternatives.
1. Hetrick SE, McKenzie JE, Cox GR, et al. Newer generation antidepressants for depressive disorders in children and adolescents. Cochrane Database Syst Rev. 2012;11:CD004851.
2. Hopkins K, Crosland P, Elliott N, et al. Diagnosis and management of depression in children and young people: summary of updated NICE guidance. BMJ. 2015;350:h824.
EVIDENCE-BASED ANSWER:
We don’t know which selective serotonin reuptake inhibitors (SSRIs) are the most effective and safe because no studies have compared these antidepressants with each other.
Three SSRI antidepressant medications—fluoxetine, sertraline, and escitalopram—produce modest improvements (about 5% to 10%) in standardized depression scores without a significant increase in the risk of suicide-related outcomes (suicidal behavior or ideation) in adolescent patients with major depression of moderate severity. As a group, however, the newer-generation antidepressants, including SSRIs, increase suicide-related outcomes by 50%. Citalopram, paroxetine, venlafaxine, and mirtazapine don’t improve depression scores (strength of recommendation [SOR]: A, meta-analyses of randomized controlled trials [RCTs]).
An updated national guideline recommends specific psychological therapy for adolescents with mild depression and combined psychotherapy and fluoxetine for moderate or severe depression, with sertraline or citalopram as second-line agents (SOR: A, RCTs).
EVIDENCE SUMMARY
A Cochrane systematic review (19 RCTs; 3335 patients, total) of newer-generation antidepressants for treating depression in adolescents found that, overall, they produced both a small decrease in symptom severity scores and an increased risk of suicide-related outcomes.1
Three SSRIs slightly lower one symptom severity score
Investigators performed a meta-analysis of all trials (14 RCTs; 2490 patients, total) that used the same standardized symptom severity score (the Children’s Depression Rating Scale—Revised [CDRS-R], range 17 to 113 points) to evaluate the following medications: fluoxetine, sertraline, escitalopram, citalopram, paroxetine, venlafaxine, and mirtazapine.1
All participants were outpatients who met criteria for a primary diagnosis of major depression, excluding comorbid conditions. The CDRS-R scores were evaluated by clinicians; the mean baseline score was 57 (40 is considered a threshold score for diagnosis, and above 60 indicates severe symptoms). Only 5 trials reported patients’ self-rated depression symptom severity (in patients taking fluoxetine and paroxetine) and none reported improvement. Treatment courses ranged from 8 to 12 weeks.
As a group, the newer antidepressants slightly reduced CDRS-R scores in adolescents (by 4.21 points, 95% confidence interval [CI], 0.41-5.95) but increased suicide-related outcomes (relative risk [RR]=1.47; 95% CI, 0.99-2.19). The individual antidepressants fluoxetine, sertraline, and escitalopram each produced statistically significant but clinically small reductions in CDRS-R scores of 5% to 10% without significantly increasing suicide-related outcomes (TABLE1). The other medications evaluated individually didn’t improve CDRS-R scores, and only venlafaxine increased suicide-related outcomes.
Other symptom severity scores show no improvement with SSRIs
Five additional RCTs not included in the meta-analysis that used standardized symptom severity scores other than the CDRS-R (Schedule for Affective Disorders and Schizophrenia for School-Aged Children [K-SADS], Montgomery-Asberg Depression Rating Scale [MADR], and Hamilton Depression Rating Scale [HAM-D]) found no improvement with fluoxetine (2 RCTs; 63 patients, total), citalopram (one RCT, 233 patients), or paroxetine (2 RCTs; 466 patients, total).
Certain drugs cause significantly more adverse events than placebo
Ten RCTs evaluated adverse events in adolescents treated with fluoxetine, escitalopram, citalopram, and paroxetine and reported a small increase over placebo when all medications were combined as a group (RR=1.11; 95% CI, 1.05-1.17). Investigators reported that the individual antidepressants fluoxetine, escitalopram, venlafaxine, and mirtazapine produced significantly more adverse events than placebo (P values not given). No studies compared antidepressant medications against each other for either efficacy or potential harms.
RECOMMENDATIONS
A newly revised expert guideline recommends treating mildly depressed adolescents with a specific psychological therapy—individual cognitive behavioral therapy, interpersonal therapy, family therapy, or psychodynamic psychotherapy—for at least 3 months.2
For adolescents with moderate to severe depression, the guideline advocates psychotherapy with the option of adding fluoxetine, although using antidepressants in adolescents who haven’t at least tried psychotherapy is outside of the drug’s indications.
The guideline also recommends careful monitoring for adverse effects and close review of mental state—weekly for the first 4 weeks of treatment, for example. If fluoxetine doesn’t help, sertraline and citalopram are recommended as alternatives.
1. Hetrick SE, McKenzie JE, Cox GR, et al. Newer generation antidepressants for depressive disorders in children and adolescents. Cochrane Database Syst Rev. 2012;11:CD004851.
2. Hopkins K, Crosland P, Elliott N, et al. Diagnosis and management of depression in children and young people: summary of updated NICE guidance. BMJ. 2015;350:h824.
Evidence-based answers from the Family Physicians Inquiries Network

Which nonhormonal treatments are effective for hot flashes?
Selective serotonin reuptake inhibitors (SSRIs [fluoxetine, sertraline, paroxetine]) and the selective norepinephrine reuptake inhibitor (SNRI) venlafaxine, as well as clonidine and gabapentin, reduce hot flashes by about 25% (approximately one per day) in women with and without a history of breast cancer. No studies compare medications against each other to determine a single best option (strength of recommendation [SOR]: A, systematic reviews and meta-analyses of randomized controlled trials [RCTs]). In comparison, estrogen reduces the frequency of hot flashes by about 75%, or 2.5 to 3 per day.
The phytoestrogens (soy isoflavones, red clover extract, black cohosh), vitamin E, and nonpharmacologic measures (relaxation therapy, exercise, acupuncture, homeopathy, magnet therapy) lack evidence of effectiveness (SOR: A, meta-analyses of RCTs, many of which were low quality).
EVIDENCE SUMMARY
A systematic review of 6 RCTs that evaluated SSRIs and SNRIs (fluoxetine, sertraline, paroxetine, venlafaxine) found them all to be effective for reducing hot flash frequency and symptom scores in women with previous breast cancer1 (TABLE1,2).
A 2006 meta-analysis combined the results of 7 RCTs (each evaluating a single SSRI [fluoxetine, paroxetine] or SNRI [venlafaxine]) and found that as a group, they reduced mean hot flash frequency (–1.13 hot flashes/d; 95% confidence interval [CI], –1.70 to –0.57) in women with and without breast cancer.2 No trial compared medications head to head, and the populations differed among studies, so that investigators couldn’t determine a single best agent.
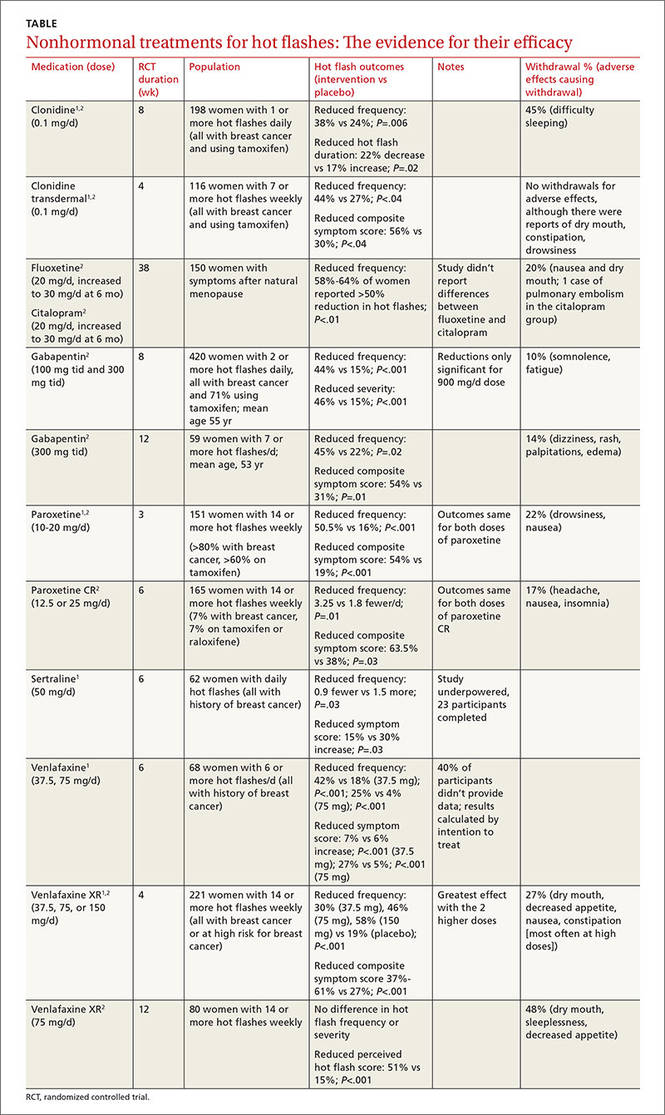
Clonidine and gabapentin decrease hot flash frequency
The 2006 meta-analysis also included 10 RCTs (743 patients) that studied clonidine in women with and without a history of breast cancer, and 2 RCTs (479 patients) that evaluated gabapentin in women with breast cancer.2 Both drugs reduced mean hot flash frequency (clonidine: –0.95 hot flashes/d, 95% CI, –1.44 to –0.47 at 4 weeks and –1.63 hot flashes/d, 95% CI, –2.76 to –0.05 at 8 weeks; gabapentin: –2.05 hot flashes/d; 95% CI, −2.80 to –1.30).
Phytoestrogens: The jury is still out
A meta-analysis of 43 RCTs (4364 patients) evaluated phytoestrogens that included dietary soy, soy extracts, red clover extracts, genistein extracts, and other types of phytoestrogens.3 The data from the only 5 RCTs (300 patients) that could be combined showed no effect from red clover extract on hot flash frequency. However, another 4 individual trials that couldn’t be combined each found that extracts with high levels of the phytoestrogen genistein (>30 mg/d) did reduce frequency. Investigators reported that many of the trials were small and had a high risk of bias.
A meta-analysis of 16 RCTs (2027 patients) that assessed black cohosh found that it didn’t reduce hot flash frequency (3 RCTs, 393 patients) or symptom severity scores (4 RCTs, 357 patients).4 Investigators reported high heterogeneity and recommended further research.
Nonpharmacologic therapies and vitamin E don’t help
Systematic reviews found that relaxation therapy (4 RCTs, 281 patients), exercise (3 RCTs, 454 patients), and acupuncture (8 RCTs, 414 patients) didn’t reduce hot flashes.5-7 In another review, vitamin E (1 RCT, 105 patients), homeopathy (2 RCTs, 124 patients), and magnetic devices (1 RCT, 11 patients) also produced no benefit.1
1. Rada G, Capurro D, Pantoja T, et al. Non-hormonal interventions for hot flushes in women with a history of breast cancer. Cochrane Database Syst Rev. 2010;(9):CD004923.
2. Nelson HD, Vesco KK, Haney E, et al. Nonhormonal therapies of menopausal hot flashes: systematic review and meta-analysis. JAMA. 2006;295:2057-2071.
3. Lethaby A, Marjoribanks J, Kronenberg F, et al. Phytoestrogens for menopausal vasomotor symptoms. Cochrane Database Syst Rev. 2013;(12):CD001395.
4. Leach MJ, Moore V. Black cohosh (Cimicifuga spp.) for menopausal symptoms. Cochrane Database Syst Rev. 2012;(9):CD007244.
5. Saensak S, Vutyavanich T, Somboonporn W, et al. Relaxation for perimenopausal and postmenopausal symptoms. Cochrane Database Syst Rev. 2014;(7):CD008582.
6. Daley A, Stokes-Lampard H, Thomas A, et al. Exercise for vasomotor menopausal symptoms. Cochrane Database Syst Rev. 2014:(11):CD006108.
7. Dodin S, Blanchet C, Marc I, et al. Acupuncture for menopausal hot flashes. Cochrane Database Syst Rev. 2013;(7):CD007410.
Selective serotonin reuptake inhibitors (SSRIs [fluoxetine, sertraline, paroxetine]) and the selective norepinephrine reuptake inhibitor (SNRI) venlafaxine, as well as clonidine and gabapentin, reduce hot flashes by about 25% (approximately one per day) in women with and without a history of breast cancer. No studies compare medications against each other to determine a single best option (strength of recommendation [SOR]: A, systematic reviews and meta-analyses of randomized controlled trials [RCTs]). In comparison, estrogen reduces the frequency of hot flashes by about 75%, or 2.5 to 3 per day.
The phytoestrogens (soy isoflavones, red clover extract, black cohosh), vitamin E, and nonpharmacologic measures (relaxation therapy, exercise, acupuncture, homeopathy, magnet therapy) lack evidence of effectiveness (SOR: A, meta-analyses of RCTs, many of which were low quality).
EVIDENCE SUMMARY
A systematic review of 6 RCTs that evaluated SSRIs and SNRIs (fluoxetine, sertraline, paroxetine, venlafaxine) found them all to be effective for reducing hot flash frequency and symptom scores in women with previous breast cancer1 (TABLE1,2).
A 2006 meta-analysis combined the results of 7 RCTs (each evaluating a single SSRI [fluoxetine, paroxetine] or SNRI [venlafaxine]) and found that as a group, they reduced mean hot flash frequency (–1.13 hot flashes/d; 95% confidence interval [CI], –1.70 to –0.57) in women with and without breast cancer.2 No trial compared medications head to head, and the populations differed among studies, so that investigators couldn’t determine a single best agent.
Clonidine and gabapentin decrease hot flash frequency
The 2006 meta-analysis also included 10 RCTs (743 patients) that studied clonidine in women with and without a history of breast cancer, and 2 RCTs (479 patients) that evaluated gabapentin in women with breast cancer.2 Both drugs reduced mean hot flash frequency (clonidine: –0.95 hot flashes/d, 95% CI, –1.44 to –0.47 at 4 weeks and –1.63 hot flashes/d, 95% CI, –2.76 to –0.05 at 8 weeks; gabapentin: –2.05 hot flashes/d; 95% CI, −2.80 to –1.30).
Phytoestrogens: The jury is still out
A meta-analysis of 43 RCTs (4364 patients) evaluated phytoestrogens that included dietary soy, soy extracts, red clover extracts, genistein extracts, and other types of phytoestrogens.3 The data from the only 5 RCTs (300 patients) that could be combined showed no effect from red clover extract on hot flash frequency. However, another 4 individual trials that couldn’t be combined each found that extracts with high levels of the phytoestrogen genistein (>30 mg/d) did reduce frequency. Investigators reported that many of the trials were small and had a high risk of bias.
A meta-analysis of 16 RCTs (2027 patients) that assessed black cohosh found that it didn’t reduce hot flash frequency (3 RCTs, 393 patients) or symptom severity scores (4 RCTs, 357 patients).4 Investigators reported high heterogeneity and recommended further research.
Nonpharmacologic therapies and vitamin E don’t help
Systematic reviews found that relaxation therapy (4 RCTs, 281 patients), exercise (3 RCTs, 454 patients), and acupuncture (8 RCTs, 414 patients) didn’t reduce hot flashes.5-7 In another review, vitamin E (1 RCT, 105 patients), homeopathy (2 RCTs, 124 patients), and magnetic devices (1 RCT, 11 patients) also produced no benefit.1
1. Rada G, Capurro D, Pantoja T, et al. Non-hormonal interventions for hot flushes in women with a history of breast cancer. Cochrane Database Syst Rev. 2010;(9):CD004923.
2. Nelson HD, Vesco KK, Haney E, et al. Nonhormonal therapies of menopausal hot flashes: systematic review and meta-analysis. JAMA. 2006;295:2057-2071.
3. Lethaby A, Marjoribanks J, Kronenberg F, et al. Phytoestrogens for menopausal vasomotor symptoms. Cochrane Database Syst Rev. 2013;(12):CD001395.
4. Leach MJ, Moore V. Black cohosh (Cimicifuga spp.) for menopausal symptoms. Cochrane Database Syst Rev. 2012;(9):CD007244.
5. Saensak S, Vutyavanich T, Somboonporn W, et al. Relaxation for perimenopausal and postmenopausal symptoms. Cochrane Database Syst Rev. 2014;(7):CD008582.
6. Daley A, Stokes-Lampard H, Thomas A, et al. Exercise for vasomotor menopausal symptoms. Cochrane Database Syst Rev. 2014:(11):CD006108.
7. Dodin S, Blanchet C, Marc I, et al. Acupuncture for menopausal hot flashes. Cochrane Database Syst Rev. 2013;(7):CD007410.
Evidence-based answers from the Family Physicians Inquiries Network

Does caffeine intake during pregnancy affect birth weight?
No. Reducing caffeinated coffee consumption by 180 mg of caffeine (the equivalent of 2 cups) per day after 16 weeks’ gestation doesn’t affect birth weight. Consuming more than 300 mg of caffeine per day is associated with a clinically trivial, and statistically insignificant (less than 1 ounce), reduction in birth weight, compared with consuming no caffeine (strength of recommendation: B, randomized controlled trial [RCT] and large prospective cohort study).
EVIDENCE SUMMARY
A Cochrane systematic review of the effects of caffeine on pregnancy identified 2 studies, only one of which addressed the question of maternal caffeine intake and infant birth weight.1 The double-blind RCT evaluating caffeine intake during pregnancy found no significant differences in birth weight or length of gestation between women who drank regular coffee and women who drank decaffeinated coffee.2
At 16 weeks’ gestation, investigators randomized 1207 pregnant women who reported daily intake of at least 3 cups of regular coffee to drink unlabeled instant coffee (which was either regular or decaffeinated) for the rest of their pregnancy. The women were allowed to request as much of their assigned instant coffee as they wanted.
Subjects were recruited from among all women with uncomplicated, singleton pregnancies who were expected to deliver at a Danish university hospital during the study period. Investigators interviewed the women at 20, 25, and 34 weeks to determine coffee consumption (including both coffee provided by the investigators and other coffee), consumption of other caffeinated beverages, and smoking status.
The difference in caffeine intake between the groups didn’t correspond to significant differences in birth weight (16 g lighter with caffeinated coffee; 95% confidence interval [CI], −40 g to 73 g; P=.48) or birth length (0.03 cm longer with caffeinated coffee; 95% CI, −0.29 to 0.22) among infants born to the 1150 women who completed the study.
Limitations of the study include randomizing women after 16 weeks’ gestation and the observation that many women correctly guessed which type of coffee they received (35% of women drinking caffeinated coffee and 49% of women drinking decaf).
A caffeine effect, but with study limitations
The Cochrane systematic review (described above) and a meta-analysis of 9 prospective cohort studies with a total of 90,000 patients that evaluated maternal caffeine intake found that it was associated with increased low birth weight, intrauterine growth restriction (IUGR), or small for gestational age (SGA) infants.3
Researchers assessed caffeine consumption from coffee or other sources either by questionnaire (5 studies) or interview (4 studies) at various times during pregnancy, mostly in the first or second trimester, and assigned subjects to 4 intake categories: none, low (50-149 mg/d), moderate (150-349 mg/d), and high (>350 mg/d).
Compared with no caffeine, all levels of caffeine intake were associated with increased rates of low birth weight, IUGR, or SGA (low intake: relative risk [RR]=1.13; 95% CI, 1.06-1.21; moderate intake: RR=1.38; 95% CI, 1.18-1.62; high intake: RR=1.60; 95% CI, 1.24-2.08).
A major limitation of the meta-analysis was that 8 of the included studies were identified by the reviewers as having quality problems. The reviewers also identified additional cohort studies, not included in the meta-analysis, which failed to show any association between caffeine intake and poor pregnancy outcomes.
Results of best-quality study prove clinically trivial
The best-quality prospective cohort study in the review described above was also the largest, comprising two-thirds of the total patients. It found a statistically significant, but clinically trivial, association between caffeine intake and birth weight.4
Investigators from Norway’s Institute of Public Health mailed surveys to 106,707 pregnant Norwegian women and recruited 59,123 with uncomplicated singleton pregnancies. The survey assessed diet and lifestyle at several stages of pregnancy and correlated caffeine intake with birth weight, gestational length, and SGA deliveries. Investigators calculated caffeine intake from coffee and other dietary sources (tea and chocolate).
Higher caffeine intake was associated with a small reduction in birth weight (8 g/100 mg/d of additional caffeine intake; 95% CI, −10 to −6 g/100 mg/d). Higher intake was also associated with increasing likelihood of SGA birth, a finding of borderline significance (odds ratio [OR]=1.18; 95% CI, 1.00-1.38, comparing intake <50 mg/d with 51-200 mg/d; OR=1.62; 95% CI, 1.26-2.29, comparing <50 mg/d with 201-300 mg/d; and OR=1.62; 95% CI, 1.15-2.29, comparing <50 mg/d with >300 mg/d).
1. Jahanfar S, Jaafar SH. Effects of restricted caffeine intake by mother on fetal, neonatal and pregnancy outcome. Cochrane Database Syst Rev. 2013;(2):CD006965.
2. Bech BH, Obel C, Henriksen TB, et al. Effect of reducing caffeine intake on birth weight and length of gestation: randomised controlled trial. BMJ. 2007;334:409.
3. Chen LW, Wu Y, Neelakantan N, et al. Maternal caffeine intake during pregnancy is associated with risk of low birth weight: a systematic review and dose-response meta-analysis. BMC Medicine. 2014;12:174-176.
4. Sengpiel V, Elind E, Bacelis J, et al. Maternal caffeine intake during pregnancy is associated with birth weight but not with gestational length: results form a large prospective observational cohort trial. BMC Medicine. 2013;11:42.
No. Reducing caffeinated coffee consumption by 180 mg of caffeine (the equivalent of 2 cups) per day after 16 weeks’ gestation doesn’t affect birth weight. Consuming more than 300 mg of caffeine per day is associated with a clinically trivial, and statistically insignificant (less than 1 ounce), reduction in birth weight, compared with consuming no caffeine (strength of recommendation: B, randomized controlled trial [RCT] and large prospective cohort study).
EVIDENCE SUMMARY
A Cochrane systematic review of the effects of caffeine on pregnancy identified 2 studies, only one of which addressed the question of maternal caffeine intake and infant birth weight.1 The double-blind RCT evaluating caffeine intake during pregnancy found no significant differences in birth weight or length of gestation between women who drank regular coffee and women who drank decaffeinated coffee.2
At 16 weeks’ gestation, investigators randomized 1207 pregnant women who reported daily intake of at least 3 cups of regular coffee to drink unlabeled instant coffee (which was either regular or decaffeinated) for the rest of their pregnancy. The women were allowed to request as much of their assigned instant coffee as they wanted.
Subjects were recruited from among all women with uncomplicated, singleton pregnancies who were expected to deliver at a Danish university hospital during the study period. Investigators interviewed the women at 20, 25, and 34 weeks to determine coffee consumption (including both coffee provided by the investigators and other coffee), consumption of other caffeinated beverages, and smoking status.
The difference in caffeine intake between the groups didn’t correspond to significant differences in birth weight (16 g lighter with caffeinated coffee; 95% confidence interval [CI], −40 g to 73 g; P=.48) or birth length (0.03 cm longer with caffeinated coffee; 95% CI, −0.29 to 0.22) among infants born to the 1150 women who completed the study.
Limitations of the study include randomizing women after 16 weeks’ gestation and the observation that many women correctly guessed which type of coffee they received (35% of women drinking caffeinated coffee and 49% of women drinking decaf).
A caffeine effect, but with study limitations
The Cochrane systematic review (described above) and a meta-analysis of 9 prospective cohort studies with a total of 90,000 patients that evaluated maternal caffeine intake found that it was associated with increased low birth weight, intrauterine growth restriction (IUGR), or small for gestational age (SGA) infants.3
Researchers assessed caffeine consumption from coffee or other sources either by questionnaire (5 studies) or interview (4 studies) at various times during pregnancy, mostly in the first or second trimester, and assigned subjects to 4 intake categories: none, low (50-149 mg/d), moderate (150-349 mg/d), and high (>350 mg/d).
Compared with no caffeine, all levels of caffeine intake were associated with increased rates of low birth weight, IUGR, or SGA (low intake: relative risk [RR]=1.13; 95% CI, 1.06-1.21; moderate intake: RR=1.38; 95% CI, 1.18-1.62; high intake: RR=1.60; 95% CI, 1.24-2.08).
A major limitation of the meta-analysis was that 8 of the included studies were identified by the reviewers as having quality problems. The reviewers also identified additional cohort studies, not included in the meta-analysis, which failed to show any association between caffeine intake and poor pregnancy outcomes.
Results of best-quality study prove clinically trivial
The best-quality prospective cohort study in the review described above was also the largest, comprising two-thirds of the total patients. It found a statistically significant, but clinically trivial, association between caffeine intake and birth weight.4
Investigators from Norway’s Institute of Public Health mailed surveys to 106,707 pregnant Norwegian women and recruited 59,123 with uncomplicated singleton pregnancies. The survey assessed diet and lifestyle at several stages of pregnancy and correlated caffeine intake with birth weight, gestational length, and SGA deliveries. Investigators calculated caffeine intake from coffee and other dietary sources (tea and chocolate).
Higher caffeine intake was associated with a small reduction in birth weight (8 g/100 mg/d of additional caffeine intake; 95% CI, −10 to −6 g/100 mg/d). Higher intake was also associated with increasing likelihood of SGA birth, a finding of borderline significance (odds ratio [OR]=1.18; 95% CI, 1.00-1.38, comparing intake <50 mg/d with 51-200 mg/d; OR=1.62; 95% CI, 1.26-2.29, comparing <50 mg/d with 201-300 mg/d; and OR=1.62; 95% CI, 1.15-2.29, comparing <50 mg/d with >300 mg/d).
1. Jahanfar S, Jaafar SH. Effects of restricted caffeine intake by mother on fetal, neonatal and pregnancy outcome. Cochrane Database Syst Rev. 2013;(2):CD006965.
2. Bech BH, Obel C, Henriksen TB, et al. Effect of reducing caffeine intake on birth weight and length of gestation: randomised controlled trial. BMJ. 2007;334:409.
3. Chen LW, Wu Y, Neelakantan N, et al. Maternal caffeine intake during pregnancy is associated with risk of low birth weight: a systematic review and dose-response meta-analysis. BMC Medicine. 2014;12:174-176.
4. Sengpiel V, Elind E, Bacelis J, et al. Maternal caffeine intake during pregnancy is associated with birth weight but not with gestational length: results form a large prospective observational cohort trial. BMC Medicine. 2013;11:42.
Evidence-based answers from the Family Physicians Inquiries Network

Is lower BP worth it in higher-risk patients with diabetes or coronary disease?
There is no simple answer; the risk/benefit picture is complicated. Controlling blood pressure to a target of 130/80 mm Hg or lower produces mixed results in patients with diabetes and coronary disease equivalents (chronic kidney disease [CKD], coronary artery disease, peripheral arterial disease, and previous stroke).
No evidence indicates that patients with diabetes or most patients with CKD have better outcomes if their blood pressure is controlled below 140/90 mm Hg. Patients with diabetes controlled to lower systolic blood pressure targets (below 120 mm Hg) have fewer strokes, but more serious adverse events. Achieving diastolic blood pressure targets below 80 mm Hg doesn’t reduce mortality, strokes, myocardial infarction, or congestive heart failure (strength of recommendation [SOR]: A, systematic review of randomized controlled trials [RCTs]).
Tight blood pressure control (approximately 130/80 mm Hg or lower) reduces the risk of kidney failure by 27% in CKD patients with proteinuria at baseline. In patients without proteinuria, it doesn’t add benefit over standard blood pressure control (140/90 mm Hg) for reducing kidney failure, mortality, or cardiovascular events (SOR: A, meta-analysis of RCTs).
Controlling hypertension to 130/80 mm Hg or lower in patients with coronary artery disease reduces heart failure (27%) and stroke (18%) but increases the incidence of hypotensive episodes (220%) when compared with standard 140/90 mm Hg target blood pressure. Lower target pressures don’t affect total or cardiovascular mortality, myocardial infarction, or angina, but do increase the need for revascularization in 6% of patients (SOR: A, meta-analysis of RCTs).
Controlling systolic blood pressure to a target of 120 mm Hg, compared with the standard target of 140 mm Hg, reduces a composite outcome (myocardial infarction, acute coronary syndrome, stroke, congestive heart failure, or cardiovascular death) by 25% and a secondary outcome of all-cause mortality by 27% in patients ages 50 and older with cardiovascular risk factors (but not diabetes or previous stroke).
However, intensive control doesn’t significantly improve the composite outcome in patients who are female, black, or younger than 75 years, or who have systolic blood pressures above 132 mm Hg, previous CKD, or previous cardiovascular disease. Intensive control causes more hypotension, syncope, and electrolyte abnormalities, but not falls resulting in injuries (SOR: B, large RCT).
No evidence-based studies exist to guide BP control in patients with peripheral artery disease or previous stroke. Current guidelines recommend treating hypertension to a target of 140/90 mm Hg in these patients.
EVIDENCE SUMMARY
A Cochrane systematic review of 5 RCTs with a total of 7314 patients evaluated cardiovascular outcomes after 4.7 years follow-up in patients with diabetes who were treated for hypertension to either “lower” or “standard” target blood pressures.1 One trial in the review (ACCORD, 4734 patients) compared outcomes from significantly lower and standard systolic blood pressures (119/64 mm Hg vs 134/71 mm Hg; P<.0001) in patients with diabetes and either cardiovascular disease or 2 risk factors for cardiovascular disease. The authors evaluated outcomes based on achieved systolic blood pressures rather than intention to treat.
They found a reduced incidence of stroke (risk ratio [RR]=0.58; 95% confidence interval [CI], 0.39-0.88; P=.009; number needed to treat [NNT]=91) but no change in mortality (RR=1.05; 95% CI, 0.84-1.30) at lower blood pressures. Achieving the lower systolic blood pressure increased the number of serious adverse effects, however (RR=2.58; 95% CI, 1.70-3.91; P<.0001; absolute risk increase=2%; number needed to harm=50).
Four RCTs (2580 patients) in the systematic review compared clinical outcomes produced by achieving significantly lower or standard diastolic blood pressure targets (128/76 mm Hg vs 135/83 mm Hg; P<.0001). The trials found no significant difference in total mortality (RR=0.73; 95% CI, 0.53-1.01), stroke (RR=0.67; 95% CI, 0.42-1.05), myocardial infarction (RR=0.95; 95% CI, 0.64-1.40), or congestive heart failure (RR=1.06; 95% CI, 0.58-1.92). Sensitivity analysis of trials comparing diastolic blood pressure targets below 80 mm Hg and below 90 mm Hg showed similar results.
The 4 RCTs didn’t report end-stage renal failure or total serious adverse events. The authors stated that there was a high risk of selection bias in favor of lower blood pressure targets.
Patients with CKD
A systematic review and meta-analysis of 11 RCTs (9287 patients) compared outcomes of achieving lower blood pressure targets or standard targets in patients with CKD. Intensive blood pressure treatment reduced the risk of kidney failure only in patients with proteinuria at baseline (hazard ratio [HR]=0.73; 95% CI, 0.62-0.86; 5 trials, 1703 patients).2 Investigators didn’t report the degree of proteinuria for all the trials, but in one trial, patients had proteinuria of 1 to 3 g/d.
Achieved blood pressures in the intensive therapy group averaged 7.7/4.9 mm Hg lower, with pressures typically ranging from 75 to 80 mm Hg diastolic and 125 to 135 mm Hg systolic. Intensive blood pressure lowering didn’t reduce kidney failure in patients without baseline proteinuria (HR=1.12; 95% CI, 0.67-1.87; 3 trials, 1218 patients). Nor did it reduce death (RR=0.94; 95% CI, 0.84-1.05; 10 trials, 6788 patients) or major cardiovascular outcomes (RR=1.09; 95% CI, 0.83-1.42; 5 trials, 5308 patients).
Patients with coronary artery disease
A meta-analysis of 15 RCTs (66,504 patients) that evaluated tight control of hypertension (≤130/80 mm Hg) compared with standard control (<140/90 mm Hg) in patients with coronary artery disease found reduced rates of heart failure (RR=0.73; 95% CI, 0.64-0.84; 10 trials, 37,990 patients) and stroke (RR=0.82; 95% CI, 0.69-0.98; 9 trials, 8344 patients) but increased rates of hypotension (RR=2.19; 95% CI, 1.80-2.66; 6 trials, 17,836 patients).3
Achieving lower blood pressure targets didn’t reduce all-cause mortality (RR=0.96; 95% CI, 0.89-1.04; 13 trials, 39,262 patients), cardiovascular mortality (RR=0.96; 95% CI, 0.86-1.07; 11 trials, 38,452 patients), myocardial infarction (RR=0.92; 95% CI, 0.85-1.00; 14 trials, 39,696 patients), or angina (RR=0.92; 95% CI, 0.84-1.0; 11 trials, 28,007 patients). But it slightly increased the need for revascularization (RR=1.06; 95% CI, 1.01-1.12; 11 trials, 38,450 patients).
The SPRINT trial: Promising results for intensive treatment of some patients
The Systolic Blood Pressure Intervention Trial (SPRINT), a large RCT, found that targeting systolic blood pressures below 120 mm Hg (compared with a target below 140 mm Hg) in middle-aged and older patients with increased cardiovascular risk reduced a composite outcome that included cardiovascular death by 25%.4
Researchers recruited 9361 patients older than 50 years (mean age 68 years; >28% older than 75 years) with systolic blood pressure between 130 and 180 mm Hg and increased cardiovascular risk defined by one or more of the following: preexisting cardiovascular disease, CKD with estimated glomerular filtration rate between 20 and 60 mL/min/1.73 m2, age >75 years, and Framingham 10-year risk of 15% or more. They excluded patients with diabetes or previous stroke.
Patients were randomized to intensive treatment (target systolic BP <120; mean achieved 121.4) or standard treatment (target systolic BP <140; mean achieved 136.2). Treatment typically comprised 3 (intensive) or 2 (standard) agents. The primary outcome was a composite of myocardial infarction, acute coronary syndrome, stroke, congestive heart failure, or cardiovascular death.
The study, which was originally intended to run for 5 years, was stopped at 3.26 years based on positive results. Intensive treatment improved the primary composite outcome overall (1.65% vs 2.19%; HR=0.75; 95% CI, 0.64-0.89; P<.001; NNT=61 over 3.26 years), all-cause mortality (HR=0.73; 95% CI, 0.60-0.90; P=.003; NNT=90), and cardiovascular death (HR=0.57; 95% CI, 0.38-0.85; P=.005; NNT=172).
However, intensive treatment didn’t significantly improve the primary composite outcome in these subgroups:
- female patients (HR=0.84; 95% CI, 0.62-1.14)
- black patients (HR=0.77; 95% CI, 0.55-1.06)
- patients with preexisting CKD (HR=0.82; 95% CI, 0.63-1.07) or cardiovascular disease (HR=0.83; 95% CI, 0.62-1.09)
- patients younger than 75 years (HR=0.80; 95% CI, 0.64-1.00)
- patients with systolic blood pressures higher than 132 mm Hg (BP >132 to <145 mm Hg, HR=0.77; 95% CI, 0.57-1.03; BP ≥145 mm Hg, HR=0.83; 95% CI, 0.63-1.09).
Intensive treatment also produced more net serious adverse events (HR=1.88; 4.7% vs 2.5%; P<.001), including: ≥30% decrease of glomerular filtration rates to values below 60 mL/min/1.73 m2 (HR=3.49; 95% CI, 2.44-5.10; P<.001), syncope (HR=1.44; 3.5% vs 2.4%; P=.003), hypotension (HR=1.70; 3.4% vs 2.0%; P<.001), and electrolyte abnormalities (HR=1.38; 3.8% vs 2.8%; P=.006). It didn’t cause injurious falls (HR=1.00; P=.97) or orthostatic hypotension in clinic (HR=0.88; 16.6% vs 18.3%; P=.01).
Guidelines for patients with peripheral artery disease, previous stroke
A national guideline by an expert panel recommended treating patients with hypertension who have peripheral artery disease or previous stroke to standard values for the general population: <140/90 mm Hg if ages 60 years or younger, <150/90 mm Hg if older than 60 years.5
1. Arguedas JA, Leiva V, Wright JM. Blood pressure targets for hypertension in people with diabetes mellitus. Cochrane Database Syst Rev. 2013;(10):CD008277.
2. Lv J, Ehteshami P, Sarnak M, et al. Effects of intensive blood pressure lowering on the progression of chronic kidney disease: a systematic review and meta-analysis. CMAJ. 2013;185:949-957.
3. Bangalore S, Kumar S, Volodarskiy A, et al. Blood pressure targets in patients with coronary artery disease: observations from traditional and Bayesian random effects meta-analysis of randomised trials. Heart. 2013;99:601-613.
4. SPRINT Research Group, Wright JT, Williamson JD, Whelton PK, et al. A randomized trial of intensive versus standard blood-pressure control. N Engl J Med. 2015;373:2103-2116.
5. James PA, Oparil S, Carter BL, et al. 2014 evidence-based guideline for the management of high blood pressure in adults: report from the panel members appointed to the eighth Joint National Committee (JNC 8). JAMA. 2014;311:507-520.
There is no simple answer; the risk/benefit picture is complicated. Controlling blood pressure to a target of 130/80 mm Hg or lower produces mixed results in patients with diabetes and coronary disease equivalents (chronic kidney disease [CKD], coronary artery disease, peripheral arterial disease, and previous stroke).
No evidence indicates that patients with diabetes or most patients with CKD have better outcomes if their blood pressure is controlled below 140/90 mm Hg. Patients with diabetes controlled to lower systolic blood pressure targets (below 120 mm Hg) have fewer strokes, but more serious adverse events. Achieving diastolic blood pressure targets below 80 mm Hg doesn’t reduce mortality, strokes, myocardial infarction, or congestive heart failure (strength of recommendation [SOR]: A, systematic review of randomized controlled trials [RCTs]).
Tight blood pressure control (approximately 130/80 mm Hg or lower) reduces the risk of kidney failure by 27% in CKD patients with proteinuria at baseline. In patients without proteinuria, it doesn’t add benefit over standard blood pressure control (140/90 mm Hg) for reducing kidney failure, mortality, or cardiovascular events (SOR: A, meta-analysis of RCTs).
Controlling hypertension to 130/80 mm Hg or lower in patients with coronary artery disease reduces heart failure (27%) and stroke (18%) but increases the incidence of hypotensive episodes (220%) when compared with standard 140/90 mm Hg target blood pressure. Lower target pressures don’t affect total or cardiovascular mortality, myocardial infarction, or angina, but do increase the need for revascularization in 6% of patients (SOR: A, meta-analysis of RCTs).
Controlling systolic blood pressure to a target of 120 mm Hg, compared with the standard target of 140 mm Hg, reduces a composite outcome (myocardial infarction, acute coronary syndrome, stroke, congestive heart failure, or cardiovascular death) by 25% and a secondary outcome of all-cause mortality by 27% in patients ages 50 and older with cardiovascular risk factors (but not diabetes or previous stroke).
However, intensive control doesn’t significantly improve the composite outcome in patients who are female, black, or younger than 75 years, or who have systolic blood pressures above 132 mm Hg, previous CKD, or previous cardiovascular disease. Intensive control causes more hypotension, syncope, and electrolyte abnormalities, but not falls resulting in injuries (SOR: B, large RCT).
No evidence-based studies exist to guide BP control in patients with peripheral artery disease or previous stroke. Current guidelines recommend treating hypertension to a target of 140/90 mm Hg in these patients.
EVIDENCE SUMMARY
A Cochrane systematic review of 5 RCTs with a total of 7314 patients evaluated cardiovascular outcomes after 4.7 years follow-up in patients with diabetes who were treated for hypertension to either “lower” or “standard” target blood pressures.1 One trial in the review (ACCORD, 4734 patients) compared outcomes from significantly lower and standard systolic blood pressures (119/64 mm Hg vs 134/71 mm Hg; P<.0001) in patients with diabetes and either cardiovascular disease or 2 risk factors for cardiovascular disease. The authors evaluated outcomes based on achieved systolic blood pressures rather than intention to treat.
They found a reduced incidence of stroke (risk ratio [RR]=0.58; 95% confidence interval [CI], 0.39-0.88; P=.009; number needed to treat [NNT]=91) but no change in mortality (RR=1.05; 95% CI, 0.84-1.30) at lower blood pressures. Achieving the lower systolic blood pressure increased the number of serious adverse effects, however (RR=2.58; 95% CI, 1.70-3.91; P<.0001; absolute risk increase=2%; number needed to harm=50).
Four RCTs (2580 patients) in the systematic review compared clinical outcomes produced by achieving significantly lower or standard diastolic blood pressure targets (128/76 mm Hg vs 135/83 mm Hg; P<.0001). The trials found no significant difference in total mortality (RR=0.73; 95% CI, 0.53-1.01), stroke (RR=0.67; 95% CI, 0.42-1.05), myocardial infarction (RR=0.95; 95% CI, 0.64-1.40), or congestive heart failure (RR=1.06; 95% CI, 0.58-1.92). Sensitivity analysis of trials comparing diastolic blood pressure targets below 80 mm Hg and below 90 mm Hg showed similar results.
The 4 RCTs didn’t report end-stage renal failure or total serious adverse events. The authors stated that there was a high risk of selection bias in favor of lower blood pressure targets.
Patients with CKD
A systematic review and meta-analysis of 11 RCTs (9287 patients) compared outcomes of achieving lower blood pressure targets or standard targets in patients with CKD. Intensive blood pressure treatment reduced the risk of kidney failure only in patients with proteinuria at baseline (hazard ratio [HR]=0.73; 95% CI, 0.62-0.86; 5 trials, 1703 patients).2 Investigators didn’t report the degree of proteinuria for all the trials, but in one trial, patients had proteinuria of 1 to 3 g/d.
Achieved blood pressures in the intensive therapy group averaged 7.7/4.9 mm Hg lower, with pressures typically ranging from 75 to 80 mm Hg diastolic and 125 to 135 mm Hg systolic. Intensive blood pressure lowering didn’t reduce kidney failure in patients without baseline proteinuria (HR=1.12; 95% CI, 0.67-1.87; 3 trials, 1218 patients). Nor did it reduce death (RR=0.94; 95% CI, 0.84-1.05; 10 trials, 6788 patients) or major cardiovascular outcomes (RR=1.09; 95% CI, 0.83-1.42; 5 trials, 5308 patients).
Patients with coronary artery disease
A meta-analysis of 15 RCTs (66,504 patients) that evaluated tight control of hypertension (≤130/80 mm Hg) compared with standard control (<140/90 mm Hg) in patients with coronary artery disease found reduced rates of heart failure (RR=0.73; 95% CI, 0.64-0.84; 10 trials, 37,990 patients) and stroke (RR=0.82; 95% CI, 0.69-0.98; 9 trials, 8344 patients) but increased rates of hypotension (RR=2.19; 95% CI, 1.80-2.66; 6 trials, 17,836 patients).3
Achieving lower blood pressure targets didn’t reduce all-cause mortality (RR=0.96; 95% CI, 0.89-1.04; 13 trials, 39,262 patients), cardiovascular mortality (RR=0.96; 95% CI, 0.86-1.07; 11 trials, 38,452 patients), myocardial infarction (RR=0.92; 95% CI, 0.85-1.00; 14 trials, 39,696 patients), or angina (RR=0.92; 95% CI, 0.84-1.0; 11 trials, 28,007 patients). But it slightly increased the need for revascularization (RR=1.06; 95% CI, 1.01-1.12; 11 trials, 38,450 patients).
The SPRINT trial: Promising results for intensive treatment of some patients
The Systolic Blood Pressure Intervention Trial (SPRINT), a large RCT, found that targeting systolic blood pressures below 120 mm Hg (compared with a target below 140 mm Hg) in middle-aged and older patients with increased cardiovascular risk reduced a composite outcome that included cardiovascular death by 25%.4
Researchers recruited 9361 patients older than 50 years (mean age 68 years; >28% older than 75 years) with systolic blood pressure between 130 and 180 mm Hg and increased cardiovascular risk defined by one or more of the following: preexisting cardiovascular disease, CKD with estimated glomerular filtration rate between 20 and 60 mL/min/1.73 m2, age >75 years, and Framingham 10-year risk of 15% or more. They excluded patients with diabetes or previous stroke.
Patients were randomized to intensive treatment (target systolic BP <120; mean achieved 121.4) or standard treatment (target systolic BP <140; mean achieved 136.2). Treatment typically comprised 3 (intensive) or 2 (standard) agents. The primary outcome was a composite of myocardial infarction, acute coronary syndrome, stroke, congestive heart failure, or cardiovascular death.
The study, which was originally intended to run for 5 years, was stopped at 3.26 years based on positive results. Intensive treatment improved the primary composite outcome overall (1.65% vs 2.19%; HR=0.75; 95% CI, 0.64-0.89; P<.001; NNT=61 over 3.26 years), all-cause mortality (HR=0.73; 95% CI, 0.60-0.90; P=.003; NNT=90), and cardiovascular death (HR=0.57; 95% CI, 0.38-0.85; P=.005; NNT=172).
However, intensive treatment didn’t significantly improve the primary composite outcome in these subgroups:
- female patients (HR=0.84; 95% CI, 0.62-1.14)
- black patients (HR=0.77; 95% CI, 0.55-1.06)
- patients with preexisting CKD (HR=0.82; 95% CI, 0.63-1.07) or cardiovascular disease (HR=0.83; 95% CI, 0.62-1.09)
- patients younger than 75 years (HR=0.80; 95% CI, 0.64-1.00)
- patients with systolic blood pressures higher than 132 mm Hg (BP >132 to <145 mm Hg, HR=0.77; 95% CI, 0.57-1.03; BP ≥145 mm Hg, HR=0.83; 95% CI, 0.63-1.09).
Intensive treatment also produced more net serious adverse events (HR=1.88; 4.7% vs 2.5%; P<.001), including: ≥30% decrease of glomerular filtration rates to values below 60 mL/min/1.73 m2 (HR=3.49; 95% CI, 2.44-5.10; P<.001), syncope (HR=1.44; 3.5% vs 2.4%; P=.003), hypotension (HR=1.70; 3.4% vs 2.0%; P<.001), and electrolyte abnormalities (HR=1.38; 3.8% vs 2.8%; P=.006). It didn’t cause injurious falls (HR=1.00; P=.97) or orthostatic hypotension in clinic (HR=0.88; 16.6% vs 18.3%; P=.01).
Guidelines for patients with peripheral artery disease, previous stroke
A national guideline by an expert panel recommended treating patients with hypertension who have peripheral artery disease or previous stroke to standard values for the general population: <140/90 mm Hg if ages 60 years or younger, <150/90 mm Hg if older than 60 years.5
1. Arguedas JA, Leiva V, Wright JM. Blood pressure targets for hypertension in people with diabetes mellitus. Cochrane Database Syst Rev. 2013;(10):CD008277.
2. Lv J, Ehteshami P, Sarnak M, et al. Effects of intensive blood pressure lowering on the progression of chronic kidney disease: a systematic review and meta-analysis. CMAJ. 2013;185:949-957.
3. Bangalore S, Kumar S, Volodarskiy A, et al. Blood pressure targets in patients with coronary artery disease: observations from traditional and Bayesian random effects meta-analysis of randomised trials. Heart. 2013;99:601-613.
4. SPRINT Research Group, Wright JT, Williamson JD, Whelton PK, et al. A randomized trial of intensive versus standard blood-pressure control. N Engl J Med. 2015;373:2103-2116.
5. James PA, Oparil S, Carter BL, et al. 2014 evidence-based guideline for the management of high blood pressure in adults: report from the panel members appointed to the eighth Joint National Committee (JNC 8). JAMA. 2014;311:507-520.
Evidence-based answers from the Family Physicians Inquiries Network

Does high dietary soy intake affect a woman’s risk of primary or recurrent breast cancer?
No, it doesn’t affect the risk of primary breast cancer, but it does (favorably) affect the risk of cancer recurrence.
Compared with diets low in soy, high dietary intake of soy protein or soy isoflavones isn’t associated with any alteration in the risk of developing primary breast cancer (strength of recommendation [SOR]: B, systematic review of prospective cohort studies). In patients with breast cancer, however, consuming a diet high in soy is associated with a 25% decrease in cancer recurrence and a 15% decrease in mortality (SOR: B, prospective cohort studies).
EVIDENCE SUMMARY
A large systematic review evaluated the relationship between dietary soy intake and risk of a primary breast cancer diagnosis. It included 7 prospective cohort studies, which comprised the best quality evidence available (numerous other reviewed studies were of lower quality). The review found no significant association between dietary soy intake and primary breast cancer (TABLE1-6).
Investigators either surveyed women for intake of soy isoflavones or soy foods or products (tofu, soybeans, lentils, miso) or measured urinary or plasma levels of soy isoflavones. They adjusted for age, alcohol use, smoking status, body mass index, caloric intake, and hormone replacement therapy, then followed subjects for 7 to 23 years, comparing the risk of breast cancer for the lowest and highest levels of soy intake.
Six of the prospective cohort studies found no association between soy intake and breast cancer risk; one study, comprising 4% of the total population, found a lower risk with higher soy intake (effect size=0.44; 95% confidence interval [CI], 0.26-0.73; an effect size of 0.2 is considered small, 0.6 medium, and 1.2 large). The authors didn’t do a meta-analysis of the prospective cohort studies.
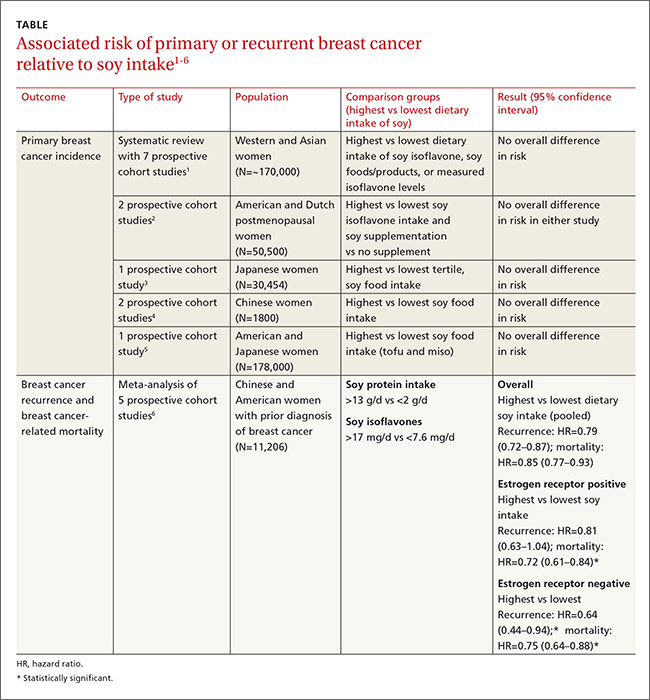
Other cohort studies yield similar findings
Four other large systematic reviews evaluating soy intake and breast cancer risk incorporated a total of 6 individual prospective cohort studies that weren’t included in the previously described review (again, these studies comprised the best quality evidence within the reviews). The 6 studies found no association between soy intake and breast cancer risk.
In 2 of the studies, investigators surveyed postmenopausal women and followed them for 4 to 8 years.2 Investigators in another study adjusted for age, family and gynecologic history, hormone and medication use, exercise, and other factors.3 In 2 other studies, investigators evaluated population subsets that consumed the most vs the fewest servings per week or kilograms per year of soy foods.4 The sixth study compared low with high intake of soy foods and miso.5
Soy intake after breast cancer diagnosis reduces recurrence risk in most studies
Most prospective cohort studies evaluating the association between dietary soy intake after breast cancer diagnosis found an overall 21% decrease in recurrence with high soy intake and a 15% reduction in mortality (TABLE1-6).
Investigators in a meta-analysis of 5 studies that followed women for 4 to 7 years after first breast cancer diagnosis found that higher soy intake was associated with lower mortality but not less recurrence in women who were estrogen receptor positive. Both recurrence and mortality were decreased in estrogen receptor negative women.6
The study also found lower recurrence and mortality in premenopausal women with higher soy intake (recurrence hazard ratio [HR]=0.91; 95% CI, 0.72-1.14; mortality HR=0.78; 95% CI, 0.69-0.88). In postmenopausal women, higher intake was likewise associated with improvement of both outcomes (recurrence HR=0.67; 95% CI, 0.56-0.80; mortality HR=0.81; 95% CI, 0.73-0.91).
An earlier meta-analysis of 4 prospective cohort studies, 2 of which were not included above, also found reduced risk of breast cancer recurrence in groups with high vs low soy isoflavone intake (HR=0.84; 95% CI, 0.70-0.99).7 Women taking tamoxifen showed no difference in mortality or recurrence risk associated with soy intake.
An additional small prospective cohort study (n=256) found similar reductions in recurrence and mortality associated with higher consumption of soy protein.8
1. Chen M, Rao Y, Zheng Y, et al. Association between soy isoflavone intake and breast cancer risk for pre- and post-menopausal women: a meta-analysis of epidemiological studies. PLoS One. 2014;9:e89288.
2. Fritz H, Seely D, Flower G, et al. Soy, red clover, and isoflavones and breast cancer: a systematic review. PLoS One. 2013;8:e81968.
3. Nagata C, Mizoue T, Tanaka K, et al. Soy intake and breast cancer risk: an evaluation based on a systematic review of epidemiologic evidence among the Japanese population. Jpn J Clin Oncol. 2014;44:282–295.
4. Liu XO, Huang YB, Gao Y, et al. Association between dietary factors and breast cancer risk among Chinese females: systematic review and meta-analysis. Asian Pac J Cancer Prev. 2014;15:1291–1298.
5. Qin LQ, Xu JY, Wang PY, et al. Soyfood intake in the prevention of breast cancer risk in women: a meta-analysis of observational epidemiological studies. J Nutr Sci Vitaminol (Tokyo). 2006;52:428–436.
6. Chi F, Wu R, Zeng YC, et al. Post-diagnosis soy food intake and breast cancer survival: a meta-analysis of cohort studies. Asian Pac J Cancer Prev. 2013;14:2407–2412.
7. Dong JY, Qin LQ. Soy isoflavones consumption and risk of breast cancer incidence or recurrence: a meta-analysis of prospective studies. Breast Cancer Res Treat. 2011;125:315-323.
8. Kang HB, Zhang YF, Yang JD, et al. Study on soy isoflavone consumption and risk of breast cancer and survival. Asian Pac J Cancer Prev. 2012;13:995–998.
No, it doesn’t affect the risk of primary breast cancer, but it does (favorably) affect the risk of cancer recurrence.
Compared with diets low in soy, high dietary intake of soy protein or soy isoflavones isn’t associated with any alteration in the risk of developing primary breast cancer (strength of recommendation [SOR]: B, systematic review of prospective cohort studies). In patients with breast cancer, however, consuming a diet high in soy is associated with a 25% decrease in cancer recurrence and a 15% decrease in mortality (SOR: B, prospective cohort studies).
EVIDENCE SUMMARY
A large systematic review evaluated the relationship between dietary soy intake and risk of a primary breast cancer diagnosis. It included 7 prospective cohort studies, which comprised the best quality evidence available (numerous other reviewed studies were of lower quality). The review found no significant association between dietary soy intake and primary breast cancer (TABLE1-6).
Investigators either surveyed women for intake of soy isoflavones or soy foods or products (tofu, soybeans, lentils, miso) or measured urinary or plasma levels of soy isoflavones. They adjusted for age, alcohol use, smoking status, body mass index, caloric intake, and hormone replacement therapy, then followed subjects for 7 to 23 years, comparing the risk of breast cancer for the lowest and highest levels of soy intake.
Six of the prospective cohort studies found no association between soy intake and breast cancer risk; one study, comprising 4% of the total population, found a lower risk with higher soy intake (effect size=0.44; 95% confidence interval [CI], 0.26-0.73; an effect size of 0.2 is considered small, 0.6 medium, and 1.2 large). The authors didn’t do a meta-analysis of the prospective cohort studies.
Other cohort studies yield similar findings
Four other large systematic reviews evaluating soy intake and breast cancer risk incorporated a total of 6 individual prospective cohort studies that weren’t included in the previously described review (again, these studies comprised the best quality evidence within the reviews). The 6 studies found no association between soy intake and breast cancer risk.
In 2 of the studies, investigators surveyed postmenopausal women and followed them for 4 to 8 years.2 Investigators in another study adjusted for age, family and gynecologic history, hormone and medication use, exercise, and other factors.3 In 2 other studies, investigators evaluated population subsets that consumed the most vs the fewest servings per week or kilograms per year of soy foods.4 The sixth study compared low with high intake of soy foods and miso.5
Soy intake after breast cancer diagnosis reduces recurrence risk in most studies
Most prospective cohort studies evaluating the association between dietary soy intake after breast cancer diagnosis found an overall 21% decrease in recurrence with high soy intake and a 15% reduction in mortality (TABLE1-6).
Investigators in a meta-analysis of 5 studies that followed women for 4 to 7 years after first breast cancer diagnosis found that higher soy intake was associated with lower mortality but not less recurrence in women who were estrogen receptor positive. Both recurrence and mortality were decreased in estrogen receptor negative women.6
The study also found lower recurrence and mortality in premenopausal women with higher soy intake (recurrence hazard ratio [HR]=0.91; 95% CI, 0.72-1.14; mortality HR=0.78; 95% CI, 0.69-0.88). In postmenopausal women, higher intake was likewise associated with improvement of both outcomes (recurrence HR=0.67; 95% CI, 0.56-0.80; mortality HR=0.81; 95% CI, 0.73-0.91).
An earlier meta-analysis of 4 prospective cohort studies, 2 of which were not included above, also found reduced risk of breast cancer recurrence in groups with high vs low soy isoflavone intake (HR=0.84; 95% CI, 0.70-0.99).7 Women taking tamoxifen showed no difference in mortality or recurrence risk associated with soy intake.
An additional small prospective cohort study (n=256) found similar reductions in recurrence and mortality associated with higher consumption of soy protein.8
1. Chen M, Rao Y, Zheng Y, et al. Association between soy isoflavone intake and breast cancer risk for pre- and post-menopausal women: a meta-analysis of epidemiological studies. PLoS One. 2014;9:e89288.
2. Fritz H, Seely D, Flower G, et al. Soy, red clover, and isoflavones and breast cancer: a systematic review. PLoS One. 2013;8:e81968.
3. Nagata C, Mizoue T, Tanaka K, et al. Soy intake and breast cancer risk: an evaluation based on a systematic review of epidemiologic evidence among the Japanese population. Jpn J Clin Oncol. 2014;44:282–295.
4. Liu XO, Huang YB, Gao Y, et al. Association between dietary factors and breast cancer risk among Chinese females: systematic review and meta-analysis. Asian Pac J Cancer Prev. 2014;15:1291–1298.
5. Qin LQ, Xu JY, Wang PY, et al. Soyfood intake in the prevention of breast cancer risk in women: a meta-analysis of observational epidemiological studies. J Nutr Sci Vitaminol (Tokyo). 2006;52:428–436.
6. Chi F, Wu R, Zeng YC, et al. Post-diagnosis soy food intake and breast cancer survival: a meta-analysis of cohort studies. Asian Pac J Cancer Prev. 2013;14:2407–2412.
7. Dong JY, Qin LQ. Soy isoflavones consumption and risk of breast cancer incidence or recurrence: a meta-analysis of prospective studies. Breast Cancer Res Treat. 2011;125:315-323.
8. Kang HB, Zhang YF, Yang JD, et al. Study on soy isoflavone consumption and risk of breast cancer and survival. Asian Pac J Cancer Prev. 2012;13:995–998.
Evidence-based answers from the Family Physicians Inquiries Network

Does qHPV vaccine prevent anal intraepithelial neoplasia and condylomata in men?
Yes. Quadrivalent human papillomavirus (qHPV) vaccine reduces rates of anal intraepithelial neoplasia (AIN) by 50% to 54%, and persistent anal infection by 59%, associated with the 4 types of HPV in the vaccine (6, 11, 16, and 18) in young men who have sex with men (MSM); it also reduces external genital lesions by 66%, and persistent HPV infection associated with the same 4 HPV types by 48 to 59% in all young men, heterosexual men,and MSM (strength of recommendation [SOR]: B, randomized, placebo-controlled trials [RCTs]).
In addition, the vaccine is associated with a 50% to 55% decrease in recurrent high-grade AIN and anogenital condylomatain older MSM (SOR: B, cohort studies).
EVIDENCE SUMMARY
Two RCTs that evaluated qHPV in young men for preventing outcomes associated with the 4 HPV subtypes in the vaccine (6, 11, 16, and 18) found that it reduced them by 50% to 66% using an intention-to-treat protocol (TABLE1-4).
Vaccination reduces AIN and persistent infection in MSM
The first RCT evaluated a subset of 602 MSM from the second, larger RCT for preventing AIN and persistent HPV infection.1 The intention-to-treat population included men with 5 or fewer lifetime sexual partners who had engaged in insertive or receptive anal intercourse or oral sex within the last year, were not necessarily HPV-negative at enrollment, and received at least one dose of vaccine (or placebo).
The vaccine reduced AIN associated with the 4 HPV types (6.3 vs 12.6 events per 100 person-years; relative risk reduction [RRR]=50.3%; 95% confidence interval [CI], 25.7-67.2; number needed to treat [NNT]=16 to prevent one AIN case per year) and with HPV of any type (13 vs 17.5 events per 100 person-years; RRR=25.7%; 95% CI, -1.1 to 45.6). It also reduced the rate of persistent HPV infection with the 4 HPV vaccine subtypes (8.8 vs 21.6 events per 100 person-years; RRR=59.4%; 95% CI, 43%-71%; NNT=8 to prevent one persistent HPV infection per year).
Investigators in the study also evaluated vaccine efficacy in a smaller subset (194 men) using per-protocol analysis and found higher prevention rates (78% for AIN due to HPV types 6, 11, 16, and 18). Investigators followed these subjects every 6 months for 36 months with polymerase chain reaction testing for HPV DNA, high-resolution anoscopy with anal cytology, and anal biopsy and histology if there were atypia.
The vaccine decreases persistent HPV infection and external genital lesions
The second RCT, including both MSM and heterosexual men, found that qHPV vaccine reduced rates of persistent HPV infection by 48%, and external genital lesions (condylomata or intraepithelial neoplasia involving the penis, perineum, or perianal area) by 66% associated with HPV types 6, 11, 16, and 18 using the intention-to-treat protocol.2
Investigators used the same protocols used in the first RCT, and the per-protocol population again had higher prevention rates (84% for any HPV type, 90% against the 4 vaccine types). The only adverse effect of the vaccine was injection site pain (57% vs 51% with placebo; P<.001).
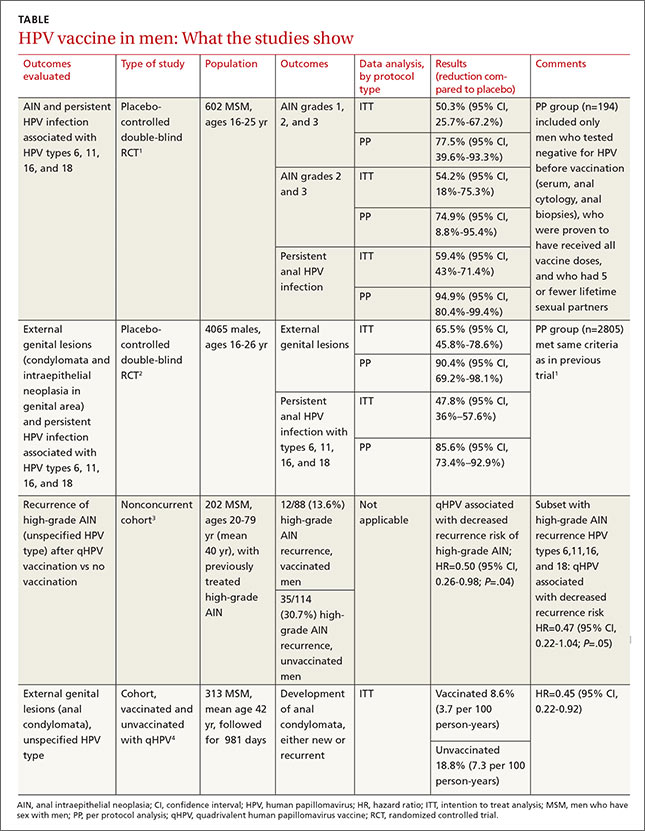
The vaccine also helps older MSM
A nonconcurrent cohort study that evaluated qHPV vaccination among older MSM with previously treated high-grade AIN found a 50% decrease in recurrence rates in the 2 years after vaccination.3 Investigators recruited HIV-negative men, some of whom chose vaccination (not randomized), and followed them for 2 years. Study limitations included using medical records for data collection and the predominance of white, nonsmoking men with private insurance.
A post-hoc analysis of older men without previous anal condylomata (210 men) or with treated condylomata and no recurrence in the year before vaccination (103 men) found that qHPV vaccination was associated with 55% lower rates of anal condylomata.4
RECOMMENDATIONS
The Centers for Disease Control and Prevention’s Advisory Committee on Immunization Practices recommends routine use of qHPV vaccine in males ages 11 through 21 years, and optional use in unvaccinated men as old as 26 years.5
1. Palefsky JM, Giuliano AR, Goldstone S, et al. HPV vaccine against anal HPV infection and anal intraepithelial neoplasia. N Engl J Med. 2011;365:1576-1585.
2. Giuliano AR, Palefsky JM, Goldstone S, et al. Efficacy of quadrivalent HPV vaccine against HPV infection and disease in males. N Engl J Med. 2011;364:401-411.
3. Swedish KA, Factor SH, Goldstone SE. Prevention of recurrent high-grade anal neoplasia with quadrivalent human papillomavirus vaccination of men who have sex with men: a nonconcurrent cohort study. Clin Infect Dis. 2012;54:891-898.
4. Swedish KA, Goldstone SE. Prevention of anal condyloma with quadrivalent human papillomavirus vaccination of older men who have sex with men. PLoS One. 2014;9:e93393.
5. Markowitz LE, Dunne EF, Saraiya M, et al. Human papillomavirus vaccination: recommendations of the Advisory Committee on Immunization Practices (ACIP). MMWR Recomm Rep. 2014;63(RR-05):1-30.
Yes. Quadrivalent human papillomavirus (qHPV) vaccine reduces rates of anal intraepithelial neoplasia (AIN) by 50% to 54%, and persistent anal infection by 59%, associated with the 4 types of HPV in the vaccine (6, 11, 16, and 18) in young men who have sex with men (MSM); it also reduces external genital lesions by 66%, and persistent HPV infection associated with the same 4 HPV types by 48 to 59% in all young men, heterosexual men,and MSM (strength of recommendation [SOR]: B, randomized, placebo-controlled trials [RCTs]).
In addition, the vaccine is associated with a 50% to 55% decrease in recurrent high-grade AIN and anogenital condylomatain older MSM (SOR: B, cohort studies).
EVIDENCE SUMMARY
Two RCTs that evaluated qHPV in young men for preventing outcomes associated with the 4 HPV subtypes in the vaccine (6, 11, 16, and 18) found that it reduced them by 50% to 66% using an intention-to-treat protocol (TABLE1-4).
Vaccination reduces AIN and persistent infection in MSM
The first RCT evaluated a subset of 602 MSM from the second, larger RCT for preventing AIN and persistent HPV infection.1 The intention-to-treat population included men with 5 or fewer lifetime sexual partners who had engaged in insertive or receptive anal intercourse or oral sex within the last year, were not necessarily HPV-negative at enrollment, and received at least one dose of vaccine (or placebo).
The vaccine reduced AIN associated with the 4 HPV types (6.3 vs 12.6 events per 100 person-years; relative risk reduction [RRR]=50.3%; 95% confidence interval [CI], 25.7-67.2; number needed to treat [NNT]=16 to prevent one AIN case per year) and with HPV of any type (13 vs 17.5 events per 100 person-years; RRR=25.7%; 95% CI, -1.1 to 45.6). It also reduced the rate of persistent HPV infection with the 4 HPV vaccine subtypes (8.8 vs 21.6 events per 100 person-years; RRR=59.4%; 95% CI, 43%-71%; NNT=8 to prevent one persistent HPV infection per year).
Investigators in the study also evaluated vaccine efficacy in a smaller subset (194 men) using per-protocol analysis and found higher prevention rates (78% for AIN due to HPV types 6, 11, 16, and 18). Investigators followed these subjects every 6 months for 36 months with polymerase chain reaction testing for HPV DNA, high-resolution anoscopy with anal cytology, and anal biopsy and histology if there were atypia.
The vaccine decreases persistent HPV infection and external genital lesions
The second RCT, including both MSM and heterosexual men, found that qHPV vaccine reduced rates of persistent HPV infection by 48%, and external genital lesions (condylomata or intraepithelial neoplasia involving the penis, perineum, or perianal area) by 66% associated with HPV types 6, 11, 16, and 18 using the intention-to-treat protocol.2
Investigators used the same protocols used in the first RCT, and the per-protocol population again had higher prevention rates (84% for any HPV type, 90% against the 4 vaccine types). The only adverse effect of the vaccine was injection site pain (57% vs 51% with placebo; P<.001).
The vaccine also helps older MSM
A nonconcurrent cohort study that evaluated qHPV vaccination among older MSM with previously treated high-grade AIN found a 50% decrease in recurrence rates in the 2 years after vaccination.3 Investigators recruited HIV-negative men, some of whom chose vaccination (not randomized), and followed them for 2 years. Study limitations included using medical records for data collection and the predominance of white, nonsmoking men with private insurance.
A post-hoc analysis of older men without previous anal condylomata (210 men) or with treated condylomata and no recurrence in the year before vaccination (103 men) found that qHPV vaccination was associated with 55% lower rates of anal condylomata.4
RECOMMENDATIONS
The Centers for Disease Control and Prevention’s Advisory Committee on Immunization Practices recommends routine use of qHPV vaccine in males ages 11 through 21 years, and optional use in unvaccinated men as old as 26 years.5
1. Palefsky JM, Giuliano AR, Goldstone S, et al. HPV vaccine against anal HPV infection and anal intraepithelial neoplasia. N Engl J Med. 2011;365:1576-1585.
2. Giuliano AR, Palefsky JM, Goldstone S, et al. Efficacy of quadrivalent HPV vaccine against HPV infection and disease in males. N Engl J Med. 2011;364:401-411.
3. Swedish KA, Factor SH, Goldstone SE. Prevention of recurrent high-grade anal neoplasia with quadrivalent human papillomavirus vaccination of men who have sex with men: a nonconcurrent cohort study. Clin Infect Dis. 2012;54:891-898.
4. Swedish KA, Goldstone SE. Prevention of anal condyloma with quadrivalent human papillomavirus vaccination of older men who have sex with men. PLoS One. 2014;9:e93393.
5. Markowitz LE, Dunne EF, Saraiya M, et al. Human papillomavirus vaccination: recommendations of the Advisory Committee on Immunization Practices (ACIP). MMWR Recomm Rep. 2014;63(RR-05):1-30.
Evidence-based answers from the Family Physicians Inquiries Network