User login
Does Patient Experience Predict 30-Day Readmission? A Patient-Level Analysis of HCAHPS Data
Patient experience and 30-day readmission are important measures of quality of care for hospitalized patients. Performance on both of these measures impact hospitals financially. Performance on the Hospital Consumer Assessment of Healthcare Systems and Providers (HCAHPS) survey is linked to 25% of the incentive payment under Value Based Purchasing (VBP) Program.1 Starting in 2012, the Centers for Medicare and Medicaid Services (CMS) introduced the Readmission Reduction Program, penalizing hospitals financially for excessive readmissions.2
A relationship between patient experience and readmissions has been explored at the hospital level. Studies have mostly found that higher patient experience scores are associated with lower 30-day readmission rates. In a study of the relationship between 30-day risk-standardized readmission rates for three medical conditions (acute myocardial infarction, heart failure, and pneumonia) and patient experience, the authors noted that higher experience scores for overall care and discharge planning were associated with lower readmission rates for these conditions. They also concluded that patient experience scores were more predictive of 30-day readmission than clinical performance measures. Additionally, the authors predicted that if a hospital increased its total experience scores from the 25th percentile to the 75th percentile, there would be an associated decrease in readmissions by at least 2.3% for each of these conditions.3 Practice management companies and the media have cited this finding to conclude that higher patient experience drives clinical outcomes such as 30-day readmission and that patients are often the best judges of the quality of care delivered.4,5
Other hospital-level studies have found that high 30-day readmission rates are associated with lower overall experience scores in a mixed surgical patient population; worse reports of pain control and overall care in the colorectal surgery population; lower experience scores with discharge preparedness in vascular surgery patients; and lower experience scores with physician communication, nurse communication, and discharge preparedness.6-9 A patient-level study noted higher readmissions are associated with worse experience with physician and nursing communication along with a paradoxically better experience with discharge information.10
Because these studies used an observational design, they demonstrated associations rather than causality. An alternative hypothesis is that readmitted patients complete their patient experience survey after readmission and the low experience is the result, rather than the cause, of their readmission. For patients who are readmitted, it is unclear whether there is an opportunity to complete the survey prior to readmission and whether being readmitted may impact patient perception of quality of care. Using patient-level data, we sought to assess HCAHPS patient-experience responses linked to the index admission of the patients who were readmitted in 30 days and compare it with those patients who were not readmitted during this time period. We paid particular attention to when the surveys were returned.
METHODS
Study Design
We conducted a retrospective analysis of prospectively collected 10-year HCAHPS and Press Ganey patient survey data for a single tertiary care academic hospital.
Participants
All adult patients discharged from the hospital and who responded to the routinely sent patient-experience survey were included. Surveys were sent to a random sample of 50% of the discharged patients.
The exposure group was comprised of patients who responded to the survey and were readmitted within 30 days of discharge. After subtracting 5 days from the survey receipt date for expected delays related to mail delivery time and processing time, survey response date was calculated. The exposure group was further divided into patients who responded to the survey prior to their 30-day readmission (“Pre-readmission responders”) and those that responded to the survey after their readmission (“Postreadmission responders”). A sensitivity analysis was performed by changing the number of days subtracted from the survey receipt date by 2 days in either direction. This approach did not result in any significant changes in the results.
The control group comprised patients who were not readmitted to the hospital within 30 days of discharge and who did not have an admission in the previous 30 days as well (“Not readmitted” group). An additional comparison group for exploratory analysis included patients who had experienced an admission in the prior 30 days but were not readmitted after the admission linked to the survey. These patients responded to the patient-experience surveys that were linked to their second admission in 30 days (“2nd-admission responders” group; Figure).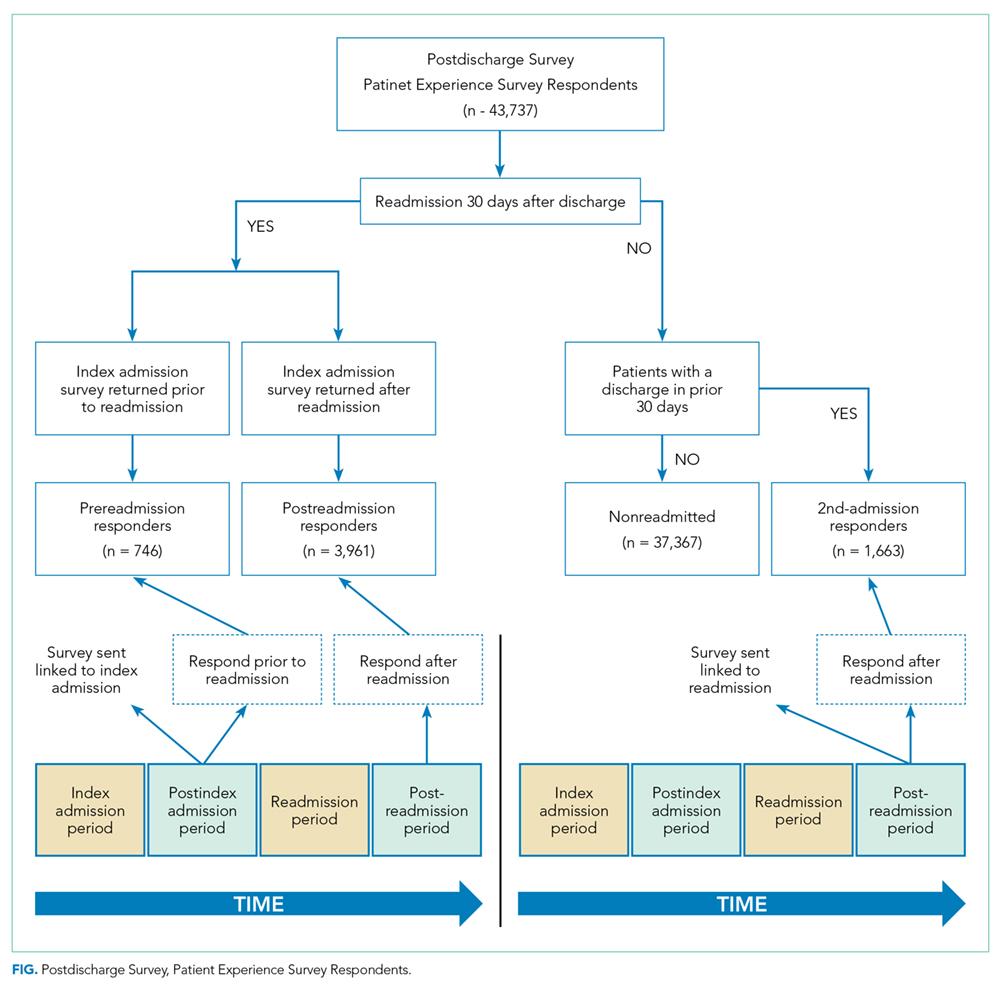
Time Periods
All survey responders from the third quarter of 2006 to the first quarter of 2016 were included in the study. Additionally, administrative data on non-responders were available from 7/2006 to 8/2012. These data were used to estimate response rates. Patient level experience and administrative data were obtained in a linked fashion for these time periods.
Instruments
Press Ganey and HCAHPS surveys were sent via mail in the same envelope. Fifty percent of the discharged patients were randomized to receive the surveys. The Press Ganey survey contained 33 items encompassing several subdomains, including room, meal, nursing, physician, ancillary staff, visitor, discharge, and overall experience.
The HCAHPS survey contained 29 CMS-mandated items, of which 21 are related to patient experience. The development, testing, and methods for administration and reporting of the HCAHPS survey have been previously described and studies using this instrument have been reported in the literature.11 Press Ganey patient satisfaction survey results have also been reported in the literature.12
Outcome Variables and Covariates
HCAHPS and Press Ganey experience survey individual item responses were the primary outcome variables of this study. Age, self-reported health status, education, primary language spoken, service line, and time taken to respond to the surveys served as the covariates. These variables are used by CMS for patient-mix adjustment and are collected on the HCAHPS survey. Additionally, the number of days to respond to the survey were included in all regression analysis to adjust for early responder effect.13-15
Statistical Analysis
“Percent top-box” scores were calculated for each survey item for patients in each group. The percent top-box scores were calculated as the percent of patients who responded “very good” for a given item on Press Ganey survey items and “always” or “definitely yes” or “yes” or “9” or “10” on HCAHPS survey items. CMS utilizes “percent top-box scores” to calculate payments under the VBP program and to report the results publicly. Numerous studies have also reported percent top-box scores for HCAHPS survey results.12
We hypothesized that whether patients complete the HCAHPS survey before or after the readmission influences their reporting of experience. To test this hypothesis, HCAHPS and Press Ganey item top-box scores of “Pre-readmission responders” and “Postreadmission responders” were compared with those of the control group using multivariate logistic regression. “Pre-readmission responders” were also compared with “Postreadmission responders”.
“2nd-admission responders” were similarly compared with the control group for an exploratory analysis. Finally, “Postreadmission responders” and “2nd-admission responders” were compared in another exploratory analysis since both these groups responded to the survey after being exposed to the readmission, even though the “Postreadmission responders” group is administratively linked to the index admission.
The Johns Hopkins Institutional Review Board approved this study.
RESULTS
There were 43,737 survey responders, among whom 4,707 were subsequently readmitted within 30 days of discharge. Among the readmitted patients who responded to the surveys linked to their index admission, only 15.8% returned the survey before readmission (pre-readmission responders’) and 84.2% returned the survey after readmission (postreadmission responders). Additionally, 1,663 patients responded to experience surveys linked to their readmission. There were 37,365 patients in the control arm (ie, patients who responded to the survey and were not readmitted within 30 days of discharge or in the prior 30 days; Figure 1). The readmission rate among survey responders was 10.6%. Among the readmitted patients, the median number of days to readmission was 10 days while the median number of days to respond to the survey for this group was 33 days. Among the nonreadmitted patients, the median number of days to return the survey was 29 days.

We also conducted an exploratory analysis of the postreadmission responders, comparing them with patients who received patient-experience surveys linked to their second admission in 30 days. Both of these groups were exposed to a readmission before they completed the surveys. There were no significant differences between these two groups on patient experience scores. Additionally, the patients who received the survey linked to their readmission had a broad dissatisfaction pattern on HCAHPS survey items that appeared similar to that of the postreadmission group when compared to the non-readmitted group (Table 3).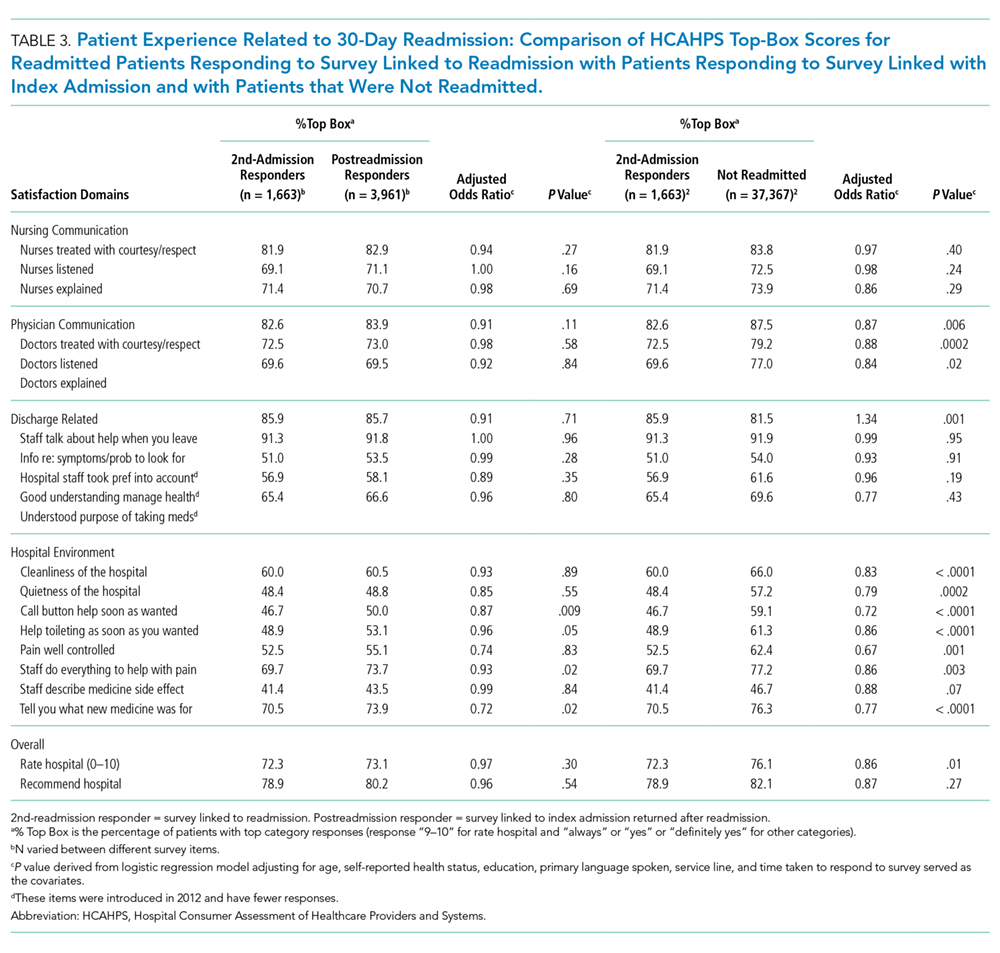
DISCUSSION
In this retrospective analysis of prospectively collected Press Ganey and HCAHPS patient-experience survey data, we found that the overwhelming majority of patients readmitted within 30 days of discharge respond to HCAHPS surveys after readmission even though the survey is sent linked to the first admission. This is not unexpected since the median time to survey response is 33 days for this group, while median time to readmission is 10 days. The dissatisfaction pattern of Postreadmission responders was similar to those who responded to the survey linked to the readmission. When a patient is readmitted prior to completing the survey, their responses appear to reflect the cumulative experience of the index admission and the readmission. The lower scores of those who respond to the survey after their readmission appear to be a driver for lower patient-experience scores related to readmissions. Overall, readmission was associated with lower scores on items in five of the nine domains used to calculate patient experience related payments under VBP.16
These findings have important implications in inferring the direction of potential causal relationship between readmissions and patient experience at the hospital level. Additionally, these patients show broad dissatisfaction with areas beyond physician communication and discharge planning. These include staff responsiveness, phlebotomy, meals, hospital cleanliness, and noise level. This pattern of dissatisfaction may represent impatience and frustration with spending additional time in the hospital environment.
Our results are consistent with findings of many of the earlier studies, but our study goes a step further by using patient-level data and incorporating survey response time in our analysis.3,7,9,10 By separating out the readmitted patients who responded to the survey prior to admission, we attempted to address the ability of patients’ perception of care to predict future readmissions. Our results do not support this idea, since pre-readmission responders had similar experience scores to non-readmitted patients. However, because of the low numbers of pre-readmission responders, the comparison lacks precision. Current HCAHPS and Press Ganey questions may lack the ability to predict future readmissions because of the timing of the survey (postdischarge) or the questions themselves.
Overall, postreadmission responders are dissatisfied with multiple domains of hospital care. Many of these survey responses may simply be related to general frustration. Alternatively, they may represent a patient population with a high degree of needs that are not as easily met by a hospital’s routine processes of care. Even though the readmission rates were 10.6% among survey responders, 14.6% of the survey responses were associated with readmissions after accounting for those who respond to surveys linked to readmission. These patients could have significant impact on cumulative experience scores.
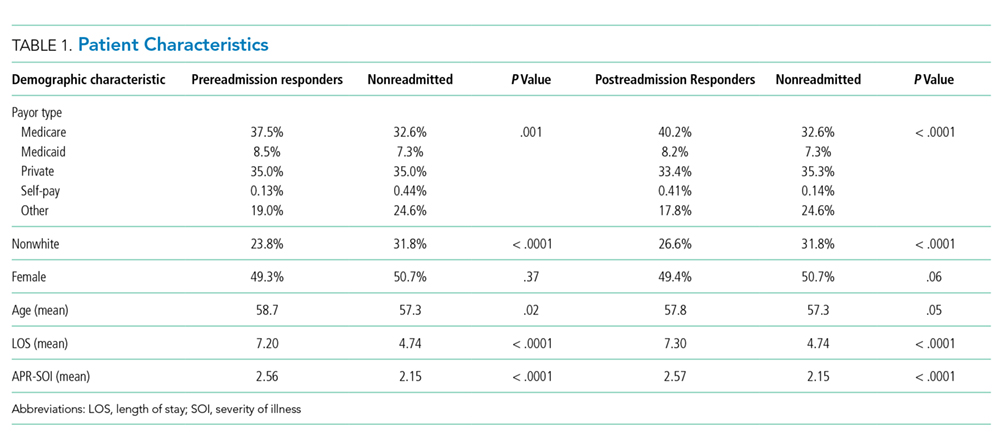
Our study has a few limitations. First, it involves a single tertiary care academic center study, and our results may not be generalizable. Second, we did not adjust for some of the patient characteristics associated with readmissions. Patients who were admitted within 30 days are different than those not readmitted based on payor, race, length of stay, and severity of illness, and we did not adjust for these factors in our analysis. This was intentional, however. Our goal was to better understand the relationship between 30-day readmission and patient experience scores as they are used for hospital-level studies, VBP, and public reporting. For these purposes, the scores are not adjusted for factors, such as payor and length of stay. We did adjust for patient-mix adjustment factors used by CMS. Third, the response rates to the HCAHPS were low and may have biased the scores. However, HCAHPS is widely used for comparisons between hospitals has been validated, and our study results have implications with regard to comparing hospital-level performance. HCAHPS results are relevant to policy and have financial consequences.17 Fourth, our study did not directly compare whether the relationship between patient experience for the postreadmission group and nonreadmitted group was different from the relationship between the pre-readmission group and postreadmission group. It is possible that there is no difference in relationship between the groups. However, despite the small number of pre-readmission responders, these patients tended to have more favorable experience responses than those who responded after being readmitted, even after adjusting for response time. Although the P values are nonsignificant for many comparisons, the directionality of the effect is relatively consistent. Also, the vast majority of the patients fall in the postreadmission group, and these patients appear to drive the overall experience related to readmissions. Finally, since relatively few patients turned in surveys prior to readmission, we had limited power to detect a significant difference between these pre-readmission responders and nonreadmitted patients.
Our study has implications for policy makers, researchers, and providers. The HCAHPS scores of patients who are readmitted and completed the survey after being readmitted reflects their experience of both the index admission and the readmission. We did not find evidence to support that HCAHPS survey responses predict future readmissions at the patient level. Our findings do support the concept that lower readmissions rates (whether due to the patient population or processes of care that decrease readmission rates) may improve HCAHPS scores. We suggest caution in assuming that improving patient experience is likely to reduce readmission rates.
Disclosures
The authors declare no conflicts of interest.
1. Hospital value-based purchasing. https://www.cms.gov/Outreach-and-Education/Medicare-Learning-Network-MLN/MLNProducts/downloads/Hospital_VBPurchasing_Fact_Sheet_ICN907664.pdf. Accessed June 25, 2016.
2. Readmissions reduction program (HRRP). Centers for Medicare & Medicaid Services. https://www.cms.gov/medicare/medicare-fee-for-service-payment/acuteinpatientpps/readmissions-reduction-program.html. Accessed June 25, 2016.
3. Boulding W, Glickman SW, Manary MP, Schulman KA, Staelin R. Relationship between patient satisfaction with inpatient care and hospital readmission within 30 days. Am J Manag Care. 2011;17(1):41-48. PubMed
4. Buum HA, Duran-Nelson AM, Menk J, Nixon LJ. Duty-hours monitoring revisited: self-report may not be adequate. Am J Med. 2013;126(4):362-365. doi: 10.1016/j.amjmed.2012.12.003 PubMed
5. Choma NN, Vasilevskis EE, Sponsler KC, Hathaway J, Kripalani S. Effect of the ACGME 16-hour rule on efficiency and quality of care: duty hours 2.0. JAMA Int Med. 2013;173(9):819-821. doi: 10.1001/jamainternmed.2013.3014 PubMed
6. Brooke BS, Samourjian E, Sarfati MR, Nguyen TT, Greer D, Kraiss LW. RR3. Patient-reported readiness at time of discharge predicts readmission following vascular surgery. J Vasc Surg. 2015;61(6):188S. doi: 10.1016/j.jvs.2015.04.356
7. Duraes LC, Merlino J, Stocchi L, et al. 756 readmission decreases patient satisfaction in colorectal surgery. Gastroenterology. 2014;146(5):S-1029. doi: 10.1016/S0016-5085(14)63751-3
8. Mitchell JP. Association of provider communication and discharge instructions on lower readmissions. J Healthc Qual. 2015;37(1):33-40. doi: 10.1097/01.JHQ.0000460126.88382.13 PubMed
9. Tsai TC, Orav EJ, Jha AK. Patient satisfaction and quality of surgical care in US hospitals. Ann Surg. 2015;261(1):2-8. doi: 10.1097/SLA.0000000000000765 PubMed
10. Hachem F, Canar J, Fullam M, Andrew S, Hohmann S, Johnson C. The relationships between HCAHPS communication and discharge satisfaction items and hospital readmissions. Patient Exp J. 2014;1(2):71-77.
11. Irby DM, Cooke M, Lowenstein D, Richards B. The academy movement: a structural approach to reinvigorating the educational mission. Acad Med. 2004;79(8):729-736. doi: 10.1097/00001888-200408000-00003 PubMed
12. Siddiqui ZK, Zuccarelli R, Durkin N, Wu AW, Brotman DJ. Changes in patient satisfaction related to hospital renovation: experience with a new clinical building. J Hosp Med. 2015;10(3):165-171. doi: 10.1002/jhm.2297 PubMed
13. Nair BR, Coughlan JL, Hensley MJ. Student and patient perspectives on bedside teaching. Med Educ. 1997;31(5):341-346. doi: 10.1046/j.1365-2923.1997.00673.x PubMed
14. Elliott MN, Zaslavsky AM, Goldstein E, et al. Effects of survey mode, patient mix, and nonresponse on CAHPS® hospital survey scores. BMC Health Serv Res. 2009;44(2p1):501-518. doi: 10.1111/j.1475-6773.2008.00914.x PubMed
15. Saunders CL, Elliott MN, Lyratzopoulos G, Abel GA. Do differential response rates to patient surveys between organizations lead to unfair performance comparisons?: evidence from the English Cancer Patient Experience Survey. Medical care. 2016;54(1):45. doi: 10.1097/MLR.0000000000000457 PubMed
16. Sabel E, Archer J. “Medical education is the ugly duckling of the medical world” and other challenges to medical educators’ identity construction: a qualitative study. Acad Med. 2014;89(11):1474-1480. doi: 10.1097/ACM.0000000000000420 PubMed
17. O’Malley AJ, Zaslavsky AM, Elliott MN, Zaborski L, Cleary PD. Case‐Mix adjustment of the CAHPS® Hospital Survey. BMC Health Serv Res. 2005;40(6p2):2162-2181. doi: 10.1111/j.1475-6773.2005.00470.x
Patient experience and 30-day readmission are important measures of quality of care for hospitalized patients. Performance on both of these measures impact hospitals financially. Performance on the Hospital Consumer Assessment of Healthcare Systems and Providers (HCAHPS) survey is linked to 25% of the incentive payment under Value Based Purchasing (VBP) Program.1 Starting in 2012, the Centers for Medicare and Medicaid Services (CMS) introduced the Readmission Reduction Program, penalizing hospitals financially for excessive readmissions.2
A relationship between patient experience and readmissions has been explored at the hospital level. Studies have mostly found that higher patient experience scores are associated with lower 30-day readmission rates. In a study of the relationship between 30-day risk-standardized readmission rates for three medical conditions (acute myocardial infarction, heart failure, and pneumonia) and patient experience, the authors noted that higher experience scores for overall care and discharge planning were associated with lower readmission rates for these conditions. They also concluded that patient experience scores were more predictive of 30-day readmission than clinical performance measures. Additionally, the authors predicted that if a hospital increased its total experience scores from the 25th percentile to the 75th percentile, there would be an associated decrease in readmissions by at least 2.3% for each of these conditions.3 Practice management companies and the media have cited this finding to conclude that higher patient experience drives clinical outcomes such as 30-day readmission and that patients are often the best judges of the quality of care delivered.4,5
Other hospital-level studies have found that high 30-day readmission rates are associated with lower overall experience scores in a mixed surgical patient population; worse reports of pain control and overall care in the colorectal surgery population; lower experience scores with discharge preparedness in vascular surgery patients; and lower experience scores with physician communication, nurse communication, and discharge preparedness.6-9 A patient-level study noted higher readmissions are associated with worse experience with physician and nursing communication along with a paradoxically better experience with discharge information.10
Because these studies used an observational design, they demonstrated associations rather than causality. An alternative hypothesis is that readmitted patients complete their patient experience survey after readmission and the low experience is the result, rather than the cause, of their readmission. For patients who are readmitted, it is unclear whether there is an opportunity to complete the survey prior to readmission and whether being readmitted may impact patient perception of quality of care. Using patient-level data, we sought to assess HCAHPS patient-experience responses linked to the index admission of the patients who were readmitted in 30 days and compare it with those patients who were not readmitted during this time period. We paid particular attention to when the surveys were returned.
METHODS
Study Design
We conducted a retrospective analysis of prospectively collected 10-year HCAHPS and Press Ganey patient survey data for a single tertiary care academic hospital.
Participants
All adult patients discharged from the hospital and who responded to the routinely sent patient-experience survey were included. Surveys were sent to a random sample of 50% of the discharged patients.
The exposure group was comprised of patients who responded to the survey and were readmitted within 30 days of discharge. After subtracting 5 days from the survey receipt date for expected delays related to mail delivery time and processing time, survey response date was calculated. The exposure group was further divided into patients who responded to the survey prior to their 30-day readmission (“Pre-readmission responders”) and those that responded to the survey after their readmission (“Postreadmission responders”). A sensitivity analysis was performed by changing the number of days subtracted from the survey receipt date by 2 days in either direction. This approach did not result in any significant changes in the results.
The control group comprised patients who were not readmitted to the hospital within 30 days of discharge and who did not have an admission in the previous 30 days as well (“Not readmitted” group). An additional comparison group for exploratory analysis included patients who had experienced an admission in the prior 30 days but were not readmitted after the admission linked to the survey. These patients responded to the patient-experience surveys that were linked to their second admission in 30 days (“2nd-admission responders” group; Figure).
Time Periods
All survey responders from the third quarter of 2006 to the first quarter of 2016 were included in the study. Additionally, administrative data on non-responders were available from 7/2006 to 8/2012. These data were used to estimate response rates. Patient level experience and administrative data were obtained in a linked fashion for these time periods.
Instruments
Press Ganey and HCAHPS surveys were sent via mail in the same envelope. Fifty percent of the discharged patients were randomized to receive the surveys. The Press Ganey survey contained 33 items encompassing several subdomains, including room, meal, nursing, physician, ancillary staff, visitor, discharge, and overall experience.
The HCAHPS survey contained 29 CMS-mandated items, of which 21 are related to patient experience. The development, testing, and methods for administration and reporting of the HCAHPS survey have been previously described and studies using this instrument have been reported in the literature.11 Press Ganey patient satisfaction survey results have also been reported in the literature.12
Outcome Variables and Covariates
HCAHPS and Press Ganey experience survey individual item responses were the primary outcome variables of this study. Age, self-reported health status, education, primary language spoken, service line, and time taken to respond to the surveys served as the covariates. These variables are used by CMS for patient-mix adjustment and are collected on the HCAHPS survey. Additionally, the number of days to respond to the survey were included in all regression analysis to adjust for early responder effect.13-15
Statistical Analysis
“Percent top-box” scores were calculated for each survey item for patients in each group. The percent top-box scores were calculated as the percent of patients who responded “very good” for a given item on Press Ganey survey items and “always” or “definitely yes” or “yes” or “9” or “10” on HCAHPS survey items. CMS utilizes “percent top-box scores” to calculate payments under the VBP program and to report the results publicly. Numerous studies have also reported percent top-box scores for HCAHPS survey results.12
We hypothesized that whether patients complete the HCAHPS survey before or after the readmission influences their reporting of experience. To test this hypothesis, HCAHPS and Press Ganey item top-box scores of “Pre-readmission responders” and “Postreadmission responders” were compared with those of the control group using multivariate logistic regression. “Pre-readmission responders” were also compared with “Postreadmission responders”.
“2nd-admission responders” were similarly compared with the control group for an exploratory analysis. Finally, “Postreadmission responders” and “2nd-admission responders” were compared in another exploratory analysis since both these groups responded to the survey after being exposed to the readmission, even though the “Postreadmission responders” group is administratively linked to the index admission.
The Johns Hopkins Institutional Review Board approved this study.
RESULTS
There were 43,737 survey responders, among whom 4,707 were subsequently readmitted within 30 days of discharge. Among the readmitted patients who responded to the surveys linked to their index admission, only 15.8% returned the survey before readmission (pre-readmission responders’) and 84.2% returned the survey after readmission (postreadmission responders). Additionally, 1,663 patients responded to experience surveys linked to their readmission. There were 37,365 patients in the control arm (ie, patients who responded to the survey and were not readmitted within 30 days of discharge or in the prior 30 days; Figure 1). The readmission rate among survey responders was 10.6%. Among the readmitted patients, the median number of days to readmission was 10 days while the median number of days to respond to the survey for this group was 33 days. Among the nonreadmitted patients, the median number of days to return the survey was 29 days.
We also conducted an exploratory analysis of the postreadmission responders, comparing them with patients who received patient-experience surveys linked to their second admission in 30 days. Both of these groups were exposed to a readmission before they completed the surveys. There were no significant differences between these two groups on patient experience scores. Additionally, the patients who received the survey linked to their readmission had a broad dissatisfaction pattern on HCAHPS survey items that appeared similar to that of the postreadmission group when compared to the non-readmitted group (Table 3).
DISCUSSION
In this retrospective analysis of prospectively collected Press Ganey and HCAHPS patient-experience survey data, we found that the overwhelming majority of patients readmitted within 30 days of discharge respond to HCAHPS surveys after readmission even though the survey is sent linked to the first admission. This is not unexpected since the median time to survey response is 33 days for this group, while median time to readmission is 10 days. The dissatisfaction pattern of Postreadmission responders was similar to those who responded to the survey linked to the readmission. When a patient is readmitted prior to completing the survey, their responses appear to reflect the cumulative experience of the index admission and the readmission. The lower scores of those who respond to the survey after their readmission appear to be a driver for lower patient-experience scores related to readmissions. Overall, readmission was associated with lower scores on items in five of the nine domains used to calculate patient experience related payments under VBP.16
These findings have important implications in inferring the direction of potential causal relationship between readmissions and patient experience at the hospital level. Additionally, these patients show broad dissatisfaction with areas beyond physician communication and discharge planning. These include staff responsiveness, phlebotomy, meals, hospital cleanliness, and noise level. This pattern of dissatisfaction may represent impatience and frustration with spending additional time in the hospital environment.
Our results are consistent with findings of many of the earlier studies, but our study goes a step further by using patient-level data and incorporating survey response time in our analysis.3,7,9,10 By separating out the readmitted patients who responded to the survey prior to admission, we attempted to address the ability of patients’ perception of care to predict future readmissions. Our results do not support this idea, since pre-readmission responders had similar experience scores to non-readmitted patients. However, because of the low numbers of pre-readmission responders, the comparison lacks precision. Current HCAHPS and Press Ganey questions may lack the ability to predict future readmissions because of the timing of the survey (postdischarge) or the questions themselves.
Overall, postreadmission responders are dissatisfied with multiple domains of hospital care. Many of these survey responses may simply be related to general frustration. Alternatively, they may represent a patient population with a high degree of needs that are not as easily met by a hospital’s routine processes of care. Even though the readmission rates were 10.6% among survey responders, 14.6% of the survey responses were associated with readmissions after accounting for those who respond to surveys linked to readmission. These patients could have significant impact on cumulative experience scores.
Our study has a few limitations. First, it involves a single tertiary care academic center study, and our results may not be generalizable. Second, we did not adjust for some of the patient characteristics associated with readmissions. Patients who were admitted within 30 days are different than those not readmitted based on payor, race, length of stay, and severity of illness, and we did not adjust for these factors in our analysis. This was intentional, however. Our goal was to better understand the relationship between 30-day readmission and patient experience scores as they are used for hospital-level studies, VBP, and public reporting. For these purposes, the scores are not adjusted for factors, such as payor and length of stay. We did adjust for patient-mix adjustment factors used by CMS. Third, the response rates to the HCAHPS were low and may have biased the scores. However, HCAHPS is widely used for comparisons between hospitals has been validated, and our study results have implications with regard to comparing hospital-level performance. HCAHPS results are relevant to policy and have financial consequences.17 Fourth, our study did not directly compare whether the relationship between patient experience for the postreadmission group and nonreadmitted group was different from the relationship between the pre-readmission group and postreadmission group. It is possible that there is no difference in relationship between the groups. However, despite the small number of pre-readmission responders, these patients tended to have more favorable experience responses than those who responded after being readmitted, even after adjusting for response time. Although the P values are nonsignificant for many comparisons, the directionality of the effect is relatively consistent. Also, the vast majority of the patients fall in the postreadmission group, and these patients appear to drive the overall experience related to readmissions. Finally, since relatively few patients turned in surveys prior to readmission, we had limited power to detect a significant difference between these pre-readmission responders and nonreadmitted patients.
Our study has implications for policy makers, researchers, and providers. The HCAHPS scores of patients who are readmitted and completed the survey after being readmitted reflects their experience of both the index admission and the readmission. We did not find evidence to support that HCAHPS survey responses predict future readmissions at the patient level. Our findings do support the concept that lower readmissions rates (whether due to the patient population or processes of care that decrease readmission rates) may improve HCAHPS scores. We suggest caution in assuming that improving patient experience is likely to reduce readmission rates.
Disclosures
The authors declare no conflicts of interest.
1. Hospital value-based purchasing. https://www.cms.gov/Outreach-and-Education/Medicare-Learning-Network-MLN/MLNProducts/downloads/Hospital_VBPurchasing_Fact_Sheet_ICN907664.pdf. Accessed June 25, 2016.
2. Readmissions reduction program (HRRP). Centers for Medicare & Medicaid Services. https://www.cms.gov/medicare/medicare-fee-for-service-payment/acuteinpatientpps/readmissions-reduction-program.html. Accessed June 25, 2016.
3. Boulding W, Glickman SW, Manary MP, Schulman KA, Staelin R. Relationship between patient satisfaction with inpatient care and hospital readmission within 30 days. Am J Manag Care. 2011;17(1):41-48. PubMed
4. Buum HA, Duran-Nelson AM, Menk J, Nixon LJ. Duty-hours monitoring revisited: self-report may not be adequate. Am J Med. 2013;126(4):362-365. doi: 10.1016/j.amjmed.2012.12.003 PubMed
5. Choma NN, Vasilevskis EE, Sponsler KC, Hathaway J, Kripalani S. Effect of the ACGME 16-hour rule on efficiency and quality of care: duty hours 2.0. JAMA Int Med. 2013;173(9):819-821. doi: 10.1001/jamainternmed.2013.3014 PubMed
6. Brooke BS, Samourjian E, Sarfati MR, Nguyen TT, Greer D, Kraiss LW. RR3. Patient-reported readiness at time of discharge predicts readmission following vascular surgery. J Vasc Surg. 2015;61(6):188S. doi: 10.1016/j.jvs.2015.04.356
7. Duraes LC, Merlino J, Stocchi L, et al. 756 readmission decreases patient satisfaction in colorectal surgery. Gastroenterology. 2014;146(5):S-1029. doi: 10.1016/S0016-5085(14)63751-3
8. Mitchell JP. Association of provider communication and discharge instructions on lower readmissions. J Healthc Qual. 2015;37(1):33-40. doi: 10.1097/01.JHQ.0000460126.88382.13 PubMed
9. Tsai TC, Orav EJ, Jha AK. Patient satisfaction and quality of surgical care in US hospitals. Ann Surg. 2015;261(1):2-8. doi: 10.1097/SLA.0000000000000765 PubMed
10. Hachem F, Canar J, Fullam M, Andrew S, Hohmann S, Johnson C. The relationships between HCAHPS communication and discharge satisfaction items and hospital readmissions. Patient Exp J. 2014;1(2):71-77.
11. Irby DM, Cooke M, Lowenstein D, Richards B. The academy movement: a structural approach to reinvigorating the educational mission. Acad Med. 2004;79(8):729-736. doi: 10.1097/00001888-200408000-00003 PubMed
12. Siddiqui ZK, Zuccarelli R, Durkin N, Wu AW, Brotman DJ. Changes in patient satisfaction related to hospital renovation: experience with a new clinical building. J Hosp Med. 2015;10(3):165-171. doi: 10.1002/jhm.2297 PubMed
13. Nair BR, Coughlan JL, Hensley MJ. Student and patient perspectives on bedside teaching. Med Educ. 1997;31(5):341-346. doi: 10.1046/j.1365-2923.1997.00673.x PubMed
14. Elliott MN, Zaslavsky AM, Goldstein E, et al. Effects of survey mode, patient mix, and nonresponse on CAHPS® hospital survey scores. BMC Health Serv Res. 2009;44(2p1):501-518. doi: 10.1111/j.1475-6773.2008.00914.x PubMed
15. Saunders CL, Elliott MN, Lyratzopoulos G, Abel GA. Do differential response rates to patient surveys between organizations lead to unfair performance comparisons?: evidence from the English Cancer Patient Experience Survey. Medical care. 2016;54(1):45. doi: 10.1097/MLR.0000000000000457 PubMed
16. Sabel E, Archer J. “Medical education is the ugly duckling of the medical world” and other challenges to medical educators’ identity construction: a qualitative study. Acad Med. 2014;89(11):1474-1480. doi: 10.1097/ACM.0000000000000420 PubMed
17. O’Malley AJ, Zaslavsky AM, Elliott MN, Zaborski L, Cleary PD. Case‐Mix adjustment of the CAHPS® Hospital Survey. BMC Health Serv Res. 2005;40(6p2):2162-2181. doi: 10.1111/j.1475-6773.2005.00470.x
© 2018 Society of Hospital Medicine