User login
You Can’t Have It All: The Experience of Academic Hospitalists During Pregnancy, Parental Leave, and Return to Work
Despite recent advances made in medicine, gender-based disparities persist.1-3 In particular, women with children have barriers to career advancement and show evidence of slower career advancement.1,2 Multiple challenges for working women experiencing motherhood have been described. In academic medicine in the United States, women have limited access to paid parental leave.4-6 For women who choose to breastfeed, there is limited time, space, and support available for breastfeeding.7 Furthermore, sleep deprivation in the postpartum period significantly impacts the ability to function at work.8
Hospital medicine is a unique specialty as it comprises 47% women, 80% of whom are aged less than 40 years, suggesting that a large portion are women of childbearing age.9 The field poses known challenges to this population, including shift work, atypical schedules, and unpredictable hours. We conducted a descriptive qualitative study to improve our understanding of the experience of female academic hospitalists who have experienced pregnancy, parental leave, and the return to work as faculty. Our goal was to both explore the challenges to undergoing this experience and discover solutions to support female academic hospitalists.
METHODS
Study Design
We conducted a qualitative descriptive study of female hospitalists recruited from academic institutions represented in Society of Hospital Medicine (SHM) committees. Interviews were conducted between November 2017 and February 2018. Participants completed an informed consent and a demographic survey prior to the interview. Each interview lasted approximately 30 minutes; discussions were recorded on digital records and transcribed verbatim. This protocol was reviewed and granted exemption by the Institutional Review Board at the University of Colorado.
Population
We recruited participants from a selection of hospital medicine groups nationally, chosen from SHM committee representation. A purposeful snowball approach was used to identify hospitalists from representative programs and seek their recommendation for hospitalists from other targeted programs. Ten hospitalists were approached by e-mail to determine their interest in participation, and all of them agreed to participate. Each participant experienced new parenthood within the last seven years.
Framework
We constructed our interview to represent the following timeline associated with having children as it pertains to a hospitalist position: pregnancy, parental leave, and the return to work. The interview guide was structured to invoke the positive aspects, challenges, and solutions within each domain (Appendix 1).
Analysis
Codes were inductively developed from the interview data by a team of three board-certified internal medicine physicians (E.G., A.M., and C.J.), one of whom had prior training and experience with qualitative interviews and analysis (C.J.). Among the coders, two (E.G. and A.M.) conducted the semistructured interviews. Code disparities were reconciled by team consensus, where the primary coder facilitated the discussions. Themes were developed inductively from the codes, and the analysis was completed using a team-based iterative approach that was facilitated using ATLAS.ti.10 Thematic saturation was achieved. This study was approved by the Colorado Multiple Institutional Review Board.
RESULTS
The demographics and the characteristics of the hospital medicine group are shown in Table 1. Although we asked questions about both the positive and challenging aspects of the experience of parenthood, the interviews tended to focus more on the challenges faced and on areas for optimization.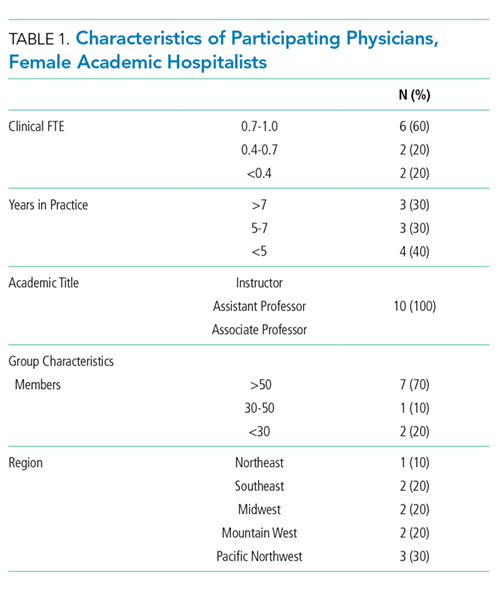
Paid Parental leave
Most of the participants described inadequate paid parental leave, with minimal transparency in the processes for ensuring time off following the birth of their child, resulting in “haggling” with bosses, human resources, and the administrative staff. Rarely was a formal parental leave policy in place. Once a parental leave plan was established, several women reported the financial burden associated with a leave that was partially, or fully, unpaid.
“All of my leave was unpaid. .. managed to finagle short-term disability into paying for it… the system was otherwise set up to screw me financially.”
For the three women who did experience sufficient paid parental leave, they recognized the financial and emotional benefit and suggested that further optimization would include a prebirth schedule to account for the physical challenges and potential complications.
Physical Challenges
All of the women described significant physical challenges when working during pregnancy, resulting in limited bandwidth for additional academic activities outside of direct clinical care responsibilities.
“Exhaustion that hits you in your pregnancy and then you have to round. I used to lie on the floor of my office, take a little nap, wake up, write some notes, go home, take another nap, wake up, write some more notes.”
Upon return to work, women reported additional physical challenges related to sleep deprivation, impacting their productivity with academic work and emotional well-being.
“I came back from maternity leave and I was sleep-deprived and exhausted, I didn’t have the energy. All of these great projects that I had started or dreamed of … dwindled and died on the vine.”
Solutions suggested by the participants included creation of a flexible schedule with a ramp-up and ramp-down period around the birth.
Breastfeeding
The majority of participants in this study encountered several challenges associated with a shared goal of breastfeeding according to evidence-based guidelines.11 Designated pumping areas were often inconveniently located and not conducive to multitasking.
“It’s two chairs that are behind a curtain in a women’s locker room in the basement of the hospital, that are tiny and gross. No computers, so I felt like I was wasting time.”
One hospitalist described carving out time for pumping in her office while multitasking with clinical work.
“I would get to work, set up, and pump while chart reviewing. Then I would go and see people… and come back to my office and pump and write a few notes. And go out and see more patients, and then pump and write a few more notes. And then pump, and then go home. I was like a cow.”
Women highlighted the barriers that could be optimized such as creating time in the clinical schedule for pumping, a physical space to breastfeed or pump, and accessible milk storage facilities.
Career Opportunities
When asked about the impact of parental leave on career opportunities, a few of the women described a phenomenon of no longer being asked to participate or being left out of prior projects.
“People didn’t want to offer you things or give you things because they realize you’re having this transition in your life. Not out of animosity, but out of courtesy that they don’t want to fill up your place even more. Her plate is full; we are not going to ask her to do anything extra.”
However, two women specifically reported a supportive environment without a loss of opportunities, often referenced as a boss who “saved” projects for their return.
Colleague Responses
One participant used the term “microaggressions,” to describe passive aggressions encountered by their colleagues or leadership.
“(A colleague) was diagnosed with pre-eclampsia, and very urgently had to deliver and couldn’t cover a week of shifts…She was asked initially to find her own coverage…Not treating (pregnancy) similar to other serious illnesses is what I would term a microaggression.”
Yet, women in our study also reported positive responses from colleagues and the importance of support networks of physician mothers (Table 2).
Empathy in Patient Care
Finally, the experience of motherhood impacted all of the women as physicians, described as increased empathy, patience, and understanding of difficult family situations.
“I’m just more sensitive to people’s lives outside the hospital, so, you know, when it’s difficult for a family member to get there because they have three other kids they are taking care of or, somebody that says they are leaving AMA, but it’s because they have a sick kid at home. I just have a better context for that.”
DISCUSSION
Gender disparities persist in both internal medicine and hospital medicine.1 Providers in this descriptive qualitative study suggested that the following factors contribute: lack of paid parental leave and the associated financial penalties, loss of career opportunities, the physical challenges associated with pregnancy, decreasing productivity, and the amount of time and effort involved in breastfeeding. However, the participants also shared valuable ideas for future solutions to relieve the challenges imposed on working physician mothers (Table 2).
Breaking the Glass Ceiling
Participants noted the importance of a paid leave policy that encompasses not only maternity leave but also a flexible scheduling period before and after the leave to account for the challenges of pregnancy and new motherhood. Paid parental leave is rare in academic settings, but studies from other industries show that when women take paid leave, they are more likely to remain in the workforce 9-12 months afterward, work more weekly hours, and feel more loyal to their organization.12,13 In the rare instance when negotiations around leave violate local policy or the law, women should be encouraged to seek guidance from their human resources department.
Me Too: Building Solidarity
Women in our study reported the value of a supportive workplace in easing their transition into motherhood. Specifically, they noted that a supportive boss who protected their career opportunities prevented momentum loss in their career trajectory. Access to mutual supports such as the Physicians Mom Group, a well-established Facebook group comprising more than 70,000 women, was referenced as a meaningful way to share joys and tribulations related to balancing a career as a physician and motherhood. Growth of similar support systems within institutions will further support this experience.
Time’s Up: The Promotion Clock
Women in our study described a prolonged period of diminished productivity related to having children, coinciding with a set time to promotion in academics. Flexible promotion schedules may impact women’s ability to successfully undergo promotion.
FUTURE DIRECTION
The aim of this study was to represent a shared set of experiences of female academic hospitalists who participated; therefore, the results may not be generalizable beyond this group. Due to the use of a purposeful snowball approach, there was a potential for selection bias. Future research may include comparing the experience of women at institutions that offer paid leave versus those that do not and the impact on retention, promotion, and well-being.
CONCLUSION
Women in hospital medicine encounter several challenges to having children, but they are also motivated to provide solutions. Efforts to improve the institutional and cultural landscape to better support women physicians with children are critical to prevent attrition of women and ensure equitable academic promotion and achievement of leadership positions.
Disclosures
The authors have no conflicts of interest to report.
Author Contributions
Each author was involved in the creation of the study protocol, data collection and analysis, and creation of the manuscript.
1. Association of American Medical Colleges. The State of Women in Academic Medicine: The pipeline and pathways to leadership, 2013-2014. https://www.hopkinsmedicine.org/women_science_medicine/_pdfs/The%20State%20of%20Women%20in%20Academic%20Medicine%202013-2014%20FINAL.pdf. Accessed February 26, 2018.
2. Carr PL, Ash AS, Friedman RH, et al. Relation of family responsibilities and gender to the productivity and career satisfaction of medical faculty. Ann Int Med. 1998;129(7):532-538. doi: 10.7326/0003-4819-129-7-199810010-00004. PubMed
3. Burden M, Frank MG, Keniston A, et al. Gender disparities for academic hospitalists. J Hosp Med. 2015;10(8):481-485. doi:10.1002/jhm.2340. PubMed
4. Bristol MN, Abbuhl S, Cappola AR, Sonnad SS. Work-life policies for faculty at the top ten medical schools. J Women’s Health. 2008;17(8):1311-1320. doi: 10.1089/jwh.2007.0682. PubMed
5. Welch JL, Wiehe SE, Palmer-Smith V, Dankoski ME. Flexibility in faculty work-life policies at medical schools in the big ten conference. J Women’s Health. 2011;20(5):725-732. doi: 10.1089/jwh.2010.2553. PubMed
6. Riano NS, Linos E, Accurso EC, et al. Paid family and childbearing leave policies at top US medical schools. JAMA. 2018;319(6):611-614. doi: 10.1001/jama.2017.19519. PubMed
7. Arthur CR, Saenz RB, Replogle WH. The employment-related breastfeeding decisions of physician mothers. J Miss State Med Assoc. 2003;44(12):383-387. PubMed
8. Filtness AJ, MacKenzie J, Armstrong K. Longitudinal change in sleep and daytime sleepiness in postpartum women. PLoS ONE. 2014;9(7):e103513. doi: 10.1371/journal.pone.0103513. PubMed
9. Reid MB, Misky GJ, Harrison RA, Sharpe B, Auerbach A, Glasheen JJ. Mentorship, productivity, and promotion among academic hospitalists. J Gen Intern Med. 2012;27(1):23-27. doi: 10.1007/s11606-011-1892-5. PubMed
10. Jones J, Nowels CT, Sudore R, Ahluwalia S, Bekelman DB. The future as a series of transitions: qualitative study of heart failure patients and their informal caregivers. J Gen Intern Med. 2015;30(2):176-182. doi: 10.1007/s11606-014-3085-5. PubMed
11. American Academy of Pediatrics. Breastfeeding and the use of human milk. Pediatrics. 2012;129(3):e827-e841. doi: 10.1542/peds.2011-3552. PubMed
12. Houser, L, Vartanian, T. Pay matters: the positive economic impact of paid family Leave for families, businesses and the public. Center for Women and Work at Rutgers. January, 2012. http://go.nationalpartnership.org/site/DocServer/Pay_Matters_Positive_Economic_Impacts_of_Paid_Fam ily_L.pdf?docID=9681. Accessed February 26, 2018.
13. Rossin-Slater M, Ruhm C, Waldfogel J. The effects of California’s paid family leave program on mothers’ leave-taking and subsequent labor market outcomes. J Policy Anal Manage. 2013;32(2):224-2 45. doi: 10.1002/pam.21676. PubMed
Despite recent advances made in medicine, gender-based disparities persist.1-3 In particular, women with children have barriers to career advancement and show evidence of slower career advancement.1,2 Multiple challenges for working women experiencing motherhood have been described. In academic medicine in the United States, women have limited access to paid parental leave.4-6 For women who choose to breastfeed, there is limited time, space, and support available for breastfeeding.7 Furthermore, sleep deprivation in the postpartum period significantly impacts the ability to function at work.8
Hospital medicine is a unique specialty as it comprises 47% women, 80% of whom are aged less than 40 years, suggesting that a large portion are women of childbearing age.9 The field poses known challenges to this population, including shift work, atypical schedules, and unpredictable hours. We conducted a descriptive qualitative study to improve our understanding of the experience of female academic hospitalists who have experienced pregnancy, parental leave, and the return to work as faculty. Our goal was to both explore the challenges to undergoing this experience and discover solutions to support female academic hospitalists.
METHODS
Study Design
We conducted a qualitative descriptive study of female hospitalists recruited from academic institutions represented in Society of Hospital Medicine (SHM) committees. Interviews were conducted between November 2017 and February 2018. Participants completed an informed consent and a demographic survey prior to the interview. Each interview lasted approximately 30 minutes; discussions were recorded on digital records and transcribed verbatim. This protocol was reviewed and granted exemption by the Institutional Review Board at the University of Colorado.
Population
We recruited participants from a selection of hospital medicine groups nationally, chosen from SHM committee representation. A purposeful snowball approach was used to identify hospitalists from representative programs and seek their recommendation for hospitalists from other targeted programs. Ten hospitalists were approached by e-mail to determine their interest in participation, and all of them agreed to participate. Each participant experienced new parenthood within the last seven years.
Framework
We constructed our interview to represent the following timeline associated with having children as it pertains to a hospitalist position: pregnancy, parental leave, and the return to work. The interview guide was structured to invoke the positive aspects, challenges, and solutions within each domain (Appendix 1).
Analysis
Codes were inductively developed from the interview data by a team of three board-certified internal medicine physicians (E.G., A.M., and C.J.), one of whom had prior training and experience with qualitative interviews and analysis (C.J.). Among the coders, two (E.G. and A.M.) conducted the semistructured interviews. Code disparities were reconciled by team consensus, where the primary coder facilitated the discussions. Themes were developed inductively from the codes, and the analysis was completed using a team-based iterative approach that was facilitated using ATLAS.ti.10 Thematic saturation was achieved. This study was approved by the Colorado Multiple Institutional Review Board.
RESULTS
The demographics and the characteristics of the hospital medicine group are shown in Table 1. Although we asked questions about both the positive and challenging aspects of the experience of parenthood, the interviews tended to focus more on the challenges faced and on areas for optimization.
Paid Parental leave
Most of the participants described inadequate paid parental leave, with minimal transparency in the processes for ensuring time off following the birth of their child, resulting in “haggling” with bosses, human resources, and the administrative staff. Rarely was a formal parental leave policy in place. Once a parental leave plan was established, several women reported the financial burden associated with a leave that was partially, or fully, unpaid.
“All of my leave was unpaid. .. managed to finagle short-term disability into paying for it… the system was otherwise set up to screw me financially.”
For the three women who did experience sufficient paid parental leave, they recognized the financial and emotional benefit and suggested that further optimization would include a prebirth schedule to account for the physical challenges and potential complications.
Physical Challenges
All of the women described significant physical challenges when working during pregnancy, resulting in limited bandwidth for additional academic activities outside of direct clinical care responsibilities.
“Exhaustion that hits you in your pregnancy and then you have to round. I used to lie on the floor of my office, take a little nap, wake up, write some notes, go home, take another nap, wake up, write some more notes.”
Upon return to work, women reported additional physical challenges related to sleep deprivation, impacting their productivity with academic work and emotional well-being.
“I came back from maternity leave and I was sleep-deprived and exhausted, I didn’t have the energy. All of these great projects that I had started or dreamed of … dwindled and died on the vine.”
Solutions suggested by the participants included creation of a flexible schedule with a ramp-up and ramp-down period around the birth.
Breastfeeding
The majority of participants in this study encountered several challenges associated with a shared goal of breastfeeding according to evidence-based guidelines.11 Designated pumping areas were often inconveniently located and not conducive to multitasking.
“It’s two chairs that are behind a curtain in a women’s locker room in the basement of the hospital, that are tiny and gross. No computers, so I felt like I was wasting time.”
One hospitalist described carving out time for pumping in her office while multitasking with clinical work.
“I would get to work, set up, and pump while chart reviewing. Then I would go and see people… and come back to my office and pump and write a few notes. And go out and see more patients, and then pump and write a few more notes. And then pump, and then go home. I was like a cow.”
Women highlighted the barriers that could be optimized such as creating time in the clinical schedule for pumping, a physical space to breastfeed or pump, and accessible milk storage facilities.
Career Opportunities
When asked about the impact of parental leave on career opportunities, a few of the women described a phenomenon of no longer being asked to participate or being left out of prior projects.
“People didn’t want to offer you things or give you things because they realize you’re having this transition in your life. Not out of animosity, but out of courtesy that they don’t want to fill up your place even more. Her plate is full; we are not going to ask her to do anything extra.”
However, two women specifically reported a supportive environment without a loss of opportunities, often referenced as a boss who “saved” projects for their return.
Colleague Responses
One participant used the term “microaggressions,” to describe passive aggressions encountered by their colleagues or leadership.
“(A colleague) was diagnosed with pre-eclampsia, and very urgently had to deliver and couldn’t cover a week of shifts…She was asked initially to find her own coverage…Not treating (pregnancy) similar to other serious illnesses is what I would term a microaggression.”
Yet, women in our study also reported positive responses from colleagues and the importance of support networks of physician mothers (Table 2).
Empathy in Patient Care
Finally, the experience of motherhood impacted all of the women as physicians, described as increased empathy, patience, and understanding of difficult family situations.
“I’m just more sensitive to people’s lives outside the hospital, so, you know, when it’s difficult for a family member to get there because they have three other kids they are taking care of or, somebody that says they are leaving AMA, but it’s because they have a sick kid at home. I just have a better context for that.”
DISCUSSION
Gender disparities persist in both internal medicine and hospital medicine.1 Providers in this descriptive qualitative study suggested that the following factors contribute: lack of paid parental leave and the associated financial penalties, loss of career opportunities, the physical challenges associated with pregnancy, decreasing productivity, and the amount of time and effort involved in breastfeeding. However, the participants also shared valuable ideas for future solutions to relieve the challenges imposed on working physician mothers (Table 2).
Breaking the Glass Ceiling
Participants noted the importance of a paid leave policy that encompasses not only maternity leave but also a flexible scheduling period before and after the leave to account for the challenges of pregnancy and new motherhood. Paid parental leave is rare in academic settings, but studies from other industries show that when women take paid leave, they are more likely to remain in the workforce 9-12 months afterward, work more weekly hours, and feel more loyal to their organization.12,13 In the rare instance when negotiations around leave violate local policy or the law, women should be encouraged to seek guidance from their human resources department.
Me Too: Building Solidarity
Women in our study reported the value of a supportive workplace in easing their transition into motherhood. Specifically, they noted that a supportive boss who protected their career opportunities prevented momentum loss in their career trajectory. Access to mutual supports such as the Physicians Mom Group, a well-established Facebook group comprising more than 70,000 women, was referenced as a meaningful way to share joys and tribulations related to balancing a career as a physician and motherhood. Growth of similar support systems within institutions will further support this experience.
Time’s Up: The Promotion Clock
Women in our study described a prolonged period of diminished productivity related to having children, coinciding with a set time to promotion in academics. Flexible promotion schedules may impact women’s ability to successfully undergo promotion.
FUTURE DIRECTION
The aim of this study was to represent a shared set of experiences of female academic hospitalists who participated; therefore, the results may not be generalizable beyond this group. Due to the use of a purposeful snowball approach, there was a potential for selection bias. Future research may include comparing the experience of women at institutions that offer paid leave versus those that do not and the impact on retention, promotion, and well-being.
CONCLUSION
Women in hospital medicine encounter several challenges to having children, but they are also motivated to provide solutions. Efforts to improve the institutional and cultural landscape to better support women physicians with children are critical to prevent attrition of women and ensure equitable academic promotion and achievement of leadership positions.
Disclosures
The authors have no conflicts of interest to report.
Author Contributions
Each author was involved in the creation of the study protocol, data collection and analysis, and creation of the manuscript.
1. Association of American Medical Colleges. The State of Women in Academic Medicine: The pipeline and pathways to leadership, 2013-2014. https://www.hopkinsmedicine.org/women_science_medicine/_pdfs/The%20State%20of%20Women%20in%20Academic%20Medicine%202013-2014%20FINAL.pdf. Accessed February 26, 2018.
2. Carr PL, Ash AS, Friedman RH, et al. Relation of family responsibilities and gender to the productivity and career satisfaction of medical faculty. Ann Int Med. 1998;129(7):532-538. doi: 10.7326/0003-4819-129-7-199810010-00004. PubMed
3. Burden M, Frank MG, Keniston A, et al. Gender disparities for academic hospitalists. J Hosp Med. 2015;10(8):481-485. doi:10.1002/jhm.2340. PubMed
4. Bristol MN, Abbuhl S, Cappola AR, Sonnad SS. Work-life policies for faculty at the top ten medical schools. J Women’s Health. 2008;17(8):1311-1320. doi: 10.1089/jwh.2007.0682. PubMed
5. Welch JL, Wiehe SE, Palmer-Smith V, Dankoski ME. Flexibility in faculty work-life policies at medical schools in the big ten conference. J Women’s Health. 2011;20(5):725-732. doi: 10.1089/jwh.2010.2553. PubMed
6. Riano NS, Linos E, Accurso EC, et al. Paid family and childbearing leave policies at top US medical schools. JAMA. 2018;319(6):611-614. doi: 10.1001/jama.2017.19519. PubMed
7. Arthur CR, Saenz RB, Replogle WH. The employment-related breastfeeding decisions of physician mothers. J Miss State Med Assoc. 2003;44(12):383-387. PubMed
8. Filtness AJ, MacKenzie J, Armstrong K. Longitudinal change in sleep and daytime sleepiness in postpartum women. PLoS ONE. 2014;9(7):e103513. doi: 10.1371/journal.pone.0103513. PubMed
9. Reid MB, Misky GJ, Harrison RA, Sharpe B, Auerbach A, Glasheen JJ. Mentorship, productivity, and promotion among academic hospitalists. J Gen Intern Med. 2012;27(1):23-27. doi: 10.1007/s11606-011-1892-5. PubMed
10. Jones J, Nowels CT, Sudore R, Ahluwalia S, Bekelman DB. The future as a series of transitions: qualitative study of heart failure patients and their informal caregivers. J Gen Intern Med. 2015;30(2):176-182. doi: 10.1007/s11606-014-3085-5. PubMed
11. American Academy of Pediatrics. Breastfeeding and the use of human milk. Pediatrics. 2012;129(3):e827-e841. doi: 10.1542/peds.2011-3552. PubMed
12. Houser, L, Vartanian, T. Pay matters: the positive economic impact of paid family Leave for families, businesses and the public. Center for Women and Work at Rutgers. January, 2012. http://go.nationalpartnership.org/site/DocServer/Pay_Matters_Positive_Economic_Impacts_of_Paid_Fam ily_L.pdf?docID=9681. Accessed February 26, 2018.
13. Rossin-Slater M, Ruhm C, Waldfogel J. The effects of California’s paid family leave program on mothers’ leave-taking and subsequent labor market outcomes. J Policy Anal Manage. 2013;32(2):224-2 45. doi: 10.1002/pam.21676. PubMed
© 2018 Society of Hospital Medicine
Impact of Medicaid expansion on inpatient outcomes
The Affordable Care Act (ACA) has greatly increased the number of Medicaid enrollees since it expanded eligibility criteria on Jan. 1, 2014. Nearly 9 million additional U.S. adults now have Medicaid coverage, mostly in the 31 states and Washington, which have opted into Medicaid expansion.
The ACA has also had an important impact on hospital payer mix, mainly by decreasing the amount of uncompensated care in Medicaid-expansion states. Previous studies have shown disparities in the quality of inpatient care based on insurance type. Patients with Medicaid insurance often have longer hospitalizations and higher in-hospital mortality than commercially-insured patients and occasionally even than uninsured patients.
In our study published in the Journal of Hospital Medicine (2016 Dec. doi: 10.1002/jhm.2649), we evaluated the impact of state Medicaid expansion status on payer mix, length of stay, and in-hospital mortality for general medicine patients discharged from U.S. academic medical centers. We considered Jan. 1, 2014, to be the date of ACA implementation for all states except Michigan, New Hampshire, Pennsylvania, and Indiana, which had unique dates of Medicaid expansion.
We were able to identify 3,144,488 discharges from 156 hospitals in 24 Medicaid-expansion states and Washington, and 1,114,464 discharges from 55 hospitals in 14 nonexpansion states between October 2012 and September 2015.
Despite this difference in payer mix trends, state Medicaid expansion status was not associated with differences in overall length of stay or in-hospital mortality in our study. More precisely, we looked at the length of stay and mortality indices, or ratio of observed to expected values, to control for such potential confounders as disease severity and comorbid conditions.
One possible explanation for our findings is that the higher proportion of Medicare and commercially-insured patients overshadowed the contribution of Medicaid patients to the overall length of stay and mortality indices.
To our knowledge, our study is the first to look at the effect of ACA implementation on inpatient outcomes. Early evidence suggests that Medicaid expansion has improved outpatient outcomes. Low-income adults in Medicaid-expansion states have shown greater gains in access to primary care clinics and medications and in the diagnosis of certain chronic health conditions than those in non-expansion states. However, these changes would not necessarily lead to improvements in the length of stay or mortality indices for Medicaid-expansion hospitals, since the measures account for patient acuity on admission.
The take-home message from our study for health policy makers is that state Medicaid expansion status had a neutral effect on both length of stay and mortality indices. This should be reassuring for states considering expansion of their Medicaid programs in the future.
As a next step, it would be useful to see research on the impact of ACA implementation on other inpatient outcomes that may vary with insurance type, such as readmissions or hospital-acquired complications.
The take-home message for hospitalists is that there is more work to be done in reducing disparities in inpatient care based on payer status. Though not a primary focus of our study, we did see variation in the length of stay and mortality indices based on insurance type.
It is unclear whether these differences occurred because of variation in the expertise of inpatient providers, access to invasive procedures or medical therapies, the timeliness of discharge to post-acute care facilities, or other patient- or system-level factors. However, these disparities warrant our improvement efforts moving forward.
Mary Anderson, MD, and Christine Jones, MD, are hospitalists at the University of Colorado (Aurora) Hospital and assistant professors in the department of medicine at the University of Colorado.
State Medicaid Expansion Status
On January 1, 2014, several major provisions of the Affordable Care Act (ACA) took effect, including introduction of the individual mandate for health insurance coverage, opening of the Health Insurance Marketplace, and expansion of Medicaid eligibility to Americans earning up to 133% of the federal poverty level.[1] Nearly 9 million US adults have enrolled in Medicaid since that time, primarily in the 31 states and Washington, DC that have opted into Medicaid expansion.[2, 3] ACA implementation has also had a significant impact on hospital payer mix, primarily by reducing the volume of uncompensated care in Medicaid‐expansion states.[4, 5]
The differential shift in payer mix in Medicaid‐expansion versus nonexpansion states may be relevant to hospitals beyond reimbursement. Medicaid insurance has historically been associated with longer hospitalizations and higher in‐hospital mortality in diverse patient populations, more so than commercial insurance and often even uninsured payer status.[6, 7, 8, 9, 10, 11, 12, 13, 14, 15] The disparity in outcomes between patients with Medicaid versus other insurance persists even after adjustment for disease severity and baseline comorbidities. Insurance type may influence the delivery of inpatient care through variation in access to invasive procedures and adherence to guideline‐concordant medical therapies.[9, 10, 11, 12] Medicaid patients may be more likely than uninsured patients to remain hospitalized pending postacute care placement rather than be discharged home with family support.[16] Medicaid patients are also less likely to leave against medical advice than uninsured patients.[17]
Currently, little is known about the impact of state Medicaid expansion status on length of stay (LOS) or mortality nationally. It is possible that hospitals in Medicaid‐expansion states have experienced relative worsening in LOS and mortality as their share of Medicaid patients has grown. Determining the impact of ACA implementation on payer mix and patient outcomes is particularly important for academic medical centers (AMCs), as they traditionally care for the greatest percentage of both Medicaid and uninsured patients.[18] We sought to characterize the impact of state Medicaid expansion status on payer mix, LOS, and in‐hospital mortality for general medicine patients at AMCs in the United States.
METHODS
The University HealthSystem Consortium (UHC) is an alliance of 117 AMCs and 310 affiliated hospitals, representing >90% of such institutions in the US. We queried the online UHC Clinical Data Base/Resource Manager (CDB/RM) to obtain hospital‐level insurance, LOS, and mortality data for inpatients discharged from a general medicine service between October 1, 2012 and September 30, 2015. We excluded hospitals that were missing data for any month within the study period. No patient‐level data were accessed.
Our outcomes of interest were the proportion of discharges by primary payer (Medicare, commercial, Medicaid, uninsured, or other [eg, Tri‐Care or Workers' Compensation]), as well as the LOS index and mortality index. Both indices were defined as the ratio of the observed to expected values. To determine the expected LOS and mortality, the UHC 2015 risk adjustment models were applied to all cases, adjusting for variables such as patient demographics, low socioeconomic status, admit source and status, severity of illness, and comorbid conditions, as described by International Classification of Diseases, Ninth Revision codes. These models have been validated and are used for research and quality benchmarking for member institutions.[19]
We next stratified hospitals according to state Medicaid expansion status. We defined Medicaid‐expansion states as those that had expanded Medicaid by the end of the study period: Arizona, Arkansas, California, Colorado, Connecticut, Illinois, Indiana, Iowa, Kentucky, Maryland, Massachusetts, Michigan, Minnesota, Nevada, New Hampshire, New Jersey, New Mexico, New York, Ohio, Oregon, Pennsylvania, Rhode Island, Washington, Washington DC, and West Virginia. Nonexpansion states included Alabama, Florida, Georgia, Kansas, Louisiana, Missouri, Nebraska, North Carolina, South Carolina, Tennessee, Texas, Utah, Virginia, and Wisconsin. We excluded 12 states due to incomplete data: Alaska, Delaware, Hawaii, Idaho, North Dakota, Maine, Mississippi, Montana, Oklahoma, South Dakota, Vermont, and Wyoming.
We then identified our pre‐ and post‐ACA implementation periods. Medicaid coverage expansion took effect in all expansion states on January 1, 2014, with the exception of Michigan (April 1, 2014), New Hampshire (August 15, 2014), Pennsylvania (January 1, 2015), and Indiana (February 1, 2015).[3] We therefore defined October 1, 2012 to December 31, 2013 as the pre‐ACA implementation period and January 1, 2014 to September 30, 2015 as the post‐ACA implementation period for all states except for Michigan, New Hampshire, Pennsylvania, and Indiana. For these 4 states, we customized the pre‐ and post‐ACA implementation periods to their respective dates of Medicaid expansion; for New Hampshire, we designated October 1, 2012 to July 31, 2014 as the pre‐ACA implementation period and September 1, 2014 to September 30, 2015 as the post‐ACA implementation period, as we were unable to distinguish before versus after data in August 2014 based on the midmonth expansion of Medicaid.
After stratifying hospitals into groups based on whether they were located in Medicaid‐expansion or nonexpansion states, the proportion of discharges by payer was compared between pre‐ and post‐ACA implementation periods both graphically by quarter and using linear regression models weighted for the number of cases from each hospital. Next, for both Medicaid‐expansion and nonexpansion hospitals, LOS index and mortality index were compared before and after ACA implementation using linear regression models weighted for the number of cases from each hospital, both overall and by payer. Difference‐in‐differences estimations were then completed to compare the proportion of discharges by payer, LOS index, and mortality index between Medicaid‐expansion and nonexpansion hospitals before and after ACA implementation. Post hoc linear regression analyses were completed to evaluate the effect of clustering by state level strata on payer mix and LOS and mortality indices. A 2‐sided P value of <0.05 was considered statistically significant. Data analyses were performed using Stata 12.0 (StataCorp, College Station, TX).
RESULTS
We identified 4,258,952 discharges among general medicine patients from 211 hospitals in 38 states and Washington, DC between October 1, 2012, and September 30, 2015. This included 3,144,488 discharges from 156 hospitals in 24 Medicaid‐expansion states and Washington, DC and 1,114,464 discharges from 55 hospitals in 14 nonexpansion states.
Figure 1 shows the trends in payer mix over time for hospitals in both Medicaid‐expansion and nonexpansion states. As summarized in Table 1, hospitals in Medicaid‐expansion states experienced a significant 3.7‐percentage point increase in Medicaid discharges (P = 0.013) and 2.9‐percentage point decrease in uninsured discharges (P < 0.001) after ACA implementation. This represented an approximately 19% jump and 60% drop in Medicaid and uninsured discharges, respectively. Hospitals in nonexpansion states saw no significant change in the proportion of discharges by payer after ACA implementation. In the difference‐in‐differences analysis, there was a trend toward a greater change in the proportion of Medicaid discharges pre‐ to post‐ACA implementation among hospitals in Medicaid‐expansion states compared to hospitals in nonexpansion states (mean difference‐in‐differences 4.1%, 95% confidence interval [CI]: 0.3%, 8.6%, P = 0.070).
| Medicaid‐expansion n=156 hospitals; 3,144,488 cases | Non‐expansion n=55 hospitals; 1,114,464 cases | |||||||||
|---|---|---|---|---|---|---|---|---|---|---|
| Pre‐ACA Implementation (1,453,090 Cases) | Post‐ACA Implementation (1,691,398 Cases) | Mean Difference | P Value | Pre‐ACA Implementation (455,440 Cases) | Post‐ACA Implementation (659,024 Cases) | Mean Difference | P Value | Mean Difference‐in‐Differences | P Value | |
| ||||||||||
| Payer mix, % (95% CI) | ||||||||||
| Medicare | 48.6 (46.2, 51.0)* | 48.3 (45.9, 50.7) | 0.3 (3.6, 3.1) | 0.865 | 44.3 (40.7, 47.7)* | 45.3 (41.9, 48.6) | 1.0 (3.8, 5.8) | 0.671 | 1.3 (7.1, 4.5) | 0.655 |
| Commercial | 23.1 (21.4, 24.7) | 23.2 (21.8, 24.6) | 0.2 (2.0, 2.3) | 0.882 | 21.5 (18.5, 24.6) | 22.7 (19.7, 25.8) | 1.2 (3.0, 5.4) | 0.574 | 1.0 (5.7, 3.6) | 0.662 |
| Medicaid | 19.6 (17.6, 21.6) | 23.3 (21.2, 25.5) | 3.7 (0.8, 6.6) | 0.013 | 19.4 (16.9, 21.9) | 19.0 (16.5, 21.4) | 0.4 (3.8, 3.0) | 0.812 | 4.1 (0.3, 8.6) | 0.070 |
| Uninsured | 5.0 (4.0, 5.9) | 2.0 (1.7, 2.3) | 2.9 (3.9, 2.0) | <0.001 | 10.9 (8.1, 13.7) | 9.4 (7.0, 11.7) | 1.5 (5.1, 2.1) | 0.407 | 1.4 (5.1, 2.2) | 0.442 |
| Other | 3.8 (2.6, 4.9) | 3.1 (2.0, 4.3) | 0.7 (2.3, 1.0) | 0.435 | 4.0 (2.9, 5.0) | 3.7 (2.6, 4.7) | 0.3 (1.7, 1.1) | 0.662 | 0.3 (2.5, 1.8) | 0.762 |
| LOS index, mean (95% CI) | ||||||||||
| Overall | 1.017 (0.996, 1.038) | 1.006 (0.981, 1.031) | 0.011 (0.044, 0.021) | 0.488 | 1.008 (0.974, 1.042) | 0.995 (0.961, 1.029) | 0.013 (0.061, 0.034) | 0.574 | 0.002 (0.055, 0.059) | 0.943 |
| Medicare | 1.012 (0.989, 1.035) | 0.999 (0.971, 1.027) | 0.013 (0.049, 0.023) | 0.488 | 0.982 (0.946, 1.017) | 0.979 (0.944, 1.013) | 0.003 (0.052, 0.046) | 0.899 | 0.010 (0.070, 0.051) | 0.754 |
| Commercial | 0.993 (0.974, 1.012) | 0.977 (0.955, 0.998) | 0.016 (0.045, 0.013) | 0.271 | 1.009 (0.978, 1.039) | 0.986 (0.956, 1.016) | 0.022 (0.065, 0.020) | 0.298 | 0.006 (0.044, 0.057) | 0.809 |
| Medicaid | 1.059 (1.036, 1.082) | 1.043 (1.018, 1.067) | 0.016 (0.049, 0.017) | 0.349 | 1.064 (1.020, 1.108) | 1.060 (1.015, 1.106) | 0.004 (0.066, 0.059) | 0.911 | 0.012 (0.082, 0.057) | 0.727 |
| Uninsured | 0.960 (0.933, 0.988) | 0.925 (0.890, 0.961) | 0.035 (0.080, 0.010) | 0.126 | 0.972 (0.935, 1.009) | 0.944 (0.909, 0.979) | 0.028 (0.078, 0.022) | 0.273 | 0.007 (0.074, 0.060) | 0.835 |
| Other | 0.988 (0.960, 1.017) | 0.984 (0.952, 1.015) | 0.005 (0.047, 0.037) | 0.822 | 1.022 (0.973, 1.071) | 0.984 (0.944, 1.024) | 0.038 (0.100, 0.024) | 0.232 | 0.033 (0.042, 0.107) | 0.386 |
| Mortality index, mean (95% CI) | ||||||||||
| Overall | 1.000 (0.955, 1.045) | 0.878 (0.836, 0.921) | 0.122 (0.183, 0.061) | <0.001 | 0.997 (0.931, 1.062) | 0.850 (0.800, 0.900) | 0.147 (0.227, 0.066) | 0.001 | 0.025 (0.076, 0.125) | 0.628 |
| Medicare | 0.990 (0.942, 1.038) | 0.871 (0.826, 0.917) | 0.119 (0.185, 0.053) | <0.001 | 1.000 (0.925, 1.076) | 0.844 (0.788, 0.900) | 0.156 (0.249, 0.064) | 0.001 | 0.038 (0.075, 0.150) | 0.513 |
| Commercial | 1.045 (0.934, 1.155) | 0.908 (0.842, 0.975) | 0.136 (0.264, 0.008) | 0.037 | 1.023 (0.935, 1.111) | 0.820 (0.758, 0.883) | 0.203 (0.309, 0.096) | <0.001 | 0.067 (0.099, 0.232) | 0.430 |
| Medicaid | 0.894 (0.845, 0.942) | 0.786 (0.748, 0.824) | 0.107 (0.168, 0.046) | 0.001 | 0.937 (0.861, 1.013) | 0.789 (0.733, 0.844) | 0.148 (0.242, 0.055) | 0.002 | 0.041 (0.069, 0.151) | 0.464 |
| Uninsured | 1.172 (1.007, 1.337)∥ | 1.136 (0.968, 1.303) | 0.037 (0.271, 0.197) | 0.758 | 0.868 (0.768, 0.968)∥ | 0.850 (0.761, 0.939) | 0.017 (0.149, 0.115) | 0.795 | 0.019 (0.287, 0.248) | 0.887 |
| Other | 1.376 (1.052, 1.700)# | 1.156 (0.910, 1.402) | 0.220 (0.624, 0.184) | 0.285 | 1.009 (0.868, 1.150) # | 0.874 (0.682, 1.066) | 0.135 (0.369, 0.099) | 0.254 | 0.085 (0.555, 0.380) | 0.720 |

Table 1 shows that the overall LOS index remained unchanged pre‐ to post‐ACA implementation for both Medicaid‐expansion (1.017 to 1.006, P = 0.488) and nonexpansion hospitals (1.008 to 0.995, P = 0.574). LOS indices for each payer type also remained unchanged. The overall mortality index significantly improved pre‐ to post‐ACA implementation for both Medicaid‐expansion (1.000 to 0.878, P < 0.001) and nonexpansion hospitals (0.997 to 0.850, P = 0.001). Among both Medicaid‐expansion and nonexpansion hospitals, the mortality index significantly improved for Medicare, commercial, and Medicaid discharges but not for uninsured or other discharges. In the difference‐in‐differences analysis, the changes in LOS indices and mortality indices pre‐ to post‐ACA implementation did not differ significantly between hospitals in Medicaid‐expansion versus nonexpansion states.
In post hoc linear regression analyses of payer mix and LOS and mortality indices clustered by state‐level strata, point estimates were minimally changed. Although 95% CIs were slightly wider, statistical significance was unchanged from our primary analyses (data not shown).
DISCUSSION
We found that ACA implementation had a significant impact on payer mix for general medicine patients at AMCs in the United States, primarily by increasing the number of Medicaid beneficiaries and by decreasing the number of uninsured patients in Medicaid‐expansion states. State Medicaid expansion status did not appear to influence either LOS or in‐hospital mortality.
Our study offers some of the longest‐term data currently available on the impact of ACA implementation on payer mix trends and encompasses more states than others have previously. Although we uniquely focused on general medicine patients at AMCs, our results are similar to those seen for US hospitals overall. Nikpay and colleagues evaluated payer mix trends for non‐Medicare adult inpatient stays in 16 states through the second quarter of 2014 using the Healthcare Cost and Utilization Project database through the Agency for Healthcare Research and Quality.[4] They found a relative 20% increase and 50% decrease in Medicaid and uninsured discharges in Medicaid‐expansion states, along with nonsignificant changes in nonexpansion states. Hempstead and Cantor assessed payer mix for non‐Medicare discharges using state hospital association data from 21 states through the fourth quarter of 2014 and found a significant increase in Medicaid patients as well as a nearly significant decrease in uninsured patients in expansion states relative to nonexpansion states.[5] The Department of Health and Human Services also reported that uninsured/self‐pay discharges fell substantially (65%73%) in Medicaid‐expansion states by the end of 2014, with slight decreases in nonexpansion states.[20]
In contrast to our hypothesis, the overall LOS and in‐hospital mortality indices were not influenced by state Medicaid expansion status. From a purely mathematical standpoint, the contribution of Medicaid patients to the overall LOS and mortality indices may have been eclipsed by Medicare and commercially insured patients, who represented a higher proportion of total discharges. The lack of impact of state Medicaid expansion status on overall LOS and mortality indices did not appear to occur as a result of indices for Medicaid patients trending toward the mean. As predicted based on observational studies, Medicaid patients in our study tended to have a higher LOS index than those with other insurance types. Medicaid patients actually tended to have a lower mortality index in our analysis; the reason for this latter finding is unclear and in contrast to other published studies.[6, 7, 8, 9, 10, 11, 12, 13, 14, 15, 21]
To our knowledge, no other studies have evaluated the effect of payer mix changes under the ACA on inpatient outcomes. However, new evidence is emerging on outpatient outcomes. Low‐income adults in Medicaid‐expansion states have reported greater gains in access to primary care services and in the diagnosis of certain chronic health conditions than those in nonexpansion states as a result of ACA implementation.[22, 23] Such improvements in the outpatient setting might be expected to reduce patient acuity on admission. However, they would not necessarily translate to relative improvements in LOS or mortality indices for Medicaid‐expansion hospitals, as the UHC risk adjustment models controlled for disease severity on admission.
Similarly, few studies have assessed the impact of payer mix changes under previous state Medicaid expansions on inpatient outcomes. After Massachusetts expanded Medicaid and enacted near‐universal healthcare coverage in 2006, a minimal LOS reduction of just 0.05 days was observed.[24] New York expanded Medicaid eligibility to nondisabled childless adults with incomes below 100% of the federal poverty level in September 2001, whereas Arizona did so in November 2001 and Maine in October 2002. A study comparing outcomes in these states to 4 neighboring nonexpansion states found a relative reduction in annual all‐cause mortality of 6.1% population wide; however, it did not assess in‐hospital mortality.[25] The Oregon Health Insurance Experiment that randomized low‐income adults to expanded Medicaid coverage or not in 2008 has also reported on outpatient rather than inpatient outcomes.[26]
Our findings have potential implications for health policymakers. That Medicaid expansion status had a neutral effect on both LOS and mortality indices in our analysis should be reassuring for states contemplating Medicaid expansion in the future. Our results also highlight the need for further efforts to reduce disparities in inpatient care based on payer status. For example, although Medicare, commercially insured, and Medicaid patients witnessed significant improvements in mortality indices pre‐ to post‐ACA implementation in hospitals in both Medicaid‐expansion and nonexpansion states, uninsured patients did not.
This study has several limitations. First, our analysis of the impact of ACA implementation on payer mix did not account for concurrent socioeconomic trends that may have influenced insurance coverage across the United States. However, the main goal of this analysis was to demonstrate that changes in payer mix did in fact occur over time, to provide rationale for our subsequent LOS and mortality analyses. Second, we could not control for variation in the design and implementation of Medicaid expansions across states as permitted under the federal Section 1115 waiver process. Third, we only had access to hospital‐level data through the UHC CDB/RM, rather than individual patient data. We attempted to mitigate this limitation by weighting data according to the number of cases per hospital. Lastly, additional patient‐level factors that may influence LOS or mortality may not be included in the UHC risk adjustment models.
In summary, the differential shift in payer mix between Medicaid‐expansion and nonexpansion states did not influence overall LOS or in‐hospital mortality for general medicine patients at AMCs in the United States. Additional research could help to determine the impact of ACA implementation on other patient outcomes that may be dependent on insurance status, such as readmissions or hospital‐acquired complications.
Disclosures: M.E.A. conceived of the study concept and design, assisted with data acquisition, and drafted the manuscript. J.J.G. assisted with study design and made critical revisions to the manuscript. D.A. assisted with study design and made critical revisions to the manuscript. R.P. assisted with study design and made critical revisions to the manuscript. M.L. assisted with study design and data acquisition and made critical revisions to the manuscript. C.D.J. assisted with study design, performed data analyses, and made critical revisions to the manuscript. A modified abstract was presented in poster format at the University HealthSystem Consortium Annual Conference held September 30 to October 2, 2015 in Orlando, Florida, as well as at the Society of Hospital Medicine Research, Innovations, and Vignettes 2016 Annual Meeting held March 69, 2016, in San Diego, California. The authors report no conflicts of interest.
- Department of Health and Human Services. Key features of the Affordable Care Act by year. Available at: http://www.hhs.gov/healthcare/facts‐and‐features/key‐features‐of‐aca‐by‐year/index.html#2014. Accessed April 4, 2016.
- Centers for Medicare and Medicaid Services. Medicaid enrollment data collected through MBES. Available at: https://www.medicaid.gov/medicaid‐chip‐program‐information/program‐information/medicaid‐and‐chip‐enrollment‐data/medicaid‐enrollment‐data‐collected‐through‐mbes.html. Accessed April 4, 2016.
- The Henry J. Kaiser Family Foundation. Status of state action on the Medicaid expansion decision. Available at: http://kff.org/health‐reform/state‐indicator/state‐activity‐around‐expanding‐medicaid‐under‐the‐affordable‐care‐act. Accessed April 4, 2016.
- , , . Affordable Care Act Medicaid expansion reduced uninsured hospital stays in 2014. Health Aff (Millwood). 2016;35(1):106–110.
- , . State Medicaid expansion and changes in hospital volume according to payer. N Engl J Med. 2016;374(2):196–198.
- , , , , , . Understanding predictors of prolonged hospitalizations among general medicine patients: a guide and preliminary analysis. J Hosp Med. 2015;10(9):623–626.
- , , , . Impact of insurance and hospital ownership on hospital length of stay among patients with ambulatory care‐sensitive conditions. Ann Fam Med. 2011;9:489–495.
- , , . Insurance status and hospital care for myocardial infarction, stroke, and pneumonia. J Hosp Med. 2010;5:452–459.
- , , , , , . Payment source, quality of care, and outcomes in patients hospitalized with heart failure. J Am Coll Cardiol. 2011;58(14):1465–1471.
- , , , , . The inpatient experience and predictors of length of stay for patients hospitalized with systolic heart failure: comparison by commercial, Medicaid, and Medicare payer type. J Med Econ. 2013;16(1):43–54.
- , , et al. Insurance coverage and care of patients with non‐ST‐segment elevation acute coronary syndromes. Ann Intern Med. 2006;145:739–748.
- , , , et al. Association of insurance status with inpatient treatment for coronary artery disease: findings from the Get with the Guidelines Program. Am Heart J. 2010;159:1026–1036.
- , , , et al. Primary payer status affects mortality for major surgical operations. Ann Surg. 2010;252:544–551.
- , , . Medicaid payer status is associated with in‐hospital morbidity and resource utilization following primary total joint arthroplasty. J Bone Joint Surg Am. 2014;96(21):e180.
- , , . The quality of care delivered to patients within the same hospital varies by insurance type. Health Aff (Millwood). 2013;32(10):1731–1739.
- , , , , . Effect of insurance status on postacute care among working age stroke survivors. Neurology. 2012;78(20):1590–1595.
- , , , . Hospitalizations in which patients leave the hospital against medical advice (AMA), 2007. HCUP statistical brief #78. August 2009. Rockville, MD: Agency for Healthcare Research and Quality; 2009. Available at: http://www.hcup‐us.ahrq.gov/reports/statbriefs/sb78.pdf. Accessed May 12, 2016.
- , , , . Characteristics of Medicaid and uninsured hospitalizations, 2012. HCUP statistical brief #182. Rockville, MD: Agency for Healthcare Research and Quality; 2014. Available at: http://www.hcup‐us.ahrq.gov/reports/statbriefs/sb182‐Medicaid‐Uninsured‐Hospitalizations‐2012.pdf. Accessed March 9, 2016.
- Agency for Healthcare Research and Quality. Mortality measurement: mortality risk adjustment methodology for University HealthSystem Consortium. Available at: http://archive.ahrq.gov/professionals/quality‐patient‐safety/quality‐resources/tools/mortality/Meurer.pdf. Accessed May 10, 2016.
- Department of Health and Human Services. Insurance expansion, hospital uncompensated care, and the Affordable Care Act. Available at: https://aspe.hhs.gov/pdf‐report/insurance‐expansion‐hospital‐uncompensated‐care‐and‐affordable‐care‐act. Accessed May 27, 2016.
- , , , . Our flawed but beneficial Medicaid program. N Engl J Med. 2011;364(16):e31.
- , , , . Changes in self‐reported insurance coverage, access to care, and health under the Affordable Care Act. JAMA. 2015;314(4):366–374.
- , . Early coverage, access, utilization, and health effects associated with the Affordable Care Act Medicaid Expansions: a quasi‐experimental study. Ann Intern Med. 2016;164(12):795–803.
- , . The impact of health care reform on hospital and preventive care: evidence from Massachusetts. J Public Econ. 2012;96(11–12):909–929.
- , , . Mortality and access to care among adults after state Medicaid expansions. N Engl J Med. 2012;367:1025–1034.
- , , , et al. The Oregon Experiment—effects of Medicaid on clinical outcomes. N Engl J Med. 2013;368(18):1713–1722.
On January 1, 2014, several major provisions of the Affordable Care Act (ACA) took effect, including introduction of the individual mandate for health insurance coverage, opening of the Health Insurance Marketplace, and expansion of Medicaid eligibility to Americans earning up to 133% of the federal poverty level.[1] Nearly 9 million US adults have enrolled in Medicaid since that time, primarily in the 31 states and Washington, DC that have opted into Medicaid expansion.[2, 3] ACA implementation has also had a significant impact on hospital payer mix, primarily by reducing the volume of uncompensated care in Medicaid‐expansion states.[4, 5]
The differential shift in payer mix in Medicaid‐expansion versus nonexpansion states may be relevant to hospitals beyond reimbursement. Medicaid insurance has historically been associated with longer hospitalizations and higher in‐hospital mortality in diverse patient populations, more so than commercial insurance and often even uninsured payer status.[6, 7, 8, 9, 10, 11, 12, 13, 14, 15] The disparity in outcomes between patients with Medicaid versus other insurance persists even after adjustment for disease severity and baseline comorbidities. Insurance type may influence the delivery of inpatient care through variation in access to invasive procedures and adherence to guideline‐concordant medical therapies.[9, 10, 11, 12] Medicaid patients may be more likely than uninsured patients to remain hospitalized pending postacute care placement rather than be discharged home with family support.[16] Medicaid patients are also less likely to leave against medical advice than uninsured patients.[17]
Currently, little is known about the impact of state Medicaid expansion status on length of stay (LOS) or mortality nationally. It is possible that hospitals in Medicaid‐expansion states have experienced relative worsening in LOS and mortality as their share of Medicaid patients has grown. Determining the impact of ACA implementation on payer mix and patient outcomes is particularly important for academic medical centers (AMCs), as they traditionally care for the greatest percentage of both Medicaid and uninsured patients.[18] We sought to characterize the impact of state Medicaid expansion status on payer mix, LOS, and in‐hospital mortality for general medicine patients at AMCs in the United States.
METHODS
The University HealthSystem Consortium (UHC) is an alliance of 117 AMCs and 310 affiliated hospitals, representing >90% of such institutions in the US. We queried the online UHC Clinical Data Base/Resource Manager (CDB/RM) to obtain hospital‐level insurance, LOS, and mortality data for inpatients discharged from a general medicine service between October 1, 2012 and September 30, 2015. We excluded hospitals that were missing data for any month within the study period. No patient‐level data were accessed.
Our outcomes of interest were the proportion of discharges by primary payer (Medicare, commercial, Medicaid, uninsured, or other [eg, Tri‐Care or Workers' Compensation]), as well as the LOS index and mortality index. Both indices were defined as the ratio of the observed to expected values. To determine the expected LOS and mortality, the UHC 2015 risk adjustment models were applied to all cases, adjusting for variables such as patient demographics, low socioeconomic status, admit source and status, severity of illness, and comorbid conditions, as described by International Classification of Diseases, Ninth Revision codes. These models have been validated and are used for research and quality benchmarking for member institutions.[19]
We next stratified hospitals according to state Medicaid expansion status. We defined Medicaid‐expansion states as those that had expanded Medicaid by the end of the study period: Arizona, Arkansas, California, Colorado, Connecticut, Illinois, Indiana, Iowa, Kentucky, Maryland, Massachusetts, Michigan, Minnesota, Nevada, New Hampshire, New Jersey, New Mexico, New York, Ohio, Oregon, Pennsylvania, Rhode Island, Washington, Washington DC, and West Virginia. Nonexpansion states included Alabama, Florida, Georgia, Kansas, Louisiana, Missouri, Nebraska, North Carolina, South Carolina, Tennessee, Texas, Utah, Virginia, and Wisconsin. We excluded 12 states due to incomplete data: Alaska, Delaware, Hawaii, Idaho, North Dakota, Maine, Mississippi, Montana, Oklahoma, South Dakota, Vermont, and Wyoming.
We then identified our pre‐ and post‐ACA implementation periods. Medicaid coverage expansion took effect in all expansion states on January 1, 2014, with the exception of Michigan (April 1, 2014), New Hampshire (August 15, 2014), Pennsylvania (January 1, 2015), and Indiana (February 1, 2015).[3] We therefore defined October 1, 2012 to December 31, 2013 as the pre‐ACA implementation period and January 1, 2014 to September 30, 2015 as the post‐ACA implementation period for all states except for Michigan, New Hampshire, Pennsylvania, and Indiana. For these 4 states, we customized the pre‐ and post‐ACA implementation periods to their respective dates of Medicaid expansion; for New Hampshire, we designated October 1, 2012 to July 31, 2014 as the pre‐ACA implementation period and September 1, 2014 to September 30, 2015 as the post‐ACA implementation period, as we were unable to distinguish before versus after data in August 2014 based on the midmonth expansion of Medicaid.
After stratifying hospitals into groups based on whether they were located in Medicaid‐expansion or nonexpansion states, the proportion of discharges by payer was compared between pre‐ and post‐ACA implementation periods both graphically by quarter and using linear regression models weighted for the number of cases from each hospital. Next, for both Medicaid‐expansion and nonexpansion hospitals, LOS index and mortality index were compared before and after ACA implementation using linear regression models weighted for the number of cases from each hospital, both overall and by payer. Difference‐in‐differences estimations were then completed to compare the proportion of discharges by payer, LOS index, and mortality index between Medicaid‐expansion and nonexpansion hospitals before and after ACA implementation. Post hoc linear regression analyses were completed to evaluate the effect of clustering by state level strata on payer mix and LOS and mortality indices. A 2‐sided P value of <0.05 was considered statistically significant. Data analyses were performed using Stata 12.0 (StataCorp, College Station, TX).
RESULTS
We identified 4,258,952 discharges among general medicine patients from 211 hospitals in 38 states and Washington, DC between October 1, 2012, and September 30, 2015. This included 3,144,488 discharges from 156 hospitals in 24 Medicaid‐expansion states and Washington, DC and 1,114,464 discharges from 55 hospitals in 14 nonexpansion states.
Figure 1 shows the trends in payer mix over time for hospitals in both Medicaid‐expansion and nonexpansion states. As summarized in Table 1, hospitals in Medicaid‐expansion states experienced a significant 3.7‐percentage point increase in Medicaid discharges (P = 0.013) and 2.9‐percentage point decrease in uninsured discharges (P < 0.001) after ACA implementation. This represented an approximately 19% jump and 60% drop in Medicaid and uninsured discharges, respectively. Hospitals in nonexpansion states saw no significant change in the proportion of discharges by payer after ACA implementation. In the difference‐in‐differences analysis, there was a trend toward a greater change in the proportion of Medicaid discharges pre‐ to post‐ACA implementation among hospitals in Medicaid‐expansion states compared to hospitals in nonexpansion states (mean difference‐in‐differences 4.1%, 95% confidence interval [CI]: 0.3%, 8.6%, P = 0.070).
| Medicaid‐expansion n=156 hospitals; 3,144,488 cases | Non‐expansion n=55 hospitals; 1,114,464 cases | |||||||||
|---|---|---|---|---|---|---|---|---|---|---|
| Pre‐ACA Implementation (1,453,090 Cases) | Post‐ACA Implementation (1,691,398 Cases) | Mean Difference | P Value | Pre‐ACA Implementation (455,440 Cases) | Post‐ACA Implementation (659,024 Cases) | Mean Difference | P Value | Mean Difference‐in‐Differences | P Value | |
| ||||||||||
| Payer mix, % (95% CI) | ||||||||||
| Medicare | 48.6 (46.2, 51.0)* | 48.3 (45.9, 50.7) | 0.3 (3.6, 3.1) | 0.865 | 44.3 (40.7, 47.7)* | 45.3 (41.9, 48.6) | 1.0 (3.8, 5.8) | 0.671 | 1.3 (7.1, 4.5) | 0.655 |
| Commercial | 23.1 (21.4, 24.7) | 23.2 (21.8, 24.6) | 0.2 (2.0, 2.3) | 0.882 | 21.5 (18.5, 24.6) | 22.7 (19.7, 25.8) | 1.2 (3.0, 5.4) | 0.574 | 1.0 (5.7, 3.6) | 0.662 |
| Medicaid | 19.6 (17.6, 21.6) | 23.3 (21.2, 25.5) | 3.7 (0.8, 6.6) | 0.013 | 19.4 (16.9, 21.9) | 19.0 (16.5, 21.4) | 0.4 (3.8, 3.0) | 0.812 | 4.1 (0.3, 8.6) | 0.070 |
| Uninsured | 5.0 (4.0, 5.9) | 2.0 (1.7, 2.3) | 2.9 (3.9, 2.0) | <0.001 | 10.9 (8.1, 13.7) | 9.4 (7.0, 11.7) | 1.5 (5.1, 2.1) | 0.407 | 1.4 (5.1, 2.2) | 0.442 |
| Other | 3.8 (2.6, 4.9) | 3.1 (2.0, 4.3) | 0.7 (2.3, 1.0) | 0.435 | 4.0 (2.9, 5.0) | 3.7 (2.6, 4.7) | 0.3 (1.7, 1.1) | 0.662 | 0.3 (2.5, 1.8) | 0.762 |
| LOS index, mean (95% CI) | ||||||||||
| Overall | 1.017 (0.996, 1.038) | 1.006 (0.981, 1.031) | 0.011 (0.044, 0.021) | 0.488 | 1.008 (0.974, 1.042) | 0.995 (0.961, 1.029) | 0.013 (0.061, 0.034) | 0.574 | 0.002 (0.055, 0.059) | 0.943 |
| Medicare | 1.012 (0.989, 1.035) | 0.999 (0.971, 1.027) | 0.013 (0.049, 0.023) | 0.488 | 0.982 (0.946, 1.017) | 0.979 (0.944, 1.013) | 0.003 (0.052, 0.046) | 0.899 | 0.010 (0.070, 0.051) | 0.754 |
| Commercial | 0.993 (0.974, 1.012) | 0.977 (0.955, 0.998) | 0.016 (0.045, 0.013) | 0.271 | 1.009 (0.978, 1.039) | 0.986 (0.956, 1.016) | 0.022 (0.065, 0.020) | 0.298 | 0.006 (0.044, 0.057) | 0.809 |
| Medicaid | 1.059 (1.036, 1.082) | 1.043 (1.018, 1.067) | 0.016 (0.049, 0.017) | 0.349 | 1.064 (1.020, 1.108) | 1.060 (1.015, 1.106) | 0.004 (0.066, 0.059) | 0.911 | 0.012 (0.082, 0.057) | 0.727 |
| Uninsured | 0.960 (0.933, 0.988) | 0.925 (0.890, 0.961) | 0.035 (0.080, 0.010) | 0.126 | 0.972 (0.935, 1.009) | 0.944 (0.909, 0.979) | 0.028 (0.078, 0.022) | 0.273 | 0.007 (0.074, 0.060) | 0.835 |
| Other | 0.988 (0.960, 1.017) | 0.984 (0.952, 1.015) | 0.005 (0.047, 0.037) | 0.822 | 1.022 (0.973, 1.071) | 0.984 (0.944, 1.024) | 0.038 (0.100, 0.024) | 0.232 | 0.033 (0.042, 0.107) | 0.386 |
| Mortality index, mean (95% CI) | ||||||||||
| Overall | 1.000 (0.955, 1.045) | 0.878 (0.836, 0.921) | 0.122 (0.183, 0.061) | <0.001 | 0.997 (0.931, 1.062) | 0.850 (0.800, 0.900) | 0.147 (0.227, 0.066) | 0.001 | 0.025 (0.076, 0.125) | 0.628 |
| Medicare | 0.990 (0.942, 1.038) | 0.871 (0.826, 0.917) | 0.119 (0.185, 0.053) | <0.001 | 1.000 (0.925, 1.076) | 0.844 (0.788, 0.900) | 0.156 (0.249, 0.064) | 0.001 | 0.038 (0.075, 0.150) | 0.513 |
| Commercial | 1.045 (0.934, 1.155) | 0.908 (0.842, 0.975) | 0.136 (0.264, 0.008) | 0.037 | 1.023 (0.935, 1.111) | 0.820 (0.758, 0.883) | 0.203 (0.309, 0.096) | <0.001 | 0.067 (0.099, 0.232) | 0.430 |
| Medicaid | 0.894 (0.845, 0.942) | 0.786 (0.748, 0.824) | 0.107 (0.168, 0.046) | 0.001 | 0.937 (0.861, 1.013) | 0.789 (0.733, 0.844) | 0.148 (0.242, 0.055) | 0.002 | 0.041 (0.069, 0.151) | 0.464 |
| Uninsured | 1.172 (1.007, 1.337)∥ | 1.136 (0.968, 1.303) | 0.037 (0.271, 0.197) | 0.758 | 0.868 (0.768, 0.968)∥ | 0.850 (0.761, 0.939) | 0.017 (0.149, 0.115) | 0.795 | 0.019 (0.287, 0.248) | 0.887 |
| Other | 1.376 (1.052, 1.700)# | 1.156 (0.910, 1.402) | 0.220 (0.624, 0.184) | 0.285 | 1.009 (0.868, 1.150) # | 0.874 (0.682, 1.066) | 0.135 (0.369, 0.099) | 0.254 | 0.085 (0.555, 0.380) | 0.720 |
Table 1 shows that the overall LOS index remained unchanged pre‐ to post‐ACA implementation for both Medicaid‐expansion (1.017 to 1.006, P = 0.488) and nonexpansion hospitals (1.008 to 0.995, P = 0.574). LOS indices for each payer type also remained unchanged. The overall mortality index significantly improved pre‐ to post‐ACA implementation for both Medicaid‐expansion (1.000 to 0.878, P < 0.001) and nonexpansion hospitals (0.997 to 0.850, P = 0.001). Among both Medicaid‐expansion and nonexpansion hospitals, the mortality index significantly improved for Medicare, commercial, and Medicaid discharges but not for uninsured or other discharges. In the difference‐in‐differences analysis, the changes in LOS indices and mortality indices pre‐ to post‐ACA implementation did not differ significantly between hospitals in Medicaid‐expansion versus nonexpansion states.
In post hoc linear regression analyses of payer mix and LOS and mortality indices clustered by state‐level strata, point estimates were minimally changed. Although 95% CIs were slightly wider, statistical significance was unchanged from our primary analyses (data not shown).
DISCUSSION
We found that ACA implementation had a significant impact on payer mix for general medicine patients at AMCs in the United States, primarily by increasing the number of Medicaid beneficiaries and by decreasing the number of uninsured patients in Medicaid‐expansion states. State Medicaid expansion status did not appear to influence either LOS or in‐hospital mortality.
Our study offers some of the longest‐term data currently available on the impact of ACA implementation on payer mix trends and encompasses more states than others have previously. Although we uniquely focused on general medicine patients at AMCs, our results are similar to those seen for US hospitals overall. Nikpay and colleagues evaluated payer mix trends for non‐Medicare adult inpatient stays in 16 states through the second quarter of 2014 using the Healthcare Cost and Utilization Project database through the Agency for Healthcare Research and Quality.[4] They found a relative 20% increase and 50% decrease in Medicaid and uninsured discharges in Medicaid‐expansion states, along with nonsignificant changes in nonexpansion states. Hempstead and Cantor assessed payer mix for non‐Medicare discharges using state hospital association data from 21 states through the fourth quarter of 2014 and found a significant increase in Medicaid patients as well as a nearly significant decrease in uninsured patients in expansion states relative to nonexpansion states.[5] The Department of Health and Human Services also reported that uninsured/self‐pay discharges fell substantially (65%73%) in Medicaid‐expansion states by the end of 2014, with slight decreases in nonexpansion states.[20]
In contrast to our hypothesis, the overall LOS and in‐hospital mortality indices were not influenced by state Medicaid expansion status. From a purely mathematical standpoint, the contribution of Medicaid patients to the overall LOS and mortality indices may have been eclipsed by Medicare and commercially insured patients, who represented a higher proportion of total discharges. The lack of impact of state Medicaid expansion status on overall LOS and mortality indices did not appear to occur as a result of indices for Medicaid patients trending toward the mean. As predicted based on observational studies, Medicaid patients in our study tended to have a higher LOS index than those with other insurance types. Medicaid patients actually tended to have a lower mortality index in our analysis; the reason for this latter finding is unclear and in contrast to other published studies.[6, 7, 8, 9, 10, 11, 12, 13, 14, 15, 21]
To our knowledge, no other studies have evaluated the effect of payer mix changes under the ACA on inpatient outcomes. However, new evidence is emerging on outpatient outcomes. Low‐income adults in Medicaid‐expansion states have reported greater gains in access to primary care services and in the diagnosis of certain chronic health conditions than those in nonexpansion states as a result of ACA implementation.[22, 23] Such improvements in the outpatient setting might be expected to reduce patient acuity on admission. However, they would not necessarily translate to relative improvements in LOS or mortality indices for Medicaid‐expansion hospitals, as the UHC risk adjustment models controlled for disease severity on admission.
Similarly, few studies have assessed the impact of payer mix changes under previous state Medicaid expansions on inpatient outcomes. After Massachusetts expanded Medicaid and enacted near‐universal healthcare coverage in 2006, a minimal LOS reduction of just 0.05 days was observed.[24] New York expanded Medicaid eligibility to nondisabled childless adults with incomes below 100% of the federal poverty level in September 2001, whereas Arizona did so in November 2001 and Maine in October 2002. A study comparing outcomes in these states to 4 neighboring nonexpansion states found a relative reduction in annual all‐cause mortality of 6.1% population wide; however, it did not assess in‐hospital mortality.[25] The Oregon Health Insurance Experiment that randomized low‐income adults to expanded Medicaid coverage or not in 2008 has also reported on outpatient rather than inpatient outcomes.[26]
Our findings have potential implications for health policymakers. That Medicaid expansion status had a neutral effect on both LOS and mortality indices in our analysis should be reassuring for states contemplating Medicaid expansion in the future. Our results also highlight the need for further efforts to reduce disparities in inpatient care based on payer status. For example, although Medicare, commercially insured, and Medicaid patients witnessed significant improvements in mortality indices pre‐ to post‐ACA implementation in hospitals in both Medicaid‐expansion and nonexpansion states, uninsured patients did not.
This study has several limitations. First, our analysis of the impact of ACA implementation on payer mix did not account for concurrent socioeconomic trends that may have influenced insurance coverage across the United States. However, the main goal of this analysis was to demonstrate that changes in payer mix did in fact occur over time, to provide rationale for our subsequent LOS and mortality analyses. Second, we could not control for variation in the design and implementation of Medicaid expansions across states as permitted under the federal Section 1115 waiver process. Third, we only had access to hospital‐level data through the UHC CDB/RM, rather than individual patient data. We attempted to mitigate this limitation by weighting data according to the number of cases per hospital. Lastly, additional patient‐level factors that may influence LOS or mortality may not be included in the UHC risk adjustment models.
In summary, the differential shift in payer mix between Medicaid‐expansion and nonexpansion states did not influence overall LOS or in‐hospital mortality for general medicine patients at AMCs in the United States. Additional research could help to determine the impact of ACA implementation on other patient outcomes that may be dependent on insurance status, such as readmissions or hospital‐acquired complications.
Disclosures: M.E.A. conceived of the study concept and design, assisted with data acquisition, and drafted the manuscript. J.J.G. assisted with study design and made critical revisions to the manuscript. D.A. assisted with study design and made critical revisions to the manuscript. R.P. assisted with study design and made critical revisions to the manuscript. M.L. assisted with study design and data acquisition and made critical revisions to the manuscript. C.D.J. assisted with study design, performed data analyses, and made critical revisions to the manuscript. A modified abstract was presented in poster format at the University HealthSystem Consortium Annual Conference held September 30 to October 2, 2015 in Orlando, Florida, as well as at the Society of Hospital Medicine Research, Innovations, and Vignettes 2016 Annual Meeting held March 69, 2016, in San Diego, California. The authors report no conflicts of interest.
- Department of Health and Human Services. Key features of the Affordable Care Act by year. Available at: http://www.hhs.gov/healthcare/facts‐and‐features/key‐features‐of‐aca‐by‐year/index.html#2014. Accessed April 4, 2016.
- Centers for Medicare and Medicaid Services. Medicaid enrollment data collected through MBES. Available at: https://www.medicaid.gov/medicaid‐chip‐program‐information/program‐information/medicaid‐and‐chip‐enrollment‐data/medicaid‐enrollment‐data‐collected‐through‐mbes.html. Accessed April 4, 2016.
- The Henry J. Kaiser Family Foundation. Status of state action on the Medicaid expansion decision. Available at: http://kff.org/health‐reform/state‐indicator/state‐activity‐around‐expanding‐medicaid‐under‐the‐affordable‐care‐act. Accessed April 4, 2016.
- , , . Affordable Care Act Medicaid expansion reduced uninsured hospital stays in 2014. Health Aff (Millwood). 2016;35(1):106–110.
- , . State Medicaid expansion and changes in hospital volume according to payer. N Engl J Med. 2016;374(2):196–198.
- , , , , , . Understanding predictors of prolonged hospitalizations among general medicine patients: a guide and preliminary analysis. J Hosp Med. 2015;10(9):623–626.
- , , , . Impact of insurance and hospital ownership on hospital length of stay among patients with ambulatory care‐sensitive conditions. Ann Fam Med. 2011;9:489–495.
- , , . Insurance status and hospital care for myocardial infarction, stroke, and pneumonia. J Hosp Med. 2010;5:452–459.
- , , , , , . Payment source, quality of care, and outcomes in patients hospitalized with heart failure. J Am Coll Cardiol. 2011;58(14):1465–1471.
- , , , , . The inpatient experience and predictors of length of stay for patients hospitalized with systolic heart failure: comparison by commercial, Medicaid, and Medicare payer type. J Med Econ. 2013;16(1):43–54.
- , , et al. Insurance coverage and care of patients with non‐ST‐segment elevation acute coronary syndromes. Ann Intern Med. 2006;145:739–748.
- , , , et al. Association of insurance status with inpatient treatment for coronary artery disease: findings from the Get with the Guidelines Program. Am Heart J. 2010;159:1026–1036.
- , , , et al. Primary payer status affects mortality for major surgical operations. Ann Surg. 2010;252:544–551.
- , , . Medicaid payer status is associated with in‐hospital morbidity and resource utilization following primary total joint arthroplasty. J Bone Joint Surg Am. 2014;96(21):e180.
- , , . The quality of care delivered to patients within the same hospital varies by insurance type. Health Aff (Millwood). 2013;32(10):1731–1739.
- , , , , . Effect of insurance status on postacute care among working age stroke survivors. Neurology. 2012;78(20):1590–1595.
- , , , . Hospitalizations in which patients leave the hospital against medical advice (AMA), 2007. HCUP statistical brief #78. August 2009. Rockville, MD: Agency for Healthcare Research and Quality; 2009. Available at: http://www.hcup‐us.ahrq.gov/reports/statbriefs/sb78.pdf. Accessed May 12, 2016.
- , , , . Characteristics of Medicaid and uninsured hospitalizations, 2012. HCUP statistical brief #182. Rockville, MD: Agency for Healthcare Research and Quality; 2014. Available at: http://www.hcup‐us.ahrq.gov/reports/statbriefs/sb182‐Medicaid‐Uninsured‐Hospitalizations‐2012.pdf. Accessed March 9, 2016.
- Agency for Healthcare Research and Quality. Mortality measurement: mortality risk adjustment methodology for University HealthSystem Consortium. Available at: http://archive.ahrq.gov/professionals/quality‐patient‐safety/quality‐resources/tools/mortality/Meurer.pdf. Accessed May 10, 2016.
- Department of Health and Human Services. Insurance expansion, hospital uncompensated care, and the Affordable Care Act. Available at: https://aspe.hhs.gov/pdf‐report/insurance‐expansion‐hospital‐uncompensated‐care‐and‐affordable‐care‐act. Accessed May 27, 2016.
- , , , . Our flawed but beneficial Medicaid program. N Engl J Med. 2011;364(16):e31.
- , , , . Changes in self‐reported insurance coverage, access to care, and health under the Affordable Care Act. JAMA. 2015;314(4):366–374.
- , . Early coverage, access, utilization, and health effects associated with the Affordable Care Act Medicaid Expansions: a quasi‐experimental study. Ann Intern Med. 2016;164(12):795–803.
- , . The impact of health care reform on hospital and preventive care: evidence from Massachusetts. J Public Econ. 2012;96(11–12):909–929.
- , , . Mortality and access to care among adults after state Medicaid expansions. N Engl J Med. 2012;367:1025–1034.
- , , , et al. The Oregon Experiment—effects of Medicaid on clinical outcomes. N Engl J Med. 2013;368(18):1713–1722.
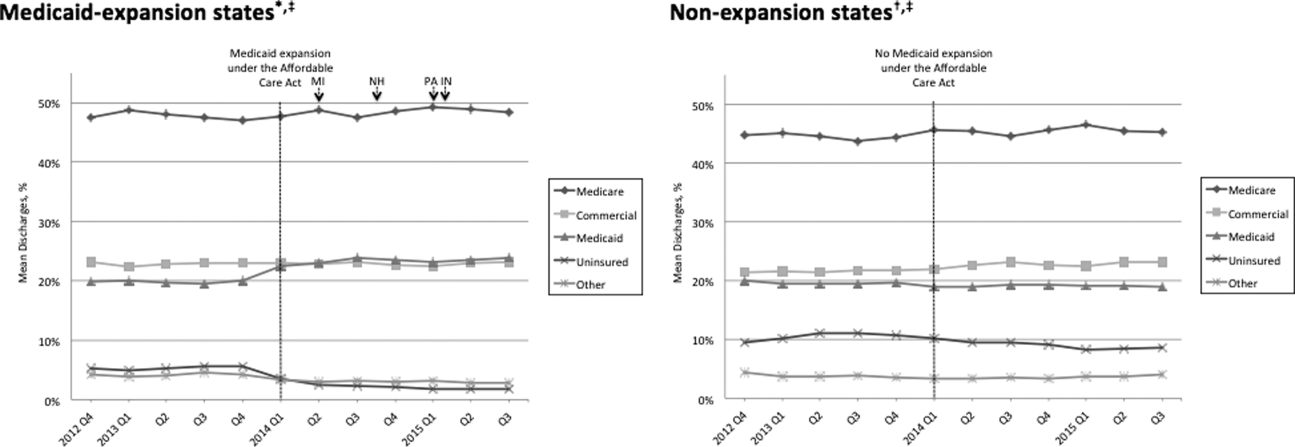
Predictors of Prolonged Hospitalizations
Hospitalizations frequently last longer than warranted by medical necessity alone, due to inefficiencies within the US healthcare system.[1, 2] Discharge delays place patients at risk for hospital‐acquired complications and increase costs. With the growing emphasis on high‐value care, hospital length of stay (LOS) has emerged as a key metric for inpatient care and will remain a central focus of hospital‐based improvement initiatives for the foreseeable future.
Hospitals may find it difficult to identify the primary drivers of inpatient LOS in a dynamic and increasingly complex healthcare system. Multiple recent policy changes have affected inpatient care. The Health Information Technology for Economic and Clinical Health Act of 2009 has led to widespread adoption of electronic health records (EHRs) that have markedly impacted provider workflows.[3] In October 2013, the Centers for Medicare & Medicaid Services implemented the 2‐midnight rule, which reclassified lower acuity inpatients with an expected stay <48 hours to observation status.[4] In January 2014, expansion of insurance coverage under the Affordable Care Act (ACA) altered payer mix for hospitals nationwide.[5] At a local level, hospitals that are rapidly adjusting resource allocation, capital investments, and marketing efforts and making complex operational decisions (eg, to open new units or change admission or referral algorithms) may simultaneously experience shifts in patient volumes, case‐mix index, and staffing ratios with downstream effects on LOS.
Given the myriad factors influencing inpatient LOS, hospital leaders may encounter real challenges in designing effective LOS reduction strategies. For example, they may expend significant resources on real‐time demand‐capacity management systems to improve hospital‐wide patient flow, but the resultant emphasis on bed placement and early discharges may shave only hours off average LOS.[6, 7] An alternative approach may be to target the small percentage of patients with prolonged hospitalizations who contribute disproportionately to the average LOS, as other initiatives focused on high utilizers have done.[8, 9, 10]
Our institution noted an increase in the average inpatient LOS for general medicine patients from 2012 to 2014, prompting a call to action by hospital leaders. We sought to characterize the predictors of prolonged hospitalizations among medicine patients to guide future efforts aimed at mitigating the contribution of prolonged LOS to overall LOS.
METHODS
Study Design
We performed a retrospective analysis of medicine patients discharged between January 1, 2012 and December 31, 2014, from the University of Colorado Hospital, a 551‐bed urban, quaternary‐care academic medical center in Aurora, Colorado. Patients were included if they were admitted under inpatient status, 18 years of age, and discharged from 1 of our 10 medicine services: 7 services with residents, staffed by hospitalists, general internists, or subspecialists; and 3 services with advanced practice providers, staffed by hospitalists.
Data Collection
We obtained LOS, calendar year of discharge, demographic data, insurance type, discharge disposition, number of medications, consults, intensive care unit (ICU) stays, surgeries (ie, procedures requiring anesthesia), and primary diagnosis by International Classification of Diseases, Ninth Revision codes from an administrative database that had been developed, validated, and maintained by our hospital medicine group. This database was populated with variables from our EHR, which was implemented in September 2011; to minimize variability in data input during the EHR rollout, we excluded data from September 2011 through December 2011. The Colorado Multiple Institutional Review Board reviewed and exempted this database (protocol 13‐2953) as a program evaluation.
Outcomes
We defined a prolonged hospitalization or LOS as >21 days in duration. This represented approximately 2 standard deviations above the mean LOS in our cohort. This cutoff also helped to remove provider‐level variability, as each medicine service was staffed by 2 attendings per month, each working approximately 7 days on and 7 days off. We examined LOS >14 and >30 days in sensitivity analyses to ensure that the selection of >21 days did not impose an arbitrary and invalid limitation on our statistical analysis.
Statistical Analysis
Demographic and clinical data were compared in the group with LOS 21 days versus the group with LOS >21 days with a 2 test for dichotomous variables and Student t test for continuous variables. We then built a multivariable logistic regression model to predict LOS >21 days using the variables that were significantly different between groups in bivariate analyses. A two‐sided P value of <0.05 was considered statistically significant. All data analyses were performed using Stata 12.0 (StataCorp, College Station, TX).
RESULTS
We identified 18,363 inpatient discharges among 12,511 medicine patients between January 1, 2012 and December 31, 2014. Of these discharges, 416 (2.3%) demonstrated prolonged LOS. Prolonged hospitalizations accounted for 18.6% of total inpatient days. The average LOS during the study period was 4.8 days including patients with prolonged LOS and 4.0 days excluding patients with prolonged LOS, a contribution of 0.8 days.
Table 1 compares the characteristics of patients with and without prolonged LOS. Age, insurance, discharge disposition, palliative care consults, ICU stays, and surgeries were among the variables that differed significantly between the 2 groups. Among patients undergoing surgery, those with prolonged LOS were more likely to have surgery >24 hours after admission than those without prolonged LOS (85.7% vs 51.4%, P<0.001).
| Variable | LOS 21 Days, N=17,947 | LOS >21 Days, N=416 | P Value |
|---|---|---|---|
| |||
| Age, y, mean (SD) | 56.4 (18.7) | 54.4 (17.1) | 0.030 |
| Female | 9,256 (52%) | 199 (48%) | 0.132 |
| Year of discharge | <0.001 | ||
| 2012 | 5,486 (31%) | 69 (17%) | |
| 2013 | 6,193 (35%) | 162 (39%) | |
| 2014 | 6,268 (35%) | 185 (44%) | |
| Race/ethnicity | 0.003 | ||
| White non‐Hispanic | 9,702 (54%) | 242 (58%) | |
| Black non‐Hispanic | 4,000 (22%) | 68 (16%) | |
| Hispanic | 2,872(16%) | 67 (16%) | |
| Asian | 578 (3%) | 9 (2%) | |
| Other or unknown | 795 (4%) | 30 (7%) | |
| Language preference | 0.795 | ||
| English | 16,049 (89%) | 376 (90%) | |
| Spanish | 1,052 (6%) | 23 (6%) | |
| Other | 846 (5%) | 17 (4%) | |
| Insurance | <0.001 | ||
| Medicare | 5,462 (30%) | 109 (26%) | |
| Medicaid | 3,406 (19%) | 126 (30%) | |
| Dual | 2,815 (16%) | 64 (15%) | |
| Private | 2,714 (15%) | 60 (14%) | |
| Indigent/self‐pay | 2,829 (16%) | 42 (10%) | |
| Other | 721 (4%) | 15 (4%) | |
| Length of stay, d (SD) | 4.0 (3.5) | 39.5 (37.3) | <0.001 |
| Discharge disposition | <0.001 | ||
| Home with self‐care | 13,276 (74%) | 115 (28%) | |
| Home with home health | 1,584 (9%) | 79 (19%) | |
| Hospicehome or inpatient | 369 (2%) | 19 (5%) | |
| Postacute‐care facility or LTAC | 1,761 (10%) | 141 (34%) | |
| Expired | 113 (1%) | 18 (4%) | |
| Other | 844 (5%) | 44 (11%) | |
| No. of admission medications (SD) | 9.7 (7.4) | 10.9 (7.8) | 0.002 |
| Primary diagnosis by ICD‐9 code* | |||
| Sepsis, unspecified | 1,548 (9%) | 55 (13%) | 0.001 |
| Acute respiratory failure | 293 (2%) | 9 (2%) | 0.400 |
| MSSA septicemia | 36 (0.2%) | 8 (2%) | <0.001 |
| MRSA septicemia | 13 (0.1%) | 7 (2%) | <0.001 |
| Alcoholic cirrhosis of the liver | 111 (1%) | 7 (2%) | 0.007 |
| Palliative care consult | 398 (2%) | 64 (15%) | <0.001 |
| ICU stay | 2,030 (11%) | 246 (59%) | <0.001 |
| Surgical procedure | 1,800 (10%) | 182 (44%) | <0.001 |
Unspecified sepsis was the most frequent primary diagnosis, regardless of LOS category (Table 2). However, the second through fifth most frequent diagnoses differed for patients with and without prolonged LOS.
| N | % | |
|---|---|---|
| ||
| LOS 21 days | ||
| 1. Sepsis, unspecified | 1,548 | 8.6% |
| 2. Acute pancreatitis | 435 | 2.4% |
| 3. Pneumonia | 431 | 2.4% |
| 4. Acute kidney failure | 363 | 2.0% |
| 5. COPD exacerbation | 320 | 1.8% |
| LOS >21 days | ||
| 1. Sepsis, unspecified | 55 | 13.0% |
| 2. Acute respiratory failure | 9 | 2.2% |
| 3. Methicillin‐sensitive Staphylococcus aureus septicemia | 8 | 1.9% |
| 4. Methicillin‐resistant Staphylococcus aureus septicemia | 7 | 1.7% |
| 5. Alcoholic cirrhosis of the liver | 7 | 1.7% |
In an adjusted logistic regression model (Table 3), we found lower odds of prolonged LOS for each 10‐year increase in age and higher odds of prolonged LOS for Medicaid insurance, discharge to home with home health, discharge to a postacute‐care or long‐term acute‐care facility, and in‐hospital death. Methicillin‐resistant Staphylococcus aureus (MRSA) septicemia, palliative care consults, ICU stays, and surgeries were all also associated with increased odds of prolonged LOS. We identified a statistically significant interaction between ICU stay and surgical procedure (odds ratio: 2.53, 95% confidence interval: 1.51‐4.26, P<0.001).
| Outcome: LOS >21 Days | Odds Ratio | 95% CI | P Value |
|---|---|---|---|
| |||
| Age, per 10 years increase in age | 0.80 | 0.73‐0.87 | <0.001 |
| Year of discharge | |||
| 2012 | 0.47 | 0.34‐0.67 | <0.001 |
| 2013 | 1.10 | 0.84‐1.43 | 0.493 |
| 2014 | Ref | ||
| Race/ethnicity | |||
| White non‐Hispanic | Ref | ||
| Black non‐Hispanic | 0.89 | 0.64‐1.22 | 0.454 |
| Hispanic | 1.01 | 0.70‐1.46 | 0.952 |
| Asian | 0.85 | 0.40‐1.83 | 0.679 |
| Other or unknown | 1.29 | 0.73‐2.26 | 0.378 |
| Insurance | |||
| Medicare | Ref | ||
| Medicaid | 1.99 | 1.29‐3.05 | 0.002 |
| Dual | 1.06 | 0.72‐1.57 | 0.765 |
| Private | 1.13 | 0.70‐1.82 | 0.620 |
| Indigent/self‐pay | 1.66 | 0.95‐2.88 | 0.073 |
| Other | 0.96 | 0.47‐1.96 | 0.908 |
| Discharge disposition | |||
| Home with self‐care | Ref | ||
| Home with home health | 4.48 | 3.10‐6.48 | <0.001 |
| Hospicehome or inpatient | 2.11 | 0.98‐4.55 | 0.057 |
| Postacute‐care facility or LTAC | 10.37 | 6.92‐15.56 | <0.001 |
| Expired | 5.38 | 2.27‐12.75 | <0.001 |
| Other | 4.04 | 2.64‐6.18 | <0.001 |
| No. of admission medications | 1.00 | 0.99‐1.02 | 0.775 |
| Primary diagnosis by ICD‐9 code | |||
| Sepsis, unspecified | 1.11 | 0.78‐1.58 | 0.575 |
| MSSA septicemia | 2.44 | 0.68‐8.67 | 0.074 |
| MRSA septicemia | 8.83 | 1.72‐45.36 | 0.009 |
| Alcoholic cirrhosis of the liver | 1.25 | 0.43‐3.65 | 0.687 |
| Palliative care consult | 4.63 | 2.86‐7.49 | <0.001 |
| ICU stay | 6.66 | 5.22‐8.50 | <0.001 |
| Surgical procedure | 5.04 | 3.90‐6.52 | <0.001 |
Sensitivity analyses using LOS >14 and >30 days yielded similar results to LOS >21 days (see Supporting Appendix Table 1 in the online version of this article).
DISCUSSION
We found that a small proportion of medicine patients with prolonged hospitalizations contributed substantially to both total inpatient days and average inpatient LOS. Such disproportionate healthcare utilization is concerning in light of the Institute of Medicine's charge for health systems to deliver timely, efficient, and equitable care.[11]
Few studies in the United States have analyzed patient characteristics that predict prolonged LOS, and to our knowledge, none have evaluated prolonged LOS specifically in general medicine patients.[12, 13, 14] Among selected surgical populations, prolonged hospitalizations are most often related to placement difficulties, operational delays, and payer‐related issues, rather than severity of illness, baseline comorbidities, or in‐hospital complications.[12, 13] In our study, we found that patients with prolonged LOS were more likely to require a palliative care consult, ICU stay, or surgery, all proxies for disease severity. Patients with prolonged LOS were also more likely to undergo surgery >24 hours after admission than those without prolonged LOS, suggesting that the former were either too unstable to proceed directly to surgery or developed complications later during their hospitalization. Even after controlling for palliative care consults, ICU stays, and surgeries, placement at a postacute‐care facility was strongly associated with prolonged LOS. Patients with prolonged LOS were also more likely to have Medicaid compared to other insurance types.
Our findings have several potential implications for efforts aimed at decreasing the number of and length of prolonged hospitalizations. Although demographic and clinical factors such as Medicaid insurance, ICU stays, and surgeries are generally not modifiable, they could, particularly in combination, be used to trigger earlier and more intensive case management involvement. A streamlined insurance approval process for Medicaid pending inpatients could be beneficial, given the recent expansion of Medicaid eligibility under the ACA. Hospital partnerships with postacute‐care facilities could also relieve bottlenecks in placement.[8] Chart review of the patients with MRSA septicemia and prolonged LOS indicated that development of an intensive outpatient parenteral antimicrobial therapy pathway with substance abuse counseling could provide an alternative to extended inpatient treatment for intravenous drug users with complicated infections.[15]
This study has several limitations. First, given the lack of consensus in the literature regarding the definition of a prolonged hospitalization, it is difficult to directly compare our results with existing studies.[8, 12, 13, 14] However, we believe LOS >21 days to be a meaningful cutoff for our cohort. Most demographic and clinical variables that were predictive at >21 days were also predictive at >14 and >30 days, which reassured us that the relationship between variables and prolonged LOS was stable at different thresholds. Second, our database did not allow us to fully adjust for baseline comorbidities or categorize the reasons for discharge delays. Finally, this was a single‐center program evaluation. Although this limits generalization to other institutions, we believe our approach may serve as a guide for others interested in reducing prolonged hospitalizations.
In summary, prolonged hospitalizations represent a potentially high‐yield target for LOS reduction efforts. Prolonged hospitalizations among medicine patients at our institution particularly affected Medicaid enrollees with complex hospital stays who were not discharged home. Further studies are needed to determine the specific reasons for unnecessary hospital days in this population.
Acknowledgements
The authors thank Essey Yirdaw for her contributions to the building and management of the database that informed this work.
Disclosure: M.E.A. conceived of the study concept and design and drafted the manuscript. J.J.G. assisted with the study design and made critical revisions to the final manuscript. D.A., R.P., and R.C. assisted with the study design and made critical revisions to the manuscript. C.D.J. assisted with the study design, performed data analyses, and made critical revisions to the manuscript. RC has disclosed that her time is funded by a National Institutes of Health grant unrelated to this study. A modified abstract was presented in poster format at the Society of Hospital Medicine Research, Innovations, and Vignettes Competition 2015 Annual Meeting, held March 29 April 1, 2015, in National Harbor, Maryland. The authors have no conflicts of interest to disclose.
- , , , et al. Excess hospitalization days in an academic medical center: perceptions of hospitalists and discharge planners. Am J Manag Care. 2011;17(2):e34–e42.
- , , A prospective study of reasons for prolonged hospitalizations on a general medicine teaching service. J Gen Intern Med. 2005;20(2):108–115.
- , , , et al. Adoption of electronic health records grows rapidly, but fewer than half of U.S. hospitals had at least a basic system in 2012. Health Aff (Millwood). 2013;32(8):1478–1485.
- , , , et al. Observation and inpatient status: clinical impact of the 2‐midnight rule. J Hosp Med. 2014;9(4):203–209.
- , , Impact of insurance expansion on hospital uncompensated care costs in 2014. Department of Health and Human Services Office of the Assistant Secretary for Planning and Evaluation. Available at: http://aspe.hhs.gov/health/reports/2014/uncompensatedcare/ib_uncompensatedcare.pdf. Accessed March 28, 2015.
- , , , Using real‐time demand capacity management to improve hospital‐wide patient flow. Jt Comm J Qual Patient Saf. 2011;37(5):217–227.
- , , , , , Natural history of late discharges from a general medical ward. J Hosp Med. 2009;4(4):226–233.
- , , , Addressing hospital length of stay outlier patients: a community‐wide approach. Adv Biosci Biotechol. 2014;5:188–196.
- , American medical home runs. Health Aff (Millwood). 2009;28(5):1317–1326.
- The hot spotters: can we lower medical costs by giving the neediest patients better care? New Yorker. January 2011:40–51.
- Institute of Medicine. Crossing the Quality Chasm. Washington, DC: National Academies Press; 2001.
- , , , et al. Excessively long hospital stays after trauma are not related to the severity of illness: let's aim to the right target! JAMA Surg. 2013;148(1):956–961.
- , , Extended length of stay after surgery: complications, inefficient practice, or sick patients? JAMA Surg. 2014;149(8):815–820.
- , , , , Nonmedical factors associated with prolonged hospital length of stay in an urban homebound population. J Hosp Med. 2012;7(2):73–78.
- , , , Safe and successful treatment of intravenous drug users with a peripherally inserted central catheter in an outpatient parenteral antibiotic treatment service. J Antimicrob Chemother. 2010;65(12):2641–2644.
Hospitalizations frequently last longer than warranted by medical necessity alone, due to inefficiencies within the US healthcare system.[1, 2] Discharge delays place patients at risk for hospital‐acquired complications and increase costs. With the growing emphasis on high‐value care, hospital length of stay (LOS) has emerged as a key metric for inpatient care and will remain a central focus of hospital‐based improvement initiatives for the foreseeable future.
Hospitals may find it difficult to identify the primary drivers of inpatient LOS in a dynamic and increasingly complex healthcare system. Multiple recent policy changes have affected inpatient care. The Health Information Technology for Economic and Clinical Health Act of 2009 has led to widespread adoption of electronic health records (EHRs) that have markedly impacted provider workflows.[3] In October 2013, the Centers for Medicare & Medicaid Services implemented the 2‐midnight rule, which reclassified lower acuity inpatients with an expected stay <48 hours to observation status.[4] In January 2014, expansion of insurance coverage under the Affordable Care Act (ACA) altered payer mix for hospitals nationwide.[5] At a local level, hospitals that are rapidly adjusting resource allocation, capital investments, and marketing efforts and making complex operational decisions (eg, to open new units or change admission or referral algorithms) may simultaneously experience shifts in patient volumes, case‐mix index, and staffing ratios with downstream effects on LOS.
Given the myriad factors influencing inpatient LOS, hospital leaders may encounter real challenges in designing effective LOS reduction strategies. For example, they may expend significant resources on real‐time demand‐capacity management systems to improve hospital‐wide patient flow, but the resultant emphasis on bed placement and early discharges may shave only hours off average LOS.[6, 7] An alternative approach may be to target the small percentage of patients with prolonged hospitalizations who contribute disproportionately to the average LOS, as other initiatives focused on high utilizers have done.[8, 9, 10]
Our institution noted an increase in the average inpatient LOS for general medicine patients from 2012 to 2014, prompting a call to action by hospital leaders. We sought to characterize the predictors of prolonged hospitalizations among medicine patients to guide future efforts aimed at mitigating the contribution of prolonged LOS to overall LOS.
METHODS
Study Design
We performed a retrospective analysis of medicine patients discharged between January 1, 2012 and December 31, 2014, from the University of Colorado Hospital, a 551‐bed urban, quaternary‐care academic medical center in Aurora, Colorado. Patients were included if they were admitted under inpatient status, 18 years of age, and discharged from 1 of our 10 medicine services: 7 services with residents, staffed by hospitalists, general internists, or subspecialists; and 3 services with advanced practice providers, staffed by hospitalists.
Data Collection
We obtained LOS, calendar year of discharge, demographic data, insurance type, discharge disposition, number of medications, consults, intensive care unit (ICU) stays, surgeries (ie, procedures requiring anesthesia), and primary diagnosis by International Classification of Diseases, Ninth Revision codes from an administrative database that had been developed, validated, and maintained by our hospital medicine group. This database was populated with variables from our EHR, which was implemented in September 2011; to minimize variability in data input during the EHR rollout, we excluded data from September 2011 through December 2011. The Colorado Multiple Institutional Review Board reviewed and exempted this database (protocol 13‐2953) as a program evaluation.
Outcomes
We defined a prolonged hospitalization or LOS as >21 days in duration. This represented approximately 2 standard deviations above the mean LOS in our cohort. This cutoff also helped to remove provider‐level variability, as each medicine service was staffed by 2 attendings per month, each working approximately 7 days on and 7 days off. We examined LOS >14 and >30 days in sensitivity analyses to ensure that the selection of >21 days did not impose an arbitrary and invalid limitation on our statistical analysis.
Statistical Analysis
Demographic and clinical data were compared in the group with LOS 21 days versus the group with LOS >21 days with a 2 test for dichotomous variables and Student t test for continuous variables. We then built a multivariable logistic regression model to predict LOS >21 days using the variables that were significantly different between groups in bivariate analyses. A two‐sided P value of <0.05 was considered statistically significant. All data analyses were performed using Stata 12.0 (StataCorp, College Station, TX).
RESULTS
We identified 18,363 inpatient discharges among 12,511 medicine patients between January 1, 2012 and December 31, 2014. Of these discharges, 416 (2.3%) demonstrated prolonged LOS. Prolonged hospitalizations accounted for 18.6% of total inpatient days. The average LOS during the study period was 4.8 days including patients with prolonged LOS and 4.0 days excluding patients with prolonged LOS, a contribution of 0.8 days.
Table 1 compares the characteristics of patients with and without prolonged LOS. Age, insurance, discharge disposition, palliative care consults, ICU stays, and surgeries were among the variables that differed significantly between the 2 groups. Among patients undergoing surgery, those with prolonged LOS were more likely to have surgery >24 hours after admission than those without prolonged LOS (85.7% vs 51.4%, P<0.001).
| Variable | LOS 21 Days, N=17,947 | LOS >21 Days, N=416 | P Value |
|---|---|---|---|
| |||
| Age, y, mean (SD) | 56.4 (18.7) | 54.4 (17.1) | 0.030 |
| Female | 9,256 (52%) | 199 (48%) | 0.132 |
| Year of discharge | <0.001 | ||
| 2012 | 5,486 (31%) | 69 (17%) | |
| 2013 | 6,193 (35%) | 162 (39%) | |
| 2014 | 6,268 (35%) | 185 (44%) | |
| Race/ethnicity | 0.003 | ||
| White non‐Hispanic | 9,702 (54%) | 242 (58%) | |
| Black non‐Hispanic | 4,000 (22%) | 68 (16%) | |
| Hispanic | 2,872(16%) | 67 (16%) | |
| Asian | 578 (3%) | 9 (2%) | |
| Other or unknown | 795 (4%) | 30 (7%) | |
| Language preference | 0.795 | ||
| English | 16,049 (89%) | 376 (90%) | |
| Spanish | 1,052 (6%) | 23 (6%) | |
| Other | 846 (5%) | 17 (4%) | |
| Insurance | <0.001 | ||
| Medicare | 5,462 (30%) | 109 (26%) | |
| Medicaid | 3,406 (19%) | 126 (30%) | |
| Dual | 2,815 (16%) | 64 (15%) | |
| Private | 2,714 (15%) | 60 (14%) | |
| Indigent/self‐pay | 2,829 (16%) | 42 (10%) | |
| Other | 721 (4%) | 15 (4%) | |
| Length of stay, d (SD) | 4.0 (3.5) | 39.5 (37.3) | <0.001 |
| Discharge disposition | <0.001 | ||
| Home with self‐care | 13,276 (74%) | 115 (28%) | |
| Home with home health | 1,584 (9%) | 79 (19%) | |
| Hospicehome or inpatient | 369 (2%) | 19 (5%) | |
| Postacute‐care facility or LTAC | 1,761 (10%) | 141 (34%) | |
| Expired | 113 (1%) | 18 (4%) | |
| Other | 844 (5%) | 44 (11%) | |
| No. of admission medications (SD) | 9.7 (7.4) | 10.9 (7.8) | 0.002 |
| Primary diagnosis by ICD‐9 code* | |||
| Sepsis, unspecified | 1,548 (9%) | 55 (13%) | 0.001 |
| Acute respiratory failure | 293 (2%) | 9 (2%) | 0.400 |
| MSSA septicemia | 36 (0.2%) | 8 (2%) | <0.001 |
| MRSA septicemia | 13 (0.1%) | 7 (2%) | <0.001 |
| Alcoholic cirrhosis of the liver | 111 (1%) | 7 (2%) | 0.007 |
| Palliative care consult | 398 (2%) | 64 (15%) | <0.001 |
| ICU stay | 2,030 (11%) | 246 (59%) | <0.001 |
| Surgical procedure | 1,800 (10%) | 182 (44%) | <0.001 |
Unspecified sepsis was the most frequent primary diagnosis, regardless of LOS category (Table 2). However, the second through fifth most frequent diagnoses differed for patients with and without prolonged LOS.
| N | % | |
|---|---|---|
| ||
| LOS 21 days | ||
| 1. Sepsis, unspecified | 1,548 | 8.6% |
| 2. Acute pancreatitis | 435 | 2.4% |
| 3. Pneumonia | 431 | 2.4% |
| 4. Acute kidney failure | 363 | 2.0% |
| 5. COPD exacerbation | 320 | 1.8% |
| LOS >21 days | ||
| 1. Sepsis, unspecified | 55 | 13.0% |
| 2. Acute respiratory failure | 9 | 2.2% |
| 3. Methicillin‐sensitive Staphylococcus aureus septicemia | 8 | 1.9% |
| 4. Methicillin‐resistant Staphylococcus aureus septicemia | 7 | 1.7% |
| 5. Alcoholic cirrhosis of the liver | 7 | 1.7% |
In an adjusted logistic regression model (Table 3), we found lower odds of prolonged LOS for each 10‐year increase in age and higher odds of prolonged LOS for Medicaid insurance, discharge to home with home health, discharge to a postacute‐care or long‐term acute‐care facility, and in‐hospital death. Methicillin‐resistant Staphylococcus aureus (MRSA) septicemia, palliative care consults, ICU stays, and surgeries were all also associated with increased odds of prolonged LOS. We identified a statistically significant interaction between ICU stay and surgical procedure (odds ratio: 2.53, 95% confidence interval: 1.51‐4.26, P<0.001).
| Outcome: LOS >21 Days | Odds Ratio | 95% CI | P Value |
|---|---|---|---|
| |||
| Age, per 10 years increase in age | 0.80 | 0.73‐0.87 | <0.001 |
| Year of discharge | |||
| 2012 | 0.47 | 0.34‐0.67 | <0.001 |
| 2013 | 1.10 | 0.84‐1.43 | 0.493 |
| 2014 | Ref | ||
| Race/ethnicity | |||
| White non‐Hispanic | Ref | ||
| Black non‐Hispanic | 0.89 | 0.64‐1.22 | 0.454 |
| Hispanic | 1.01 | 0.70‐1.46 | 0.952 |
| Asian | 0.85 | 0.40‐1.83 | 0.679 |
| Other or unknown | 1.29 | 0.73‐2.26 | 0.378 |
| Insurance | |||
| Medicare | Ref | ||
| Medicaid | 1.99 | 1.29‐3.05 | 0.002 |
| Dual | 1.06 | 0.72‐1.57 | 0.765 |
| Private | 1.13 | 0.70‐1.82 | 0.620 |
| Indigent/self‐pay | 1.66 | 0.95‐2.88 | 0.073 |
| Other | 0.96 | 0.47‐1.96 | 0.908 |
| Discharge disposition | |||
| Home with self‐care | Ref | ||
| Home with home health | 4.48 | 3.10‐6.48 | <0.001 |
| Hospicehome or inpatient | 2.11 | 0.98‐4.55 | 0.057 |
| Postacute‐care facility or LTAC | 10.37 | 6.92‐15.56 | <0.001 |
| Expired | 5.38 | 2.27‐12.75 | <0.001 |
| Other | 4.04 | 2.64‐6.18 | <0.001 |
| No. of admission medications | 1.00 | 0.99‐1.02 | 0.775 |
| Primary diagnosis by ICD‐9 code | |||
| Sepsis, unspecified | 1.11 | 0.78‐1.58 | 0.575 |
| MSSA septicemia | 2.44 | 0.68‐8.67 | 0.074 |
| MRSA septicemia | 8.83 | 1.72‐45.36 | 0.009 |
| Alcoholic cirrhosis of the liver | 1.25 | 0.43‐3.65 | 0.687 |
| Palliative care consult | 4.63 | 2.86‐7.49 | <0.001 |
| ICU stay | 6.66 | 5.22‐8.50 | <0.001 |
| Surgical procedure | 5.04 | 3.90‐6.52 | <0.001 |
Sensitivity analyses using LOS >14 and >30 days yielded similar results to LOS >21 days (see Supporting Appendix Table 1 in the online version of this article).
DISCUSSION
We found that a small proportion of medicine patients with prolonged hospitalizations contributed substantially to both total inpatient days and average inpatient LOS. Such disproportionate healthcare utilization is concerning in light of the Institute of Medicine's charge for health systems to deliver timely, efficient, and equitable care.[11]
Few studies in the United States have analyzed patient characteristics that predict prolonged LOS, and to our knowledge, none have evaluated prolonged LOS specifically in general medicine patients.[12, 13, 14] Among selected surgical populations, prolonged hospitalizations are most often related to placement difficulties, operational delays, and payer‐related issues, rather than severity of illness, baseline comorbidities, or in‐hospital complications.[12, 13] In our study, we found that patients with prolonged LOS were more likely to require a palliative care consult, ICU stay, or surgery, all proxies for disease severity. Patients with prolonged LOS were also more likely to undergo surgery >24 hours after admission than those without prolonged LOS, suggesting that the former were either too unstable to proceed directly to surgery or developed complications later during their hospitalization. Even after controlling for palliative care consults, ICU stays, and surgeries, placement at a postacute‐care facility was strongly associated with prolonged LOS. Patients with prolonged LOS were also more likely to have Medicaid compared to other insurance types.
Our findings have several potential implications for efforts aimed at decreasing the number of and length of prolonged hospitalizations. Although demographic and clinical factors such as Medicaid insurance, ICU stays, and surgeries are generally not modifiable, they could, particularly in combination, be used to trigger earlier and more intensive case management involvement. A streamlined insurance approval process for Medicaid pending inpatients could be beneficial, given the recent expansion of Medicaid eligibility under the ACA. Hospital partnerships with postacute‐care facilities could also relieve bottlenecks in placement.[8] Chart review of the patients with MRSA septicemia and prolonged LOS indicated that development of an intensive outpatient parenteral antimicrobial therapy pathway with substance abuse counseling could provide an alternative to extended inpatient treatment for intravenous drug users with complicated infections.[15]
This study has several limitations. First, given the lack of consensus in the literature regarding the definition of a prolonged hospitalization, it is difficult to directly compare our results with existing studies.[8, 12, 13, 14] However, we believe LOS >21 days to be a meaningful cutoff for our cohort. Most demographic and clinical variables that were predictive at >21 days were also predictive at >14 and >30 days, which reassured us that the relationship between variables and prolonged LOS was stable at different thresholds. Second, our database did not allow us to fully adjust for baseline comorbidities or categorize the reasons for discharge delays. Finally, this was a single‐center program evaluation. Although this limits generalization to other institutions, we believe our approach may serve as a guide for others interested in reducing prolonged hospitalizations.
In summary, prolonged hospitalizations represent a potentially high‐yield target for LOS reduction efforts. Prolonged hospitalizations among medicine patients at our institution particularly affected Medicaid enrollees with complex hospital stays who were not discharged home. Further studies are needed to determine the specific reasons for unnecessary hospital days in this population.
Acknowledgements
The authors thank Essey Yirdaw for her contributions to the building and management of the database that informed this work.
Disclosure: M.E.A. conceived of the study concept and design and drafted the manuscript. J.J.G. assisted with the study design and made critical revisions to the final manuscript. D.A., R.P., and R.C. assisted with the study design and made critical revisions to the manuscript. C.D.J. assisted with the study design, performed data analyses, and made critical revisions to the manuscript. RC has disclosed that her time is funded by a National Institutes of Health grant unrelated to this study. A modified abstract was presented in poster format at the Society of Hospital Medicine Research, Innovations, and Vignettes Competition 2015 Annual Meeting, held March 29 April 1, 2015, in National Harbor, Maryland. The authors have no conflicts of interest to disclose.
- , , , et al. Excess hospitalization days in an academic medical center: perceptions of hospitalists and discharge planners. Am J Manag Care. 2011;17(2):e34–e42.
- , , A prospective study of reasons for prolonged hospitalizations on a general medicine teaching service. J Gen Intern Med. 2005;20(2):108–115.
- , , , et al. Adoption of electronic health records grows rapidly, but fewer than half of U.S. hospitals had at least a basic system in 2012. Health Aff (Millwood). 2013;32(8):1478–1485.
- , , , et al. Observation and inpatient status: clinical impact of the 2‐midnight rule. J Hosp Med. 2014;9(4):203–209.
- , , Impact of insurance expansion on hospital uncompensated care costs in 2014. Department of Health and Human Services Office of the Assistant Secretary for Planning and Evaluation. Available at: http://aspe.hhs.gov/health/reports/2014/uncompensatedcare/ib_uncompensatedcare.pdf. Accessed March 28, 2015.
- , , , Using real‐time demand capacity management to improve hospital‐wide patient flow. Jt Comm J Qual Patient Saf. 2011;37(5):217–227.
- , , , , , Natural history of late discharges from a general medical ward. J Hosp Med. 2009;4(4):226–233.
- , , , Addressing hospital length of stay outlier patients: a community‐wide approach. Adv Biosci Biotechol. 2014;5:188–196.
- , American medical home runs. Health Aff (Millwood). 2009;28(5):1317–1326.
- The hot spotters: can we lower medical costs by giving the neediest patients better care? New Yorker. January 2011:40–51.
- Institute of Medicine. Crossing the Quality Chasm. Washington, DC: National Academies Press; 2001.
- , , , et al. Excessively long hospital stays after trauma are not related to the severity of illness: let's aim to the right target! JAMA Surg. 2013;148(1):956–961.
- , , Extended length of stay after surgery: complications, inefficient practice, or sick patients? JAMA Surg. 2014;149(8):815–820.
- , , , , Nonmedical factors associated with prolonged hospital length of stay in an urban homebound population. J Hosp Med. 2012;7(2):73–78.
- , , , Safe and successful treatment of intravenous drug users with a peripherally inserted central catheter in an outpatient parenteral antibiotic treatment service. J Antimicrob Chemother. 2010;65(12):2641–2644.
Handoffs
In this issue of the Journal of Hospital Medicine, the results of 2 inpatient handoff studies further shape our evolving understanding of in‐hospital care transitions. Schouten and colleagues,[1] report no difference in adverse outcomes when admissions were handed off to the primary team using face‐to‐face compared to nonface‐to‐face interactions. Meanwhile, Hanson and colleagues[2] report that a written handoff tool is used infrequently by covering interns.
Schouten et al.'s study attempted to isolate the impact of the verbal portion of the handoff between admitting and accepting team by evaluating whether early adverse outcomes differed between patients whose teams performed a face‐to‐face handoffs compared to those who did not. Their study was a retrospective chart review, and no additional process changes, training, or instruction regarding handoffs were implemented or measured. Handoffs occurred primarily between advanced practice providers, hospitalists, and a small number of resident physicians, so generalizability of this study to other institutions may be limited. No difference in adverse events was noted between admissions with face‐to‐face compared to those without face‐to‐face handoffs (2.6% vs 3.2%). Unfortunately, this study was likely underpowered to detect significant changes in adverse events, with a sample size of 805 total patients with a 3% baseline rate of adverse events (by our estimate, over 5000 patients would be needed in each group10,000 overallto detect a 30% relative difference in event rates). Further, this study did not examine other outcomes that could be impacted by the handoff process such as provider efficiency or patient experience.
Face‐to‐face handoffs, the gold standard for handoffs between providers, was 1 of the sign‐out approaches examined in a study by Graham and colleagues.[3] This study, in contrast to the Schouten et al. study, prospectively evaluated adverse events before and after implementation of face‐to‐face handoffs, with structured written sign‐out from the primary team to nighttime covering physicians. Prior to implementation, handoffs consisted of a double handoff involving an intermediary physician and unstructured written sign‐out. Although no statistically significant reduction in adverse events was found in the Graham et al. study, significant improvements were noted in physician satisfaction, documentation of key elements in handoffs, and reduced data omissions; importantly, a trend of fewer near misses was noted comparing the pre‐ and postintervention periods. Although the Schouten et al. and Graham et al. studies suggest questionable benefit of face‐to‐face handoffs, we would caution that limitations in sample size and methodological sensitivity to detect adverse events in both studies could explain the lack of association between face‐to‐face handoffs and reduced adverse events. Furthermore, the promising findings of fewer data omissions and near misses in the intervention group in the Graham et al. study suggest benefit from a multipronged approach to improving handoffs including both face‐to‐face interactions and a structured written component.
In this issue, Hanson and colleagues also evaluated the use of a handoff tool by cross‐covering interns in a convenience sample of overnight clinical interactions. Despite finding that standard written documentation was considered beneficial by nearly all respondents (94.3%), the interns reported that the handoff tool was used in only 27.7% of encounters. This pales in comparison to the use of the nurse or chart in 94.4% of cross‐coverage encounters. The authors speculate that a handoff tool, for many years the only timely source of information, may not be as useful when information can be easily accessed in an electronic health record. Yet, in a prior systematic review that included 6 studies of computerized handoff tools, Li and colleagues found that computerized handoff tools may improve physician efficiency, enhance the completeness of handoff information, and even potentially reduce adverse events.[4]
The Schouten et al. and Hanson et al. studies raise important questions for the fields of hospital medicine and patient safety. Is it time to do away with the written and verbal portions of the handoff process? Should the handoff of patients simply consist of transferring a list of patients to covering providers? We do not believe this is the correct course of action. Rather, we recommend a more evolutionary, not revolutionary, interpretation of these results, especially when considered as part of a broader story of in‐hospital transitions of care.
For example, a recently published evaluation of a resident handoff‐improvement program in 9 hospitals and 10,740 patient admissions by Starmer and collegues[5] focused on a handoff bundle, I‐PASS, which is a pneumonic for Illness severity, Patient summary, Action items, Situation awareness and contingency planning, Synthesis by receiver. The authors report a reduction in medical errors and preventable adverse events without significant increases in the duration of oral handoff per patient. The handoff in this study included both oral and written elements in the I‐PASS format. Implementation was multipronged, and the I‐PASS bundle included (1) use of the I‐PASS pneumonic to standardize handoffs; (2) resident physician training in handoffs and communication through a 2‐hour workshop, followed by a 1‐hour role‐playing and simulation session, and a computer module for practice; (3) faculty development and observation with use of direct‐observation tools to provide structured feedback to residents; (4) active surveillance for errors (rather than relying on self‐report); and (5) a sustainability campaign to promote continuation of culture change. The complexity and robust nature of the I‐PASS handoff bundle suggests that having multiple structured components included in a handoff program with active, rather than retrospective, evaluation might increase the likelihood of improved, sustained outcomes. In addition, one might also conclude from the Starmer et al. study that it takes commitment from all levels, including residents, faculty, and administration, to improve handoffs between teams for inpatient care.
We commend Schouten et al. and Hanson et al. on their contributions to the literature, but believe that the story of the in‐hospital handoff has yet to be fully written. Although results from these 2 articles may cause speculation about the value of oral and written handoffs, we believe that the balance of evidence favors the use of a multipronged approach that involves both structured oral and written handoffs to improve the value and efficiency of handoffs. In addition, findings from the I‐PASS study support dedicated handoff training for providers, evaluation of handoffs using structured tools, and active surveillance for medical errors. Future areas of work should include a systematic review of the inpatient handoff literature and further evaluation of precisely which specific intervention components (eg, structured content of handoffs, sensemaking content) or modes of delivery (eg, face‐to‐face vs other) are most likely to reduce medical errors and improve patient outcomes. As the hospital medicine movement continues to grow, handoffs will continue to be paramount. Establishing the safest method to complete handoffs to promote patient safety should be a common goal for hospitalists.
The handoff story is still in evolution; as hospitalists, we are poised to be its author.
- , , , et al. Association of Face‐to‐Face Handoffs and Outcomes of Hospitalized Internal Medicine Patients. J Hosp Med. 2015;10(3):137–141.
- , , , et al. Nighttime Clinical Encounters: How Residents Perceive and Respond to Calls at Night. J Hosp Med. 2015;10(3):142–146.
- , , , , , . Effect of a systems intervention on the quality and safety of patient handoffs in an internal medicine residency program. J Gen Intern Med. 2013;28(8):986–993.
- , , , , . Review of computerized physician handoff tools for improving the quality of patient care. J Hosp Med. 2013;8(8):456–463.
- , , , et al. Changes in medical errors after implementation of a handoff program. N Engl J Med. 2014;371(19):1803–1812.
In this issue of the Journal of Hospital Medicine, the results of 2 inpatient handoff studies further shape our evolving understanding of in‐hospital care transitions. Schouten and colleagues,[1] report no difference in adverse outcomes when admissions were handed off to the primary team using face‐to‐face compared to nonface‐to‐face interactions. Meanwhile, Hanson and colleagues[2] report that a written handoff tool is used infrequently by covering interns.
Schouten et al.'s study attempted to isolate the impact of the verbal portion of the handoff between admitting and accepting team by evaluating whether early adverse outcomes differed between patients whose teams performed a face‐to‐face handoffs compared to those who did not. Their study was a retrospective chart review, and no additional process changes, training, or instruction regarding handoffs were implemented or measured. Handoffs occurred primarily between advanced practice providers, hospitalists, and a small number of resident physicians, so generalizability of this study to other institutions may be limited. No difference in adverse events was noted between admissions with face‐to‐face compared to those without face‐to‐face handoffs (2.6% vs 3.2%). Unfortunately, this study was likely underpowered to detect significant changes in adverse events, with a sample size of 805 total patients with a 3% baseline rate of adverse events (by our estimate, over 5000 patients would be needed in each group10,000 overallto detect a 30% relative difference in event rates). Further, this study did not examine other outcomes that could be impacted by the handoff process such as provider efficiency or patient experience.
Face‐to‐face handoffs, the gold standard for handoffs between providers, was 1 of the sign‐out approaches examined in a study by Graham and colleagues.[3] This study, in contrast to the Schouten et al. study, prospectively evaluated adverse events before and after implementation of face‐to‐face handoffs, with structured written sign‐out from the primary team to nighttime covering physicians. Prior to implementation, handoffs consisted of a double handoff involving an intermediary physician and unstructured written sign‐out. Although no statistically significant reduction in adverse events was found in the Graham et al. study, significant improvements were noted in physician satisfaction, documentation of key elements in handoffs, and reduced data omissions; importantly, a trend of fewer near misses was noted comparing the pre‐ and postintervention periods. Although the Schouten et al. and Graham et al. studies suggest questionable benefit of face‐to‐face handoffs, we would caution that limitations in sample size and methodological sensitivity to detect adverse events in both studies could explain the lack of association between face‐to‐face handoffs and reduced adverse events. Furthermore, the promising findings of fewer data omissions and near misses in the intervention group in the Graham et al. study suggest benefit from a multipronged approach to improving handoffs including both face‐to‐face interactions and a structured written component.
In this issue, Hanson and colleagues also evaluated the use of a handoff tool by cross‐covering interns in a convenience sample of overnight clinical interactions. Despite finding that standard written documentation was considered beneficial by nearly all respondents (94.3%), the interns reported that the handoff tool was used in only 27.7% of encounters. This pales in comparison to the use of the nurse or chart in 94.4% of cross‐coverage encounters. The authors speculate that a handoff tool, for many years the only timely source of information, may not be as useful when information can be easily accessed in an electronic health record. Yet, in a prior systematic review that included 6 studies of computerized handoff tools, Li and colleagues found that computerized handoff tools may improve physician efficiency, enhance the completeness of handoff information, and even potentially reduce adverse events.[4]
The Schouten et al. and Hanson et al. studies raise important questions for the fields of hospital medicine and patient safety. Is it time to do away with the written and verbal portions of the handoff process? Should the handoff of patients simply consist of transferring a list of patients to covering providers? We do not believe this is the correct course of action. Rather, we recommend a more evolutionary, not revolutionary, interpretation of these results, especially when considered as part of a broader story of in‐hospital transitions of care.
For example, a recently published evaluation of a resident handoff‐improvement program in 9 hospitals and 10,740 patient admissions by Starmer and collegues[5] focused on a handoff bundle, I‐PASS, which is a pneumonic for Illness severity, Patient summary, Action items, Situation awareness and contingency planning, Synthesis by receiver. The authors report a reduction in medical errors and preventable adverse events without significant increases in the duration of oral handoff per patient. The handoff in this study included both oral and written elements in the I‐PASS format. Implementation was multipronged, and the I‐PASS bundle included (1) use of the I‐PASS pneumonic to standardize handoffs; (2) resident physician training in handoffs and communication through a 2‐hour workshop, followed by a 1‐hour role‐playing and simulation session, and a computer module for practice; (3) faculty development and observation with use of direct‐observation tools to provide structured feedback to residents; (4) active surveillance for errors (rather than relying on self‐report); and (5) a sustainability campaign to promote continuation of culture change. The complexity and robust nature of the I‐PASS handoff bundle suggests that having multiple structured components included in a handoff program with active, rather than retrospective, evaluation might increase the likelihood of improved, sustained outcomes. In addition, one might also conclude from the Starmer et al. study that it takes commitment from all levels, including residents, faculty, and administration, to improve handoffs between teams for inpatient care.
We commend Schouten et al. and Hanson et al. on their contributions to the literature, but believe that the story of the in‐hospital handoff has yet to be fully written. Although results from these 2 articles may cause speculation about the value of oral and written handoffs, we believe that the balance of evidence favors the use of a multipronged approach that involves both structured oral and written handoffs to improve the value and efficiency of handoffs. In addition, findings from the I‐PASS study support dedicated handoff training for providers, evaluation of handoffs using structured tools, and active surveillance for medical errors. Future areas of work should include a systematic review of the inpatient handoff literature and further evaluation of precisely which specific intervention components (eg, structured content of handoffs, sensemaking content) or modes of delivery (eg, face‐to‐face vs other) are most likely to reduce medical errors and improve patient outcomes. As the hospital medicine movement continues to grow, handoffs will continue to be paramount. Establishing the safest method to complete handoffs to promote patient safety should be a common goal for hospitalists.
The handoff story is still in evolution; as hospitalists, we are poised to be its author.
- , , , et al. Association of Face‐to‐Face Handoffs and Outcomes of Hospitalized Internal Medicine Patients. J Hosp Med. 2015;10(3):137–141.
- , , , et al. Nighttime Clinical Encounters: How Residents Perceive and Respond to Calls at Night. J Hosp Med. 2015;10(3):142–146.
- , , , , , . Effect of a systems intervention on the quality and safety of patient handoffs in an internal medicine residency program. J Gen Intern Med. 2013;28(8):986–993.
- , , , , . Review of computerized physician handoff tools for improving the quality of patient care. J Hosp Med. 2013;8(8):456–463.
- , , , et al. Changes in medical errors after implementation of a handoff program. N Engl J Med. 2014;371(19):1803–1812.