User login
Effects of Process Improvement on Guideline-Concordant Cardiac Enzyme Testing
In recent years, driven by accelerating health care costs and desire for improved health care value, major specialty group guidelines have incorporated resource utilization and value calculations into their recommendations. High-value care has the characteristics of enhancing outcomes, safety, and patient satisfaction at a reasonable cost. As one example, the American College of Cardiology (ACC) recently published a consensus statement on its clinical practice guidelines with a specific focus on cost and value.1 This guideline acknowledges the difficulty in incorporating value into clinical decision making but stresses a need for increased transparency and consistency to boost value in everyday practice.
Chest pain and related symptoms were listed as the second leading principle reasons for emergency department visits in the US in 2011 with 14% of patients undergoing cardiac enzyme testing.2 The ACC guidelines advocate use of troponin as the preferred laboratory test for the initial evaluation of acute coronary syndrome (ACS). Fractionated creatine kinase (CK-MB) is an acceptable alternative only when a cardiac troponin test is not available.3 Furthermore, troponins should be obtained no more than 3 times for the initial evaluation of a single event, and further trending provides no additional benefit or prognostic information.
A recent study from an academic hospital showed that process improvement interventions focused on eliminating unnecessary cardiac enzyme testing led to a 1-year cost savings of $1.25 million while increasing the rate of ACS diagnosis.4 Common clinical practice at Naval Medical Center Portsmouth (NMCP) in Virginia still routinely includes both troponin as well as a CK panel comprised of CK, CK-MB, and a calculated CK-MB/CK index. Our study focuses on the implementation of quality improvement efforts described by Larochelle and colleagues at NMCP.4 The study aimed to determine the impact of implementing interventions designed to improve the ordering practices and reduce the cost of cardiac enzyme testing.
Methods
The primary focus of the intervention was on ordering practices of the emergency medicine department (EMD), internal medicine (IM) inpatient services, and cardiology inpatient services. Specific interventions were: (1) removal of the CK panel from the chest pain order set in the EMD electronic health record (EHR); (2) removal of the CK panel from the inpatient cardiology order set; (3) education of staff on the changes in CK panel utility via direct communication during IM academic seminars; (4) education of nursing staff ordering laboratory results on behalf of physicians on the cardiology service at the morning and evening huddles; and (5) addition of “max of 3 tests indicated” comment to the inpatient EHR ordering page of the troponin test
Data Source
The process improvement interventions were considered exempt from institutional review board (IRB) approval; however, we obtained expedited IRB approval with waiver of consent for the research aspect of the project. We obtained clinical administrative data from the Military Health System Data Repository (MDR). We identified all adult patients aged ≥ 18 years who had a troponin test, CK-MB, or both drawn at NMCP on the following services: the EMD, IM, and cardiology. A troponin or CK-MB test was defined using Current Procedural Terminology (CPT) codes and unique Logical Observation Identifiers Names and Codes (LOINC).
Measures
The study was divided into 3 periods: the preintervention period from August 1, 2013 to July 31, 2014; the intervention period from August 1, 2014 to January 31, 2015; and the postintervention period February 1, 2015 to January 31, 2016.
The primary outcomes measured were the frequency of guideline concordance and total costs for tests ordered per month using the Centers for Medicare and Medicaid Services (CMS) clinical laboratory fee schedule of $13.40 for troponin and $16.17 for CK-MB.5Concordance was defined as ≤ 3 troponin tests and no CK-MB tests ordered during 1 encounter for a patient without an ACS diagnosis in the preceding 7 days. Due to faster cellular release kinetics of CK-MB compared with that of troponin, this test has utility in evaluating new or worsening chest pain in the setting of a recent myocardial infarction (MI). Therefore, we excluded any patient who had a MI within the preceding 7 days of an order for either CK-MB or troponin tests. Additionally, the number of tests, both CK-MB and troponin, ordered per patient encounter (hereafter referred to as an episode) were measured. Finally, we measured the monthly prevalence of ACS diagnosis and percentage of visits having that diagnosis.
Data Analysis
Descriptive statistics were used to calculate population demographics of age group, sex, beneficiary category, sponsor service, and clinical setting. Monthly data were grouped into the preintervention and postintervention periods. The analysis was performed using t tests to compare mean values and CIs before and after the intervention. Simple linear regression with attention to correlation was used to create best fit lines with confidence bands before and after the intervention. Interrupted time series (ITS) regression was used to describe all data points throughout the study. Consistency between these various methods was verified. Mean values and CIs were reported from the t tests. Statistical significance was reported when appropriate. Equations and confidence predictions on the simple linear regressions were produced and reported. These were used to identify values at the start, midpoint, and end of the pre- and postintervention periods.
Results
There were a total of 6,281 patients in the study population. More patients were seen during the postintervention period than in the preintervention period. The mean age of patients was slightly higher during the preintervention period (Table 1). 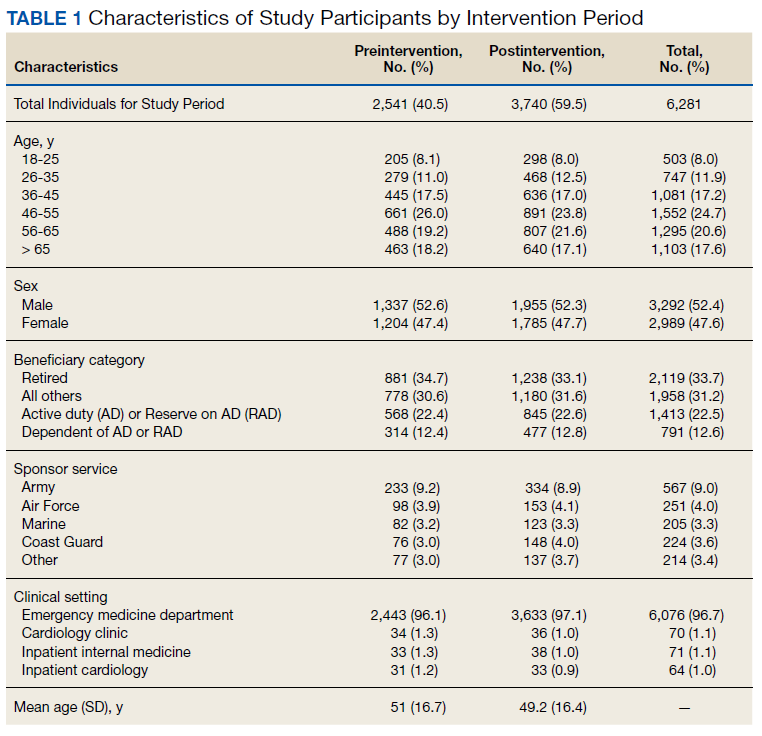
Guideline Concordance
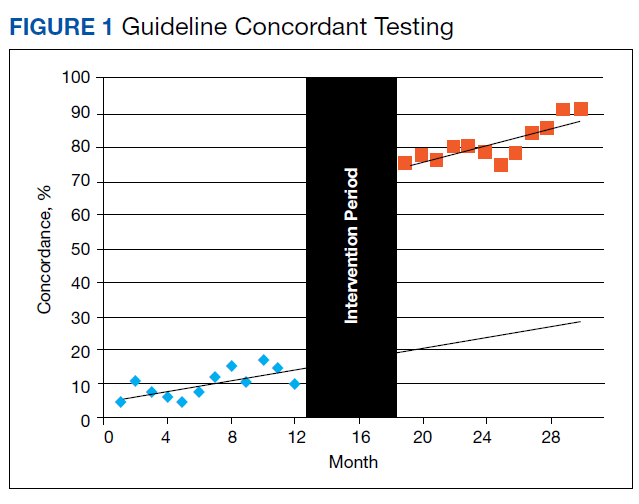
To determine whether ordering practices for cardiac enzyme testing improved, we assessed the changes in the frequency of guideline concordance during the pre- and postintervention period. On average during the preintervention year, the percentage of tests ordered that met guideline concordance was 10.1% (95% CI, 7.4%-12.9%), increasing by 0.80% (95% CI, 0.17%-1.42%) each month. 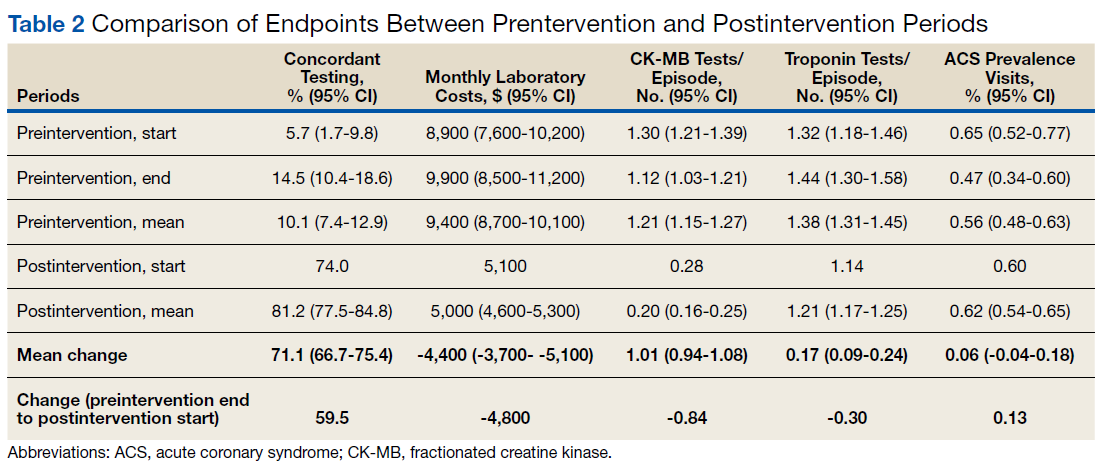
Costs
We assessed changes in total dollars spent on cardiac enzyme testing during the pre- and postintervention periods. During the preintervention year, $9,400 (95% CI, $8,700-$10,100) was spent on average each month, which did not change significantly throughout the period. During the postintervention year, the cost was stable at $5,000 (95% CI, $4,600-$5,300) on average each month, a reduction of $4,400 (95% CI, $3,700-$5,100) (Figure 2). 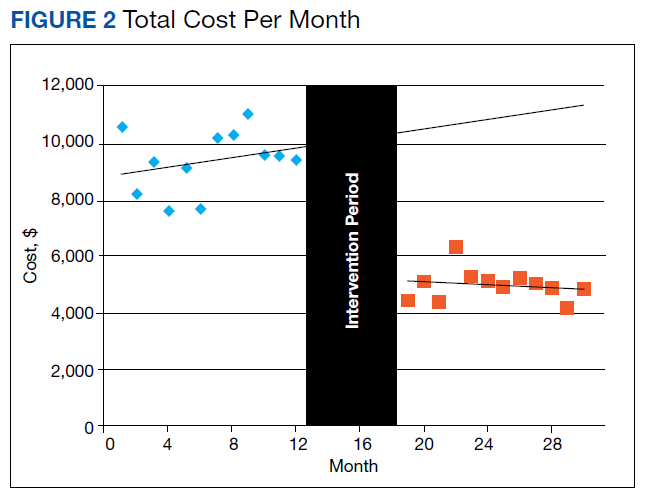
CK-MB and Troponin Tests per Patient
To further assess ordering practices for cardiac enzyme testing, we compared the changes in the monthly number of tests and the average number of CK-MB and troponin tests ordered per episode pre- and postintervention. On average during the preintervention year, 297 tests (95% CI, 278-315) were run per month, with an average of 1.21 CK tests (95% CI, 1.15-1.27) per episode (Table 2, Figure 3). 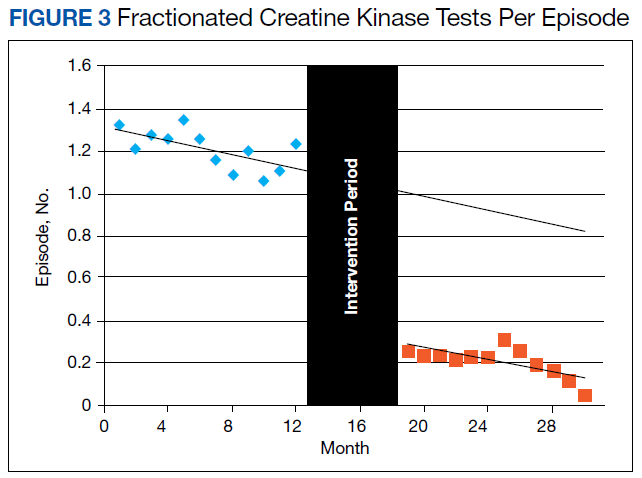
The changes in troponin testing were not as dramatic. The counts of tests each month remained similar, with a preintervention year average of 341 (95% CI, 306-377) and postintervention year average of 310 (95% CI, 287-332), which were not statistically different. However, there was a statistically significant decrease in the number of tests per episode. During the preintervention year, 1.38 troponin tests (95% CI, 1.31-1.45) were ordered per patient on average. This dropped by 0.17 (95% CI, 0.09-0.24) to the postintervention average of 1.21 (95% CI, 1.17-1.25) (Table 2, Figure 4). 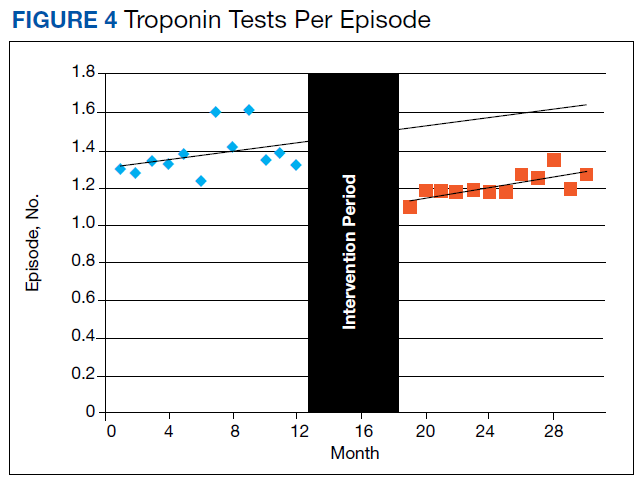
ACS Prevalence
To determine whether there was an impact on ACS diagnoses, we looked at the numbers of ACS diagnoses and their prevalence among visits before and after the intervention. During the preintervention year, the average monthly number of diagnoses was 29.7 (95% CI, 26.1-33.2), and prevalence of ACS was 0.56% (95% CI, 0.48%-0.63%) of all episodes. Although the monthly rate was statistically decreasing by 0.022% (95% CI, 0.003-0.41), this has little meaning since the level of correlation (r2 = 0.2522, not displayed) was poor due to the essentially nonexistent correlation in number of visits each month (r2 = 0.0112, not displayed). During the postintervention year, the average number of diagnoses was 32.2 (95% CI, 27.9-36.6), and the prevalence of ACS was 0.62% (95% CI, 0.54-0.65). Neither of these values changed significantly between the pre- and postintervention period. All ICD-9 and ICD-10 diagnosis codes used for the analysis are available upon request from the authors.
Discussion
Our data demonstrate the ability of simple process improvement interventions to decrease unnecessary testing in the workup of ACS, increasing the rate of guideline concordant testing by > 70% at a single military treatment facility (MTF). In particular, with the now widespread use of EHR, the order set presents a high-yield target for process improvement in an easily implemented, durable fashion. We had expected to see some decrease in the efficacy of the intervention at a time of staff turnover in the summer of 2015 because ongoing dedicated teaching sessions were not performed. Despite that, the intervention remained effective without further dedicated teaching sessions. This outcome was certainly attributable to the hardwired interventions made (mainly via order sets), but possibly indicates an institutional memory that can take hold after an initial concerted effort is made.
We reduced the estimated preintervention annual cost of $113,000 by $53,000 (95% CI, $42,000-$64,000). Although on a much smaller scale than the study by Larochelle, our study represents a nearly 50% reduction in the total cost of initial testing for possible ACS and a > 80% reduction in unnecessary CK-MB testing.4 This result was achieved with no statistical change in the prevalence of ACS. The cost reduction does not account for the labor costs to clinically follow-up and address additional unnecessary lab results. The estimated cost of intervention was limited to the time required to educate residents, interns, and nursing staff as well as the implementation of the automated, reflexive laboratory results ordering process.
Unique to our study, we also demonstrated an intervention that satisfied all the major stakeholders in the ordering of these laboratory results. By instituting the reflexive ordering of CK-MB tests for positive troponins, we obtained the support of the facility’s interventional cardiology department, which finds value in that data. Appreciating the time-sensitive nature of an ACS diagnosis, the reflexive ordering minimized the delay in receiving these data while still greatly reducing the number of tests performed. That being said, if the current trend away from CK-MB in favor of exclusively testing troponin continues, removing the reflexive ordering for positive laboratory results protocol would be an easy follow-on intervention.
Limitations
Our study presented several limitations. First, reporting errors due to improper or insufficient medical coding as well as data entry errors may exist within the MDR; therefore, the results of this analysis may be over- or underestimated. Specifically, CPT codes for troponin and CK-MB were available only in 1 of the 2 data sets used for this study, which primarily contains outpatient patient encounters. For this reason, most of the laboratory testing comes from the EMD rather than from inpatient services. However, because we excluded all patients who eventually had an ACS diagnosis (patients who likely had more inpatient time and better indication for repeat troponin), we feel that our intervention was still thoroughly investigated. Second, the number of tests drawn per patient was significantly < 2, the expected minimum number of tests to rule out ACS in patients with appropriate symptoms.
This study was not designed to answer the source of variation from guidelines. Many patients had only 1 test, which we feel represents an opportunity for future study to identify other ways cardiac enzyme testing is being used clinically. These tests might be used for patients without convincing symptoms and signs of coronary syndromes or for patients with other primary problems. Third, by using the ITS analysis, we assumed that the outcome during each intervention period follows a linear pattern. However, changes may follow a nonlinear pattern over a long period. Finally, our intervention was limited to only a single MTF, which may limit generalizability to other facilities across military medicine. However, we feel this study should serve as a guide for other MTFs as well as US Department of Veterans Affairs facilities that could institute similar process improvements.
Conclusion
We made easily implemented and durable process improvement interventions that changed institution-wide ordering practices. These changes dramatically increased the rate of guideline-concordant testing, decreasing cost and furthering the goal of high-value medical care.
1. Anderson JL, Heidenreich PA, Barnett PG, et al; ACC/AHA Task Force on Performance Measures; ACC/AHA Task Force on Practice Guidelines. ACC/AHA statement on cost/value methodology in clinical practice guidelines and performance measures: a report of the American College of Cardiology/American Heart Association Task Force on Performance Measures and Task Force on Practice Guidelines. Circulation. 2014;129(22):2329-2345.
2. Centers for Disease Control and Prevention, National Center for Health Statistics. National hospital ambulatory medical care survey: 2010 emergency department summary tables. https://www.cdc.gov/nchs/data/ahcd/nhamcs_emergency/2010_ed_web_tables.pdf. Accessed March 15, 2019.
3. Morrow DA, Cannon CP, Jesse RL, et al; National Academy of Clinical Biochemistry. National Academy of Clinical Biochemistry Laboratory Medicine Practice Guidelines: Clinical characteristics and utilization of biochemical markers in acute coronary syndromes. Circulation. 2007;115(13):e356-e375.
4. Larochelle MR, Knight AM, Pantle H, Riedel S, Trost JC. Reducing excess cardiac biomarker testing at an academic medical center. J Gen Intern Med. 2014;29(11):1468-1474.
5. Centers for Medicare and Medicaid Services. 2016 clinical laboratory fee schedule. https://www.cms.gov/Medicare/Medicare-Fee -for-Service-Payment/ClinicalLabFeeSched/Clinical-Laboratory-Fee-Schedule-Files-Items/16CLAB.html?DLPage=1&DLEntries=10&DLSort=2&DLSortDir=descending. Accessed March 15, 2019.
In recent years, driven by accelerating health care costs and desire for improved health care value, major specialty group guidelines have incorporated resource utilization and value calculations into their recommendations. High-value care has the characteristics of enhancing outcomes, safety, and patient satisfaction at a reasonable cost. As one example, the American College of Cardiology (ACC) recently published a consensus statement on its clinical practice guidelines with a specific focus on cost and value.1 This guideline acknowledges the difficulty in incorporating value into clinical decision making but stresses a need for increased transparency and consistency to boost value in everyday practice.
Chest pain and related symptoms were listed as the second leading principle reasons for emergency department visits in the US in 2011 with 14% of patients undergoing cardiac enzyme testing.2 The ACC guidelines advocate use of troponin as the preferred laboratory test for the initial evaluation of acute coronary syndrome (ACS). Fractionated creatine kinase (CK-MB) is an acceptable alternative only when a cardiac troponin test is not available.3 Furthermore, troponins should be obtained no more than 3 times for the initial evaluation of a single event, and further trending provides no additional benefit or prognostic information.
A recent study from an academic hospital showed that process improvement interventions focused on eliminating unnecessary cardiac enzyme testing led to a 1-year cost savings of $1.25 million while increasing the rate of ACS diagnosis.4 Common clinical practice at Naval Medical Center Portsmouth (NMCP) in Virginia still routinely includes both troponin as well as a CK panel comprised of CK, CK-MB, and a calculated CK-MB/CK index. Our study focuses on the implementation of quality improvement efforts described by Larochelle and colleagues at NMCP.4 The study aimed to determine the impact of implementing interventions designed to improve the ordering practices and reduce the cost of cardiac enzyme testing.
Methods
The primary focus of the intervention was on ordering practices of the emergency medicine department (EMD), internal medicine (IM) inpatient services, and cardiology inpatient services. Specific interventions were: (1) removal of the CK panel from the chest pain order set in the EMD electronic health record (EHR); (2) removal of the CK panel from the inpatient cardiology order set; (3) education of staff on the changes in CK panel utility via direct communication during IM academic seminars; (4) education of nursing staff ordering laboratory results on behalf of physicians on the cardiology service at the morning and evening huddles; and (5) addition of “max of 3 tests indicated” comment to the inpatient EHR ordering page of the troponin test
Data Source
The process improvement interventions were considered exempt from institutional review board (IRB) approval; however, we obtained expedited IRB approval with waiver of consent for the research aspect of the project. We obtained clinical administrative data from the Military Health System Data Repository (MDR). We identified all adult patients aged ≥ 18 years who had a troponin test, CK-MB, or both drawn at NMCP on the following services: the EMD, IM, and cardiology. A troponin or CK-MB test was defined using Current Procedural Terminology (CPT) codes and unique Logical Observation Identifiers Names and Codes (LOINC).
Measures
The study was divided into 3 periods: the preintervention period from August 1, 2013 to July 31, 2014; the intervention period from August 1, 2014 to January 31, 2015; and the postintervention period February 1, 2015 to January 31, 2016.
The primary outcomes measured were the frequency of guideline concordance and total costs for tests ordered per month using the Centers for Medicare and Medicaid Services (CMS) clinical laboratory fee schedule of $13.40 for troponin and $16.17 for CK-MB.5Concordance was defined as ≤ 3 troponin tests and no CK-MB tests ordered during 1 encounter for a patient without an ACS diagnosis in the preceding 7 days. Due to faster cellular release kinetics of CK-MB compared with that of troponin, this test has utility in evaluating new or worsening chest pain in the setting of a recent myocardial infarction (MI). Therefore, we excluded any patient who had a MI within the preceding 7 days of an order for either CK-MB or troponin tests. Additionally, the number of tests, both CK-MB and troponin, ordered per patient encounter (hereafter referred to as an episode) were measured. Finally, we measured the monthly prevalence of ACS diagnosis and percentage of visits having that diagnosis.
Data Analysis
Descriptive statistics were used to calculate population demographics of age group, sex, beneficiary category, sponsor service, and clinical setting. Monthly data were grouped into the preintervention and postintervention periods. The analysis was performed using t tests to compare mean values and CIs before and after the intervention. Simple linear regression with attention to correlation was used to create best fit lines with confidence bands before and after the intervention. Interrupted time series (ITS) regression was used to describe all data points throughout the study. Consistency between these various methods was verified. Mean values and CIs were reported from the t tests. Statistical significance was reported when appropriate. Equations and confidence predictions on the simple linear regressions were produced and reported. These were used to identify values at the start, midpoint, and end of the pre- and postintervention periods.
Results
There were a total of 6,281 patients in the study population. More patients were seen during the postintervention period than in the preintervention period. The mean age of patients was slightly higher during the preintervention period (Table 1).
Guideline Concordance
To determine whether ordering practices for cardiac enzyme testing improved, we assessed the changes in the frequency of guideline concordance during the pre- and postintervention period. On average during the preintervention year, the percentage of tests ordered that met guideline concordance was 10.1% (95% CI, 7.4%-12.9%), increasing by 0.80% (95% CI, 0.17%-1.42%) each month.
Costs
We assessed changes in total dollars spent on cardiac enzyme testing during the pre- and postintervention periods. During the preintervention year, $9,400 (95% CI, $8,700-$10,100) was spent on average each month, which did not change significantly throughout the period. During the postintervention year, the cost was stable at $5,000 (95% CI, $4,600-$5,300) on average each month, a reduction of $4,400 (95% CI, $3,700-$5,100) (Figure 2).
CK-MB and Troponin Tests per Patient
To further assess ordering practices for cardiac enzyme testing, we compared the changes in the monthly number of tests and the average number of CK-MB and troponin tests ordered per episode pre- and postintervention. On average during the preintervention year, 297 tests (95% CI, 278-315) were run per month, with an average of 1.21 CK tests (95% CI, 1.15-1.27) per episode (Table 2, Figure 3).
The changes in troponin testing were not as dramatic. The counts of tests each month remained similar, with a preintervention year average of 341 (95% CI, 306-377) and postintervention year average of 310 (95% CI, 287-332), which were not statistically different. However, there was a statistically significant decrease in the number of tests per episode. During the preintervention year, 1.38 troponin tests (95% CI, 1.31-1.45) were ordered per patient on average. This dropped by 0.17 (95% CI, 0.09-0.24) to the postintervention average of 1.21 (95% CI, 1.17-1.25) (Table 2, Figure 4).
ACS Prevalence
To determine whether there was an impact on ACS diagnoses, we looked at the numbers of ACS diagnoses and their prevalence among visits before and after the intervention. During the preintervention year, the average monthly number of diagnoses was 29.7 (95% CI, 26.1-33.2), and prevalence of ACS was 0.56% (95% CI, 0.48%-0.63%) of all episodes. Although the monthly rate was statistically decreasing by 0.022% (95% CI, 0.003-0.41), this has little meaning since the level of correlation (r2 = 0.2522, not displayed) was poor due to the essentially nonexistent correlation in number of visits each month (r2 = 0.0112, not displayed). During the postintervention year, the average number of diagnoses was 32.2 (95% CI, 27.9-36.6), and the prevalence of ACS was 0.62% (95% CI, 0.54-0.65). Neither of these values changed significantly between the pre- and postintervention period. All ICD-9 and ICD-10 diagnosis codes used for the analysis are available upon request from the authors.
Discussion
Our data demonstrate the ability of simple process improvement interventions to decrease unnecessary testing in the workup of ACS, increasing the rate of guideline concordant testing by > 70% at a single military treatment facility (MTF). In particular, with the now widespread use of EHR, the order set presents a high-yield target for process improvement in an easily implemented, durable fashion. We had expected to see some decrease in the efficacy of the intervention at a time of staff turnover in the summer of 2015 because ongoing dedicated teaching sessions were not performed. Despite that, the intervention remained effective without further dedicated teaching sessions. This outcome was certainly attributable to the hardwired interventions made (mainly via order sets), but possibly indicates an institutional memory that can take hold after an initial concerted effort is made.
We reduced the estimated preintervention annual cost of $113,000 by $53,000 (95% CI, $42,000-$64,000). Although on a much smaller scale than the study by Larochelle, our study represents a nearly 50% reduction in the total cost of initial testing for possible ACS and a > 80% reduction in unnecessary CK-MB testing.4 This result was achieved with no statistical change in the prevalence of ACS. The cost reduction does not account for the labor costs to clinically follow-up and address additional unnecessary lab results. The estimated cost of intervention was limited to the time required to educate residents, interns, and nursing staff as well as the implementation of the automated, reflexive laboratory results ordering process.
Unique to our study, we also demonstrated an intervention that satisfied all the major stakeholders in the ordering of these laboratory results. By instituting the reflexive ordering of CK-MB tests for positive troponins, we obtained the support of the facility’s interventional cardiology department, which finds value in that data. Appreciating the time-sensitive nature of an ACS diagnosis, the reflexive ordering minimized the delay in receiving these data while still greatly reducing the number of tests performed. That being said, if the current trend away from CK-MB in favor of exclusively testing troponin continues, removing the reflexive ordering for positive laboratory results protocol would be an easy follow-on intervention.
Limitations
Our study presented several limitations. First, reporting errors due to improper or insufficient medical coding as well as data entry errors may exist within the MDR; therefore, the results of this analysis may be over- or underestimated. Specifically, CPT codes for troponin and CK-MB were available only in 1 of the 2 data sets used for this study, which primarily contains outpatient patient encounters. For this reason, most of the laboratory testing comes from the EMD rather than from inpatient services. However, because we excluded all patients who eventually had an ACS diagnosis (patients who likely had more inpatient time and better indication for repeat troponin), we feel that our intervention was still thoroughly investigated. Second, the number of tests drawn per patient was significantly < 2, the expected minimum number of tests to rule out ACS in patients with appropriate symptoms.
This study was not designed to answer the source of variation from guidelines. Many patients had only 1 test, which we feel represents an opportunity for future study to identify other ways cardiac enzyme testing is being used clinically. These tests might be used for patients without convincing symptoms and signs of coronary syndromes or for patients with other primary problems. Third, by using the ITS analysis, we assumed that the outcome during each intervention period follows a linear pattern. However, changes may follow a nonlinear pattern over a long period. Finally, our intervention was limited to only a single MTF, which may limit generalizability to other facilities across military medicine. However, we feel this study should serve as a guide for other MTFs as well as US Department of Veterans Affairs facilities that could institute similar process improvements.
Conclusion
We made easily implemented and durable process improvement interventions that changed institution-wide ordering practices. These changes dramatically increased the rate of guideline-concordant testing, decreasing cost and furthering the goal of high-value medical care.
1. Anderson JL, Heidenreich PA, Barnett PG, et al; ACC/AHA Task Force on Performance Measures; ACC/AHA Task Force on Practice Guidelines. ACC/AHA statement on cost/value methodology in clinical practice guidelines and performance measures: a report of the American College of Cardiology/American Heart Association Task Force on Performance Measures and Task Force on Practice Guidelines. Circulation. 2014;129(22):2329-2345.
2. Centers for Disease Control and Prevention, National Center for Health Statistics. National hospital ambulatory medical care survey: 2010 emergency department summary tables. https://www.cdc.gov/nchs/data/ahcd/nhamcs_emergency/2010_ed_web_tables.pdf. Accessed March 15, 2019.
3. Morrow DA, Cannon CP, Jesse RL, et al; National Academy of Clinical Biochemistry. National Academy of Clinical Biochemistry Laboratory Medicine Practice Guidelines: Clinical characteristics and utilization of biochemical markers in acute coronary syndromes. Circulation. 2007;115(13):e356-e375.
4. Larochelle MR, Knight AM, Pantle H, Riedel S, Trost JC. Reducing excess cardiac biomarker testing at an academic medical center. J Gen Intern Med. 2014;29(11):1468-1474.
5. Centers for Medicare and Medicaid Services. 2016 clinical laboratory fee schedule. https://www.cms.gov/Medicare/Medicare-Fee -for-Service-Payment/ClinicalLabFeeSched/Clinical-Laboratory-Fee-Schedule-Files-Items/16CLAB.html?DLPage=1&DLEntries=10&DLSort=2&DLSortDir=descending. Accessed March 15, 2019.