User login
Longitudinal associations between income changes and incident CVD
Background: Low income is associated with CVD, although causality remains debated because low income is also associated with depression and negative health behaviors, which can be associated with CVD. For more robust causal inference, changes in income and their association with CVD must be observed.
Study design: Prospective observational cohort study.
Setting: Four U.S. urban centers – Jackson, Miss.; suburbs of Minneapolis; Washington County, Md.; and Forsyth County, N.C.
Synopsis: Among a large cohort of community-dwelling middle-aged adults, this study showed that negative income changes are associated with an increased incidence of CVD. Among 8,989 patients recruited from the four urban centers above, 10% experienced an income drop, 70% did not have a change in income, and 20% experienced an income increase over the first 6 years of the study. Patients were followed for a mean of 17 years, and those who experienced an income drop were found to have a 17% higher risk of incident CVD, whereas those who experienced an income increase had a 14% lower risk of CVD.
The study was limited by difficulties classifying income and its changes; the complicated nature of income, its relationship with other socioeconomic factors, and causation inferences; and the relatively short span over which income was monitored.
Bottom line: Income decrease is associated with an increased risk of incident CVD.
Citation: Wang S et al. Longitudinal associations between income changes and incident cardiovascular disease, the atherosclerosis risk in communities study. JAMA Cardiol. 2019 Oct 9;4(12):1203-12.
Dr. Rupp is a hospitalist and clinical instructor of medicine at the University of Utah, Salt Lake City.

The role of aspirin in primary prevention of cardiovascular disease
Background: Previous studies have shown that aspirin reduces the relative risk of cardiovascular disease (CVD) but also increases the relative risk of bleeding. It is unclear if there are patients without known CVD in whom the absolute risk reduction of CVD outweighs the absolute risk of bleeding. Prognostic CVD and bleeding risk models allow for an assessment of absolute risks and primary preventive interventions.
Study design: Individualized risk-benefit analysis based on sex-specific risk scores and estimates from PREDICT cohort data.
Setting: Primary care practices in New Zealand.
Synopsis: Using the New Zealand–based PREDICT online tool, 245,048 patients had their CVD risk assessed and did not meet exclusion criteria. The online tool predicts CVD events avoided and bleeding events caused by aspirin. When one CVD event was equivalent to one major bleeding event, 2.5% of women and 12.1% of men were classified as benefiting from aspirin (more CVD events avoided than bleeding events caused). When one CVD event was equivalent to two major bleeding events, 21.4% of women and 40.7% of men were classified as benefiting from aspirin. The net-benefit subgroups were older, and had higher baseline 5-year CVD risk, fewer risk factors for bleeding, higher systolic blood pressure, and a higher total cholesterol to HDL cholesterol ratio. Ethnicity and socioeconomic index also influenced benefit or harm.
With use of the upper and lower limits of 95% confidence intervals for models, there were considerable ranges of benefit versus harm. Sex-specific risk scores and meta-analysis have intrinsic uncertainties and results potentially not generalizable outside New Zealand population. Ultimate decision to use aspirin requires shared decision making.
Bottom line: Some patients are likely to derive a net benefit from aspirin for primary prevention of CVD. Risk-benefit models with online tools can help providers and patients estimate these factors to inform shared decision making.
Citation: Selak V et al. Personalized prediction of cardiovascular benefits and bleeding harms for aspirin for primary prevention, a benefit-harm analysis. Ann Intern Med. 2019;71(8):529-39.
Dr. Rupp is a hospitalist and clinical instructor of medicine at the University of Utah, Salt Lake City.
Decrease in Inpatient Telemetry Utilization Through a System-Wide Electronic Health Record Change and a Multifaceted Hospitalist Intervention
Wasteful care may account for between 21% and 34% of the United States’ $3.2 trillion in annual healthcare expenditures, making it a prime target for cost-saving initiatives.1,2 Telemetry is a target for value improvement strategies because telemetry is overutilized, rarely leads to a change in management, and has associated guidelines on appropriate use.3-10 Telemetry use has been a focus of the Joint Commission’s National Patient Safety Goals since 2014, and it is also a focus of the Society of Hospital Medicine’s Choosing Wisely® campaign.11-13
Previous initiatives have evaluated how changes to telemetry orders or education and feedback affect telemetry use. Few studies have compared a system-wide electronic health record (EHR) approach to a multifaceted intervention. In seeking to address this gap, we adapted published guidelines from the American Heart Association (AHA) and incorporated them into our EHR ordering process.3 Simultaneously, we implemented a multifaceted quality improvement initiative and compared this combined program’s effectiveness to that of the EHR approach alone.
METHODS
Study Design, Setting, and Population
We performed a 2-group observational pre- to postintervention study at University of Utah Health. Hospital encounters of patients 18 years and older who had at least 1 inpatient acute care, nonintensive care unit (ICU) room charge and an admission date between January 1, 2014, and July 31, 2016, were included. Patient encounters with missing encounter-level covariates, such as case mix index (CMI) or attending provider identification, were excluded. The Institutional Review Board classified this project as quality improvement and did not require review and oversight.
Intervention
On July 6, 2015, our Epic (Epic Systems Corporation, Madison, WI) EHR telemetry order was modified to discourage unnecessary telemetry monitoring. The new order required providers ordering telemetry to choose a clinical indication and select a duration for monitoring, after which the order would expire and require physician renewal or discontinuation. These were the only changes that occurred for nonhospitalist providers. The nonhospitalist group included all admitting providers who were not hospitalists. This group included neurology (6.98%); cardiology (8.13%); other medical specialties such as pulmonology, hematology, and oncology (21.30%); cardiothoracic surgery (3.72%); orthopedic surgery (14.84%); general surgery (11.11%); neurosurgery (11.07%); and other surgical specialties, including urology, transplant, vascular surgery, and plastics (16.68%).
Between January 2015 and June 2015, we implemented a multicomponent program among our hospitalist service. The hospitalist service is composed of 4 teams with internal medicine residents and 2 teams with advanced practice providers, all staffed by academic hospitalists. Our program was composed of 5 elements, all of which were made before the hospital-wide changes to electronic telemetry orders and maintained throughout the study period, as follows: (1) a single provider education session reviewing available evidence (eg, AHA guidelines, Choosing Wisely® campaign), (2) removal of the telemetry order from hospitalist admission order set on March 23, 2015, (3) inclusion of telemetry discussion in the hospitalist group’s daily “Rounding Checklist,”14 (4) monthly feedback provided as part of hospitalist group meetings, and (5) a financial incentive, awarded to the division (no individual provider payment) if performance targets were met. See supplementary Appendix (“Implementation Manual”) for further details.
Data Source
We obtained data on patient age, gender, Medicare Severity-Diagnosis Related Group, Charlson comorbidity index (CCI), CMI, admitting unit, attending physician, admission and discharge dates, length of stay (LOS), 30-day readmission, bed charge (telemetry or nontelemetry), ICU stay, and inpatient mortality from the enterprise data warehouse. Telemetry days were determined through room billing charges, which are assigned based on the presence or absence of an active telemetry order at midnight. Code events came from a log kept by the hospital telephone operator, who is responsible for sending out all calls to the code team. Code event data were available starting July 19, 2014.
Measures
Our primary outcome was the percentage of hospital days that had telemetry charges for individual patients. All billed telemetry days on acute care floors were included regardless of admission status (inpatient vs observation), service, indication, or ordering provider. Secondary outcomes were inpatient mortality, escalation of care, code event rates, and appropriate telemetry utilization rates. Escalation of care was defined as transfer to an ICU after initially being admitted to an acute care floor. The code event rate was defined as the ratio of the number of code team activations to the number of patient days. Appropriate telemetry utilization rates were determined via chart review, as detailed below.
In order to evaluate changes in appropriateness of telemetry monitoring, 4 of the authors who are internal medicine physicians (KE, CC, JC, DG) performed chart reviews of 25 randomly selected patients in each group (hospitalist and nonhospitalist) before and after the intervention who received at least 1 day of telemetry monitoring. Each reviewer was provided a key based on AHA guidelines for monitoring indications and associated maximum allowable durations.3 Chart reviews were performed to determine the indication (if any) for monitoring, as well as the number of days that were indicated. The number of indicated days was compared to the number of telemetry days the patient received to determine the overall proportion of days that were indicated (“Telemetry appropriateness per visit”). Three reviewers (KE, AR, CC) also evaluated 100 patients on the hospitalist service after the intervention who did not receive any telemetry monitoring to evaluate whether patients with indications for telemetry monitoring were not receiving it after the intervention. For patients who had a possible indication, the indication was classified as Class I (“Cardiac monitoring is indicated in most, if not all, patients in this group”) or Class II (“Cardiac monitoring may be of benefit in some patients but is not considered essential for all patients”).3
Adjustment Variables
To account for differences in patient characteristics between hospitalist and nonhospitalist groups, we included age, gender, CMI, and CCI in statistical models. CCI was calculated according to the algorithm specified by Quan et al.15 using all patient diagnoses from previous visits and the index visit identified from the facility billing system.
Statistical Analysis
We computed descriptive statistics for study outcomes and visit characteristics for hospitalist and nonhospitalist visits for pre- and postintervention periods. Descriptive statistics were expressed as n (%) for categorical patient characteristics and outcome variables. For continuous patient characteristics, we expressed the variability of individual observations as the mean ± the standard deviation. For continuous outcomes, we expressed the precision of the mean estimates using standard error. Telemetry utilization per visit was weighted by the number of total acute care days per visit. Telemetry appropriateness per visit was weighted by the number of telemetry days per visit. Patients who did not receive any telemetry monitoring were included in the analysis and noted to have 0 telemetry days. All patients had at least 1 acute care day. Categorical variables were compared using χ2 tests, and continuous variables were compared using t tests. Code event rates were compared using the binomial probability mid-p exact test for person-time data.16
We fitted generalized linear regression models using generalized estimating equations to evaluate the relative change in outcomes of interest in the postintervention period compared with the preintervention period after adjusting for study covariates. The models included study group (hospitalist and nonhospitalist), time period (pre- and postintervention), an interaction term between study group and time period, and study covariates (age, gender, CMI, and CCI). The models were defined using a binomial distributional assumption and logit link function for mortality, escalation of care, and whether patients had at least 1 telemetry day. A gamma distributional assumption and log link function were used for LOS, telemetry acute care days per visit, and total acute care days per visit. A negative binomial distributional assumption and log link function were used for telemetry utilization and telemetry appropriateness. We used the log of the acute care days as an offset for telemetry utilization and the log of the telemetry days per visit as an offset for telemetry appropriateness. An exchangeable working correlation matrix was used to account for physician-level clustering for all outcomes. Intervention effects, representing the difference in odds for categorical variables and in amount for continuous variables, were calculated as exponentiation of the beta parameters for the covariate minus 1.
P values <.05 were considered significant. We used SAS version 9.4 statistical software (SAS Institute Inc., Cary, NC) for data analysis.
RESULTS

The percent of patients who had any telemetry charges decreased from 36.2% to 15.9% (P < .001) in the hospitalist group and from 31.8% to 28.0% in the nonhospitalist group (P < .001; Table 1). Rates of code events did not change over time (P = .9).
In the randomly selected sample of patients pre- and postintervention who received telemetry monitoring, there was an increase in telemetry appropriateness on the hospitalist service (46% to 72%, P = .025; Table 1). In the nonhospitalist group, appropriate telemetry utilization did not change significantly. Of the 100 randomly selected patients in the hospitalist group after the intervention who did not receive telemetry, no patient had an AHA Class I indication, and only 4 patients had a Class II indication.3,17
DISCUSSION
In this study, implementing a change in the EHR telemetry order produced reductions in telemetry days. However, when combined with a multicomponent program including education, audit and feedback, financial incentives, and changes to remove telemetry orders from admission orders sets, an even more marked improvement was seen. Neither intervention reduced LOS, increased code event rates, or increased rates of escalation of care.
Prior studies have evaluated interventions to reduce unnecessary telemetry monitoring with varying degrees of success. The most successful EHR intervention to date, from Dressler et al.,18 achieved a 70% reduction in overall telemetry use by integrating the AHA guidelines into their EHR and incorporating nursing discontinuation guidelines to ensure that telemetry discontinuation was both safe and timely. Other studies using stewardship approaches and standardized protocols have been less successful.19,20 One study utilizing a multidisciplinary approach but not including an EHR component showed modest improvements in telemetry.21
Although we are unable to differentiate the exact effect of each component of the intervention, we did note an immediate decrease in telemetry orders after removing the telemetry order from our admission order set, a trend that was magnified after the addition of broader EHR changes (Figure 1). Important additional contributors to our success seem to have been the standardization of rounds to include daily discussion of telemetry and the provision of routine feedback. We cannot discern whether other components of our program (such as the financial incentives) contributed more or less to our program, though the sum of these interventions produced an overall program that required substantial buy in and sustained focus from the hospitalist group. The importance of the hospitalist program is highlighted by the relatively large differences in improvement compared with the nonhospitalist group.
Our study has several limitations. First, the study was conducted at a single center, which may limit its generalizability. Second, the intervention was multifaceted, diminishing our ability to discern which aspects beyond the system-wide change in the telemetry order were most responsible for the observed effect among hospitalists. Third, we are unable to fully account for baseline differences in telemetry utilization between hospitalist and nonhospitalist groups. It is likely that different services utilize telemetry monitoring in different ways, and the hospitalist group may have been more aware of the existing guidelines for monitoring prior to the intervention. Furthermore, we had a limited sample size for the chart audits, which reduced the available statistical power for determining changes in the appropriateness of telemetry utilization. Additionally, because internal medicine residents rotate through various services, it is possible that the education they received on their hospitalist rotation as part of our intervention had a spillover effect in the nonhospitalist group. However, any effect should have decreased the difference between the groups. Lastly, although our postintervention time period was 1 year, we do not have data beyond that to monitor for sustainability of the results.
CONCLUSION
In this single-site study, combining EHR orders prompting physicians to choose a clinical indication and duration for monitoring with a broader program—including upstream changes in ordering as well as education, audit, and feedback—produced reductions in telemetry usage. Whether this reduction improves the appropriateness of telemetry utilization or reduces other effects of telemetry (eg, alert fatigue, calls for benign arrhythmias) cannot be discerned from our study. However, our results support the idea that multipronged approaches to telemetry use are most likely to produce improvements.
Acknowledgments
The authors thank Dr. Frank Thomas for his assistance with process engineering and Mr. Andrew Wood for his routine provision of data. The statistical analysis was supported by the University of Utah Study Design and Biostatistics Center, with funding in part from the National Center for Research Resources and the National Center for Advancing Translational Sciences, National Institutes of Health, through Grant 5UL1TR001067-05 (formerly 8UL1TR000105 and UL1RR025764).
Disclosure
The authors have no conflicts of interest to report.
1. National Health Expenditure Fact Sheet. 2015; https://www.cms.gov/Research-Statistics-Data-and-Systems/Statistics-Trends-and-Reports/NationalHealthExpendData/NHE-Fact-Sheet.html. Accessed June 27, 2017.
2. Berwick DM, Hackbarth AD. Eliminating waste in US health care. JAMA. 2012;307(14):1513-1516. PubMed
3. Drew BJ, Califf RM, Funk M, et al. Practice standards for electrocardiographic monitoring in hospital settings: an American Heart Association scientific statement from the Councils on Cardiovascular Nursing, Clinical Cardiology, and Cardiovascular Disease in the Young: endorsed by the International Society of Computerized Electrocardiology and the American Association of Critical-Care Nurses. Circulation. 2004;110(17):2721-2746. PubMed
4. Sandau KE, Funk M, Auerbach A, et al. Update to Practice Standards for Electrocardiographic Monitoring in Hospital Settings: A Scientific Statement From the American Heart Association. Circulation. 2017;136(19):e273-e344. PubMed
5. Mohammad R, Shah S, Donath E, et al. Non-critical care telemetry and in-hospital cardiac arrest outcomes. J Electrocardiol. 2015;48(3):426-429. PubMed
6. Dhillon SK, Rachko M, Hanon S, Schweitzer P, Bergmann SR. Telemetry monitoring guidelines for efficient and safe delivery of cardiac rhythm monitoring to noncritical hospital inpatients. Crit Pathw Cardiol. 2009;8(3):125-126. PubMed
7. Estrada CA, Rosman HS, Prasad NK, et al. Evaluation of guidelines for the use of telemetry in the non-intensive-care setting. J Gen Intern Med. 2000;15(1):51-55. PubMed
8. Estrada CA, Prasad NK, Rosman HS, Young MJ. Outcomes of patients hospitalized to a telemetry unit. Am J Cardiol. 1994;74(4):357-362. PubMed
9. Atzema C, Schull MJ, Borgundvaag B, Slaughter GR, Lee CK. ALARMED: adverse events in low-risk patients with chest pain receiving continuous electrocardiographic monitoring in the emergency department. A pilot study. Am J Emerg Med. 2006;24(1):62-67. PubMed
10. Schull MJ, Redelmeier DA. Continuous electrocardiographic monitoring and cardiac arrest outcomes in 8,932 telemetry ward patients. Acad Emerg Med. 2000;7(6):647-652. PubMed
11. The Joint Commission 2017 National Patient Safety Goals https://www.jointcommission.org/hap_2017_npsgs/. Accessed on February 15, 2017.
12. Joint Commission on Accreditation of Healthcare Organizations. The Joint Commission announces 2014 National Patient Safety Goal. Jt Comm Perspect. 2013;33(7):1, 3-4. PubMed
13. Bulger J, Nickel W, Messler J, et al. Choosing wisely in adult hospital medicine: five opportunities for improved healthcare value. J Hosp Med. 2013;8(9):486-492. PubMed
14. Yarbrough PM, Kukhareva PV, Horton D, Edholm K, Kawamoto K. Multifaceted intervention including education, rounding checklist implementation, cost feedback, and financial incentives reduces inpatient laboratory costs. J Hosp Med. 2016;11(5):348-354. PubMed
15. Quan H, Li B, Couris CM, et al. Updating and validating the Charlson comorbidity index and score for risk adjustment in hospital discharge abstracts using data from 6 countries. Am J Epidemiol. 2011;173(6):676-682. PubMed
16. Greenland S, Rothman KJ. Introduction to categorical statistics In: Rothman KJ, Greenland S, Lash TL, eds. Modern Epidemiology. Vol 3. Philadelphia, PA: Lippincott Williams & Wilkins; 2008: 238-257.
17. Henriques-Forsythe MN, Ivonye CC, Jamched U, Kamuguisha LK, Olejeme KA, Onwuanyi AE. Is telemetry overused? Is it as helpful as thought? Cleve Clin J Med. 2009;76(6):368-372. PubMed
18. Dressler R, Dryer MM, Coletti C, Mahoney D, Doorey AJ. Altering overuse of cardiac telemetry in non-intensive care unit settings by hardwiring the use of American Heart Association guidelines. JAMA Intern Med. 2014;174(11):1852-1854. PubMed
19. Boggan JC, Navar-Boggan AM, Patel V, Schulteis RD, Simel DL. Reductions in telemetry order duration do not reduce telemetry utilization. J Hosp Med. 2014;9(12):795-796. PubMed
20. Cantillon DJ, Loy M, Burkle A, et al. Association Between Off-site Central Monitoring Using Standardized Cardiac Telemetry and Clinical Outcomes Among Non-Critically Ill Patients. JAMA. 2016;316(5):519-524. PubMed
21. Svec D, Ahuja N, Evans KH, et al. Hospitalist intervention for appropriate use of telemetry reduces length of stay and cost. J Hosp Med. 2015;10(9):627-632. PubMed
Wasteful care may account for between 21% and 34% of the United States’ $3.2 trillion in annual healthcare expenditures, making it a prime target for cost-saving initiatives.1,2 Telemetry is a target for value improvement strategies because telemetry is overutilized, rarely leads to a change in management, and has associated guidelines on appropriate use.3-10 Telemetry use has been a focus of the Joint Commission’s National Patient Safety Goals since 2014, and it is also a focus of the Society of Hospital Medicine’s Choosing Wisely® campaign.11-13
Previous initiatives have evaluated how changes to telemetry orders or education and feedback affect telemetry use. Few studies have compared a system-wide electronic health record (EHR) approach to a multifaceted intervention. In seeking to address this gap, we adapted published guidelines from the American Heart Association (AHA) and incorporated them into our EHR ordering process.3 Simultaneously, we implemented a multifaceted quality improvement initiative and compared this combined program’s effectiveness to that of the EHR approach alone.
METHODS
Study Design, Setting, and Population
We performed a 2-group observational pre- to postintervention study at University of Utah Health. Hospital encounters of patients 18 years and older who had at least 1 inpatient acute care, nonintensive care unit (ICU) room charge and an admission date between January 1, 2014, and July 31, 2016, were included. Patient encounters with missing encounter-level covariates, such as case mix index (CMI) or attending provider identification, were excluded. The Institutional Review Board classified this project as quality improvement and did not require review and oversight.
Intervention
On July 6, 2015, our Epic (Epic Systems Corporation, Madison, WI) EHR telemetry order was modified to discourage unnecessary telemetry monitoring. The new order required providers ordering telemetry to choose a clinical indication and select a duration for monitoring, after which the order would expire and require physician renewal or discontinuation. These were the only changes that occurred for nonhospitalist providers. The nonhospitalist group included all admitting providers who were not hospitalists. This group included neurology (6.98%); cardiology (8.13%); other medical specialties such as pulmonology, hematology, and oncology (21.30%); cardiothoracic surgery (3.72%); orthopedic surgery (14.84%); general surgery (11.11%); neurosurgery (11.07%); and other surgical specialties, including urology, transplant, vascular surgery, and plastics (16.68%).
Between January 2015 and June 2015, we implemented a multicomponent program among our hospitalist service. The hospitalist service is composed of 4 teams with internal medicine residents and 2 teams with advanced practice providers, all staffed by academic hospitalists. Our program was composed of 5 elements, all of which were made before the hospital-wide changes to electronic telemetry orders and maintained throughout the study period, as follows: (1) a single provider education session reviewing available evidence (eg, AHA guidelines, Choosing Wisely® campaign), (2) removal of the telemetry order from hospitalist admission order set on March 23, 2015, (3) inclusion of telemetry discussion in the hospitalist group’s daily “Rounding Checklist,”14 (4) monthly feedback provided as part of hospitalist group meetings, and (5) a financial incentive, awarded to the division (no individual provider payment) if performance targets were met. See supplementary Appendix (“Implementation Manual”) for further details.
Data Source
We obtained data on patient age, gender, Medicare Severity-Diagnosis Related Group, Charlson comorbidity index (CCI), CMI, admitting unit, attending physician, admission and discharge dates, length of stay (LOS), 30-day readmission, bed charge (telemetry or nontelemetry), ICU stay, and inpatient mortality from the enterprise data warehouse. Telemetry days were determined through room billing charges, which are assigned based on the presence or absence of an active telemetry order at midnight. Code events came from a log kept by the hospital telephone operator, who is responsible for sending out all calls to the code team. Code event data were available starting July 19, 2014.
Measures
Our primary outcome was the percentage of hospital days that had telemetry charges for individual patients. All billed telemetry days on acute care floors were included regardless of admission status (inpatient vs observation), service, indication, or ordering provider. Secondary outcomes were inpatient mortality, escalation of care, code event rates, and appropriate telemetry utilization rates. Escalation of care was defined as transfer to an ICU after initially being admitted to an acute care floor. The code event rate was defined as the ratio of the number of code team activations to the number of patient days. Appropriate telemetry utilization rates were determined via chart review, as detailed below.
In order to evaluate changes in appropriateness of telemetry monitoring, 4 of the authors who are internal medicine physicians (KE, CC, JC, DG) performed chart reviews of 25 randomly selected patients in each group (hospitalist and nonhospitalist) before and after the intervention who received at least 1 day of telemetry monitoring. Each reviewer was provided a key based on AHA guidelines for monitoring indications and associated maximum allowable durations.3 Chart reviews were performed to determine the indication (if any) for monitoring, as well as the number of days that were indicated. The number of indicated days was compared to the number of telemetry days the patient received to determine the overall proportion of days that were indicated (“Telemetry appropriateness per visit”). Three reviewers (KE, AR, CC) also evaluated 100 patients on the hospitalist service after the intervention who did not receive any telemetry monitoring to evaluate whether patients with indications for telemetry monitoring were not receiving it after the intervention. For patients who had a possible indication, the indication was classified as Class I (“Cardiac monitoring is indicated in most, if not all, patients in this group”) or Class II (“Cardiac monitoring may be of benefit in some patients but is not considered essential for all patients”).3
Adjustment Variables
To account for differences in patient characteristics between hospitalist and nonhospitalist groups, we included age, gender, CMI, and CCI in statistical models. CCI was calculated according to the algorithm specified by Quan et al.15 using all patient diagnoses from previous visits and the index visit identified from the facility billing system.
Statistical Analysis
We computed descriptive statistics for study outcomes and visit characteristics for hospitalist and nonhospitalist visits for pre- and postintervention periods. Descriptive statistics were expressed as n (%) for categorical patient characteristics and outcome variables. For continuous patient characteristics, we expressed the variability of individual observations as the mean ± the standard deviation. For continuous outcomes, we expressed the precision of the mean estimates using standard error. Telemetry utilization per visit was weighted by the number of total acute care days per visit. Telemetry appropriateness per visit was weighted by the number of telemetry days per visit. Patients who did not receive any telemetry monitoring were included in the analysis and noted to have 0 telemetry days. All patients had at least 1 acute care day. Categorical variables were compared using χ2 tests, and continuous variables were compared using t tests. Code event rates were compared using the binomial probability mid-p exact test for person-time data.16
We fitted generalized linear regression models using generalized estimating equations to evaluate the relative change in outcomes of interest in the postintervention period compared with the preintervention period after adjusting for study covariates. The models included study group (hospitalist and nonhospitalist), time period (pre- and postintervention), an interaction term between study group and time period, and study covariates (age, gender, CMI, and CCI). The models were defined using a binomial distributional assumption and logit link function for mortality, escalation of care, and whether patients had at least 1 telemetry day. A gamma distributional assumption and log link function were used for LOS, telemetry acute care days per visit, and total acute care days per visit. A negative binomial distributional assumption and log link function were used for telemetry utilization and telemetry appropriateness. We used the log of the acute care days as an offset for telemetry utilization and the log of the telemetry days per visit as an offset for telemetry appropriateness. An exchangeable working correlation matrix was used to account for physician-level clustering for all outcomes. Intervention effects, representing the difference in odds for categorical variables and in amount for continuous variables, were calculated as exponentiation of the beta parameters for the covariate minus 1.
P values <.05 were considered significant. We used SAS version 9.4 statistical software (SAS Institute Inc., Cary, NC) for data analysis.
RESULTS
The percent of patients who had any telemetry charges decreased from 36.2% to 15.9% (P < .001) in the hospitalist group and from 31.8% to 28.0% in the nonhospitalist group (P < .001; Table 1). Rates of code events did not change over time (P = .9).
In the randomly selected sample of patients pre- and postintervention who received telemetry monitoring, there was an increase in telemetry appropriateness on the hospitalist service (46% to 72%, P = .025; Table 1). In the nonhospitalist group, appropriate telemetry utilization did not change significantly. Of the 100 randomly selected patients in the hospitalist group after the intervention who did not receive telemetry, no patient had an AHA Class I indication, and only 4 patients had a Class II indication.3,17
DISCUSSION
In this study, implementing a change in the EHR telemetry order produced reductions in telemetry days. However, when combined with a multicomponent program including education, audit and feedback, financial incentives, and changes to remove telemetry orders from admission orders sets, an even more marked improvement was seen. Neither intervention reduced LOS, increased code event rates, or increased rates of escalation of care.
Prior studies have evaluated interventions to reduce unnecessary telemetry monitoring with varying degrees of success. The most successful EHR intervention to date, from Dressler et al.,18 achieved a 70% reduction in overall telemetry use by integrating the AHA guidelines into their EHR and incorporating nursing discontinuation guidelines to ensure that telemetry discontinuation was both safe and timely. Other studies using stewardship approaches and standardized protocols have been less successful.19,20 One study utilizing a multidisciplinary approach but not including an EHR component showed modest improvements in telemetry.21
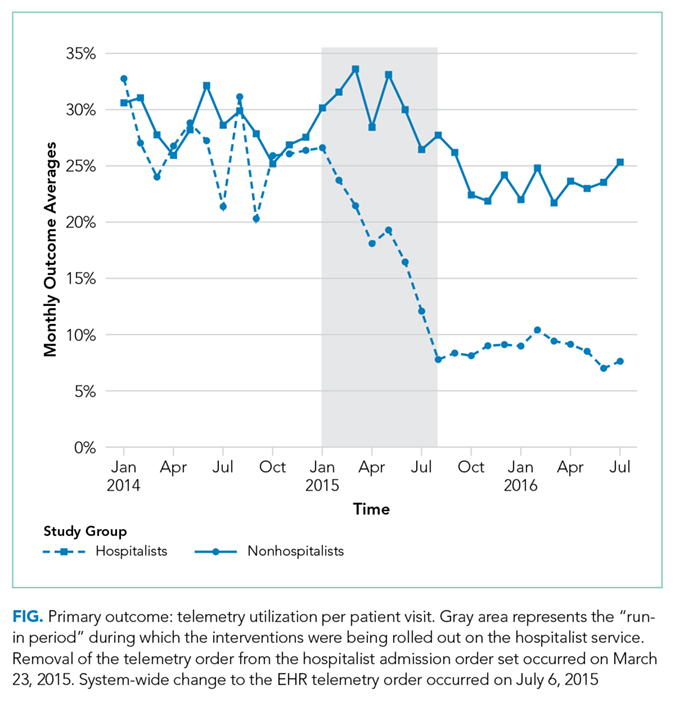
Although we are unable to differentiate the exact effect of each component of the intervention, we did note an immediate decrease in telemetry orders after removing the telemetry order from our admission order set, a trend that was magnified after the addition of broader EHR changes (Figure 1). Important additional contributors to our success seem to have been the standardization of rounds to include daily discussion of telemetry and the provision of routine feedback. We cannot discern whether other components of our program (such as the financial incentives) contributed more or less to our program, though the sum of these interventions produced an overall program that required substantial buy in and sustained focus from the hospitalist group. The importance of the hospitalist program is highlighted by the relatively large differences in improvement compared with the nonhospitalist group.
Our study has several limitations. First, the study was conducted at a single center, which may limit its generalizability. Second, the intervention was multifaceted, diminishing our ability to discern which aspects beyond the system-wide change in the telemetry order were most responsible for the observed effect among hospitalists. Third, we are unable to fully account for baseline differences in telemetry utilization between hospitalist and nonhospitalist groups. It is likely that different services utilize telemetry monitoring in different ways, and the hospitalist group may have been more aware of the existing guidelines for monitoring prior to the intervention. Furthermore, we had a limited sample size for the chart audits, which reduced the available statistical power for determining changes in the appropriateness of telemetry utilization. Additionally, because internal medicine residents rotate through various services, it is possible that the education they received on their hospitalist rotation as part of our intervention had a spillover effect in the nonhospitalist group. However, any effect should have decreased the difference between the groups. Lastly, although our postintervention time period was 1 year, we do not have data beyond that to monitor for sustainability of the results.
CONCLUSION
In this single-site study, combining EHR orders prompting physicians to choose a clinical indication and duration for monitoring with a broader program—including upstream changes in ordering as well as education, audit, and feedback—produced reductions in telemetry usage. Whether this reduction improves the appropriateness of telemetry utilization or reduces other effects of telemetry (eg, alert fatigue, calls for benign arrhythmias) cannot be discerned from our study. However, our results support the idea that multipronged approaches to telemetry use are most likely to produce improvements.
Acknowledgments
The authors thank Dr. Frank Thomas for his assistance with process engineering and Mr. Andrew Wood for his routine provision of data. The statistical analysis was supported by the University of Utah Study Design and Biostatistics Center, with funding in part from the National Center for Research Resources and the National Center for Advancing Translational Sciences, National Institutes of Health, through Grant 5UL1TR001067-05 (formerly 8UL1TR000105 and UL1RR025764).
Disclosure
The authors have no conflicts of interest to report.
Wasteful care may account for between 21% and 34% of the United States’ $3.2 trillion in annual healthcare expenditures, making it a prime target for cost-saving initiatives.1,2 Telemetry is a target for value improvement strategies because telemetry is overutilized, rarely leads to a change in management, and has associated guidelines on appropriate use.3-10 Telemetry use has been a focus of the Joint Commission’s National Patient Safety Goals since 2014, and it is also a focus of the Society of Hospital Medicine’s Choosing Wisely® campaign.11-13
Previous initiatives have evaluated how changes to telemetry orders or education and feedback affect telemetry use. Few studies have compared a system-wide electronic health record (EHR) approach to a multifaceted intervention. In seeking to address this gap, we adapted published guidelines from the American Heart Association (AHA) and incorporated them into our EHR ordering process.3 Simultaneously, we implemented a multifaceted quality improvement initiative and compared this combined program’s effectiveness to that of the EHR approach alone.
METHODS
Study Design, Setting, and Population
We performed a 2-group observational pre- to postintervention study at University of Utah Health. Hospital encounters of patients 18 years and older who had at least 1 inpatient acute care, nonintensive care unit (ICU) room charge and an admission date between January 1, 2014, and July 31, 2016, were included. Patient encounters with missing encounter-level covariates, such as case mix index (CMI) or attending provider identification, were excluded. The Institutional Review Board classified this project as quality improvement and did not require review and oversight.
Intervention
On July 6, 2015, our Epic (Epic Systems Corporation, Madison, WI) EHR telemetry order was modified to discourage unnecessary telemetry monitoring. The new order required providers ordering telemetry to choose a clinical indication and select a duration for monitoring, after which the order would expire and require physician renewal or discontinuation. These were the only changes that occurred for nonhospitalist providers. The nonhospitalist group included all admitting providers who were not hospitalists. This group included neurology (6.98%); cardiology (8.13%); other medical specialties such as pulmonology, hematology, and oncology (21.30%); cardiothoracic surgery (3.72%); orthopedic surgery (14.84%); general surgery (11.11%); neurosurgery (11.07%); and other surgical specialties, including urology, transplant, vascular surgery, and plastics (16.68%).
Between January 2015 and June 2015, we implemented a multicomponent program among our hospitalist service. The hospitalist service is composed of 4 teams with internal medicine residents and 2 teams with advanced practice providers, all staffed by academic hospitalists. Our program was composed of 5 elements, all of which were made before the hospital-wide changes to electronic telemetry orders and maintained throughout the study period, as follows: (1) a single provider education session reviewing available evidence (eg, AHA guidelines, Choosing Wisely® campaign), (2) removal of the telemetry order from hospitalist admission order set on March 23, 2015, (3) inclusion of telemetry discussion in the hospitalist group’s daily “Rounding Checklist,”14 (4) monthly feedback provided as part of hospitalist group meetings, and (5) a financial incentive, awarded to the division (no individual provider payment) if performance targets were met. See supplementary Appendix (“Implementation Manual”) for further details.
Data Source
We obtained data on patient age, gender, Medicare Severity-Diagnosis Related Group, Charlson comorbidity index (CCI), CMI, admitting unit, attending physician, admission and discharge dates, length of stay (LOS), 30-day readmission, bed charge (telemetry or nontelemetry), ICU stay, and inpatient mortality from the enterprise data warehouse. Telemetry days were determined through room billing charges, which are assigned based on the presence or absence of an active telemetry order at midnight. Code events came from a log kept by the hospital telephone operator, who is responsible for sending out all calls to the code team. Code event data were available starting July 19, 2014.
Measures
Our primary outcome was the percentage of hospital days that had telemetry charges for individual patients. All billed telemetry days on acute care floors were included regardless of admission status (inpatient vs observation), service, indication, or ordering provider. Secondary outcomes were inpatient mortality, escalation of care, code event rates, and appropriate telemetry utilization rates. Escalation of care was defined as transfer to an ICU after initially being admitted to an acute care floor. The code event rate was defined as the ratio of the number of code team activations to the number of patient days. Appropriate telemetry utilization rates were determined via chart review, as detailed below.
In order to evaluate changes in appropriateness of telemetry monitoring, 4 of the authors who are internal medicine physicians (KE, CC, JC, DG) performed chart reviews of 25 randomly selected patients in each group (hospitalist and nonhospitalist) before and after the intervention who received at least 1 day of telemetry monitoring. Each reviewer was provided a key based on AHA guidelines for monitoring indications and associated maximum allowable durations.3 Chart reviews were performed to determine the indication (if any) for monitoring, as well as the number of days that were indicated. The number of indicated days was compared to the number of telemetry days the patient received to determine the overall proportion of days that were indicated (“Telemetry appropriateness per visit”). Three reviewers (KE, AR, CC) also evaluated 100 patients on the hospitalist service after the intervention who did not receive any telemetry monitoring to evaluate whether patients with indications for telemetry monitoring were not receiving it after the intervention. For patients who had a possible indication, the indication was classified as Class I (“Cardiac monitoring is indicated in most, if not all, patients in this group”) or Class II (“Cardiac monitoring may be of benefit in some patients but is not considered essential for all patients”).3
Adjustment Variables
To account for differences in patient characteristics between hospitalist and nonhospitalist groups, we included age, gender, CMI, and CCI in statistical models. CCI was calculated according to the algorithm specified by Quan et al.15 using all patient diagnoses from previous visits and the index visit identified from the facility billing system.
Statistical Analysis
We computed descriptive statistics for study outcomes and visit characteristics for hospitalist and nonhospitalist visits for pre- and postintervention periods. Descriptive statistics were expressed as n (%) for categorical patient characteristics and outcome variables. For continuous patient characteristics, we expressed the variability of individual observations as the mean ± the standard deviation. For continuous outcomes, we expressed the precision of the mean estimates using standard error. Telemetry utilization per visit was weighted by the number of total acute care days per visit. Telemetry appropriateness per visit was weighted by the number of telemetry days per visit. Patients who did not receive any telemetry monitoring were included in the analysis and noted to have 0 telemetry days. All patients had at least 1 acute care day. Categorical variables were compared using χ2 tests, and continuous variables were compared using t tests. Code event rates were compared using the binomial probability mid-p exact test for person-time data.16
We fitted generalized linear regression models using generalized estimating equations to evaluate the relative change in outcomes of interest in the postintervention period compared with the preintervention period after adjusting for study covariates. The models included study group (hospitalist and nonhospitalist), time period (pre- and postintervention), an interaction term between study group and time period, and study covariates (age, gender, CMI, and CCI). The models were defined using a binomial distributional assumption and logit link function for mortality, escalation of care, and whether patients had at least 1 telemetry day. A gamma distributional assumption and log link function were used for LOS, telemetry acute care days per visit, and total acute care days per visit. A negative binomial distributional assumption and log link function were used for telemetry utilization and telemetry appropriateness. We used the log of the acute care days as an offset for telemetry utilization and the log of the telemetry days per visit as an offset for telemetry appropriateness. An exchangeable working correlation matrix was used to account for physician-level clustering for all outcomes. Intervention effects, representing the difference in odds for categorical variables and in amount for continuous variables, were calculated as exponentiation of the beta parameters for the covariate minus 1.
P values <.05 were considered significant. We used SAS version 9.4 statistical software (SAS Institute Inc., Cary, NC) for data analysis.
RESULTS
The percent of patients who had any telemetry charges decreased from 36.2% to 15.9% (P < .001) in the hospitalist group and from 31.8% to 28.0% in the nonhospitalist group (P < .001; Table 1). Rates of code events did not change over time (P = .9).
In the randomly selected sample of patients pre- and postintervention who received telemetry monitoring, there was an increase in telemetry appropriateness on the hospitalist service (46% to 72%, P = .025; Table 1). In the nonhospitalist group, appropriate telemetry utilization did not change significantly. Of the 100 randomly selected patients in the hospitalist group after the intervention who did not receive telemetry, no patient had an AHA Class I indication, and only 4 patients had a Class II indication.3,17
DISCUSSION
In this study, implementing a change in the EHR telemetry order produced reductions in telemetry days. However, when combined with a multicomponent program including education, audit and feedback, financial incentives, and changes to remove telemetry orders from admission orders sets, an even more marked improvement was seen. Neither intervention reduced LOS, increased code event rates, or increased rates of escalation of care.
Prior studies have evaluated interventions to reduce unnecessary telemetry monitoring with varying degrees of success. The most successful EHR intervention to date, from Dressler et al.,18 achieved a 70% reduction in overall telemetry use by integrating the AHA guidelines into their EHR and incorporating nursing discontinuation guidelines to ensure that telemetry discontinuation was both safe and timely. Other studies using stewardship approaches and standardized protocols have been less successful.19,20 One study utilizing a multidisciplinary approach but not including an EHR component showed modest improvements in telemetry.21
Although we are unable to differentiate the exact effect of each component of the intervention, we did note an immediate decrease in telemetry orders after removing the telemetry order from our admission order set, a trend that was magnified after the addition of broader EHR changes (Figure 1). Important additional contributors to our success seem to have been the standardization of rounds to include daily discussion of telemetry and the provision of routine feedback. We cannot discern whether other components of our program (such as the financial incentives) contributed more or less to our program, though the sum of these interventions produced an overall program that required substantial buy in and sustained focus from the hospitalist group. The importance of the hospitalist program is highlighted by the relatively large differences in improvement compared with the nonhospitalist group.
Our study has several limitations. First, the study was conducted at a single center, which may limit its generalizability. Second, the intervention was multifaceted, diminishing our ability to discern which aspects beyond the system-wide change in the telemetry order were most responsible for the observed effect among hospitalists. Third, we are unable to fully account for baseline differences in telemetry utilization between hospitalist and nonhospitalist groups. It is likely that different services utilize telemetry monitoring in different ways, and the hospitalist group may have been more aware of the existing guidelines for monitoring prior to the intervention. Furthermore, we had a limited sample size for the chart audits, which reduced the available statistical power for determining changes in the appropriateness of telemetry utilization. Additionally, because internal medicine residents rotate through various services, it is possible that the education they received on their hospitalist rotation as part of our intervention had a spillover effect in the nonhospitalist group. However, any effect should have decreased the difference between the groups. Lastly, although our postintervention time period was 1 year, we do not have data beyond that to monitor for sustainability of the results.
CONCLUSION
In this single-site study, combining EHR orders prompting physicians to choose a clinical indication and duration for monitoring with a broader program—including upstream changes in ordering as well as education, audit, and feedback—produced reductions in telemetry usage. Whether this reduction improves the appropriateness of telemetry utilization or reduces other effects of telemetry (eg, alert fatigue, calls for benign arrhythmias) cannot be discerned from our study. However, our results support the idea that multipronged approaches to telemetry use are most likely to produce improvements.
Acknowledgments
The authors thank Dr. Frank Thomas for his assistance with process engineering and Mr. Andrew Wood for his routine provision of data. The statistical analysis was supported by the University of Utah Study Design and Biostatistics Center, with funding in part from the National Center for Research Resources and the National Center for Advancing Translational Sciences, National Institutes of Health, through Grant 5UL1TR001067-05 (formerly 8UL1TR000105 and UL1RR025764).
Disclosure
The authors have no conflicts of interest to report.
1. National Health Expenditure Fact Sheet. 2015; https://www.cms.gov/Research-Statistics-Data-and-Systems/Statistics-Trends-and-Reports/NationalHealthExpendData/NHE-Fact-Sheet.html. Accessed June 27, 2017.
2. Berwick DM, Hackbarth AD. Eliminating waste in US health care. JAMA. 2012;307(14):1513-1516. PubMed
3. Drew BJ, Califf RM, Funk M, et al. Practice standards for electrocardiographic monitoring in hospital settings: an American Heart Association scientific statement from the Councils on Cardiovascular Nursing, Clinical Cardiology, and Cardiovascular Disease in the Young: endorsed by the International Society of Computerized Electrocardiology and the American Association of Critical-Care Nurses. Circulation. 2004;110(17):2721-2746. PubMed
4. Sandau KE, Funk M, Auerbach A, et al. Update to Practice Standards for Electrocardiographic Monitoring in Hospital Settings: A Scientific Statement From the American Heart Association. Circulation. 2017;136(19):e273-e344. PubMed
5. Mohammad R, Shah S, Donath E, et al. Non-critical care telemetry and in-hospital cardiac arrest outcomes. J Electrocardiol. 2015;48(3):426-429. PubMed
6. Dhillon SK, Rachko M, Hanon S, Schweitzer P, Bergmann SR. Telemetry monitoring guidelines for efficient and safe delivery of cardiac rhythm monitoring to noncritical hospital inpatients. Crit Pathw Cardiol. 2009;8(3):125-126. PubMed
7. Estrada CA, Rosman HS, Prasad NK, et al. Evaluation of guidelines for the use of telemetry in the non-intensive-care setting. J Gen Intern Med. 2000;15(1):51-55. PubMed
8. Estrada CA, Prasad NK, Rosman HS, Young MJ. Outcomes of patients hospitalized to a telemetry unit. Am J Cardiol. 1994;74(4):357-362. PubMed
9. Atzema C, Schull MJ, Borgundvaag B, Slaughter GR, Lee CK. ALARMED: adverse events in low-risk patients with chest pain receiving continuous electrocardiographic monitoring in the emergency department. A pilot study. Am J Emerg Med. 2006;24(1):62-67. PubMed
10. Schull MJ, Redelmeier DA. Continuous electrocardiographic monitoring and cardiac arrest outcomes in 8,932 telemetry ward patients. Acad Emerg Med. 2000;7(6):647-652. PubMed
11. The Joint Commission 2017 National Patient Safety Goals https://www.jointcommission.org/hap_2017_npsgs/. Accessed on February 15, 2017.
12. Joint Commission on Accreditation of Healthcare Organizations. The Joint Commission announces 2014 National Patient Safety Goal. Jt Comm Perspect. 2013;33(7):1, 3-4. PubMed
13. Bulger J, Nickel W, Messler J, et al. Choosing wisely in adult hospital medicine: five opportunities for improved healthcare value. J Hosp Med. 2013;8(9):486-492. PubMed
14. Yarbrough PM, Kukhareva PV, Horton D, Edholm K, Kawamoto K. Multifaceted intervention including education, rounding checklist implementation, cost feedback, and financial incentives reduces inpatient laboratory costs. J Hosp Med. 2016;11(5):348-354. PubMed
15. Quan H, Li B, Couris CM, et al. Updating and validating the Charlson comorbidity index and score for risk adjustment in hospital discharge abstracts using data from 6 countries. Am J Epidemiol. 2011;173(6):676-682. PubMed
16. Greenland S, Rothman KJ. Introduction to categorical statistics In: Rothman KJ, Greenland S, Lash TL, eds. Modern Epidemiology. Vol 3. Philadelphia, PA: Lippincott Williams & Wilkins; 2008: 238-257.
17. Henriques-Forsythe MN, Ivonye CC, Jamched U, Kamuguisha LK, Olejeme KA, Onwuanyi AE. Is telemetry overused? Is it as helpful as thought? Cleve Clin J Med. 2009;76(6):368-372. PubMed
18. Dressler R, Dryer MM, Coletti C, Mahoney D, Doorey AJ. Altering overuse of cardiac telemetry in non-intensive care unit settings by hardwiring the use of American Heart Association guidelines. JAMA Intern Med. 2014;174(11):1852-1854. PubMed
19. Boggan JC, Navar-Boggan AM, Patel V, Schulteis RD, Simel DL. Reductions in telemetry order duration do not reduce telemetry utilization. J Hosp Med. 2014;9(12):795-796. PubMed
20. Cantillon DJ, Loy M, Burkle A, et al. Association Between Off-site Central Monitoring Using Standardized Cardiac Telemetry and Clinical Outcomes Among Non-Critically Ill Patients. JAMA. 2016;316(5):519-524. PubMed
21. Svec D, Ahuja N, Evans KH, et al. Hospitalist intervention for appropriate use of telemetry reduces length of stay and cost. J Hosp Med. 2015;10(9):627-632. PubMed
© 2018 Society of Hospital Medicine