User login
What are the best treatments for reducing osteoporotic compression fracture pain?
EVIDENCE SUMMARY
A 2015 meta-analysis of 8 RCTs compared pain reduction in adults >50 years with osteoporotic compression fractures who received either vertebral augmentation (vertebroplasty or balloon kyphoplasty; 495 patients) or conservative or sham treatment (492 patients).1 Pain was measured by the visual analog scale (VAS) periodically between 1 week and 1 year.
The study included patients of both sexes who had an acute or chronic osteoporotic vertebral compression fracture that caused pain and functional limitations in daily activities. It excluded patients with neoplasm, pre-existing chronic pain or functional disability unrelated to vertebral fractures, and vertebral fractures unaccompanied by signal changes on magnetic resonance imaging.
Vertebral augmentation resulted in small to moderate reductions in pain scores compared with placebo at 1 to 4 weeks (7 trials, 938 patients; standardized mean difference [SMD]=0.3; 95% confidence interval [CI], 0.1-0.5), 2 to 3 months (7 trials, 953 patients; SMD=0.3; 95% CI, 0.1-0.4), and 1 year (5 trials, 744 patients; SMD=0.3; 95% CI, 0.1-0.4). The study is considered low-quality because of increased heterogeneity.
Calcitonin reduces pain but with some adverse effects
A 2011 meta-analysis of 10 RCTs (467 patients) examined the analgesic effectiveness of calcitonin in adults >60 years, of either sex, with osteoporotic compression fractures who received calcitonin in the acute phase (<10 days after fracture) and chronic phase (>3 months after fracture).2 For acute fractures, pain was measured at 1, 2, 3, and 4 weeks following treatment. For chronic fractures, pain was measured at 1, 3, and 6 months post-treatment.
Continue to: Calcitonin was administered...
Calcitonin was administered in varying doses by various routes (200 IU intranasal, 50-200 IU intramuscular or subcutaneous injection, or 200 IU rectal suppository) and compared with placebo, usual treatment, or other analgesia. The VAS was varied (10 cm, 100 mm, or 5-point) and assessed pain and length of time to mobilization with patients at rest, sitting, standing, and walking by using mean deviation (MD) and SMD.
In the acute phase, calcitonin resulted in greater pain relief 1 week after fracture at rest (4 trials; 260 patients; 10-cm VAS; MD=−3.4; 95% CI, −4 to −2.8) and with walking (4 trials, 228 patients; SMD=2.6; 95% CI, −4.1 to −1.1) compared with the control group. At 6 months, calcitonin had reduced pain in mobile patients more than in the control group (7 trials, 207 patients; SMD=−0.5; 95% CI, −0.9 to −0.1).
Statistically significant adverse effects of calcitonin included gastrointestinal disturbances and flushing compared with placebo. Adverse effects were more predominant in the studies that used injectable calcitonin and in the chronic pain group. The study is considered low-quality because of increased heterogeneity in the acute pain studies.
1. Li L, Ren J, Liu J, et al. Results of vertebral augmentation treatment for patients of painful osteoporotic vertebral compression fractures: a meta-analysis of eight randomized controlled trials. PLoS ONE. 2015;10:e0138126.
2. Knopp-Sihota JA, Newburn-Cook CV, Homik J, et al. Calcitonin for treating acute and chronic pain of recent and remote osteoporotic compression fractures: a systematic review and meta-analysis. Osteoporos Intl. 2012;23:17-38.
EVIDENCE SUMMARY
A 2015 meta-analysis of 8 RCTs compared pain reduction in adults >50 years with osteoporotic compression fractures who received either vertebral augmentation (vertebroplasty or balloon kyphoplasty; 495 patients) or conservative or sham treatment (492 patients).1 Pain was measured by the visual analog scale (VAS) periodically between 1 week and 1 year.
The study included patients of both sexes who had an acute or chronic osteoporotic vertebral compression fracture that caused pain and functional limitations in daily activities. It excluded patients with neoplasm, pre-existing chronic pain or functional disability unrelated to vertebral fractures, and vertebral fractures unaccompanied by signal changes on magnetic resonance imaging.
Vertebral augmentation resulted in small to moderate reductions in pain scores compared with placebo at 1 to 4 weeks (7 trials, 938 patients; standardized mean difference [SMD]=0.3; 95% confidence interval [CI], 0.1-0.5), 2 to 3 months (7 trials, 953 patients; SMD=0.3; 95% CI, 0.1-0.4), and 1 year (5 trials, 744 patients; SMD=0.3; 95% CI, 0.1-0.4). The study is considered low-quality because of increased heterogeneity.
Calcitonin reduces pain but with some adverse effects
A 2011 meta-analysis of 10 RCTs (467 patients) examined the analgesic effectiveness of calcitonin in adults >60 years, of either sex, with osteoporotic compression fractures who received calcitonin in the acute phase (<10 days after fracture) and chronic phase (>3 months after fracture).2 For acute fractures, pain was measured at 1, 2, 3, and 4 weeks following treatment. For chronic fractures, pain was measured at 1, 3, and 6 months post-treatment.
Continue to: Calcitonin was administered...
Calcitonin was administered in varying doses by various routes (200 IU intranasal, 50-200 IU intramuscular or subcutaneous injection, or 200 IU rectal suppository) and compared with placebo, usual treatment, or other analgesia. The VAS was varied (10 cm, 100 mm, or 5-point) and assessed pain and length of time to mobilization with patients at rest, sitting, standing, and walking by using mean deviation (MD) and SMD.
In the acute phase, calcitonin resulted in greater pain relief 1 week after fracture at rest (4 trials; 260 patients; 10-cm VAS; MD=−3.4; 95% CI, −4 to −2.8) and with walking (4 trials, 228 patients; SMD=2.6; 95% CI, −4.1 to −1.1) compared with the control group. At 6 months, calcitonin had reduced pain in mobile patients more than in the control group (7 trials, 207 patients; SMD=−0.5; 95% CI, −0.9 to −0.1).
Statistically significant adverse effects of calcitonin included gastrointestinal disturbances and flushing compared with placebo. Adverse effects were more predominant in the studies that used injectable calcitonin and in the chronic pain group. The study is considered low-quality because of increased heterogeneity in the acute pain studies.
1. Li L, Ren J, Liu J, et al. Results of vertebral augmentation treatment for patients of painful osteoporotic vertebral compression fractures: a meta-analysis of eight randomized controlled trials. PLoS ONE. 2015;10:e0138126.
2. Knopp-Sihota JA, Newburn-Cook CV, Homik J, et al. Calcitonin for treating acute and chronic pain of recent and remote osteoporotic compression fractures: a systematic review and meta-analysis. Osteoporos Intl. 2012;23:17-38.
EVIDENCE-BASED ANSWER:
Vertebral augmentation with vertebroplasty or balloon kyphoplasty yields a small reduction in both acute and chronic pain scores in adults with osteoporotic compression fractures compared with conservative therapy or sham treatment (strength of recommendation [SOR]: B, meta-analysis of randomized controlled trials [RCTs]).
When compared with placebo, usual treatment, or other analgesia, calcitonin reduces the severity and duration of pain at rest and with mobility 1 week after an osteoporotic compression fracture and with mobility at 6 months postfracture (SOR: B, meta-analysis of RCTs).

How accurate are point-of-care urine drug screens in patients taking chronic opioid therapy?
EVIDENCE SUMMARY
A 2011 blinded diagnostic accuracy study of 1000 adult chronic pain patients in an interventional pain management program in the United States compared POC immunoassay urine drug testing with LC-MS.1 The immunoassay index test can be performed in the office with rapid results. The LC-MS reference test requires that the urine sample be sent to a lab.
Study participants were 37% male and 63% female, average age 51 years. Of the 1000 patients, 920 were prescribed opioids. Morphine, hydrocodone, codeine, and hydromorphone (morphine group) were tested with cutoff values of 300 ng/mL for POC testing and 50 ng/mL for LC-MS. Cutoffs for methadone were 300 ng/mL for POC and 100 ng/mL for LC-MS. For oxycodone, they were 100 ng/mL for POC and 50 ng/mL for LC-MS.
Methadone had the highest sensitivity and specificity at 96% and 99%, with a false-negative rate of 3.9% and a false-positive rate of 1.2%. It also had the highest agreement between the 2 testing methods at 99%. The morphine group had a sensitivity of 92%, specificity of 93%, false-negative rate of 7.8%, false-positive rate of 6.9%, and 93% test agreement. Oxycodone showed the lowest sensitivity at 75%; it had a specificity of 92%, a false-negative rate of 25%, a false-positive rate of 7.7%, and 90% test agreement.
More false negatives than with LC-MS
A 2010 blinded diagnostic accuracy study of 4200 adults treated with opioids for chronic pain compared immunoassay urine testing with LC-MS for opioids, benzodiazepines, marijuana, cocaine, and methamphetamine between October and November 2008.2 Urine samples were tested using both methods simultaneously on split specimens. Cutoff values for methadone, codeine, hydrocodone, hydromorphone, and morphine were 50 ng/mL on LC-MS. Immunoassay relative activity—the difference between the immunoassay and the LC-MS cutoffs—was 300 for methadone, 180 for codeine, 1700 for hydrocodone, 4000 for hydromorphone, and 300 for morphine.
Of the 3414 samples submitted for opiate testing, 2191 tested positive using immunoassay and 2233 tested positive using LC-MS for a total of 42 false-negative results with immunoassay. The positive rate (percentage of samples testing positive by LC-MS) was 65%, and the false-negative rate was 1.9%. Methadone testing produced 17 false-negative results; the positive rate was 10%, and the false-negative rate was 6.1%. The immunoassay false-positive results occurred in patients taking hydromorphone and hydrocodone.
The study was limited by lack of demographic information on the participants.
1. Manchikanti L, Malla Y, Wargo B, et al. Comparative evaluation of the accuracy of immunoassay with liquid chromatography tandem mass spectrometry of urine drug testing opioids and illicit drugs in chronic pain patients. Pain Physician. 2011;14:175–187.
2. Pesce A, Rosenthal M, West R, et al. An evaluation of the diagnostic accuracy of liquid chromatography-tandem mass spectrometry versus immunoassay drug testing in pain patients. Pain Physician. 2010;13:273–281.
EVIDENCE SUMMARY
A 2011 blinded diagnostic accuracy study of 1000 adult chronic pain patients in an interventional pain management program in the United States compared POC immunoassay urine drug testing with LC-MS.1 The immunoassay index test can be performed in the office with rapid results. The LC-MS reference test requires that the urine sample be sent to a lab.
Study participants were 37% male and 63% female, average age 51 years. Of the 1000 patients, 920 were prescribed opioids. Morphine, hydrocodone, codeine, and hydromorphone (morphine group) were tested with cutoff values of 300 ng/mL for POC testing and 50 ng/mL for LC-MS. Cutoffs for methadone were 300 ng/mL for POC and 100 ng/mL for LC-MS. For oxycodone, they were 100 ng/mL for POC and 50 ng/mL for LC-MS.
Methadone had the highest sensitivity and specificity at 96% and 99%, with a false-negative rate of 3.9% and a false-positive rate of 1.2%. It also had the highest agreement between the 2 testing methods at 99%. The morphine group had a sensitivity of 92%, specificity of 93%, false-negative rate of 7.8%, false-positive rate of 6.9%, and 93% test agreement. Oxycodone showed the lowest sensitivity at 75%; it had a specificity of 92%, a false-negative rate of 25%, a false-positive rate of 7.7%, and 90% test agreement.
More false negatives than with LC-MS
A 2010 blinded diagnostic accuracy study of 4200 adults treated with opioids for chronic pain compared immunoassay urine testing with LC-MS for opioids, benzodiazepines, marijuana, cocaine, and methamphetamine between October and November 2008.2 Urine samples were tested using both methods simultaneously on split specimens. Cutoff values for methadone, codeine, hydrocodone, hydromorphone, and morphine were 50 ng/mL on LC-MS. Immunoassay relative activity—the difference between the immunoassay and the LC-MS cutoffs—was 300 for methadone, 180 for codeine, 1700 for hydrocodone, 4000 for hydromorphone, and 300 for morphine.
Of the 3414 samples submitted for opiate testing, 2191 tested positive using immunoassay and 2233 tested positive using LC-MS for a total of 42 false-negative results with immunoassay. The positive rate (percentage of samples testing positive by LC-MS) was 65%, and the false-negative rate was 1.9%. Methadone testing produced 17 false-negative results; the positive rate was 10%, and the false-negative rate was 6.1%. The immunoassay false-positive results occurred in patients taking hydromorphone and hydrocodone.
The study was limited by lack of demographic information on the participants.
1. Manchikanti L, Malla Y, Wargo B, et al. Comparative evaluation of the accuracy of immunoassay with liquid chromatography tandem mass spectrometry of urine drug testing opioids and illicit drugs in chronic pain patients. Pain Physician. 2011;14:175–187.
2. Pesce A, Rosenthal M, West R, et al. An evaluation of the diagnostic accuracy of liquid chromatography-tandem mass spectrometry versus immunoassay drug testing in pain patients. Pain Physician. 2010;13:273–281.
Evidence-based answers from the Family Physicians Inquiries Network
EVIDENCE-BASED ANSWER:
In adults treated with opioids for chronic pain, point-of-care (POC) urine drug screens (immunoassays) for detecting opioids show a false-negative rate of 1.9%, a sensitivity of 92%, and a specificity of 93% compared with the gold-standard liquid chromatography tandem mass spectrometry (LC-MS). Oxycodone has the highest rate of false-negative results at 25%; methadone has the lowest rate at 4% to 6% (strength of recommendation [SOR]: A, 2 blinded diagnostic accuracy studies with similar results).
Does treating obstructive sleep apnea improve control of Tx-resistant hypertension?
EVIDENCE SUMMARY
A 2015 meta-analysis by Liu et al of 5 RCTs from 2010 to 2015 (446 patients, range 35 to 194 per trial) evaluated the effect of CPAP on 24-hour ambulatory BP in adults with OSA and moderate to severe resistant hypertension.1 Resistance was defined as hypertension despite optimally dosed 3-drug regimens or adequate control of BP achieved with a 4-drug regimen.
Treatment groups received at least 4 hours of CPAP nightly in addition to previously prescribed pharmacotherapy; control groups received either sham CPAP or no CPAP in addition to their regimen of antihypertensive medications. Reported drug regimens included primarily diuretics, angiotensin converting enzyme inhibitors, calcium channel blockers, and aldosterone receptor blockers.
Prestudy systolic BP ranged from 129 mm Hg to 148 mm Hg; diastolic BP ranged from 75 mm Hg to 88 mm Hg. Participants were followed from 2 to 6 months. Pooled data from all 5 studies indicated an overall decrease in mean 24-hour ambulatory systolic BP of 4.8 mm Hg (95% confidence interval [CI], −8.0 to −1.6) and an overall decrease in diastolic BP of 3 mm Hg (95% CI, −5.4 to −0.5) in CPAP-treated patients compared with controls.
An earlier meta-analysis also shows BP reductions with CPAP
Another 2015 meta-analysis by Hu et al of 7 RCTs from 2006 to 2014 evaluated the effect of CPAP on hypertension in 794 patients with OSA.2 Subgroup analysis of 4 of these studies (351 patients, range 35 to 194 per trial) evaluated outcomes in patients with a previous diagnosis of resistant hypertension. This subgroup had 3 trials in common with the Liu et al meta-analysis and one not included in that study. Two other studies in the Liu et al meta-analysis were published after the search dates of this meta-analysis.
Baseline BP wasn’t reported, and treatment resistance was not explicitly defined. Treatment groups received CPAP for 3 to 6 months in addition to their pharmacotherapy regimen, but duration of nightly use was not reported; control groups received only pharmacotherapy. The number and type of antihypertensive medications used was not reported.
Pooled data from the subgroup noted a significant difference in 24-hour mean ambulatory BPs in the CPAP group compared with controls. Systolic BP decreased by 3.9 mm Hg (95% CI, −6.6 to −1.2) and diastolic BP decreased by 3.7 mm Hg (95% CI, −5.2 to −2.1).
1. Liu L, Cao Q, Guo Z, et al. Continuous positive airway pressure in patients with obstructive sleep apnea and resistant hypertension: a meta-analysis of randomized controlled trials. J Clin Hypertens (Greenwich). 2016;18:153-158. (Epub 2015 Aug 17).
2. Hu X, Fan J, Chen S, et al. The role of continuous positive airway pressure in blood pressure control with obstructive sleep apnea and hypertension: a meta-analysis of randomized controlled trials. J Clin Hypertens (Greenwich). 2015;17: 215-222.
EVIDENCE SUMMARY
A 2015 meta-analysis by Liu et al of 5 RCTs from 2010 to 2015 (446 patients, range 35 to 194 per trial) evaluated the effect of CPAP on 24-hour ambulatory BP in adults with OSA and moderate to severe resistant hypertension.1 Resistance was defined as hypertension despite optimally dosed 3-drug regimens or adequate control of BP achieved with a 4-drug regimen.
Treatment groups received at least 4 hours of CPAP nightly in addition to previously prescribed pharmacotherapy; control groups received either sham CPAP or no CPAP in addition to their regimen of antihypertensive medications. Reported drug regimens included primarily diuretics, angiotensin converting enzyme inhibitors, calcium channel blockers, and aldosterone receptor blockers.
Prestudy systolic BP ranged from 129 mm Hg to 148 mm Hg; diastolic BP ranged from 75 mm Hg to 88 mm Hg. Participants were followed from 2 to 6 months. Pooled data from all 5 studies indicated an overall decrease in mean 24-hour ambulatory systolic BP of 4.8 mm Hg (95% confidence interval [CI], −8.0 to −1.6) and an overall decrease in diastolic BP of 3 mm Hg (95% CI, −5.4 to −0.5) in CPAP-treated patients compared with controls.
An earlier meta-analysis also shows BP reductions with CPAP
Another 2015 meta-analysis by Hu et al of 7 RCTs from 2006 to 2014 evaluated the effect of CPAP on hypertension in 794 patients with OSA.2 Subgroup analysis of 4 of these studies (351 patients, range 35 to 194 per trial) evaluated outcomes in patients with a previous diagnosis of resistant hypertension. This subgroup had 3 trials in common with the Liu et al meta-analysis and one not included in that study. Two other studies in the Liu et al meta-analysis were published after the search dates of this meta-analysis.
Baseline BP wasn’t reported, and treatment resistance was not explicitly defined. Treatment groups received CPAP for 3 to 6 months in addition to their pharmacotherapy regimen, but duration of nightly use was not reported; control groups received only pharmacotherapy. The number and type of antihypertensive medications used was not reported.
Pooled data from the subgroup noted a significant difference in 24-hour mean ambulatory BPs in the CPAP group compared with controls. Systolic BP decreased by 3.9 mm Hg (95% CI, −6.6 to −1.2) and diastolic BP decreased by 3.7 mm Hg (95% CI, −5.2 to −2.1).
1. Liu L, Cao Q, Guo Z, et al. Continuous positive airway pressure in patients with obstructive sleep apnea and resistant hypertension: a meta-analysis of randomized controlled trials. J Clin Hypertens (Greenwich). 2016;18:153-158. (Epub 2015 Aug 17).
2. Hu X, Fan J, Chen S, et al. The role of continuous positive airway pressure in blood pressure control with obstructive sleep apnea and hypertension: a meta-analysis of randomized controlled trials. J Clin Hypertens (Greenwich). 2015;17: 215-222.
Evidence-based answers from the Family Physicians Inquiries Network
EVIDENCE-BASED ANSWER:
Maybe. Treating obstructive sleep apnea (OSA) with continuous positive airway pressure (CPAP) is associated with decreases in both systolic and diastolic blood pressure (BP) of 3 to 5 mm Hg in patients with treatment-resistant hypertension. The clinical significance of this small decrease hasn’t been evaluated, however (strength of recommendation [SOR]: C, meta-analyses of randomized controlled trials [RCTs] with disease-oriented outcomes).
Does giving a sweet-tasting solution before vaccine injection reduce infant crying?
EVIDENCE SUMMARY
A 2010 meta-analysis evaluated 14 RCTs investigating the effectiveness of giving sweet solutions before immunization in 1707 healthy term infants from beyond the neonatal period to 12 months of age.1 Intervention groups received 0.25 to 10 mL (median, 2 mL) of 12% to 75% sucrose or 30% to 40% glucose orally 2 minutes before one to 4 injections (one study used 3 oral doses every 30 seconds, and one study added topical EMLA cream). Control groups received water or nothing (plus topical placebo in one study).
Pooled outcome data for crying duration from 6 studies (5 sucrose, one glucose; 716 injections) showed no significant difference between groups. When 2 studies with widely differing results using 12% sucrose were removed, however, a statistically significant weighted mean difference of 12 seconds less crying favored sweet solutions (3 sucrose, one glucose; 568 injections; 95% confidence interval, −23 to −0.78).
Differences among studies in volumes and concentrations of sweet solutions used prevented investigators from ascertaining optimal dosing.
Sucrose solution significantly reduces crying time compared with placebo
A 2014 double-blind RCT evaluated sucrose solutions compared with sterile water in older infants.2 One nurse gave 2 mL of a 75% sucrose solution, a 25% sucrose solution, or sterile water orally over 15 seconds immediately before administering diphtheria, tetanus, acellular pertussis/Haemophilus influenzae type b/inactivated poliovirus (DTaP/Hib/IPV), pneumococcal, and hepatitis A vaccines to 537 healthy 16- to 19-month-old infants simultaneously in the right and left deltoids. Parents cuddled the infant over one shoulder while a distracting noise was made. Pacifiers (5 infants) and pretreatment paracetamol (8 infants) were permitted.
Infants receiving sucrose solutions showed significantly reduced total crying times compared with controls (75% sucrose, 43 seconds; 25% sucrose, 62 seconds; placebo, 120 seconds; P<.001 for 75% sucrose compared with other solutions; P<.001 for 25% sucrose compared with placebo).
Glucose also shortens crying
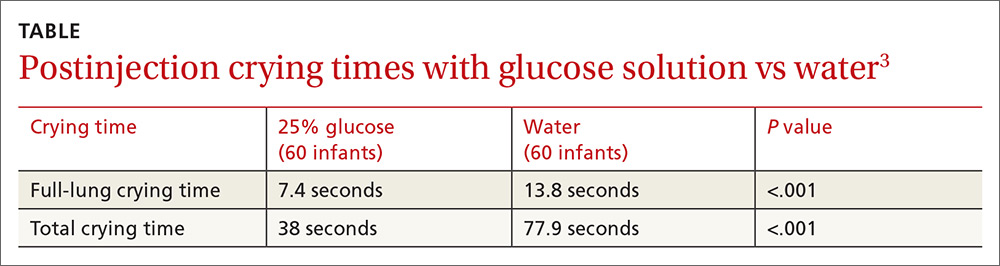
A 2012 double-blind RCT compared glucose solution with sterile water before vaccination in 120 healthy infants 2 months of age.3 Parents used a syringe to apply 2 mL of a 25% glucose solution or sterile water over 30 seconds to the lateral side of the infant’s tongue immediately before injection of DTaP/Hib/IPV vaccine into the right thigh followed by injection of hepatitis B vaccine into the left thigh.
Infants lay on the examination table in the supine position with the head elevated. Parents weren’t permitted to use a pacifier or bottle, or swaddle, cuddle, or restrain the infant during the procedure, but they were allowed to lift and calm the infant 15 seconds after the injections. Mean full-lung crying time and mean total crying time were significantly shorter in the treatment group (TABLE3).
1. Harrison D, Stevens B, Bueno M, et al. Efficacy of sweet solutions for analgesia in infants between 1 and 12 months of age: a systematic review. Arch Dis Child. 2010;95:406-413.
2. Yilmaz G, Caylan N, Oguz M, et al. Oral sucrose administration to reduce pain response during immunization in 16-19 month infants: a randomized, placebo-controlled trial. Eur J Pediatr. 2014;173:1527-1532.
3. Kassab M, Sheehy A, King M, et al. A double-blind randomised controlled trial of 25% oral glucose for pain relief in 2-month-old infants undergoing immunisation. Int J Nurs Stud. 2012;49:249-256.
EVIDENCE SUMMARY
A 2010 meta-analysis evaluated 14 RCTs investigating the effectiveness of giving sweet solutions before immunization in 1707 healthy term infants from beyond the neonatal period to 12 months of age.1 Intervention groups received 0.25 to 10 mL (median, 2 mL) of 12% to 75% sucrose or 30% to 40% glucose orally 2 minutes before one to 4 injections (one study used 3 oral doses every 30 seconds, and one study added topical EMLA cream). Control groups received water or nothing (plus topical placebo in one study).
Pooled outcome data for crying duration from 6 studies (5 sucrose, one glucose; 716 injections) showed no significant difference between groups. When 2 studies with widely differing results using 12% sucrose were removed, however, a statistically significant weighted mean difference of 12 seconds less crying favored sweet solutions (3 sucrose, one glucose; 568 injections; 95% confidence interval, −23 to −0.78).
Differences among studies in volumes and concentrations of sweet solutions used prevented investigators from ascertaining optimal dosing.
Sucrose solution significantly reduces crying time compared with placebo
A 2014 double-blind RCT evaluated sucrose solutions compared with sterile water in older infants.2 One nurse gave 2 mL of a 75% sucrose solution, a 25% sucrose solution, or sterile water orally over 15 seconds immediately before administering diphtheria, tetanus, acellular pertussis/Haemophilus influenzae type b/inactivated poliovirus (DTaP/Hib/IPV), pneumococcal, and hepatitis A vaccines to 537 healthy 16- to 19-month-old infants simultaneously in the right and left deltoids. Parents cuddled the infant over one shoulder while a distracting noise was made. Pacifiers (5 infants) and pretreatment paracetamol (8 infants) were permitted.
Infants receiving sucrose solutions showed significantly reduced total crying times compared with controls (75% sucrose, 43 seconds; 25% sucrose, 62 seconds; placebo, 120 seconds; P<.001 for 75% sucrose compared with other solutions; P<.001 for 25% sucrose compared with placebo).
Glucose also shortens crying
A 2012 double-blind RCT compared glucose solution with sterile water before vaccination in 120 healthy infants 2 months of age.3 Parents used a syringe to apply 2 mL of a 25% glucose solution or sterile water over 30 seconds to the lateral side of the infant’s tongue immediately before injection of DTaP/Hib/IPV vaccine into the right thigh followed by injection of hepatitis B vaccine into the left thigh.
Infants lay on the examination table in the supine position with the head elevated. Parents weren’t permitted to use a pacifier or bottle, or swaddle, cuddle, or restrain the infant during the procedure, but they were allowed to lift and calm the infant 15 seconds after the injections. Mean full-lung crying time and mean total crying time were significantly shorter in the treatment group (TABLE3).
1. Harrison D, Stevens B, Bueno M, et al. Efficacy of sweet solutions for analgesia in infants between 1 and 12 months of age: a systematic review. Arch Dis Child. 2010;95:406-413.
2. Yilmaz G, Caylan N, Oguz M, et al. Oral sucrose administration to reduce pain response during immunization in 16-19 month infants: a randomized, placebo-controlled trial. Eur J Pediatr. 2014;173:1527-1532.
3. Kassab M, Sheehy A, King M, et al. A double-blind randomised controlled trial of 25% oral glucose for pain relief in 2-month-old infants undergoing immunisation. Int J Nurs Stud. 2012;49:249-256.
Evidence-based answers from the Family Physicians Inquiries Network
EVIDENCE-BASED ANSWER:
Yes. Oral administration of a sucrose or glucose solution before intramuscular vaccine injection reduces expected crying duration by 12 to 77 seconds following the shot (strength of recommendation: A, meta-analysis of randomized controlled trials [RCTs] and 2 RCTs).

Do progesterone-only contraceptives lead to more mood changes than other types?
Lower, or comparable depression scores compared with other methods
A retrospective cohort trial compared 298 women on progesterone-only contraception with 6356 women on other or no contraception to examine the association between contraception use and depressive symptoms.1
When surveyed with the Center of Epidemiological Studies Depression Scale (using both a 10-question, 30-point questionnaire and a 20-question, 60-point questionnaire), women on progesterone-only contraception demonstrated significantly lower levels of depressive symptoms compared with women using low-efficacy contraception (early withdrawal, spermicides, contraceptive films) or no contraception (mean deviation [MD]=-1.3; 95% confidence interval [CI], -2.4 to -0.2). No significant difference was seen in depression scores when compared with women on other forms of hormonal contraception (MD=-0.3; 95% CI, -1.2 to 0.6).
No significant difference in depression and less anhedonia for nonusers
A cross-sectional, population-based trial conducted by survey in Finland in 1997, 2002, and 2007 investigated the link between contraception and mood symptoms. It included 759 women using the progesterone-only levonorgestrel-releasing intrauterine system (LNG-IUS) and 7036 women on other forms of contraception or none.2
Current LNG-IUS users vs nonusers had no significant difference in diagnosis of depression, as assessed by asking patients if they had been diagnosed with or treated for depression in the previous year of contraception (8.0% vs 7.3%; P>.05); depressive symptoms in the previous year (24% vs 26%; P>.05), or psychological illness (1.9% vs 2.5%; P>.05).
LNG-IUS users reported significantly less anhedonia than nonusers in the previous year (19% vs 22%; P<.05). Moreover, in a partial correlation analysis, LNG-IUS was negatively correlated with anhedonia (r=0.024; P<.05) and symptoms of depression over the previous month (r=0.098; P<.05).
Did relationship satisfaction, rather than contraceptive, influence depression?
A multicenter prospective cohort trial analyzed the effect of the levonorgestrel implant on mood in 267 women followed for 2 years by evaluating depressive symptoms reported from the Mental Health Inventory, a 6-item questionnaire scored 0 to 24.3
The women demonstrated a significant increase in depressive symptom scores from 7.9 at baseline to 8.8 (P=.01). However, the study authors suggested that relationship satisfaction, not method of birth control, was the cause of depressive symptoms. The 62 women who experienced a decrease in relationship satisfaction exhibited a significant increase in depressive symptoms (6.7-10; P=.001) compared with the 156 women who reported an improvement or no change in relationship satisfaction (7.8-8.2; P=.30).
1. Keyes K, Cheslack-Postava K, Westhoff C, et al. Association of hormonal contraception use with reduced levels of depressive symptoms: a national study of sexually active women in the United States. Am J Epidemiol. 2013;178:1378-1388.
2. Toffol E, Heikinheimo O, Koponen P, et al. Further evidence for lack of negative associations between hormonal contraception and mental health. Contraception. 2012;86:470-480.
3. Westhoff C, Truman C, Kalmuss D, et al. Depressive symptoms and Norplant contraceptive implants. Contraception. 1998;57:241-245.
Lower, or comparable depression scores compared with other methods
A retrospective cohort trial compared 298 women on progesterone-only contraception with 6356 women on other or no contraception to examine the association between contraception use and depressive symptoms.1
When surveyed with the Center of Epidemiological Studies Depression Scale (using both a 10-question, 30-point questionnaire and a 20-question, 60-point questionnaire), women on progesterone-only contraception demonstrated significantly lower levels of depressive symptoms compared with women using low-efficacy contraception (early withdrawal, spermicides, contraceptive films) or no contraception (mean deviation [MD]=-1.3; 95% confidence interval [CI], -2.4 to -0.2). No significant difference was seen in depression scores when compared with women on other forms of hormonal contraception (MD=-0.3; 95% CI, -1.2 to 0.6).
No significant difference in depression and less anhedonia for nonusers
A cross-sectional, population-based trial conducted by survey in Finland in 1997, 2002, and 2007 investigated the link between contraception and mood symptoms. It included 759 women using the progesterone-only levonorgestrel-releasing intrauterine system (LNG-IUS) and 7036 women on other forms of contraception or none.2
Current LNG-IUS users vs nonusers had no significant difference in diagnosis of depression, as assessed by asking patients if they had been diagnosed with or treated for depression in the previous year of contraception (8.0% vs 7.3%; P>.05); depressive symptoms in the previous year (24% vs 26%; P>.05), or psychological illness (1.9% vs 2.5%; P>.05).
LNG-IUS users reported significantly less anhedonia than nonusers in the previous year (19% vs 22%; P<.05). Moreover, in a partial correlation analysis, LNG-IUS was negatively correlated with anhedonia (r=0.024; P<.05) and symptoms of depression over the previous month (r=0.098; P<.05).
Did relationship satisfaction, rather than contraceptive, influence depression?
A multicenter prospective cohort trial analyzed the effect of the levonorgestrel implant on mood in 267 women followed for 2 years by evaluating depressive symptoms reported from the Mental Health Inventory, a 6-item questionnaire scored 0 to 24.3
The women demonstrated a significant increase in depressive symptom scores from 7.9 at baseline to 8.8 (P=.01). However, the study authors suggested that relationship satisfaction, not method of birth control, was the cause of depressive symptoms. The 62 women who experienced a decrease in relationship satisfaction exhibited a significant increase in depressive symptoms (6.7-10; P=.001) compared with the 156 women who reported an improvement or no change in relationship satisfaction (7.8-8.2; P=.30).
1. Keyes K, Cheslack-Postava K, Westhoff C, et al. Association of hormonal contraception use with reduced levels of depressive symptoms: a national study of sexually active women in the United States. Am J Epidemiol. 2013;178:1378-1388.
2. Toffol E, Heikinheimo O, Koponen P, et al. Further evidence for lack of negative associations between hormonal contraception and mental health. Contraception. 2012;86:470-480.
3. Westhoff C, Truman C, Kalmuss D, et al. Depressive symptoms and Norplant contraceptive implants. Contraception. 1998;57:241-245.
Evidence-based answers from the Family Physicians Inquiries Network
EVIDENCE-BASED ANSWER:
No. Women taking progesterone-only contraceptives don’t appear to experience more depressive symptoms or mood changes than women on other hormonal contraceptives, and they may experience slightly less depression than women using no contraception (strength of recommendation: B, multiple homogeneous cohorts).
Is an intestinal biopsy necessary when the blood work suggests celiac disease?
EVIDENCE SUMMARY
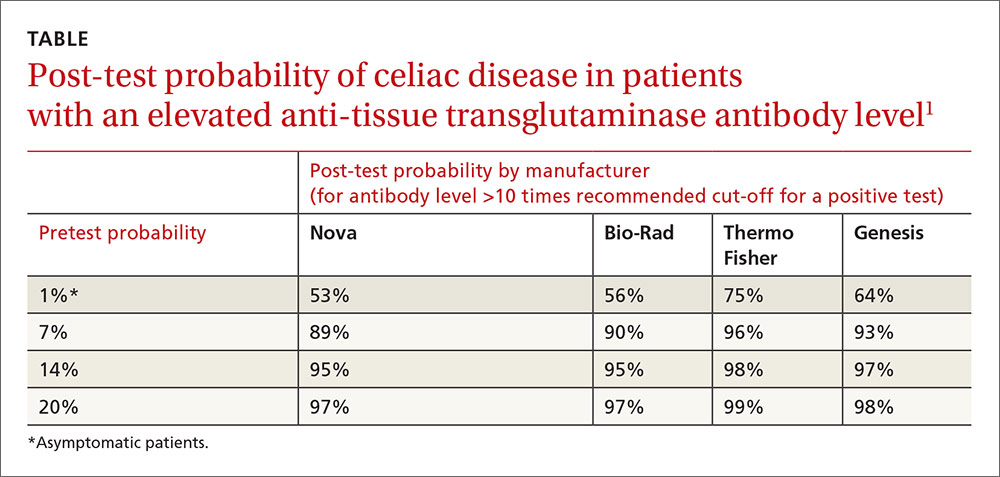
A 2013 Belgian prospective study of 104 non-IgA–deficient adults and children diagnosed with celiac disease and 537 adults and children without celiac disease evaluated the accuracy of 4 manufacturers’ serologic tests for IgA anti-tTG.1 All patients underwent serologic testing followed by a diagnostic biopsy. A Marsh type 3 or greater lesion on duodenal biopsy was considered diagnostic for celiac disease.
Anti-tTG levels greater than 10 times the manufacturer-recommended level for a positive test (cut-off) were associated with a likelihood ratio of 111 to 294 (depending on the manufacturer) of positive biopsy. Post-test probabilities were calculated based on various pretest probabilities using an anti-tTG level of greater than 10 times the cut-off (TABLE1).
Investigators also obtained IgG anti-DGP levels from 2 of the manufacturers.1 Likelihood ratios increased along with antibody levels. Ratios of 80 and 400, depending on the manufacturer, were found at IgG anti-DGP levels 10-fold greater than the cut-off. Pre- and post-test probabilities weren’t calculated.
Positive predictive value rises with antibody levels
A 2013 retrospective study evaluated the European Society for Pediatric Gastroenterology, Hepatology, and Nutrition’s recommendation to forego intestinal biopsy in non-IgA–deficient, symptomatic children and adolescents with positive IgA anti-tTG levels greater than 10 times the cut-off value, positive EMA, and positive HLA-DQ2 or HLA-DQ8.2
Overall, 153 symptomatic patients referred to the gastroenterology unit met these criteria. The age range was 9 months to 14.6 years (mean 4 years). All but 3 of the patients had Marsh 2 or greater lesions with biopsy-confirmed diagnoses of celiac disease. The remaining 3 developed biopsy-positive celiac disease on follow-up. The positive predictive value of combined serologic testing in this small selected patient population was 100%.
A 2013 retrospective study of 2477 symptomatic adults (older than 18 years) who received diagnostic testing for celiac disease at 2 academic institutions in Cleveland, Ohio, evaluated the predictive value of IgA anti-tTG and EMA. Of the patients, 610 (25%) had abnormal serologic tests, and 240 (39%) underwent endoscopy with biopsy.
A total of 50 patients (21%) had biopsy results consistent with celiac disease, defined as a Marsh 3 lesion or greater.3 An IgA anti-tTG level of 118 U/mL (5.9-fold the upper limit of normal on the test) had a positive predictive value of 86.4% with a false-positive value of 2%. An EMA titer greater than 1:160 when IgA anti-tTG was between 21 and 118 U/mL had a positive predictive value of 83%.
Antibody levels 10 times normal show 100% positive predictive value
A 2008 retrospective study of one manufacturer’s IgA anti-tTG serologic test sought to establish the serologic antibody level at which the positive predictive value was 100%.4 Overall, 148 people, 15 years and older, with a positive IgA anti-tTG before biopsy or within 21 days of biopsy were included.
Of the patients biopsied, 139 (93%) had positive biopsies of Marsh 2 or greater and were diagnosed with celiac disease. Using a cut-off of 3.3 and 6.7 times the upper limit of normal, investigators calculated a positive predictive value of 95% and 98%, respectively.
A cut-off of 10 times the upper limit of normal or greater had a positive predictive value of 100%. The highest level of IgA anti-tTG in a patient who didn’t have celiac disease on biopsy was 7.3 times the upper limit of normal.
1. Vermeersch P, Geboes K, Mariën G, et al. Defining thresholds of antibody levels improves diagnosis of celiac disease. Clin Gastroenterol Hepatol. 2013;11:398-403;quiz e32.
2. Klapp G, Masip E, Bolonio M, et al. Celiac disease: The new proposed ESPGHAN diagnostic criteria do work well in a selected population. J Pediatr Gastroenterol Nutr. 2013;56:251-256.
3. Wakim-Fleming J, Pagadala MR, Lemyre MS, et al. Diagnosis of celiac disease in adults based on serology test results, without small-bowel biopsy. Clin Gastroenterol Hepatol. 2013;11:511-516.
4. Hill PG, Holmes GK. Coeliac disease: a biopsy is not always necessary for diagnosis. Aliment Pharmacol Ther. 2008;27:572-577.
EVIDENCE SUMMARY
A 2013 Belgian prospective study of 104 non-IgA–deficient adults and children diagnosed with celiac disease and 537 adults and children without celiac disease evaluated the accuracy of 4 manufacturers’ serologic tests for IgA anti-tTG.1 All patients underwent serologic testing followed by a diagnostic biopsy. A Marsh type 3 or greater lesion on duodenal biopsy was considered diagnostic for celiac disease.
Anti-tTG levels greater than 10 times the manufacturer-recommended level for a positive test (cut-off) were associated with a likelihood ratio of 111 to 294 (depending on the manufacturer) of positive biopsy. Post-test probabilities were calculated based on various pretest probabilities using an anti-tTG level of greater than 10 times the cut-off (TABLE1).
Investigators also obtained IgG anti-DGP levels from 2 of the manufacturers.1 Likelihood ratios increased along with antibody levels. Ratios of 80 and 400, depending on the manufacturer, were found at IgG anti-DGP levels 10-fold greater than the cut-off. Pre- and post-test probabilities weren’t calculated.
Positive predictive value rises with antibody levels
A 2013 retrospective study evaluated the European Society for Pediatric Gastroenterology, Hepatology, and Nutrition’s recommendation to forego intestinal biopsy in non-IgA–deficient, symptomatic children and adolescents with positive IgA anti-tTG levels greater than 10 times the cut-off value, positive EMA, and positive HLA-DQ2 or HLA-DQ8.2
Overall, 153 symptomatic patients referred to the gastroenterology unit met these criteria. The age range was 9 months to 14.6 years (mean 4 years). All but 3 of the patients had Marsh 2 or greater lesions with biopsy-confirmed diagnoses of celiac disease. The remaining 3 developed biopsy-positive celiac disease on follow-up. The positive predictive value of combined serologic testing in this small selected patient population was 100%.
A 2013 retrospective study of 2477 symptomatic adults (older than 18 years) who received diagnostic testing for celiac disease at 2 academic institutions in Cleveland, Ohio, evaluated the predictive value of IgA anti-tTG and EMA. Of the patients, 610 (25%) had abnormal serologic tests, and 240 (39%) underwent endoscopy with biopsy.
A total of 50 patients (21%) had biopsy results consistent with celiac disease, defined as a Marsh 3 lesion or greater.3 An IgA anti-tTG level of 118 U/mL (5.9-fold the upper limit of normal on the test) had a positive predictive value of 86.4% with a false-positive value of 2%. An EMA titer greater than 1:160 when IgA anti-tTG was between 21 and 118 U/mL had a positive predictive value of 83%.
Antibody levels 10 times normal show 100% positive predictive value
A 2008 retrospective study of one manufacturer’s IgA anti-tTG serologic test sought to establish the serologic antibody level at which the positive predictive value was 100%.4 Overall, 148 people, 15 years and older, with a positive IgA anti-tTG before biopsy or within 21 days of biopsy were included.
Of the patients biopsied, 139 (93%) had positive biopsies of Marsh 2 or greater and were diagnosed with celiac disease. Using a cut-off of 3.3 and 6.7 times the upper limit of normal, investigators calculated a positive predictive value of 95% and 98%, respectively.
A cut-off of 10 times the upper limit of normal or greater had a positive predictive value of 100%. The highest level of IgA anti-tTG in a patient who didn’t have celiac disease on biopsy was 7.3 times the upper limit of normal.
1. Vermeersch P, Geboes K, Mariën G, et al. Defining thresholds of antibody levels improves diagnosis of celiac disease. Clin Gastroenterol Hepatol. 2013;11:398-403;quiz e32.
2. Klapp G, Masip E, Bolonio M, et al. Celiac disease: The new proposed ESPGHAN diagnostic criteria do work well in a selected population. J Pediatr Gastroenterol Nutr. 2013;56:251-256.
3. Wakim-Fleming J, Pagadala MR, Lemyre MS, et al. Diagnosis of celiac disease in adults based on serology test results, without small-bowel biopsy. Clin Gastroenterol Hepatol. 2013;11:511-516.
4. Hill PG, Holmes GK. Coeliac disease: a biopsy is not always necessary for diagnosis. Aliment Pharmacol Ther. 2008;27:572-577.
Evidence-based answers from the Family Physicians Inquiries Network
EVIDENCE-BASED ANSWER:
It depends on the antibody levels in the blood work. Symptomatic patients with serologic levels of immunoglobulin A anti-tissue transglutaminase (IgA anti-tTG) or immunoglobulin G anti-deamidated gliadin peptide antibody (IgG anti-DGP) greater than 10 times the upper limits of normal—especially if they also are positive for endomysial antibodies (EMA) and human leukocyte antigen DQ2 (HLA-DQ2 or HLA-DQ8)—may not need an intestinal biopsy to confirm the diagnosis of celiac disease (strength of recommendation [SOR]: B, inconsistent or limited-quality cohort studies).
Patients with antibody levels lower than 10 times the upper limits of normal or who are asymptomatic most likely need an intestinal biopsy to confirm the diagnosis (SOR: B, inconsistent or limited-quality cohort studies).