User login
Survival curves illustrate prognosis. The percentage of patients reaching an endpoint (eg, death, recurrence of disease, or cure) is plotted on the y(vertical) axis against time on the x(horizontal) axis.
Plotting a survival curve
Two common plotting methods are used. With the actuarial method, the x axis is divided into regular intervals (eg, by month) and percent survival is calculated for each interval. With the Kaplan-Meier method, percent survival is recalculated each time a patient dies (or reaches a different endpoint). Consider the example here (Figure).1
Time zerois when each patient entered the trial. Survival is the percentage of patients still alive thereafter. Median survivalis found by extending a horizontal line from the 50% survival point until it intersects the curve (24 months in this case).
FIGURE
Sample survival curve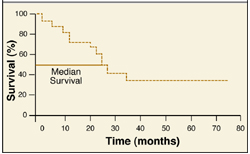
Survival curves have limitations. Consider a study that enrolls patients between 1996 and 2002 and ends in 2005. All that is known about a patient enrolled in 2002 who survived until 2005 is that he or she survived 3 years. Some patients also drop out of the study early or are lost to follow-up. Some patients die from causes other than the one under study.
Censoringis the process of excluding data from survival curves when information about survival is unknown. For a patient who drops out early, for example, only data obtained when the patient was followed would be included. The result is a more accurate picture of survival for the patients under study.
Correspondence
Stephen A. Wilson, MD, UPMC Family Praxctice Residency, 200 Lothrop St., Pittsburgh, PA 15213-2582. E-mail: wilsons2@upmc.edu.
REFERENCE
1. Skordilis P, Mouzas IA, Dimoulios PD, Alexandrakis G, Moschandrea J, Kouroumalis E. Is endosonography an effective method for detection and local staging of the ampullary carcinoma? A prospective study. BMC Surg 2002; 2(1):1.
Survival curves illustrate prognosis. The percentage of patients reaching an endpoint (eg, death, recurrence of disease, or cure) is plotted on the y(vertical) axis against time on the x(horizontal) axis.
Plotting a survival curve
Two common plotting methods are used. With the actuarial method, the x axis is divided into regular intervals (eg, by month) and percent survival is calculated for each interval. With the Kaplan-Meier method, percent survival is recalculated each time a patient dies (or reaches a different endpoint). Consider the example here (Figure).1
Time zerois when each patient entered the trial. Survival is the percentage of patients still alive thereafter. Median survivalis found by extending a horizontal line from the 50% survival point until it intersects the curve (24 months in this case).
FIGURE
Sample survival curve
Survival curves have limitations. Consider a study that enrolls patients between 1996 and 2002 and ends in 2005. All that is known about a patient enrolled in 2002 who survived until 2005 is that he or she survived 3 years. Some patients also drop out of the study early or are lost to follow-up. Some patients die from causes other than the one under study.
Censoringis the process of excluding data from survival curves when information about survival is unknown. For a patient who drops out early, for example, only data obtained when the patient was followed would be included. The result is a more accurate picture of survival for the patients under study.
Correspondence
Stephen A. Wilson, MD, UPMC Family Praxctice Residency, 200 Lothrop St., Pittsburgh, PA 15213-2582. E-mail: wilsons2@upmc.edu.
REFERENCE
1. Skordilis P, Mouzas IA, Dimoulios PD, Alexandrakis G, Moschandrea J, Kouroumalis E. Is endosonography an effective method for detection and local staging of the ampullary carcinoma? A prospective study. BMC Surg 2002; 2(1):1.
REFERENCE
1. Skordilis P, Mouzas IA, Dimoulios PD, Alexandrakis G, Moschandrea J, Kouroumalis E. Is endosonography an effective method for detection and local staging of the ampullary carcinoma? A prospective study. BMC Surg 2002; 2(1):1.