User login
Across the continuum of care, the discharge summary is a critical tool for communication among care providers.[1] In the United States, the Joint Commission policies mandate that all hospital providers complete a discharge summary for patients with specific components to foster effective communication with future providers.[2] Because outpatient providers and emergency physicians rely on clinical information in the discharge summary to ensure appropriate postdischarge continuity of care, timely documentation is potentially an essential aspect of readmission reduction initiatives.[3, 4, 5] Prior reports indicate that poor discharge documentation of follow‐up plan‐of‐care increases the risk of hospitalization, whereas structured instructions, patient education, and direct communications with primary care physicians (PCPs) reduce repeat hospital visits.[6, 7, 8, 9] However, the current literature is limited in its narrow focus on the contents of discharge summaries, considered only same‐hospital readmissions, or considered readmissions within 3 months of discharge.[10, 11, 12, 13] Moreover, some prior research has suggested no association between discharge summary timeliness with readmission,[12, 13, 14] whereas another study did find a relationship,[15] hence the need to study this further is important. Filling this gap in knowledge could provide an avenue to track and improve quality of patient care, as delays in discharge summaries have been linked with pot‐discharge adverse outcomes and patient safety concerns.[15, 16, 17, 18] Because readmissions often occur soon after discharge, having timely discharge summaries may be particularly important to outcomes.[19, 20]
This research began under the framework of evaluating a bundle of care coordination strategies that were implemented at the Johns Hopkins Health System. These strategies were informed by the early Centers for Medicare and Medicaid Services (CMS) demonstration projects and other best practices that have been documented in the literature to improve utilization and improve communication during transitions of care.[21, 22, 23, 24, 25] Later they were augmented through a contract with the Center of Medicare and Medicaid Innovation to improve access to healthcare services and improve patient outcomes through improved care coordination processes. One of the domains our institution has increased efforts to improve is in provider handoffs. Toward that goal, we have worked to disentangle the effects of different factors of provider‐to‐provider communication that may influence readmissions.[26] For example, effective written provider handoffs in the form of accurate and timely discharge summaries was considered a key care coordination component of this program, but there was institutional resistance to endorsing an expectation that discharge summary turnaround should be shortened. To build a case for this concept, we sought to test the hypothesis that, at our hospital, longer time to complete hospital discharge summaries was associated with increased readmission rates. Unique to this analysis is that, in the state of Maryland, there is statewide reporting of readmissions, so we were able to account for intra‐ and interhospital readmissions for an all‐payer population. The authors anticipated that findings from this study would help inform discharge quality‐improvement initiatives and reemphasize the importance of timely discharge documentation across all disciplines as part of quality patient care.
METHODS
Study Population and Setting
We conducted a single‐center, retrospective cohort study of 87,994 consecutive patients discharged from Johns Hopkins Hospital, which is a 1000‐bed, tertiary academic medical center in Baltimore, Maryland between January 1, 2013 and December 31, 2014. One thousand ninety‐three (1.2%) of the records on days to complete the discharge summary were missing and were excluded from the analysis.
Data Source and Covariates
Data were derived from several sources. The Johns Hopkins Hospital data mart financial database, used for mandatory reporting to the State of Maryland, provided the following patient data: age, gender, race/ethnicity, payer (Medicare, Medicaid, and other) as a proxy for socioeconomic status,[27] hospital service prior to discharge (gynecologyobstetrics, medicine, neurosciences, oncology, pediatrics, and surgical sciences), hospital length of stay (LOS) prior to discharge, Agency for Healthcare Research and Quality (AHRQ) Comorbidity Index (which is an update to the original Elixhauser methodology[28]), and all‐payerrefined diagnosis‐related group (APRDRG) and severity of illness (SOI) combinations (a tool to group patients into clinically comparable disease and SOI categories expected to use similar resources and experience similar outcomes). The Health Services Cost Review Commission (HSCRC) in Maryland provided the observed readmission rate in Maryland for each APRDRG‐SOI combination and served as an expected readmission rate. This risk stratification methodology is similar to the approach used in previous studies.[26, 29] Discharge summary turnaround time was obtained from institutional administrative databases used to track compliance with discharge summary completion. Discharge location (home, facility, home with homecare or hospice, or other) was obtained from Curaspan databases (Curaspan Health Group, Inc., Newton, MA).
Primary Outcome: 30‐Day Readmission
The primary outcome was unplanned rehospitalizations to an acute care hospital in Maryland within 30 days of discharge from Johns Hopkins Hospital. This was as defined by the Maryland HSCRC using an algorithm to exclude readmissions that were likely to be scheduled, as defined by the index admission diagnosis and readmission diagnosis; this algorithm is updated based on the CMS all‐cause readmission algorithm.[30, 31]
Primary Exposure: Days to Complete the Discharge Summary
Discharge summary completion time was defined as the date when the discharge attending physician electronically signs the discharge summary. At our institution, an auto‐fax system sends documents (eg, discharge summaries, clinic notes) to linked providers (eg, primary care providers) shortly after midnight from the day the document is signed by an attending physician. During the period of the project, the policy for discharge summaries at the Johns Hopkins Hospital went from requiring them to be completed within 30 days to 14 days, and we were hoping to use our analyses to inform decision makers why this was important. To emphasize the need for timely completion of discharge summaries, we dichotomized the number of days to complete the discharge summary into >3 versus 3 days (20th percentile cutoff) and modeled it as a continuous variable (per 3‐day increase in days to complete the discharge summary).
Statistical Analysis
To evaluate differences in patient characteristics by readmission status, analysis of variance and 2 tests were used for continuous and dichotomous variables, respectively. Logistic regression was used to evaluate the association between days to complete the discharge summary >3 days and readmission status, adjusting for potentially confounding variables. Before inclusion in the logistic regression model, we confirmed a lack of multicollinearity in the multivariable regression model using variance inflation factors. We evaluated residual versus predicted value plots and residual versus fitted value plots with a locally weighted scatterplot smoothing line. In a sensitivity analysis we evaluated the association between readmission status and different cutoffs (>8 days, 50th percentile; and >14 days, 70% percentile). In a separate analysis, we used interaction terms to test whether the association between the association between days to complete the discharge summary >3 days and hospital readmission varied by the covariates in the analysis (age, sex, race, payer, hospital service, discharge location, LOS, APRDRG‐SOI expected readmission rate, and AHRQ Comorbidity Index). We observed a significant interaction between 30‐day readmission and days to complete the discharge summary >3 days by hospital service. Hence, we separately calculated the adjusted mean readmission rates separately for each hospital service using the least squared means method for the multivariable logistic regression analysis and adjusting for the previously mentioned covariates. In a separate analysis, we used linear regression to evaluate the association between LOS and days to complete the discharge summary, adjusting for potentially confounding variables. Statistical significance was defined as a 2‐sided P < 0.05. Data were analyzed with R (version 2.15.0; R Foundation for Statistical Computing, Vienna, Austria;
RESULTS
Readmitted Patients
In the study period, 14,248 out of 87,994 (16.2%) consecutive eligible patients were readmitted to a hospital in Maryland from patients discharged from Johns Hopkins Hospital between January 1, 2013 and December 31, 2014. A total of 11,027 (77.4%) of the readmissions were back to Johns Hopkins Hospital. Table 1 compares characteristics of readmitted versus nonreadmitted patients, with the following variables being significantly different between these patient groups: age, gender, healthcare payer, hospital service, discharge location, length of stay expected readmission rate, AHRQ Comorbidity Index, and days to complete inpatient discharge summary.
| Characteristics | All Patients, N = 87,994 | Not Readmitted, N = 73,746 | Readmitted, N = 14,248 | P Value |
|---|---|---|---|---|
| ||||
| Age, y | 42.1 (25.1) | 41.3 (25.4) | 46.4 (23.1) | <0.001 |
| Male | 43,210 (49.1%) | 35,851 (48.6%) | 7,359 (51.6%) | <0.001 |
| Race | <0.001 | |||
| Caucasian | 45,705 (51.9%) | 3,8661 (52.4%) | 7,044 (49.4%) | |
| African American | 32,777 (37.2%) | 2,6841 (36.4%) | 5,936 (41.7%) | |
| Other | 9,512 (10.8%) | 8,244 (11.2%) | 1,268 (8.9%) | |
| Payer | <0.001 | |||
| Medicare | 22,345 (25.4%) | 17,614 (23.9%) | 4,731 (33.2%) | |
| Medicaid | 24,080 (27.4%) | 20,100 (27.3%) | 3,980 (27.9%) | |
| Other | 41,569 (47.2%) | 36,032 (48.9%) | 5,537 (38.9%) | |
| Hospital service | <0.001 | |||
| Gynecologyobstetrics | 9,299 (10.6%) | 8,829 (12.0%) | 470 (3.3%) | |
| Medicine | 26,036 (29.6%) | 20,069 (27.2%) | 5,967 (41.9%) | |
| Neurosciences | 8,269 (9.4%) | 7,331 (9.9%) | 938 (6.6%) | |
| Oncology | 5,222 (5.9%) | 3,898 (5.3%) | 1,324 (9.3%) | |
| Pediatrics | 17,029 (19.4%) | 14,684 (19.9%) | 2,345 (16.5%) | |
| Surgical sciences | 22,139 (25.2%) | 18,935 (25.7%) | 3,204 (22.5%) | |
| Discharge location | <0.001 | |||
| Home | 65,478 (74.4%) | 56,359 (76.4%) | 9,119 (64.0%) | |
| Home with homecare or hospice | 9,524 (10.8%) | 7,440 (10.1%) | 2,084 (14.6%) | |
| Facility (SNF, rehabilitation facility) | 5,398 (6.1%) | 4,131 (5.6%) | 1,267 (8.9%) | |
| Other | 7,594 (8.6%) | 5,816 (7.9%) | 1,778 (12.5%) | |
| Length of stay, d | 5.5 (8.6) | 5.1 (7.8) | 7.5 (11.6) | <0.001 |
| APRDRG‐SOI Expected Readmission Rate, % | 14.4 (9.5) | 13.3 (9.2) | 20.1 (9.0) | <0.001 |
| AHRQ Comorbidity Index (1 point) | 2.5 (1.4) | 2.4 (1.4) | 3.0 (1.8) | <0.001 |
| Discharge summary completed >3 days | 66,242 (75.3%) | 55,329 (75.0%) | 10,913 (76.6%) | <0.001 |
Association Between Days to Complete the Discharge Summary and Readmission
After hospital discharge, median (IQR) number of days to complete discharge summaries was 8 (416) days. After hospital discharge, median (IQR) number of days to complete discharge summaries and the number of days from discharge to readmission was 8 (416) and 11 (519) days, respectively (P < 0.001). Six thousand one hundred one patients (42.8%) were readmitted before their discharge summary was completed. The median (IQR) days to complete discharge summaries by hospital service in order from shortest to longest was: oncology, 6 (212) days; surgical sciences, 6 (312) days; pediatrics, 7 (315) days; gynecologyobstetrics, 8 (415) days; medicine, 9 (420) days; neurosciences, 12 (621) days.
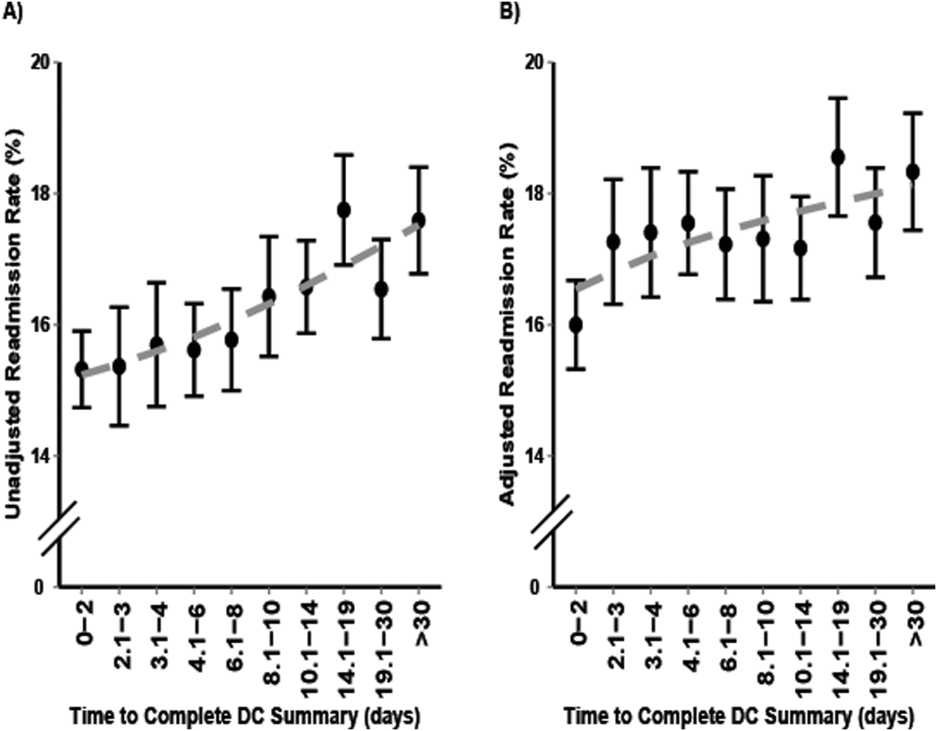
When we divided the number of days to complete the discharge summary into deciles (02, 2.13, 3.14, 4.16, 6.18, 8.210, 10.114, 14.119, 19.130, >30), a longer number of days to complete discharge summaries had higher unadjusted and adjusted readmission rates (Figure 1). In unadjusted analysis, Table 2 shows that older age, male sex, African American race, oncological versus medicine hospital service, discharge location, longer LOS, higher APRDRG‐SOI expected readmission rate, and higher AHRQ Comorbidity Index were associated with readmission. Days to complete the discharge summary >3 days versus 3 days was associated with a higher readmission rate, with an unadjusted odds ratio (OR) and 95% confidence interval (CI) of 1.09 (95% CI: 1.04 to 1.13, P < 0.001).
| Characteristic | Bivariable Analysis* | Multivariable Analysis* | ||
|---|---|---|---|---|
| OR (95% CI) | P Value | OR (95% CI) | P Value | |
| ||||
| Age, 10 y | 1.09 (1.08 to 1.09) | <0.001 | 0.97 (0.95 to 0.98) | <0.001 |
| Male | 1.13 (1.09 to 1.17) | <0.001 | 1.01 (0.97 to 1.05) | 0.76 |
| Race | ||||
| Caucasian | Referent | Referent | ||
| African American | 1.21 (1.17 to 1.26) | <0.001 | 1.01 (0.96 to 1.05) | 0.74 |
| Other | 0.84 (0.79 to 0.90) | <0.001 | 0.92 (0.86 to 0.98) | 0.01 |
| Payer | ||||
| Medicare | Referent | Referent | ||
| Medicaid | 0.74 (0.70 to 0.77) | <0.001 | 1.03 (0.97 to 1.09) | 0.42 |
| Other | 0.57 (0.55 to 0.60) | <0.001 | 0.86 (0.82 to 0.91) | <0.001 |
| Hospital service | ||||
| Medicine | Referent | Referent | ||
| Gynecologyobstetrics | 0.18 (0.16 to 0.20) | <0.001 | 0.50 (0.45 to 0.56) | <0.001 |
| Neurosciences | 0.43 (0.40 to 0.46) | <0.001 | 0.76 (0.70 to 0.82) | <0.001 |
| Oncology | 1.14 (1.07 to 1.22) | <0.001 | 1.18 (1.10 to 1.28) | <0.001 |
| Pediatrics | 0.54 (0.51 to 0.57) | <0.001 | 0.77 (0.71 to 0.83) | <0.001 |
| Surgical sciences | 0.57 (0.54 to 0.60) | <0.001 | 0.92 (0.87 to 0.97) | 0.002 |
| Discharge location | ||||
| Home | Referent | |||
| Facility (SNF, rehabilitation facility) | 1.90 (1.77 to 2.03) | <0.001 | 1.11 (1.02 to 1.19) | 0.009 |
| Home with homecare or hospice | 1.73 (1.64 to 1.83) | <0.001 | 1.26 (1.19 to 1.34) | <0.001 |
| Other | 1.89 (1.78 to 2.00) | <0.001 | 1.25 (1.18 to 1.34) | <0.001 |
| Length of stay, d | 1.03 (1.02 to 1.03) | <0.001 | 1.00 (1.00 to 1.01) | <0.001 |
| APRDRG‐SOI expected readmission rate, % | 1.08 (1.07 to 1.08) | <0.001 | 1.06 (1.06 to 1.06) | <0.001 |
| AHRQ Comorbidity Index (1 point) | 1.27 (1.26 to 1.28) | <0.001 | 1.11 (1.09 to 1.12) | <0.001 |
| Discharge summary completed >3 days | 1.09 (1.04 to 1.14) | <0.001 | 1.09 (1.05 to 1.14) | <0.001 |

Multivariable and Secondary Analyses
In adjusted analysis (Table 2), patients discharged from an oncologic service relative to a medicine hospital service (OR: 1.19, 95% CI: 1.10 to 1.28, P < 0.001), patients discharged to a facility, home with homecare or hospice, or other location compared to home (facility OR: 1.11, 95% CI: 1.02 to 1.19, P = 0.009; home with homecare or hospice OR: 1.26, 95% CI: 1.19 to 1.34, P < 0.001; other OR: 1.25, 95% CI: 1.18 to 1.34, P < 0.001), patients with longer LOS (OR: 1.11 per day, 95% CI: 1.10 to 1.12, P < 0.001), patients with a higher expected readmission rates (OR: 1.01 per percent, 95% CI: 1.00 to 1.01, P < 0.001), and patients with a higher AHRQ comorbidity index (OR: 1.06 per 1 point, 95% CI: 1.06 to 1.06, P < 0.001) had higher 30‐day readmission rates. Overall, days to complete the discharge summary >3 days versus 3 days was associated with a higher readmission rate (OR: 1.09, 95% CI: 1.05 to 1.14, P < 0.001).
In a sensitivity analysis, discharge summary completion >8 days (median) versus 8 days was associated with higher unadjusted readmission rate (OR: 1.11, 95% CI: 1.07 to 1.15, P < 0.001) and a higher adjusted readmission rate (OR: 1.06, 95% CI: 1.02 to 1.10, P < 0.001). Discharge summary completion >14 days (70th percentile) versus 14 days was also associated with higher unadjusted readmission rate (OR: 1.15, 95% CI: 1.08 to 1.21, P < 0.001) and a higher adjusted readmission rate (OR: 1.09, 95% CI: 1.02 to 1.16, P = 0.008). The association between days to complete the discharge summary >3 days and readmissions was found to vary significantly by hospital service (P = 0.03). For comparing days to complete the discharge summary >3 versus 3 days, Table 3 shows that neurosciences, pediatrics, oncology, and medicine hospital services were associated with significantly increased adjusted mean readmission rates. Additionally, when days to complete the discharge summary was modeled as a continuous variable, we found that for every 3 days the odds of readmission increased by 1% (OR: 1.01, 95% CI: 1.00 to 1.01, P < 0.001).
| Days to Complete Discharge Summary by Hospital Service | Adjusted Mean Readmission Rate (95% CI)* | P Value |
|---|---|---|
| ||
| Gynecologyobstetrics | 0.30 | |
| 03 days, n = 1,792 | 5.4 (4.1 to 6.7) | |
| >3 days, n = 7,507 | 6.0 (4.9 to 7.0) | |
| Medicine | 0.04 | |
| 03 days, n = 6,137 | 21.1 (20.0 to 22.3) | |
| >3 days, n = 19,899 | 22.4 (21.6 to 23.2) | |
| Neurosciences | 0.02 | |
| 03 days, n = 1,116 | 10.1 (8.2 to 12.1) | |
| >3 days, n = 7,153 | 12.5 (11.6 to 13.5) | |
| Oncology | 0.01 | |
| 03 days, n = 1,885 | 25.0 (22.6 to 27.4) | |
| >3 days, n = 3,337 | 28.2 (26.6 to 30.2) | |
| Pediatrics | 0.001 | |
| 03 days, n = 4,561 | 9.5 (6.9 to 12.2) | |
| >3 days, n = 12,468 | 11.4 (8.9 to 13.9) | |
| Surgical sciences | 0.89 | |
| 03 days, n = 6,261 | 15.2 (14.2 to 16.1) | |
| >3 days, n = 15,878 | 15.1 (14.4 to 15.8) | |
In an unadjusted analysis, we found that the relationship between LOS and days to complete the discharge summary was not significant ( coefficient and 95% CI:, 0.01, 0.02 to 0.00, P = 0.20). However, we found a small but significant relationship in our multivariable analysis, such that each hospitalization day was associated with a 0.01 (95% CI: 0.00 to 0.02, P = 0.03) increase in days to complete the discharge summary.
DISCUSSION
In this single‐center retrospective analysis, the number of days to complete the discharge summary was significantly associated with readmissions after hospitalization. This association was independent of age, gender, comorbidity index, payer, discharge location, length of hospital stay, expected readmission rate based on diagnosis and severity of illness, and all hospital services. The odds of readmission for patients with delayed discharge summaries was small but significant. This is important in the current landscape of readmissions, particularly for institutions who are challenged to reduce readmission rates, and a small relative difference in readmissions may be the difference between getting penalized or not. In the context of prior studies, the results highlight the role of timely discharge summary as an under‐recognized metric, which may be a valid litmus test for care coordination. The findings also emphasize the potential of early summaries to expedite communication and to help facilitate quality of patient care. Hence, the study results extend the literature examining the relationship of delay in discharge summary with unfavorable patient outcomes.[15, 32]
In contrast to prior reports with limited focus on same‐hospital readmissions,[18, 33, 34, 35] readmissions beyond 30 days,[12] or focused on a specific patient population,[13, 36] this study evaluates both intra‐ and interhospital 30‐day readmissions in Maryland in an all‐payer, multi‐institution, diverse patient population. Additionally, prior research is conflicting with respect to whether timely discharges summaries are significantly associated with increased hospital readmissions.[12, 13, 14, 15] Although it is not surprising that inadequate care during hospitalization could result in readmissions, the role of discharge summaries remain underappreciated. Having a timely discharge summary may not always prevent readmissions, but our study showed that 43% of readmission occurred before the discharge summary completion. Not having a completed discharge summary at the time of readmission may have been a driver for the positive association between timely completion and 30‐day readmission we observed. This study highlights that delay in the discharge summary could be a marker of poor transitions of care, because suboptimal dissemination of critical information to care providers may result in discontinuity of patient care posthospitalization.
A plausible mechanism of the association between discharge summary delays and readmissions could be the provision of collateral information, which may potentially alter the threshold for readmissions. For example, in the emergency room/emergency department (ER/ED) setting, discharge summaries may help with preventable readmissions. For patients who present repeatedly with the same complaint, timely summaries to ER/ED providers may help reframe the patient complaints, such as patient has concern X, which was previously identified to be related to diagnosis Y. As others have shown, the content of discharge summaries, format, and accessibility (electronic vs paper chart), as well as timely distribution of summaries, are key factors that impact quality outcomes.[2, 12, 15, 37, 38] By detailing prior hospital information (ie, discharge medications, prior presentations, tests completed), summaries could help prevent errors in medication dosing, reduce unnecessary testing, and help facilitate admission triage. Summaries may have information regarding a new diagnosis such as the results of an endoscopic evaluation that revealed the source of occult gastrointestinal bleeding, which could help contextualize a complaint of repeat melena and redirect goals of care. Discussions of goals of care in the discharge summary may guide primary providers in continued care management plans.
Our study findings underscore a positive correlation between late discharge summaries and readmissions. However, the extent that this is a causal relationship is unclear; the association of delay in days to complete the discharge summary with readmission may be an epiphenomenon related to processes related to quality of clinical care. For example, delays in discharge summary completion could be a marker of other system issues, such as a stressed work environment. It is possible that providers who fail to complete timely discharge summaries may also fail to do other important functions related to transitions of care and care coordination. However, even if this is so, timely discharge summaries could become a focal point for discussion for optimization of care transitions. A discharge summary could be delayed because the patient has already been readmitted before the summary was distributed, thus making that original summary less relevant. Delays could also be a reflection of the data complexity for patients with longer hospital stays. This is supported by the small but significant relationship between LOS and days to complete the discharge summary in this study. Lastly, delays in discharge summary completion may also be a proxy of provider communication and can reflect the culture of communication at the institution.
Although unplanned hospital readmission is an important outcome, many readmissions may be related to other factors such as disease progression, rather than late summaries or the lack of postdischarge communication. For instance, prior reports did not find any association between the PCP seeing the discharge summaries or direct communications with the PCP and 30‐day clinical outcomes for readmission and death.[26, 39] However, these studies were limited in their use of self‐reported handoffs, did not measure quality of information transfer, and failed to capture a broader audience beyond the PCP, such as ED physicians or specialists.
Our results suggest that the relationship between days to complete discharge summaries and 30‐day readmissions may vary depending on whether the hospitalization is primarily surgical/procedural versus medical treatment. A recent study found that most readmissions after surgery were associated with new complications related to the procedure and not exacerbation of prior index hospitalization complications.[40] Hence, treatment for common causes of hospital readmissions after surgical or gynecological procedures, such as wound infections, acute anemia, ileus, or dehydration, may not necessarily require a completed discharge summary for appropriate management. However, we caution extending this finding to clinical practice before further studies are conducted on specific procedures and in different clinical settings.
Results from this study also support institutional policies that specify the need for practitioners to complete discharge summaries contemporaneously, such as at the time of discharge or within a couple of days. Unlike other forms of communication that are optional, discharge summaries are required, so we recommend that practitioners be held accountable for short turnaround times. For example, providers could be graded and rated on timely completions of discharge summaries, among other performance variables. Anecdotally at our institutions, we have heard from practitioners that it takes less time to complete them when you do them on the day of discharge, because the hospitalization course is fresher in their mind and they have to wade through less information in the medical record to complete an accurate discharge summary. To this point, a barrier to on‐time completion is that providers may have misconceptions about what is really vital information to convey to the next provider. In agreement with past research and in the era of the electronic medical record system, we recommend that the discharge summary should be a quick synthesis of key findings that incorporates only the important elements, such as why the patient was hospitalized, what were key findings and key responses to therapy, what is pending at the time of discharge, what medications the patient is currently taking, and what are the follow‐up plans, rather than a lengthy expose of all the findings.[13, 36, 41, 42]
Lastly, our study results should be taken in the context of its limitations. As a single‐center study, findings may lack generalizability. In particular, the results may not generalize to hospitals that lack access to statewide reporting. We were also not able to assess readmission for patients who may have been readmitted to a hospital outside of Maryland. Although we adjusted for pertinent variables such as age, gender, healthcare payer, hospital service, comorbidity index, discharge location, LOS, and expected readmission rates, there may be other relevant confounders that we failed to capture or measure optimally. Median days to complete the discharge summary in this study was 8 days, which is longer than practices at other institutions, and may also limit this study's generalizability.[15, 36, 42] However, prior research supports our findings,[15] and a systematic review found that only 29% and 52% of discharge summaries were completed by 2 weeks and 4 weeks, respectively.[9] Finally, as noted above and perhaps most important, it is possible that discharge summary turnaround time does not in itself causally impact readmissions, but rather reflects an underlying commitment of the inpatient team to effectively coordinate care following hospital discharge.
CONCLUSION
In sum, this study delineates an underappreciated but important relationship of timely discharge summary completion and readmission outcomes. The discharge summary may be a relevant metric reflecting quality of patient care. Healthcare providers may begin to target timely discharge summaries as a potential focal point of quality‐improvement projects with the goal to facilitate better patient outcomes.
Disclosures
The authors certify that no party having a direct interest in the results of the research supporting this article has or will confer a benefit on us or on any organization with which we are associated, and, if applicable, the authors certify that all financial and material support for this research (eg, Centers for Medicare and Medicaid Services, National Institutes of Health, or National Health Service grants) and work are clearly identified. This study was supported by funding opportunity, number CMS‐1C1‐12‐0001, from the Centers for Medicare and Medicaid Services and Center for Medicare and Medicaid Innovation. Its contents are solely the responsibility of the authors and do not necessarily represent the official views of the Department of Health and Human Services or any of its agencies.
- , , , et al. Development and sustainability of an inpatient‐to‐outpatient discharge handoff tool: a quality improvement project. Jt Comm J Qual Patient Saf. 2014;40(5):219–227.
- , , , , , . Documentation of mandated discharge summary components in transitions from acute to subacute care. In: Henriksen K, Battles JB, Keyes MA, et al., eds. Advances in Patient Safety: New Directions and Alternative Approaches. Vol. 2. Culture and Redesign. Rockville, MD: Agency for Healthcare Research and Quality; 2008.
- , , , . Better transitions: improving comprehension of discharge instructions. Front Health Serv Manage. 2009;25(3):11–32.
- , , , . Structured discharge education improves early outcome in orthopedic patients. Int J Orthop Trauma Nurs. 2010;14(2):66–74.
- , , , et al. Hospital discharge documentation and risk of rehospitalisation. BMJ Qual Saf. 2011;20(9):773–778.
- , , . The hospital discharge: a review of a high risk care transition with highlights of a reengineered discharge process. J Patient Saf. 2007;3(2):97–106.
- , , , , . Interventions to reduce 30‐day rehospitalization: a systematic review. Ann Intern Med. 2011;155(8):520–528.
- , , , , , . Effect of hospital follow‐up appointment on clinical event outcomes and mortality. Arch Intern Med. 2010;170(11):955–960.
- , , , , , . Deficits in communication and information transfer between hospital‐based and primary care physicians: implications for patient safety and continuity of care. JAMA. 2007;297(8):831–841.
- , , , , . Provider characteristics, clinical‐work processes and their relationship to discharge summary quality for sub‐acute care patients. J Gen Intern Med. 2012;27(1):78–84.
- , , , et al. Contemporary evidence about hospital strategies for reducing 30‐day readmissions: a national study. J Am Coll Cardiol. 2012;60(7):607–614.
- , , , . Effect of discharge summary availability during post‐discharge visits on hospital readmission. J Gen Intern Med. 2002;17(3):186–192.
- , , , et al. Association of discharge summary quality with readmission risk for patients hospitalized with heart failure exacerbation. Circ Cardiovasc Qual Outcomes. 2015;8(1):109–111.
- , , , et al. The independent association of provider and information continuity on outcomes after hospital discharge: implications for hospitalists. J Hosp Med. 2010;5(7):398–405.
- , , , , . Timeliness in discharge summary dissemination is associated with patients' clinical outcomes. J Eval Clin Pract. 2013;19(1):76–79.
- , , , et al. Communication and information deficits in patients discharged to rehabilitation facilities: an evaluation of five acute care hospitals. J Hosp Med. 2009;4(8):E28–E33.
- , , . Preventing readmissions through comprehensive discharge planning. Prof Case Manag. 2013;18(2):56–63; quiz 64–65.
- , , , et al. Effect of a postdischarge virtual ward on readmission or death for high‐risk patients: a randomized clinical trial. JAMA. 2014;312(13):1305–1312..
- , , . Risk factors for early unplanned hospital readmission in the elderly. J Gen Intern Med. 1991;6(3):223–228.
- , , , , . Differences between early and late readmissions among patients: a cohort study. Ann Intern Med. 2015;162(11):741–749.
- , , , et al. Post‐acute care payment reform demonstration report to congress supplement‐interim report. Centers for Medicare 14(3):1–14; quiz 88–89.
- , , , et al. Comprehensive discharge planning and home follow‐up of hospitalized elders: a randomized clinical trial. JAMA. 1999;281(7):613–620.
- , , , . Posthospital care transitions: patterns, complications, and risk identification. Health Serv Res. 2004;39(5):1449–1465.
- , , , et al. Transitions of care consensus policy statement: American College of Physicians, Society of General Internal Medicine, Society of Hospital Medicine, American Geriatrics Society, American College of Emergency Physicians, and Society for Academic Emergency Medicine. J Hosp Med. 2009;4(6):364–370.
- , , , et al. Association of self‐reported hospital discharge handoffs with 30‐day readmissions. JAMA Intern Med. 2013;173(8):624–629.
- , . Socioeconomic disparities in health: pathways and policies. Health Aff (Millwood). 2002;21(2):60–76.
- , , , . Comorbidity measures for use with administrative data. Med Care. 1998;36(1):8–27.
- , , , , , . Functional status impairment is associated with unplanned readmissions. Arch Phys Med Rehabil. 2013;94(10):1951–1958.
- Centers for Medicare 35(10):1044–1059.
- , , , et al. Understanding and execution of discharge instructions. Am J Med Qual. 2013;28(5):383–391.
- , , , , . Beyond the hospital gates: elucidating the interactive association of social support, depressive symptoms, and physical function with 30‐day readmissions. Am J Phys Med Rehabil. 2015;94(7):555–567.
- , , , et al. Improving the discharge process by embedding a discharge facilitator in a resident team. J Hosp Med. 2011;6(9):494–500.
- , , , et al. Hospital variation in quality of discharge summaries for patients hospitalized with heart failure exacerbation. Circ Cardiovasc Qual Outcomes. 2015;8(1):77–86
- , , , . Addressing the business of discharge: building a case for an electronic discharge summary. J Hosp Med. 2011;6(1):37–42.
- , , , , . Joint commission requirements for discharge instructions in patients with heart failure: is understanding important for preventing readmissions? J Card Fail. 2014;20(9):641–649.
- , , , et al. Association of communication between hospital‐based physicians and primary care providers with patient outcomes. J Gen Intern Med. 2009;24(3):381–386.
- , , , et al. Underlying reasons associated with hospital readmission following surgery in the united states. JAMA. 2015;313(5):483–495.
- , , , , . Assessing quality and efficiency of discharge summaries. Am J Med Qual. 2005;20(6):337–343.
- , , , et al. Comprehensive quality of discharge summaries at an academic medical center. J Hosp Med. 2013;8(8):436–443.
Across the continuum of care, the discharge summary is a critical tool for communication among care providers.[1] In the United States, the Joint Commission policies mandate that all hospital providers complete a discharge summary for patients with specific components to foster effective communication with future providers.[2] Because outpatient providers and emergency physicians rely on clinical information in the discharge summary to ensure appropriate postdischarge continuity of care, timely documentation is potentially an essential aspect of readmission reduction initiatives.[3, 4, 5] Prior reports indicate that poor discharge documentation of follow‐up plan‐of‐care increases the risk of hospitalization, whereas structured instructions, patient education, and direct communications with primary care physicians (PCPs) reduce repeat hospital visits.[6, 7, 8, 9] However, the current literature is limited in its narrow focus on the contents of discharge summaries, considered only same‐hospital readmissions, or considered readmissions within 3 months of discharge.[10, 11, 12, 13] Moreover, some prior research has suggested no association between discharge summary timeliness with readmission,[12, 13, 14] whereas another study did find a relationship,[15] hence the need to study this further is important. Filling this gap in knowledge could provide an avenue to track and improve quality of patient care, as delays in discharge summaries have been linked with pot‐discharge adverse outcomes and patient safety concerns.[15, 16, 17, 18] Because readmissions often occur soon after discharge, having timely discharge summaries may be particularly important to outcomes.[19, 20]
This research began under the framework of evaluating a bundle of care coordination strategies that were implemented at the Johns Hopkins Health System. These strategies were informed by the early Centers for Medicare and Medicaid Services (CMS) demonstration projects and other best practices that have been documented in the literature to improve utilization and improve communication during transitions of care.[21, 22, 23, 24, 25] Later they were augmented through a contract with the Center of Medicare and Medicaid Innovation to improve access to healthcare services and improve patient outcomes through improved care coordination processes. One of the domains our institution has increased efforts to improve is in provider handoffs. Toward that goal, we have worked to disentangle the effects of different factors of provider‐to‐provider communication that may influence readmissions.[26] For example, effective written provider handoffs in the form of accurate and timely discharge summaries was considered a key care coordination component of this program, but there was institutional resistance to endorsing an expectation that discharge summary turnaround should be shortened. To build a case for this concept, we sought to test the hypothesis that, at our hospital, longer time to complete hospital discharge summaries was associated with increased readmission rates. Unique to this analysis is that, in the state of Maryland, there is statewide reporting of readmissions, so we were able to account for intra‐ and interhospital readmissions for an all‐payer population. The authors anticipated that findings from this study would help inform discharge quality‐improvement initiatives and reemphasize the importance of timely discharge documentation across all disciplines as part of quality patient care.
METHODS
Study Population and Setting
We conducted a single‐center, retrospective cohort study of 87,994 consecutive patients discharged from Johns Hopkins Hospital, which is a 1000‐bed, tertiary academic medical center in Baltimore, Maryland between January 1, 2013 and December 31, 2014. One thousand ninety‐three (1.2%) of the records on days to complete the discharge summary were missing and were excluded from the analysis.
Data Source and Covariates
Data were derived from several sources. The Johns Hopkins Hospital data mart financial database, used for mandatory reporting to the State of Maryland, provided the following patient data: age, gender, race/ethnicity, payer (Medicare, Medicaid, and other) as a proxy for socioeconomic status,[27] hospital service prior to discharge (gynecologyobstetrics, medicine, neurosciences, oncology, pediatrics, and surgical sciences), hospital length of stay (LOS) prior to discharge, Agency for Healthcare Research and Quality (AHRQ) Comorbidity Index (which is an update to the original Elixhauser methodology[28]), and all‐payerrefined diagnosis‐related group (APRDRG) and severity of illness (SOI) combinations (a tool to group patients into clinically comparable disease and SOI categories expected to use similar resources and experience similar outcomes). The Health Services Cost Review Commission (HSCRC) in Maryland provided the observed readmission rate in Maryland for each APRDRG‐SOI combination and served as an expected readmission rate. This risk stratification methodology is similar to the approach used in previous studies.[26, 29] Discharge summary turnaround time was obtained from institutional administrative databases used to track compliance with discharge summary completion. Discharge location (home, facility, home with homecare or hospice, or other) was obtained from Curaspan databases (Curaspan Health Group, Inc., Newton, MA).
Primary Outcome: 30‐Day Readmission
The primary outcome was unplanned rehospitalizations to an acute care hospital in Maryland within 30 days of discharge from Johns Hopkins Hospital. This was as defined by the Maryland HSCRC using an algorithm to exclude readmissions that were likely to be scheduled, as defined by the index admission diagnosis and readmission diagnosis; this algorithm is updated based on the CMS all‐cause readmission algorithm.[30, 31]
Primary Exposure: Days to Complete the Discharge Summary
Discharge summary completion time was defined as the date when the discharge attending physician electronically signs the discharge summary. At our institution, an auto‐fax system sends documents (eg, discharge summaries, clinic notes) to linked providers (eg, primary care providers) shortly after midnight from the day the document is signed by an attending physician. During the period of the project, the policy for discharge summaries at the Johns Hopkins Hospital went from requiring them to be completed within 30 days to 14 days, and we were hoping to use our analyses to inform decision makers why this was important. To emphasize the need for timely completion of discharge summaries, we dichotomized the number of days to complete the discharge summary into >3 versus 3 days (20th percentile cutoff) and modeled it as a continuous variable (per 3‐day increase in days to complete the discharge summary).
Statistical Analysis
To evaluate differences in patient characteristics by readmission status, analysis of variance and 2 tests were used for continuous and dichotomous variables, respectively. Logistic regression was used to evaluate the association between days to complete the discharge summary >3 days and readmission status, adjusting for potentially confounding variables. Before inclusion in the logistic regression model, we confirmed a lack of multicollinearity in the multivariable regression model using variance inflation factors. We evaluated residual versus predicted value plots and residual versus fitted value plots with a locally weighted scatterplot smoothing line. In a sensitivity analysis we evaluated the association between readmission status and different cutoffs (>8 days, 50th percentile; and >14 days, 70% percentile). In a separate analysis, we used interaction terms to test whether the association between the association between days to complete the discharge summary >3 days and hospital readmission varied by the covariates in the analysis (age, sex, race, payer, hospital service, discharge location, LOS, APRDRG‐SOI expected readmission rate, and AHRQ Comorbidity Index). We observed a significant interaction between 30‐day readmission and days to complete the discharge summary >3 days by hospital service. Hence, we separately calculated the adjusted mean readmission rates separately for each hospital service using the least squared means method for the multivariable logistic regression analysis and adjusting for the previously mentioned covariates. In a separate analysis, we used linear regression to evaluate the association between LOS and days to complete the discharge summary, adjusting for potentially confounding variables. Statistical significance was defined as a 2‐sided P < 0.05. Data were analyzed with R (version 2.15.0; R Foundation for Statistical Computing, Vienna, Austria;
RESULTS
Readmitted Patients
In the study period, 14,248 out of 87,994 (16.2%) consecutive eligible patients were readmitted to a hospital in Maryland from patients discharged from Johns Hopkins Hospital between January 1, 2013 and December 31, 2014. A total of 11,027 (77.4%) of the readmissions were back to Johns Hopkins Hospital. Table 1 compares characteristics of readmitted versus nonreadmitted patients, with the following variables being significantly different between these patient groups: age, gender, healthcare payer, hospital service, discharge location, length of stay expected readmission rate, AHRQ Comorbidity Index, and days to complete inpatient discharge summary.
| Characteristics | All Patients, N = 87,994 | Not Readmitted, N = 73,746 | Readmitted, N = 14,248 | P Value |
|---|---|---|---|---|
| ||||
| Age, y | 42.1 (25.1) | 41.3 (25.4) | 46.4 (23.1) | <0.001 |
| Male | 43,210 (49.1%) | 35,851 (48.6%) | 7,359 (51.6%) | <0.001 |
| Race | <0.001 | |||
| Caucasian | 45,705 (51.9%) | 3,8661 (52.4%) | 7,044 (49.4%) | |
| African American | 32,777 (37.2%) | 2,6841 (36.4%) | 5,936 (41.7%) | |
| Other | 9,512 (10.8%) | 8,244 (11.2%) | 1,268 (8.9%) | |
| Payer | <0.001 | |||
| Medicare | 22,345 (25.4%) | 17,614 (23.9%) | 4,731 (33.2%) | |
| Medicaid | 24,080 (27.4%) | 20,100 (27.3%) | 3,980 (27.9%) | |
| Other | 41,569 (47.2%) | 36,032 (48.9%) | 5,537 (38.9%) | |
| Hospital service | <0.001 | |||
| Gynecologyobstetrics | 9,299 (10.6%) | 8,829 (12.0%) | 470 (3.3%) | |
| Medicine | 26,036 (29.6%) | 20,069 (27.2%) | 5,967 (41.9%) | |
| Neurosciences | 8,269 (9.4%) | 7,331 (9.9%) | 938 (6.6%) | |
| Oncology | 5,222 (5.9%) | 3,898 (5.3%) | 1,324 (9.3%) | |
| Pediatrics | 17,029 (19.4%) | 14,684 (19.9%) | 2,345 (16.5%) | |
| Surgical sciences | 22,139 (25.2%) | 18,935 (25.7%) | 3,204 (22.5%) | |
| Discharge location | <0.001 | |||
| Home | 65,478 (74.4%) | 56,359 (76.4%) | 9,119 (64.0%) | |
| Home with homecare or hospice | 9,524 (10.8%) | 7,440 (10.1%) | 2,084 (14.6%) | |
| Facility (SNF, rehabilitation facility) | 5,398 (6.1%) | 4,131 (5.6%) | 1,267 (8.9%) | |
| Other | 7,594 (8.6%) | 5,816 (7.9%) | 1,778 (12.5%) | |
| Length of stay, d | 5.5 (8.6) | 5.1 (7.8) | 7.5 (11.6) | <0.001 |
| APRDRG‐SOI Expected Readmission Rate, % | 14.4 (9.5) | 13.3 (9.2) | 20.1 (9.0) | <0.001 |
| AHRQ Comorbidity Index (1 point) | 2.5 (1.4) | 2.4 (1.4) | 3.0 (1.8) | <0.001 |
| Discharge summary completed >3 days | 66,242 (75.3%) | 55,329 (75.0%) | 10,913 (76.6%) | <0.001 |
Association Between Days to Complete the Discharge Summary and Readmission
After hospital discharge, median (IQR) number of days to complete discharge summaries was 8 (416) days. After hospital discharge, median (IQR) number of days to complete discharge summaries and the number of days from discharge to readmission was 8 (416) and 11 (519) days, respectively (P < 0.001). Six thousand one hundred one patients (42.8%) were readmitted before their discharge summary was completed. The median (IQR) days to complete discharge summaries by hospital service in order from shortest to longest was: oncology, 6 (212) days; surgical sciences, 6 (312) days; pediatrics, 7 (315) days; gynecologyobstetrics, 8 (415) days; medicine, 9 (420) days; neurosciences, 12 (621) days.
When we divided the number of days to complete the discharge summary into deciles (02, 2.13, 3.14, 4.16, 6.18, 8.210, 10.114, 14.119, 19.130, >30), a longer number of days to complete discharge summaries had higher unadjusted and adjusted readmission rates (Figure 1). In unadjusted analysis, Table 2 shows that older age, male sex, African American race, oncological versus medicine hospital service, discharge location, longer LOS, higher APRDRG‐SOI expected readmission rate, and higher AHRQ Comorbidity Index were associated with readmission. Days to complete the discharge summary >3 days versus 3 days was associated with a higher readmission rate, with an unadjusted odds ratio (OR) and 95% confidence interval (CI) of 1.09 (95% CI: 1.04 to 1.13, P < 0.001).
| Characteristic | Bivariable Analysis* | Multivariable Analysis* | ||
|---|---|---|---|---|
| OR (95% CI) | P Value | OR (95% CI) | P Value | |
| ||||
| Age, 10 y | 1.09 (1.08 to 1.09) | <0.001 | 0.97 (0.95 to 0.98) | <0.001 |
| Male | 1.13 (1.09 to 1.17) | <0.001 | 1.01 (0.97 to 1.05) | 0.76 |
| Race | ||||
| Caucasian | Referent | Referent | ||
| African American | 1.21 (1.17 to 1.26) | <0.001 | 1.01 (0.96 to 1.05) | 0.74 |
| Other | 0.84 (0.79 to 0.90) | <0.001 | 0.92 (0.86 to 0.98) | 0.01 |
| Payer | ||||
| Medicare | Referent | Referent | ||
| Medicaid | 0.74 (0.70 to 0.77) | <0.001 | 1.03 (0.97 to 1.09) | 0.42 |
| Other | 0.57 (0.55 to 0.60) | <0.001 | 0.86 (0.82 to 0.91) | <0.001 |
| Hospital service | ||||
| Medicine | Referent | Referent | ||
| Gynecologyobstetrics | 0.18 (0.16 to 0.20) | <0.001 | 0.50 (0.45 to 0.56) | <0.001 |
| Neurosciences | 0.43 (0.40 to 0.46) | <0.001 | 0.76 (0.70 to 0.82) | <0.001 |
| Oncology | 1.14 (1.07 to 1.22) | <0.001 | 1.18 (1.10 to 1.28) | <0.001 |
| Pediatrics | 0.54 (0.51 to 0.57) | <0.001 | 0.77 (0.71 to 0.83) | <0.001 |
| Surgical sciences | 0.57 (0.54 to 0.60) | <0.001 | 0.92 (0.87 to 0.97) | 0.002 |
| Discharge location | ||||
| Home | Referent | |||
| Facility (SNF, rehabilitation facility) | 1.90 (1.77 to 2.03) | <0.001 | 1.11 (1.02 to 1.19) | 0.009 |
| Home with homecare or hospice | 1.73 (1.64 to 1.83) | <0.001 | 1.26 (1.19 to 1.34) | <0.001 |
| Other | 1.89 (1.78 to 2.00) | <0.001 | 1.25 (1.18 to 1.34) | <0.001 |
| Length of stay, d | 1.03 (1.02 to 1.03) | <0.001 | 1.00 (1.00 to 1.01) | <0.001 |
| APRDRG‐SOI expected readmission rate, % | 1.08 (1.07 to 1.08) | <0.001 | 1.06 (1.06 to 1.06) | <0.001 |
| AHRQ Comorbidity Index (1 point) | 1.27 (1.26 to 1.28) | <0.001 | 1.11 (1.09 to 1.12) | <0.001 |
| Discharge summary completed >3 days | 1.09 (1.04 to 1.14) | <0.001 | 1.09 (1.05 to 1.14) | <0.001 |
Multivariable and Secondary Analyses
In adjusted analysis (Table 2), patients discharged from an oncologic service relative to a medicine hospital service (OR: 1.19, 95% CI: 1.10 to 1.28, P < 0.001), patients discharged to a facility, home with homecare or hospice, or other location compared to home (facility OR: 1.11, 95% CI: 1.02 to 1.19, P = 0.009; home with homecare or hospice OR: 1.26, 95% CI: 1.19 to 1.34, P < 0.001; other OR: 1.25, 95% CI: 1.18 to 1.34, P < 0.001), patients with longer LOS (OR: 1.11 per day, 95% CI: 1.10 to 1.12, P < 0.001), patients with a higher expected readmission rates (OR: 1.01 per percent, 95% CI: 1.00 to 1.01, P < 0.001), and patients with a higher AHRQ comorbidity index (OR: 1.06 per 1 point, 95% CI: 1.06 to 1.06, P < 0.001) had higher 30‐day readmission rates. Overall, days to complete the discharge summary >3 days versus 3 days was associated with a higher readmission rate (OR: 1.09, 95% CI: 1.05 to 1.14, P < 0.001).
In a sensitivity analysis, discharge summary completion >8 days (median) versus 8 days was associated with higher unadjusted readmission rate (OR: 1.11, 95% CI: 1.07 to 1.15, P < 0.001) and a higher adjusted readmission rate (OR: 1.06, 95% CI: 1.02 to 1.10, P < 0.001). Discharge summary completion >14 days (70th percentile) versus 14 days was also associated with higher unadjusted readmission rate (OR: 1.15, 95% CI: 1.08 to 1.21, P < 0.001) and a higher adjusted readmission rate (OR: 1.09, 95% CI: 1.02 to 1.16, P = 0.008). The association between days to complete the discharge summary >3 days and readmissions was found to vary significantly by hospital service (P = 0.03). For comparing days to complete the discharge summary >3 versus 3 days, Table 3 shows that neurosciences, pediatrics, oncology, and medicine hospital services were associated with significantly increased adjusted mean readmission rates. Additionally, when days to complete the discharge summary was modeled as a continuous variable, we found that for every 3 days the odds of readmission increased by 1% (OR: 1.01, 95% CI: 1.00 to 1.01, P < 0.001).
| Days to Complete Discharge Summary by Hospital Service | Adjusted Mean Readmission Rate (95% CI)* | P Value |
|---|---|---|
| ||
| Gynecologyobstetrics | 0.30 | |
| 03 days, n = 1,792 | 5.4 (4.1 to 6.7) | |
| >3 days, n = 7,507 | 6.0 (4.9 to 7.0) | |
| Medicine | 0.04 | |
| 03 days, n = 6,137 | 21.1 (20.0 to 22.3) | |
| >3 days, n = 19,899 | 22.4 (21.6 to 23.2) | |
| Neurosciences | 0.02 | |
| 03 days, n = 1,116 | 10.1 (8.2 to 12.1) | |
| >3 days, n = 7,153 | 12.5 (11.6 to 13.5) | |
| Oncology | 0.01 | |
| 03 days, n = 1,885 | 25.0 (22.6 to 27.4) | |
| >3 days, n = 3,337 | 28.2 (26.6 to 30.2) | |
| Pediatrics | 0.001 | |
| 03 days, n = 4,561 | 9.5 (6.9 to 12.2) | |
| >3 days, n = 12,468 | 11.4 (8.9 to 13.9) | |
| Surgical sciences | 0.89 | |
| 03 days, n = 6,261 | 15.2 (14.2 to 16.1) | |
| >3 days, n = 15,878 | 15.1 (14.4 to 15.8) | |
In an unadjusted analysis, we found that the relationship between LOS and days to complete the discharge summary was not significant ( coefficient and 95% CI:, 0.01, 0.02 to 0.00, P = 0.20). However, we found a small but significant relationship in our multivariable analysis, such that each hospitalization day was associated with a 0.01 (95% CI: 0.00 to 0.02, P = 0.03) increase in days to complete the discharge summary.
DISCUSSION
In this single‐center retrospective analysis, the number of days to complete the discharge summary was significantly associated with readmissions after hospitalization. This association was independent of age, gender, comorbidity index, payer, discharge location, length of hospital stay, expected readmission rate based on diagnosis and severity of illness, and all hospital services. The odds of readmission for patients with delayed discharge summaries was small but significant. This is important in the current landscape of readmissions, particularly for institutions who are challenged to reduce readmission rates, and a small relative difference in readmissions may be the difference between getting penalized or not. In the context of prior studies, the results highlight the role of timely discharge summary as an under‐recognized metric, which may be a valid litmus test for care coordination. The findings also emphasize the potential of early summaries to expedite communication and to help facilitate quality of patient care. Hence, the study results extend the literature examining the relationship of delay in discharge summary with unfavorable patient outcomes.[15, 32]
In contrast to prior reports with limited focus on same‐hospital readmissions,[18, 33, 34, 35] readmissions beyond 30 days,[12] or focused on a specific patient population,[13, 36] this study evaluates both intra‐ and interhospital 30‐day readmissions in Maryland in an all‐payer, multi‐institution, diverse patient population. Additionally, prior research is conflicting with respect to whether timely discharges summaries are significantly associated with increased hospital readmissions.[12, 13, 14, 15] Although it is not surprising that inadequate care during hospitalization could result in readmissions, the role of discharge summaries remain underappreciated. Having a timely discharge summary may not always prevent readmissions, but our study showed that 43% of readmission occurred before the discharge summary completion. Not having a completed discharge summary at the time of readmission may have been a driver for the positive association between timely completion and 30‐day readmission we observed. This study highlights that delay in the discharge summary could be a marker of poor transitions of care, because suboptimal dissemination of critical information to care providers may result in discontinuity of patient care posthospitalization.
A plausible mechanism of the association between discharge summary delays and readmissions could be the provision of collateral information, which may potentially alter the threshold for readmissions. For example, in the emergency room/emergency department (ER/ED) setting, discharge summaries may help with preventable readmissions. For patients who present repeatedly with the same complaint, timely summaries to ER/ED providers may help reframe the patient complaints, such as patient has concern X, which was previously identified to be related to diagnosis Y. As others have shown, the content of discharge summaries, format, and accessibility (electronic vs paper chart), as well as timely distribution of summaries, are key factors that impact quality outcomes.[2, 12, 15, 37, 38] By detailing prior hospital information (ie, discharge medications, prior presentations, tests completed), summaries could help prevent errors in medication dosing, reduce unnecessary testing, and help facilitate admission triage. Summaries may have information regarding a new diagnosis such as the results of an endoscopic evaluation that revealed the source of occult gastrointestinal bleeding, which could help contextualize a complaint of repeat melena and redirect goals of care. Discussions of goals of care in the discharge summary may guide primary providers in continued care management plans.
Our study findings underscore a positive correlation between late discharge summaries and readmissions. However, the extent that this is a causal relationship is unclear; the association of delay in days to complete the discharge summary with readmission may be an epiphenomenon related to processes related to quality of clinical care. For example, delays in discharge summary completion could be a marker of other system issues, such as a stressed work environment. It is possible that providers who fail to complete timely discharge summaries may also fail to do other important functions related to transitions of care and care coordination. However, even if this is so, timely discharge summaries could become a focal point for discussion for optimization of care transitions. A discharge summary could be delayed because the patient has already been readmitted before the summary was distributed, thus making that original summary less relevant. Delays could also be a reflection of the data complexity for patients with longer hospital stays. This is supported by the small but significant relationship between LOS and days to complete the discharge summary in this study. Lastly, delays in discharge summary completion may also be a proxy of provider communication and can reflect the culture of communication at the institution.
Although unplanned hospital readmission is an important outcome, many readmissions may be related to other factors such as disease progression, rather than late summaries or the lack of postdischarge communication. For instance, prior reports did not find any association between the PCP seeing the discharge summaries or direct communications with the PCP and 30‐day clinical outcomes for readmission and death.[26, 39] However, these studies were limited in their use of self‐reported handoffs, did not measure quality of information transfer, and failed to capture a broader audience beyond the PCP, such as ED physicians or specialists.
Our results suggest that the relationship between days to complete discharge summaries and 30‐day readmissions may vary depending on whether the hospitalization is primarily surgical/procedural versus medical treatment. A recent study found that most readmissions after surgery were associated with new complications related to the procedure and not exacerbation of prior index hospitalization complications.[40] Hence, treatment for common causes of hospital readmissions after surgical or gynecological procedures, such as wound infections, acute anemia, ileus, or dehydration, may not necessarily require a completed discharge summary for appropriate management. However, we caution extending this finding to clinical practice before further studies are conducted on specific procedures and in different clinical settings.
Results from this study also support institutional policies that specify the need for practitioners to complete discharge summaries contemporaneously, such as at the time of discharge or within a couple of days. Unlike other forms of communication that are optional, discharge summaries are required, so we recommend that practitioners be held accountable for short turnaround times. For example, providers could be graded and rated on timely completions of discharge summaries, among other performance variables. Anecdotally at our institutions, we have heard from practitioners that it takes less time to complete them when you do them on the day of discharge, because the hospitalization course is fresher in their mind and they have to wade through less information in the medical record to complete an accurate discharge summary. To this point, a barrier to on‐time completion is that providers may have misconceptions about what is really vital information to convey to the next provider. In agreement with past research and in the era of the electronic medical record system, we recommend that the discharge summary should be a quick synthesis of key findings that incorporates only the important elements, such as why the patient was hospitalized, what were key findings and key responses to therapy, what is pending at the time of discharge, what medications the patient is currently taking, and what are the follow‐up plans, rather than a lengthy expose of all the findings.[13, 36, 41, 42]
Lastly, our study results should be taken in the context of its limitations. As a single‐center study, findings may lack generalizability. In particular, the results may not generalize to hospitals that lack access to statewide reporting. We were also not able to assess readmission for patients who may have been readmitted to a hospital outside of Maryland. Although we adjusted for pertinent variables such as age, gender, healthcare payer, hospital service, comorbidity index, discharge location, LOS, and expected readmission rates, there may be other relevant confounders that we failed to capture or measure optimally. Median days to complete the discharge summary in this study was 8 days, which is longer than practices at other institutions, and may also limit this study's generalizability.[15, 36, 42] However, prior research supports our findings,[15] and a systematic review found that only 29% and 52% of discharge summaries were completed by 2 weeks and 4 weeks, respectively.[9] Finally, as noted above and perhaps most important, it is possible that discharge summary turnaround time does not in itself causally impact readmissions, but rather reflects an underlying commitment of the inpatient team to effectively coordinate care following hospital discharge.
CONCLUSION
In sum, this study delineates an underappreciated but important relationship of timely discharge summary completion and readmission outcomes. The discharge summary may be a relevant metric reflecting quality of patient care. Healthcare providers may begin to target timely discharge summaries as a potential focal point of quality‐improvement projects with the goal to facilitate better patient outcomes.
Disclosures
The authors certify that no party having a direct interest in the results of the research supporting this article has or will confer a benefit on us or on any organization with which we are associated, and, if applicable, the authors certify that all financial and material support for this research (eg, Centers for Medicare and Medicaid Services, National Institutes of Health, or National Health Service grants) and work are clearly identified. This study was supported by funding opportunity, number CMS‐1C1‐12‐0001, from the Centers for Medicare and Medicaid Services and Center for Medicare and Medicaid Innovation. Its contents are solely the responsibility of the authors and do not necessarily represent the official views of the Department of Health and Human Services or any of its agencies.
- , , , et al. Development and sustainability of an inpatient‐to‐outpatient discharge handoff tool: a quality improvement project. Jt Comm J Qual Patient Saf. 2014;40(5):219–227.
- , , , , , . Documentation of mandated discharge summary components in transitions from acute to subacute care. In: Henriksen K, Battles JB, Keyes MA, et al., eds. Advances in Patient Safety: New Directions and Alternative Approaches. Vol. 2. Culture and Redesign. Rockville, MD: Agency for Healthcare Research and Quality; 2008.
- , , , . Better transitions: improving comprehension of discharge instructions. Front Health Serv Manage. 2009;25(3):11–32.
- , , , . Structured discharge education improves early outcome in orthopedic patients. Int J Orthop Trauma Nurs. 2010;14(2):66–74.
- , , , et al. Hospital discharge documentation and risk of rehospitalisation. BMJ Qual Saf. 2011;20(9):773–778.
- , , . The hospital discharge: a review of a high risk care transition with highlights of a reengineered discharge process. J Patient Saf. 2007;3(2):97–106.
- , , , , . Interventions to reduce 30‐day rehospitalization: a systematic review. Ann Intern Med. 2011;155(8):520–528.
- , , , , , . Effect of hospital follow‐up appointment on clinical event outcomes and mortality. Arch Intern Med. 2010;170(11):955–960.
- , , , , , . Deficits in communication and information transfer between hospital‐based and primary care physicians: implications for patient safety and continuity of care. JAMA. 2007;297(8):831–841.
- , , , , . Provider characteristics, clinical‐work processes and their relationship to discharge summary quality for sub‐acute care patients. J Gen Intern Med. 2012;27(1):78–84.
- , , , et al. Contemporary evidence about hospital strategies for reducing 30‐day readmissions: a national study. J Am Coll Cardiol. 2012;60(7):607–614.
- , , , . Effect of discharge summary availability during post‐discharge visits on hospital readmission. J Gen Intern Med. 2002;17(3):186–192.
- , , , et al. Association of discharge summary quality with readmission risk for patients hospitalized with heart failure exacerbation. Circ Cardiovasc Qual Outcomes. 2015;8(1):109–111.
- , , , et al. The independent association of provider and information continuity on outcomes after hospital discharge: implications for hospitalists. J Hosp Med. 2010;5(7):398–405.
- , , , , . Timeliness in discharge summary dissemination is associated with patients' clinical outcomes. J Eval Clin Pract. 2013;19(1):76–79.
- , , , et al. Communication and information deficits in patients discharged to rehabilitation facilities: an evaluation of five acute care hospitals. J Hosp Med. 2009;4(8):E28–E33.
- , , . Preventing readmissions through comprehensive discharge planning. Prof Case Manag. 2013;18(2):56–63; quiz 64–65.
- , , , et al. Effect of a postdischarge virtual ward on readmission or death for high‐risk patients: a randomized clinical trial. JAMA. 2014;312(13):1305–1312..
- , , . Risk factors for early unplanned hospital readmission in the elderly. J Gen Intern Med. 1991;6(3):223–228.
- , , , , . Differences between early and late readmissions among patients: a cohort study. Ann Intern Med. 2015;162(11):741–749.
- , , , et al. Post‐acute care payment reform demonstration report to congress supplement‐interim report. Centers for Medicare 14(3):1–14; quiz 88–89.
- , , , et al. Comprehensive discharge planning and home follow‐up of hospitalized elders: a randomized clinical trial. JAMA. 1999;281(7):613–620.
- , , , . Posthospital care transitions: patterns, complications, and risk identification. Health Serv Res. 2004;39(5):1449–1465.
- , , , et al. Transitions of care consensus policy statement: American College of Physicians, Society of General Internal Medicine, Society of Hospital Medicine, American Geriatrics Society, American College of Emergency Physicians, and Society for Academic Emergency Medicine. J Hosp Med. 2009;4(6):364–370.
- , , , et al. Association of self‐reported hospital discharge handoffs with 30‐day readmissions. JAMA Intern Med. 2013;173(8):624–629.
- , . Socioeconomic disparities in health: pathways and policies. Health Aff (Millwood). 2002;21(2):60–76.
- , , , . Comorbidity measures for use with administrative data. Med Care. 1998;36(1):8–27.
- , , , , , . Functional status impairment is associated with unplanned readmissions. Arch Phys Med Rehabil. 2013;94(10):1951–1958.
- Centers for Medicare 35(10):1044–1059.
- , , , et al. Understanding and execution of discharge instructions. Am J Med Qual. 2013;28(5):383–391.
- , , , , . Beyond the hospital gates: elucidating the interactive association of social support, depressive symptoms, and physical function with 30‐day readmissions. Am J Phys Med Rehabil. 2015;94(7):555–567.
- , , , et al. Improving the discharge process by embedding a discharge facilitator in a resident team. J Hosp Med. 2011;6(9):494–500.
- , , , et al. Hospital variation in quality of discharge summaries for patients hospitalized with heart failure exacerbation. Circ Cardiovasc Qual Outcomes. 2015;8(1):77–86
- , , , . Addressing the business of discharge: building a case for an electronic discharge summary. J Hosp Med. 2011;6(1):37–42.
- , , , , . Joint commission requirements for discharge instructions in patients with heart failure: is understanding important for preventing readmissions? J Card Fail. 2014;20(9):641–649.
- , , , et al. Association of communication between hospital‐based physicians and primary care providers with patient outcomes. J Gen Intern Med. 2009;24(3):381–386.
- , , , et al. Underlying reasons associated with hospital readmission following surgery in the united states. JAMA. 2015;313(5):483–495.
- , , , , . Assessing quality and efficiency of discharge summaries. Am J Med Qual. 2005;20(6):337–343.
- , , , et al. Comprehensive quality of discharge summaries at an academic medical center. J Hosp Med. 2013;8(8):436–443.
© 2016 Society of Hospital Medicine