User login
The Association between Limited English Proficiency and Sepsis Mortality
Sepsis is defined as a life-threatening organ dysfunction that occurs in response to systemic infection.1,2 It is frequently fatal, common in hospital medicine, and a leading contributor to critical illness, morbidity, and healthcare expenditures.2-5 While sepsis care and outcomes have improved in the past decade,6,7 inpatient mortality remains high.8
A number of studies have sought to determine whether race plays a role in sepsis mortality. While Black patients with sepsis have frequently been identified as having the highest rates of death,9-14 similar observations have been made for most non-White races/ethnicities.13-15 Studies have also demonstrated higher rates of hospital-acquired infections among Asian and Latino patients.16
There are several possible explanations for why racial minorities experience disparate outcomes in sepsis, including access to care, comorbidities, implicit biases, and biological or environmental factors,17-20 as well as characteristics of hospitals most likely to care for racial minorities.13,15,21 One explanation that has not been explored is that racial disparities in sepsis are mediated by language. Limited English proficiency (LEP) has previously been associated with increased rates of adverse hospital events,22 longer length of stay,23 and greater likelihood of readmission.24 LEP has also been shown to represent a significant barrier to accessing healthcare and preventive screening.25 The role of LEP in sepsis mortality, however, has yet to be examined.
The diverse patient population at the University of California, San Francisco (UCSF) provides a unique opportunity to build upon existing literature by further exploring racial differences in sepsis, specifically by investigating the role of LEP. The objective of this study was to determine the association between LEP and inpatient mortality among adults hospitalized with sepsis.
METHODS
Setting
The study was conducted at the University of California, San Francisco, California (UCSF), an 800-bed tertiary care, academic medical center. It was approved by the UCSF Institutional Review Board with waiver of informed consent. UCSF cares for a population of patients who are racially and linguistically diverse, with high proportions of patients of East Asian descent and with LEP. According to recent United States census estimates, more than half of San Francisco County residents identify as non-White (35% Asians, 15% Hispanic/Latino, 6% Black), and 44% report speaking a language other than English at home.26
Study Population and Data Collection
The UCSF Medical Center uses the electronic health record (EHR) Epic (Epic 2017, Epic Systems Corporation, Verona, Wisconsin). We obtained computerized EHR data from Clarity, the relational database that stores Epic’s inpatient data in thousands of tables. We identified all patients ≥18 years of age presenting to the emergency department (ED) between June 1, 2012 and December 31, 2016 with suspected serious infection, defined as having blood cultures ordered within 72 hours of ED presentation (N = 25,441). Patients who did not receive at least two doses of intravenous (IV) antibiotics within 48 hours were excluded, as they were unlikely to have serious infections.
We defined sepsis based on Sepsis-3 consensus guidelines2 as a change in sequential [sepsis-related] organ failure assessment (SOFA) score ≥2 within the first 48 hours of ED presentation. The SOFA score is comprised of six variables representing different organ systems, each rated 0-4 based on the degree of dysfunction.2 Patient vital signs, laboratory data, vasopressor medication doses, and ventilator settings were used to determine the exact timestamp at which each patient attained a change in SOFA score ≥2. Missing values were considered to be normal. To adjust for baseline organ dysfunction, SOFA elements associated with elevated bilirubin and/or creatinine were excluded for patients with chronic liver/kidney disease based on Elixhauser comorbidities.27 We chose to focus on the first 48 hours in an attempt to capture patients with the most severe illnesses and the highest probability of true sepsis.
All primary and secondary International Classification of Diseases (ICD)-9/10 diagnosis codes were extracted from Clarity coding tables at the time of hospital discharge. Diagnosis codes signifying bacterial infection were grouped into the following categories based on type/location: pneumonia; bacteremia; urinary tract infection; and skin and soft tissue infection. All remaining diagnostic codes indicating bacterial infections at other sites were categorized as “Other”. If no codes indicating infection were present, patients were categorized as “None coded”. Patients with discharge diagnosis codes of “sepsis” were also identified. Dates and times of antibiotic administrations were obtained from the medications table. Time to first antibiotic was defined as the time in minutes from ED presentation to initiation of the first IV antibacterial medication. This variable was transformed using a natural log transformation based on best fit for normal distribution.
We limited our analyses to 8,974 patients who were diagnosed with sepsis as defined above and had either (1) ≥4 qualifying antibiotic days (QADs) or (2) an ICD-9/10 discharge diagnosis code of “sepsis” (Figure). QADs were defined based on the recent publication by Rhee et al. as having received four or more consecutive days of antibiotics, with the first dose given IV within 48 hours of presentation.28 Patients who died or were discharged to hospice prior to the 4th QAD were also included. These additional parameters were added to increase specificity of the study sample for patients with true sepsis. Patients admitted to all levels of care (acute care, transitional care unit [TCU], intensive care unit [ICU]) and under all hospital services were included. There were no missing data for mortality, race, or language. We chose to focus on patients with sepsis in this initial study as this is a common diagnosis in hospital medicine that is enriched for high mortality.
Primary Outcome
The primary outcome of the study was inpatient mortality, which was obtained from the hospital encounters table in Clarity.
Primary Predictors
The primary predictor of interest was LEP. The encounter numbers from the dataset were used to link to self-reported demographic data, including “preferred language” and need for interpreter services. A manual chart review of 60 patients speaking the top six languages was conducted to verify the accuracy of the data on language and interpreter use (KNK). Defining the gold standard for LEP as having any chart note indicating non-English language and/or that an interpreter was used, the “interpreter needed” variable in Epic was found to have a positive predictive value for LEP of 100%. Therefore, patients in the study cohort were defined as having LEP if they met both of the following criteria: (1) a self-reported “preferred language” other than English and (2) having the “interpreter needed” variable indicating “yes”.
Covariate Data Collection
Additional data were obtained from the demographics tables, including age, race, sex, and insurance status. Race and ethnicity were combined into a single five-category variable including White, Asian, Black, Latino, and Other. This approach has been suggested as the best way to operationalize these variables29 and has been utilized by similar studies in the literature.9,14,15 We considered the Asian race to include all people of East Asian, Southeast Asian, or South Asian descent, which is consistent with the United States Census Bureau definition.30 Patients identifying as Native Hawaiians/Pacific Islanders, Native Americans/Alaskan Natives, as well as those with unspecified race or ethnicity, were categorized as Other. Insurance status was categorized as Commercial, Medicare, Medicaid, or Other.
We estimated illness severity in several ways. First, the total qualifying SOFA score was calculated for each patient, which was defined as the total score achieved at the time that SOFA criteria were first met (≥2, within 48 hours). Second, we dichotomized patients based on whether they had received mechanical ventilation at any point during hospitalization. Finally, we used admission location as a surrogate marker for severity at the time of initial hospitalization.
To estimate the burden of baseline comorbidities, we calculated the van Walraven score (VWS),31 a validated modification of the Elixhauser Comorbidity Index.27 This score conveys an estimated risk of in hospital death based on ICD-9/10 diagnosis codes for preexisting conditions, which ranges from <1% for the minimum score of –19 to >99% for the maximum score of 89.
Statistical Analyses
All statistical analyses were performed using Stata software version 15 (StataCorp LLC, College Station, Texas). Baseline demographics and patient characteristics were stratified by LEP. These were compared using two-sample t-tests or chi-squared tests of significance. Wilcoxon rank-sum tests were used for non-normally distributed variables. Inpatient mortality was compared across all races stratified by LEP using chi-squared tests of significance.
We fit a series of multivariable logistic regression models to examine the association between race and inpatient mortality adjusting for LEP and other patient/clinical characteristics. We first examined the unadjusted association between mortality and race; then adjusted for LEP alone; and finally adjusted for all covariates of interest, including LEP, age, sex, insurance status, year, admission level of care, VWS, total qualifying SOFA score, need for mechanical ventilation, site of infection, and time to first IV antibiotic. A subgroup analysis was also performed using the fully adjusted model restricted to patients who were mechanically ventilated. This population was selected because the patients (1) have among the highest severity of illness and (2) share a common barrier to communication, regardless of English proficiency.
Several potential interactions between LEP with other covariates were explored, including age, race, ICU admission level of care, and need for mechanical ventilation. Lastly, a mediation analysis was performed based on Baron & Kenny’s four-step model32 in order to calculate the proportion of the association between race and mortality explained by the proposed mediator (LEP).
To evaluate for the likelihood of residual confounding, we calculated an E-value, which is defined as the minimum strength of association that an unmeasured confounder would need to have with both the predictor and outcome variables, above and beyond the measured covariates, in order to fully explain away an observed predictor-outcome association.33,34
RESULTS
We identified 8,974 patients hospitalized with sepsis based on the above inclusion criteria. This represented a medically complex, racially and linguistically diverse population (Table 1). The cohort was comprised of 24% Asian, 12% Black, and 11% Latino patients. Among those categorized as Other race, Native Americans/Alaskan Natives and Native Hawaiians/Pacific Islanders accounted for 4% (n = 31) and 21% (n = 159), respectively. A fifth of all patients had LEP (n = 1,716), 62% of whom were Asian (n = 1,064). Patients with LEP tended to be older, female, and to have a greater number of comorbid conditions (Table 1). The total qualifying SOFA score was also higher among patients with LEP (median 5; interquartile range [IQR]: 4-8 vs 5; IQR: 3-7; P <.001), though there was no association between LEP and mechanical ventilation (P = .22). The prevalence of LEP differed significantly across races, with 50% LEP among Asians, 32% among Latinos, 5% among White patients (P < .001). Only eight Black patients had LEP. More than 40 unique languages were represented in the cohort, with English, Cantonese, Spanish, Russian, and Mandarin accounting for ~95% (Appendix Table 1). Among Latino patients, 63% spoke English and 36% spoke Spanish.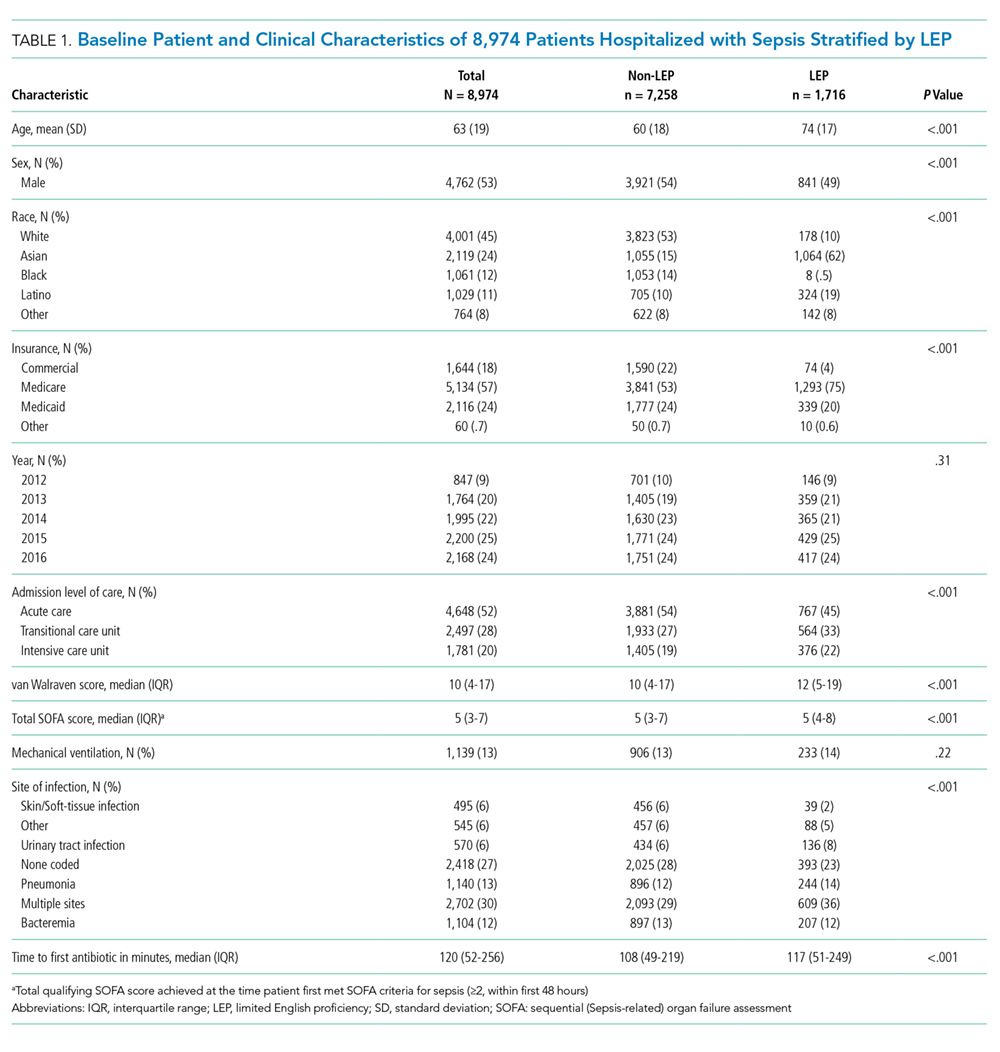
In-hospital mortality was significantly higher among patients who had LEP (n = 268/1,716, 16%) compared to non-LEP patients (n = 678/7,258, 9%), with 80% greater unadjusted odds of mortality (OR 1.80; 95% CI: 1.54-2.09; P < .001). Notably we also found that Asian race was associated with a 1.57 unadjusted odds of mortality compared to White race (95% CI: 1.34-1.85; P < .001). Age, VWS, total qualifying SOFA score, mechanical ventilation, and admission level of care all exhibited a positive dose-response association with mortality (Appendix Table 2). In unadjusted analyses, there was no evidence of interaction between LEP and age (P = .38), LEP and race (P = .45), LEP and ICU admission level of care (P = .31), or LEP and mechanical ventilation (P = .19). Asian patients had the highest overall mortality (14% total, 17% with LEP). LEP was associated with increased unadjusted mortality among White, Asian, and Other races compared to their non-LEP counterparts (Appendix Figure 1). There was no significant difference in mortality between Latino patients with and without LEP. The sample size for Black patients with LEP (n = 8) was too small to draw conclusions about mortality.
Following multivariable logistic regression modeling for the association between race and mortality, we found that the increased odds of death among Asian patients was partially attenuated after adjusting for LEP (odds ratio [OR] 1.23, 95% CI: 1.02-1.48; P = .03; Table 2). Meanwhile, LEP was associated with a 1.66 odds of mortality (95% CI: 1.38-1.99; P < .001) after adjustment for race. In the full multivariable model adjusting for demographics and clinical characteristics, illness severity, and comorbidities, LEP was associated with a 31% increase in the odds of mortality compared to non-LEP (95% CI: 1.06-1.63; P = .02). In this model, the association between Asian race and mortality was now fully attenuated, with a point estimate near 1.0 (OR 0.98; 95% CI: 0.79-1.22; P = .87). Markers of illness severity, including total qualifying SOFA score (OR 1.23; 95% CI: 1.20-1.27; P < .001) and need for mechanical ventilation (OR 1.88; 95% CI: 1.52-2.33; P < .001), were both associated with greater odds of death. Based on a four-step mediation analysis, LEP was found to be a partial mediator to the association between Asian race and mortality (76% proportion explained). The E-value for the association between LEP and mortality was 1.95, with an E-value for the corresponding confidence interval of 1.29.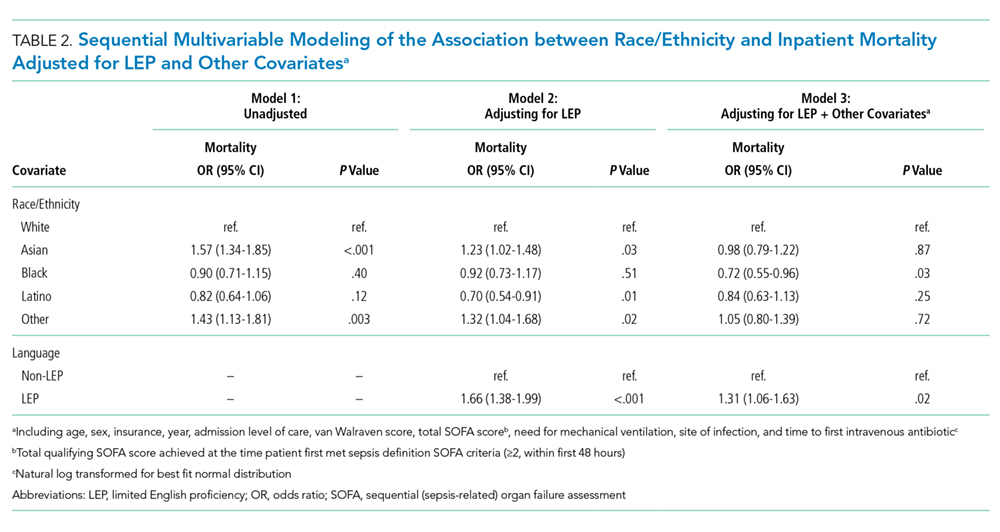
In a subgroup analysis using the fully adjusted model restricted to patients who were mechanically ventilated during hospitalization, the association between LEP and mortality was no longer present (OR 1.15; 95% CI: 0.76-1.72; P = .51).
DISCUSSION
At a single US academic medical center serving a diverse population, we found that LEP was associated with sepsis mortality across all races except Black and Latino, conveying a 31% increase in the odds of death after adjusting for illness severity, comorbidities, and baseline characteristics. The higher mortality among Asian patients was largely mediated by LEP (76% proportion explained). While previous studies have variably found Black, Asian, Latino, and other non-White races/ethnicities to be at an increased risk of death from sepsis,9-15 LEP has not been previously evaluated as a mediator of sepsis mortality. We were uniquely suited to uncover such an association due to the racial and linguistic diversity of our patient population. LEP has previously been implicated in poor health outcomes among hospitalized patients in general.22-24 Future studies will be necessary to determine whether similar associations between LEP and mortality are observed among broader patient populations outside of sepsis.
There are a number of possible explanations for how LEP could mediate the association between race and mortality. First, LEP is known to be associated with greater difficulties in accessing medical care,25 which could result in poorer baseline control of chronic comorbid conditions, fewer opportunities for preventive screening, and greater reluctance to seek medical attention when ill, theoretically leading to more severe presentations and worse outcomes. Indeed, LEP patients in our cohort had both a shorter median time to receiving their first antibiotic, as well as a higher total qualifying SOFA score, both of which may suggest more severe initial presentations. LEP is also known to contribute to, or exacerbate, the impact of low health literacy, which is itself associated with poor health.35 Second, implicit biases may also have been present, as they are known to be common among healthcare providers and have been shown to negatively impact patient care.36
Finally,it is possible that the association is related to the language barrier itself, which impacts providers’ ability to take an appropriate clinical history, and can lead to clinical errors or delays in care.37 The fact that the association between LEP and mortality was eliminated when the analysis was restricted to mechanically ventilated patients seems to support this, since differences in language proficiency become irrelevant in this subgroup. While we are unable to comment on causality based on this observational study, we included a directed acyclic graph (DAG) in the supplemental materials, which shows one proposed model for describing these associations (Appendix Figure 2).
Assuming that the language barrier itself does, at least in part, drive the observed association, LEP represents a potentially modifiable risk factor that could be a target for quality improvement interventions. There is evidence that the use of medical interpreters among patients with LEP leads to greater satisfaction, fewer errors, and improved clinical outcomes;38 however, several recent studies have documented underutilization of professional interpreter services, even when readily available.39,40 At our institution, phone and video interpreter services are available 24/7 for approximately 150 languages. Due to limitations inherent to the EHR, we were unable to ascertain the extent to which these services were used in the present study. Heavy clinical workloads, connectivity issues, and missing or faulty equipment represent theoretical barriers to utilization of these services.
There are some limitations to our study. First, by utilizing a large database of electronic data, the quality of our analyses was reliant on the accuracy of the EHR. Demographic data such as language may have been subject to misclassification due to self-reporting. We attempted to minimize this by also including the need for interpreter services within the definition of LEP, which was validated by manual chart review. Second, generalizability is limited in this single-center study conducted at an institution with unique demographics, wherein nearly two-thirds of the LEP patients were Asian, and the Chinese-speaking population outnumbered those who speak Spanish.
Finally, the most important limitation to our study is the potential for residual confounding. While we attempted to mitigate this by adjusting for as many clinically relevant covariates as possible, there may still be unmeasured confounders to the association between LEP and mortality, such as access to outpatient care, functional status, interpreter use, and other markers of illness severity like the number and type of supportive therapies received. Based on our E-value calculations, with an observed OR of 1.31 for the association between LEP and mortality, an unmeasured confounder with an OR of 1.95 would fully explain away this association, while an OR of 1.29 would shift the confidence interval to include the null. These values suggest at least some risk of residual confounding. The fact that our fully adjusted model included multiple covariates, including several markers of illness severity, does somewhat lessen the likelihood of a confounder achieving these values, since they represent the minimum strength of an unmeasured confounder above and beyond the measured covariates. Regardless, the finding that patients with LEP are more likely to die from sepsis remains an important one, recognizing the need for further studies including multicenter investigations.
In this study, we showed that LEP was associated with sepsis mortality across nearly all races in our cohort. While Asian race was associated with a higher unadjusted odds of death compared to White race, this was attenuated after adjusting for LEP. This may suggest that some of the racial disparities in sepsis identified in prior studies were in fact mediated by language proficiency. Further studies will be required to explore the causal nature of this novel association. If modifiable factors are identified, this could represent a potential target for future quality improvement initiatives aimed at improving sepsis outcomes.
Disclaimer
The contents are solely the responsibility of the authors and do not necessarily represent the official views of the University of California, San Francisco or the National Institutes of Health.
1. De Backer DD, Dorman T. Surviving sepsis guidelines: A continuous move toward better care of patients with sepsis. JAMA. 2017;317(8):807-808. https://doi.org/10.1001/jama.2017.0059.
2. Singer M, Deutschman CS, Seymour CW, et al. The third international consensus definitions for sepsis and septic shock (Sepsis-3). JAMA. 2016;315(8):801-810. https://doi.org/10.1001/jama.2016.0287.
3. Angus DC, Linde-Zwirble WT, Lidicker J, et al. Epidemiology of severe sepsis in the United States: analysis of incidence, outcome, and associated costs of care. Crit Care Med. 2001;29(7):1303-1310. https://doi.org/10.1097/00003246-200107000-00002.
4. Mayr FB, Yende S, Angus DC. Epidemiology of severe sepsis. Virulence. 2014;5(1):4-11. https://doi.org/10.4161/viru.27372.
5. Dellinger RP, Levy MM, Rhodes A, et al. Surviving Sepsis Campaign: international guidelines for management of severe sepsis and septic shock: 2012. Crit Care Med. 2013;41(2):580-637. https://doi.org/10.1097/CCM.0b013e31827e83af.
6. Levy MM, Rhodes A, Phillips GS, et al. Surviving Sepsis Campaign: association between performance metrics and outcomes in a 7.5-year study. Crit Care Med. 2015;43(1):3-12. https://doi.org/10.1097/CCM.0000000000000723.
7. Damiani E, Donati A, Serafini G, et al. Effect of performance improvement programs on compliance with sepsis bundles and mortality: a systematic review and meta-analysis of observational studies. PLOS ONE. 2015;10(5):e0125827. https://doi.org/10.1371/journal.pone.0125827.
8. Paoli CJ, Reynolds MA, Sinha M, Gitlin M, Crouser E. Epidemiology and costs of sepsis in the United States-an analysis based on timing of diagnosis and severity level. Crit Care Med. 2018;46(12):1889-1897. https://doi.org/10.1097/CCM.0000000000003342.
9. Barnato AE, Alexander SL, Linde-Zwirble WT, Angus DC. Racial variation in the incidence, care, and outcomes of severe sepsis: analysis of population, patient, and hospital characteristics. Am J Respir Crit Care Med [patient]. 2008;177(3):279-284. https://doi.org/10.1164/rccm.200703-480OC.
10. Mayr FB, Yende S, Linde-Zwirble WT, et al. Infection rate and acute organ dysfunction risk as explanations for racial differences in severe sepsis. JAMA. 2010;303(24):2495-2503. https://doi.org/10.1001/jama.2010.851.
11. Dombrovskiy VY, Martin AA, Sunderram J, Paz HL. Occurrence and outcomes of sepsis: influence of race. Crit Care Med. 2007;35(3):763-768. https://doi.org/10.1097/01.CCM.0000256726.80998.BF.
12. Yamane D, Huancahuari N, Hou P, Schuur J. Disparities in acute sepsis care: a systematic review. Crit Care. 2015;19(Suppl 1):22. https://doi.org/10.1186/cc14102.
13. Martin GS, Mannino DM, Eaton S, Moss M. The epidemiology of sepsis in the United States from 1979 through 2000. N Engl J Med. 2003;348(16):1546-1554. https://doi.org/10.1056/NEJMoa022139.
14. Melamed A, Sorvillo FJ. The burden of sepsis-associated mortality in the United States from 1999 to 2005: an analysis of multiple-cause-of-death data. Crit Care. 2009;13(1):R28. https://doi.org/10.1186/cc7733.
15. Jones JM, Fingar KR, Miller MA, et al. Racial disparities in sepsis-related in-hospital mortality: using a broad case capture method and multivariate controls for clinical and hospital variables, 2004-2013. Crit Care Med. 2017;45(12):e1209-e1217. https://doi.org/10.1097/CCM.0000000000002699.
16. Bakullari A, Metersky ML, Wang Y, et al. Racial and ethnic disparities in healthcare-associated infections in the United States, 2009–2011. Infect Control Hosp Epidemiol. 2014;35(S3):S10-S16. https://doi.org/10.1086/677827.
17. Institute of Medicine. Unequal Treatment: What Healthcare Providers Need to Know about Racial and Ethnic Disparities in Healthcare. Washington, DC: National Academy Press; 2002.
18. Vogel TR. Update and review of racial disparities in sepsis. Surg Infect. 2012;13(4):203-208. https://doi.org/10.1089/sur.2012.124.
19. Esper AM, Moss M, Lewis CA, et al. The role of infection and comorbidity: factors that influence disparities in sepsis. Crit Care Med. 2006;34(10):2576-2582. https://doi.org/10.1097/01.CCM.0000239114.50519.0E.
20. Soto GJ, Martin GS, Gong MN. Healthcare disparities in critical illness. Crit Care Med. 2013;41(12):2784-2793. https://doi.org/10.1097/CCM.0b013e3182a84a43.
21. Taylor SP, Karvetski CH, Templin MA, Taylor BT. Hospital differences drive antibiotic delays for black patients compared with white patients with suspected septic shock. Crit Care Med. 2018;46(2):e126-e131. https://doi.org/10.1097/CCM.0000000000002829.
22. Divi C, Koss RG, Schmaltz SP, Loeb JM. Language proficiency and adverse events in US hospitals: a pilot study. Int J Qual Health Care. 2007;19(2):60-67. https://doi.org/10.1093/intqhc/mzl069.
23. John-Baptiste A, Naglie G, Tomlinson G, et al. The effect of English language proficiency on length of stay and in-hospital mortality. J Gen Intern Med. 2004;19(3):221-228. https://doi.org/10.1111/j.1525-1497.2004.21205.x.
24. Karliner LS, Kim SE, Meltzer DO, Auerbach AD. Influence of language barriers on outcomes of hospital care for general medicine inpatients. J Hosp Med. 2010;5(5):276-282. https://doi.org/10.1002/jhm.658.
25. Hacker K, Anies M, Folb BL, Zallman L. Barriers to health care for undocumented immigrants: a literature review. Risk Manag Healthc Policy. 2015;8:175-183. https://doi.org/10.2147/RMHP.S70173.
26. QuickFacts: San Francisco County, California. U.S. Census Bureau (2016). https://www.census.gov/quickfacts/fact/table/sanfranciscocountycalifornia/RHI425216. Accessed May 15, 2018.
27. Moore BJ, White S, Washington R, Coenen N, Elixhauser A. Identifying increased risk of readmission and in-hospital mortality using hospital administrative data: The AHRQ Elixhauser comorbidity index. Med Care. 2017;55(7):698-705. https://doi.org/10.1097/MLR.0000000000000735.
28. Rhee C, Dantes R, Epstein L, et al. Incidence and trends of sepsis in us hospitals using clinical vs claims data, 2009-2014. JAMA. 2017;318(13):1241-1249. https://doi.org/10.1001/jama.2017.13836.
29. Howell J, Emerson MO, So M. What “should” we use? Evaluating the impact of five racial measures on markers of social inequality. Sociol Race Ethn. 2017;3(1):14-30. https://doi.org/10.1177/2332649216648465.
30. Reeves T, Claudett B. United States Census Bureau. Asian Pac Islander Popul. March 2002;2003.
31. van Walraven C, Austin PC, Jennings A, Quan H, Forster AJ. A modification of the Elixhauser comorbidity measures into a point system for hospital death using administrative data. Med Care. 2009;47(6):626-633. https://doi.org/10.1097/MLR.0b013e31819432e5.
32. Baron RM, Kenny DA. The moderator-mediator variable distinction in social psychological research: conceptual, strategic, and statistical considerations. J Pers Soc Psychol. 1986;51(6):1173-1182. https://doi.org/10.1037//0022-3514.51.6.1173. 33. VanderWeele TJ, Ding P. Sensitivity analysis in observational research: introducing the E-value. Ann Intern Med. 2017;167(4):268-274. https://doi.org/10.7326/M16-2607.
34. Mathur MB, Ding P, Riddell CA, VanderWeele TJ. Website and R package for computing E-values. Epidemiology. 2018;29(5):e45-e47. https://doi.org/10.1097/EDE.0000000000000864.
35. Sentell T, Braun KL. Low Health Literacy, Limited English proficiency, and health status in Asians, Latinos, and other racial/ethnic groups in California. J Health Commun. 2012;17 Supplement 3:82-99. https://doi.org/10.1080/10810730.2012.712621.
36. FitzGerald C, Hurst S. Implicit bias in healthcare professionals: a systematic review. BMC Med Eth. 2017;18(1):19. https://doi.org/10.1186/s12910-017-0179-8.
37. Flores G. The impact of medical interpreter services on the quality of health care: A systematic review. Med Care Res Rev. 2005;62(3):255-299. https://doi.org/10.1177/1077558705275416.
38. Karliner LS, Jacobs EA, Chen AH, Mutha S. Do professional interpreters improve clinical care for patients with limited English proficiency? A systematic review of the literature. Health Serv Res. 2007;42(2):727-754. https://doi.org/10.1111/j.1475-6773.2006.00629.x.
39. Diamond LC, Schenker Y, Curry L, Bradley EH, Fernandez A. Getting by: underuse of interpreters by resident physicians. J Gen Intern Med. 2009;24(2):256-262. https://doi.org/10.1007/s11606-008-0875-7.
40. López L, Rodriguez F, Huerta D, Soukup J, Hicks L. Use of interpreters by physicians for hospitalized limited English proficient patients and its impact on patient outcomes. J Gen Intern Med. 2015;30(6):783-789. https://doi.org/10.1007/s11606-015-3213-x.
Sepsis is defined as a life-threatening organ dysfunction that occurs in response to systemic infection.1,2 It is frequently fatal, common in hospital medicine, and a leading contributor to critical illness, morbidity, and healthcare expenditures.2-5 While sepsis care and outcomes have improved in the past decade,6,7 inpatient mortality remains high.8
A number of studies have sought to determine whether race plays a role in sepsis mortality. While Black patients with sepsis have frequently been identified as having the highest rates of death,9-14 similar observations have been made for most non-White races/ethnicities.13-15 Studies have also demonstrated higher rates of hospital-acquired infections among Asian and Latino patients.16
There are several possible explanations for why racial minorities experience disparate outcomes in sepsis, including access to care, comorbidities, implicit biases, and biological or environmental factors,17-20 as well as characteristics of hospitals most likely to care for racial minorities.13,15,21 One explanation that has not been explored is that racial disparities in sepsis are mediated by language. Limited English proficiency (LEP) has previously been associated with increased rates of adverse hospital events,22 longer length of stay,23 and greater likelihood of readmission.24 LEP has also been shown to represent a significant barrier to accessing healthcare and preventive screening.25 The role of LEP in sepsis mortality, however, has yet to be examined.
The diverse patient population at the University of California, San Francisco (UCSF) provides a unique opportunity to build upon existing literature by further exploring racial differences in sepsis, specifically by investigating the role of LEP. The objective of this study was to determine the association between LEP and inpatient mortality among adults hospitalized with sepsis.
METHODS
Setting
The study was conducted at the University of California, San Francisco, California (UCSF), an 800-bed tertiary care, academic medical center. It was approved by the UCSF Institutional Review Board with waiver of informed consent. UCSF cares for a population of patients who are racially and linguistically diverse, with high proportions of patients of East Asian descent and with LEP. According to recent United States census estimates, more than half of San Francisco County residents identify as non-White (35% Asians, 15% Hispanic/Latino, 6% Black), and 44% report speaking a language other than English at home.26
Study Population and Data Collection
The UCSF Medical Center uses the electronic health record (EHR) Epic (Epic 2017, Epic Systems Corporation, Verona, Wisconsin). We obtained computerized EHR data from Clarity, the relational database that stores Epic’s inpatient data in thousands of tables. We identified all patients ≥18 years of age presenting to the emergency department (ED) between June 1, 2012 and December 31, 2016 with suspected serious infection, defined as having blood cultures ordered within 72 hours of ED presentation (N = 25,441). Patients who did not receive at least two doses of intravenous (IV) antibiotics within 48 hours were excluded, as they were unlikely to have serious infections.
We defined sepsis based on Sepsis-3 consensus guidelines2 as a change in sequential [sepsis-related] organ failure assessment (SOFA) score ≥2 within the first 48 hours of ED presentation. The SOFA score is comprised of six variables representing different organ systems, each rated 0-4 based on the degree of dysfunction.2 Patient vital signs, laboratory data, vasopressor medication doses, and ventilator settings were used to determine the exact timestamp at which each patient attained a change in SOFA score ≥2. Missing values were considered to be normal. To adjust for baseline organ dysfunction, SOFA elements associated with elevated bilirubin and/or creatinine were excluded for patients with chronic liver/kidney disease based on Elixhauser comorbidities.27 We chose to focus on the first 48 hours in an attempt to capture patients with the most severe illnesses and the highest probability of true sepsis.
All primary and secondary International Classification of Diseases (ICD)-9/10 diagnosis codes were extracted from Clarity coding tables at the time of hospital discharge. Diagnosis codes signifying bacterial infection were grouped into the following categories based on type/location: pneumonia; bacteremia; urinary tract infection; and skin and soft tissue infection. All remaining diagnostic codes indicating bacterial infections at other sites were categorized as “Other”. If no codes indicating infection were present, patients were categorized as “None coded”. Patients with discharge diagnosis codes of “sepsis” were also identified. Dates and times of antibiotic administrations were obtained from the medications table. Time to first antibiotic was defined as the time in minutes from ED presentation to initiation of the first IV antibacterial medication. This variable was transformed using a natural log transformation based on best fit for normal distribution.
We limited our analyses to 8,974 patients who were diagnosed with sepsis as defined above and had either (1) ≥4 qualifying antibiotic days (QADs) or (2) an ICD-9/10 discharge diagnosis code of “sepsis” (Figure). QADs were defined based on the recent publication by Rhee et al. as having received four or more consecutive days of antibiotics, with the first dose given IV within 48 hours of presentation.28 Patients who died or were discharged to hospice prior to the 4th QAD were also included. These additional parameters were added to increase specificity of the study sample for patients with true sepsis. Patients admitted to all levels of care (acute care, transitional care unit [TCU], intensive care unit [ICU]) and under all hospital services were included. There were no missing data for mortality, race, or language. We chose to focus on patients with sepsis in this initial study as this is a common diagnosis in hospital medicine that is enriched for high mortality.
Primary Outcome
The primary outcome of the study was inpatient mortality, which was obtained from the hospital encounters table in Clarity.
Primary Predictors
The primary predictor of interest was LEP. The encounter numbers from the dataset were used to link to self-reported demographic data, including “preferred language” and need for interpreter services. A manual chart review of 60 patients speaking the top six languages was conducted to verify the accuracy of the data on language and interpreter use (KNK). Defining the gold standard for LEP as having any chart note indicating non-English language and/or that an interpreter was used, the “interpreter needed” variable in Epic was found to have a positive predictive value for LEP of 100%. Therefore, patients in the study cohort were defined as having LEP if they met both of the following criteria: (1) a self-reported “preferred language” other than English and (2) having the “interpreter needed” variable indicating “yes”.
Covariate Data Collection
Additional data were obtained from the demographics tables, including age, race, sex, and insurance status. Race and ethnicity were combined into a single five-category variable including White, Asian, Black, Latino, and Other. This approach has been suggested as the best way to operationalize these variables29 and has been utilized by similar studies in the literature.9,14,15 We considered the Asian race to include all people of East Asian, Southeast Asian, or South Asian descent, which is consistent with the United States Census Bureau definition.30 Patients identifying as Native Hawaiians/Pacific Islanders, Native Americans/Alaskan Natives, as well as those with unspecified race or ethnicity, were categorized as Other. Insurance status was categorized as Commercial, Medicare, Medicaid, or Other.
We estimated illness severity in several ways. First, the total qualifying SOFA score was calculated for each patient, which was defined as the total score achieved at the time that SOFA criteria were first met (≥2, within 48 hours). Second, we dichotomized patients based on whether they had received mechanical ventilation at any point during hospitalization. Finally, we used admission location as a surrogate marker for severity at the time of initial hospitalization.
To estimate the burden of baseline comorbidities, we calculated the van Walraven score (VWS),31 a validated modification of the Elixhauser Comorbidity Index.27 This score conveys an estimated risk of in hospital death based on ICD-9/10 diagnosis codes for preexisting conditions, which ranges from <1% for the minimum score of –19 to >99% for the maximum score of 89.
Statistical Analyses
All statistical analyses were performed using Stata software version 15 (StataCorp LLC, College Station, Texas). Baseline demographics and patient characteristics were stratified by LEP. These were compared using two-sample t-tests or chi-squared tests of significance. Wilcoxon rank-sum tests were used for non-normally distributed variables. Inpatient mortality was compared across all races stratified by LEP using chi-squared tests of significance.
We fit a series of multivariable logistic regression models to examine the association between race and inpatient mortality adjusting for LEP and other patient/clinical characteristics. We first examined the unadjusted association between mortality and race; then adjusted for LEP alone; and finally adjusted for all covariates of interest, including LEP, age, sex, insurance status, year, admission level of care, VWS, total qualifying SOFA score, need for mechanical ventilation, site of infection, and time to first IV antibiotic. A subgroup analysis was also performed using the fully adjusted model restricted to patients who were mechanically ventilated. This population was selected because the patients (1) have among the highest severity of illness and (2) share a common barrier to communication, regardless of English proficiency.
Several potential interactions between LEP with other covariates were explored, including age, race, ICU admission level of care, and need for mechanical ventilation. Lastly, a mediation analysis was performed based on Baron & Kenny’s four-step model32 in order to calculate the proportion of the association between race and mortality explained by the proposed mediator (LEP).
To evaluate for the likelihood of residual confounding, we calculated an E-value, which is defined as the minimum strength of association that an unmeasured confounder would need to have with both the predictor and outcome variables, above and beyond the measured covariates, in order to fully explain away an observed predictor-outcome association.33,34
RESULTS
We identified 8,974 patients hospitalized with sepsis based on the above inclusion criteria. This represented a medically complex, racially and linguistically diverse population (Table 1). The cohort was comprised of 24% Asian, 12% Black, and 11% Latino patients. Among those categorized as Other race, Native Americans/Alaskan Natives and Native Hawaiians/Pacific Islanders accounted for 4% (n = 31) and 21% (n = 159), respectively. A fifth of all patients had LEP (n = 1,716), 62% of whom were Asian (n = 1,064). Patients with LEP tended to be older, female, and to have a greater number of comorbid conditions (Table 1). The total qualifying SOFA score was also higher among patients with LEP (median 5; interquartile range [IQR]: 4-8 vs 5; IQR: 3-7; P <.001), though there was no association between LEP and mechanical ventilation (P = .22). The prevalence of LEP differed significantly across races, with 50% LEP among Asians, 32% among Latinos, 5% among White patients (P < .001). Only eight Black patients had LEP. More than 40 unique languages were represented in the cohort, with English, Cantonese, Spanish, Russian, and Mandarin accounting for ~95% (Appendix Table 1). Among Latino patients, 63% spoke English and 36% spoke Spanish.
In-hospital mortality was significantly higher among patients who had LEP (n = 268/1,716, 16%) compared to non-LEP patients (n = 678/7,258, 9%), with 80% greater unadjusted odds of mortality (OR 1.80; 95% CI: 1.54-2.09; P < .001). Notably we also found that Asian race was associated with a 1.57 unadjusted odds of mortality compared to White race (95% CI: 1.34-1.85; P < .001). Age, VWS, total qualifying SOFA score, mechanical ventilation, and admission level of care all exhibited a positive dose-response association with mortality (Appendix Table 2). In unadjusted analyses, there was no evidence of interaction between LEP and age (P = .38), LEP and race (P = .45), LEP and ICU admission level of care (P = .31), or LEP and mechanical ventilation (P = .19). Asian patients had the highest overall mortality (14% total, 17% with LEP). LEP was associated with increased unadjusted mortality among White, Asian, and Other races compared to their non-LEP counterparts (Appendix Figure 1). There was no significant difference in mortality between Latino patients with and without LEP. The sample size for Black patients with LEP (n = 8) was too small to draw conclusions about mortality.
Following multivariable logistic regression modeling for the association between race and mortality, we found that the increased odds of death among Asian patients was partially attenuated after adjusting for LEP (odds ratio [OR] 1.23, 95% CI: 1.02-1.48; P = .03; Table 2). Meanwhile, LEP was associated with a 1.66 odds of mortality (95% CI: 1.38-1.99; P < .001) after adjustment for race. In the full multivariable model adjusting for demographics and clinical characteristics, illness severity, and comorbidities, LEP was associated with a 31% increase in the odds of mortality compared to non-LEP (95% CI: 1.06-1.63; P = .02). In this model, the association between Asian race and mortality was now fully attenuated, with a point estimate near 1.0 (OR 0.98; 95% CI: 0.79-1.22; P = .87). Markers of illness severity, including total qualifying SOFA score (OR 1.23; 95% CI: 1.20-1.27; P < .001) and need for mechanical ventilation (OR 1.88; 95% CI: 1.52-2.33; P < .001), were both associated with greater odds of death. Based on a four-step mediation analysis, LEP was found to be a partial mediator to the association between Asian race and mortality (76% proportion explained). The E-value for the association between LEP and mortality was 1.95, with an E-value for the corresponding confidence interval of 1.29.
In a subgroup analysis using the fully adjusted model restricted to patients who were mechanically ventilated during hospitalization, the association between LEP and mortality was no longer present (OR 1.15; 95% CI: 0.76-1.72; P = .51).
DISCUSSION
At a single US academic medical center serving a diverse population, we found that LEP was associated with sepsis mortality across all races except Black and Latino, conveying a 31% increase in the odds of death after adjusting for illness severity, comorbidities, and baseline characteristics. The higher mortality among Asian patients was largely mediated by LEP (76% proportion explained). While previous studies have variably found Black, Asian, Latino, and other non-White races/ethnicities to be at an increased risk of death from sepsis,9-15 LEP has not been previously evaluated as a mediator of sepsis mortality. We were uniquely suited to uncover such an association due to the racial and linguistic diversity of our patient population. LEP has previously been implicated in poor health outcomes among hospitalized patients in general.22-24 Future studies will be necessary to determine whether similar associations between LEP and mortality are observed among broader patient populations outside of sepsis.
There are a number of possible explanations for how LEP could mediate the association between race and mortality. First, LEP is known to be associated with greater difficulties in accessing medical care,25 which could result in poorer baseline control of chronic comorbid conditions, fewer opportunities for preventive screening, and greater reluctance to seek medical attention when ill, theoretically leading to more severe presentations and worse outcomes. Indeed, LEP patients in our cohort had both a shorter median time to receiving their first antibiotic, as well as a higher total qualifying SOFA score, both of which may suggest more severe initial presentations. LEP is also known to contribute to, or exacerbate, the impact of low health literacy, which is itself associated with poor health.35 Second, implicit biases may also have been present, as they are known to be common among healthcare providers and have been shown to negatively impact patient care.36
Finally,it is possible that the association is related to the language barrier itself, which impacts providers’ ability to take an appropriate clinical history, and can lead to clinical errors or delays in care.37 The fact that the association between LEP and mortality was eliminated when the analysis was restricted to mechanically ventilated patients seems to support this, since differences in language proficiency become irrelevant in this subgroup. While we are unable to comment on causality based on this observational study, we included a directed acyclic graph (DAG) in the supplemental materials, which shows one proposed model for describing these associations (Appendix Figure 2).
Assuming that the language barrier itself does, at least in part, drive the observed association, LEP represents a potentially modifiable risk factor that could be a target for quality improvement interventions. There is evidence that the use of medical interpreters among patients with LEP leads to greater satisfaction, fewer errors, and improved clinical outcomes;38 however, several recent studies have documented underutilization of professional interpreter services, even when readily available.39,40 At our institution, phone and video interpreter services are available 24/7 for approximately 150 languages. Due to limitations inherent to the EHR, we were unable to ascertain the extent to which these services were used in the present study. Heavy clinical workloads, connectivity issues, and missing or faulty equipment represent theoretical barriers to utilization of these services.
There are some limitations to our study. First, by utilizing a large database of electronic data, the quality of our analyses was reliant on the accuracy of the EHR. Demographic data such as language may have been subject to misclassification due to self-reporting. We attempted to minimize this by also including the need for interpreter services within the definition of LEP, which was validated by manual chart review. Second, generalizability is limited in this single-center study conducted at an institution with unique demographics, wherein nearly two-thirds of the LEP patients were Asian, and the Chinese-speaking population outnumbered those who speak Spanish.
Finally, the most important limitation to our study is the potential for residual confounding. While we attempted to mitigate this by adjusting for as many clinically relevant covariates as possible, there may still be unmeasured confounders to the association between LEP and mortality, such as access to outpatient care, functional status, interpreter use, and other markers of illness severity like the number and type of supportive therapies received. Based on our E-value calculations, with an observed OR of 1.31 for the association between LEP and mortality, an unmeasured confounder with an OR of 1.95 would fully explain away this association, while an OR of 1.29 would shift the confidence interval to include the null. These values suggest at least some risk of residual confounding. The fact that our fully adjusted model included multiple covariates, including several markers of illness severity, does somewhat lessen the likelihood of a confounder achieving these values, since they represent the minimum strength of an unmeasured confounder above and beyond the measured covariates. Regardless, the finding that patients with LEP are more likely to die from sepsis remains an important one, recognizing the need for further studies including multicenter investigations.
In this study, we showed that LEP was associated with sepsis mortality across nearly all races in our cohort. While Asian race was associated with a higher unadjusted odds of death compared to White race, this was attenuated after adjusting for LEP. This may suggest that some of the racial disparities in sepsis identified in prior studies were in fact mediated by language proficiency. Further studies will be required to explore the causal nature of this novel association. If modifiable factors are identified, this could represent a potential target for future quality improvement initiatives aimed at improving sepsis outcomes.
Disclaimer
The contents are solely the responsibility of the authors and do not necessarily represent the official views of the University of California, San Francisco or the National Institutes of Health.
1. De Backer DD, Dorman T. Surviving sepsis guidelines: A continuous move toward better care of patients with sepsis. JAMA. 2017;317(8):807-808. https://doi.org/10.1001/jama.2017.0059.
2. Singer M, Deutschman CS, Seymour CW, et al. The third international consensus definitions for sepsis and septic shock (Sepsis-3). JAMA. 2016;315(8):801-810. https://doi.org/10.1001/jama.2016.0287.
3. Angus DC, Linde-Zwirble WT, Lidicker J, et al. Epidemiology of severe sepsis in the United States: analysis of incidence, outcome, and associated costs of care. Crit Care Med. 2001;29(7):1303-1310. https://doi.org/10.1097/00003246-200107000-00002.
4. Mayr FB, Yende S, Angus DC. Epidemiology of severe sepsis. Virulence. 2014;5(1):4-11. https://doi.org/10.4161/viru.27372.
5. Dellinger RP, Levy MM, Rhodes A, et al. Surviving Sepsis Campaign: international guidelines for management of severe sepsis and septic shock: 2012. Crit Care Med. 2013;41(2):580-637. https://doi.org/10.1097/CCM.0b013e31827e83af.
6. Levy MM, Rhodes A, Phillips GS, et al. Surviving Sepsis Campaign: association between performance metrics and outcomes in a 7.5-year study. Crit Care Med. 2015;43(1):3-12. https://doi.org/10.1097/CCM.0000000000000723.
7. Damiani E, Donati A, Serafini G, et al. Effect of performance improvement programs on compliance with sepsis bundles and mortality: a systematic review and meta-analysis of observational studies. PLOS ONE. 2015;10(5):e0125827. https://doi.org/10.1371/journal.pone.0125827.
8. Paoli CJ, Reynolds MA, Sinha M, Gitlin M, Crouser E. Epidemiology and costs of sepsis in the United States-an analysis based on timing of diagnosis and severity level. Crit Care Med. 2018;46(12):1889-1897. https://doi.org/10.1097/CCM.0000000000003342.
9. Barnato AE, Alexander SL, Linde-Zwirble WT, Angus DC. Racial variation in the incidence, care, and outcomes of severe sepsis: analysis of population, patient, and hospital characteristics. Am J Respir Crit Care Med [patient]. 2008;177(3):279-284. https://doi.org/10.1164/rccm.200703-480OC.
10. Mayr FB, Yende S, Linde-Zwirble WT, et al. Infection rate and acute organ dysfunction risk as explanations for racial differences in severe sepsis. JAMA. 2010;303(24):2495-2503. https://doi.org/10.1001/jama.2010.851.
11. Dombrovskiy VY, Martin AA, Sunderram J, Paz HL. Occurrence and outcomes of sepsis: influence of race. Crit Care Med. 2007;35(3):763-768. https://doi.org/10.1097/01.CCM.0000256726.80998.BF.
12. Yamane D, Huancahuari N, Hou P, Schuur J. Disparities in acute sepsis care: a systematic review. Crit Care. 2015;19(Suppl 1):22. https://doi.org/10.1186/cc14102.
13. Martin GS, Mannino DM, Eaton S, Moss M. The epidemiology of sepsis in the United States from 1979 through 2000. N Engl J Med. 2003;348(16):1546-1554. https://doi.org/10.1056/NEJMoa022139.
14. Melamed A, Sorvillo FJ. The burden of sepsis-associated mortality in the United States from 1999 to 2005: an analysis of multiple-cause-of-death data. Crit Care. 2009;13(1):R28. https://doi.org/10.1186/cc7733.
15. Jones JM, Fingar KR, Miller MA, et al. Racial disparities in sepsis-related in-hospital mortality: using a broad case capture method and multivariate controls for clinical and hospital variables, 2004-2013. Crit Care Med. 2017;45(12):e1209-e1217. https://doi.org/10.1097/CCM.0000000000002699.
16. Bakullari A, Metersky ML, Wang Y, et al. Racial and ethnic disparities in healthcare-associated infections in the United States, 2009–2011. Infect Control Hosp Epidemiol. 2014;35(S3):S10-S16. https://doi.org/10.1086/677827.
17. Institute of Medicine. Unequal Treatment: What Healthcare Providers Need to Know about Racial and Ethnic Disparities in Healthcare. Washington, DC: National Academy Press; 2002.
18. Vogel TR. Update and review of racial disparities in sepsis. Surg Infect. 2012;13(4):203-208. https://doi.org/10.1089/sur.2012.124.
19. Esper AM, Moss M, Lewis CA, et al. The role of infection and comorbidity: factors that influence disparities in sepsis. Crit Care Med. 2006;34(10):2576-2582. https://doi.org/10.1097/01.CCM.0000239114.50519.0E.
20. Soto GJ, Martin GS, Gong MN. Healthcare disparities in critical illness. Crit Care Med. 2013;41(12):2784-2793. https://doi.org/10.1097/CCM.0b013e3182a84a43.
21. Taylor SP, Karvetski CH, Templin MA, Taylor BT. Hospital differences drive antibiotic delays for black patients compared with white patients with suspected septic shock. Crit Care Med. 2018;46(2):e126-e131. https://doi.org/10.1097/CCM.0000000000002829.
22. Divi C, Koss RG, Schmaltz SP, Loeb JM. Language proficiency and adverse events in US hospitals: a pilot study. Int J Qual Health Care. 2007;19(2):60-67. https://doi.org/10.1093/intqhc/mzl069.
23. John-Baptiste A, Naglie G, Tomlinson G, et al. The effect of English language proficiency on length of stay and in-hospital mortality. J Gen Intern Med. 2004;19(3):221-228. https://doi.org/10.1111/j.1525-1497.2004.21205.x.
24. Karliner LS, Kim SE, Meltzer DO, Auerbach AD. Influence of language barriers on outcomes of hospital care for general medicine inpatients. J Hosp Med. 2010;5(5):276-282. https://doi.org/10.1002/jhm.658.
25. Hacker K, Anies M, Folb BL, Zallman L. Barriers to health care for undocumented immigrants: a literature review. Risk Manag Healthc Policy. 2015;8:175-183. https://doi.org/10.2147/RMHP.S70173.
26. QuickFacts: San Francisco County, California. U.S. Census Bureau (2016). https://www.census.gov/quickfacts/fact/table/sanfranciscocountycalifornia/RHI425216. Accessed May 15, 2018.
27. Moore BJ, White S, Washington R, Coenen N, Elixhauser A. Identifying increased risk of readmission and in-hospital mortality using hospital administrative data: The AHRQ Elixhauser comorbidity index. Med Care. 2017;55(7):698-705. https://doi.org/10.1097/MLR.0000000000000735.
28. Rhee C, Dantes R, Epstein L, et al. Incidence and trends of sepsis in us hospitals using clinical vs claims data, 2009-2014. JAMA. 2017;318(13):1241-1249. https://doi.org/10.1001/jama.2017.13836.
29. Howell J, Emerson MO, So M. What “should” we use? Evaluating the impact of five racial measures on markers of social inequality. Sociol Race Ethn. 2017;3(1):14-30. https://doi.org/10.1177/2332649216648465.
30. Reeves T, Claudett B. United States Census Bureau. Asian Pac Islander Popul. March 2002;2003.
31. van Walraven C, Austin PC, Jennings A, Quan H, Forster AJ. A modification of the Elixhauser comorbidity measures into a point system for hospital death using administrative data. Med Care. 2009;47(6):626-633. https://doi.org/10.1097/MLR.0b013e31819432e5.
32. Baron RM, Kenny DA. The moderator-mediator variable distinction in social psychological research: conceptual, strategic, and statistical considerations. J Pers Soc Psychol. 1986;51(6):1173-1182. https://doi.org/10.1037//0022-3514.51.6.1173.33. VanderWeele TJ, Ding P. Sensitivity analysis in observational research: introducing the E-value. Ann Intern Med. 2017;167(4):268-274. https://doi.org/10.7326/M16-2607.
34. Mathur MB, Ding P, Riddell CA, VanderWeele TJ. Website and R package for computing E-values. Epidemiology. 2018;29(5):e45-e47. https://doi.org/10.1097/EDE.0000000000000864.
35. Sentell T, Braun KL. Low Health Literacy, Limited English proficiency, and health status in Asians, Latinos, and other racial/ethnic groups in California. J Health Commun. 2012;17 Supplement 3:82-99. https://doi.org/10.1080/10810730.2012.712621.
36. FitzGerald C, Hurst S. Implicit bias in healthcare professionals: a systematic review. BMC Med Eth. 2017;18(1):19. https://doi.org/10.1186/s12910-017-0179-8.
37. Flores G. The impact of medical interpreter services on the quality of health care: A systematic review. Med Care Res Rev. 2005;62(3):255-299. https://doi.org/10.1177/1077558705275416.
38. Karliner LS, Jacobs EA, Chen AH, Mutha S. Do professional interpreters improve clinical care for patients with limited English proficiency? A systematic review of the literature. Health Serv Res. 2007;42(2):727-754. https://doi.org/10.1111/j.1475-6773.2006.00629.x.
39. Diamond LC, Schenker Y, Curry L, Bradley EH, Fernandez A. Getting by: underuse of interpreters by resident physicians. J Gen Intern Med. 2009;24(2):256-262. https://doi.org/10.1007/s11606-008-0875-7.
40. López L, Rodriguez F, Huerta D, Soukup J, Hicks L. Use of interpreters by physicians for hospitalized limited English proficient patients and its impact on patient outcomes. J Gen Intern Med. 2015;30(6):783-789. https://doi.org/10.1007/s11606-015-3213-x.
© 2019 Society of Hospital Medicine
Reducing Unnecessary Treatment of Asymptomatic Elevated Blood Pressure with Intravenous Medications on the General Internal Medicine Wards: A Quality Improvement Initiative
Elevated blood pressure (BP) is common among hospitalized adults, with prevalence estimates between 50% and 70%.1 Many factors can cause or exacerbate BP elevations in the setting of acute illness, such as pain, anxiety, medication withdrawal, and volume status, among others.2 While there are clear evidence-based recommendations for treating hypertension (HTN) in the ambulatory setting,3 guidelines for the management of elevated BP in the hospital are lacking.4,5
Hypertensive crises are generally recognized as warranting rapid reduction in BP;6-8 however, these represent the minority of cases.9,10 Far more common in the hospital are patients with asymptomatic elevated BP, a population for which there is no high-quality evidence and no guidelines supporting the use of intravenous (IV) antihypertensives.11,12 Treatment with such medications has been associated with highly variable clinical responses13-15 and may result in adverse events, such as hypotension.10
To date, only a small number of studies have investigated the treatment of asymptomatic elevated BP among hospitalized adults.10,13-15 These have suggested that IV antihypertensives are utilized frequently in this setting, often for only modestly elevated BPs; however, the studies have tended to be small, not racially diverse, and limited to noncritically ill patients. Furthermore, while it is generally accepted that reducing the use of IV antihypertensives among asymptomatic patients would have no adverse impact, to our knowledge there have been no published studies which have instituted such an initiative while measuring balancing outcomes.
The purpose of this study was to further the existing literature by defining the prevalence and effects of IV antihypertensive medication utilization among a medically complex, multiracial population of asymptomatic medical inpatients using a large electronic dataset and to evaluate the impact of a division-wide, two-tiered quality improvement (QI) initiative on the rates of IV antihypertensive utilization and patient outcomes.
METHODS
Setting
The study was conducted at the University of California, San Francisco (UCSF), an 800-bed tertiary care, academic medical center. It was approved by the UCSF Institutional Review Board. General medicine patients at UCSF are distributed between teaching and direct-care (hospitalist) services. The intensive care unit (ICU) is “open,” meaning the medicine service acts as the primary team for all nonsurgical ICU patients. This study included all adult general medicine patients admitted to UCSF Medical Center between January 1, 2017 and March 1, 2018, including those in the ICU.
Study Population and Data Collection
The UCSF Medical Center uses the electronic health record (EHR) Epic (Epic 2017, Epic Systems Corporation, Verona, Wisconsin) for all clinical care. We obtained computerized EHR data from Clarity, the relational database that stores Epic’s inpatient data in thousands of tables, including orders, medications, laboratory and radiology results, vital signs, patient demographics, and notes. We identified all adult patients hospitalized on the general medicine service with ≥1 episode of elevated BP (>160/90 mm Hg) at any point during their hospitalization who were not on a vasopressor medication at the time of the vital sign recording.
We further identified all instances in which either IV labetalol or hydralazine were administered to these patients. These two agents were chosen because they are the only IV antihypertensives used commonly at our institution for the treatment of asymptomatic elevated BP among internal medicine patients. Only those orders placed by a general medicine provider or reconciled by a general medicine provider upon transfer from another service were included. For each medication administration timestamp, we collected vital signs before and after the administration, along with the ordering provider and the clinical indication that was documented in the electronic order. To determine if a medication was administered with concern for end-organ injury, we also extracted orders that could serve as a proxy for the provider’s clinical assessment—namely electrocardiograms, serum troponins, chest x-rays, and computerized tomography scans of the head—which were placed in the one hour preceding or 15 minutes following administration of an IV antihypertensive medication.
To assess for comorbid conditions, including a preexisting diagnosis of HTN, we collected International Classification of Diseases (ICD)-9/10 diagnosis codes. Further, we also extracted All Patient Refined Diagnosis-Related Group (APR-DRG) weights, which are a standardized measure of illness severity based on relative resource consumption during hospitalization.16,17
Patients were categorized as having either “symptomatic” or “asymptomatic” elevated BP. We defined symptomatic elevated BP as having received treatment with an IV medication with provider concern for end-organ injury, as defined above. We further identified all patients in which tight BP control may be clinically indicated on the basis of the presence of any of the following ICD-9/10 diagnosis codes at the time of hospital discharge: myocardial infarction, ischemic stroke, intracranial hemorrhage, subarachnoid hemorrhage, subdural hematoma, aortic dissection, hypertensive emergency, or hypertensive encephalopathy. All patients with symptomatic elevated BP or any of the above ICD-9/10 diagnoses were excluded from the analysis, since administration of IV antihypertensive medications would plausibly be warranted in these clinical scenarios.
The encounter numbers from the dataset were used to link to patient demographic data, which included age, sex, race, ethnicity, primary language, and insurance status. Finally, we identified all instances of rapid response calls, ICU transfers, and code blues (cardiopulmonary arrests) for each patient in the dataset.
Blood Pressure Measurements
BP data were collected from invasive BP (IBP) monitoring devices and noninvasive BP cuffs. For patients with BP measurements recorded concomitantly from both IBP (ie, arterial lines) in addition to noninvasive BP cuffs, the arterial line reading was favored. All systolic BP (SBP) readings >240 mm Hg from arterial lines were excluded, as this has previously been described as the upper physiologic limit for IBP readings.18
Primary Outcome
The primary outcome for the study was the proportion of patients treated with IV antihypertensive medications (labetalol or hydralazine). Using aggregate data, we calculated the number of patients who were treated at least once with an IV antihypertensive in a given month (numerator), divided by the number of patients with ≥1 episode of asymptomatic elevated BP that month (denominator). The denominator was considered to be the population of patients “at risk” of being treated with IV antihypertensive medications. For patients with multiple admissions during the study period, each admission was considered separately. These results are displayed in the upper portion of the run chart (Figure).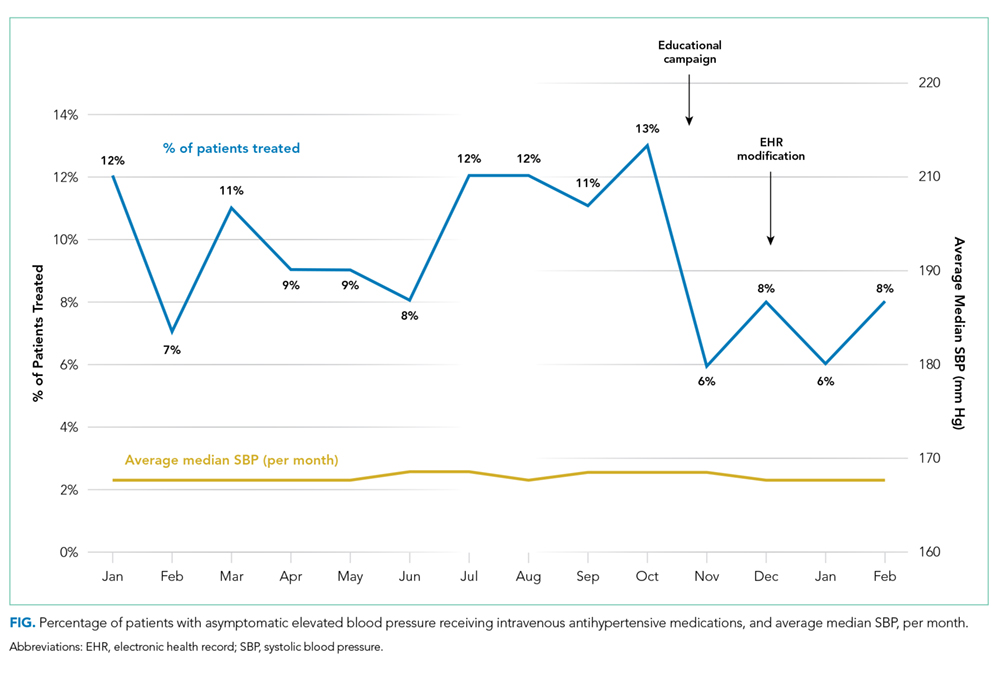
Secondary Outcomes
To investigate blood pressure trends over time, we analyzed BP in three ways. First, we analyzed the median SBP for the entire population. Second, to determine clinical responses to IV antihypertensive medications among patients receiving treatment, we calculated the population medians for the pretreatment SBP, the change in SBP from pretreatment baseline, and the posttreatment SBP. Third, we calculated the average median SBP on a monthly basis for the duration of the study. This was achieved by calculating the median value of all SBPs for an individual patient, then averaging across all patients in a given month. The average monthly median SBPs are displayed in the lower portion of the Figure.
To investigate whether the intervention was associated with negative patient outcomes, the proportions of several balancing outcomes were compared between pre- and postintervention periods, including ICU transfers, rapid response calls, and code blues (cardiopulmonary arrests).
Development and Implementation of an Intervention to Reduce Excessive IV Antihypertensive Use
After establishing the baseline prevalence of IV antihypertensive medication use at our institution, we developed a QI initiative with the goal of reducing IV antihypertensive medication utilization by the general medicine service for the treatment of asymptomatic patients. We hypothesized that potential contributors to overutilization might include lack of education, provider/nursing discomfort, and a system designed to mandate provider notification for even modestly elevated BPs. The QI initiative, which took place between October 2017 and December 2017, was designed to address these potential contributors and was comprised of a division-wide, two-tiered, bundled intervention. Our choice of a two-tiered approach was based on the fact that successful culture change is challenging, along with the existing evidence that multifaceted QI interventions are more often successful than single-tiered approaches.19
The first tier of the initiative included an educational campaign referred to colloquially as “NoIVForHighBP,” which targeted residents, hospitalists, and nursing staff. The campaign consisted of a series of presentations, best practice updates, handouts, and posters displayed prominently in shared workspaces. The educational content focused on alternative approaches to the management of asymptomatic elevated BP in the hospital, such as identification and treatment of pain, anxiety, volume overload, or other contributing factors (see supplemental materials). These educational outreaches occurred periodically between October 4, 2017 and November 20, 2017, with the bulk of the educational efforts taking place during November. Therefore, November 1, 2017 was designated the start date for the intervention period.
The second tier of the intervention included the liberalization of the EHR BP notification parameters on the standard inpatient admission order set from >160/90 mm Hg to >180/90 mm Hg. This change took effect on 12/6/2017. The decision to modify the BP notification parameters was based on the hypothesis that mandatory notifications for modestly elevated BPs may prompt providers to reflexively order IV antihypertensive medications, especially during times of cross-coverage or high clinical workload.
Statistical Analysis
All statistical analyses were performed using Stata software version 15 (StataCorp. 2017. Stata Statistical Software: Release 15. College Station, Texas: StataCorp LLC). Baseline patient characteristics were compared using nonparametric tests of significance. Population median SBPs were compared between pre- and postintervention periods using Mood’s Median Test, which was selected because the data were distributed nonnormally, and variances between samples were unequal.
Among patients treated with IV antihypertensive medications, we compared the proportion of pretreatment SBPs falling into each of three specified ranges (SBP <180 mm Hg, SBP 180-199 mm Hg, and SBP >200 mm Hg) between baseline and intervention periods using chi-squared tests.
Using aggregate data, we compared the unadjusted proportion of patients treated with IV antihypertensive medications between pre- and postintervention periods using a chi-squared test. Next, using patient-level data, a logistic regression analysis was performed to examine the association between receipt of IV antihypertensive medications and time (dichotomized between pre- and postintervention periods) while adjusting for age, sex, race, ethnicity, primary language, insurance status, preexisting HTN, length of stay, and APR-DRG weight.
Rates of balancing outcomes were compared using chi-squared tests. A logistic regression analysis using patient-level data was also performed to investigate the association between each of these outcomes and the intervention period (pre vs post) while adjusting for age, sex, race, ethnicity, primary language, insurance status, preexisting HTN, length of stay, and APR-DRG weight.
RESULTS
Baseline Period
We identified 2,306 patients with ≥1 episode of asymptomatic elevated BP during the 10-month preintervention period. Patients on average experienced 9 episodes of elevated BP per hospitalization, representing 21,207 potential opportunities for treatment. Baseline characteristics are summarized in Table 1. In general, this represents an older population that was medically complex and multiracial.
Of these patients, 251 (11%) received IV hydralazine and/or labetalol at least once during their hospitalization, with a total of 597 doses administered. Among those treated, a median of 2 doses were given per patient (IQR: 1-4), 64% of which were hydralazine. The majority (380 [64%]) were ordered on an “as needed” basis, while 217 (36%) were administered as a one-time dose. Three-quarters of all doses were ordered by the teaching service (456 [76%]), with the remaining 24% ordered by the direct-care (hospitalist) service.
During the baseline period among patients receiving IV antihypertensive medications, the median SBP of the population prior to treatment was 187 mm Hg (IQR 177-199; Table 2). Treatment was initiated in 30% of patients for an SBP <180 mm Hg and in 75% for an SBP <200 mm Hg. The median time to follow-up BP check was 34 minutes (IQR 15-58). The median decrement in SBP was 20 mm Hg (IQR 5-37); however, the response to treatment was highly variable, with 2% of patients experiencing no change and 14% experiencing an increase in SBP. Seventy-nine patients (14%) had a decrement in SBP >25% following treatment.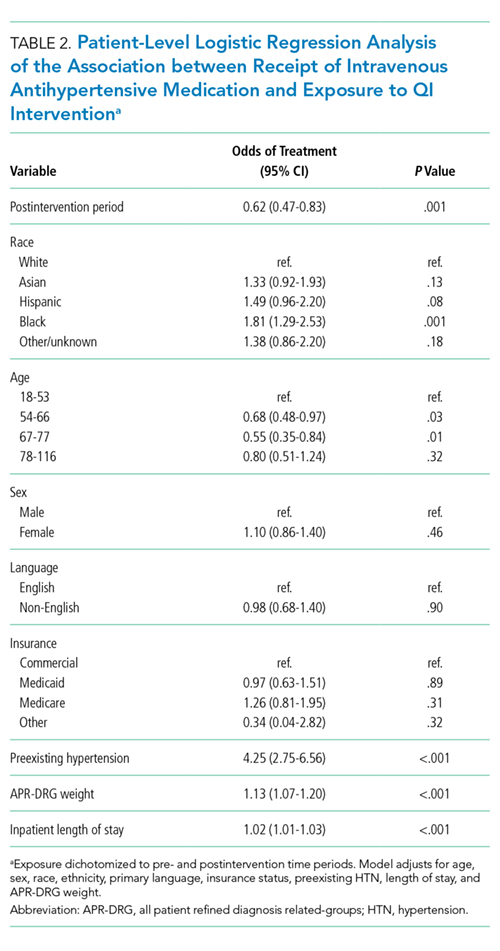
Description of Quality Improvement Results
Following the QI initiative, a total of 934 patients experienced 9,743 episodes of asymptomatic elevated blood pressure over a 4-month period (November 1, 2017 to February 28, 2018). As shown in Table 1, patients in the postintervention period had a slightly higher median age (67 [IQR 55-80] vs 69 [IQR 57-83]; P = .01), a higher median APR-DRG weight (1.34 [IQR 0.99-1.77] vs 1.48 [1.00-1.82]; P < .001), and a longer median length of stay (4.6 [2.8-8.0] days vs 5.1 [2.9-9.2] days; P = .004). There was also a higher proportion of nonEnglish speakers, fewer Black patients, and a lower proportion of preexisting HTN, in the postintervention period.
Of the 934 patients with ≥1 episode of asymptomatic elevated BP, 70 (7%) were treated with IV antihypertensive medications, with a total of 196 doses administered. The proportion of patients treated per month during the postintervention period ranged from 6% to 8%, which was the lowest of the entire study period and below the baseline average of 10% (Figure).
In a patient-level logistic regression pre-post analysis adjusting for age, sex, race, ethnicity, primary language, insurance status, preexisting HTN, length of stay, and APR-DRG weight, patients admitted to the general medicine service during the postintervention period had 38% lower odds of receiving IV antihypertensive medications than those admitted during the baseline period (OR = 0.62; 95% CI 0.47-0.83; P = .001). In this adjusted model, the following factors were independently associated with increased odds of receiving treatment: APR-DRG weight (OR 1.13; 95% CI 1.07-1.20; P < .001), Black race (OR 1.81; 95% CI 1.29-2.53; P = .001), length of stay (OR 1.02; 95% CI 1.01-1.03; P < .001), and preexisting HTN (OR 4.25; 95% CI 2.75-6.56; P < .001). Older age was associated with lower odds of treatment (Table 2).
Among patients who received treatment, there were no differences between pre- and postintervention periods in the proportion of pretreatment SBP <180 mm Hg (29% vs 32%; P = .40), 180-199 mm Hg (47% vs 40%; P = .10), or >200 mm Hg (25% vs 28%; P = .31; Table 3).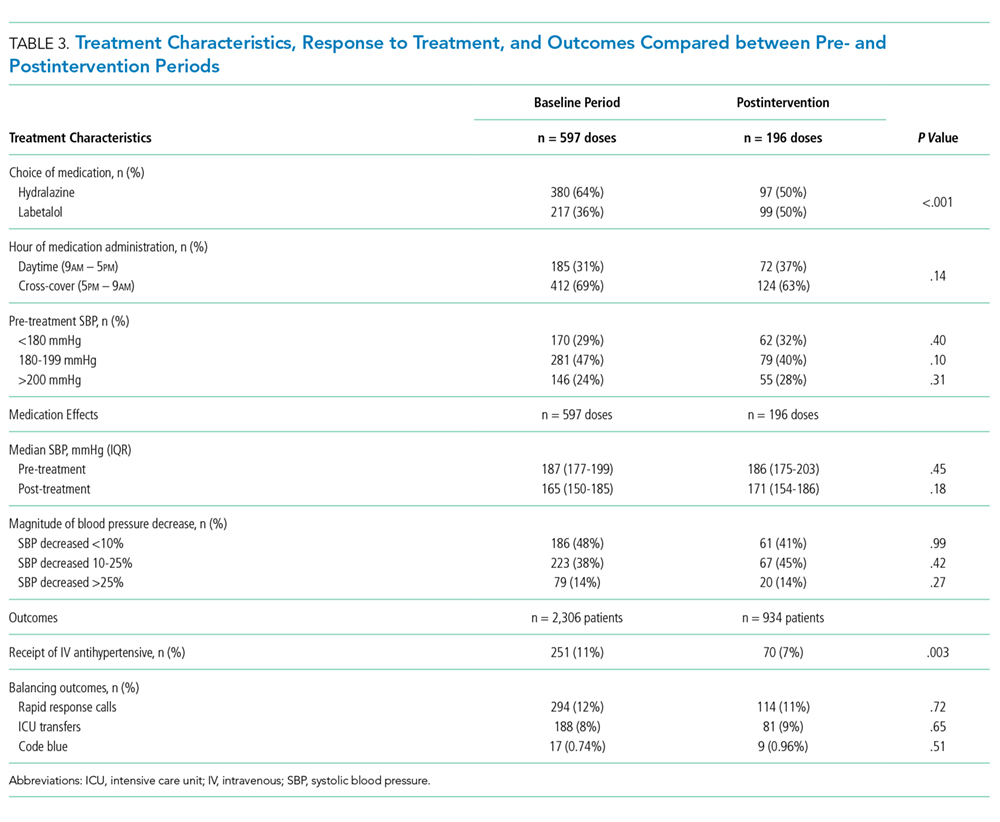
Population-level median SBP was similar between pre- and postintervention periods (167 mm Hg vs 168 mm Hg, P = .78), as were unadjusted rates of rapid response calls, ICU transfers, and code blues (Table 3). After adjustment for baseline characteristics and illness severity at the patient level, the odds of rapid response calls (OR 0.84; 95% CI 0.65-1.10; P = .21) and ICU transfers (OR 1.01; 95% CI 0.75-1.38; P = .93) did not differ between pre- and postintervention periods. A regression model was not fit for cardiopulmonary arrests due to the low absolute number of events.
CONCLUSIONS
Our results suggest that treatment of asymptomatic elevated BP using IV antihypertensive medications is common practice at our institution. We found that treatment is often initiated for only modestly elevated BPs and that the clinical response to these medications is highly variable. In the baseline period, one in seven patients experienced a decrement in BP >25% following treatment, which could potentially cause harm.11 There is no evidence, neither are there any consensus guidelines, to support the rapid reduction of BP among asymptomatic patients, making this a potential valuable opportunity for reducing unnecessary treatment, minimizing waste, and avoiding harm.
While there are a few previously published studies with similar results, we add to the existing literature by studying a larger population of more than 3,000 total patients, which was uniquely multiracial, including a high proportion of non-English speakers. Furthermore, our cohort included patients in the ICU, which is reflected in the higher-than-average APR-DRG weights. Despite being critically ill, these patients arguably still do not warrant aggressive treatment of elevated BP when asymptomatic. By excluding symptomatic BP elevations using surrogate markers for end-organ damage in addition to discharge diagnosis codes indicative of conditions in which tight BP control may be warranted, we were able to study a more critically ill patient population. We were also able to describe which baseline patient characteristics convey higher adjusted odds of receiving treatment, such as preexisting HTN, younger age, illness severity, and black race.
Perhaps most significantly, our study is the first to demonstrate an effective QI intervention aimed at reducing unnecessary utilization of IV antihypertensives. We found that this can feasibly be accomplished through a combination of educational efforts and systems changes, which could easily be replicated at other institutions. While the absolute reduction in the number of patients receiving treatment was modest, if these findings were to be widely accepted and resulted in a wide-spread change in culture, there would be a potential for greater impact.
Despite the reduction in the proportion of patients receiving IV antihypertensive medications, we found no change in the median SBP compared with the baseline period, which seems to support that the intervention was well tolerated. We also found no difference in the number of ICU transfers, rapid response calls, and cardiopulmonary arrests between groups. While these findings are both reassuring, it is impossible to draw definitive conclusions about safety given the small absolute number of patients having received treatment in each group. Fortunately, current guidelines and literature support the safety of such an intervention, as there is no existing evidence to suggest that failing to rapidly lower BP among asymptomatic patients is potentially harmful.11
There are several limitations to our study. First, by utilizing a large electronic dataset, the quality of our analyses was reliant on the accuracy of the recorded EHR data. Second, in the absence of a controlled trial or control group, we cannot say definitively that our QI initiative was the direct cause of the improved rates of IV antihypertensive utilization, though the effect did persist after adjusting for baseline characteristics in patient-level models. Third, our follow-up period was relatively short, with fewer than half as many patients as in the preintervention period. This is an important limitation, since the impact of QI interventions often diminishes over time. We plan to continually monitor IV antihypertensive use, feed those data back to our group, and revitalize educational efforts should rates begin to rise. Fourth, we were unable to directly measure which patients had true end-organ injury and instead used orders placed around the time of medication administration as a surrogate marker. While this is an imperfect measure, we feel that in cases where a provider was concerned enough to even test for end-organ injury, the use of IV antihypertensives was likely justified and was therefore appropriately excluded from the analysis. Lastly, we were limited in our ability to describe associations with true clinical outcomes, such as stroke or myocardial infarction, which could theoretically be propagated by either the use or the avoidance of IV antihypertensive medications. Fortunately, based on clinical guidelines and existing evidence, there is no reason to believe that reducing IV antihypertensive use would result in increased rates of these outcomes.
Our study reaffirms the fact that overutilization of IV antihypertensive medications among asymptomatic hospitalized patients is pervasive across hospital systems. This represents a potential target for a concerted change in culture, which we have demonstrated can be feasibly accomplished through education and systems changes.
Disclosures
Dr. Auerbach has current or pending grants from the CDC, PCORI, and FDA that are unrelated to this research manuscript. He also receives royalties from UpToDate, and received an honorarium for being editor of JHM. Dr. Jacobs received a $1,000 Resident/Fellow Travel Grant from the Society of Hospital Medicine to support the cost of travel to SHM, where he presented this research as a poster in 2018. Dr. Prasad receives money from EpiExcellence, LLC for consultation, which is unrelated to this research manuscript. All other authors have nothing to disclose.
1. Axon RN, Cousineau L, Egan BM. Prevalence and management of hypertension in the inpatient setting: A systematic review. J Hosp Med. 2011;6(7):417-422. doi: 10.1002/jhm.804. PubMed
2. Herzog E, Frankenberger O, Aziz E, et al. A novel pathway for the management of ypertension for hospitalized patients. Crit Pathw Cardiol. 2007;6(4):150-160. doi: 10.1097/HPC.0b013e318160c3a7. PubMed
3. James PA, Oparil S, Carter BL, et al. 2014 evidence-based guideline for the management of high blood pressure in adults: report from the panel members appointed to the eighth Joint National Committee (JNC 8). JAMA. 2014;311(5):507-520. doi: 10.1001/jama.2013.284427. PubMed
4. Weder AB. Treating acute hypertension in the hospital: A lacuna in the guidelines [editorial]. Hypertension. 2011;57(1):18-20. PubMed
5. Axon RN, Turner M, Buckley R. An update on inpatient hypertension management. Curr Cardiol Rep. 2015;17(11):94. doi: 10.1007/s11886-015-0648-y. PubMed
6. Marik PE, Rivera R. Hypertensive emergencies: an update. Curr Opin Crit Care. 2011;17(6):569-580. doi:10.1097/MCC.0b013e32834cd31d. PubMed
7. Cherney D, Straus S. Management of patients with hypertensive urgencies and emergencies: a systematic review of the literature. J Gen Intern Med. 2002;17(12):937-945. doi: 10.1046/j.1525-1497.2002.20389.x. PubMed
8. Padilla Ramos A, Varon J. Current and newer agents for hypertensive emergencies. Curr Hypertens Rep. 2014;16(7):450. doi: 10.1007/s11906-014-0450-z. PubMed
9. Whitworth JA, World Health Organization, International Society of Hypertension Writing Group. 2003 World Health Organization (WHO)/International Society of Hypertension (ISH) statement on management of hypertension. J Hypertens. 2003;21(11):1983-1992. doi: 10.1097/01.hjh.0000084751.37215.d2. PubMed
10. Campbell P, Baker WL, Bendel SD, White WB. Intravenous hydralazine for blood pressure management in the hospitalized patient: its use is often unjustified. J Am Soc Hypertens. 2011;5(6):473-477. doi: 10.1016/j.jash.2011.07.002. PubMed
11. Chobanian AV, Bakris GL, Black HR, et al. The Seventh Report of the Joint National Committee on Prevention, Detection, Evaluation, and Treatment of High Blood Pressure: the JNC 7 report. JAMA. 2003;289(19):2560-2572. doi: 10.1001/jama.289.19.2560. PubMed
12. Gauer R. Severe asymptomatic hypertension: Evaluation and treatment. Am Fam Physician. 2017;95(8):492-500. PubMed
13. Lipari M, Moser LR, Petrovitch EA, Farber M, Flack JM. As-needed intravenous antihypertensive therapy and blood pressure control: Antihypertensive Therapy and BP Control. J Hosp Med. 2016;11(3):193-198. doi: 10.1002/jhm.2510. PubMed
14. Gaynor MF, Wright GC, Vondracek S. Retrospective review of the use of as-needed hydralazine and labetalol for the treatment of acute hypertension in hospitalized medicine patients. Ther Adv Cardiovasc Dis. 2017;12(1):7-15. doi: 10.1177/1753944717746613. PubMed
15. Weder AB, Erickson S. Treatment of hypertension in the inpatient setting: Use of intravenous labetalol and hydralazine. J Clin Hypertens. 2010;12(1):29-33. doi: 10.1111/j.1751-7176.2009.00196.x. PubMed
16. Averill RF, Goldfield N, Hughes, JS, et al. All Patient Refined Diagnosis Related Groups (APR-DRGs) Version 20.0: Methodology Overview. Clinical Research and Documentation Departments of 3M Health Information Systems, Wallingford, Connecticut and Murray, Utah, 2003. https://www.hcup-us.ahrq.gov/. Accessed February 19, 2018.
17. Iezzoni LI, Ash AS, Shwartz M, Daley J, Hughes JS, Mackiernan YD. Predicting who dies depends on how severity is measured: Implications for evaluating patient outcomes. Ann Intern Med. 1995;123(10):763-770. PubMed
18. Romagnoli S, Ricci Z, Quattrone D, et al. Accuracy of invasive arterial pressure monitoring in cardiovascular patients: an observational study. Crit Care. 2014;18(6):644. doi: 10.1186/s13054-014-0644-4. PubMed
19. Shojania K, Grimshaw JM. Evidence-based quality improvement: The state of the science. Health Aff (Millwood). 2005;24(1):138-150. doi: 10.1377/hlthaff.24.1.138. PubMed
Elevated blood pressure (BP) is common among hospitalized adults, with prevalence estimates between 50% and 70%.1 Many factors can cause or exacerbate BP elevations in the setting of acute illness, such as pain, anxiety, medication withdrawal, and volume status, among others.2 While there are clear evidence-based recommendations for treating hypertension (HTN) in the ambulatory setting,3 guidelines for the management of elevated BP in the hospital are lacking.4,5
Hypertensive crises are generally recognized as warranting rapid reduction in BP;6-8 however, these represent the minority of cases.9,10 Far more common in the hospital are patients with asymptomatic elevated BP, a population for which there is no high-quality evidence and no guidelines supporting the use of intravenous (IV) antihypertensives.11,12 Treatment with such medications has been associated with highly variable clinical responses13-15 and may result in adverse events, such as hypotension.10
To date, only a small number of studies have investigated the treatment of asymptomatic elevated BP among hospitalized adults.10,13-15 These have suggested that IV antihypertensives are utilized frequently in this setting, often for only modestly elevated BPs; however, the studies have tended to be small, not racially diverse, and limited to noncritically ill patients. Furthermore, while it is generally accepted that reducing the use of IV antihypertensives among asymptomatic patients would have no adverse impact, to our knowledge there have been no published studies which have instituted such an initiative while measuring balancing outcomes.
The purpose of this study was to further the existing literature by defining the prevalence and effects of IV antihypertensive medication utilization among a medically complex, multiracial population of asymptomatic medical inpatients using a large electronic dataset and to evaluate the impact of a division-wide, two-tiered quality improvement (QI) initiative on the rates of IV antihypertensive utilization and patient outcomes.
METHODS
Setting
The study was conducted at the University of California, San Francisco (UCSF), an 800-bed tertiary care, academic medical center. It was approved by the UCSF Institutional Review Board. General medicine patients at UCSF are distributed between teaching and direct-care (hospitalist) services. The intensive care unit (ICU) is “open,” meaning the medicine service acts as the primary team for all nonsurgical ICU patients. This study included all adult general medicine patients admitted to UCSF Medical Center between January 1, 2017 and March 1, 2018, including those in the ICU.
Study Population and Data Collection
The UCSF Medical Center uses the electronic health record (EHR) Epic (Epic 2017, Epic Systems Corporation, Verona, Wisconsin) for all clinical care. We obtained computerized EHR data from Clarity, the relational database that stores Epic’s inpatient data in thousands of tables, including orders, medications, laboratory and radiology results, vital signs, patient demographics, and notes. We identified all adult patients hospitalized on the general medicine service with ≥1 episode of elevated BP (>160/90 mm Hg) at any point during their hospitalization who were not on a vasopressor medication at the time of the vital sign recording.
We further identified all instances in which either IV labetalol or hydralazine were administered to these patients. These two agents were chosen because they are the only IV antihypertensives used commonly at our institution for the treatment of asymptomatic elevated BP among internal medicine patients. Only those orders placed by a general medicine provider or reconciled by a general medicine provider upon transfer from another service were included. For each medication administration timestamp, we collected vital signs before and after the administration, along with the ordering provider and the clinical indication that was documented in the electronic order. To determine if a medication was administered with concern for end-organ injury, we also extracted orders that could serve as a proxy for the provider’s clinical assessment—namely electrocardiograms, serum troponins, chest x-rays, and computerized tomography scans of the head—which were placed in the one hour preceding or 15 minutes following administration of an IV antihypertensive medication.
To assess for comorbid conditions, including a preexisting diagnosis of HTN, we collected International Classification of Diseases (ICD)-9/10 diagnosis codes. Further, we also extracted All Patient Refined Diagnosis-Related Group (APR-DRG) weights, which are a standardized measure of illness severity based on relative resource consumption during hospitalization.16,17
Patients were categorized as having either “symptomatic” or “asymptomatic” elevated BP. We defined symptomatic elevated BP as having received treatment with an IV medication with provider concern for end-organ injury, as defined above. We further identified all patients in which tight BP control may be clinically indicated on the basis of the presence of any of the following ICD-9/10 diagnosis codes at the time of hospital discharge: myocardial infarction, ischemic stroke, intracranial hemorrhage, subarachnoid hemorrhage, subdural hematoma, aortic dissection, hypertensive emergency, or hypertensive encephalopathy. All patients with symptomatic elevated BP or any of the above ICD-9/10 diagnoses were excluded from the analysis, since administration of IV antihypertensive medications would plausibly be warranted in these clinical scenarios.
The encounter numbers from the dataset were used to link to patient demographic data, which included age, sex, race, ethnicity, primary language, and insurance status. Finally, we identified all instances of rapid response calls, ICU transfers, and code blues (cardiopulmonary arrests) for each patient in the dataset.
Blood Pressure Measurements
BP data were collected from invasive BP (IBP) monitoring devices and noninvasive BP cuffs. For patients with BP measurements recorded concomitantly from both IBP (ie, arterial lines) in addition to noninvasive BP cuffs, the arterial line reading was favored. All systolic BP (SBP) readings >240 mm Hg from arterial lines were excluded, as this has previously been described as the upper physiologic limit for IBP readings.18
Primary Outcome
The primary outcome for the study was the proportion of patients treated with IV antihypertensive medications (labetalol or hydralazine). Using aggregate data, we calculated the number of patients who were treated at least once with an IV antihypertensive in a given month (numerator), divided by the number of patients with ≥1 episode of asymptomatic elevated BP that month (denominator). The denominator was considered to be the population of patients “at risk” of being treated with IV antihypertensive medications. For patients with multiple admissions during the study period, each admission was considered separately. These results are displayed in the upper portion of the run chart (Figure).
Secondary Outcomes
To investigate blood pressure trends over time, we analyzed BP in three ways. First, we analyzed the median SBP for the entire population. Second, to determine clinical responses to IV antihypertensive medications among patients receiving treatment, we calculated the population medians for the pretreatment SBP, the change in SBP from pretreatment baseline, and the posttreatment SBP. Third, we calculated the average median SBP on a monthly basis for the duration of the study. This was achieved by calculating the median value of all SBPs for an individual patient, then averaging across all patients in a given month. The average monthly median SBPs are displayed in the lower portion of the Figure.
To investigate whether the intervention was associated with negative patient outcomes, the proportions of several balancing outcomes were compared between pre- and postintervention periods, including ICU transfers, rapid response calls, and code blues (cardiopulmonary arrests).
Development and Implementation of an Intervention to Reduce Excessive IV Antihypertensive Use
After establishing the baseline prevalence of IV antihypertensive medication use at our institution, we developed a QI initiative with the goal of reducing IV antihypertensive medication utilization by the general medicine service for the treatment of asymptomatic patients. We hypothesized that potential contributors to overutilization might include lack of education, provider/nursing discomfort, and a system designed to mandate provider notification for even modestly elevated BPs. The QI initiative, which took place between October 2017 and December 2017, was designed to address these potential contributors and was comprised of a division-wide, two-tiered, bundled intervention. Our choice of a two-tiered approach was based on the fact that successful culture change is challenging, along with the existing evidence that multifaceted QI interventions are more often successful than single-tiered approaches.19
The first tier of the initiative included an educational campaign referred to colloquially as “NoIVForHighBP,” which targeted residents, hospitalists, and nursing staff. The campaign consisted of a series of presentations, best practice updates, handouts, and posters displayed prominently in shared workspaces. The educational content focused on alternative approaches to the management of asymptomatic elevated BP in the hospital, such as identification and treatment of pain, anxiety, volume overload, or other contributing factors (see supplemental materials). These educational outreaches occurred periodically between October 4, 2017 and November 20, 2017, with the bulk of the educational efforts taking place during November. Therefore, November 1, 2017 was designated the start date for the intervention period.
The second tier of the intervention included the liberalization of the EHR BP notification parameters on the standard inpatient admission order set from >160/90 mm Hg to >180/90 mm Hg. This change took effect on 12/6/2017. The decision to modify the BP notification parameters was based on the hypothesis that mandatory notifications for modestly elevated BPs may prompt providers to reflexively order IV antihypertensive medications, especially during times of cross-coverage or high clinical workload.
Statistical Analysis
All statistical analyses were performed using Stata software version 15 (StataCorp. 2017. Stata Statistical Software: Release 15. College Station, Texas: StataCorp LLC). Baseline patient characteristics were compared using nonparametric tests of significance. Population median SBPs were compared between pre- and postintervention periods using Mood’s Median Test, which was selected because the data were distributed nonnormally, and variances between samples were unequal.
Among patients treated with IV antihypertensive medications, we compared the proportion of pretreatment SBPs falling into each of three specified ranges (SBP <180 mm Hg, SBP 180-199 mm Hg, and SBP >200 mm Hg) between baseline and intervention periods using chi-squared tests.
Using aggregate data, we compared the unadjusted proportion of patients treated with IV antihypertensive medications between pre- and postintervention periods using a chi-squared test. Next, using patient-level data, a logistic regression analysis was performed to examine the association between receipt of IV antihypertensive medications and time (dichotomized between pre- and postintervention periods) while adjusting for age, sex, race, ethnicity, primary language, insurance status, preexisting HTN, length of stay, and APR-DRG weight.
Rates of balancing outcomes were compared using chi-squared tests. A logistic regression analysis using patient-level data was also performed to investigate the association between each of these outcomes and the intervention period (pre vs post) while adjusting for age, sex, race, ethnicity, primary language, insurance status, preexisting HTN, length of stay, and APR-DRG weight.
RESULTS
Baseline Period
We identified 2,306 patients with ≥1 episode of asymptomatic elevated BP during the 10-month preintervention period. Patients on average experienced 9 episodes of elevated BP per hospitalization, representing 21,207 potential opportunities for treatment. Baseline characteristics are summarized in Table 1. In general, this represents an older population that was medically complex and multiracial.
Of these patients, 251 (11%) received IV hydralazine and/or labetalol at least once during their hospitalization, with a total of 597 doses administered. Among those treated, a median of 2 doses were given per patient (IQR: 1-4), 64% of which were hydralazine. The majority (380 [64%]) were ordered on an “as needed” basis, while 217 (36%) were administered as a one-time dose. Three-quarters of all doses were ordered by the teaching service (456 [76%]), with the remaining 24% ordered by the direct-care (hospitalist) service.
During the baseline period among patients receiving IV antihypertensive medications, the median SBP of the population prior to treatment was 187 mm Hg (IQR 177-199; Table 2). Treatment was initiated in 30% of patients for an SBP <180 mm Hg and in 75% for an SBP <200 mm Hg. The median time to follow-up BP check was 34 minutes (IQR 15-58). The median decrement in SBP was 20 mm Hg (IQR 5-37); however, the response to treatment was highly variable, with 2% of patients experiencing no change and 14% experiencing an increase in SBP. Seventy-nine patients (14%) had a decrement in SBP >25% following treatment.
Description of Quality Improvement Results
Following the QI initiative, a total of 934 patients experienced 9,743 episodes of asymptomatic elevated blood pressure over a 4-month period (November 1, 2017 to February 28, 2018). As shown in Table 1, patients in the postintervention period had a slightly higher median age (67 [IQR 55-80] vs 69 [IQR 57-83]; P = .01), a higher median APR-DRG weight (1.34 [IQR 0.99-1.77] vs 1.48 [1.00-1.82]; P < .001), and a longer median length of stay (4.6 [2.8-8.0] days vs 5.1 [2.9-9.2] days; P = .004). There was also a higher proportion of nonEnglish speakers, fewer Black patients, and a lower proportion of preexisting HTN, in the postintervention period.
Of the 934 patients with ≥1 episode of asymptomatic elevated BP, 70 (7%) were treated with IV antihypertensive medications, with a total of 196 doses administered. The proportion of patients treated per month during the postintervention period ranged from 6% to 8%, which was the lowest of the entire study period and below the baseline average of 10% (Figure).
In a patient-level logistic regression pre-post analysis adjusting for age, sex, race, ethnicity, primary language, insurance status, preexisting HTN, length of stay, and APR-DRG weight, patients admitted to the general medicine service during the postintervention period had 38% lower odds of receiving IV antihypertensive medications than those admitted during the baseline period (OR = 0.62; 95% CI 0.47-0.83; P = .001). In this adjusted model, the following factors were independently associated with increased odds of receiving treatment: APR-DRG weight (OR 1.13; 95% CI 1.07-1.20; P < .001), Black race (OR 1.81; 95% CI 1.29-2.53; P = .001), length of stay (OR 1.02; 95% CI 1.01-1.03; P < .001), and preexisting HTN (OR 4.25; 95% CI 2.75-6.56; P < .001). Older age was associated with lower odds of treatment (Table 2).
Among patients who received treatment, there were no differences between pre- and postintervention periods in the proportion of pretreatment SBP <180 mm Hg (29% vs 32%; P = .40), 180-199 mm Hg (47% vs 40%; P = .10), or >200 mm Hg (25% vs 28%; P = .31; Table 3).
Population-level median SBP was similar between pre- and postintervention periods (167 mm Hg vs 168 mm Hg, P = .78), as were unadjusted rates of rapid response calls, ICU transfers, and code blues (Table 3). After adjustment for baseline characteristics and illness severity at the patient level, the odds of rapid response calls (OR 0.84; 95% CI 0.65-1.10; P = .21) and ICU transfers (OR 1.01; 95% CI 0.75-1.38; P = .93) did not differ between pre- and postintervention periods. A regression model was not fit for cardiopulmonary arrests due to the low absolute number of events.
CONCLUSIONS
Our results suggest that treatment of asymptomatic elevated BP using IV antihypertensive medications is common practice at our institution. We found that treatment is often initiated for only modestly elevated BPs and that the clinical response to these medications is highly variable. In the baseline period, one in seven patients experienced a decrement in BP >25% following treatment, which could potentially cause harm.11 There is no evidence, neither are there any consensus guidelines, to support the rapid reduction of BP among asymptomatic patients, making this a potential valuable opportunity for reducing unnecessary treatment, minimizing waste, and avoiding harm.
While there are a few previously published studies with similar results, we add to the existing literature by studying a larger population of more than 3,000 total patients, which was uniquely multiracial, including a high proportion of non-English speakers. Furthermore, our cohort included patients in the ICU, which is reflected in the higher-than-average APR-DRG weights. Despite being critically ill, these patients arguably still do not warrant aggressive treatment of elevated BP when asymptomatic. By excluding symptomatic BP elevations using surrogate markers for end-organ damage in addition to discharge diagnosis codes indicative of conditions in which tight BP control may be warranted, we were able to study a more critically ill patient population. We were also able to describe which baseline patient characteristics convey higher adjusted odds of receiving treatment, such as preexisting HTN, younger age, illness severity, and black race.
Perhaps most significantly, our study is the first to demonstrate an effective QI intervention aimed at reducing unnecessary utilization of IV antihypertensives. We found that this can feasibly be accomplished through a combination of educational efforts and systems changes, which could easily be replicated at other institutions. While the absolute reduction in the number of patients receiving treatment was modest, if these findings were to be widely accepted and resulted in a wide-spread change in culture, there would be a potential for greater impact.
Despite the reduction in the proportion of patients receiving IV antihypertensive medications, we found no change in the median SBP compared with the baseline period, which seems to support that the intervention was well tolerated. We also found no difference in the number of ICU transfers, rapid response calls, and cardiopulmonary arrests between groups. While these findings are both reassuring, it is impossible to draw definitive conclusions about safety given the small absolute number of patients having received treatment in each group. Fortunately, current guidelines and literature support the safety of such an intervention, as there is no existing evidence to suggest that failing to rapidly lower BP among asymptomatic patients is potentially harmful.11
There are several limitations to our study. First, by utilizing a large electronic dataset, the quality of our analyses was reliant on the accuracy of the recorded EHR data. Second, in the absence of a controlled trial or control group, we cannot say definitively that our QI initiative was the direct cause of the improved rates of IV antihypertensive utilization, though the effect did persist after adjusting for baseline characteristics in patient-level models. Third, our follow-up period was relatively short, with fewer than half as many patients as in the preintervention period. This is an important limitation, since the impact of QI interventions often diminishes over time. We plan to continually monitor IV antihypertensive use, feed those data back to our group, and revitalize educational efforts should rates begin to rise. Fourth, we were unable to directly measure which patients had true end-organ injury and instead used orders placed around the time of medication administration as a surrogate marker. While this is an imperfect measure, we feel that in cases where a provider was concerned enough to even test for end-organ injury, the use of IV antihypertensives was likely justified and was therefore appropriately excluded from the analysis. Lastly, we were limited in our ability to describe associations with true clinical outcomes, such as stroke or myocardial infarction, which could theoretically be propagated by either the use or the avoidance of IV antihypertensive medications. Fortunately, based on clinical guidelines and existing evidence, there is no reason to believe that reducing IV antihypertensive use would result in increased rates of these outcomes.
Our study reaffirms the fact that overutilization of IV antihypertensive medications among asymptomatic hospitalized patients is pervasive across hospital systems. This represents a potential target for a concerted change in culture, which we have demonstrated can be feasibly accomplished through education and systems changes.
Disclosures
Dr. Auerbach has current or pending grants from the CDC, PCORI, and FDA that are unrelated to this research manuscript. He also receives royalties from UpToDate, and received an honorarium for being editor of JHM. Dr. Jacobs received a $1,000 Resident/Fellow Travel Grant from the Society of Hospital Medicine to support the cost of travel to SHM, where he presented this research as a poster in 2018. Dr. Prasad receives money from EpiExcellence, LLC for consultation, which is unrelated to this research manuscript. All other authors have nothing to disclose.
1. Axon RN, Cousineau L, Egan BM. Prevalence and management of hypertension in the inpatient setting: A systematic review. J Hosp Med. 2011;6(7):417-422. doi: 10.1002/jhm.804. PubMed
2. Herzog E, Frankenberger O, Aziz E, et al. A novel pathway for the management of ypertension for hospitalized patients. Crit Pathw Cardiol. 2007;6(4):150-160. doi: 10.1097/HPC.0b013e318160c3a7. PubMed
3. James PA, Oparil S, Carter BL, et al. 2014 evidence-based guideline for the management of high blood pressure in adults: report from the panel members appointed to the eighth Joint National Committee (JNC 8). JAMA. 2014;311(5):507-520. doi: 10.1001/jama.2013.284427. PubMed
4. Weder AB. Treating acute hypertension in the hospital: A lacuna in the guidelines [editorial]. Hypertension. 2011;57(1):18-20. PubMed
5. Axon RN, Turner M, Buckley R. An update on inpatient hypertension management. Curr Cardiol Rep. 2015;17(11):94. doi: 10.1007/s11886-015-0648-y. PubMed
6. Marik PE, Rivera R. Hypertensive emergencies: an update. Curr Opin Crit Care. 2011;17(6):569-580. doi:10.1097/MCC.0b013e32834cd31d. PubMed
7. Cherney D, Straus S. Management of patients with hypertensive urgencies and emergencies: a systematic review of the literature. J Gen Intern Med. 2002;17(12):937-945. doi: 10.1046/j.1525-1497.2002.20389.x. PubMed
8. Padilla Ramos A, Varon J. Current and newer agents for hypertensive emergencies. Curr Hypertens Rep. 2014;16(7):450. doi: 10.1007/s11906-014-0450-z. PubMed
9. Whitworth JA, World Health Organization, International Society of Hypertension Writing Group. 2003 World Health Organization (WHO)/International Society of Hypertension (ISH) statement on management of hypertension. J Hypertens. 2003;21(11):1983-1992. doi: 10.1097/01.hjh.0000084751.37215.d2. PubMed
10. Campbell P, Baker WL, Bendel SD, White WB. Intravenous hydralazine for blood pressure management in the hospitalized patient: its use is often unjustified. J Am Soc Hypertens. 2011;5(6):473-477. doi: 10.1016/j.jash.2011.07.002. PubMed
11. Chobanian AV, Bakris GL, Black HR, et al. The Seventh Report of the Joint National Committee on Prevention, Detection, Evaluation, and Treatment of High Blood Pressure: the JNC 7 report. JAMA. 2003;289(19):2560-2572. doi: 10.1001/jama.289.19.2560. PubMed
12. Gauer R. Severe asymptomatic hypertension: Evaluation and treatment. Am Fam Physician. 2017;95(8):492-500. PubMed
13. Lipari M, Moser LR, Petrovitch EA, Farber M, Flack JM. As-needed intravenous antihypertensive therapy and blood pressure control: Antihypertensive Therapy and BP Control. J Hosp Med. 2016;11(3):193-198. doi: 10.1002/jhm.2510. PubMed
14. Gaynor MF, Wright GC, Vondracek S. Retrospective review of the use of as-needed hydralazine and labetalol for the treatment of acute hypertension in hospitalized medicine patients. Ther Adv Cardiovasc Dis. 2017;12(1):7-15. doi: 10.1177/1753944717746613. PubMed
15. Weder AB, Erickson S. Treatment of hypertension in the inpatient setting: Use of intravenous labetalol and hydralazine. J Clin Hypertens. 2010;12(1):29-33. doi: 10.1111/j.1751-7176.2009.00196.x. PubMed
16. Averill RF, Goldfield N, Hughes, JS, et al. All Patient Refined Diagnosis Related Groups (APR-DRGs) Version 20.0: Methodology Overview. Clinical Research and Documentation Departments of 3M Health Information Systems, Wallingford, Connecticut and Murray, Utah, 2003. https://www.hcup-us.ahrq.gov/. Accessed February 19, 2018.
17. Iezzoni LI, Ash AS, Shwartz M, Daley J, Hughes JS, Mackiernan YD. Predicting who dies depends on how severity is measured: Implications for evaluating patient outcomes. Ann Intern Med. 1995;123(10):763-770. PubMed
18. Romagnoli S, Ricci Z, Quattrone D, et al. Accuracy of invasive arterial pressure monitoring in cardiovascular patients: an observational study. Crit Care. 2014;18(6):644. doi: 10.1186/s13054-014-0644-4. PubMed
19. Shojania K, Grimshaw JM. Evidence-based quality improvement: The state of the science. Health Aff (Millwood). 2005;24(1):138-150. doi: 10.1377/hlthaff.24.1.138. PubMed
© 2019 Society of Hospital Medicine