User login
Naloxone Dispensing in Patients at Risk for Opioid Overdose After Total Knee Arthroplasty Within the Veterans Health Administration
Opioid overdose is a major public health challenge, with recent reports estimating 41 deaths per day in the United States from prescription opioid overdose.1,2 Prescribing naloxone has increasingly been advocated to reduce the risk of opioid overdose for patients identified as high risk. Naloxone distribution has been shown to decrease the incidence of opioid overdoses in the general population.3,4 The Centers for Disease Control and Prevention (CDC) Guideline for Prescribing Opioids for Chronic Pain recommends considering naloxone prescription for patients with a history of overdose or substance use disorder, opioid dosages ≥ 50 morphine equivalent daily dose (MEDD), and concurrent use of benzodiazepines.5
Although the CDC guidelines are intended for primary care clinicians in outpatient settings, naloxone prescribing is also relevant in the postsurgical setting.5 Many surgical patients are at risk for opioid overdose and data from the Veterans Health Administration (VHA) has shown that risk of opioid overdose is 11-fold higher in the 30 days following discharge from a surgical admission, when compared with the subsequent calendar year.6,7 This likely occurs due to new prescriptions or escalated doses of opioids following surgery. Overdose risk may be particularly relevant to orthopedic surgery as postoperative opioids are commonly prescribed.8 Patients undergoing total knee arthroplasty (TKA) may represent a vulnerable population to overdose as it is one of the most commonly performed surgeries for the treatment of chronic pain, and is frequently performed in older adults with medical comorbidities.9,10
Identifying patients at high risk for opioid overdose is important for targeted naloxone dispensing.5 A risk index for overdose or serious opioid-induced respiratory depression (RIOSORD) tool has been developed and validated in veteran and other populations to identify such patients.11 The RIOSORD tool classifies patients by risk level (1-10) and predicts probability of overdose or serious opioid-induced respiratory depression (OSORD). A patient’s level of risk is based on a weighted combination of the 15 independent risk factors most highly associated with OSORD, including comorbid conditions, prescription drug use, and health care utilization.12 Using the RIOSORD tool, the VHA Opioid Education and Naloxone Distribution (OEND) program is a risk mitigation initiative that aims to decrease opioid-related overdose morbidity and mortality. This is achieved via opioid overdose education for prevention, recognition, and response and includes outpatient naloxone prescription.13,14
Despite the comprehensive OEND program, there exists very little data to guide postsurgical naloxone prescribing. The prevalence of known risk factors for overdose in surgical patients remains unknown, as does the prevalence of perioperative naloxone distribution. Understanding overdose risk factors and naloxone prescribing patterns in surgical patients may identify potential targets for OEND efforts. This study retrospectively estimated RIOSORD scores for TKA patients between 2013 to 2016 and described naloxone distribution based on RIOSORD scores and risk factors.
Methods
We identified patients who had undergone primary TKA at VHA hospitals using Current Procedural Terminology (CPT), International Classification of Diseases, Ninth Revision (ICD-9) procedure codes, and data extracted from the VHA Corporate Data Warehouse (CDW) of electronic health records (EHRs). Our study was granted approval with exemption from informed consent by the Durham Veteran Affairs Healthcare System Institutional Review Board.
This retrospective cohort study included all veterans who underwent elective primary TKA from January 1, 2013 through December 31, 2016. We excluded patients who died before discharge.
Outcomes
Our primary outcome was being dispensed an outpatient naloxone prescription following TKA. Naloxone dispensing was identified by examining CDW outpatient pharmacy records with a final dispense date from 1 year before surgery through 7 days after discharge following TKA. To exclude naloxone administration that may have been given in a clinic, prescription data included only records with an outpatient prescription copay. Naloxone dispensing in the year before surgery was chosen to estimate likely preoperative possession of naloxone which could be available in the postoperative period. Naloxone dispensing until 7 days after discharge was chosen to identify any new dispensing that would be available in the postoperative period. These outcomes were examined over the study time frame on an annual basis.
Patient Factors
Demographic variables included age, sex, and race/ethnicity. Independent risk factors for overdose from RIOSORD were identified for each patient.15 These risk factors included comorbidities (opioid use disorder, schizophrenia, bipolar disorder, liver disease, chronic kidney disease, sleep apnea, or lung disease) and prescription drug use (use of opioids, benzodiazepines, long-acting opioids, ≥ 50 MEDD or ≥ 100 MEDD). ICD-9 and ICD-10 diagnosis codes were used to identify comorbidities. Risk classes on day of surgery were identified using a RIOSORD algorithm code. Consistent with the display of RIOSORD risk classes on the VHA Academic Detailing Service OEND risk report, patients were grouped into 3 groups based on their RIOSORD score: classes 1 to 4 (low risk), 5 to 7 (moderate risk), and 8 to 10 (high risk).
Descriptive statistics were used to summarize data on patient demographics, RIOSORD risk factors, overdose events, and naloxone dispensing over time.
Results
The study cohort included 38,011 veterans who underwent primary TKA in the VHA between January 1, 2013 and December 30, 2016. In this cohort, the mean age was 65 years, 93% were male, and 77% were White patients (Table 1). The most common comorbidities were lung disease in 9170 (24.1%) patients, sleep apnea in 6630 (17.4%) patients, chronic kidney disease in 4036 (10.6%) patients, liver disease in 2822 (7.4%) patients, and bipolar disorder in 1748 (4.6%) patients.
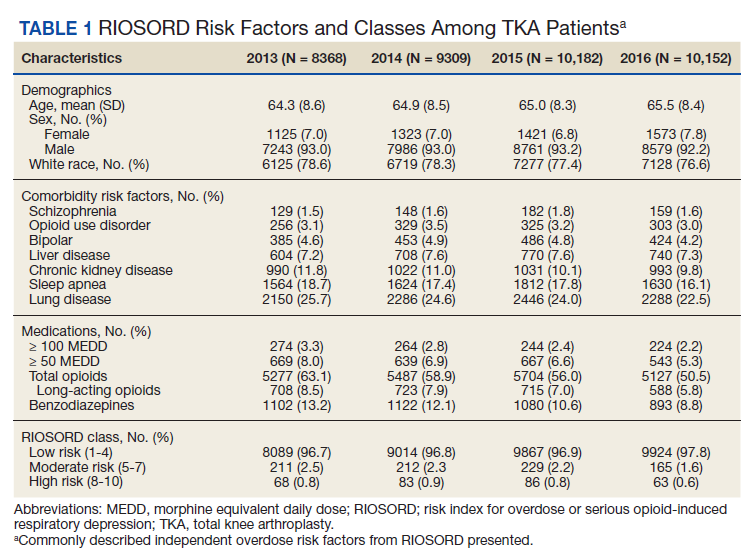
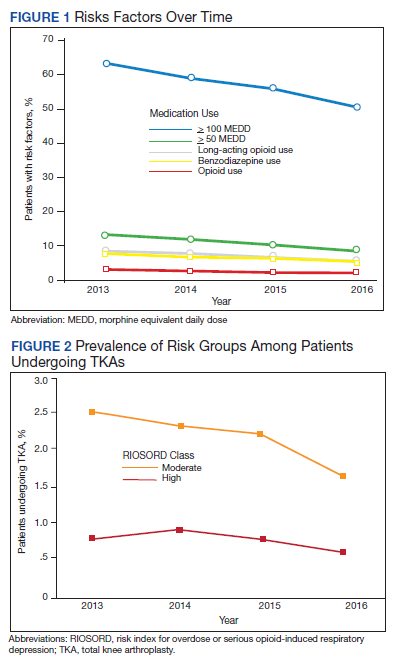
In 2013, 63.1% of patients presenting for surgery were actively prescribed opioids. By 2016, this decreased to 50.5%. Benzodiazepine use decreased from 13.2 to 8.8% and long-acting opioid use decreased from 8.5 to 5.8% over the same period. Patients taking ≥ 50 MEDD decreased from 8.0 to 5.3% and patients taking ≥ 100 MEDD decreased from 3.3 to 2.2%. The prevalence of moderate-risk patients decreased from 2.5 to 1.6% and high-risk patients decreased from 0.8 to 0.6% (Figure 1). Cumulatively, the prevalence of presenting with either moderate or high risk of overdose decreased from 3.3 to 2.2% between 2013 to 2016.
Naloxone Dispensing
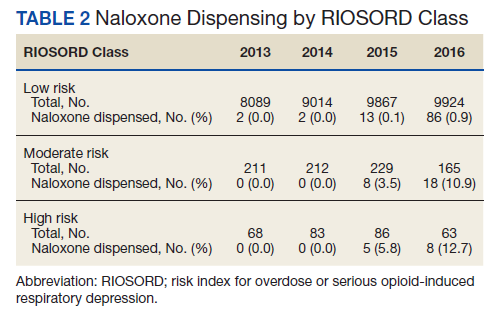
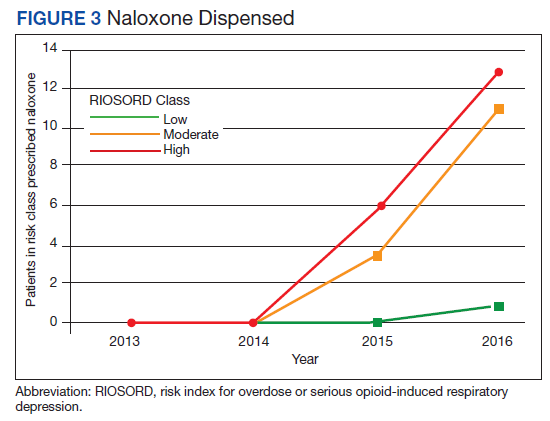
In 2013, naloxone was not dispensed to any patients at moderate or high risk for overdose between 365 days prior to surgery until 7 days after discharge (Table 2 and Figure 2). Low-risk group naloxone dispensing increased to 2 (0.0%) in 2014, to 13 (0.1%), in 2015, and to 86 (0.9%) in 2016. Moderate-risk group naloxone dispensing remained at 0 (0.0%) in 2014, but increased to 8 (3.5%) in 2015, and to 18 (10.9%) in 2016. High-risk group naloxone dispensing remained at 0 (0.0%) in 2014, but increased to 5 (5.8%) in 2015, and to 8 (12.7%) in 2016 (Figure 3).
Discussion
Our data demonstrate that patients presenting for TKA between 2013 and 2016 routinely had individual risk factors for overdose related to either prescription drug use or comorbidities. We also show that, although the number of patients at moderate and high risk for opioid overdose is decreasing, 2.2% of TKA patients remain at moderate or high risk for opioid overdose based on a weighted combination of these individual risk factors using RIOSORD. As demand for primary TKA is projected to grow to 3.5 million procedures by 2030, using prevalence from 2016, we estimate that 76,560 patients may present for TKA across the US with moderate or high risk for opioid overdose.9 Following discharge, this risk may be even higher as this estimate does not yet account for postoperative opioid use. We demonstrate that through a VHA OEND initiative, naloxone distribution increased and appeared to be targeted to those most at risk using a simple validated tool like RIOSORD.
Presence of an individual risk factor for overdose was present in as many as 63.1% of patients presenting for TKA, as was seen in 2013 with preoperative opioid use. The 3 highest scoring prescription use–related risk factors in RIOSORD are use of opioids ≥ 100 MEDD (16 points), ≥ 50 MEDD (9 points), and long-acting formulations (9 points). All 3 decreased in prevalence over the study period but by 2016 were still seen in 2.2% for ≥ 100 MEDD, 5.3% for ≥ 50 MEDD, and 5.8% for long-acting opioids. This decrease was not surprising given implementation of a VHA-wide opioid safety initiative and the OEND program, but this could also be related to changes in patient selection for surgery in the context of increased awareness of the opioid epidemic. Despite the trend toward safer opioid prescribing, by 2016 over half of patients (50.5%) who presented for TKA were already taking opioids, with 10.6% (543 of 5127) on doses ≥ 50 MEDD.
We observed a decrease in RIOSORD risk each year, consistent with decreasing prescription-related risk factors over time. This was most obvious in the moderate-risk group. It is unclear why a similar decrease was not as obvious in the high-risk group, but this in part may be due to the already low numbers of patients in the high-risk group. This may also represent the high-risk group being somewhat resistant to the initiatives that shifted moderate-risk patients to the low-risk group. There were proportionately more patients in the moderate- and high-risk groups in the original RIOSORD population than in our surgical population, which may be attributed to the fewer comorbidities seen in our surgical population, as well as the higher opioid-prescribing patterns seen prior to the VA OEND initiative.12
Naloxone prescribing was rare prior to the OEND initiative and increased from 2013 to 2016. Increases were most marked in those in moderate- and high-risk groups, although naloxone prescribing also increased among the low-risk group. Integration of RIOSORD stratification into the OEND initiative likely played a role in targeting increased access to naloxone among those at highest risk of overdose. Naloxone dispensing increased for every group, although a significant proportion of moderate- and high-risk patients, 89.1% and 87.3%, respectively, were still not dispensed naloxone by 2016. Moreover, our estimates of perioperative naloxone access were likely an overestimate by including patients dispensed naloxone up to 1 year before surgery until 7 days after surgery. The aim was to include patients who may not have been prescribed naloxone postoperatively because of an existing naloxone prescription at home. Perioperative naloxone access estimates would have been even lower if a narrower window had been used to approximate perioperative access. This identifies an important gap between those who may benefit from naloxone dispensing and those who received naloxone. This in part may be because OEND has not been implemented as routinely in surgical settings as other settings (eg, primary care). OEND efforts may more effectively increase naloxone prescribing among surgical patients if these efforts were targeted at surgical and anesthesia departments. Given that the Comprehensive Addiction and Recovery Act of 2016 requires an assessment of patient risk prior to opioid prescribing and VHA efforts to increase utilization of tools like the Stratification Tool for Opioid Risk Mitigation (STORM), which estimates patient risk when initiating an opioid prescription and includes naloxone as one of many risk mitigation strategies, we anticipate that rates of naloxone prescribing will increase over time.
Limitations
Our study captures a large number of patients across VHA hospitals of varying size nationwide, including a mix of those with and without academic medical center affiliations. This veteran population may not represent the US commercially insured population (CIP). Zedler and colleagues highlighted the differences in prevalence of individual risk factors: notably, the CIP had a substantially higher proportion of females and younger patients.11 VHA had a greater prevalence of common chronic conditions associated with older age. The frequency of opioid dependence was similar among CIP and VHA. However, substance abuse and nonopioid substance dependence diagnoses were 4-fold more frequent among VHA controls as CIP controls. Prescribing of all opioids, except morphine and methadone, was substantially greater in CIP than in VHA.11 Despite a difference in individual risk factors, a CIP-specific RIOSORD has been validated and can be used outside of the VHA to obviate the limitations of the VHA-specific RIOSORD.11
Other limitations include our estimation of naloxone access. We do not know whether naloxone was administered or have a reliable estimate of overdose incidence in this postoperative TKA population. Also, it is important to note that RIOSORD was not developed for surgical patients. The use of RIOSORD in a postoperative population likely underestimates risk of opioid overdose due to the frequent prescriptions of new opioids or escalation of existing MEDD to the postoperative patient. Our study was also retrospective in nature and reliant on accurate coding of patient risk factors. It is possible that comorbidities were not accurately identified by EHR and therefore subject to inconsistency.
Conclusions
Veterans presenting for TKA routinely have risk factors for opioid overdose. We observed a trend toward decreasing overdose risk which coincided with the Opioid Safety and OEND initiatives within the VHA. We also observed an increase in naloxone prescription for moderate- and high-risk patients undergoing TKA, although most of these patients still did not receive naloxone as of 2016. More research is needed to refine and validate the RIOSORD score for surgical populations. Expanding initiatives such as OEND to include surgical patients presents an opportunity to improve access to naloxone for postoperative patients that may help reduce opioid overdose in this population.
1. Rudd RA, Seth P, David F, Scholl L. Increases in drug and opioid-involved overdose deaths - United States, 2010-2015. MMWR Morb Mortal Wkly Rep. 2016;65(50-51):1445-1452. Published 2016 Dec 30. doi:10.15585/mmwr.mm655051e1
2. Wilson N, Kariisa M, Seth P, Smith H, Davis NL. Drug and opioid-involved overdose deaths - United States, 2017-2018. MMWR Morb Mortal Wkly Rep. 2020;69(11):290-297. doi:10.15585/mmwr.mm6911a4
3. Walley AY, Xuan Z, Hackman HH, et al. Opioid overdose rates and implementation of overdose education and nasal naloxone distribution in Massachusetts: interrupted time series analysis. BMJ. Jan 30 2013;346:f174. doi:10.1136/bmj.f174
4. McClellan C, Lambdin BH, Ali MM, et al. Opioid-overdose laws association with opioid use and overdose mortality. Addict Behav. 2018;86:90-95. doi:10.1016/j.addbeh.2018.03.014
5. Dowell D, Haegerich TM, Chou R. CDC Guideline for prescribing opioids for chronic pain--United States, 2016. JAMA. 2016;315(15):1624-1645. doi:10.1001/jama.2016.1464
6. Brat GA, Agniel D, Beam A, et al. Postsurgical prescriptions for opioid naive patients and association with overdose and misuse: retrospective cohort study. BMJ. 2018;360:j5790. Published 2018 Jan 17. doi:10.1136/bmj.j5790
7. Mudumbai SC, Lewis ET, Oliva EM, et al. Overdose risk associated with opioid use upon hospital discharge in Veterans Health Administration surgical patients. Pain Med. 2019;20(5):1020-1031. doi:10.1093/pm/pny150
8. Hsia HL, Takemoto S, van de Ven T, et al. Acute pain is associated with chronic opioid use after total knee arthroplasty. Reg Anesth Pain Med. 2018;43(7):705-711. doi:10.1097/AAP.0000000000000831
9. Kurtz S, Ong K, Lau E, Mowat F, Halpern M. Projections of primary and revision hip and knee arthroplasty in the United States from 2005 to 2030. J Bone Joint Surg Am. 2007;89(4):780-785. doi:10.2106/JBJS.F.00222
10. Kurtz SM, Ong KL, Lau E, Bozic KJ. Impact of the economic downturn on total joint replacement demand in the United States: updated projections to 2021. J Bone Joint Surg Am. 2014;96(8):624-630. doi:10.2106/JBJS.M.00285
11. Zedler BK, Saunders WB, Joyce AR, Vick CC, Murrelle EL. Validation of a screening risk index for serious prescription opioid-induced respiratory depression or overdose in a US commercial health plan claims database. Pain Med. 2018;19(1):68-78. doi:10.1093/pm/pnx009
12. Zedler B, Xie L, Wang L, et al. Development of a risk index for serious prescription opioid-induced respiratory depression or overdose in Veterans Health Administration patients. Pain Med. 2015;16(8):1566-79. doi:10.1111/pme.12777
13. Oliva EM, Bowe T, Tavakoli S, et al. Development and applications of the Veterans Health Administration’s Stratification Tool for Opioid Risk Mitigation (STORM) to improve opioid safety and prevent overdose and suicide. Psychol Serv. 2017;14(1):34-49. doi:10.1037/ser0000099
14. Oliva EM, Christopher MLD, Wells D, et al. Opioid overdose education and naloxone distribution: development of the Veterans Health Administration’s national program. J Am Pharm Assoc (2003). 2017;57(2S):S168-S179.e4. doi:10.1016/j.japh.2017.01.022
15. Noël PH, Copeland LA, Perrin RA, et al. VHA Corporate Data Warehouse height and weight data: opportunities and challenges for health services research. J Rehabil Res Dev. 2010;47(8):739-750. doi:10.1682/jrrd.2009.08.0110
Opioid overdose is a major public health challenge, with recent reports estimating 41 deaths per day in the United States from prescription opioid overdose.1,2 Prescribing naloxone has increasingly been advocated to reduce the risk of opioid overdose for patients identified as high risk. Naloxone distribution has been shown to decrease the incidence of opioid overdoses in the general population.3,4 The Centers for Disease Control and Prevention (CDC) Guideline for Prescribing Opioids for Chronic Pain recommends considering naloxone prescription for patients with a history of overdose or substance use disorder, opioid dosages ≥ 50 morphine equivalent daily dose (MEDD), and concurrent use of benzodiazepines.5
Although the CDC guidelines are intended for primary care clinicians in outpatient settings, naloxone prescribing is also relevant in the postsurgical setting.5 Many surgical patients are at risk for opioid overdose and data from the Veterans Health Administration (VHA) has shown that risk of opioid overdose is 11-fold higher in the 30 days following discharge from a surgical admission, when compared with the subsequent calendar year.6,7 This likely occurs due to new prescriptions or escalated doses of opioids following surgery. Overdose risk may be particularly relevant to orthopedic surgery as postoperative opioids are commonly prescribed.8 Patients undergoing total knee arthroplasty (TKA) may represent a vulnerable population to overdose as it is one of the most commonly performed surgeries for the treatment of chronic pain, and is frequently performed in older adults with medical comorbidities.9,10
Identifying patients at high risk for opioid overdose is important for targeted naloxone dispensing.5 A risk index for overdose or serious opioid-induced respiratory depression (RIOSORD) tool has been developed and validated in veteran and other populations to identify such patients.11 The RIOSORD tool classifies patients by risk level (1-10) and predicts probability of overdose or serious opioid-induced respiratory depression (OSORD). A patient’s level of risk is based on a weighted combination of the 15 independent risk factors most highly associated with OSORD, including comorbid conditions, prescription drug use, and health care utilization.12 Using the RIOSORD tool, the VHA Opioid Education and Naloxone Distribution (OEND) program is a risk mitigation initiative that aims to decrease opioid-related overdose morbidity and mortality. This is achieved via opioid overdose education for prevention, recognition, and response and includes outpatient naloxone prescription.13,14
Despite the comprehensive OEND program, there exists very little data to guide postsurgical naloxone prescribing. The prevalence of known risk factors for overdose in surgical patients remains unknown, as does the prevalence of perioperative naloxone distribution. Understanding overdose risk factors and naloxone prescribing patterns in surgical patients may identify potential targets for OEND efforts. This study retrospectively estimated RIOSORD scores for TKA patients between 2013 to 2016 and described naloxone distribution based on RIOSORD scores and risk factors.
Methods
We identified patients who had undergone primary TKA at VHA hospitals using Current Procedural Terminology (CPT), International Classification of Diseases, Ninth Revision (ICD-9) procedure codes, and data extracted from the VHA Corporate Data Warehouse (CDW) of electronic health records (EHRs). Our study was granted approval with exemption from informed consent by the Durham Veteran Affairs Healthcare System Institutional Review Board.
This retrospective cohort study included all veterans who underwent elective primary TKA from January 1, 2013 through December 31, 2016. We excluded patients who died before discharge.
Outcomes
Our primary outcome was being dispensed an outpatient naloxone prescription following TKA. Naloxone dispensing was identified by examining CDW outpatient pharmacy records with a final dispense date from 1 year before surgery through 7 days after discharge following TKA. To exclude naloxone administration that may have been given in a clinic, prescription data included only records with an outpatient prescription copay. Naloxone dispensing in the year before surgery was chosen to estimate likely preoperative possession of naloxone which could be available in the postoperative period. Naloxone dispensing until 7 days after discharge was chosen to identify any new dispensing that would be available in the postoperative period. These outcomes were examined over the study time frame on an annual basis.
Patient Factors
Demographic variables included age, sex, and race/ethnicity. Independent risk factors for overdose from RIOSORD were identified for each patient.15 These risk factors included comorbidities (opioid use disorder, schizophrenia, bipolar disorder, liver disease, chronic kidney disease, sleep apnea, or lung disease) and prescription drug use (use of opioids, benzodiazepines, long-acting opioids, ≥ 50 MEDD or ≥ 100 MEDD). ICD-9 and ICD-10 diagnosis codes were used to identify comorbidities. Risk classes on day of surgery were identified using a RIOSORD algorithm code. Consistent with the display of RIOSORD risk classes on the VHA Academic Detailing Service OEND risk report, patients were grouped into 3 groups based on their RIOSORD score: classes 1 to 4 (low risk), 5 to 7 (moderate risk), and 8 to 10 (high risk).
Descriptive statistics were used to summarize data on patient demographics, RIOSORD risk factors, overdose events, and naloxone dispensing over time.
Results
The study cohort included 38,011 veterans who underwent primary TKA in the VHA between January 1, 2013 and December 30, 2016. In this cohort, the mean age was 65 years, 93% were male, and 77% were White patients (Table 1). The most common comorbidities were lung disease in 9170 (24.1%) patients, sleep apnea in 6630 (17.4%) patients, chronic kidney disease in 4036 (10.6%) patients, liver disease in 2822 (7.4%) patients, and bipolar disorder in 1748 (4.6%) patients.
In 2013, 63.1% of patients presenting for surgery were actively prescribed opioids. By 2016, this decreased to 50.5%. Benzodiazepine use decreased from 13.2 to 8.8% and long-acting opioid use decreased from 8.5 to 5.8% over the same period. Patients taking ≥ 50 MEDD decreased from 8.0 to 5.3% and patients taking ≥ 100 MEDD decreased from 3.3 to 2.2%. The prevalence of moderate-risk patients decreased from 2.5 to 1.6% and high-risk patients decreased from 0.8 to 0.6% (Figure 1). Cumulatively, the prevalence of presenting with either moderate or high risk of overdose decreased from 3.3 to 2.2% between 2013 to 2016.
Naloxone Dispensing
In 2013, naloxone was not dispensed to any patients at moderate or high risk for overdose between 365 days prior to surgery until 7 days after discharge (Table 2 and Figure 2). Low-risk group naloxone dispensing increased to 2 (0.0%) in 2014, to 13 (0.1%), in 2015, and to 86 (0.9%) in 2016. Moderate-risk group naloxone dispensing remained at 0 (0.0%) in 2014, but increased to 8 (3.5%) in 2015, and to 18 (10.9%) in 2016. High-risk group naloxone dispensing remained at 0 (0.0%) in 2014, but increased to 5 (5.8%) in 2015, and to 8 (12.7%) in 2016 (Figure 3).
Discussion
Our data demonstrate that patients presenting for TKA between 2013 and 2016 routinely had individual risk factors for overdose related to either prescription drug use or comorbidities. We also show that, although the number of patients at moderate and high risk for opioid overdose is decreasing, 2.2% of TKA patients remain at moderate or high risk for opioid overdose based on a weighted combination of these individual risk factors using RIOSORD. As demand for primary TKA is projected to grow to 3.5 million procedures by 2030, using prevalence from 2016, we estimate that 76,560 patients may present for TKA across the US with moderate or high risk for opioid overdose.9 Following discharge, this risk may be even higher as this estimate does not yet account for postoperative opioid use. We demonstrate that through a VHA OEND initiative, naloxone distribution increased and appeared to be targeted to those most at risk using a simple validated tool like RIOSORD.
Presence of an individual risk factor for overdose was present in as many as 63.1% of patients presenting for TKA, as was seen in 2013 with preoperative opioid use. The 3 highest scoring prescription use–related risk factors in RIOSORD are use of opioids ≥ 100 MEDD (16 points), ≥ 50 MEDD (9 points), and long-acting formulations (9 points). All 3 decreased in prevalence over the study period but by 2016 were still seen in 2.2% for ≥ 100 MEDD, 5.3% for ≥ 50 MEDD, and 5.8% for long-acting opioids. This decrease was not surprising given implementation of a VHA-wide opioid safety initiative and the OEND program, but this could also be related to changes in patient selection for surgery in the context of increased awareness of the opioid epidemic. Despite the trend toward safer opioid prescribing, by 2016 over half of patients (50.5%) who presented for TKA were already taking opioids, with 10.6% (543 of 5127) on doses ≥ 50 MEDD.
We observed a decrease in RIOSORD risk each year, consistent with decreasing prescription-related risk factors over time. This was most obvious in the moderate-risk group. It is unclear why a similar decrease was not as obvious in the high-risk group, but this in part may be due to the already low numbers of patients in the high-risk group. This may also represent the high-risk group being somewhat resistant to the initiatives that shifted moderate-risk patients to the low-risk group. There were proportionately more patients in the moderate- and high-risk groups in the original RIOSORD population than in our surgical population, which may be attributed to the fewer comorbidities seen in our surgical population, as well as the higher opioid-prescribing patterns seen prior to the VA OEND initiative.12
Naloxone prescribing was rare prior to the OEND initiative and increased from 2013 to 2016. Increases were most marked in those in moderate- and high-risk groups, although naloxone prescribing also increased among the low-risk group. Integration of RIOSORD stratification into the OEND initiative likely played a role in targeting increased access to naloxone among those at highest risk of overdose. Naloxone dispensing increased for every group, although a significant proportion of moderate- and high-risk patients, 89.1% and 87.3%, respectively, were still not dispensed naloxone by 2016. Moreover, our estimates of perioperative naloxone access were likely an overestimate by including patients dispensed naloxone up to 1 year before surgery until 7 days after surgery. The aim was to include patients who may not have been prescribed naloxone postoperatively because of an existing naloxone prescription at home. Perioperative naloxone access estimates would have been even lower if a narrower window had been used to approximate perioperative access. This identifies an important gap between those who may benefit from naloxone dispensing and those who received naloxone. This in part may be because OEND has not been implemented as routinely in surgical settings as other settings (eg, primary care). OEND efforts may more effectively increase naloxone prescribing among surgical patients if these efforts were targeted at surgical and anesthesia departments. Given that the Comprehensive Addiction and Recovery Act of 2016 requires an assessment of patient risk prior to opioid prescribing and VHA efforts to increase utilization of tools like the Stratification Tool for Opioid Risk Mitigation (STORM), which estimates patient risk when initiating an opioid prescription and includes naloxone as one of many risk mitigation strategies, we anticipate that rates of naloxone prescribing will increase over time.
Limitations
Our study captures a large number of patients across VHA hospitals of varying size nationwide, including a mix of those with and without academic medical center affiliations. This veteran population may not represent the US commercially insured population (CIP). Zedler and colleagues highlighted the differences in prevalence of individual risk factors: notably, the CIP had a substantially higher proportion of females and younger patients.11 VHA had a greater prevalence of common chronic conditions associated with older age. The frequency of opioid dependence was similar among CIP and VHA. However, substance abuse and nonopioid substance dependence diagnoses were 4-fold more frequent among VHA controls as CIP controls. Prescribing of all opioids, except morphine and methadone, was substantially greater in CIP than in VHA.11 Despite a difference in individual risk factors, a CIP-specific RIOSORD has been validated and can be used outside of the VHA to obviate the limitations of the VHA-specific RIOSORD.11
Other limitations include our estimation of naloxone access. We do not know whether naloxone was administered or have a reliable estimate of overdose incidence in this postoperative TKA population. Also, it is important to note that RIOSORD was not developed for surgical patients. The use of RIOSORD in a postoperative population likely underestimates risk of opioid overdose due to the frequent prescriptions of new opioids or escalation of existing MEDD to the postoperative patient. Our study was also retrospective in nature and reliant on accurate coding of patient risk factors. It is possible that comorbidities were not accurately identified by EHR and therefore subject to inconsistency.
Conclusions
Veterans presenting for TKA routinely have risk factors for opioid overdose. We observed a trend toward decreasing overdose risk which coincided with the Opioid Safety and OEND initiatives within the VHA. We also observed an increase in naloxone prescription for moderate- and high-risk patients undergoing TKA, although most of these patients still did not receive naloxone as of 2016. More research is needed to refine and validate the RIOSORD score for surgical populations. Expanding initiatives such as OEND to include surgical patients presents an opportunity to improve access to naloxone for postoperative patients that may help reduce opioid overdose in this population.
1. Rudd RA, Seth P, David F, Scholl L. Increases in drug and opioid-involved overdose deaths - United States, 2010-2015. MMWR Morb Mortal Wkly Rep. 2016;65(50-51):1445-1452. Published 2016 Dec 30. doi:10.15585/mmwr.mm655051e1
2. Wilson N, Kariisa M, Seth P, Smith H, Davis NL. Drug and opioid-involved overdose deaths - United States, 2017-2018. MMWR Morb Mortal Wkly Rep. 2020;69(11):290-297. doi:10.15585/mmwr.mm6911a4
3. Walley AY, Xuan Z, Hackman HH, et al. Opioid overdose rates and implementation of overdose education and nasal naloxone distribution in Massachusetts: interrupted time series analysis. BMJ. Jan 30 2013;346:f174. doi:10.1136/bmj.f174
4. McClellan C, Lambdin BH, Ali MM, et al. Opioid-overdose laws association with opioid use and overdose mortality. Addict Behav. 2018;86:90-95. doi:10.1016/j.addbeh.2018.03.014
5. Dowell D, Haegerich TM, Chou R. CDC Guideline for prescribing opioids for chronic pain--United States, 2016. JAMA. 2016;315(15):1624-1645. doi:10.1001/jama.2016.1464
6. Brat GA, Agniel D, Beam A, et al. Postsurgical prescriptions for opioid naive patients and association with overdose and misuse: retrospective cohort study. BMJ. 2018;360:j5790. Published 2018 Jan 17. doi:10.1136/bmj.j5790
7. Mudumbai SC, Lewis ET, Oliva EM, et al. Overdose risk associated with opioid use upon hospital discharge in Veterans Health Administration surgical patients. Pain Med. 2019;20(5):1020-1031. doi:10.1093/pm/pny150
8. Hsia HL, Takemoto S, van de Ven T, et al. Acute pain is associated with chronic opioid use after total knee arthroplasty. Reg Anesth Pain Med. 2018;43(7):705-711. doi:10.1097/AAP.0000000000000831
9. Kurtz S, Ong K, Lau E, Mowat F, Halpern M. Projections of primary and revision hip and knee arthroplasty in the United States from 2005 to 2030. J Bone Joint Surg Am. 2007;89(4):780-785. doi:10.2106/JBJS.F.00222
10. Kurtz SM, Ong KL, Lau E, Bozic KJ. Impact of the economic downturn on total joint replacement demand in the United States: updated projections to 2021. J Bone Joint Surg Am. 2014;96(8):624-630. doi:10.2106/JBJS.M.00285
11. Zedler BK, Saunders WB, Joyce AR, Vick CC, Murrelle EL. Validation of a screening risk index for serious prescription opioid-induced respiratory depression or overdose in a US commercial health plan claims database. Pain Med. 2018;19(1):68-78. doi:10.1093/pm/pnx009
12. Zedler B, Xie L, Wang L, et al. Development of a risk index for serious prescription opioid-induced respiratory depression or overdose in Veterans Health Administration patients. Pain Med. 2015;16(8):1566-79. doi:10.1111/pme.12777
13. Oliva EM, Bowe T, Tavakoli S, et al. Development and applications of the Veterans Health Administration’s Stratification Tool for Opioid Risk Mitigation (STORM) to improve opioid safety and prevent overdose and suicide. Psychol Serv. 2017;14(1):34-49. doi:10.1037/ser0000099
14. Oliva EM, Christopher MLD, Wells D, et al. Opioid overdose education and naloxone distribution: development of the Veterans Health Administration’s national program. J Am Pharm Assoc (2003). 2017;57(2S):S168-S179.e4. doi:10.1016/j.japh.2017.01.022
15. Noël PH, Copeland LA, Perrin RA, et al. VHA Corporate Data Warehouse height and weight data: opportunities and challenges for health services research. J Rehabil Res Dev. 2010;47(8):739-750. doi:10.1682/jrrd.2009.08.0110
Preoperative Care Assessment of Need Scores Are Associated With Postoperative Mortality and Length of Stay in Veterans Undergoing Knee Replacement
Risk calculators can be of great value in guiding clinical decision making, patient-centered precision medicine, and resource allocation.1 Several perioperative risk prediction models have emerged in recent decades that estimate specific hazards (eg, cardiovascular complications after noncardiac surgery) with varying accuracy and utility. In the perioperative sphere, the time windows are often limited to an index hospitalization or 30 days following surgery or discharge.2-9 Although longer periods are of interest to patients, families, and health systems, few widely used or validated models are designed to look beyond this very narrow window.10,11 In addition, perioperative risk prediction models do not routinely incorporate parameters of a wide variety of health or demographic domains, such as patterns of health care, health care utilization, or medication use.
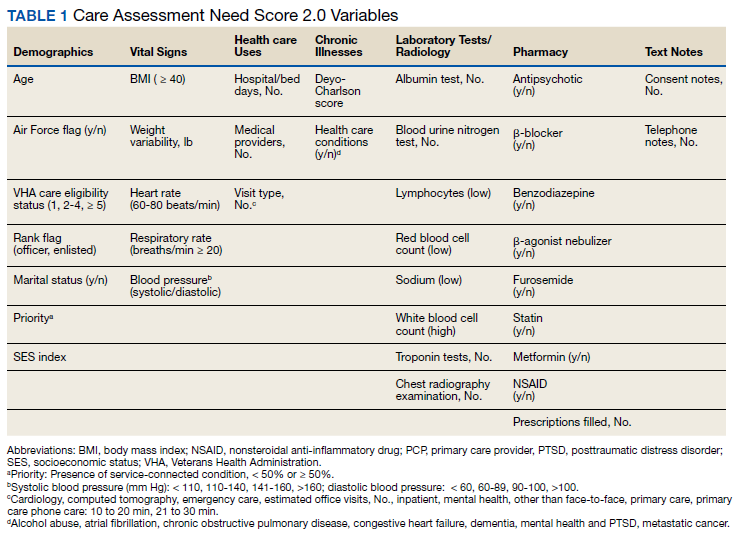
In 2013, in response to the need for near real-time information to guide delivery of enhanced care management services, the Veterans Health Administration (VHA) Office of Informatics and Analytics developed automated risk prediction models that used detailed electronic health record (EHR) data. These models were used to report Care Assessment Need (CAN) scores each week for all VHA enrollees and include data from a wide array of health domains. These CAN scores predict the risk for hospitalization, death, or either event within 90 days and 1 year.12,13 Each score is reported as both a predicted probability (0-1) and as a percentile in relation to all other VHA enrollees (a value between 1 and 99).13 The data used to calculate CAN scores are listed in Table 1.12
Surgical procedures or admissions would not be differentiated from nonsurgical admissions or other procedural clinic visits, and as such, it is not possible to isolate the effect of undergoing a surgical procedure from another health-related event on the CAN score. At the same time though, a short-term increase in system utilization caused by an elective surgical procedure such as a total knee replacement (TKR) would presumably be reflected in a change in CAN score, but this has not been studied.
Since their introduction, CAN scores have been routinely accessed by primary care teams and used to facilitate care coordination for thousands of VHA patients. However, these CAN scores are currently not available to VHA surgeons, anesthesiologists, or other perioperative clinicians. In this study, we examine the distributions of preoperative CAN scores and explore the relationships of preoperative CAN 1-year mortality scores with 1-year survival following discharge and length of stay (LOS) during index hospitalization in a cohort of US veterans who underwent TKR, the most common elective operation performed within the VHA system.
Methods
Following approval of the Durham Veterans Affairs Medical Center Institutional Review Board, all necessary data were extracted from the VHA Corporate Data Warehouse (CDW) repository.14 Informed consent was waived due to the minimal risk nature of the study.
We used Current Procedural Terminology codes (27438, 27446, 27447, 27486, 27487, 27488) and International Classification of Diseases, 9th edition clinical modification procedure codes (81.54, 81.55, 81.59, 00.80-00.84) to identify all veterans who had undergone primary or revision TKR between July 2014 and December 2015 in VHA Veterans Integrated Service Network 1 (Maine, Vermont, New Hampshire, Massachusetts, Connecticut, Rhode Island, New York, Pennsylvania, West Virginia, Virginia, North Carolina). Because we focused on outcomes following hospital discharge, patients who died before discharge were excluded from the analysis. Preoperative CAN 1-year mortality score was chosen as the measure under the assumption that long-term survival may be the most meaningful of the 4 possible CAN score measures.
Our primary objective was to determine distribution of preoperative CAN scores in the study population. Our secondary was to study relationships among the preoperative CAN 1-year mortality scores and 1-year mortality and hospital LOS.
Study Variables
For each patient, we extracted the date of index surgery. The primary exposure or independent variable was the CAN score in the week prior to this date. Because prior study has shown that CAN scores trajectories do not significantly change over time, the date-stamped CAN scores in the week before surgery represent what would have been available to clinicians in a preoperative setting.15 Since CAN scores are refreshed and overwritten every week, we extracted archived scores from the CDW.
For the 1-year survival outcome, the primary dependent variable, we queried the vital status files in the CDW for the date of death if applicable. We confirmed survival beyond 1 year by examining vital signs in the CDW for a minimum of 2 independent encounters beyond 1 year after the date of discharge. To compute the index LOS, the secondary outcome, we computed the difference between the date of admission and date of hospital discharge.
Statistical Methods
The parameters and performance of the multivariable logistic regression models developed to compute the various CAN mortality and hospitalization risk scores have been previously described.12 Briefly, Wang and colleagues created parsimonious regression models using backward selection. Model discrimination was evaluated using C (concordance)-statistic. Model calibration was assessed by comparing predicted vs observed event rates by risk deciles and performing Cox proportional hazards regression.
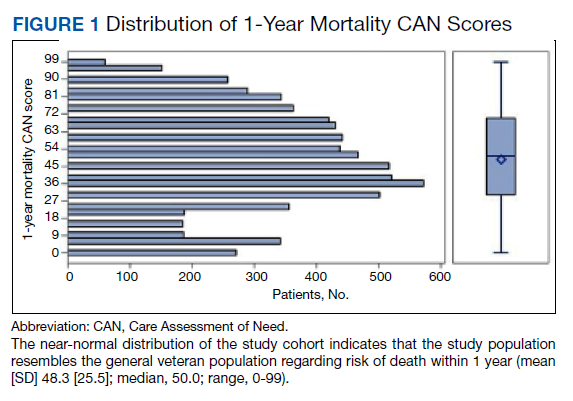
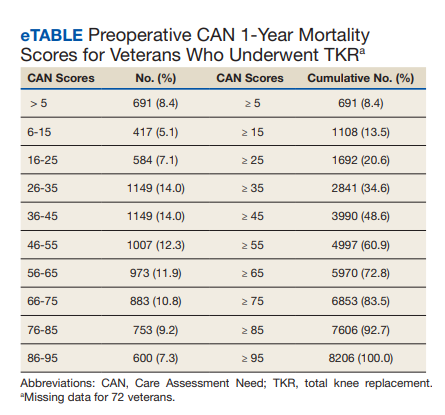
We plotted histograms to display preoperative CAN scores as a simple measure of distribution (Figure 1). We also examined the cumulative proportion of patients at each preoperative CAN 1-year mortality score.
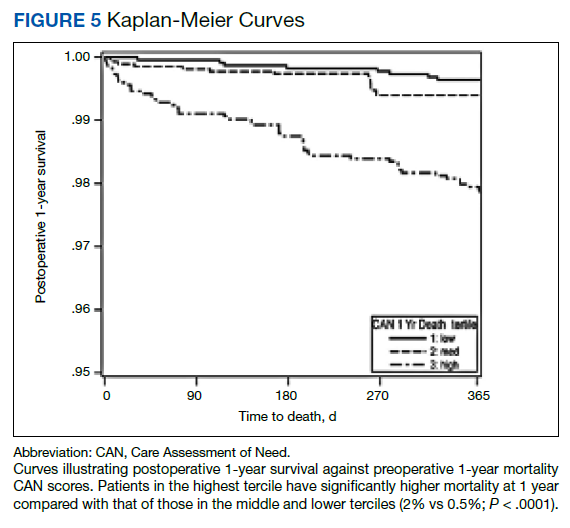
Using a conventional t test, we compared means of preoperative CAN 1-year mortality scores in patients who survived vs those who died within 1 year. We also constructed a plot of the proportion of patients who had died within 1 year vs preoperative CAN 1-year mortality scores. Kaplan-Meier curves were then constructed examining 1-year survival by CAN 1-year mortality score by terciles.
Finally, we examined the relationship between preoperative CAN 1-year mortality scores and index LOS in 2 ways: We plotted LOS across CAN scores, and we constructed a
Results
We identified 8206 patients who had undergone a TKR over the 18-month study period. The overall mean (SD) for age was 65 (8.41) years; 93% were male, and 78% were White veterans. Patient demographics are well described in a previous publication.16,17
In terms of model parameters for the CAN score models, C-statistics for the 90-day outcome models were as follows: 0.833 for the model predicting hospitalization (95% CI, 0.832-0.834); 0.865 for the model predicting death (95% CI, 0.863-0.876); and 0.811 for the model predicting either event (95% CI, 0.810-0.812). C-statistics for the 1-year outcome models were 0.809 for the model predicting hospitalization (95% CI, 0.808-0.810); 0.851 for the model predicting death (95% CI, 0.849-0.852); and 0.787 for the model predicting either event (95% CI, 0.786-0.787). Models were well calibrated with α = 0 and β = 1, demonstrating strong agreement between observed and predicted event rates.
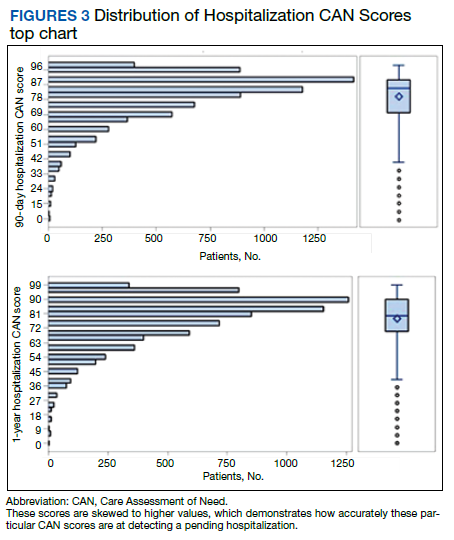
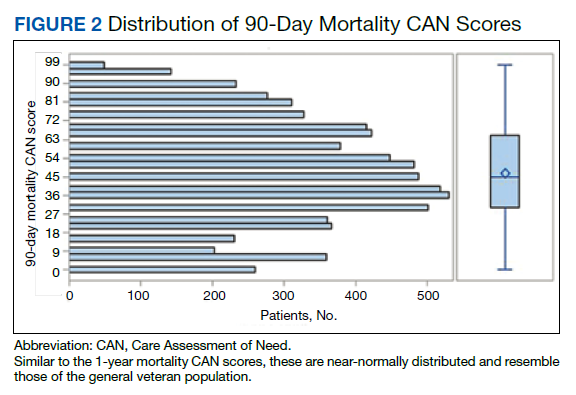
The distribution of preoperative CAN 1-year mortality scores was close to normal (median, 50; interquartile range, 40; mean [SD] 48 [25.6]) (eTable). The original CAN score models were developed having an equal number of patients in each strata and as such, are normally distributed.12 Our cohort was similar in pattern of distribution. Distributions of the remaining preoperative CAN scores (90-day mortality, 1-year hospitalization, 90-day hospitalization) are shown in Figures 2, 3, and 4. Not surprisingly, histograms for both 90-day and 1-year hospitalization were skewed toward higher scores, indicating that these patients were expected to be hospitalized in the near future.
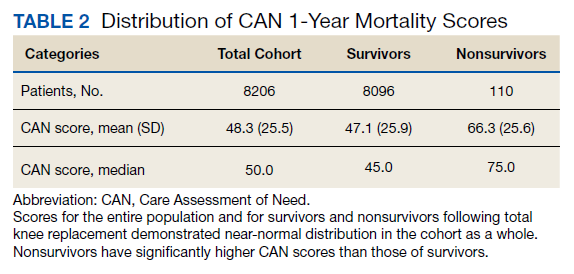
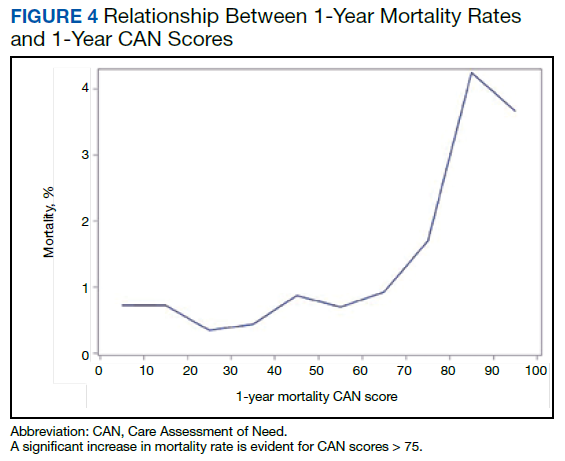
Overall, 1.4% (110/8096) of patients died within 1 year of surgery. Comparing 1-year mortality CAN scores in survivors vs nonsurvivors, we found statistically significant differences in means (47 vs 66 respectively, P < .001) and medians (45 vs 75 respectively, P < .001) (Table 2). In the plot examining the relationship between preoperative 1-year mortality CAN scores and 1-year mortality, the percentage who died within 1 year increased initially for patients with CAN scores > 60 and again exponentially for patients with CAN scores > 80. Examining Kaplan-Meier curves, we found that survivors and nonsurvivors separated early after surgery, and the differences between the top tercile and the middle/lower terciles were statistically significant (P < .001). Mortality rates were about 0.5% in the lower and middle terciles but about 2% in the upper tercile (Figure 5).
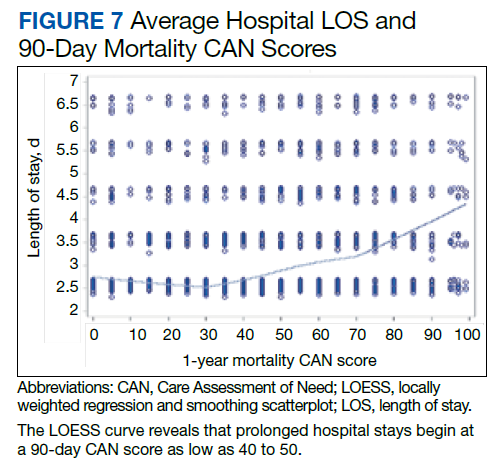
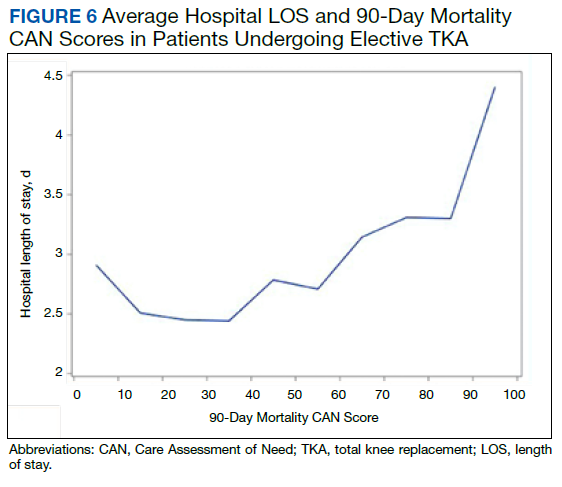
In the plot examining the relationship between CAN scores and index LOS, the LOS rose significantly beyond a CAN score of 60 and dramatically beyond a CAN score of 80 (Figure 6). LOESS curves also showed 2 inflection points suggesting an incremental and sequential rise in the LOS with increasing CAN scores (Figure 7). Mean (SD) LOS in days for the lowest to highest terciles was 2.6 (1.7), 2.8 (2.1), and 3.6 (2.2), respectively.
Discussion
CAN scores are automatically generated each week by EHR-based multivariable risk models. These scores have excellent predictive accuracy for 90-day and 1-year mortality and hospitalization and are routinely used by VHA primary care teams to assist with clinical operations.13 We studied the distribution of CAN 1-year mortality scores in a preoperative context and examined relationships of the preoperative CAN 1-year mortality scores with postoperative mortality and LOS in 8206 veterans who underwent TKR.
There are several noteworthy findings. First, the overall 1-year mortality rate observed following TKR (1.4%) was similar to other published reports.18,19 Not surprisingly, preoperative CAN 1-year mortality scores were significantly higher in veterans who died compared with those of survivors. The majority of patients who died had a preoperative CAN 1-year mortality score > 75 while most who survived had a preoperative CAN 1-year mortality score < 45 (P < .001). Interestingly, the same scores showed a nonlinear correlation with LOS. Index LOS was about 4 days in patients in the highest tercile of CAN scores vs 2.5 days in the lowest tercile, but the initial increase in LOS was detected at a CAN score of about 55 to 60.
In addition, mortality rate varied widely in different segments of the population when grouped according to preoperative CAN scores. One-year mortality rates in the highest tercile reached 2%, about 4-fold higher than that of lower terciles (0.5%). Examination of the Kaplan-Meier curves showed that this difference in mortality between the highest tercile and the lower 2 groups appears soon after discharge and continues to increase over time, suggesting that the factors contributing to the increased mortality are present at the time of discharge and persist beyond the postoperative period. In summary, although CAN scores were not designed for use in the perioperative context, we found that preoperative CAN 1-year mortality scores are broadly predictive of mortality, but especially for increases in LOS following elective TKA, both increases in hospital LOS following elective TKA and mortality over the year after TKA.
Our findings raise several important questions. The decision to undergo elective surgery is complex. Arguably, individuals who undergo elective knee replacement should be healthy enough to undergo, recover, and reap the benefits from a procedure that does not extend life. The distribution of preoperative CAN 1-year mortality scores for our study population was similar to that of the general VHA enrollee population with similar measured mortality rates (≤ 0.5% vs ≥ 1.7% in the low and high terciles, respectively).1 Further study comparing outcomes in matched cohorts who did and did not undergo joint replacement would be of interest. In lieu of this, though, the association of high but not extreme CAN scores with increased hospital LOS may potentially be used to guide allocation of resources to this group, obviating the increased cost and risk to which this group is exposed. And the additional insight afforded by CAN scores may enhance shared decision-making models by identifying patients at the very highest risk (eg, 1-year mortality CAN score ≥ 90), patients who conceivably might not survive long enough to recover from and enjoy their reconstructed knee, who might in the long run be harmed by undergoing the procedure.
Many total joint arthroplasties are performed in older patients, a population in which frailty is increasingly recognized as a significant risk factor for poor outcomes.20,21 CAN scores reliably identify high-risk patients and have been shown to correlate with frailty in this group.22 Multiple authors have reported improved outcomes with cost reductions after implementation of programs targeting modifiable risk factors in high-risk surgical candidates.23-25 A preoperative assessment that includes the CAN score may be valuable in identifying patients who would benefit most from prehabilitation programs or other interventions designed to blunt the impact of frailty. It is true that many elements used to calculate the CAN score would not be considered modifiable, especially in the short term. However, specific contributors to frailty, such as nutritional status and polypharmacy might be potential candidates. As with all multivariable risk prediction models, there are multiple paths to a high CAN score, and further research to identify clinically relevant subgroups may help inform efforts to improve perioperative care within this population.
Hospital LOS is of intense interest for many reasons, not least its utility as a surrogate for cost and increased risk for immediate perioperative adverse events, such as multidrug-resistant hospital acquired infections, need for postacute facility-based rehabilitation, and deconditioning that increase risks of falls and fractures in the older population.26-29 In addition, its importance is magnified due to the COVID-19 pandemic context in which restarting elective surgery programs has changed traditional criteria by which patients are scheduled for surgery.
We have shown that elevated CAN scores are able to identify patients at risk for extended hospital stays and, as such, may be useful additional data in allocating scarce operating room time and other resources for optimal patient and health care provider safety.30,31 Individual surgeons and hospital systems would, of course, decide which patients should be triaged to go first, based on local priorities; however, choosing lower risk patients with minimal risk of morbidity and mortality while pursuing prehabilitation for higher risk patients is a reasonable approach.
Limitations
Our study has several limitations. Only a single surgical procedure was included, albeit the most common one performed in the VHA. In addition, no information was available concerning the precise clinical course for these patients, such as the duration of surgery, anesthetic technique, and management of acute, perioperative course. Although the assumption was made that patients received standard care in a manner such that these factors would not significantly affect either their mortality or their LOS out of proportion to their preoperative clinical status, confounding cannot be excluded. Therefore, further study is necessary to determine whether CAN scores can accurately predict mortality and/or LOS for patients undergoing other procedures. Further, a clinical trial is required to assess whether systematic provision of the CAN score at the point of surgery would impact care and, more important, impact outcomes. In addition, multivariable analyses were not performed, including and excluding various components of the CAN score models. Currently, CAN scores could be made available to the surgical/anesthesia communities at minimal or no cost and are updated automatically. Model calibration and discrimination in this particular setting were not validated.
Because our interest is in leveraging an existing resource to a current clinical and operational problem rather than in creating or validating a new tool, we chose to test the simple bivariate relationship between preoperative CAN scores and outcomes. We chose the preoperative 1-year mortality CAN score from among the 4 options under the assumption that long-term survival is the most meaningful of the 4 candidate outcomes. Finally, while the CAN scores are currently only calculated and generated for patients cared for within the VHA, few data elements are unavailable to civilian health systems. The most problematic would be documentation of actual prescription filling, but this is a topic of increasing interest to the medical and academic communities and access to such information we hope will improve.32-34
Conclusions
Although designed for use by VHA primary care teams, CAN scores also may have value for perioperative clinicians, predicting mortality and prolonged hospital LOS in those with elevated 1-year mortality scores. Advantages of CAN scores relative to other perioperative risk calculators lies in their ability to predict long-term rather than 30-day survival and that they are automatically generated on a near-real-time basis for all patients who receive care in VHA ambulatory clinics. Further study is needed to determine practical utility in shared decision making, preoperative evaluation and optimization, and perioperative resource allocation.
Acknowledgments
This work was supported by the US Department of Veterans Affairs (VA) National Center for Patient Safety, Field Office 10A4E, through the Patient Safety Center of Inquiry at the Durham VA Medical Center in North Carolina. The study also received support from the Center of Innovation to Accelerate Discovery and Practice Transformation (CIN 13-410) at the Durham VA Health Care System.
1. McNair AGK, MacKichan F, Donovan JL, et al. What surgeons tell patients and what patients want to know before major cancer surgery: a qualitative study. BMC Cancer. 2016;16:258. doi:10.1186/s12885-016-2292-3
2. Grover FL, Hammermeister KE, Burchfiel C. Initial report of the Veterans Administration Preoperative Risk Assessment Study for Cardiac Surgery. Ann Thorac Surg. 1990;50(1):12-26; discussion 27-18. doi:10.1016/0003-4975(90)90073-f
3. Khuri SF, Daley J, Henderson W, et al. The National Veterans Administration Surgical Risk Study: risk adjustment for the comparative assessment of the quality of surgical care. J Am Coll Surg. 1995;180(5):519-531.
4. Glance LG, Lustik SJ, Hannan EL, et al. The Surgical Mortality Probability Model: derivation and validation of a simple simple risk prediction rule for noncardiac surgery. Ann Surg. 2012;255(4):696-702. doi:10.1097/SLA.0b013e31824b45af
5. Keller DS, Kroll D, Papaconstantinou HT, Ellis CN. Development and validation of a methodology to reduce mortality using the veterans affairs surgical quality improvement program risk calculator. J Am Coll Surg. 2017;224(4):602-607. doi:10.1016/j.jamcollsurg.2016.12.033
6. Bilimoria KY, Liu Y, Paruch JL, et al. Development and evaluation of the universal ACS NSQIP surgical risk calculator: a decision aid and informed consent tool for patients and surgeons. J Am Coll Surg. 2013;217(5):833-842.e831-833. doi:10.1016/j.jamcollsurg.2013.07.385
7. Ford MK, Beattie WS, Wijeysundera DN. Systematic review: prediction of perioperative cardiac complications and mortality by the revised cardiac risk index. Ann Intern Med. 2010;152(1):26-35. doi:10.7326/0003-4819-152-1-201001050-00007
8. Gupta PK, Gupta H, Sundaram A, et al. Development and validation of a risk calculator for prediction of cardiac risk after surgery. Circulation. 2011;124(4):381-387. doi:10.1161/CIRCULATIONAHA.110.015701
9. Lee TH, Marcantonio ER, Mangione CM, et al. Derivation and prospective validation of a simple index for prediction of cardiac risk of major noncardiac surgery. Circulation. 1999;100(10):1043-1049. doi:10.1161/01.cir.100.10.1043
10. Smith T, Li X, Nylander W, Gunnar W. Thirty-day postoperative mortality risk estimates and 1-year survival in Veterans Health Administration surgery patients. JAMA Surg. 2016;151(5):417-422. doi:10.1001/jamasurg.2015.4882
11. Damhuis RA, Wijnhoven BP, Plaisier PW, Kirkels WJ, Kranse R, van Lanschot JJ. Comparison of 30-day, 90- day and in-hospital postoperative mortality for eight different cancer types. Br J Surg. 2012;99(8):1149-1154. doi:10.1002/bjs.8813
12. Wang L, Porter B, Maynard C, et al. Predicting risk of hospitalization or death among patients receiving primary care in the Veterans Health Administration. Med Care. 2013;51(4):368-373. doi:10.1016/j.amjcard.2012.06.038
13. Fihn SD, Francis J, Clancy C, et al. Insights from advanced analytics at the Veterans Health Administration. Health Aff (Millwood). 2014;33(7):1203-1211. doi:10.1377/hlthaff.2014.0054
14. Noël PH, Copeland LA, Perrin RA, et al. VHA Corporate Data Warehouse height and weight data: opportunities and challenges for health services research. J Rehabil Res Dev. 2010;47(8):739-750. doi:10.1682/jrrd.2009.08.0110
15. Wong ES, Yoon J, Piegari RI, Rosland AM, Fihn SD, Chang ET. Identifying latent subgroups of high-risk patients using risk score trajectories. J Gen Intern Med. 2018;33(12):2120-2126. doi:10.1007/s11606-018-4653-x
16. Chen Q, Hsia HL, Overman R, et al. Impact of an opioid safety initiative on patients undergoing total knee arthroplasty: a time series analysis. Anesthesiology. 2019;131(2):369-380. doi:10.1097/ALN.0000000000002771
17. Hsia HL, Takemoto S, van de Ven T, et al. Acute pain is associated with chronic opioid use after total knee arthroplasty. Reg Anesth Pain Med. 2018;43(7):705-711. doi:10.1097/AAP.0000000000000831
18. Inacio MCS, Dillon MT, Miric A, Navarro RA, Paxton EW. Mortality after total knee and total hip arthroplasty in a large integrated health care system. Perm J. 2017;21:16-171. doi:10.7812/TPP/16-171
19. Lee QJ, Mak WP, Wong YC. Mortality following primary total knee replacement in public hospitals in Hong Kong. Hong Kong Med J. 2016;22(3):237-241. doi:10.12809/hkmj154712
20. Lin HS, Watts JN, Peel NM, Hubbard RE. Frailty and post-operative outcomes in older surgical patients: a systematic review. BMC Geriatr. 2016;16(1):157. doi:10.1186/s12877-016-0329-8
21. Shinall MC Jr, Arya S, Youk A, et al. Association of preoperative patient frailty and operative stress with postoperative mortality. JAMA Surg. 2019;155(1):e194620. doi:10.1001/jamasurg.2019.4620
22. Ruiz JG, Priyadarshni S, Rahaman Z, et al. Validation of an automatically generated screening score for frailty: the care assessment need (CAN) score. BMC Geriatr. 2018;18(1):106. doi:10.1186/s12877-018-0802-7
23. Bernstein DN, Liu TC, Winegar AL, et al. Evaluation of a preoperative optimization protocol for primary hip and knee arthroplasty patients. J Arthroplasty. 2018;33(12):3642- 3648. doi:10.1016/j.arth.2018.08.018
24. Sodhi N, Anis HK, Coste M, et al. A nationwide analysis of preoperative planning on operative times and postoperative complications in total knee arthroplasty. J Knee Surg. 2019;32(11):1040-1045. doi:10.1055/s-0039-1677790
25. Krause A, Sayeed Z, El-Othmani M, Pallekonda V, Mihalko W, Saleh KJ. Outpatient total knee arthroplasty: are we there yet? (part 1). Orthop Clin North Am. 2018;49(1):1-6. doi:10.1016/j.ocl.2017.08.002
26. Barrasa-Villar JI, Aibar-Remón C, Prieto-Andrés P, Mareca- Doñate R, Moliner-Lahoz J. Impact on morbidity, mortality, and length of stay of hospital-acquired infections by resistant microorganisms. Clin Infect Dis. 2017;65(4):644-652. doi:10.1093/cid/cix411
27. Nikkel LE, Kates SL, Schreck M, Maceroli M, Mahmood B, Elfar JC. Length of hospital stay after hip fracture and risk of early mortality after discharge in New York state: retrospective cohort study. BMJ. 2015;351:h6246. doi:10.1136/bmj.h6246
28. Marfil-Garza BA, Belaunzarán-Zamudio PF, Gulias-Herrero A, et al. Risk factors associated with prolonged hospital length-of-stay: 18-year retrospective study of hospitalizations in a tertiary healthcare center in Mexico. PLoS One. 2018;13(11):e0207203. doi:10.1371/journal.pone.0207203
29. Hirsch CH, Sommers L, Olsen A, Mullen L, Winograd CH. The natural history of functional morbidity in hospitalized older patients. J Am Geriatr Soc. 1990;38(12):1296-1303. doi:10.1111/j.1532-5415.1990.tb03451.x
30. Iyengar KP, Jain VK, Vaish A, Vaishya R, Maini L, Lal H. Post COVID-19: planning strategies to resume orthopaedic surgery -challenges and considerations. J Clin Orthop Trauma. 2020;11(suppl 3):S291-S295. doi:10.1016/j.jcot.2020.04.028
31. O’Connor CM, Anoushiravani AA, DiCaprio MR, Healy WL, Iorio R. Economic recovery after the COVID-19 pandemic: resuming elective orthopedic surgery and total joint arthroplasty. J Arthroplasty. 2020;35(suppl 7):S32-S36. doi:10.1016/j.arth.2020.04.038.
32. Mauseth SA, Skurtveit S, Skovlund E, Langhammer A, Spigset O. Medication use and association with urinary incontinence in women: data from the Norwegian Prescription Database and the HUNT study. Neurourol Urodyn. 2018;37(4):1448-1457. doi:10.1002/nau.23473
33. Sultan RS, Correll CU, Schoenbaum M, King M, Walkup JT, Olfson M. National patterns of commonly prescribed psychotropic medications to young people. J Child Adolesc Psychopharmacol. 2018;28(3):158-165. doi:10.1089/cap.2017.0077
34. McCoy RG, Dykhoff HJ, Sangaralingham L, et al. Adoption of new glucose-lowering medications in the U.S.-the case of SGLT2 inhibitors: nationwide cohort study. Diabetes Technol Ther. 2019;21(12):702-712. doi:10.1089/dia.2019.0213
Risk calculators can be of great value in guiding clinical decision making, patient-centered precision medicine, and resource allocation.1 Several perioperative risk prediction models have emerged in recent decades that estimate specific hazards (eg, cardiovascular complications after noncardiac surgery) with varying accuracy and utility. In the perioperative sphere, the time windows are often limited to an index hospitalization or 30 days following surgery or discharge.2-9 Although longer periods are of interest to patients, families, and health systems, few widely used or validated models are designed to look beyond this very narrow window.10,11 In addition, perioperative risk prediction models do not routinely incorporate parameters of a wide variety of health or demographic domains, such as patterns of health care, health care utilization, or medication use.
In 2013, in response to the need for near real-time information to guide delivery of enhanced care management services, the Veterans Health Administration (VHA) Office of Informatics and Analytics developed automated risk prediction models that used detailed electronic health record (EHR) data. These models were used to report Care Assessment Need (CAN) scores each week for all VHA enrollees and include data from a wide array of health domains. These CAN scores predict the risk for hospitalization, death, or either event within 90 days and 1 year.12,13 Each score is reported as both a predicted probability (0-1) and as a percentile in relation to all other VHA enrollees (a value between 1 and 99).13 The data used to calculate CAN scores are listed in Table 1.12
Surgical procedures or admissions would not be differentiated from nonsurgical admissions or other procedural clinic visits, and as such, it is not possible to isolate the effect of undergoing a surgical procedure from another health-related event on the CAN score. At the same time though, a short-term increase in system utilization caused by an elective surgical procedure such as a total knee replacement (TKR) would presumably be reflected in a change in CAN score, but this has not been studied.
Since their introduction, CAN scores have been routinely accessed by primary care teams and used to facilitate care coordination for thousands of VHA patients. However, these CAN scores are currently not available to VHA surgeons, anesthesiologists, or other perioperative clinicians. In this study, we examine the distributions of preoperative CAN scores and explore the relationships of preoperative CAN 1-year mortality scores with 1-year survival following discharge and length of stay (LOS) during index hospitalization in a cohort of US veterans who underwent TKR, the most common elective operation performed within the VHA system.
Methods
Following approval of the Durham Veterans Affairs Medical Center Institutional Review Board, all necessary data were extracted from the VHA Corporate Data Warehouse (CDW) repository.14 Informed consent was waived due to the minimal risk nature of the study.
We used Current Procedural Terminology codes (27438, 27446, 27447, 27486, 27487, 27488) and International Classification of Diseases, 9th edition clinical modification procedure codes (81.54, 81.55, 81.59, 00.80-00.84) to identify all veterans who had undergone primary or revision TKR between July 2014 and December 2015 in VHA Veterans Integrated Service Network 1 (Maine, Vermont, New Hampshire, Massachusetts, Connecticut, Rhode Island, New York, Pennsylvania, West Virginia, Virginia, North Carolina). Because we focused on outcomes following hospital discharge, patients who died before discharge were excluded from the analysis. Preoperative CAN 1-year mortality score was chosen as the measure under the assumption that long-term survival may be the most meaningful of the 4 possible CAN score measures.
Our primary objective was to determine distribution of preoperative CAN scores in the study population. Our secondary was to study relationships among the preoperative CAN 1-year mortality scores and 1-year mortality and hospital LOS.
Study Variables
For each patient, we extracted the date of index surgery. The primary exposure or independent variable was the CAN score in the week prior to this date. Because prior study has shown that CAN scores trajectories do not significantly change over time, the date-stamped CAN scores in the week before surgery represent what would have been available to clinicians in a preoperative setting.15 Since CAN scores are refreshed and overwritten every week, we extracted archived scores from the CDW.
For the 1-year survival outcome, the primary dependent variable, we queried the vital status files in the CDW for the date of death if applicable. We confirmed survival beyond 1 year by examining vital signs in the CDW for a minimum of 2 independent encounters beyond 1 year after the date of discharge. To compute the index LOS, the secondary outcome, we computed the difference between the date of admission and date of hospital discharge.
Statistical Methods
The parameters and performance of the multivariable logistic regression models developed to compute the various CAN mortality and hospitalization risk scores have been previously described.12 Briefly, Wang and colleagues created parsimonious regression models using backward selection. Model discrimination was evaluated using C (concordance)-statistic. Model calibration was assessed by comparing predicted vs observed event rates by risk deciles and performing Cox proportional hazards regression.
We plotted histograms to display preoperative CAN scores as a simple measure of distribution (Figure 1). We also examined the cumulative proportion of patients at each preoperative CAN 1-year mortality score.
Using a conventional t test, we compared means of preoperative CAN 1-year mortality scores in patients who survived vs those who died within 1 year. We also constructed a plot of the proportion of patients who had died within 1 year vs preoperative CAN 1-year mortality scores. Kaplan-Meier curves were then constructed examining 1-year survival by CAN 1-year mortality score by terciles.
Finally, we examined the relationship between preoperative CAN 1-year mortality scores and index LOS in 2 ways: We plotted LOS across CAN scores, and we constructed a
Results
We identified 8206 patients who had undergone a TKR over the 18-month study period. The overall mean (SD) for age was 65 (8.41) years; 93% were male, and 78% were White veterans. Patient demographics are well described in a previous publication.16,17
In terms of model parameters for the CAN score models, C-statistics for the 90-day outcome models were as follows: 0.833 for the model predicting hospitalization (95% CI, 0.832-0.834); 0.865 for the model predicting death (95% CI, 0.863-0.876); and 0.811 for the model predicting either event (95% CI, 0.810-0.812). C-statistics for the 1-year outcome models were 0.809 for the model predicting hospitalization (95% CI, 0.808-0.810); 0.851 for the model predicting death (95% CI, 0.849-0.852); and 0.787 for the model predicting either event (95% CI, 0.786-0.787). Models were well calibrated with α = 0 and β = 1, demonstrating strong agreement between observed and predicted event rates.
The distribution of preoperative CAN 1-year mortality scores was close to normal (median, 50; interquartile range, 40; mean [SD] 48 [25.6]) (eTable). The original CAN score models were developed having an equal number of patients in each strata and as such, are normally distributed.12 Our cohort was similar in pattern of distribution. Distributions of the remaining preoperative CAN scores (90-day mortality, 1-year hospitalization, 90-day hospitalization) are shown in Figures 2, 3, and 4. Not surprisingly, histograms for both 90-day and 1-year hospitalization were skewed toward higher scores, indicating that these patients were expected to be hospitalized in the near future.
Overall, 1.4% (110/8096) of patients died within 1 year of surgery. Comparing 1-year mortality CAN scores in survivors vs nonsurvivors, we found statistically significant differences in means (47 vs 66 respectively, P < .001) and medians (45 vs 75 respectively, P < .001) (Table 2). In the plot examining the relationship between preoperative 1-year mortality CAN scores and 1-year mortality, the percentage who died within 1 year increased initially for patients with CAN scores > 60 and again exponentially for patients with CAN scores > 80. Examining Kaplan-Meier curves, we found that survivors and nonsurvivors separated early after surgery, and the differences between the top tercile and the middle/lower terciles were statistically significant (P < .001). Mortality rates were about 0.5% in the lower and middle terciles but about 2% in the upper tercile (Figure 5).
In the plot examining the relationship between CAN scores and index LOS, the LOS rose significantly beyond a CAN score of 60 and dramatically beyond a CAN score of 80 (Figure 6). LOESS curves also showed 2 inflection points suggesting an incremental and sequential rise in the LOS with increasing CAN scores (Figure 7). Mean (SD) LOS in days for the lowest to highest terciles was 2.6 (1.7), 2.8 (2.1), and 3.6 (2.2), respectively.
Discussion
CAN scores are automatically generated each week by EHR-based multivariable risk models. These scores have excellent predictive accuracy for 90-day and 1-year mortality and hospitalization and are routinely used by VHA primary care teams to assist with clinical operations.13 We studied the distribution of CAN 1-year mortality scores in a preoperative context and examined relationships of the preoperative CAN 1-year mortality scores with postoperative mortality and LOS in 8206 veterans who underwent TKR.
There are several noteworthy findings. First, the overall 1-year mortality rate observed following TKR (1.4%) was similar to other published reports.18,19 Not surprisingly, preoperative CAN 1-year mortality scores were significantly higher in veterans who died compared with those of survivors. The majority of patients who died had a preoperative CAN 1-year mortality score > 75 while most who survived had a preoperative CAN 1-year mortality score < 45 (P < .001). Interestingly, the same scores showed a nonlinear correlation with LOS. Index LOS was about 4 days in patients in the highest tercile of CAN scores vs 2.5 days in the lowest tercile, but the initial increase in LOS was detected at a CAN score of about 55 to 60.
In addition, mortality rate varied widely in different segments of the population when grouped according to preoperative CAN scores. One-year mortality rates in the highest tercile reached 2%, about 4-fold higher than that of lower terciles (0.5%). Examination of the Kaplan-Meier curves showed that this difference in mortality between the highest tercile and the lower 2 groups appears soon after discharge and continues to increase over time, suggesting that the factors contributing to the increased mortality are present at the time of discharge and persist beyond the postoperative period. In summary, although CAN scores were not designed for use in the perioperative context, we found that preoperative CAN 1-year mortality scores are broadly predictive of mortality, but especially for increases in LOS following elective TKA, both increases in hospital LOS following elective TKA and mortality over the year after TKA.
Our findings raise several important questions. The decision to undergo elective surgery is complex. Arguably, individuals who undergo elective knee replacement should be healthy enough to undergo, recover, and reap the benefits from a procedure that does not extend life. The distribution of preoperative CAN 1-year mortality scores for our study population was similar to that of the general VHA enrollee population with similar measured mortality rates (≤ 0.5% vs ≥ 1.7% in the low and high terciles, respectively).1 Further study comparing outcomes in matched cohorts who did and did not undergo joint replacement would be of interest. In lieu of this, though, the association of high but not extreme CAN scores with increased hospital LOS may potentially be used to guide allocation of resources to this group, obviating the increased cost and risk to which this group is exposed. And the additional insight afforded by CAN scores may enhance shared decision-making models by identifying patients at the very highest risk (eg, 1-year mortality CAN score ≥ 90), patients who conceivably might not survive long enough to recover from and enjoy their reconstructed knee, who might in the long run be harmed by undergoing the procedure.
Many total joint arthroplasties are performed in older patients, a population in which frailty is increasingly recognized as a significant risk factor for poor outcomes.20,21 CAN scores reliably identify high-risk patients and have been shown to correlate with frailty in this group.22 Multiple authors have reported improved outcomes with cost reductions after implementation of programs targeting modifiable risk factors in high-risk surgical candidates.23-25 A preoperative assessment that includes the CAN score may be valuable in identifying patients who would benefit most from prehabilitation programs or other interventions designed to blunt the impact of frailty. It is true that many elements used to calculate the CAN score would not be considered modifiable, especially in the short term. However, specific contributors to frailty, such as nutritional status and polypharmacy might be potential candidates. As with all multivariable risk prediction models, there are multiple paths to a high CAN score, and further research to identify clinically relevant subgroups may help inform efforts to improve perioperative care within this population.
Hospital LOS is of intense interest for many reasons, not least its utility as a surrogate for cost and increased risk for immediate perioperative adverse events, such as multidrug-resistant hospital acquired infections, need for postacute facility-based rehabilitation, and deconditioning that increase risks of falls and fractures in the older population.26-29 In addition, its importance is magnified due to the COVID-19 pandemic context in which restarting elective surgery programs has changed traditional criteria by which patients are scheduled for surgery.
We have shown that elevated CAN scores are able to identify patients at risk for extended hospital stays and, as such, may be useful additional data in allocating scarce operating room time and other resources for optimal patient and health care provider safety.30,31 Individual surgeons and hospital systems would, of course, decide which patients should be triaged to go first, based on local priorities; however, choosing lower risk patients with minimal risk of morbidity and mortality while pursuing prehabilitation for higher risk patients is a reasonable approach.
Limitations
Our study has several limitations. Only a single surgical procedure was included, albeit the most common one performed in the VHA. In addition, no information was available concerning the precise clinical course for these patients, such as the duration of surgery, anesthetic technique, and management of acute, perioperative course. Although the assumption was made that patients received standard care in a manner such that these factors would not significantly affect either their mortality or their LOS out of proportion to their preoperative clinical status, confounding cannot be excluded. Therefore, further study is necessary to determine whether CAN scores can accurately predict mortality and/or LOS for patients undergoing other procedures. Further, a clinical trial is required to assess whether systematic provision of the CAN score at the point of surgery would impact care and, more important, impact outcomes. In addition, multivariable analyses were not performed, including and excluding various components of the CAN score models. Currently, CAN scores could be made available to the surgical/anesthesia communities at minimal or no cost and are updated automatically. Model calibration and discrimination in this particular setting were not validated.
Because our interest is in leveraging an existing resource to a current clinical and operational problem rather than in creating or validating a new tool, we chose to test the simple bivariate relationship between preoperative CAN scores and outcomes. We chose the preoperative 1-year mortality CAN score from among the 4 options under the assumption that long-term survival is the most meaningful of the 4 candidate outcomes. Finally, while the CAN scores are currently only calculated and generated for patients cared for within the VHA, few data elements are unavailable to civilian health systems. The most problematic would be documentation of actual prescription filling, but this is a topic of increasing interest to the medical and academic communities and access to such information we hope will improve.32-34
Conclusions
Although designed for use by VHA primary care teams, CAN scores also may have value for perioperative clinicians, predicting mortality and prolonged hospital LOS in those with elevated 1-year mortality scores. Advantages of CAN scores relative to other perioperative risk calculators lies in their ability to predict long-term rather than 30-day survival and that they are automatically generated on a near-real-time basis for all patients who receive care in VHA ambulatory clinics. Further study is needed to determine practical utility in shared decision making, preoperative evaluation and optimization, and perioperative resource allocation.
Acknowledgments
This work was supported by the US Department of Veterans Affairs (VA) National Center for Patient Safety, Field Office 10A4E, through the Patient Safety Center of Inquiry at the Durham VA Medical Center in North Carolina. The study also received support from the Center of Innovation to Accelerate Discovery and Practice Transformation (CIN 13-410) at the Durham VA Health Care System.
1. McNair AGK, MacKichan F, Donovan JL, et al. What surgeons tell patients and what patients want to know before major cancer surgery: a qualitative study. BMC Cancer. 2016;16:258. doi:10.1186/s12885-016-2292-3
2. Grover FL, Hammermeister KE, Burchfiel C. Initial report of the Veterans Administration Preoperative Risk Assessment Study for Cardiac Surgery. Ann Thorac Surg. 1990;50(1):12-26; discussion 27-18. doi:10.1016/0003-4975(90)90073-f
3. Khuri SF, Daley J, Henderson W, et al. The National Veterans Administration Surgical Risk Study: risk adjustment for the comparative assessment of the quality of surgical care. J Am Coll Surg. 1995;180(5):519-531.
4. Glance LG, Lustik SJ, Hannan EL, et al. The Surgical Mortality Probability Model: derivation and validation of a simple simple risk prediction rule for noncardiac surgery. Ann Surg. 2012;255(4):696-702. doi:10.1097/SLA.0b013e31824b45af
5. Keller DS, Kroll D, Papaconstantinou HT, Ellis CN. Development and validation of a methodology to reduce mortality using the veterans affairs surgical quality improvement program risk calculator. J Am Coll Surg. 2017;224(4):602-607. doi:10.1016/j.jamcollsurg.2016.12.033
6. Bilimoria KY, Liu Y, Paruch JL, et al. Development and evaluation of the universal ACS NSQIP surgical risk calculator: a decision aid and informed consent tool for patients and surgeons. J Am Coll Surg. 2013;217(5):833-842.e831-833. doi:10.1016/j.jamcollsurg.2013.07.385
7. Ford MK, Beattie WS, Wijeysundera DN. Systematic review: prediction of perioperative cardiac complications and mortality by the revised cardiac risk index. Ann Intern Med. 2010;152(1):26-35. doi:10.7326/0003-4819-152-1-201001050-00007
8. Gupta PK, Gupta H, Sundaram A, et al. Development and validation of a risk calculator for prediction of cardiac risk after surgery. Circulation. 2011;124(4):381-387. doi:10.1161/CIRCULATIONAHA.110.015701
9. Lee TH, Marcantonio ER, Mangione CM, et al. Derivation and prospective validation of a simple index for prediction of cardiac risk of major noncardiac surgery. Circulation. 1999;100(10):1043-1049. doi:10.1161/01.cir.100.10.1043
10. Smith T, Li X, Nylander W, Gunnar W. Thirty-day postoperative mortality risk estimates and 1-year survival in Veterans Health Administration surgery patients. JAMA Surg. 2016;151(5):417-422. doi:10.1001/jamasurg.2015.4882
11. Damhuis RA, Wijnhoven BP, Plaisier PW, Kirkels WJ, Kranse R, van Lanschot JJ. Comparison of 30-day, 90- day and in-hospital postoperative mortality for eight different cancer types. Br J Surg. 2012;99(8):1149-1154. doi:10.1002/bjs.8813
12. Wang L, Porter B, Maynard C, et al. Predicting risk of hospitalization or death among patients receiving primary care in the Veterans Health Administration. Med Care. 2013;51(4):368-373. doi:10.1016/j.amjcard.2012.06.038
13. Fihn SD, Francis J, Clancy C, et al. Insights from advanced analytics at the Veterans Health Administration. Health Aff (Millwood). 2014;33(7):1203-1211. doi:10.1377/hlthaff.2014.0054
14. Noël PH, Copeland LA, Perrin RA, et al. VHA Corporate Data Warehouse height and weight data: opportunities and challenges for health services research. J Rehabil Res Dev. 2010;47(8):739-750. doi:10.1682/jrrd.2009.08.0110
15. Wong ES, Yoon J, Piegari RI, Rosland AM, Fihn SD, Chang ET. Identifying latent subgroups of high-risk patients using risk score trajectories. J Gen Intern Med. 2018;33(12):2120-2126. doi:10.1007/s11606-018-4653-x
16. Chen Q, Hsia HL, Overman R, et al. Impact of an opioid safety initiative on patients undergoing total knee arthroplasty: a time series analysis. Anesthesiology. 2019;131(2):369-380. doi:10.1097/ALN.0000000000002771
17. Hsia HL, Takemoto S, van de Ven T, et al. Acute pain is associated with chronic opioid use after total knee arthroplasty. Reg Anesth Pain Med. 2018;43(7):705-711. doi:10.1097/AAP.0000000000000831
18. Inacio MCS, Dillon MT, Miric A, Navarro RA, Paxton EW. Mortality after total knee and total hip arthroplasty in a large integrated health care system. Perm J. 2017;21:16-171. doi:10.7812/TPP/16-171
19. Lee QJ, Mak WP, Wong YC. Mortality following primary total knee replacement in public hospitals in Hong Kong. Hong Kong Med J. 2016;22(3):237-241. doi:10.12809/hkmj154712
20. Lin HS, Watts JN, Peel NM, Hubbard RE. Frailty and post-operative outcomes in older surgical patients: a systematic review. BMC Geriatr. 2016;16(1):157. doi:10.1186/s12877-016-0329-8
21. Shinall MC Jr, Arya S, Youk A, et al. Association of preoperative patient frailty and operative stress with postoperative mortality. JAMA Surg. 2019;155(1):e194620. doi:10.1001/jamasurg.2019.4620
22. Ruiz JG, Priyadarshni S, Rahaman Z, et al. Validation of an automatically generated screening score for frailty: the care assessment need (CAN) score. BMC Geriatr. 2018;18(1):106. doi:10.1186/s12877-018-0802-7
23. Bernstein DN, Liu TC, Winegar AL, et al. Evaluation of a preoperative optimization protocol for primary hip and knee arthroplasty patients. J Arthroplasty. 2018;33(12):3642- 3648. doi:10.1016/j.arth.2018.08.018
24. Sodhi N, Anis HK, Coste M, et al. A nationwide analysis of preoperative planning on operative times and postoperative complications in total knee arthroplasty. J Knee Surg. 2019;32(11):1040-1045. doi:10.1055/s-0039-1677790
25. Krause A, Sayeed Z, El-Othmani M, Pallekonda V, Mihalko W, Saleh KJ. Outpatient total knee arthroplasty: are we there yet? (part 1). Orthop Clin North Am. 2018;49(1):1-6. doi:10.1016/j.ocl.2017.08.002
26. Barrasa-Villar JI, Aibar-Remón C, Prieto-Andrés P, Mareca- Doñate R, Moliner-Lahoz J. Impact on morbidity, mortality, and length of stay of hospital-acquired infections by resistant microorganisms. Clin Infect Dis. 2017;65(4):644-652. doi:10.1093/cid/cix411
27. Nikkel LE, Kates SL, Schreck M, Maceroli M, Mahmood B, Elfar JC. Length of hospital stay after hip fracture and risk of early mortality after discharge in New York state: retrospective cohort study. BMJ. 2015;351:h6246. doi:10.1136/bmj.h6246
28. Marfil-Garza BA, Belaunzarán-Zamudio PF, Gulias-Herrero A, et al. Risk factors associated with prolonged hospital length-of-stay: 18-year retrospective study of hospitalizations in a tertiary healthcare center in Mexico. PLoS One. 2018;13(11):e0207203. doi:10.1371/journal.pone.0207203
29. Hirsch CH, Sommers L, Olsen A, Mullen L, Winograd CH. The natural history of functional morbidity in hospitalized older patients. J Am Geriatr Soc. 1990;38(12):1296-1303. doi:10.1111/j.1532-5415.1990.tb03451.x
30. Iyengar KP, Jain VK, Vaish A, Vaishya R, Maini L, Lal H. Post COVID-19: planning strategies to resume orthopaedic surgery -challenges and considerations. J Clin Orthop Trauma. 2020;11(suppl 3):S291-S295. doi:10.1016/j.jcot.2020.04.028
31. O’Connor CM, Anoushiravani AA, DiCaprio MR, Healy WL, Iorio R. Economic recovery after the COVID-19 pandemic: resuming elective orthopedic surgery and total joint arthroplasty. J Arthroplasty. 2020;35(suppl 7):S32-S36. doi:10.1016/j.arth.2020.04.038.
32. Mauseth SA, Skurtveit S, Skovlund E, Langhammer A, Spigset O. Medication use and association with urinary incontinence in women: data from the Norwegian Prescription Database and the HUNT study. Neurourol Urodyn. 2018;37(4):1448-1457. doi:10.1002/nau.23473
33. Sultan RS, Correll CU, Schoenbaum M, King M, Walkup JT, Olfson M. National patterns of commonly prescribed psychotropic medications to young people. J Child Adolesc Psychopharmacol. 2018;28(3):158-165. doi:10.1089/cap.2017.0077
34. McCoy RG, Dykhoff HJ, Sangaralingham L, et al. Adoption of new glucose-lowering medications in the U.S.-the case of SGLT2 inhibitors: nationwide cohort study. Diabetes Technol Ther. 2019;21(12):702-712. doi:10.1089/dia.2019.0213