User login
Impact of Liraglutide to Semaglutide Conversion on Glycemic Control and Cost Savings at a Veterans Affairs Medical Center
Semaglutide and liraglutide are glucagon-like peptide 1 receptor agonists (GLP-1 RAs) that are approved by the US Food and Drug Administration as subcutaneous injections for patients with type 2 diabetes mellitus (T2DM). Both are recommended by the American Diabetes Association (ADA) as first-line options for patients with concomitant atherosclerotic cardiovascular (CV) disease and exert therapeutic effect via incretin-like mechanisms.1 These agents lower blood glucose levels by stimulating insulin release, increasing the body’s sensitivity to insulin, and inhibiting inappropriate glucagon secretion.2,3 They also slow gastric emptying, resulting in decreased appetite and potential weight loss.4
The SUSTAIN (1-7) trials concluded that semaglutide presented an equivalent safety profile and greater efficacy compared with other GLP-1 RAs, including exenatide and dulaglutide.2 The SUSTAIN-10 open-label, head-to-head trial evaluating 1 mg semaglutide once weekly vs 1.2 mg liraglutide daily concluded that semaglutide was superior in hemoglobin A1c (HbA1c) and body weight reduction compared with liraglutide, with slightly increased gastrointestinal (GI) adverse effects (AEs).5 Similar to the LEADER trial assessing liraglutide, SUSTAIN-6 evaluated semaglutide in patients at increased CV risk and found that compared with placebo, semaglutide decreased rates of serious CV events, such as CV death, myocardial infarction, and stroke and were similar to the CV outcomes in the LEADER trial.2,6 Although initial results of the SUSTAIN-6 trial were thought to be nearly equivalent to the LEADER trial, analyses later published comparing both trials noted that semaglutide had more potent HbA1c lowering and weight loss benefit when compared with liraglutide.2,6 The cardioprotective outcomes of SUSTAIN-6 qualified semaglutide for inclusion in the current ADA Standards of Medical Care recommendations for CV risk reduction.6,7 However, despite the CV safety profile and efficacy associated with semaglutide, the SUSTAIN-6 trial noted an increased risk of diabetic retinopathy (DR) complications in 50 of 1648 patients (3%) treated with semaglutide compared with 29 of 1649 (1.8%) who received placebo (P = .02; hazard ratio, 1.76; 95% CI, 1.11-2.78).6 Of the 79 total patients who experienced retinopathy complications, 66 had retinopathy at baseline (42 of 50 [84%]) in the semaglutide group; 24 of 29 [83%] in the placebo group).6 Worsening of DR became one of the most notable AEs of semaglutide evaluated in clinical trials. This further deemed the effect as a warning in the semaglutide package insert to assist clinicians with treatment decisions.
As part of a US Department of Veterans Affairs (VA) National Lost Opportunity Cost Savings Initiative, which encompasses administrative efforts to promote more cost-effective yet safe and efficacious therapy options for veterans, the Michael E. DeBakey VA Medical Center (MEDVAMC) in Houston, Texas, converted a portion of patients with T2DM established on liraglutide to semaglutide. The 30-day supply cost of the 2-pack liraglutide 6 mg/mL (3 mL) injection pens for the MEDVAMC was $197.64. The 30-day supply cost for the singular multidose semaglutide 0.5 mg/0.375 mL (1.5 mL) injection pen was $115.15. Cost savings for the MEDVAMC facility were initially estimated to reach $642,522.
The subset of patients converted had to have undergone teleretinal imaging and not have a diagnosis of nonproliferative DR (NPDR), proliferative DR (PDR), or PDR with or without
In the fall of 2021, there was also a standing list of patients on liraglutide who were not converted due to a lack of teleretinal imaging. As a result, there was potential for a quality improvement (QI) intervention to target this patient population, which could result in further cost savings for MEDVAMC and improved glycemic control because of increased conversion from liraglutide to semaglutide. The purpose of this project was to perform a QI assessment on this subset of patients both initially converted from liraglutide to semaglutide, and those who were yet to be converted due to a lack of teleretinal imaging to determine the impact on glycemic control and cost savings.
Methods
This QI project was a single-center, prospective cohort study with a retrospective chart review of veterans with T2DM converted from liraglutide to semaglutide at the MEDVAMC. Patient data were collected from the Computerized Patient Record System (CPRS) between March 1, 2021, and November 30, 2021. An initial subset of patients was converted to semaglutide in March and April 2021. Patients initially excluded underwent a second chart review to determine whether they truly met exclusion criteria. Patients who did not have a definitive diagnosis of NPDR or PDR, those due for updated teleretinal imaging, as well as those with updated teleretinal imaging that excluded NPDR or PDR were targeted for clinician education interventions.
Following this intervention, a subset of patients with negative DR findings were converted from liraglutide to semaglutide. Primary care and endocrinology clinicians were notified that patients who met the criteria should be referred for teleretinal imaging if no updated results were present or that patients were eligible for semaglutide conversion based on negative findings. Both patients who were initially converted as well as those converted following education were included for data collection/analysis of glycemic control via HbA1c and blood glucose levels.
Cost savings were evaluated using outpatient pharmacy procurement pricing data. This project was approved by the MEDVAMC Quality Assurance and Regulatory Affairs Office.
Participants
Patients included in the study were adults aged ≥ 18 years with T2DM, converted from liraglutide 0.6 and 1.2 mg daily to semaglutide 0.25 mg weekly (titrated to 0.5 mg weekly after 4 weeks), and had an active prescription for semaglutide, with or without insulin or other oral antihyperglycemics. Patients with NPDR or PDR, type 1 DM, no HbA1c data, no filled semaglutide prescriptions, insulin pumps, and those without teleretinal imaging within the postintervention period or who died during the study period were excluded.
Patient baseline characteristics collected included demographic data, CV comorbidities, antihyperglycemic medications, and changes in insulin doses. Parameters analyzed at baseline and 3 to 12 months postconversion included body weight, HbA1c, and blood glucose levels.
Outcomes
The primary objectives of this QI project were to assess glycemic control (via changes in HbA1c levels) and cost savings following patient conversion from liraglutide to semaglutide. A second objective was to educate clinicians for referral of T2DM patients without teleretinal imaging in the past 2 years.
The purpose of the latter objective was to encourage conversion from liraglutide to semaglutide in the absence of DR. We predicted that 50% of patients with clinician education would be converted. Secondary objectives included assessing body weight differences, evaluating modifications in diabetes regimen, and documenting AEs. We predicted that glycemic control would either remain stable or improve with conversion to semaglutide.
Statistical Analysis
Patient demographic data were analyzed using descriptive statistics. Quantitative data (HbA1c, blood glucose, and body weight differences as continuous variables) were analyzed using a paired Student t test, and categorical variables were analyzed using the χ2 test.
Results

During the study period, 692 patients were identified with active liraglutide prescriptions (Figure). Of these, 49 patients who were initially excluded due to outdated teleretinal imaging or negative findings met the criteria for clinician education, and 14 of those 49 patients (28.6%) were converted from liraglutide to semaglutide. Thirty-three patients (67.3%) did not schedule teleretinal imaging or did not convert to semaglutide following negative teleretinal findings. Two patients (4.1%) either scheduled or proceeded with teleretinal imaging, without any further action from the clinician.
Including the 14 patients converted posteducational intervention, 425 patients were converted to semaglutide. Excluded from analysis were 121 patients: 57 for incomplete HbA1c data or no filled semaglutide prescription; 30 for HbA1c and weight data outside of the study timeframe; 25 died of causes unrelated to the project; 8 had insulin pumps; and 1 was diagnosed with late-onset type 1 DM. The final sample was 304 patients who underwent analysis.

Two hundred seventy-three patients (89.8%) were male, and 180 (59.2%) were White (Table 1). The mean (SD) age of patients was 65.9 (9.6) years, and 236 (77.6%) were established on insulin therapy (either basal, bolus, or a combination). The 3 most common antihyperglycemic agents (other than insulin) that patients used included 185 metformin (60.9%), 104 empagliflozin (34.2%), and 50 glipizide (16.4%) prescriptions.

Most patients had CV disease. Three hundred patients (98.7%) had comorbid hypertension, 298 (98.0%) had hyperlipidemia, and 114 (37.5%) had coronary artery disease (Table 2). Other diseases that patients were concomitantly diagnosed with included peripheral vascular disease, heart failure, history of stroke or transient ischemic attack, and history of myocardial infarction.
Documented AEs included 83 patients (27.3%) with hypoglycemia at any point within 3 to 12 months of conversion and 25 patients (8.2%) with mainly GI-related events, including nausea, vomiting, diarrhea, decreased appetite, and abdominal pain. Six patients (2.0%) had a new diagnosis of DR 3 to 12 months postconversion.
Glycemic Control and Weight Changes

At baseline, mean (SD) HbA1c was 8.1% (1.5), blood glucose was 187.4 (44.2) mg/dL, and body weight was 112.9 (23.0) kg (Table 3). In the timeframe evaluated (3 to 12 months postconversion), patients’ mean (SD) HbA1c was found to have significantly decreased to 7.6% (1.4) (P < .001; 95% CI, -0.7 to -0.3), blood glucose decreased to 172.6 (39.0) mg/dL (P < .001; 95% CI, -19.3 to -10.2), and body weight decreased to 105.2 (32.3) kg (P < .001; 95% CI, -10.6 to -4.8). All parameters evaluated were deemed statistically significant.
Further analyses evaluating specific changes in HbA1c observed postconversion are as follows: 199 patients (65.5%) experienced a decrease, 92 (30.3%) experienced an increase, and 13 (4.3%) experienced no change in their HbA1c.
As the timeframe was fairly broad to assess HbA1c changes, a prespecified subgroup analysis was conducted to determine specific changes in HbA1c within 3 to 6, 6 to 9, and 9 to 12 months postconversion (Table 4). At 3 to 6 months postconversion, patient mean (SD) HbA1c levels significantly decreased from 8.2% (1.5) at baseline to 7.6% (1.3) postconversion (P = .002; 95% CI, -1.0 to -0.2). At 6 to 9 months postconversion, the mean (SD) HbA1c significantly decreased from 8.1% (1.5) at baseline to 7.6% (1.4) postconversion (P = .002; 95% CI, -0.8 to -0.2).
Glucose-Lowering Agent Adjustments

One hundred thirteen patients (37.2%) required no changes to their antihyperglycemic regimen with the conversion, 85 (28.0%) required increased insulin doses, and 77 (25.3%) required decreased insulin doses (Table 5). Forty-five (14.8%) patients underwent discontinuation of either insulin or other antihyperglycemic agents; 44 (14.5%) had other antihyperglycemic agents dose increased, 39 (12.8%) required adding other glucose-lowering agents, 28 (9.2%) discontinued semaglutide, and 10 (3.3%) had other glucose-lowering medication doses decreased.
Cost Savings
Cost savings were evaluated using the MEDVAMC outpatient pharmacy procurement service. The total cost savings per patient per month was $82.49. For the 411 preclinician education patients converted to semaglutide, this resulted in a prospective annual cost savings of $406,840.68. An additional $13,858.32 was saved due to the intervention/clinician education for 14 patients converted to semaglutide. The total annual cost savings was $420,699.00.
Discussion
Overall, glycemic control significantly improved with veterans’ conversion from liraglutide to semaglutide. Not only were significant changes noted with HbA1c levels and weight, but consistencies were noted with mean HbA1c decrease and weight loss expected of GLP-1 RAs noted in clinical trials. The typical range for HbA1c changes expected is -1% to -2% and weight loss of 1 to 6 kg.4,7 Data from the LEAD-5 and SUSTAIN-4 trials, evaluating glycemic control in liraglutide and semaglutide, respectively, have noted comparable yet slightly more potent HbA1c decreases (-1.33% for liraglutide 1.8 mg daily vs -1.2% and -1.6% for semaglutide 0.5 mg and 1 mg weekly, respectively).8,9 However, more robust weight loss has been noted with semaglutide vs liraglutide (-4.62 kg for semaglutide 0.5 mg weekly and -6.33 kg for semaglutide 1 mg weekly vs -3.43 kg for liraglutide 1.8 mg daily).8,9 Results from the SUSTAIN-10 trial also noted mean changes in HbA1c of -1.7% for semaglutide 1 mg weekly vs -1.0% for liraglutide 1.2 mg daily; mean body weight differences were -5.8 kg for semaglutide and -1.9 kg for liraglutide at their respective doses.5 The mean weight loss noted with this QI project is consistent with prior trials of semaglutide.
Of note, 44 patients (14.5%) required the dosage increase of either one or multiple additional glucose-lowering agents at any time point within the 3- to 12-month period. Of those patients, 38 (86.4%) underwent further semaglutide dose titration to 1 mg weekly. Common reasons for a further dose increase to 1 mg weekly were an indication for more robust HbA1c lowering, a desire to decrease patients’ either basal or bolus insulin requirements, or a treatment goal of completely titrating patients off insulin.
It is uncertain why 30.3% of patients experienced an increase in HbA1c and 4.3% experienced no change. However, possibilities for the divergence in HbA1c outcomes in these subsets of patients may include suboptimal adherence to semaglutide or other antihyperglycemic agents as indicated by clinicians or nonadherence to dietary and lifestyle modifications.
Most patients (65.5%) experienced a decrease in HbA1c because of conversion to semaglutide, and
At the MEDVAMC, liraglutide is a nonformulary agent and semaglutide is now the formulary-preferred option. For patients with uncontrolled T2DM, if a GLP-1 RA is desired for therapy, clinicians are to place a prior authorization drug request (PADR) consultation for semaglutide for further evaluation and review of VA Criteria for Use (CFU) by clinical pharmacist practitioners. Liraglutide is the alternative option if patients do not meet the CFU for semaglutide (ie, have a diagnosis of DR among other exclusions). However, the semaglutide CFU was updated in April 2022 to exclude those specifically diagnosed with PDR, severe NPDR, and macular edema unless an ophthalmologist deems semaglutide acceptable. This indicates that patients with mild-to-moderate NPDR (who were originally excluded from this QI project) are now eligible to receive semaglutide. The incidence of new DR diagnoses (2%) observed in this study could indicate an unclear relationship between semaglutide and increased rates of DR; however, no definitive correlation can be established due to the retrospective nature of this project. The implications of the results of this QI project in relation to the updated CFU remain undetermined.
Due to the comparable improvements in HbA1c and more robust weight loss noted with semaglutide vs liraglutide, we deem it appropriate to select semaglutide as the more cost-efficient GLP-1 RA and formulary preferred option. The data of this QI project supports the overall safety and treatment utility of this option. Although significant cost savings were achieved (> $400,000), the long-term benefit of the liraglutide to semaglutide conversion remains unknown.
Strengths and Limitations
Strengths of this project include the large sample size, its setting in a large VA medical center, and the evaluation of multiple outcomes beyond HbA1c for assessment of glycemic control (ie, mean blood glucose, insulin titration, and dose adjustment of other glucose-lowering agents).
Limitations of this study include the retrospective chart review used for data collection, limited accuracy of objective data due to the COVID-19 pandemic, and inconsistencies with documentation in patients’ electronic health records. As a protective measure in the height of the pandemic between March 2021 and November 2021, the VA promoted using telephone and virtual-visit clinics to minimize exposure for patients with nonurgent follow-up needs. Patient hesitance to present to the clinic in person due to COVID-19 was also a significant factor in obtaining objective follow-up data. As a result, less accurate and timely baseline and postconversion weight and HbA1c data resulted, leading to our decision to extend the timeframe evaluated postconversion to 3 to 12 months. We also noted inconsistencies with documentation in CPRS. Unless veterans were closely followed by clinical pharmacist practitioners or endocrine consultation service clinicians, it was more difficult to follow and document trends of insulin titration to assess the impact of semaglutide conversion. The number of AEs, including hypoglycemia and GI intolerance, were also not consistently documented within the CPRS, and the frequency of AEs may be underestimated.
Another possible limitation regarding the interpretation of the results includes the portion of patients titrated up to semaglutide 1 mg weekly. As the focal point of this project was to review changes in glycemic control in the conversion to semaglutide 0.5 mg, this population of patients converted to 1 mg could potentially overestimate the HbA1c and weight changes described, as it is consistent with the SUSTAIN trials that show more robust decreases in those parameters described earlier.
Conclusions
A subset of patients with T2DM converted from liraglutide to semaglutide experienced significant changes in glycemic control and body weight. Significant differences were noted for a decreased HbA1c, decreased mean blood glucose, and weight loss. A fair portion of patients’ antihyperglycemic regimens required no changes on conversion to semaglutide. Although the semaglutide discontinuation rate neared 10%, AEs that may have contributed to this discontinuation rate included hypoglycemia and GI intolerance. Clinician education resulted in a substantial number of patients undergoing teleretinal imaging and further conversion to semaglutide; however, due to the low conversion response rate, a more effective method of educating clinicians is warranted. Although the semaglutide cost savings initiative at MEDVAMC resulted in significant savings, a full cost-effective analysis is needed to assess more comprehensive institution savings.
1. ElSayed NA, Aleppo G, Aroda VR, et al. 9. Pharmacologic Approaches to Glycemic Treatment: Standards of Care in Diabetes-2023. Diabetes Care. 2023;46(suppl 1):S140-S157. doi:10.2337/dc23-S009
2. Aroda VR, Ahmann A, Cariou B, et al. Comparative efficacy, safety, and cardiovascular outcome with once-weekly subcutaneous semaglutide in the treatment of type 2 diabetes: insights from the SUSTAIN 1-7 trials. Diabetes Metab. 2019;45(5):409-418. doi:10.1016/j.diabet.2018.12.001
3. Trujillo JM, Nuffer W, Smith BA. GLP-1 receptor agonists: an updated review of head-to-head clinical studies. Ther Adv Endocrinol Metab. 2021;12:2042018821997320. Published 2021 Mar 9. doi:10.1177/2042018821997320
4. Drucker DJ. Mechanisms of action and therapeutic application of glucagon-like peptide-1. Cell Metab. 2018;27(4):740-756. doi:10.1016/j.cmet.2018.03.001
5. Capehorn MS, Catarig AM, Furberg JK, et al. Efficacy and safety of once-weekly semaglutide 1.0mg vs once-daily liraglutide 1.2mg as add-on to 1-3 oral antidiabetic drugs in subjects with type 2 diabetes (SUSTAIN 10). Diabetes Metab. 2020;46(2):100-109. doi:10.1016/j.diabet.2019.101117
6. Marso SP, Bain SC, Consoli A, et al; SUSTAIN-6 Investigators. Semaglutide and cardiovascular outcomes in patients with type 2 diabetes. N Engl J Med. 2016;375(19):1834-1844. doi:10.1056/NEJMoa1607141
7. ElSayed NA, Aleppo G, Aroda VR, et al. 10. Cardiovascular Disease and Risk Management: Standards of Care in Diabetes-2023. Diabetes Care. 2023;46(suppl 1):S158-S190. doi:10.2337/dc23-S010
8. Russell-Jones D, Vaag A, Schmitz O, et al. Liraglutide vs insulin glargine and placebo in combination with metformin and sulfonylurea therapy in type 2 diabetes mellitus (LEAD-5 met+SU): a randomised controlled trial. Diabetologia. 2009;52(10):2046-2055. doi:10.1007/s00125-009-1472-y
9. Aroda VR, Bain SC, Cariou B, et al. Efficacy and safety of once-weekly semaglutide versus once-daily insulin glargine as add-on to metformin (with or without sulfonylureas) in insulin-naive patients with type 2 diabetes (SUSTAIN 4): a randomised, open-label, parallel-group, multicentre, multinational, phase 3a trial. Lancet Diabetes Endocrinol. 2017;5(5):355-366. doi:10.1016/S2213-8587(17)30085-2
Semaglutide and liraglutide are glucagon-like peptide 1 receptor agonists (GLP-1 RAs) that are approved by the US Food and Drug Administration as subcutaneous injections for patients with type 2 diabetes mellitus (T2DM). Both are recommended by the American Diabetes Association (ADA) as first-line options for patients with concomitant atherosclerotic cardiovascular (CV) disease and exert therapeutic effect via incretin-like mechanisms.1 These agents lower blood glucose levels by stimulating insulin release, increasing the body’s sensitivity to insulin, and inhibiting inappropriate glucagon secretion.2,3 They also slow gastric emptying, resulting in decreased appetite and potential weight loss.4
The SUSTAIN (1-7) trials concluded that semaglutide presented an equivalent safety profile and greater efficacy compared with other GLP-1 RAs, including exenatide and dulaglutide.2 The SUSTAIN-10 open-label, head-to-head trial evaluating 1 mg semaglutide once weekly vs 1.2 mg liraglutide daily concluded that semaglutide was superior in hemoglobin A1c (HbA1c) and body weight reduction compared with liraglutide, with slightly increased gastrointestinal (GI) adverse effects (AEs).5 Similar to the LEADER trial assessing liraglutide, SUSTAIN-6 evaluated semaglutide in patients at increased CV risk and found that compared with placebo, semaglutide decreased rates of serious CV events, such as CV death, myocardial infarction, and stroke and were similar to the CV outcomes in the LEADER trial.2,6 Although initial results of the SUSTAIN-6 trial were thought to be nearly equivalent to the LEADER trial, analyses later published comparing both trials noted that semaglutide had more potent HbA1c lowering and weight loss benefit when compared with liraglutide.2,6 The cardioprotective outcomes of SUSTAIN-6 qualified semaglutide for inclusion in the current ADA Standards of Medical Care recommendations for CV risk reduction.6,7 However, despite the CV safety profile and efficacy associated with semaglutide, the SUSTAIN-6 trial noted an increased risk of diabetic retinopathy (DR) complications in 50 of 1648 patients (3%) treated with semaglutide compared with 29 of 1649 (1.8%) who received placebo (P = .02; hazard ratio, 1.76; 95% CI, 1.11-2.78).6 Of the 79 total patients who experienced retinopathy complications, 66 had retinopathy at baseline (42 of 50 [84%]) in the semaglutide group; 24 of 29 [83%] in the placebo group).6 Worsening of DR became one of the most notable AEs of semaglutide evaluated in clinical trials. This further deemed the effect as a warning in the semaglutide package insert to assist clinicians with treatment decisions.
As part of a US Department of Veterans Affairs (VA) National Lost Opportunity Cost Savings Initiative, which encompasses administrative efforts to promote more cost-effective yet safe and efficacious therapy options for veterans, the Michael E. DeBakey VA Medical Center (MEDVAMC) in Houston, Texas, converted a portion of patients with T2DM established on liraglutide to semaglutide. The 30-day supply cost of the 2-pack liraglutide 6 mg/mL (3 mL) injection pens for the MEDVAMC was $197.64. The 30-day supply cost for the singular multidose semaglutide 0.5 mg/0.375 mL (1.5 mL) injection pen was $115.15. Cost savings for the MEDVAMC facility were initially estimated to reach $642,522.
The subset of patients converted had to have undergone teleretinal imaging and not have a diagnosis of nonproliferative DR (NPDR), proliferative DR (PDR), or PDR with or without
In the fall of 2021, there was also a standing list of patients on liraglutide who were not converted due to a lack of teleretinal imaging. As a result, there was potential for a quality improvement (QI) intervention to target this patient population, which could result in further cost savings for MEDVAMC and improved glycemic control because of increased conversion from liraglutide to semaglutide. The purpose of this project was to perform a QI assessment on this subset of patients both initially converted from liraglutide to semaglutide, and those who were yet to be converted due to a lack of teleretinal imaging to determine the impact on glycemic control and cost savings.
Methods
This QI project was a single-center, prospective cohort study with a retrospective chart review of veterans with T2DM converted from liraglutide to semaglutide at the MEDVAMC. Patient data were collected from the Computerized Patient Record System (CPRS) between March 1, 2021, and November 30, 2021. An initial subset of patients was converted to semaglutide in March and April 2021. Patients initially excluded underwent a second chart review to determine whether they truly met exclusion criteria. Patients who did not have a definitive diagnosis of NPDR or PDR, those due for updated teleretinal imaging, as well as those with updated teleretinal imaging that excluded NPDR or PDR were targeted for clinician education interventions.
Following this intervention, a subset of patients with negative DR findings were converted from liraglutide to semaglutide. Primary care and endocrinology clinicians were notified that patients who met the criteria should be referred for teleretinal imaging if no updated results were present or that patients were eligible for semaglutide conversion based on negative findings. Both patients who were initially converted as well as those converted following education were included for data collection/analysis of glycemic control via HbA1c and blood glucose levels.
Cost savings were evaluated using outpatient pharmacy procurement pricing data. This project was approved by the MEDVAMC Quality Assurance and Regulatory Affairs Office.
Participants
Patients included in the study were adults aged ≥ 18 years with T2DM, converted from liraglutide 0.6 and 1.2 mg daily to semaglutide 0.25 mg weekly (titrated to 0.5 mg weekly after 4 weeks), and had an active prescription for semaglutide, with or without insulin or other oral antihyperglycemics. Patients with NPDR or PDR, type 1 DM, no HbA1c data, no filled semaglutide prescriptions, insulin pumps, and those without teleretinal imaging within the postintervention period or who died during the study period were excluded.
Patient baseline characteristics collected included demographic data, CV comorbidities, antihyperglycemic medications, and changes in insulin doses. Parameters analyzed at baseline and 3 to 12 months postconversion included body weight, HbA1c, and blood glucose levels.
Outcomes
The primary objectives of this QI project were to assess glycemic control (via changes in HbA1c levels) and cost savings following patient conversion from liraglutide to semaglutide. A second objective was to educate clinicians for referral of T2DM patients without teleretinal imaging in the past 2 years.
The purpose of the latter objective was to encourage conversion from liraglutide to semaglutide in the absence of DR. We predicted that 50% of patients with clinician education would be converted. Secondary objectives included assessing body weight differences, evaluating modifications in diabetes regimen, and documenting AEs. We predicted that glycemic control would either remain stable or improve with conversion to semaglutide.
Statistical Analysis
Patient demographic data were analyzed using descriptive statistics. Quantitative data (HbA1c, blood glucose, and body weight differences as continuous variables) were analyzed using a paired Student t test, and categorical variables were analyzed using the χ2 test.
Results
During the study period, 692 patients were identified with active liraglutide prescriptions (Figure). Of these, 49 patients who were initially excluded due to outdated teleretinal imaging or negative findings met the criteria for clinician education, and 14 of those 49 patients (28.6%) were converted from liraglutide to semaglutide. Thirty-three patients (67.3%) did not schedule teleretinal imaging or did not convert to semaglutide following negative teleretinal findings. Two patients (4.1%) either scheduled or proceeded with teleretinal imaging, without any further action from the clinician.
Including the 14 patients converted posteducational intervention, 425 patients were converted to semaglutide. Excluded from analysis were 121 patients: 57 for incomplete HbA1c data or no filled semaglutide prescription; 30 for HbA1c and weight data outside of the study timeframe; 25 died of causes unrelated to the project; 8 had insulin pumps; and 1 was diagnosed with late-onset type 1 DM. The final sample was 304 patients who underwent analysis.
Two hundred seventy-three patients (89.8%) were male, and 180 (59.2%) were White (Table 1). The mean (SD) age of patients was 65.9 (9.6) years, and 236 (77.6%) were established on insulin therapy (either basal, bolus, or a combination). The 3 most common antihyperglycemic agents (other than insulin) that patients used included 185 metformin (60.9%), 104 empagliflozin (34.2%), and 50 glipizide (16.4%) prescriptions.
Most patients had CV disease. Three hundred patients (98.7%) had comorbid hypertension, 298 (98.0%) had hyperlipidemia, and 114 (37.5%) had coronary artery disease (Table 2). Other diseases that patients were concomitantly diagnosed with included peripheral vascular disease, heart failure, history of stroke or transient ischemic attack, and history of myocardial infarction.
Documented AEs included 83 patients (27.3%) with hypoglycemia at any point within 3 to 12 months of conversion and 25 patients (8.2%) with mainly GI-related events, including nausea, vomiting, diarrhea, decreased appetite, and abdominal pain. Six patients (2.0%) had a new diagnosis of DR 3 to 12 months postconversion.
Glycemic Control and Weight Changes
At baseline, mean (SD) HbA1c was 8.1% (1.5), blood glucose was 187.4 (44.2) mg/dL, and body weight was 112.9 (23.0) kg (Table 3). In the timeframe evaluated (3 to 12 months postconversion), patients’ mean (SD) HbA1c was found to have significantly decreased to 7.6% (1.4) (P < .001; 95% CI, -0.7 to -0.3), blood glucose decreased to 172.6 (39.0) mg/dL (P < .001; 95% CI, -19.3 to -10.2), and body weight decreased to 105.2 (32.3) kg (P < .001; 95% CI, -10.6 to -4.8). All parameters evaluated were deemed statistically significant.
Further analyses evaluating specific changes in HbA1c observed postconversion are as follows: 199 patients (65.5%) experienced a decrease, 92 (30.3%) experienced an increase, and 13 (4.3%) experienced no change in their HbA1c.
As the timeframe was fairly broad to assess HbA1c changes, a prespecified subgroup analysis was conducted to determine specific changes in HbA1c within 3 to 6, 6 to 9, and 9 to 12 months postconversion (Table 4). At 3 to 6 months postconversion, patient mean (SD) HbA1c levels significantly decreased from 8.2% (1.5) at baseline to 7.6% (1.3) postconversion (P = .002; 95% CI, -1.0 to -0.2). At 6 to 9 months postconversion, the mean (SD) HbA1c significantly decreased from 8.1% (1.5) at baseline to 7.6% (1.4) postconversion (P = .002; 95% CI, -0.8 to -0.2).
Glucose-Lowering Agent Adjustments
One hundred thirteen patients (37.2%) required no changes to their antihyperglycemic regimen with the conversion, 85 (28.0%) required increased insulin doses, and 77 (25.3%) required decreased insulin doses (Table 5). Forty-five (14.8%) patients underwent discontinuation of either insulin or other antihyperglycemic agents; 44 (14.5%) had other antihyperglycemic agents dose increased, 39 (12.8%) required adding other glucose-lowering agents, 28 (9.2%) discontinued semaglutide, and 10 (3.3%) had other glucose-lowering medication doses decreased.
Cost Savings
Cost savings were evaluated using the MEDVAMC outpatient pharmacy procurement service. The total cost savings per patient per month was $82.49. For the 411 preclinician education patients converted to semaglutide, this resulted in a prospective annual cost savings of $406,840.68. An additional $13,858.32 was saved due to the intervention/clinician education for 14 patients converted to semaglutide. The total annual cost savings was $420,699.00.
Discussion
Overall, glycemic control significantly improved with veterans’ conversion from liraglutide to semaglutide. Not only were significant changes noted with HbA1c levels and weight, but consistencies were noted with mean HbA1c decrease and weight loss expected of GLP-1 RAs noted in clinical trials. The typical range for HbA1c changes expected is -1% to -2% and weight loss of 1 to 6 kg.4,7 Data from the LEAD-5 and SUSTAIN-4 trials, evaluating glycemic control in liraglutide and semaglutide, respectively, have noted comparable yet slightly more potent HbA1c decreases (-1.33% for liraglutide 1.8 mg daily vs -1.2% and -1.6% for semaglutide 0.5 mg and 1 mg weekly, respectively).8,9 However, more robust weight loss has been noted with semaglutide vs liraglutide (-4.62 kg for semaglutide 0.5 mg weekly and -6.33 kg for semaglutide 1 mg weekly vs -3.43 kg for liraglutide 1.8 mg daily).8,9 Results from the SUSTAIN-10 trial also noted mean changes in HbA1c of -1.7% for semaglutide 1 mg weekly vs -1.0% for liraglutide 1.2 mg daily; mean body weight differences were -5.8 kg for semaglutide and -1.9 kg for liraglutide at their respective doses.5 The mean weight loss noted with this QI project is consistent with prior trials of semaglutide.
Of note, 44 patients (14.5%) required the dosage increase of either one or multiple additional glucose-lowering agents at any time point within the 3- to 12-month period. Of those patients, 38 (86.4%) underwent further semaglutide dose titration to 1 mg weekly. Common reasons for a further dose increase to 1 mg weekly were an indication for more robust HbA1c lowering, a desire to decrease patients’ either basal or bolus insulin requirements, or a treatment goal of completely titrating patients off insulin.
It is uncertain why 30.3% of patients experienced an increase in HbA1c and 4.3% experienced no change. However, possibilities for the divergence in HbA1c outcomes in these subsets of patients may include suboptimal adherence to semaglutide or other antihyperglycemic agents as indicated by clinicians or nonadherence to dietary and lifestyle modifications.
Most patients (65.5%) experienced a decrease in HbA1c because of conversion to semaglutide, and
At the MEDVAMC, liraglutide is a nonformulary agent and semaglutide is now the formulary-preferred option. For patients with uncontrolled T2DM, if a GLP-1 RA is desired for therapy, clinicians are to place a prior authorization drug request (PADR) consultation for semaglutide for further evaluation and review of VA Criteria for Use (CFU) by clinical pharmacist practitioners. Liraglutide is the alternative option if patients do not meet the CFU for semaglutide (ie, have a diagnosis of DR among other exclusions). However, the semaglutide CFU was updated in April 2022 to exclude those specifically diagnosed with PDR, severe NPDR, and macular edema unless an ophthalmologist deems semaglutide acceptable. This indicates that patients with mild-to-moderate NPDR (who were originally excluded from this QI project) are now eligible to receive semaglutide. The incidence of new DR diagnoses (2%) observed in this study could indicate an unclear relationship between semaglutide and increased rates of DR; however, no definitive correlation can be established due to the retrospective nature of this project. The implications of the results of this QI project in relation to the updated CFU remain undetermined.
Due to the comparable improvements in HbA1c and more robust weight loss noted with semaglutide vs liraglutide, we deem it appropriate to select semaglutide as the more cost-efficient GLP-1 RA and formulary preferred option. The data of this QI project supports the overall safety and treatment utility of this option. Although significant cost savings were achieved (> $400,000), the long-term benefit of the liraglutide to semaglutide conversion remains unknown.
Strengths and Limitations
Strengths of this project include the large sample size, its setting in a large VA medical center, and the evaluation of multiple outcomes beyond HbA1c for assessment of glycemic control (ie, mean blood glucose, insulin titration, and dose adjustment of other glucose-lowering agents).
Limitations of this study include the retrospective chart review used for data collection, limited accuracy of objective data due to the COVID-19 pandemic, and inconsistencies with documentation in patients’ electronic health records. As a protective measure in the height of the pandemic between March 2021 and November 2021, the VA promoted using telephone and virtual-visit clinics to minimize exposure for patients with nonurgent follow-up needs. Patient hesitance to present to the clinic in person due to COVID-19 was also a significant factor in obtaining objective follow-up data. As a result, less accurate and timely baseline and postconversion weight and HbA1c data resulted, leading to our decision to extend the timeframe evaluated postconversion to 3 to 12 months. We also noted inconsistencies with documentation in CPRS. Unless veterans were closely followed by clinical pharmacist practitioners or endocrine consultation service clinicians, it was more difficult to follow and document trends of insulin titration to assess the impact of semaglutide conversion. The number of AEs, including hypoglycemia and GI intolerance, were also not consistently documented within the CPRS, and the frequency of AEs may be underestimated.
Another possible limitation regarding the interpretation of the results includes the portion of patients titrated up to semaglutide 1 mg weekly. As the focal point of this project was to review changes in glycemic control in the conversion to semaglutide 0.5 mg, this population of patients converted to 1 mg could potentially overestimate the HbA1c and weight changes described, as it is consistent with the SUSTAIN trials that show more robust decreases in those parameters described earlier.
Conclusions
A subset of patients with T2DM converted from liraglutide to semaglutide experienced significant changes in glycemic control and body weight. Significant differences were noted for a decreased HbA1c, decreased mean blood glucose, and weight loss. A fair portion of patients’ antihyperglycemic regimens required no changes on conversion to semaglutide. Although the semaglutide discontinuation rate neared 10%, AEs that may have contributed to this discontinuation rate included hypoglycemia and GI intolerance. Clinician education resulted in a substantial number of patients undergoing teleretinal imaging and further conversion to semaglutide; however, due to the low conversion response rate, a more effective method of educating clinicians is warranted. Although the semaglutide cost savings initiative at MEDVAMC resulted in significant savings, a full cost-effective analysis is needed to assess more comprehensive institution savings.
1. ElSayed NA, Aleppo G, Aroda VR, et al. 9. Pharmacologic Approaches to Glycemic Treatment: Standards of Care in Diabetes-2023. Diabetes Care. 2023;46(suppl 1):S140-S157. doi:10.2337/dc23-S009
2. Aroda VR, Ahmann A, Cariou B, et al. Comparative efficacy, safety, and cardiovascular outcome with once-weekly subcutaneous semaglutide in the treatment of type 2 diabetes: insights from the SUSTAIN 1-7 trials. Diabetes Metab. 2019;45(5):409-418. doi:10.1016/j.diabet.2018.12.001
3. Trujillo JM, Nuffer W, Smith BA. GLP-1 receptor agonists: an updated review of head-to-head clinical studies. Ther Adv Endocrinol Metab. 2021;12:2042018821997320. Published 2021 Mar 9. doi:10.1177/2042018821997320
4. Drucker DJ. Mechanisms of action and therapeutic application of glucagon-like peptide-1. Cell Metab. 2018;27(4):740-756. doi:10.1016/j.cmet.2018.03.001
5. Capehorn MS, Catarig AM, Furberg JK, et al. Efficacy and safety of once-weekly semaglutide 1.0mg vs once-daily liraglutide 1.2mg as add-on to 1-3 oral antidiabetic drugs in subjects with type 2 diabetes (SUSTAIN 10). Diabetes Metab. 2020;46(2):100-109. doi:10.1016/j.diabet.2019.101117
6. Marso SP, Bain SC, Consoli A, et al; SUSTAIN-6 Investigators. Semaglutide and cardiovascular outcomes in patients with type 2 diabetes. N Engl J Med. 2016;375(19):1834-1844. doi:10.1056/NEJMoa1607141
7. ElSayed NA, Aleppo G, Aroda VR, et al. 10. Cardiovascular Disease and Risk Management: Standards of Care in Diabetes-2023. Diabetes Care. 2023;46(suppl 1):S158-S190. doi:10.2337/dc23-S010
8. Russell-Jones D, Vaag A, Schmitz O, et al. Liraglutide vs insulin glargine and placebo in combination with metformin and sulfonylurea therapy in type 2 diabetes mellitus (LEAD-5 met+SU): a randomised controlled trial. Diabetologia. 2009;52(10):2046-2055. doi:10.1007/s00125-009-1472-y
9. Aroda VR, Bain SC, Cariou B, et al. Efficacy and safety of once-weekly semaglutide versus once-daily insulin glargine as add-on to metformin (with or without sulfonylureas) in insulin-naive patients with type 2 diabetes (SUSTAIN 4): a randomised, open-label, parallel-group, multicentre, multinational, phase 3a trial. Lancet Diabetes Endocrinol. 2017;5(5):355-366. doi:10.1016/S2213-8587(17)30085-2
Burnt Out ? The Phenomenon of Type 2 Diabetes Mellitus in End-Stage Renal Disease
In patients with T2DM and ESRD, insulin is the antidiabetic medication of choice with a hemoglobin A1c target of 6 to 8%, using fructosamine levels or other measures for better assessment of glycemic control.
More than 34 million adults in the US have type 2 diabetes mellitus (T2DM), a chronic progressive disease identified by worsening hyperglycemia and micro- and macrovascular complications.1 Consequently, 12.2% of the US adult population is currently at risk for macrovascular diseases, such as stroke and coronary artery disease (CAD) and microvascular diseases, such as neuropathy and diabetic nephropathy.1
T2DM is the most common comorbid risk factor for chronic kidney disease (CKD) and the leading cause of end-stage renal disease (ESRD). As of 2017, about 750,000 Americans have CKD stage 5 requiring dialysis, and 50% of these patients have preexisting diabetic nephropathy.2 Rates of mortality and morbidity are observed to be higher in patients with both CKD and T2DM compared with patients with CKD without T2DM.2 Previous clinical trials, including the United Kingdom Prospective Diabetes Study of 1998, have proven that optimal glycemic control decreases the risk of complications of T2DM (ie, nephropathy) in the general population.3 Conversely, tight glycemic control that targets hemoglobin A1c (HbA1c) < 7%, in patients with T2DM with ESRD has not shown the same benefits and may lead to worse outcomes. It is postulated that this may be due to the increased incidence of hypoglycemia in this patient population.4
Dialysis has varying effects on patients both with and without T2DM. While patients with ESRD without T2DM have the potential to develop impaired glucose tolerance and T2DM, about 33% of patients with T2DM on dialysis actually have HbA1c < 6%.5 In these patients, glycemic control improves spontaneously as their disease progresses, leading to a decrease or cessation of insulin or other antidiabetic medications. This phenomenon, known as burnt-out diabetes, is characterized by (1) alterations in glucose homeostasis and normoglycemia without antidiabetic treatment; (2) HbA1c levels < 6% despite having established T2DM; (3) decline in insulin requirements or cessation of insulin altogether; and (4) spontaneous hypoglycemia.
There is a misconception that burnt-out diabetes is a favorable condition due to the alteration of the natural course of T2DM. Although this may be true, patients with this condition are prone to develop hypoglycemic episodes and may be linked to poor survival outcomes due to low HbA1c.6,7
Since Kalantar-Zadeh and colleagues presented a 2009 case study, there has been a lack of research regarding this unique condition.8 The purpose of this case study is to shed further light on burnt-out diabetes and present a patient case pertaining to the challenges of glycemic control in ESRD.
Case Presentation
Mr. A is a 49-year-old Hispanic male veteran with a history of ESRD on hemodialysis (HD) for 6 years, anemia of CKD, and T2DM for 22 years. The patient also has an extensive cardiovascular disease history, including hypertension, hyperlipidemia, and CAD status post-4-vessel coronary artery bypass graft in December 2014. The patient receives in-home HD Monday, Wednesday, and Friday and is on the wait list for kidney transplantation. The patient’s T2DM is managed by a primary care clinical pharmacy specialist (CPS) at the
Mr. A’s antidiabetic regimen is 45 units of subcutaneous insulin glargine every morning; insulin aspart sliding scale (about 15-27 units) subcutaneous 3 times daily with meals; and saxagliptin 2.5 mg by mouth once daily.
At a follow-up visit with the CPS, Mr. A stated, “I feel fine except for the occasional low blood sugar episode.” The patient’s most recent HbA1c was 6.1%, and he reported medication adherence and no signs or symptoms of hyperglycemia (ie, polydipsia, polyphagia, nocturia, visual disturbances). Mr. A reported no use of alcohol, tobacco, or illicit drugs. He walks 1 mile every other day and participates in self-monitoring blood glucose (SMBG) about 2 to 3 times daily (Table 1).
![]()
Although Mr. A’s most recent HbA1c was well controlled, his estimated fasting blood glucose at the same laboratory draw was 224 mg/dL. His SMBG readings in the past month also were elevated with higher readings in the evening. Mr. A attributed the elevated readings to dietary excursions and a high carbohydrate intake. At this visit, the CPS increased his insulin glargine dose to 50 units subcutaneous every morning and educated him on lifestyle modifications. Follow-up with the CPS was scheduled for 2 months from the day of the visit.
Analysis
Few articles on potential contributors to burnt-out diabetes have been published.6,7 These articles discuss decreased renal and hepatic clearance of insulin (which increases its half-life) hypoglycemia during HD, and low HbA1c due to preexisting anemia. Inappropriately low HbA1c levels may be secondary to, but not limited to, hemolysis, recent blood transfusion, acute blood loss, and medications, such as erythropoietin-stimulating agents (ESAs).9 The conditions that affect red blood cell turnover are common in patients with advanced CKD and may result in discrepancies in HbA1c levels.
Glycated hemoglobin is a series of minor hemoglobin components formed by the adduction of various carbohydrate molecules to hemoglobin. HbA1c is the largest fraction formed and the most consistent index of the concentration of glucose in the blood.10 Hence, HbA1c is the traditional indicator of overall glycemic control. The current HbA1c goals recommended by the American Diabetes Association are derived from landmark trials conducted with patients in the general adult diabetic non-CKD population. However, hemoglobin measurements can be confounded by conditions present in ESRD and tend to underestimate glucose measurements in patients with T2DM on HD. Despite this, HbA1c is still regarded as a reasonable measure of glycemic control even in patients with ESRD; however, alternative markers of glycemia may be preferable.11
Although HbA1c is the gold standard, there are other laboratory measures of average glycemic control available. Fructosamine is a ketoamine formed when glucose binds to serum proteins. When these proteins are exposed to high concentrations of glucose, they experience increased glycation. Fructosamine assays measure the total glycated serum proteins, of which albumin accounts for about 90%.11 Because the half-life of serum proteins is about 20 days, fructosamine levels can reflect glycemic control over a 2- to 3-week period. This is advantageous in conditions that affect the average age of red blood cells, in pregnancy where frequent monitoring and measures of short-term glucose control are especially important, and in the evaluation of a medication adjustment in the management of T2DM. However, this test is not without its limitations. It is less reliable in settings of decreased protein levels (eg, liver disease), there is a lack of availability in routine practice, and reference levels have not been established.11
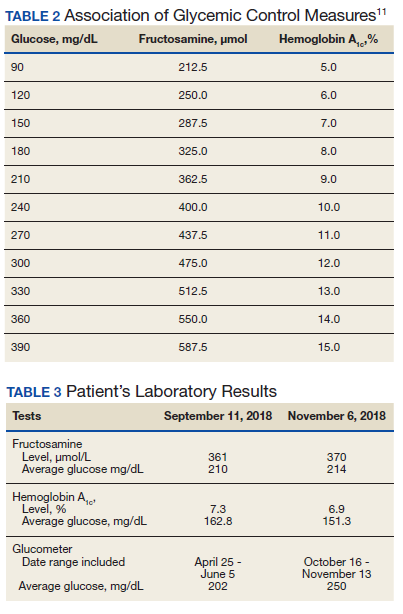
Fructosamine has been shown to be strongly associated with mean blood glucose and HbA1c (Table 2). In 2010, Mittman and colleagues published a study that compared HbA1c with fructosamine and their correlation to glycemic control and morbidity, defined as rates of hospitalization and infection.12 The study included 100 patients with T2DM on HD with a mean age of 63 years, 54% were women, mean HbA1c of 7.2%, and mean dialysis duration of 3 years. Average follow-up was 3 years. At the end of follow-up, Mittman and colleagues found that HbA1c and fructosamine were highly correlated and associated with serum glucose (P < .01). However, fructosamine was found to be more highly correlated with mean glucose levels when those levels were below 150 mg/dL (P = .01). A higher fructosamine level, not HbA1c was a more significant predictor of hospitalization (P = .007) and infection (P = .001). Mittman and colleagues presented evidence for the use of fructosamine over HbA1c in patients with T2DM on HD.12
Hypoglycemic Episodes
At the 2-month follow-up visit with the CPS, Mr. A reported having 5 hypoglycemic episodes in the past 30 days. He also stated he would forget to take his insulin aspart dose before dinner about 3 to 4 times a week but would take it 30 to 60 minutes after the meal. Mr. A did not bring his glucometer or SMBG readings to the visit, but he indicated that his blood glucose levels continued to fluctuate and were elevated when consuming carbohydrates.
Laboratory tests 1 month prior to the 2-month follow-up visit showed HbA1c of 7.3%, which had increased from his previous level of 6.1%. He was counseled on the proper administration of insulin aspart and lifestyle modifications. A fructosamine level was ordered at this visit to further assess his glycemic control. A follow-up appointment and laboratory workup (fructosamine and HbA1c) were scheduled for 2 months from the visit (Table 3).
Mr. A was educated on the unreliability of his HbA1c levels secondary to his condition of ESRD on HD. He was counseled on the purpose of fructosamine and how it may be a better predictor of his glycemic control and morbidity. Mr. A continued to be followed closely by the primary care CPS for T2DM management.
Discussion
Management of T2DM in patients with ESRD presents challenges for clinicians in determining HbA1c goals and selecting appropriate medication options. The 2012 Kidney Disease Outcomes Quality Initiative (KDOQI) diabetes guideline does not recommend treatment for patients with substantially reduced kidney function to a target HbA1c < 7% due to risk of hypoglycemia.13 Although a target HbA1c > 7% is suggested for these patients, little is known about appropriate glycemic control in these patients as there is a paucity of prospective, randomized clinical trials that include patients with advanced CKD.13
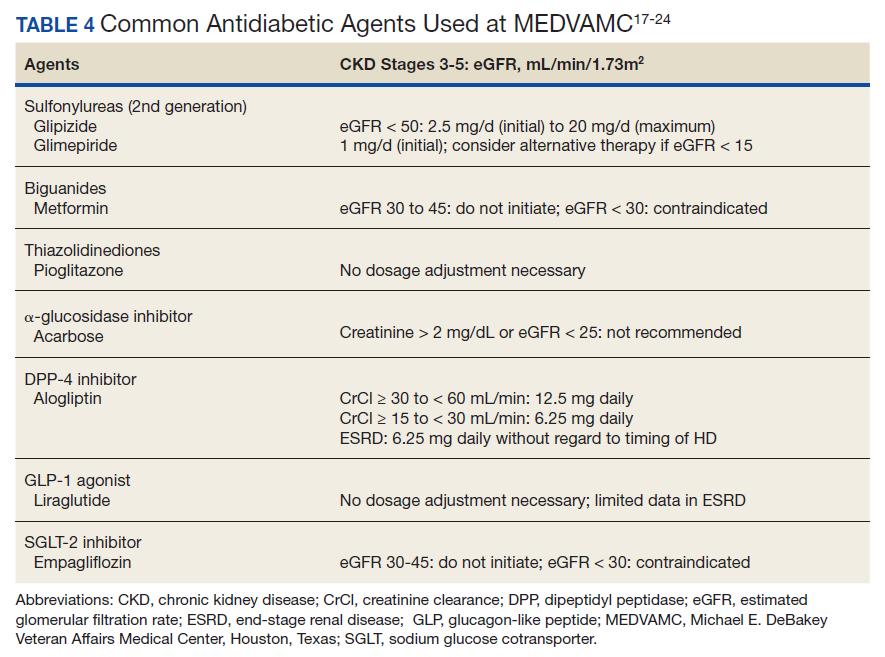
Moreover, many oral antidiabetic medications and their metabolites are cleared by the kidneys and, therefore, pose with potential harm for patients with CKD. Because of this, insulin is the medication of choice for patients with ESRD.7 Although insulin requirements may diminish with worsening kidney function, insulin provides the safest method of glycemic control. Insulin dosing can be individualized according to a patient’s renal status as there is no uniformity in renal dose adjustments. There are some noninsulin antidiabetic agents that can be used in ESRD, but use of these agents requires close monitoring and evaluation of the medication’s pharmacokinetics (Table 4). Overall, medication management can be a difficult task for patients with T2DM and ESRD, but antidiabetic regimens may be reduced or discontinued altogether in burnt-out diabetes.
One of 3 patients with T2DM and ESRD on dialysis has burnt-out diabetes, defined as a phenomenon in which glucose homeostasis is altered to cause normoglycemia, spontaneous hypoglycemia, and decreased insulin requirements in established patients with T2DM.5 Although Mr. A had a normal-to-low HbA1c, he did not meet these criteria. Due to his elevated SMBG readings, he did not have normoglycemia and did require an increase in his basal insulin dose. Therefore, our patient did not have burnt-out diabetes.
Mr. A represents the relevant issue of inappropriately and unreliably low HbA1c levels due to various factors in ESRD. Our patient did not receive a blood transfusion in the past 2 years and was not on ESA therapy; nevertheless, Mr. A was a patient with ESRD on HD with a diagnosis of anemia. These diagnoses are confounders for low HbA1c values. When fructosamine levels were drawn for Mr. A on September 11, 2018 and November 6, 2018, they correlated well with his serum glucose and SMBG readings. This indicated to the CPS that the patient’s glycemic control was poor despite a promising HbA1c level.
This patient’s case and supporting evidence suggests that other measures of glycemic control (eg, fructosamine) can be used to supplement HbA1c, serum glucose, and glucometer readings to provide an accurate assessment of glycemic control in T2DM. Fructosamine also can assist HbA1c with predicting morbidity and potentially mortality, which are of great importance in this patient population.
Kalantar-Zadeh and colleagues conducted a study of 23,618 patients with T2DM on dialysis to observe mortality in association with HbA1c.5 This analysis showed that patients with HbA1c levels < 5% or > 8% had a higher risk of mortality; higher values of HbA1c (> 10%) were associated with increased death risk vs all other values. In the unadjusted analysis, HbA1c levels between 6 and 8% had the lowest death risk (hazard ratios [HR] 0.8 - 0.9, 95% CI) compared with those of higher and lower HbA1c ranges.5 In nonanemic patients, HbA1c > 6% was associated with increased death risk, whereas anemic patients did not show this trend.
Other studies made similar observations. In 2001, Morioka and colleagues published an observational study of 150 patients with DM on intermittent hemodialysis. The study analyzed survival and HbA1c levels at 1, 3, and 5 years. The study found that at 1, 3, and 5 years, patients with HbA1c < 7.5% had better survival than did patients with HbA1c > 7.5% (3.6 years vs 2.0 years, P = .008). Morioka and colleagues also found that there was a 13% increase in death per 1% increase in HbA1c.14 Oomichi and colleagues conducted an observational study of 114 patients with T2DM and ESRD on intermittent hemodialysis. Patients with fair control (HbA1c 6.5 - 8%) and good control (HbA1c < 6.5%) were compared with patients with poor control (HbA1c > 8%); it was found that the poor control group had nearly triple the mortality when compared with the good and fair control groups (HR = 2.89, P = .01).15 Park and colleagues also saw a similar observation in a study of 1,239 patients with ESRD and DM; 70% of these patients were on intermittent hemodialysis. Patients with poor control (HbA1c ≥ 8%) had worse survival outcomes than those with HbA1c < 8% (HR 2.2, P < .001).16
Our patient case forced us to ask the question, “What should our patient’s HbA1c goals be?” In the study by Oomichi and colleagues, a HbA1c level of 8% has usefulness as a “signpost for management of glycemic control.”15 All patients’ goals should be individualized based on various factors (eg, age, comorbidities), but based on the survival studies above, a HbA1c goal range of 6 to 8% may be optimal.
Conclusions
Patients with T2DM and ESRD on dialysis may have higher morbidity and mortality rates than the rates of those without T2DM. It has been shown in various studies that very low HbA1c (< 5%) and high HbA1c (> 8%) are associated with poor survival. Some patients with T2DM on dialysis may experience burnt-out diabetes in which they may have normoglycemia and a HbA1c below goal; despite these facts, this condition is not positive and can be linked to bad outcomes. In patients with T2DM and ESRD, insulin is the antidiabetic medication of choice, and we recommend a HbA1c target of 6 to 8%. In this patient population, consider using fructosamine levels or other measures of glycemic control to supplement HbA1c and glucose values to provide a better assessment of glycemic control, morbidity, and mortality. Larger clinical trials are needed to assist in answering questions regarding mortality and optimal HbA1c targets in burnt-out diabetes.
1. Centers for Disease Control and Prevention. National Diabetes Statistics Report, 2020. https://www.cdc.gov/diabetes/data/statistics-report/index.html. Updated August 28, 2020. Accessed November 17, 2020.
2. Saran R, Robinson B, et al. US renal data system 2019 annual data report: epidemiology of klidney disease in the United States. Am J Kidney Dis. 2020 Jan;75(1 suppl 1):A6-A7. doi:10.1053/j.ajkd.2019.09.003. Epub 2019 Nov 5.
3. UK Prospective Diabetes Study Group. Effect of intensive blood-glucose control with metformin on complications in overweight patients with type 2 diabetes (UKPDS 34). Lancet. 1998;352(9131):854-865.
4. Gerstein HC, Miller ME, Byington RP, et al. Effects of intensive glucose lowering in type 2 diabetes. N Engl J Med. 2008;358(24):2545-2559. doi:10.1056/NEJMoa0802743
5. Kalantar-Zadeh K, Kopple JD, Regidor DL, et al. A1c and survival in maintenance hemodialysis patients. Diabetes Care. 2007;30(5):1049-10.55. doi:10.2337/dc06-2127
6. Park J, Lertdumrongluk P, Molnar MZ, Kovesdy CP, Kalantar-Zadeh K. Glycemic control in diabetic dialysis patients and the burnt-out diabetes phenomenon. Curr Diab Rep. 2012;12(4):432-439. doi:10.1007/s11892-012-0286-3
7. Rhee CM, Leung AM, Kovesdy CP, Lynch KE, Brent GA, Kalantar-Zadeh K. Updates on the management of diabetes in dialysis patients. Semin Dial. 2014;27(2):135-145. doi:10.1111/sdi.12198
8. Kalantar-Zadeh K, Derose SF, Nicholas S, Benner D, Sharma K, Kovesdy CP. Burnt-out diabetes: impact of chronic kidney disease progression on the natural course of diabetes mellitus. J Ren Nutr. 2009;19(1):33-37. doi:10.1053/j.jrn.2008.11.012
9. Unnikrishnan R, Anjana RM, Mohan V. Drugs affecting HbA1c levels. Indian J Endocrinol Metab. 2012;16(4):528-531. doi:10.4103/2230-8210.98004
10. Makris K, Spanou L. Is there a relationship between mean blood glucose and glycated hemoglobin? J Diabetes Sci Technol. 2011;5(6):1572-1583. doi:10.1177/193229681100500634
11. Wright LAC, Hirsch IB. The challenge of the use of glycemic biomarkers in diabetes: reflecting on hemoglobin A1c, 1,5-anhydroglucitol, and the glycated proteins fructosamine and glycated albumin. Diabetes Spectr. 2012;25(3):141-148. doi:10.2337/diaspect.25.3.141
12. Mittman N, Desiraju B, Fazil I, et al. Serum fructosamine versus glycosylated hemoglobin as an index of glycemic control, hospitalization, and infection in diabetic hemodialysis patients. Kidney Int. 2010;78 (suppl 117):S41-S45. doi:10.1038/ki.2010.193
13. National Kidney Foundation. KDOQI clinical practice guideline for diabetes and CKD: 2012 update. Am J Kidney Dis. 2012;60(5):850-886. doi:10.1053/j.ajkd.2012.07.005
14. Morioka T, Emoto M, Tabata T, et al. Glycemic control is a predictor of survival for diabetic patients on hemodialysis. Diabetes Care. 2001;24(5):909-913. doi.10.2337/diacare.24.5.909

15. Oomichi T, Emoto M, Tabata T, et al. Impact of glycemic control on survival of diabetic patients on chronic regular hemodialysis: a 7-year observational study. Diabetes Care. 2006;29(7):1496-1500. doi:10.2337/dc05-1887
16. Park JI, Bae E, Kim YL, et al. Glycemic control and mortality in diabetic patients undergoing dialysis focusing on the effects of age and dialysis type: a prospective cohort study in Korea. PLoS ONE. 2015;10(8):e0136085. doi:10.1371/journal.pone.0136085
17. Glucotrol tablets [
18. Amaryl [package insert]. Bridgewater, NJ: Sanofi-Aventis; December 2018.
19. Glucophage [package insert]. Princeton, NJ: Bristol-Myers Squibb; May 2018.
20. Actos [package insert]. Deerfield, IL: Takeda Pharmaceuticals America Inc; December 2017.
21. Precose [package insert]. Whippany, NJ: Bayer HealthCare Pharmaceuticals; March 2015.
22. Nesina [package insert]. Deerfield, IL: Takeda Pharmaceuticals America Inc; June 2019.
23. Victoza [package insert]. Plainsboro, NJ: Novo Nordisk Inc; June 2019.
24. Jardiance [package insert]. Ridgefield, CT: Boehringer Ingelheim Pharmaceuticals Inc; October 2018.
In patients with T2DM and ESRD, insulin is the antidiabetic medication of choice with a hemoglobin A1c target of 6 to 8%, using fructosamine levels or other measures for better assessment of glycemic control.
In patients with T2DM and ESRD, insulin is the antidiabetic medication of choice with a hemoglobin A1c target of 6 to 8%, using fructosamine levels or other measures for better assessment of glycemic control.
More than 34 million adults in the US have type 2 diabetes mellitus (T2DM), a chronic progressive disease identified by worsening hyperglycemia and micro- and macrovascular complications.1 Consequently, 12.2% of the US adult population is currently at risk for macrovascular diseases, such as stroke and coronary artery disease (CAD) and microvascular diseases, such as neuropathy and diabetic nephropathy.1
T2DM is the most common comorbid risk factor for chronic kidney disease (CKD) and the leading cause of end-stage renal disease (ESRD). As of 2017, about 750,000 Americans have CKD stage 5 requiring dialysis, and 50% of these patients have preexisting diabetic nephropathy.2 Rates of mortality and morbidity are observed to be higher in patients with both CKD and T2DM compared with patients with CKD without T2DM.2 Previous clinical trials, including the United Kingdom Prospective Diabetes Study of 1998, have proven that optimal glycemic control decreases the risk of complications of T2DM (ie, nephropathy) in the general population.3 Conversely, tight glycemic control that targets hemoglobin A1c (HbA1c) < 7%, in patients with T2DM with ESRD has not shown the same benefits and may lead to worse outcomes. It is postulated that this may be due to the increased incidence of hypoglycemia in this patient population.4
Dialysis has varying effects on patients both with and without T2DM. While patients with ESRD without T2DM have the potential to develop impaired glucose tolerance and T2DM, about 33% of patients with T2DM on dialysis actually have HbA1c < 6%.5 In these patients, glycemic control improves spontaneously as their disease progresses, leading to a decrease or cessation of insulin or other antidiabetic medications. This phenomenon, known as burnt-out diabetes, is characterized by (1) alterations in glucose homeostasis and normoglycemia without antidiabetic treatment; (2) HbA1c levels < 6% despite having established T2DM; (3) decline in insulin requirements or cessation of insulin altogether; and (4) spontaneous hypoglycemia.
There is a misconception that burnt-out diabetes is a favorable condition due to the alteration of the natural course of T2DM. Although this may be true, patients with this condition are prone to develop hypoglycemic episodes and may be linked to poor survival outcomes due to low HbA1c.6,7
Since Kalantar-Zadeh and colleagues presented a 2009 case study, there has been a lack of research regarding this unique condition.8 The purpose of this case study is to shed further light on burnt-out diabetes and present a patient case pertaining to the challenges of glycemic control in ESRD.
Case Presentation
Mr. A is a 49-year-old Hispanic male veteran with a history of ESRD on hemodialysis (HD) for 6 years, anemia of CKD, and T2DM for 22 years. The patient also has an extensive cardiovascular disease history, including hypertension, hyperlipidemia, and CAD status post-4-vessel coronary artery bypass graft in December 2014. The patient receives in-home HD Monday, Wednesday, and Friday and is on the wait list for kidney transplantation. The patient’s T2DM is managed by a primary care clinical pharmacy specialist (CPS) at the
Mr. A’s antidiabetic regimen is 45 units of subcutaneous insulin glargine every morning; insulin aspart sliding scale (about 15-27 units) subcutaneous 3 times daily with meals; and saxagliptin 2.5 mg by mouth once daily.
At a follow-up visit with the CPS, Mr. A stated, “I feel fine except for the occasional low blood sugar episode.” The patient’s most recent HbA1c was 6.1%, and he reported medication adherence and no signs or symptoms of hyperglycemia (ie, polydipsia, polyphagia, nocturia, visual disturbances). Mr. A reported no use of alcohol, tobacco, or illicit drugs. He walks 1 mile every other day and participates in self-monitoring blood glucose (SMBG) about 2 to 3 times daily (Table 1).
![]()
Although Mr. A’s most recent HbA1c was well controlled, his estimated fasting blood glucose at the same laboratory draw was 224 mg/dL. His SMBG readings in the past month also were elevated with higher readings in the evening. Mr. A attributed the elevated readings to dietary excursions and a high carbohydrate intake. At this visit, the CPS increased his insulin glargine dose to 50 units subcutaneous every morning and educated him on lifestyle modifications. Follow-up with the CPS was scheduled for 2 months from the day of the visit.
Analysis
Few articles on potential contributors to burnt-out diabetes have been published.6,7 These articles discuss decreased renal and hepatic clearance of insulin (which increases its half-life) hypoglycemia during HD, and low HbA1c due to preexisting anemia. Inappropriately low HbA1c levels may be secondary to, but not limited to, hemolysis, recent blood transfusion, acute blood loss, and medications, such as erythropoietin-stimulating agents (ESAs).9 The conditions that affect red blood cell turnover are common in patients with advanced CKD and may result in discrepancies in HbA1c levels.
Glycated hemoglobin is a series of minor hemoglobin components formed by the adduction of various carbohydrate molecules to hemoglobin. HbA1c is the largest fraction formed and the most consistent index of the concentration of glucose in the blood.10 Hence, HbA1c is the traditional indicator of overall glycemic control. The current HbA1c goals recommended by the American Diabetes Association are derived from landmark trials conducted with patients in the general adult diabetic non-CKD population. However, hemoglobin measurements can be confounded by conditions present in ESRD and tend to underestimate glucose measurements in patients with T2DM on HD. Despite this, HbA1c is still regarded as a reasonable measure of glycemic control even in patients with ESRD; however, alternative markers of glycemia may be preferable.11
Although HbA1c is the gold standard, there are other laboratory measures of average glycemic control available. Fructosamine is a ketoamine formed when glucose binds to serum proteins. When these proteins are exposed to high concentrations of glucose, they experience increased glycation. Fructosamine assays measure the total glycated serum proteins, of which albumin accounts for about 90%.11 Because the half-life of serum proteins is about 20 days, fructosamine levels can reflect glycemic control over a 2- to 3-week period. This is advantageous in conditions that affect the average age of red blood cells, in pregnancy where frequent monitoring and measures of short-term glucose control are especially important, and in the evaluation of a medication adjustment in the management of T2DM. However, this test is not without its limitations. It is less reliable in settings of decreased protein levels (eg, liver disease), there is a lack of availability in routine practice, and reference levels have not been established.11
Fructosamine has been shown to be strongly associated with mean blood glucose and HbA1c (Table 2). In 2010, Mittman and colleagues published a study that compared HbA1c with fructosamine and their correlation to glycemic control and morbidity, defined as rates of hospitalization and infection.12 The study included 100 patients with T2DM on HD with a mean age of 63 years, 54% were women, mean HbA1c of 7.2%, and mean dialysis duration of 3 years. Average follow-up was 3 years. At the end of follow-up, Mittman and colleagues found that HbA1c and fructosamine were highly correlated and associated with serum glucose (P < .01). However, fructosamine was found to be more highly correlated with mean glucose levels when those levels were below 150 mg/dL (P = .01). A higher fructosamine level, not HbA1c was a more significant predictor of hospitalization (P = .007) and infection (P = .001). Mittman and colleagues presented evidence for the use of fructosamine over HbA1c in patients with T2DM on HD.12
Hypoglycemic Episodes
At the 2-month follow-up visit with the CPS, Mr. A reported having 5 hypoglycemic episodes in the past 30 days. He also stated he would forget to take his insulin aspart dose before dinner about 3 to 4 times a week but would take it 30 to 60 minutes after the meal. Mr. A did not bring his glucometer or SMBG readings to the visit, but he indicated that his blood glucose levels continued to fluctuate and were elevated when consuming carbohydrates.
Laboratory tests 1 month prior to the 2-month follow-up visit showed HbA1c of 7.3%, which had increased from his previous level of 6.1%. He was counseled on the proper administration of insulin aspart and lifestyle modifications. A fructosamine level was ordered at this visit to further assess his glycemic control. A follow-up appointment and laboratory workup (fructosamine and HbA1c) were scheduled for 2 months from the visit (Table 3).
Mr. A was educated on the unreliability of his HbA1c levels secondary to his condition of ESRD on HD. He was counseled on the purpose of fructosamine and how it may be a better predictor of his glycemic control and morbidity. Mr. A continued to be followed closely by the primary care CPS for T2DM management.
Discussion
Management of T2DM in patients with ESRD presents challenges for clinicians in determining HbA1c goals and selecting appropriate medication options. The 2012 Kidney Disease Outcomes Quality Initiative (KDOQI) diabetes guideline does not recommend treatment for patients with substantially reduced kidney function to a target HbA1c < 7% due to risk of hypoglycemia.13 Although a target HbA1c > 7% is suggested for these patients, little is known about appropriate glycemic control in these patients as there is a paucity of prospective, randomized clinical trials that include patients with advanced CKD.13
Moreover, many oral antidiabetic medications and their metabolites are cleared by the kidneys and, therefore, pose with potential harm for patients with CKD. Because of this, insulin is the medication of choice for patients with ESRD.7 Although insulin requirements may diminish with worsening kidney function, insulin provides the safest method of glycemic control. Insulin dosing can be individualized according to a patient’s renal status as there is no uniformity in renal dose adjustments. There are some noninsulin antidiabetic agents that can be used in ESRD, but use of these agents requires close monitoring and evaluation of the medication’s pharmacokinetics (Table 4). Overall, medication management can be a difficult task for patients with T2DM and ESRD, but antidiabetic regimens may be reduced or discontinued altogether in burnt-out diabetes.
One of 3 patients with T2DM and ESRD on dialysis has burnt-out diabetes, defined as a phenomenon in which glucose homeostasis is altered to cause normoglycemia, spontaneous hypoglycemia, and decreased insulin requirements in established patients with T2DM.5 Although Mr. A had a normal-to-low HbA1c, he did not meet these criteria. Due to his elevated SMBG readings, he did not have normoglycemia and did require an increase in his basal insulin dose. Therefore, our patient did not have burnt-out diabetes.
Mr. A represents the relevant issue of inappropriately and unreliably low HbA1c levels due to various factors in ESRD. Our patient did not receive a blood transfusion in the past 2 years and was not on ESA therapy; nevertheless, Mr. A was a patient with ESRD on HD with a diagnosis of anemia. These diagnoses are confounders for low HbA1c values. When fructosamine levels were drawn for Mr. A on September 11, 2018 and November 6, 2018, they correlated well with his serum glucose and SMBG readings. This indicated to the CPS that the patient’s glycemic control was poor despite a promising HbA1c level.
This patient’s case and supporting evidence suggests that other measures of glycemic control (eg, fructosamine) can be used to supplement HbA1c, serum glucose, and glucometer readings to provide an accurate assessment of glycemic control in T2DM. Fructosamine also can assist HbA1c with predicting morbidity and potentially mortality, which are of great importance in this patient population.
Kalantar-Zadeh and colleagues conducted a study of 23,618 patients with T2DM on dialysis to observe mortality in association with HbA1c.5 This analysis showed that patients with HbA1c levels < 5% or > 8% had a higher risk of mortality; higher values of HbA1c (> 10%) were associated with increased death risk vs all other values. In the unadjusted analysis, HbA1c levels between 6 and 8% had the lowest death risk (hazard ratios [HR] 0.8 - 0.9, 95% CI) compared with those of higher and lower HbA1c ranges.5 In nonanemic patients, HbA1c > 6% was associated with increased death risk, whereas anemic patients did not show this trend.
Other studies made similar observations. In 2001, Morioka and colleagues published an observational study of 150 patients with DM on intermittent hemodialysis. The study analyzed survival and HbA1c levels at 1, 3, and 5 years. The study found that at 1, 3, and 5 years, patients with HbA1c < 7.5% had better survival than did patients with HbA1c > 7.5% (3.6 years vs 2.0 years, P = .008). Morioka and colleagues also found that there was a 13% increase in death per 1% increase in HbA1c.14 Oomichi and colleagues conducted an observational study of 114 patients with T2DM and ESRD on intermittent hemodialysis. Patients with fair control (HbA1c 6.5 - 8%) and good control (HbA1c < 6.5%) were compared with patients with poor control (HbA1c > 8%); it was found that the poor control group had nearly triple the mortality when compared with the good and fair control groups (HR = 2.89, P = .01).15 Park and colleagues also saw a similar observation in a study of 1,239 patients with ESRD and DM; 70% of these patients were on intermittent hemodialysis. Patients with poor control (HbA1c ≥ 8%) had worse survival outcomes than those with HbA1c < 8% (HR 2.2, P < .001).16
Our patient case forced us to ask the question, “What should our patient’s HbA1c goals be?” In the study by Oomichi and colleagues, a HbA1c level of 8% has usefulness as a “signpost for management of glycemic control.”15 All patients’ goals should be individualized based on various factors (eg, age, comorbidities), but based on the survival studies above, a HbA1c goal range of 6 to 8% may be optimal.
Conclusions
Patients with T2DM and ESRD on dialysis may have higher morbidity and mortality rates than the rates of those without T2DM. It has been shown in various studies that very low HbA1c (< 5%) and high HbA1c (> 8%) are associated with poor survival. Some patients with T2DM on dialysis may experience burnt-out diabetes in which they may have normoglycemia and a HbA1c below goal; despite these facts, this condition is not positive and can be linked to bad outcomes. In patients with T2DM and ESRD, insulin is the antidiabetic medication of choice, and we recommend a HbA1c target of 6 to 8%. In this patient population, consider using fructosamine levels or other measures of glycemic control to supplement HbA1c and glucose values to provide a better assessment of glycemic control, morbidity, and mortality. Larger clinical trials are needed to assist in answering questions regarding mortality and optimal HbA1c targets in burnt-out diabetes.
1. Centers for Disease Control and Prevention. National Diabetes Statistics Report, 2020. https://www.cdc.gov/diabetes/data/statistics-report/index.html. Updated August 28, 2020. Accessed November 17, 2020.
2. Saran R, Robinson B, et al. US renal data system 2019 annual data report: epidemiology of klidney disease in the United States. Am J Kidney Dis. 2020 Jan;75(1 suppl 1):A6-A7. doi:10.1053/j.ajkd.2019.09.003. Epub 2019 Nov 5.
3. UK Prospective Diabetes Study Group. Effect of intensive blood-glucose control with metformin on complications in overweight patients with type 2 diabetes (UKPDS 34). Lancet. 1998;352(9131):854-865.
4. Gerstein HC, Miller ME, Byington RP, et al. Effects of intensive glucose lowering in type 2 diabetes. N Engl J Med. 2008;358(24):2545-2559. doi:10.1056/NEJMoa0802743
5. Kalantar-Zadeh K, Kopple JD, Regidor DL, et al. A1c and survival in maintenance hemodialysis patients. Diabetes Care. 2007;30(5):1049-10.55. doi:10.2337/dc06-2127
6. Park J, Lertdumrongluk P, Molnar MZ, Kovesdy CP, Kalantar-Zadeh K. Glycemic control in diabetic dialysis patients and the burnt-out diabetes phenomenon. Curr Diab Rep. 2012;12(4):432-439. doi:10.1007/s11892-012-0286-3
7. Rhee CM, Leung AM, Kovesdy CP, Lynch KE, Brent GA, Kalantar-Zadeh K. Updates on the management of diabetes in dialysis patients. Semin Dial. 2014;27(2):135-145. doi:10.1111/sdi.12198
8. Kalantar-Zadeh K, Derose SF, Nicholas S, Benner D, Sharma K, Kovesdy CP. Burnt-out diabetes: impact of chronic kidney disease progression on the natural course of diabetes mellitus. J Ren Nutr. 2009;19(1):33-37. doi:10.1053/j.jrn.2008.11.012
9. Unnikrishnan R, Anjana RM, Mohan V. Drugs affecting HbA1c levels. Indian J Endocrinol Metab. 2012;16(4):528-531. doi:10.4103/2230-8210.98004
10. Makris K, Spanou L. Is there a relationship between mean blood glucose and glycated hemoglobin? J Diabetes Sci Technol. 2011;5(6):1572-1583. doi:10.1177/193229681100500634
11. Wright LAC, Hirsch IB. The challenge of the use of glycemic biomarkers in diabetes: reflecting on hemoglobin A1c, 1,5-anhydroglucitol, and the glycated proteins fructosamine and glycated albumin. Diabetes Spectr. 2012;25(3):141-148. doi:10.2337/diaspect.25.3.141
12. Mittman N, Desiraju B, Fazil I, et al. Serum fructosamine versus glycosylated hemoglobin as an index of glycemic control, hospitalization, and infection in diabetic hemodialysis patients. Kidney Int. 2010;78 (suppl 117):S41-S45. doi:10.1038/ki.2010.193
13. National Kidney Foundation. KDOQI clinical practice guideline for diabetes and CKD: 2012 update. Am J Kidney Dis. 2012;60(5):850-886. doi:10.1053/j.ajkd.2012.07.005
14. Morioka T, Emoto M, Tabata T, et al. Glycemic control is a predictor of survival for diabetic patients on hemodialysis. Diabetes Care. 2001;24(5):909-913. doi.10.2337/diacare.24.5.909
15. Oomichi T, Emoto M, Tabata T, et al. Impact of glycemic control on survival of diabetic patients on chronic regular hemodialysis: a 7-year observational study. Diabetes Care. 2006;29(7):1496-1500. doi:10.2337/dc05-1887
16. Park JI, Bae E, Kim YL, et al. Glycemic control and mortality in diabetic patients undergoing dialysis focusing on the effects of age and dialysis type: a prospective cohort study in Korea. PLoS ONE. 2015;10(8):e0136085. doi:10.1371/journal.pone.0136085
17. Glucotrol tablets [
18. Amaryl [package insert]. Bridgewater, NJ: Sanofi-Aventis; December 2018.
19. Glucophage [package insert]. Princeton, NJ: Bristol-Myers Squibb; May 2018.
20. Actos [package insert]. Deerfield, IL: Takeda Pharmaceuticals America Inc; December 2017.
21. Precose [package insert]. Whippany, NJ: Bayer HealthCare Pharmaceuticals; March 2015.
22. Nesina [package insert]. Deerfield, IL: Takeda Pharmaceuticals America Inc; June 2019.
23. Victoza [package insert]. Plainsboro, NJ: Novo Nordisk Inc; June 2019.
24. Jardiance [package insert]. Ridgefield, CT: Boehringer Ingelheim Pharmaceuticals Inc; October 2018.