User login
Financial Difficulties in Families of Hospitalized Children
Rising US healthcare costs coupled with high cost-sharing insurance plans have led to increased out-of-pocket healthcare expenditures, especially for those who are low income or in poorer health.1-7 Increased out-of-pocket expenditures can lead to “financial distress” (defined as the subjective level of stress felt toward one’s personal financial situation) and to “medical financial burden” (defined as the subjective assessment of financial problems relating specifically to medical costs). Financial distress and medical financial burden (defined together as “financial difficulty”) lead to impaired access and delayed presentation to care and treatment nonadherence in hopes of alleviating costs.8-12
Between 20% and 50% of families with children requiring frequent medical care report that their child’s healthcare has caused a financial difficulty.13,14 In addition to direct medical costs, these parents can also suffer from indirect costs of their child’s care, such as unemployment or missed work.15-17 Along with these families, families who are low income (generally defined as living below 200% of the Federal Poverty Level) also have higher absolute and relative out-of-pocket healthcare costs, and both groups are more likely to have unmet medical needs or to delay or forgo care.18-20 Medically complex children also represent an increasing percentage of patients admitted to children’s hospitals21,22 where their families may be more vulnerable to worsening financial difficulties caused by direct costs and income depletion—due to lost wages, transportation, and meals—associated with hospitalization.23
The hospitalized population can be readily screened and provided interventions. Although evidence on effective inpatient financial interventions is lacking, financial navigation programs piloted in the ambulatory setting that standardize financial screening and support trained financial navigators could prove a promising model for inpatient care.24-26 Therefore, understanding the prevalence of financial difficulties in this population and potential high-yield screening characteristics is critical in laying the groundwork for more robust in-hospital financial screening and support systems.
Our primary objective was to assess the prevalence of financial distress and medical financial burden in families of hospitalized children. Our secondary objective was to examine measurable factors during hospitalization that could identify families at risk for these financial difficulties to better understand how to target and implement hospital-based interventions.
METHODS
We conducted a cross-sectional survey at six university-affiliated children’s hospitals (Table 1). Each site’s institutional review board approved the study. All participants were verbally informed of the research goals of the study and provided with a research information document. Need for written informed consent was determined by each institutional review board.

Study enrollment occurred between October 2017 and November 2018, with individual sites having shorter active enrollment periods (ranging from 25 to 100 days) until sample size goals were met as explained below. Participants represented a convenience sample of parents or guardians (hereafter referred to only as “parents”), who were eligible for enrollment if their child was admitted to one of the six hospitals during the active enrollment period at that site. To avoid sampling bias, each site made an effort to enroll a consecutive sample of parents, but this was limited by resources and investigator availability. Parents were excluded if their child was admitted to a neonatal unit because of difficulty in complexity categorization and the confounding issue of mothers often being admitted simultaneously. There were no other unit-, diagnosis-, or service-based exclusions to participation. Parents were also excluded if their child was 18 years or older or if they themselves were younger than 18 years. Parents were approached once their child was identified for discharge from the hospital within 48 hours. Surveys were self-administered at the time of enrollment on provided electronic tablets. Participants at some sites were offered a $5 gift card as an incentive for survey completion.
The survey included a previously published financial distress scale (InCharge Financial Distress/Financial Wellbeing Scale [IFDFW])(Appendix).27 A question in addition to the IFDFW assessed whether families were currently experiencing financial burden from medical care28,29 and whether that burden was caused by their child (Appendix) because the IFDFW does not address the source of financial distress. The survey also included questions assessing perspectives on healthcare costs (data not presented here). The survey was refined through review by psychometric experts and members of the Family Advisory Council at the primary research site, which led to minor modifications. The final survey consisted of 40 items and was professionally translated into Spanish by a third-party company (Idem Translations). It was pilot tested by 10 parents of hospitalized children to assess for adequate comprehension and clarity; these parents were not included in the final data analysis.
Variables
The primary outcome variables were level of financial distress as defined by the IFDFW scale27 and the presence of medical financial burden. The IFDFW scale has eight questions answered on a scale of 1-10, and the final score is calculated by averaging these answers. The scale defines three categories of financial distress (high, 1-3.9; average, 4-6.9; low, 7-10); however, we dichotomized our outcome as high (<4) or not high (≥4). The outcome was analyzed as both continuous and dichotomous variables because small differences in continuous scores, if detected, may be less clinically relevant. Medical financial burden was categorized as child related, child unrelated, and none.

Our secondary aim was to identify predictors of financial distress and medical financial burden. The primary predictor variable of interest was the hospitalized child’s level of chronic disease (complex chronic disease, C-CD; noncomplex chronic disease, NC-CD; no chronic disease, no-CD) as categorized by the consensus definitions from the Center of Excellence on Quality of Care Measures for Children with Complex Needs (Appendix).30 We assigned level of chronic disease based on manual review of problem lists and diagnoses in the electronic health record (EHR) from up to 3 years prior. At sites with multiple researchers, the first five to ten charts were reviewed together to ensure consistency in categorization, but no formal assessment of interrater reliability was conducted. Other predictor variables are listed in Tables 2 and 3. Insurance payer was defined as “public” or “private” based on the documented insurance plan in the EHR. Patients with dual public and private insurance were categorized as public.

Statistical Analysis
We estimated sample size requirements using an expected mean IFDFW score with standard deviation of 5.7 ± 2 based on preliminary data from the primary study site and previously published data.27 We used a significance level of P = .05, power of 0.80, and an effect size of 0.5 points difference on the IFDFW scale between the families of children with C-CD and those with either NC-CD or no-CD. We assumed there would be unequal representation of chronic disease states, with an expectation that children with C-CD would make up approximately 40% of the total population.21,22,31 Under these assumptions, we calculated a desired total sample size of 519. This would also allow us to detect a 12% absolute difference in the rate of high financial distress between families with and without C-CD, assuming a baseline level of high financial distress of 30%.27 Our goal enrollment was 150 parents at the primary site and 75 parents at each of the other 5 sites.
We fit mixed effects logistic regression models to evaluate the odds of high financial distress and polytomous logistic regression models (for our three-level outcome) to evaluate the odds of having child-related medical financial burden vs having child-unrelated burden vs having no burden. We fit linear mixed effects models to evaluate the effect of chronic disease level and medical financial burden on mean IFDFW scores. Respondents who answered “I don’t know” to the medical financial burden question were aggregated with those who reported no medical financial burden. Models were fit as a function of chronic disease level, race, ethnicity, percentage of Federal Poverty Level (FPL), insurance payer, and having a deductible less than $1,000 per year. These models included a random intercept for facility. We also fit logistic regression models that used an interaction term between chronic disease level and percentage of FPL, as well as insurance payer and percentage of FPL, to explore potential effect modification between poverty and both chronic disease level and insurance payer on financial distress. For our models, we used the MICE package for multiple imputation to fill in missing data. We imputed 25 data sets with 25 iterations each and pooled model results using Rubin’s Rules.32 All analyses were performed in R 3.5.33
RESULTS
Of 644 parents who were invited to participate, 526 (82%) were enrolled. Participants and their hospitalized children were mostly White/Caucasian (69%) and not Hispanic/Latino (76%), with 34% of families living below 200% FPL and 274 (52%) having private insurance (Table 1). Of the hospitalized children, 225 (43%) were categorized as C-CD, 143 (27%) as NC-CD, and 157 (30%) as no-CD. All participants completed the IFDFW; however, there were five missing responses to the medical financial burden question. Table 1 lists missing demographic and financial difficulty data.
Financial Distress
The mean IFDFW score of all participants was 5.6 ± 2.1, with 125 having high financial distress (24%; 95% CI, 20-28) (Table 1). There was no difference in mean IFDFW scores among families of children with different chronic disease levels (Figure). On unadjusted and adjusted analyses, there was no association between level of chronic disease and high financial distress when C-CD and NC-CD groups were each compared with no-CD (Table 2). However, families living below 400% FPL (annual income of $100,400 for a family of four) were significantly more likely than families living at 400% FPL and above to have high financial distress. Families tended to have lower financial distress (as indicated by mean IFDFW scores) with increasing percentage of FPL; however, there were families in every FPL bracket who experienced high financial distress (Appendix Figure 1a). A secondary analysis of families below and those at or above 200% FPL did not find any significant interactions between percentage of FPL and either chronic disease level (P = .86) or insurance payer (P = .83) on financial distress.

Medical Financial Burden
Overall, 160 parents (30%; 95% CI, 27-35) reported having medical financial burden, with 86 of those parents (54%) indicating their financial burden was related to their child’s medical care (Table 1). Compared with families with no such medical financial burden, respondents with medical financial burden, either child related or child unrelated, had significantly lower mean IFDFW scores (Figure), which indicates overall higher financial distress in these families. However, some families with low financial distress also reported medical financial burden.
Adjusted analyses demonstrated that, compared with families of children with no-CD, families of children with C-CD (adjusted odds ratio [AOR], 4.98; 95% CI, 2.41-10.29) or NC-CD (AOR, 2.57; 95% CI, 1.11-5.93) had significantly higher odds of having child-related medical financial burden (Table 3). Families of children with NC-CD were also more likely than families of children with no-CD to have child-unrelated medical burden (Table 3). Percentage of FPL was the only other significant predictor of child-related and child-unrelated medical financial burden (Table 3), but as with the distribution of financial distress, medical financial burden was seen across family income brackets (Appendix Figure 1b).
DISCUSSION
In this multicenter study of parents of hospitalized children, almost one in four families experienced high financial distress and almost one in three families reported having medical financial burden, with both measures of financial difficulty affecting families across all income levels. While these percentages are not substantially higher than those seen in the general population,27,34 70% of our population was composed of children with chronic disease who are more likely to have short-term and long-term healthcare needs, which places them at risk for significant ongoing medical costs.
We hypothesized that families of children with complex chronic disease would have higher levels of financial difficulties,13,35,36 but we found that level of chronic disease was associated only with medical financial burden and not with high financial distress. Financial distress is likely multifactorial and dynamic, with different drivers across various income levels. Therefore, while medical financial burden likely contributes to high financial distress, there may be other contributing factors not captured by the IFDFW. However, subjective medical financial burden has still been associated with impaired access to care.10,34 Therefore, our results suggest that families of children with chronic diseases might be at higher risk for barriers to consistent healthcare because of the financial burden their frequent healthcare utilization incurs.
Household poverty level was also associated with financial distress and medical financial burden, although surprisingly both measures of financial difficulty were present in all FPL brackets. This highlights an important reality that financial vulnerability extends beyond income and federally defined “poverty.” Non-income factors, such as high local costs of living and the growing problem of underinsurance, may significantly contribute to financial difficulty, which may render static financial metrics such as percentage of FPL insufficient screeners. Furthermore, as evidenced by the nearly 10% of our respondents who declined to provide their income information, this is a sensitive topic for some families, so gathering income data during admission could likely be a nonstarter.
In the absence of other consistent predictors of financial difficulty that could trigger interventions such as an automatic financial counselor consult, hospitals and healthcare providers could consider implementing routine non-income based financial screening questions on admission, such as one assessing medical financial burden, as a nondiscriminatory way of identifying at-risk families and provide further education and assistance regarding their financial needs. Systematically gathering this data may also further demonstrate the need for broad financial navigation programs as a mainstay in comprehensive inpatient care.
We acknowledge several limitations of this study. Primarily, we surveyed families prior to discharge and receipt of hospitalization-related bills, and these bills could contribute significantly to financial difficulties. While the families of children with chronic disease, who likely have recurrent medical bills, did not demonstrate higher financial distress, it is possible that the overall rate of financial difficulties would have been higher had we surveyed families several weeks after discharge. Our measures of financial difficulty were also subjective and, therefore, at risk for response biases (such as recall bias) that could have misestimated the prevalence of these problems in our population. However, published literature on the IFDFW scale demonstrates concordance between the subjective score and tangible outcomes of financial distress (eg, contacting a credit agency). The IFDFW scale was validated in the general population, and although it has been used in studies of medical populations,37-41 none have been in hospitalized populations, which may affect the scale’s applicability in our study. The study was also conducted only at university-affiliated children’s hospitals, and although these hospitals are geographically diverse, most children in the United States are admitted to general or community hospitals.31 Our population was also largely White, non-Hispanic/Latino, and English speaking. Therefore, our sample may not reflect the general population of hospitalized children and their families. We also assigned levels of chronic disease based on manual EHR review. While the EHR should capture each patient’s breadth of medical issues, inaccurate or missing documentation could have led to misclassification of complexity in some cases. Additionally, our sample size was calculated to detect fairly large differences in our primary outcome, and some of our unexpected results may have resulted from this study being underpowered for detection of smaller, but perhaps still clinically relevant, differences. Finally, we do not have data for several possible confounders in our study, such as employment status, health insurance concordance among family members, or sources of supplemental income, that may impact a family’s overall financial health, along with some potential important hospital-based screening characteristics, such as admitting service team or primary diagnosis.
CONCLUSION
Financial difficulties are common in families of hospitalized pediatric patients. Low-income families and those who have children with chronic conditions are at particular risk; however, all subsets of families can be affected. Given the potential negative health outcomes financial difficulties impose on families and children, the ability to identify and support vulnerable families is a crucial component of care. Hospitalization may be a prime opportunity to identify and support our at-risk families.
Acknowledgments
The authors would like to thank the parents at each of the study sites for their participation, as well as the multiple research coordinators across the study sites for assisting in recruitment of families, survey administration, and data collection. KT Park, MD, MS (Stanford University School of Medicine) served as an adviser for the study’s design.
Disclosures
All authors have no financial relationships or conflicts of interest relevant to this article to disclose.
1. Blumberg LJ, Waidmann TA, Blavin F, Roth J. Trends in health care financial burdens, 2001 to 2009. Milbank Q. 2014;92(1):88-113. https://doi.org/10.1111/1468-0009.12042
2. Claxton G, Rae M, Long M, et al. Employer Health Benefits, 2015 Annual Survey. Kaiser Family Foundation; 2015. http://files.kff.org/attachment/report-2015-employer-health-benefits-survey
3. Long M, Rae M, Claxton G, et al. Recent trends in employer-sponsored insurance premiums. JAMA. 2016;315(1):18. https://doi.org/10.1001/jama.2015.17349
4. Patients’ perspectives on health care in the United States: A look at seven states and the nation. Press release. NPR, Robert Wood Johnson Foundation, Harvard T.H. Chan School of Public Health; February 29, 2016. Accessed February 23, 2018. https://www.rwjf.org/en/library/research/2016/02/patients--perspectives-on-health-care-in-the-united-states.html
5. May JH, Cunningham PJ. Tough trade-offs: medical bills, family finances and access to care. Issue Brief Cent Stud Health Syst Change. 2004;(85):1-4.
6. Tu HT. Rising health costs, medical debt and chronic conditions. Issue Brief Cent Stud Health Syst Change. 2004;(88):1-5.
7. Richman IB, Brodie M. A National study of burdensome health care costs among non-elderly Americans. BMC Health Serv Res. 2014;14:435. https://doi.org/10.1186/1472-6963-14-435
8. Choudhry NK, Saya UY, Shrank WH, et al. Cost-related medication underuse: prevalence among hospitalized managed care patients. J Hosp Med. 2012;7(2):104-109. https://doi.org/10.1002/jhm.948
9. QuickStats: percentage of persons of all ages who delayed or did not receive medical care during the preceding year because of cost, by U.S. Census region of residence—National Health Interview Survey, 2015. MMWR Morb Mortal Wkly Rep. 2017;66(4):121. https://dx.doi.org/10.15585/mmwr.mm6604a9
10. Doty MM, Ho A, Davis K. How High Is Too High? Implications of High-Deductible Health Plans. The Commonwealth Fund; April 1, 2005. Accessed February 24, 2018. http://www.commonwealthfund.org/publications/fund-reports/2005/apr/how-high-is-too-high--implications-of-high-deductible-health-plans
11. Doty MM, Edwards JN, Holmgren AL. Seeing Red: American Driven into Debt by Medical Bills. The Commonwealth Fund; August 1, 2005. Accessed October 24, 2018. https://www.commonwealthfund.org/publications/issue-briefs/2005/aug/seeing-red-americans-driven-debt-medical-bills
12. Altice CK, Banegas MP, Tucker-Seeley RD, Yabroff KR. Financial hardships experienced by cancer survivors: a systematic review. J Natl Cancer Inst. 2016;109(2):djw205. https://doi.org/10.1093/jnci/djw205
13. Ghandour RM, Hirai AH, Blumberg SJ, Strickland BB, Kogan MD. Financial and nonfinancial burden among families of CSHCN: changes between 2001 and 2009-2010. Acad Pediatr. 2014;14(1):92-100. https://doi.org/10.1016/j.acap.2013.10.001
14. Thomson J, Shah SS, Simmons JM, et al. Financial and social hardships in families of children with medical complexity. J Pediatr. 2016;172:187-193.e1. https://doi.org/10.1016/j.jpeds.2016.01.049
15. Kuhlthau K, Kahn R, Hill KS, Gnanasekaran S, Ettner SL. The well-being of parental caregivers of children with activity limitations. Matern Child Health J. 2010;14(2):155-163. https://doi.org/10.1007/s10995-008-0434-1
16. Kuhlthau KA, Perrin JM. Child health status and parental employment. Arch Pediatr Adolesc Med. 2001;155(12):1346-1350. https://doi.org/10.1001/archpedi.155.12.1346
17. Witt WP, Gottlieb CA, Hampton J, Litzelman K. The impact of childhood activity limitations on parental health, mental health, and workdays lost in the United States. Acad Pediatr. 2009;9(4):263-269. https://doi.org/10.1016/j.acap.2009.02.008
18. Wisk LE, Witt WP. Predictors of delayed or forgone needed health care for families with children. Pediatrics. 2012;130(6):1027-1037. https://doi.org/10.1542/peds.2012-0668
19. Davidoff AJ. Insurance for children with special health care needs: patterns of coverage and burden on families to provide adequate insurance. Pediatrics. 2004;114(2):394-403. https://doi.org/10.1542/peds.114.2.394
20. Galbraith AA, Wong ST, Kim SE, Newacheck PW. Out-of-pocket financial burden for low-income families with children: socioeconomic disparities and effects of insurance. Health Serv Res. 2005;40(6 Pt 1):1722-1736. https://doi.org/10.1111/j.1475-6773.2005.00421.x
21. Berry JG, Hall DE, Kuo DZ, et al. Hospital utilization and characteristics of patients experiencing recurrent readmissions within children’s hospitals. JAMA. 2011;305(7):682-690. https://doi.org/10.1001/jama.2011.122
22. Berry JG, Hall M, Hall DE, et al. Inpatient growth and resource use in 28 children’s hospitals: a longitudinal, multi-institutional study. JAMA Pediatrics. 2013;167(2):170-177. https://doi.org/10.1001/jamapediatrics.2013.432
23. Chang LV, Shah AN, Hoefgen ER, et al. Lost earnings and nonmedical expenses of pediatric hospitalizations. Pediatrics. 2018;142(3):e20180195. https://doi.org/10.1542/peds.2018-0195
24. Banegas MP, Dickerson JF, Friedman NL, et al. Evaluation of a novel financial navigator pilot to address patient concerns about medical care costs. Perm J. 2019;23:18-084. https://doi.org/10.7812/tpp/18-084
25. Shankaran V, Leahy T, Steelquist J, et al. Pilot feasibility study of an oncology financial navigation program. J Oncol Pract. 2018;14(2):e122-e129. https://doi.org/10.1200/jop.2017.024927
26. Yezefski T, Steelquist J, Watabayashi K, Sherman D, Shankaran V. Impact of trained oncology financial navigators on patient out-of-pocket spending. Am J Manag Care. 2018;24(5 Suppl):S74-S79.
27. Prawitz AD, Garman ET, Sorhaindo B, O’Neill B, Kim J, Drentea P. InCharge Financial Distress/Financial Well-Being Scale: Development, Administration, and Score Interpretation. J Financial Counseling Plann. 2006;17(1):34-50. https://doi.org/10.1037/t60365-000
28. Cohen RA, Kirzinger WK. Financial burden of medical care: a family perspective. NCHS Data Brief. 2014;(142):1-8.
29. Galbraith AA, Ross-Degnan D, Soumerai SB, Rosenthal MB, Gay C, Lieu TA. Nearly half of families in high-deductible health plans whose members have chronic conditions face substantial financial burden. Health Aff (Millwood). 2011;30(2):322-331. https://doi.org/10.1377/hlthaff.2010.0584
30. Simon TD, Cawthon ML, Stanford S, et al. Pediatric medical complexity algorithm: a new method to stratify children by medical complexity. Pediatrics. 2014;133(6):e1647-e1654. https://doi.org/10.1542/peds.2013-3875
31. Leyenaar JK, Ralston SL, Shieh MS, Pekow PS, Mangione-Smith R, Lindenauer PK. Epidemiology of pediatric hospitalizations at general hospitals and freestanding children’s hospitals in the United States. J Hosp Med. 2016;11(11):743-749. https://doi.org/10.1002/jhm.2624
32. Rubin DB. Multiple Imputation for Nonresponse in Surveys. John Wiley and Sons; 1987.
33. R: A language and environment for statistical computing. R Foundation for Statistical Computing; 2018. https://www.R-project.org/
34. Hamel L, Norton M, Pollitz K, Levitt L, Claxton G, Brodie M. The Burden of Medical Debt: Results from the Kaiser Family Foundation/New York Times Medical Bills Survey. Kaiser Family Foundation; January 5, 2016. Accessed February 26, 2019. https://www.kff.org/wp-content/uploads/2016/01/8806-the-burden-of-medical-debt-results-from-the-kaiser-family-foundation-new-york-times-medical-bills-survey.pdf
35. Witt WP, Litzelman K, Mandic CG, et al. Healthcare-related financial burden among families in the U.S.: the role of childhood activity limitations and income. J Fam Econ Issues. 2011;32(2):308-326. https://doi.org/10.1007/s10834-011-9253-4
36. Zan H, Scharff RL. The heterogeneity in financial and time burden of caregiving to children with chronic conditions. Matern Child Health J. 2015;19(3):615-625. https://doi.org/10.1007/s10995-014-1547-3
37. Irwin B, Kimmick G, Altomare I, et al. Patient experience and attitudes toward addressing the cost of breast cancer care. Oncologist. 2014;19(11):1135-1140. https://doi.org/10.1634/theoncologist.2014-0117
38. Meisenberg BR, Varner A, Ellis E, et al. Patient attitudes regarding the cost of illness in cancer care. Oncologist. 2015;20(10):1199-1204. https://doi.org/10.1634/theoncologist.2015-0168
39. Altomare I, Irwin B, Zafar SY, et al. Physician experience and attitudes toward addressing the cost of cancer care. J Oncol Pract. 2016;12(3):e281-288, 247-288. https://doi.org/10.1200/jop.2015.007401
40. Starkey AJ, Keane CR, Terry MA, Marx JH, Ricci EM. Financial distress and depressive symptoms among African American women: identifying financial priorities and needs and why it matters for mental health. J Urban Health. 2013;90(1):83-100. https://doi.org/10.1007/s11524-012-9755-x
41. Amanatullah DF, Murasko MJ, Chona DV, Crijns TJ, Ring D, Kamal RN. Financial distress and discussing the cost of total joint arthroplasty. J Arthroplasty. 2018;33(11):3394-3397. https://doi.org/10.1016/j.arth.2018.07.010
Rising US healthcare costs coupled with high cost-sharing insurance plans have led to increased out-of-pocket healthcare expenditures, especially for those who are low income or in poorer health.1-7 Increased out-of-pocket expenditures can lead to “financial distress” (defined as the subjective level of stress felt toward one’s personal financial situation) and to “medical financial burden” (defined as the subjective assessment of financial problems relating specifically to medical costs). Financial distress and medical financial burden (defined together as “financial difficulty”) lead to impaired access and delayed presentation to care and treatment nonadherence in hopes of alleviating costs.8-12
Between 20% and 50% of families with children requiring frequent medical care report that their child’s healthcare has caused a financial difficulty.13,14 In addition to direct medical costs, these parents can also suffer from indirect costs of their child’s care, such as unemployment or missed work.15-17 Along with these families, families who are low income (generally defined as living below 200% of the Federal Poverty Level) also have higher absolute and relative out-of-pocket healthcare costs, and both groups are more likely to have unmet medical needs or to delay or forgo care.18-20 Medically complex children also represent an increasing percentage of patients admitted to children’s hospitals21,22 where their families may be more vulnerable to worsening financial difficulties caused by direct costs and income depletion—due to lost wages, transportation, and meals—associated with hospitalization.23
The hospitalized population can be readily screened and provided interventions. Although evidence on effective inpatient financial interventions is lacking, financial navigation programs piloted in the ambulatory setting that standardize financial screening and support trained financial navigators could prove a promising model for inpatient care.24-26 Therefore, understanding the prevalence of financial difficulties in this population and potential high-yield screening characteristics is critical in laying the groundwork for more robust in-hospital financial screening and support systems.
Our primary objective was to assess the prevalence of financial distress and medical financial burden in families of hospitalized children. Our secondary objective was to examine measurable factors during hospitalization that could identify families at risk for these financial difficulties to better understand how to target and implement hospital-based interventions.
METHODS
We conducted a cross-sectional survey at six university-affiliated children’s hospitals (Table 1). Each site’s institutional review board approved the study. All participants were verbally informed of the research goals of the study and provided with a research information document. Need for written informed consent was determined by each institutional review board.
Study enrollment occurred between October 2017 and November 2018, with individual sites having shorter active enrollment periods (ranging from 25 to 100 days) until sample size goals were met as explained below. Participants represented a convenience sample of parents or guardians (hereafter referred to only as “parents”), who were eligible for enrollment if their child was admitted to one of the six hospitals during the active enrollment period at that site. To avoid sampling bias, each site made an effort to enroll a consecutive sample of parents, but this was limited by resources and investigator availability. Parents were excluded if their child was admitted to a neonatal unit because of difficulty in complexity categorization and the confounding issue of mothers often being admitted simultaneously. There were no other unit-, diagnosis-, or service-based exclusions to participation. Parents were also excluded if their child was 18 years or older or if they themselves were younger than 18 years. Parents were approached once their child was identified for discharge from the hospital within 48 hours. Surveys were self-administered at the time of enrollment on provided electronic tablets. Participants at some sites were offered a $5 gift card as an incentive for survey completion.
The survey included a previously published financial distress scale (InCharge Financial Distress/Financial Wellbeing Scale [IFDFW])(Appendix).27 A question in addition to the IFDFW assessed whether families were currently experiencing financial burden from medical care28,29 and whether that burden was caused by their child (Appendix) because the IFDFW does not address the source of financial distress. The survey also included questions assessing perspectives on healthcare costs (data not presented here). The survey was refined through review by psychometric experts and members of the Family Advisory Council at the primary research site, which led to minor modifications. The final survey consisted of 40 items and was professionally translated into Spanish by a third-party company (Idem Translations). It was pilot tested by 10 parents of hospitalized children to assess for adequate comprehension and clarity; these parents were not included in the final data analysis.
Variables
The primary outcome variables were level of financial distress as defined by the IFDFW scale27 and the presence of medical financial burden. The IFDFW scale has eight questions answered on a scale of 1-10, and the final score is calculated by averaging these answers. The scale defines three categories of financial distress (high, 1-3.9; average, 4-6.9; low, 7-10); however, we dichotomized our outcome as high (<4) or not high (≥4). The outcome was analyzed as both continuous and dichotomous variables because small differences in continuous scores, if detected, may be less clinically relevant. Medical financial burden was categorized as child related, child unrelated, and none.
Our secondary aim was to identify predictors of financial distress and medical financial burden. The primary predictor variable of interest was the hospitalized child’s level of chronic disease (complex chronic disease, C-CD; noncomplex chronic disease, NC-CD; no chronic disease, no-CD) as categorized by the consensus definitions from the Center of Excellence on Quality of Care Measures for Children with Complex Needs (Appendix).30 We assigned level of chronic disease based on manual review of problem lists and diagnoses in the electronic health record (EHR) from up to 3 years prior. At sites with multiple researchers, the first five to ten charts were reviewed together to ensure consistency in categorization, but no formal assessment of interrater reliability was conducted. Other predictor variables are listed in Tables 2 and 3. Insurance payer was defined as “public” or “private” based on the documented insurance plan in the EHR. Patients with dual public and private insurance were categorized as public.
Statistical Analysis
We estimated sample size requirements using an expected mean IFDFW score with standard deviation of 5.7 ± 2 based on preliminary data from the primary study site and previously published data.27 We used a significance level of P = .05, power of 0.80, and an effect size of 0.5 points difference on the IFDFW scale between the families of children with C-CD and those with either NC-CD or no-CD. We assumed there would be unequal representation of chronic disease states, with an expectation that children with C-CD would make up approximately 40% of the total population.21,22,31 Under these assumptions, we calculated a desired total sample size of 519. This would also allow us to detect a 12% absolute difference in the rate of high financial distress between families with and without C-CD, assuming a baseline level of high financial distress of 30%.27 Our goal enrollment was 150 parents at the primary site and 75 parents at each of the other 5 sites.
We fit mixed effects logistic regression models to evaluate the odds of high financial distress and polytomous logistic regression models (for our three-level outcome) to evaluate the odds of having child-related medical financial burden vs having child-unrelated burden vs having no burden. We fit linear mixed effects models to evaluate the effect of chronic disease level and medical financial burden on mean IFDFW scores. Respondents who answered “I don’t know” to the medical financial burden question were aggregated with those who reported no medical financial burden. Models were fit as a function of chronic disease level, race, ethnicity, percentage of Federal Poverty Level (FPL), insurance payer, and having a deductible less than $1,000 per year. These models included a random intercept for facility. We also fit logistic regression models that used an interaction term between chronic disease level and percentage of FPL, as well as insurance payer and percentage of FPL, to explore potential effect modification between poverty and both chronic disease level and insurance payer on financial distress. For our models, we used the MICE package for multiple imputation to fill in missing data. We imputed 25 data sets with 25 iterations each and pooled model results using Rubin’s Rules.32 All analyses were performed in R 3.5.33
RESULTS
Of 644 parents who were invited to participate, 526 (82%) were enrolled. Participants and their hospitalized children were mostly White/Caucasian (69%) and not Hispanic/Latino (76%), with 34% of families living below 200% FPL and 274 (52%) having private insurance (Table 1). Of the hospitalized children, 225 (43%) were categorized as C-CD, 143 (27%) as NC-CD, and 157 (30%) as no-CD. All participants completed the IFDFW; however, there were five missing responses to the medical financial burden question. Table 1 lists missing demographic and financial difficulty data.
Financial Distress
The mean IFDFW score of all participants was 5.6 ± 2.1, with 125 having high financial distress (24%; 95% CI, 20-28) (Table 1). There was no difference in mean IFDFW scores among families of children with different chronic disease levels (Figure). On unadjusted and adjusted analyses, there was no association between level of chronic disease and high financial distress when C-CD and NC-CD groups were each compared with no-CD (Table 2). However, families living below 400% FPL (annual income of $100,400 for a family of four) were significantly more likely than families living at 400% FPL and above to have high financial distress. Families tended to have lower financial distress (as indicated by mean IFDFW scores) with increasing percentage of FPL; however, there were families in every FPL bracket who experienced high financial distress (Appendix Figure 1a). A secondary analysis of families below and those at or above 200% FPL did not find any significant interactions between percentage of FPL and either chronic disease level (P = .86) or insurance payer (P = .83) on financial distress.
Medical Financial Burden
Overall, 160 parents (30%; 95% CI, 27-35) reported having medical financial burden, with 86 of those parents (54%) indicating their financial burden was related to their child’s medical care (Table 1). Compared with families with no such medical financial burden, respondents with medical financial burden, either child related or child unrelated, had significantly lower mean IFDFW scores (Figure), which indicates overall higher financial distress in these families. However, some families with low financial distress also reported medical financial burden.
Adjusted analyses demonstrated that, compared with families of children with no-CD, families of children with C-CD (adjusted odds ratio [AOR], 4.98; 95% CI, 2.41-10.29) or NC-CD (AOR, 2.57; 95% CI, 1.11-5.93) had significantly higher odds of having child-related medical financial burden (Table 3). Families of children with NC-CD were also more likely than families of children with no-CD to have child-unrelated medical burden (Table 3). Percentage of FPL was the only other significant predictor of child-related and child-unrelated medical financial burden (Table 3), but as with the distribution of financial distress, medical financial burden was seen across family income brackets (Appendix Figure 1b).
DISCUSSION
In this multicenter study of parents of hospitalized children, almost one in four families experienced high financial distress and almost one in three families reported having medical financial burden, with both measures of financial difficulty affecting families across all income levels. While these percentages are not substantially higher than those seen in the general population,27,34 70% of our population was composed of children with chronic disease who are more likely to have short-term and long-term healthcare needs, which places them at risk for significant ongoing medical costs.
We hypothesized that families of children with complex chronic disease would have higher levels of financial difficulties,13,35,36 but we found that level of chronic disease was associated only with medical financial burden and not with high financial distress. Financial distress is likely multifactorial and dynamic, with different drivers across various income levels. Therefore, while medical financial burden likely contributes to high financial distress, there may be other contributing factors not captured by the IFDFW. However, subjective medical financial burden has still been associated with impaired access to care.10,34 Therefore, our results suggest that families of children with chronic diseases might be at higher risk for barriers to consistent healthcare because of the financial burden their frequent healthcare utilization incurs.
Household poverty level was also associated with financial distress and medical financial burden, although surprisingly both measures of financial difficulty were present in all FPL brackets. This highlights an important reality that financial vulnerability extends beyond income and federally defined “poverty.” Non-income factors, such as high local costs of living and the growing problem of underinsurance, may significantly contribute to financial difficulty, which may render static financial metrics such as percentage of FPL insufficient screeners. Furthermore, as evidenced by the nearly 10% of our respondents who declined to provide their income information, this is a sensitive topic for some families, so gathering income data during admission could likely be a nonstarter.
In the absence of other consistent predictors of financial difficulty that could trigger interventions such as an automatic financial counselor consult, hospitals and healthcare providers could consider implementing routine non-income based financial screening questions on admission, such as one assessing medical financial burden, as a nondiscriminatory way of identifying at-risk families and provide further education and assistance regarding their financial needs. Systematically gathering this data may also further demonstrate the need for broad financial navigation programs as a mainstay in comprehensive inpatient care.
We acknowledge several limitations of this study. Primarily, we surveyed families prior to discharge and receipt of hospitalization-related bills, and these bills could contribute significantly to financial difficulties. While the families of children with chronic disease, who likely have recurrent medical bills, did not demonstrate higher financial distress, it is possible that the overall rate of financial difficulties would have been higher had we surveyed families several weeks after discharge. Our measures of financial difficulty were also subjective and, therefore, at risk for response biases (such as recall bias) that could have misestimated the prevalence of these problems in our population. However, published literature on the IFDFW scale demonstrates concordance between the subjective score and tangible outcomes of financial distress (eg, contacting a credit agency). The IFDFW scale was validated in the general population, and although it has been used in studies of medical populations,37-41 none have been in hospitalized populations, which may affect the scale’s applicability in our study. The study was also conducted only at university-affiliated children’s hospitals, and although these hospitals are geographically diverse, most children in the United States are admitted to general or community hospitals.31 Our population was also largely White, non-Hispanic/Latino, and English speaking. Therefore, our sample may not reflect the general population of hospitalized children and their families. We also assigned levels of chronic disease based on manual EHR review. While the EHR should capture each patient’s breadth of medical issues, inaccurate or missing documentation could have led to misclassification of complexity in some cases. Additionally, our sample size was calculated to detect fairly large differences in our primary outcome, and some of our unexpected results may have resulted from this study being underpowered for detection of smaller, but perhaps still clinically relevant, differences. Finally, we do not have data for several possible confounders in our study, such as employment status, health insurance concordance among family members, or sources of supplemental income, that may impact a family’s overall financial health, along with some potential important hospital-based screening characteristics, such as admitting service team or primary diagnosis.
CONCLUSION
Financial difficulties are common in families of hospitalized pediatric patients. Low-income families and those who have children with chronic conditions are at particular risk; however, all subsets of families can be affected. Given the potential negative health outcomes financial difficulties impose on families and children, the ability to identify and support vulnerable families is a crucial component of care. Hospitalization may be a prime opportunity to identify and support our at-risk families.
Acknowledgments
The authors would like to thank the parents at each of the study sites for their participation, as well as the multiple research coordinators across the study sites for assisting in recruitment of families, survey administration, and data collection. KT Park, MD, MS (Stanford University School of Medicine) served as an adviser for the study’s design.
Disclosures
All authors have no financial relationships or conflicts of interest relevant to this article to disclose.
1. Blumberg LJ, Waidmann TA, Blavin F, Roth J. Trends in health care financial burdens, 2001 to 2009. Milbank Q. 2014;92(1):88-113. https://doi.org/10.1111/1468-0009.12042
2. Claxton G, Rae M, Long M, et al. Employer Health Benefits, 2015 Annual Survey. Kaiser Family Foundation; 2015. http://files.kff.org/attachment/report-2015-employer-health-benefits-survey
3. Long M, Rae M, Claxton G, et al. Recent trends in employer-sponsored insurance premiums. JAMA. 2016;315(1):18. https://doi.org/10.1001/jama.2015.17349
4. Patients’ perspectives on health care in the United States: A look at seven states and the nation. Press release. NPR, Robert Wood Johnson Foundation, Harvard T.H. Chan School of Public Health; February 29, 2016. Accessed February 23, 2018. https://www.rwjf.org/en/library/research/2016/02/patients--perspectives-on-health-care-in-the-united-states.html
5. May JH, Cunningham PJ. Tough trade-offs: medical bills, family finances and access to care. Issue Brief Cent Stud Health Syst Change. 2004;(85):1-4.
6. Tu HT. Rising health costs, medical debt and chronic conditions. Issue Brief Cent Stud Health Syst Change. 2004;(88):1-5.
7. Richman IB, Brodie M. A National study of burdensome health care costs among non-elderly Americans. BMC Health Serv Res. 2014;14:435. https://doi.org/10.1186/1472-6963-14-435
8. Choudhry NK, Saya UY, Shrank WH, et al. Cost-related medication underuse: prevalence among hospitalized managed care patients. J Hosp Med. 2012;7(2):104-109. https://doi.org/10.1002/jhm.948
9. QuickStats: percentage of persons of all ages who delayed or did not receive medical care during the preceding year because of cost, by U.S. Census region of residence—National Health Interview Survey, 2015. MMWR Morb Mortal Wkly Rep. 2017;66(4):121. https://dx.doi.org/10.15585/mmwr.mm6604a9
10. Doty MM, Ho A, Davis K. How High Is Too High? Implications of High-Deductible Health Plans. The Commonwealth Fund; April 1, 2005. Accessed February 24, 2018. http://www.commonwealthfund.org/publications/fund-reports/2005/apr/how-high-is-too-high--implications-of-high-deductible-health-plans
11. Doty MM, Edwards JN, Holmgren AL. Seeing Red: American Driven into Debt by Medical Bills. The Commonwealth Fund; August 1, 2005. Accessed October 24, 2018. https://www.commonwealthfund.org/publications/issue-briefs/2005/aug/seeing-red-americans-driven-debt-medical-bills
12. Altice CK, Banegas MP, Tucker-Seeley RD, Yabroff KR. Financial hardships experienced by cancer survivors: a systematic review. J Natl Cancer Inst. 2016;109(2):djw205. https://doi.org/10.1093/jnci/djw205
13. Ghandour RM, Hirai AH, Blumberg SJ, Strickland BB, Kogan MD. Financial and nonfinancial burden among families of CSHCN: changes between 2001 and 2009-2010. Acad Pediatr. 2014;14(1):92-100. https://doi.org/10.1016/j.acap.2013.10.001
14. Thomson J, Shah SS, Simmons JM, et al. Financial and social hardships in families of children with medical complexity. J Pediatr. 2016;172:187-193.e1. https://doi.org/10.1016/j.jpeds.2016.01.049
15. Kuhlthau K, Kahn R, Hill KS, Gnanasekaran S, Ettner SL. The well-being of parental caregivers of children with activity limitations. Matern Child Health J. 2010;14(2):155-163. https://doi.org/10.1007/s10995-008-0434-1
16. Kuhlthau KA, Perrin JM. Child health status and parental employment. Arch Pediatr Adolesc Med. 2001;155(12):1346-1350. https://doi.org/10.1001/archpedi.155.12.1346
17. Witt WP, Gottlieb CA, Hampton J, Litzelman K. The impact of childhood activity limitations on parental health, mental health, and workdays lost in the United States. Acad Pediatr. 2009;9(4):263-269. https://doi.org/10.1016/j.acap.2009.02.008
18. Wisk LE, Witt WP. Predictors of delayed or forgone needed health care for families with children. Pediatrics. 2012;130(6):1027-1037. https://doi.org/10.1542/peds.2012-0668
19. Davidoff AJ. Insurance for children with special health care needs: patterns of coverage and burden on families to provide adequate insurance. Pediatrics. 2004;114(2):394-403. https://doi.org/10.1542/peds.114.2.394
20. Galbraith AA, Wong ST, Kim SE, Newacheck PW. Out-of-pocket financial burden for low-income families with children: socioeconomic disparities and effects of insurance. Health Serv Res. 2005;40(6 Pt 1):1722-1736. https://doi.org/10.1111/j.1475-6773.2005.00421.x
21. Berry JG, Hall DE, Kuo DZ, et al. Hospital utilization and characteristics of patients experiencing recurrent readmissions within children’s hospitals. JAMA. 2011;305(7):682-690. https://doi.org/10.1001/jama.2011.122
22. Berry JG, Hall M, Hall DE, et al. Inpatient growth and resource use in 28 children’s hospitals: a longitudinal, multi-institutional study. JAMA Pediatrics. 2013;167(2):170-177. https://doi.org/10.1001/jamapediatrics.2013.432
23. Chang LV, Shah AN, Hoefgen ER, et al. Lost earnings and nonmedical expenses of pediatric hospitalizations. Pediatrics. 2018;142(3):e20180195. https://doi.org/10.1542/peds.2018-0195
24. Banegas MP, Dickerson JF, Friedman NL, et al. Evaluation of a novel financial navigator pilot to address patient concerns about medical care costs. Perm J. 2019;23:18-084. https://doi.org/10.7812/tpp/18-084
25. Shankaran V, Leahy T, Steelquist J, et al. Pilot feasibility study of an oncology financial navigation program. J Oncol Pract. 2018;14(2):e122-e129. https://doi.org/10.1200/jop.2017.024927
26. Yezefski T, Steelquist J, Watabayashi K, Sherman D, Shankaran V. Impact of trained oncology financial navigators on patient out-of-pocket spending. Am J Manag Care. 2018;24(5 Suppl):S74-S79.
27. Prawitz AD, Garman ET, Sorhaindo B, O’Neill B, Kim J, Drentea P. InCharge Financial Distress/Financial Well-Being Scale: Development, Administration, and Score Interpretation. J Financial Counseling Plann. 2006;17(1):34-50. https://doi.org/10.1037/t60365-000
28. Cohen RA, Kirzinger WK. Financial burden of medical care: a family perspective. NCHS Data Brief. 2014;(142):1-8.
29. Galbraith AA, Ross-Degnan D, Soumerai SB, Rosenthal MB, Gay C, Lieu TA. Nearly half of families in high-deductible health plans whose members have chronic conditions face substantial financial burden. Health Aff (Millwood). 2011;30(2):322-331. https://doi.org/10.1377/hlthaff.2010.0584
30. Simon TD, Cawthon ML, Stanford S, et al. Pediatric medical complexity algorithm: a new method to stratify children by medical complexity. Pediatrics. 2014;133(6):e1647-e1654. https://doi.org/10.1542/peds.2013-3875
31. Leyenaar JK, Ralston SL, Shieh MS, Pekow PS, Mangione-Smith R, Lindenauer PK. Epidemiology of pediatric hospitalizations at general hospitals and freestanding children’s hospitals in the United States. J Hosp Med. 2016;11(11):743-749. https://doi.org/10.1002/jhm.2624
32. Rubin DB. Multiple Imputation for Nonresponse in Surveys. John Wiley and Sons; 1987.
33. R: A language and environment for statistical computing. R Foundation for Statistical Computing; 2018. https://www.R-project.org/
34. Hamel L, Norton M, Pollitz K, Levitt L, Claxton G, Brodie M. The Burden of Medical Debt: Results from the Kaiser Family Foundation/New York Times Medical Bills Survey. Kaiser Family Foundation; January 5, 2016. Accessed February 26, 2019. https://www.kff.org/wp-content/uploads/2016/01/8806-the-burden-of-medical-debt-results-from-the-kaiser-family-foundation-new-york-times-medical-bills-survey.pdf
35. Witt WP, Litzelman K, Mandic CG, et al. Healthcare-related financial burden among families in the U.S.: the role of childhood activity limitations and income. J Fam Econ Issues. 2011;32(2):308-326. https://doi.org/10.1007/s10834-011-9253-4
36. Zan H, Scharff RL. The heterogeneity in financial and time burden of caregiving to children with chronic conditions. Matern Child Health J. 2015;19(3):615-625. https://doi.org/10.1007/s10995-014-1547-3
37. Irwin B, Kimmick G, Altomare I, et al. Patient experience and attitudes toward addressing the cost of breast cancer care. Oncologist. 2014;19(11):1135-1140. https://doi.org/10.1634/theoncologist.2014-0117
38. Meisenberg BR, Varner A, Ellis E, et al. Patient attitudes regarding the cost of illness in cancer care. Oncologist. 2015;20(10):1199-1204. https://doi.org/10.1634/theoncologist.2015-0168
39. Altomare I, Irwin B, Zafar SY, et al. Physician experience and attitudes toward addressing the cost of cancer care. J Oncol Pract. 2016;12(3):e281-288, 247-288. https://doi.org/10.1200/jop.2015.007401
40. Starkey AJ, Keane CR, Terry MA, Marx JH, Ricci EM. Financial distress and depressive symptoms among African American women: identifying financial priorities and needs and why it matters for mental health. J Urban Health. 2013;90(1):83-100. https://doi.org/10.1007/s11524-012-9755-x
41. Amanatullah DF, Murasko MJ, Chona DV, Crijns TJ, Ring D, Kamal RN. Financial distress and discussing the cost of total joint arthroplasty. J Arthroplasty. 2018;33(11):3394-3397. https://doi.org/10.1016/j.arth.2018.07.010
© 2020 Society of Hospital Medicine
Managing Eating Disorders on a General Pediatrics Unit: A Centralized Video Monitoring Pilot
Hospitalizations for nutritional rehabilitation of patients with restrictive eating disorders are increasing.1 Among primary mental health admissions at free-standing children’s hospitals, eating disorders represent 5.5% of hospitalizations and are associated with the longest length of stay (LOS; mean 14.3 days) and costliest care (mean $46,130).2 Admission is necessary to ensure initial weight restoration and monitoring for symptoms of refeeding syndrome, including electrolyte shifts and vital sign abnormalities.3-5
Supervision is generally considered an essential element of caring for hospitalized patients with eating disorders, who may experience difficulty adhering to nutritional treatment, perform excessive movement or exercise, or demonstrate purging or self-harming behaviors. Supervision is presumed to prevent counterproductive behaviors, facilitating weight gain and earlier discharge to psychiatric treatment. Best practices for patient supervision to address these challenges have not been established but often include meal time or continuous one-to-one supervision by nursing assistants (NAs) or other staff.6,7 While meal supervision has been shown to decrease medical LOS, it is costly, reduces staff availability for the care of other patient care, and can be a barrier to caring for patients with eating disorders in many institutions.8
Although not previously used in patients with eating disorders, centralized video monitoring (CVM) may provide an additional mode of supervision. CVM is an emerging technology consisting of real-time video streaming, without video recording, enabling tracking of patient movement, redirection of behaviors, and communication with unit nurses when necessary. CVM has been used in multiple patient safety initiatives to reduce falls, address staffing shortages, reduce costs,9,10 supervise patients at risk for self-harm or elopement, and prevent controlled medication diversion.10,11
We sought to pilot a novel use of CVM to replace our institution’s standard practice of continuous one-to-one nursing assistant (NA) supervision of patients admitted for medical stabilization of an eating disorder. Our objective was to evaluate the supervision cost and feasibility of CVM, using LOS and days to weight gain as balancing measures.
METHODS
Setting and Participants
This retrospective cohort study included patients 12-18 years old admitted to the pediatric hospital medicine service on a general unit of an academic quaternary care children’s hospital for medical stabilization of an eating disorder between September 2013 and March 2017. Patients were identified using administrative data based on primary or secondary diagnosis of anorexia nervosa, eating disorder not other wise specified, or another specified eating disorder (ICD 9 3071, 20759, or ICD 10 f5000, 5001, f5089, f509).12,13 This research study was considered exempt by the University of Wisconsin School of Medicine and Public Health’s Institutional Review Board.
Supervision Interventions
A standard medical stabilization protocol was used for patients admitted with an eating disorder throughout the study period (Appendix). All patients received continuous one-to-one NA supervision until they reached the target calorie intake and demonstrated the ability to follow the nutritional meal protocol. Beginning July 2015, patients received continuous CVM supervision unless they expressed suicidal ideation (SI), which triggered one-to-one NA supervision until they no longer endorsed suicidality.
Centralized Video Monitoring Implementation
Institutional CVM technology was AvaSys TeleSitter Solution (AvaSure, Inc). Our institution purchased CVM devices for use in adult settings, and one was assigned for pediatric CVM. Mobile CVM video carts were deployed to patient rooms and generated live video streams, without recorded capture, which were supervised by CVM technicians. These technicians were NAs hired and trained specifically for this role; worked four-, eight-, and 12-hour shifts; and observed up to eight camera feeds on a single monitor in a centralized room. Patients and family members could refuse CVM, which would trigger one-to-one NA supervision. Patients were not observed by CVM while in the restroom; staff were notified by either the patient or technician, and one-to-one supervision was provided. CVM had two-way audio communication, which allowed technicians to redirect patients verbally. Technicians could contact nursing staff directly by phone when additional intervention was needed.
Supervision Costs
NA supervision costs were estimated at $19/hour, based upon institutional human resources average NA salaries at that time. No additional mealtime supervision was included, as in-person supervision was already occurring.
CVM supervision costs were defined as the sum of the device cost plus CVM technician costs and two hours of one-to-one NA mealtime supervision per day. The CVM device cost was estimated at $2.10/hour, assuming a 10-year machine life expectancy (single unit cost $82,893 in 2015, 3,944 hours of use in fiscal year of 2018). CVM technician costs were $19/hour, based upon institutional human resources average CVM technician salaries at that time. Because technicians monitored an average of six patients simultaneously during this study, one-sixth of a CVM technician’s salary (ie, $3.17/hour) was used for each hour of CVM monitoring. Patients with mixed (NA and CVM) supervision were analyzed with those having CVM supervision. These patients’ costs were the sum of their NA supervision costs plus their CVM supervision costs.
Data Collection
Descriptive variables including age, gender, race/ethnicity, insurance, and LOS were collected from administrative data. The duration and type of supervision for all patients were collected from daily staffing logs. The eating disorder protocol standardized the process of obtaining daily weights (Appendix). Days to weight gain following admission were defined as the total number of days from admission to the first day of weight gain that was followed by another day of weight gain or maintaining the same weight
Data Analysis
Patient and hospitalization characteristics were summarized. A sample size of at least 14 in each group was estimated as necessary to detect a 50% reduction in supervision cost between the groups using alpha = 0.05, a power of 80%, a mean cost of $4,400 in the NA group, and a standard deviation of $1,600.Wilcoxon rank-sum tests were used to assess differences in median supervision cost between NA and CVM use. Differences in mean LOS and days to weight gain between NA and CVM use were assessed with t-tests because these data were normally distributed.
RESULTS
Patient Characteristics and Supervision Costs
The study included 37 consecutive admissions (NA = 23 and CVM = 14) with 35 unique patients. Patients were female, primarily non-Hispanic White, and privately insured (Table 1). Median supervision cost for the NA was statistically significantly more expensive at $4,104/admission versus $1,166/admission for CVM (P < .001, Table 2).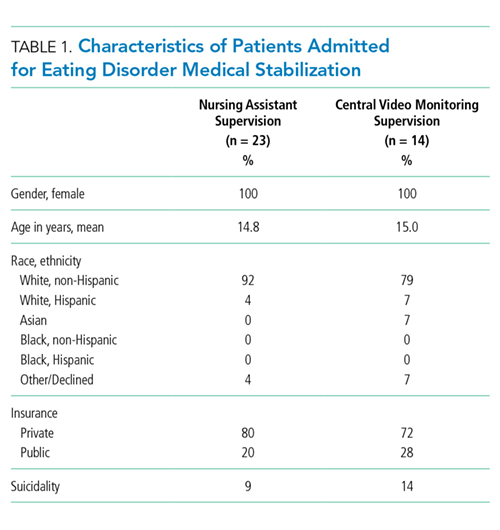
Balancing Measures, Acceptability, and Feasibility
Mean LOS was 11.7 days for NA and 9.8 days for CVM (P = .27; Table 2). The mean number of days to weight gain was 3.1 and 3.6 days, respectively (P = .28). No patients converted from CVM to NA supervision. One patient with SI converted to CVM after SI resolved and two patients required ongoing NA supervision due to continued SI. There were no reported refusals, technology failures, or unplanned discontinuations of CVM. One patient/family reported excessive CVM redirection of behavior.
DISCUSSION
This is the first description of CVM use in adolescent patients or patients with eating disorders. Our results suggest that CVM appears feasible and less costly in this population than one-to-one NA supervision, without statistically significant differences in LOS or time to weight gain. Patients with CVM with any NA supervision (except mealtime alone) were analyzed in the CVM group; therefore, this study may underestimate cost savings from CVM supervision. This innovative use of CVM may represent an opportunity for hospitals to repurpose monitoring technology for more efficient supervision of patients with eating disorders.
This pediatric pilot study adds to the growing body of literature in adult patients suggesting CVM supervision may be a feasible inpatient cost-reduction strategy.9,10 One single-center study demonstrated that the use of CVM with adult inpatients led to fewer unsafe behaviors, eg, patient removal of intravenous catheters and oxygen therapy. Personnel savings exceeded the original investment cost of the monitor within one fiscal quarter.9 Results of another study suggest that CVM use with hospitalized adults who required supervision to prevent falls was associated with improved patient and family satisfaction.14 In the absence of a gold standard for supervision of patients hospitalized with eating disorders, CVM technology is a tool that may balance cost, care quality, and patient experience. Given the upfront investment in CVM units, this technology may be most appropriate for institutions already using CVM for other inpatient indications.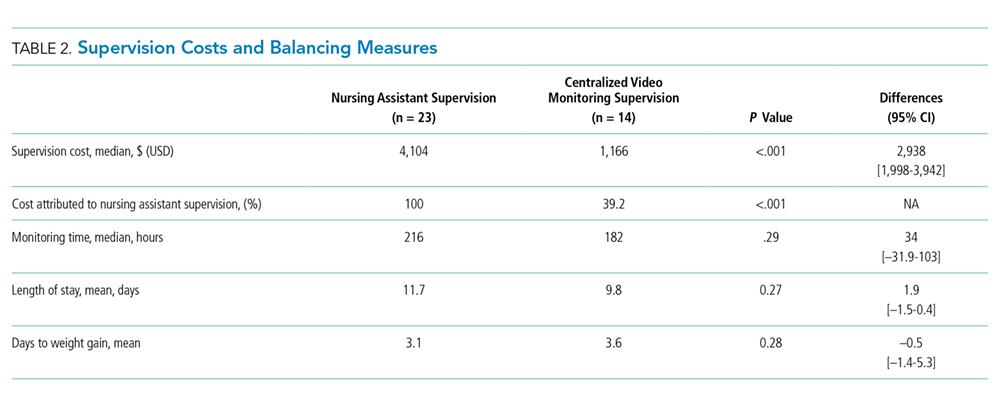
Although our institutional cost of CVM use was similar to that reported by other institutions,11,15 the single-center design of this pilot study limits the generalizability of our findings. Unadjusted results of this observational study may be confounded by indication bias. As this was a pilot study, it was powered to detect a clinically significant difference in cost between NA and CVM supervision. While statistically significant differences were not seen in LOS or weight gain, this pilot study was not powered to detect potential differences or to adjust for all potential confounders (eg, other mental health conditions or comorbidities, eating disorder type, previous hospitalizations). Future studies should include these considerations in estimating sample sizes. The ability to conduct a robust cost-effectiveness analysis was also limited by cost data availability and reliance on staffing assumptions to calculate supervision costs. However, these findings will be important for valid effect size estimates for future interventional studies that rigorously evaluate CVM effectiveness and safety. Patients and families were not formally surveyed about their experiences with CVM, and the patient and family experience is another important outcome to consider in future studies.
CONCLUSION
The results of this pilot study suggest that supervision costs for patients admitted for medical stabilization of eating disorders were statistically significantly lower with CVM when compared with one-to-one NA supervision, without a change in hospitalization LOS or time to weight gain. These findings are particularly important as hospitals seek opportunities to reduce costs while providing safe and effective care. Future efforts should focus on evaluating clinical outcomes and patient experiences with this technology and strategies to maximize efficiency to offset the initial device cost.
Disclosures
The authors have no financial relationships relevant to this article to disclose. The authors have no conflicts of interest relevant to this article to disclose.
1. Zhao Y, Encinosa W. An update on hospitalizations for eating disorders, 1999 to 2009: statistical brief #120. In: Healthcare Cost and Utilization Project (HCUP) Statistical Briefs. Rockville, MD: Agency for Healthcare Research and Quality (US); 2006. PubMed
2. Bardach NS, Coker TR, Zima BT, et al. Common and costly hospitalizations for pediatric mental health disorders. Pediatrics. 2014;133(4):602-609. doi: 10.1542/peds.2013-3165. PubMed
3. Society for Adolescent H, Medicine, Golden NH, et al. Position Paper of the Society for Adolescent Health and Medicine: medical management of restrictive eating disorders in adolescents and young adults. J Adolesc Health. 2015;56(1):121-125. doi: 10.1016/j.jadohealth.2014.10.259. PubMed
4. Katzman DK. Medical complications in adolescents with anorexia nervosa: a review of the literature. Int J Eat Disord. 2005;37(S1):S52-S59; discussion S87-S59. doi: 10.1002/eat.20118. PubMed
5. Strandjord SE, Sieke EH, Richmond M, Khadilkar A, Rome ES. Medical stabilization of adolescents with nutritional insufficiency: a clinical care path. Eat Weight Disord. 2016;21(3):403-410. doi: 10.1007/s40519-015-0245-5. PubMed
6. Kells M, Davidson K, Hitchko L, O’Neil K, Schubert-Bob P, McCabe M. Examining supervised meals in patients with restrictive eating disorders. Appl Nurs Res. 2013;26(2):76-79. doi: 10.1016/j.apnr.2012.06.003. PubMed
7. Leclerc A, Turrini T, Sherwood K, Katzman DK. Evaluation of a nutrition rehabilitation protocol in hospitalized adolescents with restrictive eating disorders. J Adolesc Health. 2013;53(5):585-589. doi: 10.1016/j.jadohealth.2013.06.001. PubMed
8. Kells M, Schubert-Bob P, Nagle K, et al. Meal supervision during medical hospitalization for eating disorders. Clin Nurs Res. 2017;26(4):525-537. doi: 10.1177/1054773816637598. PubMed
9. Jeffers S, Searcey P, Boyle K, et al. Centralized video monitoring for patient safety: a Denver Health Lean journey. Nurs Econ. 2013;31(6):298-306. PubMed
10. Sand-Jecklin K, Johnson JR, Tylka S. Protecting patient safety: can video monitoring prevent falls in high-risk patient populations? J Nurs Care Qual. 2016;31(2):131-138. doi: 10.1097/NCQ.0000000000000163. PubMed
11. Burtson PL, Vento L. Sitter reduction through mobile video monitoring: a nurse-driven sitter protocol and administrative oversight. J Nurs Adm. 2015;45(7-8):363-369. doi: 10.1097/NNA.0000000000000216. PubMed
12. Prevention CfDCa. ICD-9-CM Guidelines, 9th ed. https://www.cdc.gov/nchs/data/icd/icd9cm_guidelines_2011.pdf. Accessed April 11, 2018.
13. Prevention CfDca. IDC-9-CM Code Conversion Table. https://www.cdc.gov/nchs/data/icd/icd-9-cm_fy14_cnvtbl_final.pdf. Accessed April 11, 2018.
14. Cournan M, Fusco-Gessick B, Wright L. Improving patient safety through video monitoring. Rehabil Nurs. 2016. doi: 10.1002/rnj.308. PubMed
15. Rochefort CM, Ward L, Ritchie JA, Girard N, Tamblyn RM. Patient and nurse staffing characteristics associated with high sitter use costs. J Adv Nurs. 2012;68(8):1758-1767. doi: 10.1111/j.1365-2648.2011.05864.x. PubMed
Hospitalizations for nutritional rehabilitation of patients with restrictive eating disorders are increasing.1 Among primary mental health admissions at free-standing children’s hospitals, eating disorders represent 5.5% of hospitalizations and are associated with the longest length of stay (LOS; mean 14.3 days) and costliest care (mean $46,130).2 Admission is necessary to ensure initial weight restoration and monitoring for symptoms of refeeding syndrome, including electrolyte shifts and vital sign abnormalities.3-5
Supervision is generally considered an essential element of caring for hospitalized patients with eating disorders, who may experience difficulty adhering to nutritional treatment, perform excessive movement or exercise, or demonstrate purging or self-harming behaviors. Supervision is presumed to prevent counterproductive behaviors, facilitating weight gain and earlier discharge to psychiatric treatment. Best practices for patient supervision to address these challenges have not been established but often include meal time or continuous one-to-one supervision by nursing assistants (NAs) or other staff.6,7 While meal supervision has been shown to decrease medical LOS, it is costly, reduces staff availability for the care of other patient care, and can be a barrier to caring for patients with eating disorders in many institutions.8
Although not previously used in patients with eating disorders, centralized video monitoring (CVM) may provide an additional mode of supervision. CVM is an emerging technology consisting of real-time video streaming, without video recording, enabling tracking of patient movement, redirection of behaviors, and communication with unit nurses when necessary. CVM has been used in multiple patient safety initiatives to reduce falls, address staffing shortages, reduce costs,9,10 supervise patients at risk for self-harm or elopement, and prevent controlled medication diversion.10,11
We sought to pilot a novel use of CVM to replace our institution’s standard practice of continuous one-to-one nursing assistant (NA) supervision of patients admitted for medical stabilization of an eating disorder. Our objective was to evaluate the supervision cost and feasibility of CVM, using LOS and days to weight gain as balancing measures.
METHODS
Setting and Participants
This retrospective cohort study included patients 12-18 years old admitted to the pediatric hospital medicine service on a general unit of an academic quaternary care children’s hospital for medical stabilization of an eating disorder between September 2013 and March 2017. Patients were identified using administrative data based on primary or secondary diagnosis of anorexia nervosa, eating disorder not other wise specified, or another specified eating disorder (ICD 9 3071, 20759, or ICD 10 f5000, 5001, f5089, f509).12,13 This research study was considered exempt by the University of Wisconsin School of Medicine and Public Health’s Institutional Review Board.
Supervision Interventions
A standard medical stabilization protocol was used for patients admitted with an eating disorder throughout the study period (Appendix). All patients received continuous one-to-one NA supervision until they reached the target calorie intake and demonstrated the ability to follow the nutritional meal protocol. Beginning July 2015, patients received continuous CVM supervision unless they expressed suicidal ideation (SI), which triggered one-to-one NA supervision until they no longer endorsed suicidality.
Centralized Video Monitoring Implementation
Institutional CVM technology was AvaSys TeleSitter Solution (AvaSure, Inc). Our institution purchased CVM devices for use in adult settings, and one was assigned for pediatric CVM. Mobile CVM video carts were deployed to patient rooms and generated live video streams, without recorded capture, which were supervised by CVM technicians. These technicians were NAs hired and trained specifically for this role; worked four-, eight-, and 12-hour shifts; and observed up to eight camera feeds on a single monitor in a centralized room. Patients and family members could refuse CVM, which would trigger one-to-one NA supervision. Patients were not observed by CVM while in the restroom; staff were notified by either the patient or technician, and one-to-one supervision was provided. CVM had two-way audio communication, which allowed technicians to redirect patients verbally. Technicians could contact nursing staff directly by phone when additional intervention was needed.
Supervision Costs
NA supervision costs were estimated at $19/hour, based upon institutional human resources average NA salaries at that time. No additional mealtime supervision was included, as in-person supervision was already occurring.
CVM supervision costs were defined as the sum of the device cost plus CVM technician costs and two hours of one-to-one NA mealtime supervision per day. The CVM device cost was estimated at $2.10/hour, assuming a 10-year machine life expectancy (single unit cost $82,893 in 2015, 3,944 hours of use in fiscal year of 2018). CVM technician costs were $19/hour, based upon institutional human resources average CVM technician salaries at that time. Because technicians monitored an average of six patients simultaneously during this study, one-sixth of a CVM technician’s salary (ie, $3.17/hour) was used for each hour of CVM monitoring. Patients with mixed (NA and CVM) supervision were analyzed with those having CVM supervision. These patients’ costs were the sum of their NA supervision costs plus their CVM supervision costs.
Data Collection
Descriptive variables including age, gender, race/ethnicity, insurance, and LOS were collected from administrative data. The duration and type of supervision for all patients were collected from daily staffing logs. The eating disorder protocol standardized the process of obtaining daily weights (Appendix). Days to weight gain following admission were defined as the total number of days from admission to the first day of weight gain that was followed by another day of weight gain or maintaining the same weight
Data Analysis
Patient and hospitalization characteristics were summarized. A sample size of at least 14 in each group was estimated as necessary to detect a 50% reduction in supervision cost between the groups using alpha = 0.05, a power of 80%, a mean cost of $4,400 in the NA group, and a standard deviation of $1,600.Wilcoxon rank-sum tests were used to assess differences in median supervision cost between NA and CVM use. Differences in mean LOS and days to weight gain between NA and CVM use were assessed with t-tests because these data were normally distributed.
RESULTS
Patient Characteristics and Supervision Costs
The study included 37 consecutive admissions (NA = 23 and CVM = 14) with 35 unique patients. Patients were female, primarily non-Hispanic White, and privately insured (Table 1). Median supervision cost for the NA was statistically significantly more expensive at $4,104/admission versus $1,166/admission for CVM (P < .001, Table 2).
Balancing Measures, Acceptability, and Feasibility
Mean LOS was 11.7 days for NA and 9.8 days for CVM (P = .27; Table 2). The mean number of days to weight gain was 3.1 and 3.6 days, respectively (P = .28). No patients converted from CVM to NA supervision. One patient with SI converted to CVM after SI resolved and two patients required ongoing NA supervision due to continued SI. There were no reported refusals, technology failures, or unplanned discontinuations of CVM. One patient/family reported excessive CVM redirection of behavior.
DISCUSSION
This is the first description of CVM use in adolescent patients or patients with eating disorders. Our results suggest that CVM appears feasible and less costly in this population than one-to-one NA supervision, without statistically significant differences in LOS or time to weight gain. Patients with CVM with any NA supervision (except mealtime alone) were analyzed in the CVM group; therefore, this study may underestimate cost savings from CVM supervision. This innovative use of CVM may represent an opportunity for hospitals to repurpose monitoring technology for more efficient supervision of patients with eating disorders.
This pediatric pilot study adds to the growing body of literature in adult patients suggesting CVM supervision may be a feasible inpatient cost-reduction strategy.9,10 One single-center study demonstrated that the use of CVM with adult inpatients led to fewer unsafe behaviors, eg, patient removal of intravenous catheters and oxygen therapy. Personnel savings exceeded the original investment cost of the monitor within one fiscal quarter.9 Results of another study suggest that CVM use with hospitalized adults who required supervision to prevent falls was associated with improved patient and family satisfaction.14 In the absence of a gold standard for supervision of patients hospitalized with eating disorders, CVM technology is a tool that may balance cost, care quality, and patient experience. Given the upfront investment in CVM units, this technology may be most appropriate for institutions already using CVM for other inpatient indications.
Although our institutional cost of CVM use was similar to that reported by other institutions,11,15 the single-center design of this pilot study limits the generalizability of our findings. Unadjusted results of this observational study may be confounded by indication bias. As this was a pilot study, it was powered to detect a clinically significant difference in cost between NA and CVM supervision. While statistically significant differences were not seen in LOS or weight gain, this pilot study was not powered to detect potential differences or to adjust for all potential confounders (eg, other mental health conditions or comorbidities, eating disorder type, previous hospitalizations). Future studies should include these considerations in estimating sample sizes. The ability to conduct a robust cost-effectiveness analysis was also limited by cost data availability and reliance on staffing assumptions to calculate supervision costs. However, these findings will be important for valid effect size estimates for future interventional studies that rigorously evaluate CVM effectiveness and safety. Patients and families were not formally surveyed about their experiences with CVM, and the patient and family experience is another important outcome to consider in future studies.
CONCLUSION
The results of this pilot study suggest that supervision costs for patients admitted for medical stabilization of eating disorders were statistically significantly lower with CVM when compared with one-to-one NA supervision, without a change in hospitalization LOS or time to weight gain. These findings are particularly important as hospitals seek opportunities to reduce costs while providing safe and effective care. Future efforts should focus on evaluating clinical outcomes and patient experiences with this technology and strategies to maximize efficiency to offset the initial device cost.
Disclosures
The authors have no financial relationships relevant to this article to disclose. The authors have no conflicts of interest relevant to this article to disclose.
1. Zhao Y, Encinosa W. An update on hospitalizations for eating disorders, 1999 to 2009: statistical brief #120. In: Healthcare Cost and Utilization Project (HCUP) Statistical Briefs. Rockville, MD: Agency for Healthcare Research and Quality (US); 2006. PubMed
2. Bardach NS, Coker TR, Zima BT, et al. Common and costly hospitalizations for pediatric mental health disorders. Pediatrics. 2014;133(4):602-609. doi: 10.1542/peds.2013-3165. PubMed
3. Society for Adolescent H, Medicine, Golden NH, et al. Position Paper of the Society for Adolescent Health and Medicine: medical management of restrictive eating disorders in adolescents and young adults. J Adolesc Health. 2015;56(1):121-125. doi: 10.1016/j.jadohealth.2014.10.259. PubMed
4. Katzman DK. Medical complications in adolescents with anorexia nervosa: a review of the literature. Int J Eat Disord. 2005;37(S1):S52-S59; discussion S87-S59. doi: 10.1002/eat.20118. PubMed
5. Strandjord SE, Sieke EH, Richmond M, Khadilkar A, Rome ES. Medical stabilization of adolescents with nutritional insufficiency: a clinical care path. Eat Weight Disord. 2016;21(3):403-410. doi: 10.1007/s40519-015-0245-5. PubMed
6. Kells M, Davidson K, Hitchko L, O’Neil K, Schubert-Bob P, McCabe M. Examining supervised meals in patients with restrictive eating disorders. Appl Nurs Res. 2013;26(2):76-79. doi: 10.1016/j.apnr.2012.06.003. PubMed
7. Leclerc A, Turrini T, Sherwood K, Katzman DK. Evaluation of a nutrition rehabilitation protocol in hospitalized adolescents with restrictive eating disorders. J Adolesc Health. 2013;53(5):585-589. doi: 10.1016/j.jadohealth.2013.06.001. PubMed
8. Kells M, Schubert-Bob P, Nagle K, et al. Meal supervision during medical hospitalization for eating disorders. Clin Nurs Res. 2017;26(4):525-537. doi: 10.1177/1054773816637598. PubMed
9. Jeffers S, Searcey P, Boyle K, et al. Centralized video monitoring for patient safety: a Denver Health Lean journey. Nurs Econ. 2013;31(6):298-306. PubMed
10. Sand-Jecklin K, Johnson JR, Tylka S. Protecting patient safety: can video monitoring prevent falls in high-risk patient populations? J Nurs Care Qual. 2016;31(2):131-138. doi: 10.1097/NCQ.0000000000000163. PubMed
11. Burtson PL, Vento L. Sitter reduction through mobile video monitoring: a nurse-driven sitter protocol and administrative oversight. J Nurs Adm. 2015;45(7-8):363-369. doi: 10.1097/NNA.0000000000000216. PubMed
12. Prevention CfDCa. ICD-9-CM Guidelines, 9th ed. https://www.cdc.gov/nchs/data/icd/icd9cm_guidelines_2011.pdf. Accessed April 11, 2018.
13. Prevention CfDca. IDC-9-CM Code Conversion Table. https://www.cdc.gov/nchs/data/icd/icd-9-cm_fy14_cnvtbl_final.pdf. Accessed April 11, 2018.
14. Cournan M, Fusco-Gessick B, Wright L. Improving patient safety through video monitoring. Rehabil Nurs. 2016. doi: 10.1002/rnj.308. PubMed
15. Rochefort CM, Ward L, Ritchie JA, Girard N, Tamblyn RM. Patient and nurse staffing characteristics associated with high sitter use costs. J Adv Nurs. 2012;68(8):1758-1767. doi: 10.1111/j.1365-2648.2011.05864.x. PubMed
© 2019 Society of Hospital Medicine