User login
Ultrasound and Pleural Effusions
Hospitalists commonly encounter pleural effusions, and their detection and characterization by point‐of‐care ultrasound can guide management. Approximately 44% to 57% of hospitalized patients with bacterial pneumonia,[1, 2] and up to 62% of intensive care unit (ICU) patients[3] have a pleural effusion. For patients with a parapneumonic effusion, hospitalists can use ultrasound to quantify and characterize pleural fluid to determine whether diagnostic or therapeutic drainage is indicated, as well as guide performance of thoracentesis. For patients with lung cancer, detection of a malignant pleural effusion changes staging to stage IV, regardless of tumor size or lymph node involvement, and hospitalists may discuss more appropriate treatment options with patients and consultants.
Routine use of pleural ultrasonography may help hospitalists provide high‐value care by reducing ancillary testing, including computerized tomography (CT) scans that expose patients to ionizing radiation, and reducing complications of thoracentesis. However, many hospitalists may not be familiar with the use of point‐of‐care ultrasound. A national survey in 2012 revealed only 25% of internal medicine residencies have formal curricula to teach point‐of‐care ultrasonography.[4] The purpose of this review is to provide an overview of how point‐of‐care ultrasound can be utilized by hospitalists in the care of patients with pleural effusions. We review the literature on the diagnosis and evaluation of pleural effusions with ultrasound, as well as techniques to examine and drain the pleural space.
DIAGNOSIS OF PLEURAL EFFUSION
History and Physical Exam
Pleural effusions are most commonly associated with heart failure, pneumonia, cancer, pulmonary embolism, viral disease, coronary artery bypass surgery, and cirrhosis with ascites. The most common symptoms related to pleural effusion are nonspecific and often indistinguishable from those of the underlying disease process, including cough, dyspnea, and pleuritic chest pain.[5]
Diagnostic accuracy of a physical examination to detect pleural fluid is highly dependent on the size of the effusion and is unlikely to detect effusions <300 mL. A systematic review found the most accurate physical exam findings to rule in a pleural effusion were dullness to percussion (positive likelihood ratio [LR]: 8.7; 95% CI: 2.2‐33.8) and asymmetric chest expansion (positive LR: 8.1; 95% CI: 5.2‐12.7). Normal tactile vocal fremitus was the most accurate physical exam finding to rule out a pleural effusion (negative LR: 0.21; 95% CI: 0.12‐0.37).[6] A major limitation of all these studies is that physical exam was compared to chest radiography as the reference standard, and posterior‐anterior chest radiographs are not sensitive for detection of pleural effusions until 200 mL of fluid has accumulated.[7] Further, chest percussion penetrates to a maximum depth of 6 cm, and its utility is limited in obese patients.[8] Characteristics of pleural fluid that can change management, such as loculations, cannot be detected by physical exam.
Chest Radiography
Chest radiography has traditionally been used to diagnose pleural effusions. Free‐flowing pleural fluid collects in the most dependent portions of the thorax, initially in the subpulmonic space followed by the costophrenic recesses. Pleural fluid is detectable in the costophrenic recesses on lateral upright chest radiograph after 50 mL has accumulated. On standard posterior‐anterior chest radiograph, blunting of the costophrenic recesses and obliteration of the hemidiaphragm are seen when >200 mL and >500 mL of pleural fluid have accumulated, respectively.[7] However, upright chest radiographs can miss a considerable number of effusions, including as many as 10% of parapneumonic effusions large enough to indicate need for drainage.[9] Supine anterior‐posterior chest radiographs can miss a significant proportion of large effusions seen on chest CT,[10] ultrasound,[11] and lateral decubitus radiographs.[12] Pleural effusions are frequently mistaken for parenchymal opacities on portable anterior‐posterior chest radiographs.[10]
Computerized Tomography
Chest CT serves as the reference standard in most modern diagnostic accuracy studies. Limitations of chest CT include difficulty distinguishing small effusions from pleural thickening, dependent atelectasis, or tumor; lower sensitivity for detecting pleural fluid septations compared to ultrasound[13]; exposure of patients to approximately 7 mSv of ionizing radiation (the equivalent radiation dose of 350 chest radiographs)[14]; high cost; and need to transport patients to radiology departments where CT scanners are located.
Pleural Ultrasonography
Ultrasound can rapidly differentiate conditions that demonstrate a nonspecific, radiopaque appearance of lower lung fields on chest radiographs, including pleural effusions, pneumonia, atelectasis, elevated hemidiaphragm, and lung or pleural masses. Advantages of point‐of‐care ultrasound include the ability of hospitalists to acquire and interpret images at the bedside and integrate findings into clinical decision making immediately. Multiple studies have demonstrated superior diagnostic accuracy of ultrasound compared to chest radiography for detection of pleural effusions. Pleural ultrasound can detect physiologic amounts of pleural fluid (5 mL),[15] but a minimal volume of 20 mL is more reliably detected,[16] and ultrasound is 100% sensitive for effusions >100 mL.[17] In a prospective study of critically ill patients with acute respiratory distress syndrome, the diagnostic accuracy of ultrasound for pleural effusions was superior (93%) compared to auscultation (61%) and anterior‐posterior chest radiograph (47%), using chest CT as the reference standard.[18] A meta‐analysis of 4 studies calculated a pooled sensitivity and specificity of ultrasound for detection of pleural effusions as 93% (95% CI: 89%‐96%) and 96% (95% CI: 95%‐98%), respectively.[18, 19, 20, 21, 22] Ultrasound has the additional benefit of characterizing underlying lung parenchyma, which is well described in the literature but beyond the scope of this review.[23]
Sensitivity and specificity of chest radiography and ultrasonography to detect a pleural effusion are displayed in Table 1.[9, 10, 11, 12, 18, 20, 21, 22, 24, 25, 26]
| Exam | Reference Standard | Sensitivity | Specificity | Study | |
|---|---|---|---|---|---|
| |||||
| Chest radiograph | Supine AP | Upright PA/lateral | 92% | Woodring[24] | |
| Lateral decubitus XR | 67% | 70% | Ruskin[12] | ||
| Ultrasound | 82% | 82% | Emamian[11] | ||
| Ultrasound or thoracentesis | 33% | Kocijancic[25] | |||
| CT | 39% | 85% | Lichtenstein[18] | ||
| CT | 66% | 89% | Kitazano[10] | ||
| CT | 65% | 81% | Xirouchaki[26] | ||
| CT | 78% | 76% | Brixey[9] | ||
| Lateral decubitus | Ultrasound or thoracentesis | 94% | 100% | Kocijancic[25] | |
| Upright PA | CT | 82% | 81% | Brixey[9] | |
| Lateral upright | CT | 86% | 88% | Brixey[9] | |
| Ultrasound | Cardiology | CT | 93% | 88% | Kataoka[20] |
| Point of care | CT or tube thoracostomy | 96% | 100% | Ma[21] | |
| CT | 92% | 93% | Lichtenstein[18] | ||
| CT | 94% | 99% | Rocco[22] | ||
| CT | 100% | 100% | Xirouchaki[26] | ||
PLEURAL ULTRASOUND EXAMINATION
A pleural ultrasound exam may be performed as part of a complete lung ultrasound exam, such as the BLUE (Bedside Lung Ultrasound in Emergency) protocol,[27] or a focused exam to evaluate a suspected or known pleural effusion seen on chest radiograph or CT scan.[27] Free‐flowing pleural effusions accumulate in the most dependent portions of the thorax, most commonly, the posterolateral costophrenic recesses in semirecumbent or seated patients, but anteriorly in mechanically ventilated patients in a prone position.
A low‐frequency (25 MHz) phased‐array transducer is generally preferred for imaging in between the ribs. High‐frequency linear transducers do not provide adequate penetration to visualize deep structures, but do provide superior visualization of the pleural line to assess pleural thickness, measure pleural depth, and evaluate for pneumothorax.
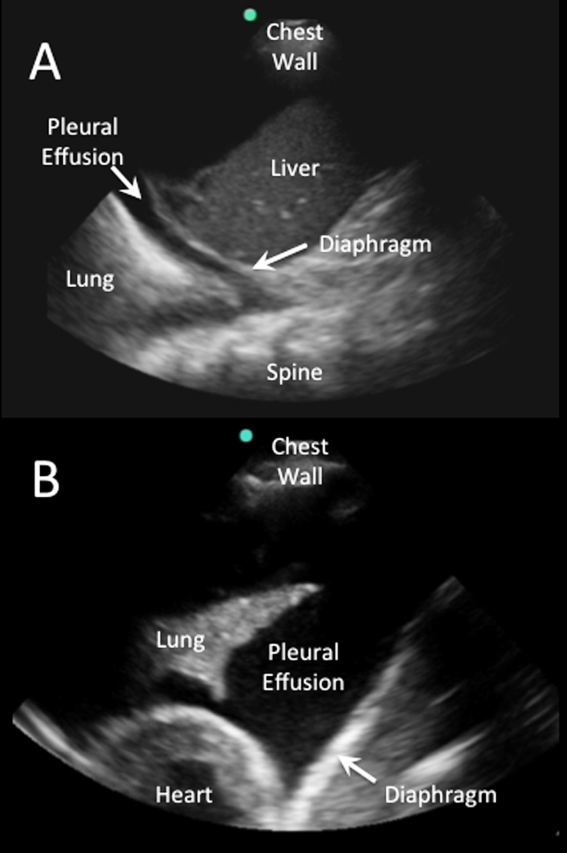
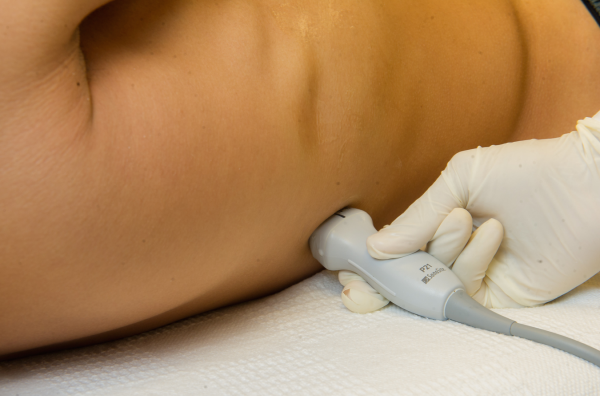
Pleural effusions are best evaluated starting at the level of the diaphragm. Place the transducer in a longitudinal plane on the posterior axillary line at the level of the diaphragm with the transducer orientation marker (notch) pointed cephalad (Figure 1). Five structures must be definitively identified to diagnose a pleural effusion: liver/spleen, diaphragm, pleural fluid, lung, and chest wall (Figure 2A). Large pleural effusions compress the adjacent lung causing atelectasis, which gives the lung a tissue‐like echogenicity similar to the liver (Figure 2B). Static air bronchograms are commonly seen in atelectatic lung bases with pleural effusions.[28]

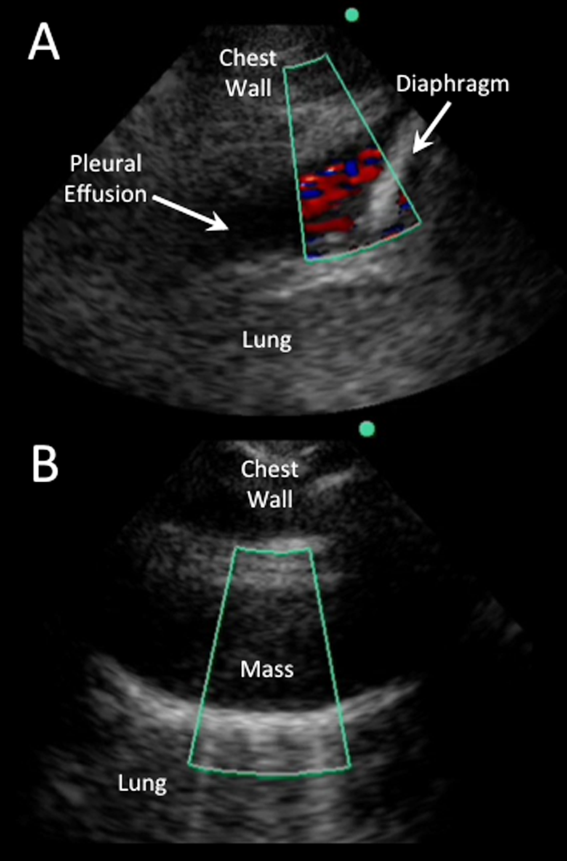
Color flow Doppler and M‐mode ultrasound may be utilized as adjuncts to routine 2‐dimensional ultrasonography. Free‐flowing pleural effusions will demonstrate flow by color Doppler (Figure 3A). Using M‐mode ultrasound, the lung can been seen moving within a pleural effusion to and from the chest wall (sinusoid sign).[29] Absence of flow or movement is seen with dense pleural loculations, pleural thickening, and peripheral lung or pleural masses (Figure 3B).
CHARACTERIZATION OF PLEURAL EFFUSION
Pleural Fluid Volume
Quantification of pleural fluid volume has been proposed using formulas with sonographic measurements.[30, 31, 32] These formulas are most accurate for moderate‐sized effusions but have not been validated beyond individual study cohorts. The largest study (n = 150) found a strong correlation between calculated and actual volumes drained by thoracentesis (r2 = 0.79; P < 0.001) using the formula (Volume [mL] = 16 parietal to visceral pleura distance (mm) at the mid‐diaphragm).[31] Although an accurate quantitative pleural fluid volume assessment may be possible, these formulas are not commonly used in clinical practice. A qualitative assessment is adequate for most clinical decision making using categories of minimal, small, moderate, or large volume.
Simple Versus Complex Effusions
Based on its sonographic appearance, pleural effusions are categorized as simple or complex. Simple pleural effusions are anechoic and usually transudative. Complex pleural effusions are subcategorized as homogeneously or heterogeneously echogenic, with or without septations, and are more often exudative.[33]
Effusions with heterogeneous echogenicity with swirling echoes suggest high cellular content that is often associated with malignancy.[34] Fibrinous stranding, septations, and loculations also suggest an exudative effusion (Figure 4A), and are more readily identified and characterized on lung ultrasound than CT scan.[35]
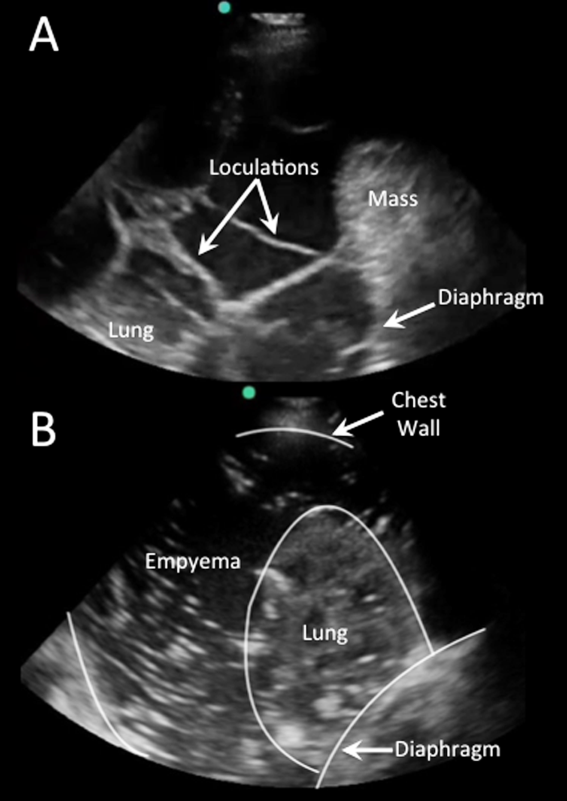
Homogenously echogenic effusions are most often due to hemothorax or empyema.[36] The high cell count of a hemothorax creates a layering effect in costophrenic recesses (hematocrit sign). Empyemas develop from complex effusions that organize into collections of pus and usually have a homogeneously echogenic, speckled appearance (Figure 4B). Sonographic evidence of septations in the presence of empyema predicts the need for intrapleural fibrinolytic therapy, longer duration of drainage, and possible surgical intervention.[37]
Isolated dense loculations may be challenging to differentiate from peripheral lung or pleural lesions, such as abscess or tumor.
Pleural Thickness
Normal visceral and parietal pleura are apposed and 0.2 to 0.3 mm thick.[38] Pleural effusions with parietal pleural thickness >10 mm, pleural nodularity, and diaphragmatic thickness >7 mm predicted underlying malignancy with high specificity and positive predictive value in 1 study.[39] As many as 20% of anechoic lesions of the pleura are solid rather than fluid. Color flow Doppler ultrasound can differentiate small pleural effusions from solid pleural abnormalities with sensitivity and specificity of 89% and 100%, respectively.[40]
PLEURAL FLUID DRAINAGE
Since its first description in 1967, use of ultrasound guidance for thoracentesis has evolved to become the standard of care in many hospitals in the United States.[41] The British Thoracic Society guidelines recommend that all thoracenteses be performed with ultrasound guidance.[42] The American College of Graduate Medical Education now requires proficiency in the use of ultrasound for thoracentesis and pleural catheter insertion by pulmonary and critical care fellows.[43]
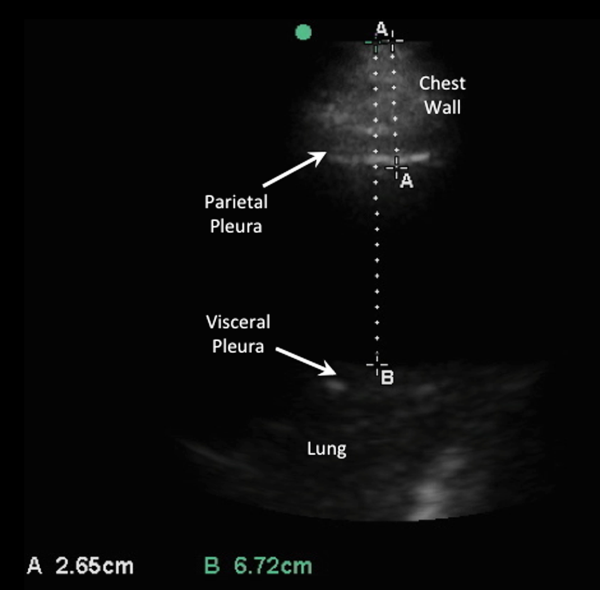
The impetus for these recommendations stems from increased procedural success and decreased complications associated with ultrasound‐guided drainage of pleural effusions. A study evaluating thoracentesis site selection based on physical exam and chest radiographs demonstrated inaccurate site selection in 15% of patients, and use of ultrasound for site selection prevented possible accidental organ puncture in 10% of all cases.[44] The success rate of thoracentesis for small pleural effusions has been shown to increase from 66% to 90% with ultrasound guidance.[42] Using ultrasound, the distance from the skin to parietal and visceral pleura can be measured to determine whether thoracentesis can be safely performed, and to guide selection of an adequate length needle (Figure 5). A minimum pleural effusion depth of 1.5 cm between the visceral and parietal pleura has been recommended to perform diagnostic thoracentesis.[28] Diagnostic thoracentesis of complex septated pleural effusions or empyemas may be performed with a straight needle, but therapeutic drainage often requires temporary insertion of a catheter. Traditionally, large‐bore chest tubes (>24 F) had been advocated to drain viscid pus, but recent evidence suggests that small‐bore catheters (1014 F) with instillation of thrombolytics may be as effective and performed with less discomfort.[45] Video‐assisted thoracoscopy to lyse septations and evacuate infected materials is indicated when chest tube drainage has failed.
The most common complication of pleural drainage is pneumothorax. A meta‐analysis demonstrated a reduction in post‐thoracentesis pneumothorax rates from 9% to 4% with use of ultrasound.[46] Transporting patients to radiology for ultrasound marking has not been shown to decrease pneumothorax rates compared to thoracentesis without ultrasound guidance, likely due to changes in patient position and prolonged delays between marking and drainage.[47] Postprocedure pneumothorax can be ruled out if lung sliding is visualized. A meta‐analysis demonstrated superior sensitivity and similar specificity of pleural ultrasonography versus chest radiography to detect pneumothorax (sensitivity 91% vs 50% and specificity 98% vs 99%, respectively).[48] Real‐time ultrasound guidance for thoracentesis, or use of ultrasound to track the needle tip, has not been well studied but may be performed by experienced proceduralists to drain small effusions.
FUTURE RESEARCH
Future research should focus on the clinical effectiveness of point‐of‐care pleural ultrasonography when integrated with other diagnostic tools, and application of new ultrasound technologies to evaluate pleural diseases. Routine use of point‐of‐care ultrasound as the primary imaging modality in a medical ICU demonstrated a highly statistically significant reduction in chest x‐rays (3.75 vs 0.82, P < 0.0001) and chest CT scans (0.10 vs 0.04, P = 0.0007).[49] Similar studies have yet to be performed with the use of ultrasound specifically in the management of pleural diseases. Thus, clinical effectiveness studies are needed to assess the impact of routine use of pleural ultrasound on the initiation of appropriate therapies, length of stay, and costs in the management of pleural disease.
Point‐of‐care pleural ultrasound findings need to be evaluated in the context of other clinical findings and diagnostic tests. Certain ultrasound findings have been associated with exudative pleural effusions, but whether exudative and transudative effusions can be differentiated noninvasively using ultrasound findings alone, or in combination with other clinical data, warrants investigation. Similar to severity of illness scores, models that incorporate clinical, laboratory, and ultrasound findings need to be developed to guide treatment decisions, such as type of drainage procedure, as well as prognostication.
Finally, new technologies may advance the utility of point‐of‐care pleural ultrasonography. Even though 3‐dimensional ultrasonography has been available for over 2 decades, comparative studies of conventional 2‐dimensional versus 3‐dimensional ultrasonography to characterize pleural effusions have yet to be performed. Furthermore, computer‐aided detection has been shown to facilitate interpretation of ultrasound images, but this technology has yet to be applied to pleural ultrasonography.
CONCLUSIONS
Point‐of‐care pleural ultrasound is a powerful bedside tool in the hospitalist's armamentarium that is superior to physical examination and chest radiographs in the detection and characterization of pleural effusions. Furthermore, ultrasound performs similarly when compared to CT scans but offers the advantages of decreased cost, avoidance of ionizing radiation, and availability at the bedside. Ultrasound guidance reduces complications and increases the success rate of pleural drainage procedures, leading to improved patient safety. As clinical effectiveness studies emerge revealing its true value, point‐of‐care pleural ultrasonography is likely to become the standard diagnostic tool to evaluate and manage patients with pleural effusions.
Disclosures: Dr. Restrepo is partially supported by award number K23HL096054 from the National Heart, Lung, and Blood Institute. The content is solely the responsibility of the authors and does not necessarily represent the official views of the National Heart, Lung, and Blood Institute or the National Institutes of Health. The authors report no conflicts of interest.
- , , , . Parapneumonic effusions. Am J Med. 1980;69(4):507–512.
- , , . The incidence and clinical correlates of parapneumonic effusions in pneumococcal pneumonia. Chest. 1978;74(2):170–173.
- , , , , . Pleural effusions in the medical ICU: prevalence, causes, and clinical implications. Chest. 1997;111(4):1018–1023.
- , , , . Point‐of‐care ultrasound in internal medicine: a national survey of educational leadership. J Grad Med Educ. 2013;5(3):498–502.
- . Pleural Diseases. Philadelphia, PA: Lippincott Williams 2007.
- , , . Does this patient have a pleural effusion? JAMA. 2009;301(3):309–317.
- , , , . Pleural fluid volume estimation: a chest radiograph prediction rule. Acad Radiol. 1996;3(2):103–109.
- , . Accuracy of the physical examination in evaluating pleural effusion. Cleve Clin J Med. 2008;75(4):297–303.
- , , , , . The efficacy of chest radiographs in detecting parapneumonic effusions. Respirology. 2011;16(6):1000–1004.
- , , , , . Differentiation of pleural effusions from parenchymal opacities: accuracy of bedside chest radiography. AJR Am J Roentgenol. 2010;194(2):407–412.
- , , , . Accuracy of the diagnosis of pleural effusion on supine chest X‐ray. Eur Radiol. 1997;7(1):57–60.
- , , , . Detection of pleural effusions on supine chest radiographs. AJR Am J Roentgenol. 1987;148(4):681–683.
- , , , , . Multiloculated pleural effusion detected by ultrasound only in a critically‐ill patient. Am J Case Rep. 2013;14:63–66.
- , , , et al. Exposure to low‐dose ionizing radiation from medical imaging procedures. N Engl J Med. 2009;361(9):849–857.
- , , . The diagnosis of pleural effusion by ultrasonic and radiologic techniques. Chest. 1976;70(1):33–37.
- , , , , , . Ultrasound in blunt abdominal and thoracic trauma. J Trauma. 1993;34(4):488–495.
- , , , et al. Application of color Doppler ultrasound in the study of small pleural effusion. Med Ultrason. 2010;12(1):12–16.
- , , , , , . Comparative diagnostic performances of auscultation, chest radiography, and lung ultrasonography in acute respiratory distress syndrome. Anesthesiology. 2004;100(1):9–15.
- , , , , . Diagnostic accuracy of sonography for pleural effusion: systematic review. Sao Paulo Med J. 2010;128(2):90–95.
- , . The role of thoracic ultrasonography for evaluation of patients with decompensated chronic heart failure. J Am Coll Cardiol. 2000;35(6):1638–1646.
- , . Trauma ultrasound examination versus chest radiography in the detection of hemothorax. Ann Emerg Med. 1997;29(3):312–315; discussion 315–316.
- , , , et al. Diagnostic accuracy of bedside ultrasonography in the ICU: feasibility of detecting pulmonary effusion and lung contusion in patients on respiratory support after severe blunt thoracic trauma. Acta Anaesthesiol Scand. 2008;52(6):776–784.
- . Lung ultrasound in the critically ill. Ann Intensive Care. 2014;4(1):1.
- . Recognition of pleural effusion on supine radiographs: how much fluid is required? AJR. Am J Roentgenol. 1984;142(1):59–64.
- , , . Chest sonography versus lateral decubitus radiography in the diagnosis of small pleural effusions. J Clin Ultrasound. 2003;31(2):69–74.
- , , , , . Impact of lung ultrasound on clinical decision making in critically ill patients. Intensive Care Med. 2014;40(1):57–65.
- . Lung ultrasound in acute respiratory failure an introduction to the BLUE‐protocol. Minerva Anestesiol. 2009;75(5):313–317.
- , , . Point‐of‐Care Ultrasound. 1st ed. Philadelphia, PA: Saunders; 2014.
- , , , et al. International evidence‐based recommendations for point‐of‐care lung ultrasound. Intensive Care Med. 2012;38(4):577–591.
- , , , et al. Ultrasound estimation of volume of pleural fluid in mechanically ventilated patients. Intensive Care Med. 2006;32(2):318–321.
- , , . Ultrasound estimation of volume of postoperative pleural effusion in cardiac surgery patients. Interact Cardiovasc Thorac Surg. 2010;10(2):204–207.
- , , , et al. Multiplane ultrasound approach to quantify pleural effusion at the bedside. Intensive Care Med. 2010;36(4):656–664.
- , , , , , . Value of sonography in determining the nature of pleural effusion: analysis of 320 cases. AJR Am J Roentgenol. 1992;159(1):29–33.
- , , , , , . Echogenic swirling pattern as a predictor of malignant pleural effusions in patients with malignancies. Chest. 2004;126(1):129–134.
- , . Imaging the pleura: sonography, CT, and MR imaging. AJR Am J Roentgenol. 1991;156(6):1145–1153.
- , , , et al. Pleural effusions in febrile medical ICU patients: chest ultrasound study. Chest. 2004;126(4):1274–1280.
- , , , , . Sonographic septation: a useful prognostic indicator of acute thoracic empyema. J Ultrasound Med. 2000;19(12):837–843.
- . Sonography of the pleura [in German]. Ultraschall Med. 2010;31(1):8–22, quiz 23–25.
- , , . Thoracic ultrasound in the diagnosis of malignant pleural effusion. Thorax. 2009;64(2):139–143.
- , , , . “Fluid color” sign: a useful indicator for discrimination between pleural thickening and pleural effusion. J Ultrasound Med. 1995;14(10):767–769.
- , , . Reflected ultrasound in the detection and localization of pleural effusion. JAMA. 1967;200(5):399–402.
- , , , . Pleural procedures and thoracic ultrasound: British Thoracic Society Pleural Disease Guideline 2010. Thorax. 2010;65(suppl 2):ii61–ii76.
- Accreditation Council for Graduate Medical Education. http://www.acgme.org/acgmeweb. Accessed January 15, 2015.
- , , . Accuracy of pleural puncture sites: a prospective comparison of clinical examination with ultrasound. Chest. 2003;123(2):436–441.
- , , , , , . A double blind randomized cross over trial comparing rate of decortication and efficacy of intrapleural instillation of alteplase vs placebo in patients with empyemas and complicated parapneumonic effusions. Respir Med. 2012;106(5):716–723.
- , , , . Pneumothorax following thoracentesis: a systematic review and meta‐analysis. Arch Intern Med. 2010;170(4):332–339.
- , , , , , . Factors affecting the development of pneumothorax associated with thoracentesis. AJR Am J Roentgenol. 1991;156(5):917–920.
- , , . Test characteristics of ultrasonography for the detection of pneumothorax: a systematic review and meta‐analysis. Chest. 2012;141(3):703–708.
- , , , et al. The effect of point‐of‐care ultrasonography on imaging studies in the medical ICU: a comparative study. Chest. 2014;146(6):1574–1577.
Hospitalists commonly encounter pleural effusions, and their detection and characterization by point‐of‐care ultrasound can guide management. Approximately 44% to 57% of hospitalized patients with bacterial pneumonia,[1, 2] and up to 62% of intensive care unit (ICU) patients[3] have a pleural effusion. For patients with a parapneumonic effusion, hospitalists can use ultrasound to quantify and characterize pleural fluid to determine whether diagnostic or therapeutic drainage is indicated, as well as guide performance of thoracentesis. For patients with lung cancer, detection of a malignant pleural effusion changes staging to stage IV, regardless of tumor size or lymph node involvement, and hospitalists may discuss more appropriate treatment options with patients and consultants.
Routine use of pleural ultrasonography may help hospitalists provide high‐value care by reducing ancillary testing, including computerized tomography (CT) scans that expose patients to ionizing radiation, and reducing complications of thoracentesis. However, many hospitalists may not be familiar with the use of point‐of‐care ultrasound. A national survey in 2012 revealed only 25% of internal medicine residencies have formal curricula to teach point‐of‐care ultrasonography.[4] The purpose of this review is to provide an overview of how point‐of‐care ultrasound can be utilized by hospitalists in the care of patients with pleural effusions. We review the literature on the diagnosis and evaluation of pleural effusions with ultrasound, as well as techniques to examine and drain the pleural space.
DIAGNOSIS OF PLEURAL EFFUSION
History and Physical Exam
Pleural effusions are most commonly associated with heart failure, pneumonia, cancer, pulmonary embolism, viral disease, coronary artery bypass surgery, and cirrhosis with ascites. The most common symptoms related to pleural effusion are nonspecific and often indistinguishable from those of the underlying disease process, including cough, dyspnea, and pleuritic chest pain.[5]
Diagnostic accuracy of a physical examination to detect pleural fluid is highly dependent on the size of the effusion and is unlikely to detect effusions <300 mL. A systematic review found the most accurate physical exam findings to rule in a pleural effusion were dullness to percussion (positive likelihood ratio [LR]: 8.7; 95% CI: 2.2‐33.8) and asymmetric chest expansion (positive LR: 8.1; 95% CI: 5.2‐12.7). Normal tactile vocal fremitus was the most accurate physical exam finding to rule out a pleural effusion (negative LR: 0.21; 95% CI: 0.12‐0.37).[6] A major limitation of all these studies is that physical exam was compared to chest radiography as the reference standard, and posterior‐anterior chest radiographs are not sensitive for detection of pleural effusions until 200 mL of fluid has accumulated.[7] Further, chest percussion penetrates to a maximum depth of 6 cm, and its utility is limited in obese patients.[8] Characteristics of pleural fluid that can change management, such as loculations, cannot be detected by physical exam.
Chest Radiography
Chest radiography has traditionally been used to diagnose pleural effusions. Free‐flowing pleural fluid collects in the most dependent portions of the thorax, initially in the subpulmonic space followed by the costophrenic recesses. Pleural fluid is detectable in the costophrenic recesses on lateral upright chest radiograph after 50 mL has accumulated. On standard posterior‐anterior chest radiograph, blunting of the costophrenic recesses and obliteration of the hemidiaphragm are seen when >200 mL and >500 mL of pleural fluid have accumulated, respectively.[7] However, upright chest radiographs can miss a considerable number of effusions, including as many as 10% of parapneumonic effusions large enough to indicate need for drainage.[9] Supine anterior‐posterior chest radiographs can miss a significant proportion of large effusions seen on chest CT,[10] ultrasound,[11] and lateral decubitus radiographs.[12] Pleural effusions are frequently mistaken for parenchymal opacities on portable anterior‐posterior chest radiographs.[10]
Computerized Tomography
Chest CT serves as the reference standard in most modern diagnostic accuracy studies. Limitations of chest CT include difficulty distinguishing small effusions from pleural thickening, dependent atelectasis, or tumor; lower sensitivity for detecting pleural fluid septations compared to ultrasound[13]; exposure of patients to approximately 7 mSv of ionizing radiation (the equivalent radiation dose of 350 chest radiographs)[14]; high cost; and need to transport patients to radiology departments where CT scanners are located.
Pleural Ultrasonography
Ultrasound can rapidly differentiate conditions that demonstrate a nonspecific, radiopaque appearance of lower lung fields on chest radiographs, including pleural effusions, pneumonia, atelectasis, elevated hemidiaphragm, and lung or pleural masses. Advantages of point‐of‐care ultrasound include the ability of hospitalists to acquire and interpret images at the bedside and integrate findings into clinical decision making immediately. Multiple studies have demonstrated superior diagnostic accuracy of ultrasound compared to chest radiography for detection of pleural effusions. Pleural ultrasound can detect physiologic amounts of pleural fluid (5 mL),[15] but a minimal volume of 20 mL is more reliably detected,[16] and ultrasound is 100% sensitive for effusions >100 mL.[17] In a prospective study of critically ill patients with acute respiratory distress syndrome, the diagnostic accuracy of ultrasound for pleural effusions was superior (93%) compared to auscultation (61%) and anterior‐posterior chest radiograph (47%), using chest CT as the reference standard.[18] A meta‐analysis of 4 studies calculated a pooled sensitivity and specificity of ultrasound for detection of pleural effusions as 93% (95% CI: 89%‐96%) and 96% (95% CI: 95%‐98%), respectively.[18, 19, 20, 21, 22] Ultrasound has the additional benefit of characterizing underlying lung parenchyma, which is well described in the literature but beyond the scope of this review.[23]
Sensitivity and specificity of chest radiography and ultrasonography to detect a pleural effusion are displayed in Table 1.[9, 10, 11, 12, 18, 20, 21, 22, 24, 25, 26]
| Exam | Reference Standard | Sensitivity | Specificity | Study | |
|---|---|---|---|---|---|
| |||||
| Chest radiograph | Supine AP | Upright PA/lateral | 92% | Woodring[24] | |
| Lateral decubitus XR | 67% | 70% | Ruskin[12] | ||
| Ultrasound | 82% | 82% | Emamian[11] | ||
| Ultrasound or thoracentesis | 33% | Kocijancic[25] | |||
| CT | 39% | 85% | Lichtenstein[18] | ||
| CT | 66% | 89% | Kitazano[10] | ||
| CT | 65% | 81% | Xirouchaki[26] | ||
| CT | 78% | 76% | Brixey[9] | ||
| Lateral decubitus | Ultrasound or thoracentesis | 94% | 100% | Kocijancic[25] | |
| Upright PA | CT | 82% | 81% | Brixey[9] | |
| Lateral upright | CT | 86% | 88% | Brixey[9] | |
| Ultrasound | Cardiology | CT | 93% | 88% | Kataoka[20] |
| Point of care | CT or tube thoracostomy | 96% | 100% | Ma[21] | |
| CT | 92% | 93% | Lichtenstein[18] | ||
| CT | 94% | 99% | Rocco[22] | ||
| CT | 100% | 100% | Xirouchaki[26] | ||
PLEURAL ULTRASOUND EXAMINATION
A pleural ultrasound exam may be performed as part of a complete lung ultrasound exam, such as the BLUE (Bedside Lung Ultrasound in Emergency) protocol,[27] or a focused exam to evaluate a suspected or known pleural effusion seen on chest radiograph or CT scan.[27] Free‐flowing pleural effusions accumulate in the most dependent portions of the thorax, most commonly, the posterolateral costophrenic recesses in semirecumbent or seated patients, but anteriorly in mechanically ventilated patients in a prone position.
A low‐frequency (25 MHz) phased‐array transducer is generally preferred for imaging in between the ribs. High‐frequency linear transducers do not provide adequate penetration to visualize deep structures, but do provide superior visualization of the pleural line to assess pleural thickness, measure pleural depth, and evaluate for pneumothorax.
Pleural effusions are best evaluated starting at the level of the diaphragm. Place the transducer in a longitudinal plane on the posterior axillary line at the level of the diaphragm with the transducer orientation marker (notch) pointed cephalad (Figure 1). Five structures must be definitively identified to diagnose a pleural effusion: liver/spleen, diaphragm, pleural fluid, lung, and chest wall (Figure 2A). Large pleural effusions compress the adjacent lung causing atelectasis, which gives the lung a tissue‐like echogenicity similar to the liver (Figure 2B). Static air bronchograms are commonly seen in atelectatic lung bases with pleural effusions.[28]
Color flow Doppler and M‐mode ultrasound may be utilized as adjuncts to routine 2‐dimensional ultrasonography. Free‐flowing pleural effusions will demonstrate flow by color Doppler (Figure 3A). Using M‐mode ultrasound, the lung can been seen moving within a pleural effusion to and from the chest wall (sinusoid sign).[29] Absence of flow or movement is seen with dense pleural loculations, pleural thickening, and peripheral lung or pleural masses (Figure 3B).
CHARACTERIZATION OF PLEURAL EFFUSION
Pleural Fluid Volume
Quantification of pleural fluid volume has been proposed using formulas with sonographic measurements.[30, 31, 32] These formulas are most accurate for moderate‐sized effusions but have not been validated beyond individual study cohorts. The largest study (n = 150) found a strong correlation between calculated and actual volumes drained by thoracentesis (r2 = 0.79; P < 0.001) using the formula (Volume [mL] = 16 parietal to visceral pleura distance (mm) at the mid‐diaphragm).[31] Although an accurate quantitative pleural fluid volume assessment may be possible, these formulas are not commonly used in clinical practice. A qualitative assessment is adequate for most clinical decision making using categories of minimal, small, moderate, or large volume.
Simple Versus Complex Effusions
Based on its sonographic appearance, pleural effusions are categorized as simple or complex. Simple pleural effusions are anechoic and usually transudative. Complex pleural effusions are subcategorized as homogeneously or heterogeneously echogenic, with or without septations, and are more often exudative.[33]
Effusions with heterogeneous echogenicity with swirling echoes suggest high cellular content that is often associated with malignancy.[34] Fibrinous stranding, septations, and loculations also suggest an exudative effusion (Figure 4A), and are more readily identified and characterized on lung ultrasound than CT scan.[35]
Homogenously echogenic effusions are most often due to hemothorax or empyema.[36] The high cell count of a hemothorax creates a layering effect in costophrenic recesses (hematocrit sign). Empyemas develop from complex effusions that organize into collections of pus and usually have a homogeneously echogenic, speckled appearance (Figure 4B). Sonographic evidence of septations in the presence of empyema predicts the need for intrapleural fibrinolytic therapy, longer duration of drainage, and possible surgical intervention.[37]
Isolated dense loculations may be challenging to differentiate from peripheral lung or pleural lesions, such as abscess or tumor.
Pleural Thickness
Normal visceral and parietal pleura are apposed and 0.2 to 0.3 mm thick.[38] Pleural effusions with parietal pleural thickness >10 mm, pleural nodularity, and diaphragmatic thickness >7 mm predicted underlying malignancy with high specificity and positive predictive value in 1 study.[39] As many as 20% of anechoic lesions of the pleura are solid rather than fluid. Color flow Doppler ultrasound can differentiate small pleural effusions from solid pleural abnormalities with sensitivity and specificity of 89% and 100%, respectively.[40]
PLEURAL FLUID DRAINAGE
Since its first description in 1967, use of ultrasound guidance for thoracentesis has evolved to become the standard of care in many hospitals in the United States.[41] The British Thoracic Society guidelines recommend that all thoracenteses be performed with ultrasound guidance.[42] The American College of Graduate Medical Education now requires proficiency in the use of ultrasound for thoracentesis and pleural catheter insertion by pulmonary and critical care fellows.[43]
The impetus for these recommendations stems from increased procedural success and decreased complications associated with ultrasound‐guided drainage of pleural effusions. A study evaluating thoracentesis site selection based on physical exam and chest radiographs demonstrated inaccurate site selection in 15% of patients, and use of ultrasound for site selection prevented possible accidental organ puncture in 10% of all cases.[44] The success rate of thoracentesis for small pleural effusions has been shown to increase from 66% to 90% with ultrasound guidance.[42] Using ultrasound, the distance from the skin to parietal and visceral pleura can be measured to determine whether thoracentesis can be safely performed, and to guide selection of an adequate length needle (Figure 5). A minimum pleural effusion depth of 1.5 cm between the visceral and parietal pleura has been recommended to perform diagnostic thoracentesis.[28] Diagnostic thoracentesis of complex septated pleural effusions or empyemas may be performed with a straight needle, but therapeutic drainage often requires temporary insertion of a catheter. Traditionally, large‐bore chest tubes (>24 F) had been advocated to drain viscid pus, but recent evidence suggests that small‐bore catheters (1014 F) with instillation of thrombolytics may be as effective and performed with less discomfort.[45] Video‐assisted thoracoscopy to lyse septations and evacuate infected materials is indicated when chest tube drainage has failed.
The most common complication of pleural drainage is pneumothorax. A meta‐analysis demonstrated a reduction in post‐thoracentesis pneumothorax rates from 9% to 4% with use of ultrasound.[46] Transporting patients to radiology for ultrasound marking has not been shown to decrease pneumothorax rates compared to thoracentesis without ultrasound guidance, likely due to changes in patient position and prolonged delays between marking and drainage.[47] Postprocedure pneumothorax can be ruled out if lung sliding is visualized. A meta‐analysis demonstrated superior sensitivity and similar specificity of pleural ultrasonography versus chest radiography to detect pneumothorax (sensitivity 91% vs 50% and specificity 98% vs 99%, respectively).[48] Real‐time ultrasound guidance for thoracentesis, or use of ultrasound to track the needle tip, has not been well studied but may be performed by experienced proceduralists to drain small effusions.
FUTURE RESEARCH
Future research should focus on the clinical effectiveness of point‐of‐care pleural ultrasonography when integrated with other diagnostic tools, and application of new ultrasound technologies to evaluate pleural diseases. Routine use of point‐of‐care ultrasound as the primary imaging modality in a medical ICU demonstrated a highly statistically significant reduction in chest x‐rays (3.75 vs 0.82, P < 0.0001) and chest CT scans (0.10 vs 0.04, P = 0.0007).[49] Similar studies have yet to be performed with the use of ultrasound specifically in the management of pleural diseases. Thus, clinical effectiveness studies are needed to assess the impact of routine use of pleural ultrasound on the initiation of appropriate therapies, length of stay, and costs in the management of pleural disease.
Point‐of‐care pleural ultrasound findings need to be evaluated in the context of other clinical findings and diagnostic tests. Certain ultrasound findings have been associated with exudative pleural effusions, but whether exudative and transudative effusions can be differentiated noninvasively using ultrasound findings alone, or in combination with other clinical data, warrants investigation. Similar to severity of illness scores, models that incorporate clinical, laboratory, and ultrasound findings need to be developed to guide treatment decisions, such as type of drainage procedure, as well as prognostication.
Finally, new technologies may advance the utility of point‐of‐care pleural ultrasonography. Even though 3‐dimensional ultrasonography has been available for over 2 decades, comparative studies of conventional 2‐dimensional versus 3‐dimensional ultrasonography to characterize pleural effusions have yet to be performed. Furthermore, computer‐aided detection has been shown to facilitate interpretation of ultrasound images, but this technology has yet to be applied to pleural ultrasonography.
CONCLUSIONS
Point‐of‐care pleural ultrasound is a powerful bedside tool in the hospitalist's armamentarium that is superior to physical examination and chest radiographs in the detection and characterization of pleural effusions. Furthermore, ultrasound performs similarly when compared to CT scans but offers the advantages of decreased cost, avoidance of ionizing radiation, and availability at the bedside. Ultrasound guidance reduces complications and increases the success rate of pleural drainage procedures, leading to improved patient safety. As clinical effectiveness studies emerge revealing its true value, point‐of‐care pleural ultrasonography is likely to become the standard diagnostic tool to evaluate and manage patients with pleural effusions.
Disclosures: Dr. Restrepo is partially supported by award number K23HL096054 from the National Heart, Lung, and Blood Institute. The content is solely the responsibility of the authors and does not necessarily represent the official views of the National Heart, Lung, and Blood Institute or the National Institutes of Health. The authors report no conflicts of interest.
- , , , . Parapneumonic effusions. Am J Med. 1980;69(4):507–512.
- , , . The incidence and clinical correlates of parapneumonic effusions in pneumococcal pneumonia. Chest. 1978;74(2):170–173.
- , , , , . Pleural effusions in the medical ICU: prevalence, causes, and clinical implications. Chest. 1997;111(4):1018–1023.
- , , , . Point‐of‐care ultrasound in internal medicine: a national survey of educational leadership. J Grad Med Educ. 2013;5(3):498–502.
- . Pleural Diseases. Philadelphia, PA: Lippincott Williams 2007.
- , , . Does this patient have a pleural effusion? JAMA. 2009;301(3):309–317.
- , , , . Pleural fluid volume estimation: a chest radiograph prediction rule. Acad Radiol. 1996;3(2):103–109.
- , . Accuracy of the physical examination in evaluating pleural effusion. Cleve Clin J Med. 2008;75(4):297–303.
- , , , , . The efficacy of chest radiographs in detecting parapneumonic effusions. Respirology. 2011;16(6):1000–1004.
- , , , , . Differentiation of pleural effusions from parenchymal opacities: accuracy of bedside chest radiography. AJR Am J Roentgenol. 2010;194(2):407–412.
- , , , . Accuracy of the diagnosis of pleural effusion on supine chest X‐ray. Eur Radiol. 1997;7(1):57–60.
- , , , . Detection of pleural effusions on supine chest radiographs. AJR Am J Roentgenol. 1987;148(4):681–683.
- , , , , . Multiloculated pleural effusion detected by ultrasound only in a critically‐ill patient. Am J Case Rep. 2013;14:63–66.
- , , , et al. Exposure to low‐dose ionizing radiation from medical imaging procedures. N Engl J Med. 2009;361(9):849–857.
- , , . The diagnosis of pleural effusion by ultrasonic and radiologic techniques. Chest. 1976;70(1):33–37.
- , , , , , . Ultrasound in blunt abdominal and thoracic trauma. J Trauma. 1993;34(4):488–495.
- , , , et al. Application of color Doppler ultrasound in the study of small pleural effusion. Med Ultrason. 2010;12(1):12–16.
- , , , , , . Comparative diagnostic performances of auscultation, chest radiography, and lung ultrasonography in acute respiratory distress syndrome. Anesthesiology. 2004;100(1):9–15.
- , , , , . Diagnostic accuracy of sonography for pleural effusion: systematic review. Sao Paulo Med J. 2010;128(2):90–95.
- , . The role of thoracic ultrasonography for evaluation of patients with decompensated chronic heart failure. J Am Coll Cardiol. 2000;35(6):1638–1646.
- , . Trauma ultrasound examination versus chest radiography in the detection of hemothorax. Ann Emerg Med. 1997;29(3):312–315; discussion 315–316.
- , , , et al. Diagnostic accuracy of bedside ultrasonography in the ICU: feasibility of detecting pulmonary effusion and lung contusion in patients on respiratory support after severe blunt thoracic trauma. Acta Anaesthesiol Scand. 2008;52(6):776–784.
- . Lung ultrasound in the critically ill. Ann Intensive Care. 2014;4(1):1.
- . Recognition of pleural effusion on supine radiographs: how much fluid is required? AJR. Am J Roentgenol. 1984;142(1):59–64.
- , , . Chest sonography versus lateral decubitus radiography in the diagnosis of small pleural effusions. J Clin Ultrasound. 2003;31(2):69–74.
- , , , , . Impact of lung ultrasound on clinical decision making in critically ill patients. Intensive Care Med. 2014;40(1):57–65.
- . Lung ultrasound in acute respiratory failure an introduction to the BLUE‐protocol. Minerva Anestesiol. 2009;75(5):313–317.
- , , . Point‐of‐Care Ultrasound. 1st ed. Philadelphia, PA: Saunders; 2014.
- , , , et al. International evidence‐based recommendations for point‐of‐care lung ultrasound. Intensive Care Med. 2012;38(4):577–591.
- , , , et al. Ultrasound estimation of volume of pleural fluid in mechanically ventilated patients. Intensive Care Med. 2006;32(2):318–321.
- , , . Ultrasound estimation of volume of postoperative pleural effusion in cardiac surgery patients. Interact Cardiovasc Thorac Surg. 2010;10(2):204–207.
- , , , et al. Multiplane ultrasound approach to quantify pleural effusion at the bedside. Intensive Care Med. 2010;36(4):656–664.
- , , , , , . Value of sonography in determining the nature of pleural effusion: analysis of 320 cases. AJR Am J Roentgenol. 1992;159(1):29–33.
- , , , , , . Echogenic swirling pattern as a predictor of malignant pleural effusions in patients with malignancies. Chest. 2004;126(1):129–134.
- , . Imaging the pleura: sonography, CT, and MR imaging. AJR Am J Roentgenol. 1991;156(6):1145–1153.
- , , , et al. Pleural effusions in febrile medical ICU patients: chest ultrasound study. Chest. 2004;126(4):1274–1280.
- , , , , . Sonographic septation: a useful prognostic indicator of acute thoracic empyema. J Ultrasound Med. 2000;19(12):837–843.
- . Sonography of the pleura [in German]. Ultraschall Med. 2010;31(1):8–22, quiz 23–25.
- , , . Thoracic ultrasound in the diagnosis of malignant pleural effusion. Thorax. 2009;64(2):139–143.
- , , , . “Fluid color” sign: a useful indicator for discrimination between pleural thickening and pleural effusion. J Ultrasound Med. 1995;14(10):767–769.
- , , . Reflected ultrasound in the detection and localization of pleural effusion. JAMA. 1967;200(5):399–402.
- , , , . Pleural procedures and thoracic ultrasound: British Thoracic Society Pleural Disease Guideline 2010. Thorax. 2010;65(suppl 2):ii61–ii76.
- Accreditation Council for Graduate Medical Education. http://www.acgme.org/acgmeweb. Accessed January 15, 2015.
- , , . Accuracy of pleural puncture sites: a prospective comparison of clinical examination with ultrasound. Chest. 2003;123(2):436–441.
- , , , , , . A double blind randomized cross over trial comparing rate of decortication and efficacy of intrapleural instillation of alteplase vs placebo in patients with empyemas and complicated parapneumonic effusions. Respir Med. 2012;106(5):716–723.
- , , , . Pneumothorax following thoracentesis: a systematic review and meta‐analysis. Arch Intern Med. 2010;170(4):332–339.
- , , , , , . Factors affecting the development of pneumothorax associated with thoracentesis. AJR Am J Roentgenol. 1991;156(5):917–920.
- , , . Test characteristics of ultrasonography for the detection of pneumothorax: a systematic review and meta‐analysis. Chest. 2012;141(3):703–708.
- , , , et al. The effect of point‐of‐care ultrasonography on imaging studies in the medical ICU: a comparative study. Chest. 2014;146(6):1574–1577.
Peripheral Administration of VM
Vasoactive medications (VMs) are often required to improve hemodynamic function in patients with shock. They are usually given through central venous catheter (CVC) access, primarily out of concern that extravasation of peripheral intravenous (PIV) access may result in local tissue injury due to the vasoconstrictive effect of the VM. However, insertion of CVC is associated with a variety of mechanical complications and risk of central lineassociated bacteremia. To examine the feasibility and safety of using VM via PIV access, we report on the administration of VM in the form of norepinephrine, dopamine, and phenylephrine via PIV access, with the rationale that this would be a method of reducing the need of CVC use. Our hypotheses are that VM via PIV access is both feasible and safe.
MATERIAL AND METHODS
Study Design
This was a single‐arm, consecutive‐patient study conducted from September 2012 to June 2014. The study site was an 18‐bed medical intensive care unit (MICU) staffed by full‐time attendings, fellows, and residents at the Long Island Jewish Medical Center, which is an 827‐bed tertiary care teaching hospital that is part of the North ShoreLong Island Jewish Health System. The primary outcome measure was the rate of local tissue injury resulting from use of VM via PIV access. The study was approved by the hospital institutional review board (study #13583A), which waived requirement for informed consent.
Protocol for Administration of VM via PIV Access
In cooperation with the Department of Pharmacy, medical and nursing staff developed a written protocol for administration of VM via PIV access. The protocol was reviewed and approved by the hospital pharmacy and therapeutics committee and the MICU nursing leadership. The MICU nursing staff received in‐service training before rollout of the protocol, which included training on the recognition of PIV access extravasation and the type of line that could be used. The MICU housestaff teams were given specific instructions concerning the protocol during their MICU rotations. A summary of the requirements for PIV access for VM use is summarized in Table 1.
|
| Vein diameter >4 mm measured with ultrasonography |
| Position of PIV access documented to be in the vein with ultrasonography before starting infusion of VM |
| Upper extremity only, contralateral to the blood pressure cuff |
| Intravenous line size 20 gauge or 18 gauge |
| No hand, wrist, or antecubital fossa PIV access position |
| Blood return from the PIV access prior to VM administration |
| Assessment of PIV access function every 2 hours as per nursing protocol |
| Immediate alert by nursing staff to the medical team if line extravasation, with prompt initiation of local treatment |
| 72 hours maximum duration of PIV access use |
Patient Management
The decision to initiate treatment with VM was made by the clinical management team. The standard concentrations of VM for use via PIV access were: norepinephrine 8 mg or 16 mg/250 mL normal saline, dopamine 400 mg or 800 mg/250 mL D5W, and phenylephrine 80 mg or 160 mg/500 mL normal saline. If the attending or fellow in charge of the case decided that VM should be administered through PIV access, peripheral access was established that conformed to the requirements of the protocol, and VM was administered via PIV access for as long as there was clinical indication or until PIV access suitable for VM administration was no longer feasible. If the patient received VM via PIV access, a second PIV access site was established in case of failure of the primary PIV site. If no PIV access could be inserted, the patient received CVC access. The decision to use VM via CVC access was made by the clinical management team, as was the type, dose, and duration of the VM use via PIV access or CVC access. Vasopressin was not used via PIV access. Dobutamine was used via PIV access but not recorded in our results, as it has no ‐mediated vasoconstrictor effect. Dobutamine was not used concomitantly with other vasoactive medication through the same PIV access. If PIV access was not established using standard technique by nursing staff, medical residents or critical care fellows inserted PIV access using real‐time ultrasound guidance. The PIV access use for VM could also be used for other medications providing they were compatible with the VM. Only 1 type of VM was infused through the PIV access.
As indicated in Table 1, the nursing staff examined the PIV access site every 2 hours and checked that blood could be aspirated from the line. The aspiration of the line requires several seconds of discontinuation of VM use, which we considered to have no clinical relevance. If the nursing staff identified extravasation of the PIV access site through which VM was infusing, they notified the medical housestaff, who promptly initiated treatment with local injection of phentolamine and local application of nitroglycerin paste as described in Table 2. The extravasation site was examined for tissue injury on a shift basis by the nursing staff, and on bedside rounds by the attending and fellow for at least 48 hours following PIV access removal. Tissue injury was defined as any erythema, blistering, skin breakdown, or necrosis in the site of extravasation.
|
| 1. The VM via PIV infusion is stopped immediately. |
| 2. Residual medication is aspirated through the PIV access, and the catheter is removed. |
| 3. The extent of the extravasation is outlined to provide a baseline for monitoring. |
| 4. Two vials, each containing 5 mg of phentolamine, are reconstituted with 5 mL of normal saline per vial to yield a final concentration of 1 mg/mL. |
| 5. The phentolamine solution is injected in 0.5‐ to 1‐mL aliquots in 5 separate injections around the leading edge of the extravasation, using separate 25‐gauge or 27‐gauge needles for each injection. |
| 6. Nitroglycerin paste (2.5 cm) is applied to the area of extravasation. |
| 7. A medication occurrence report is filled out for review by the quality committee. |
Data were collected prospectively by an investigator (J.C.‐G.) and entered into a standard data‐collection sheet for quality and safety assessment for the initial 13 months of the study. In the subsequent 7 months of observation, data were collected from retrospective chart review. The initial 13 months of data collection were performed as an ongoing safety analysis project; the subsequent 7‐month review was performed as an additional quality assessment project. The deidentified data included patient demographics, patient disease characteristics, use of VM, and VM via PIV access complications.
Statistical Analysis
The statistical analysis was performed using SPSS 21 (Statistical Package for the Social Sciences; IBM, Armonk, NY). Continuous variables are presented as meanstandard deviation.
RESULTS
Characteristics of patients who received VM via PIV access are presented in Table 3. During the study period, there were 2462 admissions to the MICU, and 267 CVCs were inserted by the MICU team, 170 of which were triple‐lumen catheters and 97 were large‐gauge catheters for hemodialysis or plasmapheresis. Of the total admissions, 953 cases received VM; 783/953 (82%) received VM via PIV access, and 170/953 received VM via CVC access (18%). For VM use, an 18‐gauge PIV catheter was used in 192/783 (25%), a 20‐gauge catheter was used in 590/783 (75%), and a 22‐gauge catheter was used in 1/783 of interventions. Catheter length was 30 mm, 45 mm, or 48 mm depending on availability. The 22‐gauge catheter, which was a deviation from standard protocol, infiltrated shortly following insertion. We did not formally record the anatomic position of the PIV access in the standard data‐collection sheet; anecdotally, the majority of PIV accesses were placed in the upper arm basilic or cephalic vein. The duration of VM via PIV access was 4922 hours. Central intravenous access was required in 95/734 (13%) of patients who initially had VM via PIV access. These catheters are included in the 170 triple‐lumen CVCs that were inserted by the MICU team during the study period. The type and highest dose of VM administered via PIV access are presented in Table 4.
| Total Study Group | |
|---|---|
| |
| No. of patients | 734 |
| Age, y | 7215 |
| Gender | |
| Male | 398 (54%) |
| Female | 336 (46%) |
| SAPS II score | 7515 |
| Patients on mechanical ventilation | 235 (32%) |
| Patients on hemodialysis | 90 (12%) |
| MICU mortality | 177 (23%) |
| Use of VM via PIV access | 783 |
| Extravasations of VM via PIV access | 19 (2%) |
| Total MICU admissions during study period | 2,462 |
| |
| Norepinephrine | |
| Interventions | 506 |
| Dose, g/kg/min, meanSD | 0.700.23 |
| PIV access extravasations | 16 |
| Dopamine | |
| Interventions | 101 |
| Dose, g/kg/min, meanSD | 12.75.23 |
| PIV access extravasations | 3 |
| Phenylephrine | |
| Interventions | 176 |
| Dose, g/kg/min, meanSD | 3.251.69 |
| PIV access extravasations | 0 |
A total of 734 patients received VM via PIV access during the 20‐month study period; 49 of these patients required 2 or more PIV access insertions, as the initial and/or subsequent site timed out at 72 hours, resulting in a total of 783 separate interventions. Infiltration of the PIV access site occurred in 19/783 (2%) of interventions. All of them were identified by nursing staff with prompt response using local injection of phentolamine and application of nitroglycerin paste at the site of the extravasation. There was no tissue injury at the site of VM extravasation. Sixteen of the extravasations occurred with norepinephrine infusions and 3 with dopamine infusions. There were no infections of the PIV access sites used for VM. Use of phentolamine and nitroglycerin paste was not associated with hypotension, as defined as mean arterial pressure less than 65 mm Hg.
DISCUSSION
Our study demonstrates that administration of VM via PIV access is feasible, carries a low rate of complications, and offers an alternative to CVC access. There are several elements that may have allowed safe use of VM via PIV access. We developed a protocol that involved a multidisciplinary team. The hospital pharmacy performed an extensive literature search and formulated the initial protocol with the MICU attending staff. The protocol was then subjected to iterative process improvement by a hospital committee and nursing leadership in the MICU. Before program rollout, the MICU nursing staff were educated and trained to use the protocol. This was a key component of the program, as the nurses were responsible for many of the line insertions, line maintenance, and identification of infiltration. Although we did not perform any formal measurement of the impact of PIV access use on nursing workflow, we note that leadership and frontline nurses have been enthusiastic about the implementation of VM via PIV access. The MICU housestaff teams were given an in‐service instruction concerning the importance of prompt initiation of local treatment in case of infiltration of the PIV access site. Specific elements of the protocol that may have improved safety were the use of ultrasonography to insert difficult PIV access and confirmation of all PIV access insertions using ultrasonography by the MICU housestaff. The requirement for frequent checks of PIV access function, prompt recognition of infiltration, and specific antidote to extravasation were important elements of safety. The low rate of PIV access extravasation (2%) may be related to the use of ultrasonography to guide PIV access insertion in patients who had challenging anatomy (eg, obesity, edema, recreational drug use, history of multiple PIV insertions), and ultrasonography was used to check that the PIV access was well positioned before VM infusion.
There were early literature reports that subcutaneous extravasation of catecholamines could result in local ischemic injury both in human patients and animal models.[1, 2, 3, 4, 5] Local phentolamine injection has been identified as a specific antidote to block the local ischemic injury.[6, 7, 8, 9, 10, 11, 12, 13, 14, 15] More recently, there have been anecdotal reports showing that local application of nitroglycerin paste blocks ischemic injury in the pediatric population.[5, 16, 17] With this information, our protocol included the requirement of prompt treatment of local extravasation with phentolamine and nitroglycerin paste at the site of VM via PIV access extravasation. In theory, both phentolamine and nitroglycerin might cause hypotension. In our study, administration of both phentolamine and nitroglycerin paste was not associated with more hypotension nor did it increase requirements for VM.
Multilumen small bore CVCs may be used for several reasons, some of which need to be reconsidered. First, before introduction of the VM via PIV access protocol, a common indication for triple lumen CVC insertion in our MICU was the perception that VM could only be administered through CVC access, for fear of local tissue injury should extravasation of the VM occur through the PIV access site. Our results indicate that VM use is not an automatic indication for CVC insertion. Second, a possible indication for CVC insertion is to measure central venous pressure for the purpose of guiding volume resuscitation in patients with hemodynamic failure. As the utility of central venous pressure monitoring has been called into serious question,[18, 19, 20] we do not consider this indication for CVC use to be valid. Third, CVC access may be required due to anatomic constraints (ie, there is no suitable PIV site). Fourth, there may be need for such a large number of intravenous medications that PIV access cannot support. Fifth, there is occasional situation where the patient requires use of medications where extravasation of PIV access would cause local tissue injury without local antidote (eg, certain chemotherapeutic agents). The continued need for CVC access in some patients is reflected in the finding that 13% of our study patients who received VM via PIV access eventually required triple‐lumen CVC insertion. However, our results indicate that the rate of CVC use may be reduced by using PIV access for VM administration.
Our study has some methodological limitations. Study design was single center and observational. The focus of this study was to examine the safety of VM via PIV access. We cannot comment on its effectiveness, indications, or influence on patient outcome nor on why some patients required CVC insertion whereas others did not. The decision to administer VM was made by the clinical team, as was the route of its administration and concentration, without any input from the investigators. We did not collect data on who performed the PIV access insertion (medical or nursing staff), demographics, and disease characteristics of the CVC group, nor to what extent ultrasonography was used to guide PIV insertion. We did not attempt to define whether there were any factors that identified risk for PIV access extravasation, nor did we evaluate for any differences between the PIV and CVC group in terms of demographics and disease characteristics. Lacking a control group, we cannot say definitively that VM via PIV access is safer than VM via CVC. Being a single‐center study, it is not possible to say that the results are transferable to another clinical environment; this applies particularly to the use of ultrasonography, which is a user‐dependent skill. We cannot determine which, if any, component of the protocol was responsible for the safe use of VM via PIV access. The rate of PIV access extravasation was low, so it is possible that a larger sample size is required to identify incidents of tissue necrosis from extravasation of VM delivered via PIV access despite the use of local antidote.
CONCLUSIONS
The delivery of VM via PIV access is safe and feasible. Tto reduce the risk of extravasation leading to possible local tissue injury, we developed a protocol that emphasized close cooperation between the nursing and medical staff, routine use of ultrasonography, rapid identification of extravasation of the PIV access, and prompt response to local extravasation of VM using phentolamine and nitroglycerin paste. This approach offers a means of reducing CVC use, in both intensive care unit (ICU) and non‐ICU settings, including hospital wards and emergency departments. Clinicians should no longer consider administration of norepinephrine, dopamine, or phenylephrine to be an automatic indication for CVC access. This study focused on the safety of VM administered via PIV access, with emphasis on local complications related to extravasation, and should be considered a preliminary single‐center study that demonstrates that administration of certain vasoactive medications may not universally require central venous access. A broader study regarding assessment of safety and efficacy will require a multicenter design.
Disclosures
J.C.‐G., K.F.S., Y.G.B., M.N., S.J.K., and P.H.M. participated in the study design, statistical review, and manuscript writing. J.C.‐G. is the guarantor of the article, taking responsibility for the integrity of the work as a whole from inception to published article. This work is original, and all authors meet the criteria for authorship, including acceptance of responsibility for the scientific content of the article. This article is not under consideration in any other journal, and all of the authors have read and approved the content of the article. No potential conflict of interest exists with any companies or organizations whose products or services are discussed in this article. This article has not been funded by the National Institutes of Health, the Wellcome Trust, or their agencies. All financial support of the study was derived from the Division of Pulmonary, Critical Care and Sleep Medicine at North ShoreLong Island Jewish Medical Center, New Hyde Park, New York.
- , , . Cutaneous necrosis due to norepinephrine. II. Mechanism and prevention. Ann Surg. 1958;147:44–50.
- , , . Pedal gangrene associated with the use of dopamine. N Engl J Med. 1975;293:591.
- , . Gangrene aggravation after use of dopamine [letter]. JAMA. 1976;235:2812.
- , . Dopamine gangrene [letter]. N Engl J Med. 1976;294:114.
- , . Extravasation injury associated with low‐dose dopamine. Ann Pharmacother. 1998;32:545–548.
- . Use of phenytolamine to prevent necrosis due to levarterenol. JAMA. 1957;163:1477–1479.
- . Phentolamine hydrochloride in prevention of cutaneous necrosis due to levarterenol. JAMA. 1959;170:1916–1917.
- , . Avoidance of vascular complications associated with the use of dopamine. Can Anaesth Soc J. 1977;24:727–733.
- . Management of intravenous extravasations. Infusion. 1984;6:77–79.
- , . Acute management of dopamine infiltration injury with Regitine. Plast Reconstr Surg. 1987;80:610–612.
- . High dose phentolamine for extravasation of pressors [letter]. Clin Pharm. 1989;8:689.
- , . Phentolamine reversal of epinephrine‐induced digital vasospasm. How to save an ischemic finger. Arch Fam Med. 1994;3:193–195.
- , , . Phentolamine use in a neonate for the prevention of dermal necrosis caused by dopamine: a case report. J Perinatol. 2001;21:324–326.
- , , , , . Images in vascular medicine: rapid epinephrine 'reversal' with phentolamine following accidental autoinjector inoculation. Vasc Med. 2011;16:215–216.
- , . Extravasation of noncytotoxic drugs: a review of the literature. Ann Pharmacother. 2014 8;48:870–886.
- , . Reversal of dopamine extravasation injury with topical nitroglycerin ointment. Plast Reconstr Surg. 1989;84:811–813.
- , . Treatment of peripheral tissue ischemia with topical nitroglycerin ointment in neonates. J Pediatr. 1992;121:980–983.
- , , . Does central venous pressure predict fluid responsiveness? A systematic review of the literature and the tale of seven mares. Chest. 2008;134:172–178.
- , . Does the central venous pressure predict fluid responsiveness? An updated meta‐analysis and a plea for some common sense. Crit Care Med. 2013;41:1774–1781.
- ProCESS Investigators, , , , et al. A randomized trial of protocol‐based care for early septic shock. N Engl J Med. 2014;370:1683–1693.
Vasoactive medications (VMs) are often required to improve hemodynamic function in patients with shock. They are usually given through central venous catheter (CVC) access, primarily out of concern that extravasation of peripheral intravenous (PIV) access may result in local tissue injury due to the vasoconstrictive effect of the VM. However, insertion of CVC is associated with a variety of mechanical complications and risk of central lineassociated bacteremia. To examine the feasibility and safety of using VM via PIV access, we report on the administration of VM in the form of norepinephrine, dopamine, and phenylephrine via PIV access, with the rationale that this would be a method of reducing the need of CVC use. Our hypotheses are that VM via PIV access is both feasible and safe.
MATERIAL AND METHODS
Study Design
This was a single‐arm, consecutive‐patient study conducted from September 2012 to June 2014. The study site was an 18‐bed medical intensive care unit (MICU) staffed by full‐time attendings, fellows, and residents at the Long Island Jewish Medical Center, which is an 827‐bed tertiary care teaching hospital that is part of the North ShoreLong Island Jewish Health System. The primary outcome measure was the rate of local tissue injury resulting from use of VM via PIV access. The study was approved by the hospital institutional review board (study #13583A), which waived requirement for informed consent.
Protocol for Administration of VM via PIV Access
In cooperation with the Department of Pharmacy, medical and nursing staff developed a written protocol for administration of VM via PIV access. The protocol was reviewed and approved by the hospital pharmacy and therapeutics committee and the MICU nursing leadership. The MICU nursing staff received in‐service training before rollout of the protocol, which included training on the recognition of PIV access extravasation and the type of line that could be used. The MICU housestaff teams were given specific instructions concerning the protocol during their MICU rotations. A summary of the requirements for PIV access for VM use is summarized in Table 1.
|
| Vein diameter >4 mm measured with ultrasonography |
| Position of PIV access documented to be in the vein with ultrasonography before starting infusion of VM |
| Upper extremity only, contralateral to the blood pressure cuff |
| Intravenous line size 20 gauge or 18 gauge |
| No hand, wrist, or antecubital fossa PIV access position |
| Blood return from the PIV access prior to VM administration |
| Assessment of PIV access function every 2 hours as per nursing protocol |
| Immediate alert by nursing staff to the medical team if line extravasation, with prompt initiation of local treatment |
| 72 hours maximum duration of PIV access use |
Patient Management
The decision to initiate treatment with VM was made by the clinical management team. The standard concentrations of VM for use via PIV access were: norepinephrine 8 mg or 16 mg/250 mL normal saline, dopamine 400 mg or 800 mg/250 mL D5W, and phenylephrine 80 mg or 160 mg/500 mL normal saline. If the attending or fellow in charge of the case decided that VM should be administered through PIV access, peripheral access was established that conformed to the requirements of the protocol, and VM was administered via PIV access for as long as there was clinical indication or until PIV access suitable for VM administration was no longer feasible. If the patient received VM via PIV access, a second PIV access site was established in case of failure of the primary PIV site. If no PIV access could be inserted, the patient received CVC access. The decision to use VM via CVC access was made by the clinical management team, as was the type, dose, and duration of the VM use via PIV access or CVC access. Vasopressin was not used via PIV access. Dobutamine was used via PIV access but not recorded in our results, as it has no ‐mediated vasoconstrictor effect. Dobutamine was not used concomitantly with other vasoactive medication through the same PIV access. If PIV access was not established using standard technique by nursing staff, medical residents or critical care fellows inserted PIV access using real‐time ultrasound guidance. The PIV access use for VM could also be used for other medications providing they were compatible with the VM. Only 1 type of VM was infused through the PIV access.
As indicated in Table 1, the nursing staff examined the PIV access site every 2 hours and checked that blood could be aspirated from the line. The aspiration of the line requires several seconds of discontinuation of VM use, which we considered to have no clinical relevance. If the nursing staff identified extravasation of the PIV access site through which VM was infusing, they notified the medical housestaff, who promptly initiated treatment with local injection of phentolamine and local application of nitroglycerin paste as described in Table 2. The extravasation site was examined for tissue injury on a shift basis by the nursing staff, and on bedside rounds by the attending and fellow for at least 48 hours following PIV access removal. Tissue injury was defined as any erythema, blistering, skin breakdown, or necrosis in the site of extravasation.
|
| 1. The VM via PIV infusion is stopped immediately. |
| 2. Residual medication is aspirated through the PIV access, and the catheter is removed. |
| 3. The extent of the extravasation is outlined to provide a baseline for monitoring. |
| 4. Two vials, each containing 5 mg of phentolamine, are reconstituted with 5 mL of normal saline per vial to yield a final concentration of 1 mg/mL. |
| 5. The phentolamine solution is injected in 0.5‐ to 1‐mL aliquots in 5 separate injections around the leading edge of the extravasation, using separate 25‐gauge or 27‐gauge needles for each injection. |
| 6. Nitroglycerin paste (2.5 cm) is applied to the area of extravasation. |
| 7. A medication occurrence report is filled out for review by the quality committee. |
Data were collected prospectively by an investigator (J.C.‐G.) and entered into a standard data‐collection sheet for quality and safety assessment for the initial 13 months of the study. In the subsequent 7 months of observation, data were collected from retrospective chart review. The initial 13 months of data collection were performed as an ongoing safety analysis project; the subsequent 7‐month review was performed as an additional quality assessment project. The deidentified data included patient demographics, patient disease characteristics, use of VM, and VM via PIV access complications.
Statistical Analysis
The statistical analysis was performed using SPSS 21 (Statistical Package for the Social Sciences; IBM, Armonk, NY). Continuous variables are presented as meanstandard deviation.
RESULTS
Characteristics of patients who received VM via PIV access are presented in Table 3. During the study period, there were 2462 admissions to the MICU, and 267 CVCs were inserted by the MICU team, 170 of which were triple‐lumen catheters and 97 were large‐gauge catheters for hemodialysis or plasmapheresis. Of the total admissions, 953 cases received VM; 783/953 (82%) received VM via PIV access, and 170/953 received VM via CVC access (18%). For VM use, an 18‐gauge PIV catheter was used in 192/783 (25%), a 20‐gauge catheter was used in 590/783 (75%), and a 22‐gauge catheter was used in 1/783 of interventions. Catheter length was 30 mm, 45 mm, or 48 mm depending on availability. The 22‐gauge catheter, which was a deviation from standard protocol, infiltrated shortly following insertion. We did not formally record the anatomic position of the PIV access in the standard data‐collection sheet; anecdotally, the majority of PIV accesses were placed in the upper arm basilic or cephalic vein. The duration of VM via PIV access was 4922 hours. Central intravenous access was required in 95/734 (13%) of patients who initially had VM via PIV access. These catheters are included in the 170 triple‐lumen CVCs that were inserted by the MICU team during the study period. The type and highest dose of VM administered via PIV access are presented in Table 4.
| Total Study Group | |
|---|---|
| |
| No. of patients | 734 |
| Age, y | 7215 |
| Gender | |
| Male | 398 (54%) |
| Female | 336 (46%) |
| SAPS II score | 7515 |
| Patients on mechanical ventilation | 235 (32%) |
| Patients on hemodialysis | 90 (12%) |
| MICU mortality | 177 (23%) |
| Use of VM via PIV access | 783 |
| Extravasations of VM via PIV access | 19 (2%) |
| Total MICU admissions during study period | 2,462 |
| |
| Norepinephrine | |
| Interventions | 506 |
| Dose, g/kg/min, meanSD | 0.700.23 |
| PIV access extravasations | 16 |
| Dopamine | |
| Interventions | 101 |
| Dose, g/kg/min, meanSD | 12.75.23 |
| PIV access extravasations | 3 |
| Phenylephrine | |
| Interventions | 176 |
| Dose, g/kg/min, meanSD | 3.251.69 |
| PIV access extravasations | 0 |
A total of 734 patients received VM via PIV access during the 20‐month study period; 49 of these patients required 2 or more PIV access insertions, as the initial and/or subsequent site timed out at 72 hours, resulting in a total of 783 separate interventions. Infiltration of the PIV access site occurred in 19/783 (2%) of interventions. All of them were identified by nursing staff with prompt response using local injection of phentolamine and application of nitroglycerin paste at the site of the extravasation. There was no tissue injury at the site of VM extravasation. Sixteen of the extravasations occurred with norepinephrine infusions and 3 with dopamine infusions. There were no infections of the PIV access sites used for VM. Use of phentolamine and nitroglycerin paste was not associated with hypotension, as defined as mean arterial pressure less than 65 mm Hg.
DISCUSSION
Our study demonstrates that administration of VM via PIV access is feasible, carries a low rate of complications, and offers an alternative to CVC access. There are several elements that may have allowed safe use of VM via PIV access. We developed a protocol that involved a multidisciplinary team. The hospital pharmacy performed an extensive literature search and formulated the initial protocol with the MICU attending staff. The protocol was then subjected to iterative process improvement by a hospital committee and nursing leadership in the MICU. Before program rollout, the MICU nursing staff were educated and trained to use the protocol. This was a key component of the program, as the nurses were responsible for many of the line insertions, line maintenance, and identification of infiltration. Although we did not perform any formal measurement of the impact of PIV access use on nursing workflow, we note that leadership and frontline nurses have been enthusiastic about the implementation of VM via PIV access. The MICU housestaff teams were given an in‐service instruction concerning the importance of prompt initiation of local treatment in case of infiltration of the PIV access site. Specific elements of the protocol that may have improved safety were the use of ultrasonography to insert difficult PIV access and confirmation of all PIV access insertions using ultrasonography by the MICU housestaff. The requirement for frequent checks of PIV access function, prompt recognition of infiltration, and specific antidote to extravasation were important elements of safety. The low rate of PIV access extravasation (2%) may be related to the use of ultrasonography to guide PIV access insertion in patients who had challenging anatomy (eg, obesity, edema, recreational drug use, history of multiple PIV insertions), and ultrasonography was used to check that the PIV access was well positioned before VM infusion.
There were early literature reports that subcutaneous extravasation of catecholamines could result in local ischemic injury both in human patients and animal models.[1, 2, 3, 4, 5] Local phentolamine injection has been identified as a specific antidote to block the local ischemic injury.[6, 7, 8, 9, 10, 11, 12, 13, 14, 15] More recently, there have been anecdotal reports showing that local application of nitroglycerin paste blocks ischemic injury in the pediatric population.[5, 16, 17] With this information, our protocol included the requirement of prompt treatment of local extravasation with phentolamine and nitroglycerin paste at the site of VM via PIV access extravasation. In theory, both phentolamine and nitroglycerin might cause hypotension. In our study, administration of both phentolamine and nitroglycerin paste was not associated with more hypotension nor did it increase requirements for VM.
Multilumen small bore CVCs may be used for several reasons, some of which need to be reconsidered. First, before introduction of the VM via PIV access protocol, a common indication for triple lumen CVC insertion in our MICU was the perception that VM could only be administered through CVC access, for fear of local tissue injury should extravasation of the VM occur through the PIV access site. Our results indicate that VM use is not an automatic indication for CVC insertion. Second, a possible indication for CVC insertion is to measure central venous pressure for the purpose of guiding volume resuscitation in patients with hemodynamic failure. As the utility of central venous pressure monitoring has been called into serious question,[18, 19, 20] we do not consider this indication for CVC use to be valid. Third, CVC access may be required due to anatomic constraints (ie, there is no suitable PIV site). Fourth, there may be need for such a large number of intravenous medications that PIV access cannot support. Fifth, there is occasional situation where the patient requires use of medications where extravasation of PIV access would cause local tissue injury without local antidote (eg, certain chemotherapeutic agents). The continued need for CVC access in some patients is reflected in the finding that 13% of our study patients who received VM via PIV access eventually required triple‐lumen CVC insertion. However, our results indicate that the rate of CVC use may be reduced by using PIV access for VM administration.
Our study has some methodological limitations. Study design was single center and observational. The focus of this study was to examine the safety of VM via PIV access. We cannot comment on its effectiveness, indications, or influence on patient outcome nor on why some patients required CVC insertion whereas others did not. The decision to administer VM was made by the clinical team, as was the route of its administration and concentration, without any input from the investigators. We did not collect data on who performed the PIV access insertion (medical or nursing staff), demographics, and disease characteristics of the CVC group, nor to what extent ultrasonography was used to guide PIV insertion. We did not attempt to define whether there were any factors that identified risk for PIV access extravasation, nor did we evaluate for any differences between the PIV and CVC group in terms of demographics and disease characteristics. Lacking a control group, we cannot say definitively that VM via PIV access is safer than VM via CVC. Being a single‐center study, it is not possible to say that the results are transferable to another clinical environment; this applies particularly to the use of ultrasonography, which is a user‐dependent skill. We cannot determine which, if any, component of the protocol was responsible for the safe use of VM via PIV access. The rate of PIV access extravasation was low, so it is possible that a larger sample size is required to identify incidents of tissue necrosis from extravasation of VM delivered via PIV access despite the use of local antidote.
CONCLUSIONS
The delivery of VM via PIV access is safe and feasible. Tto reduce the risk of extravasation leading to possible local tissue injury, we developed a protocol that emphasized close cooperation between the nursing and medical staff, routine use of ultrasonography, rapid identification of extravasation of the PIV access, and prompt response to local extravasation of VM using phentolamine and nitroglycerin paste. This approach offers a means of reducing CVC use, in both intensive care unit (ICU) and non‐ICU settings, including hospital wards and emergency departments. Clinicians should no longer consider administration of norepinephrine, dopamine, or phenylephrine to be an automatic indication for CVC access. This study focused on the safety of VM administered via PIV access, with emphasis on local complications related to extravasation, and should be considered a preliminary single‐center study that demonstrates that administration of certain vasoactive medications may not universally require central venous access. A broader study regarding assessment of safety and efficacy will require a multicenter design.
Disclosures
J.C.‐G., K.F.S., Y.G.B., M.N., S.J.K., and P.H.M. participated in the study design, statistical review, and manuscript writing. J.C.‐G. is the guarantor of the article, taking responsibility for the integrity of the work as a whole from inception to published article. This work is original, and all authors meet the criteria for authorship, including acceptance of responsibility for the scientific content of the article. This article is not under consideration in any other journal, and all of the authors have read and approved the content of the article. No potential conflict of interest exists with any companies or organizations whose products or services are discussed in this article. This article has not been funded by the National Institutes of Health, the Wellcome Trust, or their agencies. All financial support of the study was derived from the Division of Pulmonary, Critical Care and Sleep Medicine at North ShoreLong Island Jewish Medical Center, New Hyde Park, New York.
- , , . Cutaneous necrosis due to norepinephrine. II. Mechanism and prevention. Ann Surg. 1958;147:44–50.
- , , . Pedal gangrene associated with the use of dopamine. N Engl J Med. 1975;293:591.
- , . Gangrene aggravation after use of dopamine [letter]. JAMA. 1976;235:2812.
- , . Dopamine gangrene [letter]. N Engl J Med. 1976;294:114.
- , . Extravasation injury associated with low‐dose dopamine. Ann Pharmacother. 1998;32:545–548.
- . Use of phenytolamine to prevent necrosis due to levarterenol. JAMA. 1957;163:1477–1479.
- . Phentolamine hydrochloride in prevention of cutaneous necrosis due to levarterenol. JAMA. 1959;170:1916–1917.
- , . Avoidance of vascular complications associated with the use of dopamine. Can Anaesth Soc J. 1977;24:727–733.
- . Management of intravenous extravasations. Infusion. 1984;6:77–79.
- , . Acute management of dopamine infiltration injury with Regitine. Plast Reconstr Surg. 1987;80:610–612.
- . High dose phentolamine for extravasation of pressors [letter]. Clin Pharm. 1989;8:689.
- , . Phentolamine reversal of epinephrine‐induced digital vasospasm. How to save an ischemic finger. Arch Fam Med. 1994;3:193–195.
- , , . Phentolamine use in a neonate for the prevention of dermal necrosis caused by dopamine: a case report. J Perinatol. 2001;21:324–326.
- , , , , . Images in vascular medicine: rapid epinephrine 'reversal' with phentolamine following accidental autoinjector inoculation. Vasc Med. 2011;16:215–216.
- , . Extravasation of noncytotoxic drugs: a review of the literature. Ann Pharmacother. 2014 8;48:870–886.
- , . Reversal of dopamine extravasation injury with topical nitroglycerin ointment. Plast Reconstr Surg. 1989;84:811–813.
- , . Treatment of peripheral tissue ischemia with topical nitroglycerin ointment in neonates. J Pediatr. 1992;121:980–983.
- , , . Does central venous pressure predict fluid responsiveness? A systematic review of the literature and the tale of seven mares. Chest. 2008;134:172–178.
- , . Does the central venous pressure predict fluid responsiveness? An updated meta‐analysis and a plea for some common sense. Crit Care Med. 2013;41:1774–1781.
- ProCESS Investigators, , , , et al. A randomized trial of protocol‐based care for early septic shock. N Engl J Med. 2014;370:1683–1693.
© 2015 Society of Hospital Medicine