User login
Internal Medicine Resident Engagement with a Laboratory Utilization Dashboard: Mixed Methods Study
Recent efforts to reduce waste and overuse in healthcare include reforms, such as merit-based physician reimbursement for efficient resource use1 and the inclusion of cost-effective care as a competency for physician trainees.2 Focusing on resource use in physician training and reimbursement presumes that teaching and feedback about utilization can alter physician behavior. Early studies of social comparison feedback observed considerable variation in effectiveness, depending on the behavior targeted and how feedback was provided to physicians.3-5 The widespread adoption of electronic medical record (EMR) software enables the design of feedback interventions that provide continuous feedback in real-time via EMR-based practice dashboards. Currently, little is known about physician engagement with practice dashboards and, in particular, about trainee engagement with dashboards aimed to improve cost-effective care.
To inform future efforts in using social comparison feedback to teach cost-effective care in residency, we measured internal medicine resident engagement with an EMR-based utilization dashboard that provides feedback on their use of routine laboratory tests on an inpatient medicine service. Routine labs are often overused in the inpatient setting. In fact, one study reported that 68% of laboratory tests ordered in an academic hospital did not contribute to improving patient outcomes.6 To understand resident perceptions of the dashboards and identify barriers to their use, we conducted a mixed methods study tracking resident utilization of the dashboard over time and collecting qualitative data from 3 focus groups about resident attitudes toward the dashboards.
METHODS
From January 2016 to June 2016, resident-specific rates of routine lab orders (eg, complete blood count, basic metabolic panel, complete metabolic panel, liver function panel, and common coagulation tests) were synthesized continuously in a web-based dashboard. Laboratory orders could be placed either individually on a day-to-day basis or ordered on a recurrent basis (eg, daily morning labs ordered on admission). The dashboard contained an interactive graph, which plotted the average number of labs per patient-day ordered by each resident over the past week, along with an overall graph for all services for comparison (Appendix Figure). Residents could click on an individual day on the graph to review the labs they ordered for each patient. The dashboard also allowed the user to look up each patient’s medical record to obtain more detailed information.
All residents received an e-mail describing the study, including the purpose of the intervention, basic description of the feedback intervention (dashboard and e-mail), potential risks and benefits, duration and scope of data collection, and contact information of the principal investigator. One hundred and ninety-eight resident-blocks on 6 general medicine services at the Hospital of the University of Pennsylvania were cluster-randomized with an equal probability to 1 of 2 arms: (1) those e-mailed a snapshot of the personalized dashboard, a link to the online dashboard, and text containing resident and service utilization averages, and (2) those who did not receive the feedback intervention. Postgraduate year (PGY) 1 residents were attributed only orders by that resident. PGY2 and PGY3 residents were attributed orders for all patients assigned to the resident’s team.
The initial e-mails were timed to arrive in the middle of each resident’s 2-week service to allow for a baseline and follow-up period. The e-mail contained an attachment of a snapshot of the personalized graphic dashboard (Appendix Figure), a link to the online dashboard, and a few sentences summarizing the resident utilization average compared to the general medicine service overall, for the same time interval. They were followed by a reminder e-mail 24 hours later containing only the link to the report card. We measured resident engagement with the utilization dashboard by using e-mail read-receipts and a web-based tracking platform that recorded when the dashboard was opened and who logged on.
Following completion of the intervention, 3-hour-long focus groups were conducted with residents. These focus groups were guided with prescripted questions to prompt discussion on the advantages and drawbacks of the study intervention and the usage of dashboards in general. These sessions were digitally recorded and transcribed. The transcripts were reviewed by 2 authors (KR and GK) and analyzed to identify common themes by using a grounded theory approach.7 First, the transcripts were reviewed independently by each author, who each generated a broad list of themes across 3 domains: dashboard usability, barriers to use, and suggestions for the future. Next, the codebook was refined through an iterative series of discussions and transcript review, resulting in a unified codebook. Lastly, all transcripts were reviewed by using the final codebook definitions, resulting in a list of exemplary quotes and suggestions.
The study was approved by the University of Pennsylvania Institutional Review Board and registered on clinicaltrials.gov (NCT02330289).
RESULTS
Eighty unique residents participated in the intervention, including 51 PGY1s (64%) and 29 PGY2- or PGY3-level (36%) residents. Of these, 19/80 (24%) physicians participated more than once. 74% of participants opened the e-mail and 21% opened the link to the dashboard. The average elapsed time from receiving the initial e-mail to logging into the dashboard was 28.5 hours (standard deviation [SD] = 25.7, median = 25.5, interquartile range [IQR] = 40.5). On average, residents deviated from the service mean by 0.54 laboratory test orders (SD = 0.49, median = 0.40, IQR = 0.60). The mean baseline rate of targeted labs was 1.30 (SD 1.77) labs per physician per patient-day.8
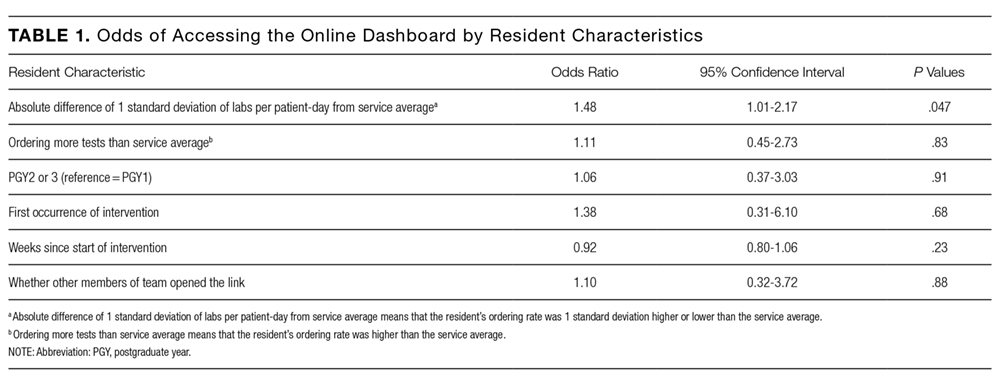
We did not observe a statistically significant difference in routine laboratory ordering by dashboard use, although residents who opened the link to the dashboard ordered 0.26 fewer labs per doctor-patient-day than those who did not (95% CI, −0.77-0.25; P = 0.31). The greatest difference was observed on day 2 after the intervention, when lab orders were lower among dashboard users by 0.59 labs per doc-patient-day (95% CI, −1.41-0.24; P = 0.16) when compared with the residents who did not open the dashboard.
Third, participants identified barriers to using dashboards during training, including time constraints, insufficient patient volume, possible unanticipated consequences, and concerns regarding punitive action by the hospital administration or teaching supervisors. Suggestions to improve the uptake of practice feedback via dashboards included additional guidance for interpreting the data, exclusion of outlier cases or risk-adjustment, and ensuring ease of access to the data.
Last, participants also expressed enthusiasm toward receiving other types of individualized feedback data, including patient satisfaction, timing of discharges, readmission rates, utilization of consulting services, length of stay, antibiotic stewardship practices, costs and utilization data, and mortality or intensive care unit transfer rates (data not shown).
DISCUSSION
Overall, the engagement rates of internal medicine trainees with the online dashboard were low. Most residents did open the e-mails containing the link and basic information about their utilization rates, but less than a quarter of them accessed the dashboard containing real-time data. Additionally, on average, it took them more than a day to do so. However, there is some indication that residents who deviated further from the mean in either direction, which was described in the body of the e-mail, were more motivated to investigate further and click the link to access the dashboard. This suggests that providing practice feedback in this manner may be effective for a subset of residents who deviate from the “typical practice,” and as such, dashboards may represent a potential educational tool that could be aligned with practice-based learning competencies.
The focus groups provided important context about residents’ attitudes toward EMR-based dashboards. Overall, residents were enthusiastic about receiving information regarding their personal laboratory ordering, both in terms of preventing iatrogenic harm and waste of resources. This supports previous research that found that both medical students and residents overwhelmingly believe that the overuse of labs is a problem and that there may be insufficient focus on cost-conscious care during training.9,10 However, many residents questioned several aspects of the specific intervention used in this study and suggested that significant improvements would need to be made to future dashboards to increase their utility.
To our knowledge, this is the first attempt to evaluate resident engagement and attitudes toward receiving practice-based feedback via an EMR-based online dashboard. Previous efforts to influence resident laboratory ordering behavior have primarily focused on didactic sessions, financial incentives, price transparency, and repeated e-mail messaging containing summary statistics about ordering practices and peer comparisons.11-14 While some prior studies observed success in decreasing unnecessary use of laboratory tests, such efforts are challenging to implement routinely on a teaching service with multiple rotating providers and may be difficult to replicate. Future iterations of dashboards that incorporate focused curriculum design and active participation of teaching attendings require further study.
This study has several limitations. The sample size of physicians is relatively small and consists of residents at a single institution. This may limit the generalizability of the results. Additionally, the dashboard captured laboratory-ordering rates during a 2-week block on an inpatient medicine service and was not adjusted for factors such as patient case mix. However, the rates were adjusted for patient volume. In future iterations of utilization dashboards, residents’ concerns about small sample size and variability in clinical severity could be addressed through the adoption of risk-adjustment methodologies to balance out patient burden. This could be accomplished using currently available EMR data, such as diagnosis related groups or diagnoses codes to adjust for clinical complexity or report expected length of stay as a surrogate indicator of complexity.
Because residents are expected to be responsive to feedback, their use of the dashboards may represent an upper bound on physician responsiveness to social comparison feedback regarding utilization. However, e-mails alone may not be an effective way to provide feedback in areas that require additional engagement by the learner, especially given the volume of e-mails and alerts physicians receive. Future efforts to improve care efficiency may try to better capture baseline ordering rates, follow resident ordering over a longer period of time, encourage hospital staff to review utilization information with trainees, integrate dashboard information into regular performance reviews by the attendings, and provide more concrete feedback from attendings or senior residents for how this information can be used to adjust behavior.
Disclosure
Dr. Ryskina’s work on this study was supported by the Ruth L. Kirschstein National Research Service Award (T32-HP10026) and the NIA Career Development Award (K08AG052572). Dr. Patel reports board membership on the advisory board of and owning stock/stock options for Healthmine Services, and serving as a consultant and owning stock/stock options for Catalyst Health LLC. The authors declare no conflict of interest.
1. Clough JD, McClellan M. Implementing MACRA: Implications for Physicians and for Physician Leadership. JAMA. 2016;315(22):2397-2398. PubMed
2. The Internal Medicine Subspecialty Milestones Project. A Joint Initiative of the Accrediation Council for Graduate Medical Education and The American Board of Internal Medicine. http://www.acgme.org/portals/0/pdfs/milestones/internalmedicinesubspecialtymilestoint.pdf. Accessed July 6, 2016.
3. Meeker D, Linder JA, Fox CR, et al. Effect of Behavioral Interventions on Inappropriate Antibiotic Prescribing Among Primary Care Practices: A Randomized Clinical Trial. JAMA. 2016;315(6):562-570. PubMed
4. Jamtvedt G, Young JM, Kristoffersen DT, O’Brien MA, Oxman AD. Audit and feedback: effects on professional practice and health care outcomes. Cochrane Database Syst Rev. 2006;2(2):CD000259. PubMed
5. Navathe AS, Emanuel EJ. Physician Peer Comparisons as a Nonfinancial Strategy to Improve the Value of Care. JAMA. 2016;316(17)1759-1760. PubMed
6. Miyakis S, Karamanof G, Liontos M, Mountokalakis TD. Factors contributing to inappropriate ordering of tests in an academic medical department and the effect of an educational feedback strategy. Postgrad Med J. 2006;82(974):823-829. PubMed
7. Glaser B, Strauss A. The Discovery of Grounded Theory. London: Weidenfeld and Nicholson; 1967.
8. Ryskina K, Dine J, Gitelman Y, et al. Effect of norms on laboratory and imaging testing (ENLITen): A Randomized Controlled Trial. Abstract presented at the Society of General Internal Medicine Conference; April 20, 2017; Washington, DC.
9. Sedrak MS, Patel MS, Ziemba JB, et al. Residents’ self-report on why they order perceived unnecessary inpatient laboratory tests. J Hosp Med. 2016;11(12):869-872. PubMed
10. Tartaglia KM, Kman N, Ledford C. Medical student perceptions of cost-conscious care in an internal medicine clerkship: a thematic analysis. J Gen Intern Med. 2015;30(10):1491-1496. PubMed
11. Iams W, Heck J, Kapp M, et al. A Multidisciplinary Housestaff-Led Initiative to Safely Reduce Daily Laboratory Testing. Acad Med. 2016;91(6):813-820. DOI:10.1097/ACM.0000000000001149. PubMed
12. Corson AH, Fan VS, White T, et al. A multifaceted hospitalist quality improvement intervention: decreased frequency of common labs. J Hosp Med. 2015;10:390-395. PubMed
13. Yarbrough P, Kukhareva P, Horton D, Edholm K, Kawamoto K. Multifaceted Intervention including Education, Rounding Checklist Implementation, Cost Feedback, and Financial Incentives Reduces Inpatient Laboratory Costs. J Hosp Med. 2016;11(5):348-354. PubMed
14. Feldman LS, Shihab HM, Thiemann D, et al. Impact of Providing Fee Data on Laboratory Test Ordering: A Controlled Clinical Trial. JAMA Intern Med. 2013;173(10):903-908. PubMed
Recent efforts to reduce waste and overuse in healthcare include reforms, such as merit-based physician reimbursement for efficient resource use1 and the inclusion of cost-effective care as a competency for physician trainees.2 Focusing on resource use in physician training and reimbursement presumes that teaching and feedback about utilization can alter physician behavior. Early studies of social comparison feedback observed considerable variation in effectiveness, depending on the behavior targeted and how feedback was provided to physicians.3-5 The widespread adoption of electronic medical record (EMR) software enables the design of feedback interventions that provide continuous feedback in real-time via EMR-based practice dashboards. Currently, little is known about physician engagement with practice dashboards and, in particular, about trainee engagement with dashboards aimed to improve cost-effective care.
To inform future efforts in using social comparison feedback to teach cost-effective care in residency, we measured internal medicine resident engagement with an EMR-based utilization dashboard that provides feedback on their use of routine laboratory tests on an inpatient medicine service. Routine labs are often overused in the inpatient setting. In fact, one study reported that 68% of laboratory tests ordered in an academic hospital did not contribute to improving patient outcomes.6 To understand resident perceptions of the dashboards and identify barriers to their use, we conducted a mixed methods study tracking resident utilization of the dashboard over time and collecting qualitative data from 3 focus groups about resident attitudes toward the dashboards.
METHODS
From January 2016 to June 2016, resident-specific rates of routine lab orders (eg, complete blood count, basic metabolic panel, complete metabolic panel, liver function panel, and common coagulation tests) were synthesized continuously in a web-based dashboard. Laboratory orders could be placed either individually on a day-to-day basis or ordered on a recurrent basis (eg, daily morning labs ordered on admission). The dashboard contained an interactive graph, which plotted the average number of labs per patient-day ordered by each resident over the past week, along with an overall graph for all services for comparison (Appendix Figure). Residents could click on an individual day on the graph to review the labs they ordered for each patient. The dashboard also allowed the user to look up each patient’s medical record to obtain more detailed information.
All residents received an e-mail describing the study, including the purpose of the intervention, basic description of the feedback intervention (dashboard and e-mail), potential risks and benefits, duration and scope of data collection, and contact information of the principal investigator. One hundred and ninety-eight resident-blocks on 6 general medicine services at the Hospital of the University of Pennsylvania were cluster-randomized with an equal probability to 1 of 2 arms: (1) those e-mailed a snapshot of the personalized dashboard, a link to the online dashboard, and text containing resident and service utilization averages, and (2) those who did not receive the feedback intervention. Postgraduate year (PGY) 1 residents were attributed only orders by that resident. PGY2 and PGY3 residents were attributed orders for all patients assigned to the resident’s team.
The initial e-mails were timed to arrive in the middle of each resident’s 2-week service to allow for a baseline and follow-up period. The e-mail contained an attachment of a snapshot of the personalized graphic dashboard (Appendix Figure), a link to the online dashboard, and a few sentences summarizing the resident utilization average compared to the general medicine service overall, for the same time interval. They were followed by a reminder e-mail 24 hours later containing only the link to the report card. We measured resident engagement with the utilization dashboard by using e-mail read-receipts and a web-based tracking platform that recorded when the dashboard was opened and who logged on.
Following completion of the intervention, 3-hour-long focus groups were conducted with residents. These focus groups were guided with prescripted questions to prompt discussion on the advantages and drawbacks of the study intervention and the usage of dashboards in general. These sessions were digitally recorded and transcribed. The transcripts were reviewed by 2 authors (KR and GK) and analyzed to identify common themes by using a grounded theory approach.7 First, the transcripts were reviewed independently by each author, who each generated a broad list of themes across 3 domains: dashboard usability, barriers to use, and suggestions for the future. Next, the codebook was refined through an iterative series of discussions and transcript review, resulting in a unified codebook. Lastly, all transcripts were reviewed by using the final codebook definitions, resulting in a list of exemplary quotes and suggestions.
The study was approved by the University of Pennsylvania Institutional Review Board and registered on clinicaltrials.gov (NCT02330289).
RESULTS
Eighty unique residents participated in the intervention, including 51 PGY1s (64%) and 29 PGY2- or PGY3-level (36%) residents. Of these, 19/80 (24%) physicians participated more than once. 74% of participants opened the e-mail and 21% opened the link to the dashboard. The average elapsed time from receiving the initial e-mail to logging into the dashboard was 28.5 hours (standard deviation [SD] = 25.7, median = 25.5, interquartile range [IQR] = 40.5). On average, residents deviated from the service mean by 0.54 laboratory test orders (SD = 0.49, median = 0.40, IQR = 0.60). The mean baseline rate of targeted labs was 1.30 (SD 1.77) labs per physician per patient-day.8
We did not observe a statistically significant difference in routine laboratory ordering by dashboard use, although residents who opened the link to the dashboard ordered 0.26 fewer labs per doctor-patient-day than those who did not (95% CI, −0.77-0.25; P = 0.31). The greatest difference was observed on day 2 after the intervention, when lab orders were lower among dashboard users by 0.59 labs per doc-patient-day (95% CI, −1.41-0.24; P = 0.16) when compared with the residents who did not open the dashboard.
Third, participants identified barriers to using dashboards during training, including time constraints, insufficient patient volume, possible unanticipated consequences, and concerns regarding punitive action by the hospital administration or teaching supervisors. Suggestions to improve the uptake of practice feedback via dashboards included additional guidance for interpreting the data, exclusion of outlier cases or risk-adjustment, and ensuring ease of access to the data.
Last, participants also expressed enthusiasm toward receiving other types of individualized feedback data, including patient satisfaction, timing of discharges, readmission rates, utilization of consulting services, length of stay, antibiotic stewardship practices, costs and utilization data, and mortality or intensive care unit transfer rates (data not shown).
DISCUSSION
Overall, the engagement rates of internal medicine trainees with the online dashboard were low. Most residents did open the e-mails containing the link and basic information about their utilization rates, but less than a quarter of them accessed the dashboard containing real-time data. Additionally, on average, it took them more than a day to do so. However, there is some indication that residents who deviated further from the mean in either direction, which was described in the body of the e-mail, were more motivated to investigate further and click the link to access the dashboard. This suggests that providing practice feedback in this manner may be effective for a subset of residents who deviate from the “typical practice,” and as such, dashboards may represent a potential educational tool that could be aligned with practice-based learning competencies.
The focus groups provided important context about residents’ attitudes toward EMR-based dashboards. Overall, residents were enthusiastic about receiving information regarding their personal laboratory ordering, both in terms of preventing iatrogenic harm and waste of resources. This supports previous research that found that both medical students and residents overwhelmingly believe that the overuse of labs is a problem and that there may be insufficient focus on cost-conscious care during training.9,10 However, many residents questioned several aspects of the specific intervention used in this study and suggested that significant improvements would need to be made to future dashboards to increase their utility.
To our knowledge, this is the first attempt to evaluate resident engagement and attitudes toward receiving practice-based feedback via an EMR-based online dashboard. Previous efforts to influence resident laboratory ordering behavior have primarily focused on didactic sessions, financial incentives, price transparency, and repeated e-mail messaging containing summary statistics about ordering practices and peer comparisons.11-14 While some prior studies observed success in decreasing unnecessary use of laboratory tests, such efforts are challenging to implement routinely on a teaching service with multiple rotating providers and may be difficult to replicate. Future iterations of dashboards that incorporate focused curriculum design and active participation of teaching attendings require further study.
This study has several limitations. The sample size of physicians is relatively small and consists of residents at a single institution. This may limit the generalizability of the results. Additionally, the dashboard captured laboratory-ordering rates during a 2-week block on an inpatient medicine service and was not adjusted for factors such as patient case mix. However, the rates were adjusted for patient volume. In future iterations of utilization dashboards, residents’ concerns about small sample size and variability in clinical severity could be addressed through the adoption of risk-adjustment methodologies to balance out patient burden. This could be accomplished using currently available EMR data, such as diagnosis related groups or diagnoses codes to adjust for clinical complexity or report expected length of stay as a surrogate indicator of complexity.
Because residents are expected to be responsive to feedback, their use of the dashboards may represent an upper bound on physician responsiveness to social comparison feedback regarding utilization. However, e-mails alone may not be an effective way to provide feedback in areas that require additional engagement by the learner, especially given the volume of e-mails and alerts physicians receive. Future efforts to improve care efficiency may try to better capture baseline ordering rates, follow resident ordering over a longer period of time, encourage hospital staff to review utilization information with trainees, integrate dashboard information into regular performance reviews by the attendings, and provide more concrete feedback from attendings or senior residents for how this information can be used to adjust behavior.
Disclosure
Dr. Ryskina’s work on this study was supported by the Ruth L. Kirschstein National Research Service Award (T32-HP10026) and the NIA Career Development Award (K08AG052572). Dr. Patel reports board membership on the advisory board of and owning stock/stock options for Healthmine Services, and serving as a consultant and owning stock/stock options for Catalyst Health LLC. The authors declare no conflict of interest.
1. Clough JD, McClellan M. Implementing MACRA: Implications for Physicians and for Physician Leadership. JAMA. 2016;315(22):2397-2398. PubMed
2. The Internal Medicine Subspecialty Milestones Project. A Joint Initiative of the Accrediation Council for Graduate Medical Education and The American Board of Internal Medicine. http://www.acgme.org/portals/0/pdfs/milestones/internalmedicinesubspecialtymilestoint.pdf. Accessed July 6, 2016.
3. Meeker D, Linder JA, Fox CR, et al. Effect of Behavioral Interventions on Inappropriate Antibiotic Prescribing Among Primary Care Practices: A Randomized Clinical Trial. JAMA. 2016;315(6):562-570. PubMed
4. Jamtvedt G, Young JM, Kristoffersen DT, O’Brien MA, Oxman AD. Audit and feedback: effects on professional practice and health care outcomes. Cochrane Database Syst Rev. 2006;2(2):CD000259. PubMed
5. Navathe AS, Emanuel EJ. Physician Peer Comparisons as a Nonfinancial Strategy to Improve the Value of Care. JAMA. 2016;316(17)1759-1760. PubMed
6. Miyakis S, Karamanof G, Liontos M, Mountokalakis TD. Factors contributing to inappropriate ordering of tests in an academic medical department and the effect of an educational feedback strategy. Postgrad Med J. 2006;82(974):823-829. PubMed
7. Glaser B, Strauss A. The Discovery of Grounded Theory. London: Weidenfeld and Nicholson; 1967.
8. Ryskina K, Dine J, Gitelman Y, et al. Effect of norms on laboratory and imaging testing (ENLITen): A Randomized Controlled Trial. Abstract presented at the Society of General Internal Medicine Conference; April 20, 2017; Washington, DC.
9. Sedrak MS, Patel MS, Ziemba JB, et al. Residents’ self-report on why they order perceived unnecessary inpatient laboratory tests. J Hosp Med. 2016;11(12):869-872. PubMed
10. Tartaglia KM, Kman N, Ledford C. Medical student perceptions of cost-conscious care in an internal medicine clerkship: a thematic analysis. J Gen Intern Med. 2015;30(10):1491-1496. PubMed
11. Iams W, Heck J, Kapp M, et al. A Multidisciplinary Housestaff-Led Initiative to Safely Reduce Daily Laboratory Testing. Acad Med. 2016;91(6):813-820. DOI:10.1097/ACM.0000000000001149. PubMed
12. Corson AH, Fan VS, White T, et al. A multifaceted hospitalist quality improvement intervention: decreased frequency of common labs. J Hosp Med. 2015;10:390-395. PubMed
13. Yarbrough P, Kukhareva P, Horton D, Edholm K, Kawamoto K. Multifaceted Intervention including Education, Rounding Checklist Implementation, Cost Feedback, and Financial Incentives Reduces Inpatient Laboratory Costs. J Hosp Med. 2016;11(5):348-354. PubMed
14. Feldman LS, Shihab HM, Thiemann D, et al. Impact of Providing Fee Data on Laboratory Test Ordering: A Controlled Clinical Trial. JAMA Intern Med. 2013;173(10):903-908. PubMed
© 2017 Society of Hospital Medicine
Why Residents Order Unnecessary Inpatient Laboratory Tests
Resident physicians routinely order inpatient laboratory tests,[1] and there is evidence to suggest that many of these tests are unnecessary[2] and potentially harmful.[3] The Society of Hospital Medicine has identified reducing the unnecessary ordering of inpatient laboratory testing as part of the Choosing Wisely campaign.[4] Hospitalists at academic medical centers face growing pressures to develop processes to reduce low‐value care and train residents to be stewards of healthcare resources.[5] Studies[6, 7, 8, 9] have described that institutional and training factors drive residents' resource utilization patterns, but, to our knowledge, none have described what factors contribute to residents' unnecessary laboratory testing. To better understand the factors associated with residents' ordering patterns, we conducted a qualitative analysis of internal medicine (IM) and general surgery (GS) residents at a large academic medical center in order to describe residents' perception of the: (1) frequency of ordering unnecessary inpatient laboratory tests, (2) factors contributing to that behavior, and (3) potential interventions to change it. We also explored differences in responses by specialty and training level.
METHODS
In October 2014, we surveyed all IM and GS residents at the Hospital of the University of Pennsylvania. We reviewed the literature and conducted focus groups with residents to formulate items for the survey instrument. A draft of the survey was administered to 8 residents from both specialties, and their feedback was collated and incorporated into the final version of the instrument. The final 15‐question survey was comprised of 4 components: (1) training information such as specialty and postgraduate year (PGY), (2) self‐reported frequency of perceived unnecessary ordering of inpatient laboratory tests, (3) perception of factors contributing to unnecessary ordering, and (4) potential interventions to reduce unnecessary ordering. An unnecessary test was defined as a test that would not change management regardless of its result. To increase response rates, participants were entered into drawings for $5 gift cards, a $200 air travel voucher, and an iPad mini.
Descriptive statistics and 2tests were conducted with Stata version 13 (StataCorp LP, College Station, TX) to explore differences in the frequency of responses by specialty and training level. To identify themes that emerged from free‐text responses, two independent reviewers (M.S.S. and E.J.K.) performed qualitative content analysis using grounded theory.[10] Reviewers read 10% of responses to create a coding guide. Another 10% of the responses were randomly selected to assess inter‐rater reliability by calculating scores. The reviewers independently coded the remaining 80% of responses. Discrepancies were adjudicated by consensus between the reviewers. The University of Pennsylvania Institutional Review Board deemed this study exempt from review.
RESULTS
The sample comprised 57.0% (85/149) of IM and 54.4% (31/57) of GS residents (Table 1). Among respondents, perceived unnecessary inpatient laboratory test ordering was self‐reported by 88.2% of IM and 67.7% of GS residents. This behavior was reported to occur on a daily basis by 43.5% and 32.3% of responding IM and GS residents, respectively. Across both specialties, the most commonly reported factors contributing to these behaviors were learned practice habit/routine (90.5%), a lack of understanding of the costs associated with lab tests (86.2%), diagnostic uncertainty (82.8%), and fear of not having the lab result information when requested by an attending (75.9%). There were no significant differences in any of these contributing factors by specialty or PGY level. Among respondents who completed a free‐text response (IM: 76 of 85; GS: 21 of 31), the most commonly proposed interventions to address these issues were increasing cost transparency (IM 40.8%; GS 33.3%), improvements to faculty role modeling (IM 30.2%; GS 33.3%), and computerized reminders or decision support (IM 21.1%; GS 28.6%) (Table 2).
| Residents (n = 116)* | |
|---|---|
| |
| Reported he or she orders unnecessary routine labs, no. (%) | 96 (82.8) |
| Frequency of ordering unnecessary labs, no. (%) | |
| Daily | 47 (49.0) |
| 23 times/week | 44 (45.8) |
| 1 time/week or less | 5 (5.2) |
| Agreement with statement as factors contributing to ordering unnecessary labs, no. (%) | |
| Practice habit; I am trained to order repeating daily labs | 105 (90.5) |
| Lack of cost transparency of labs | 100 (86.2) |
| Discomfort with diagnostic uncertainty | 96 (82.8) |
| Concern that the attending will ask for the data and I will not have it | 88 (75.9) |
| Lack of role modeling of cost conscious care | 78 (67.2) |
| Lack of cost conscious culture at our institution | 76 (65.5) |
| Lack of experience | 72 (62.1) |
| Ease of ordering repeating labs in EHR | 60 (51.7) |
| Fear of litigation from missed diagnosis related to lab data | 44 (37.9) |
| Categories* | Representative Quotes | IM, n = 76, No. (%) | GS, n = 21, No. (%) |
|---|---|---|---|
| |||
| Cost transparency | Let us know the costs of what we order and train us to remember that a patient gets a bill and we are contributing to a possible bankruptcy or hardship. | 31 (40.8) | 7 (33.3) |
| Display the cost of labs when [we're] ordering them [in the EHR]. | |||
| Post the prices so that MDs understand how much everything costs. | |||
| Role modeling restrain | Train attendings to be more critical about necessity of labs and overordering. Make it part of rounding practice to decide on the labs truly needed for each patient the next day. | 23 (30.2) | 7 (33.3) |
| Attendings could review daily lab orders and briefly explain which they do not believe we need. This would allow residents to learn from their experience and their thought processes. | |||
| Encouragement and modeling of this practice from the faculty perhaps by laying out more clear expectations for which clinical situations warrant daily labs and which do not. | |||
| Computerized or decision support | When someone orders labs and the previous day's lab was normal or labs were stable for 2 days, an alert should pop up to reconsider. | 16 (21.1) | 6 (28.6) |
| Prevent us from being able to order repeating [or standing] labs. | |||
| Track how many times labs changed management, and restrict certain labslike LFTs/coags. | |||
| High‐value care educational curricula | Increase awareness of issue by having a noon conference about it or some other forum for residents to discuss the issue. | 12 (15.8) | 4 (19.0) |
| Establish guidelines for housestaff to learn/follow from start of residency. | |||
| Integrate cost conscious care into training program curricula. | |||
| System improvements | Make it easier to get labs later [in the day] | 6 (7.9) | 2 (9.5) |
| Improve timeliness of phlebotomy/laboratory systems. | |||
| More responsive phlebotomy. | |||
DISCUSSION
A significant portion of inpatient laboratory testing is unnecessary,[2] creating an opportunity to reduce utilization and associated costs. Our findings demonstrate that these behaviors occur at high levels among residents (IM 88.2%; GS 67.7%) at a large academic medical center. These findings also reveal that residents attribute this behavior to practice habit, lack of access to cost data, and perceived expectations for daily lab ordering by faculty. Interventions to change these behaviors will need to involve changes to the health system culture, increasing transparency of the costs associated with healthcare services, and shifting to a model of education that celebrates restraint.[11]
Our study adds to the emerging quest for delivering value in healthcare and provides several important insights for hospitalists and medical educators at academic centers. First, our findings reflect the significant role that the clinical learning environment plays in influencing practice behaviors among residents. Residency training is a critical time when physicians begin to form habits that imprint upon their future practice patterns,[5] and our residents are aware that their behavior to order what they perceive to be unnecessary laboratory tests is driven by habit. Studies[6, 7] have shown that residents may implicitly accept certain styles of practice as correct and are more likely to adopt those styles during the early years of their training. In our institution, for example, the process of ordering standing or daily morning labs using a repeated copy‐forward function in the electronic health record is a common, learned practice (a ritual) that is passed down from senior to junior residents year after year. This practice is common across both training specialties. There is a need to better understand, measure, and change the culture in the clinical learning environment to demonstrate practices and values that model high‐value care for residents. Multipronged interventions that address culture, oversight, and systems change[12] are necessary to facilitate effective physician stewardship of inpatient laboratory testing and attack a problem so deeply ingrained in habit.
Second, residents in our study believe that access to cost information will better equip them to reduce unnecessary lab ordering. Two recent systematic reviews[13, 14] have shown that having real‐time access to charges changes physician ordering and prescribing behavior. Increasing cost transparency may not only be an important intervention for hospitals to reduce overuse and control cost, but also better arm resident physicians with the information they need to make higher‐value recommendations for their patients and be stewards of healthcare resources.
Third, our study highlights that residents' unnecessary laboratory utilization is driven by perceived, unspoken expectations for such ordering by faculty. This reflects an important undercurrent in the medical education system that has historically emphasized and rewarded thoroughness while often penalizing restraint.[11] Hospitalists can play a major role in changing these behaviors by sharing their expectations regarding test ordering at the beginning of teaching rotations, including teaching points that discourage overutilization during rounds, and role modeling high‐value care in their own practice. Taken together and practiced routinely, these hospitalist behaviors could prevent poor habits from forming in our trainees and discourage overinvestigation. Hospitalists must be responsible to disseminate the practice of restraint to achieve more cost‐effective care. Purposeful faculty development efforts in the area of high‐value care are needed. Additionally, supporting physician leaders that serve as the institutional bridge between graduate medical education and the health system[15] could foster an environment conducive to coaching residents and faculty to reduce unnecessary practice variation.
This study is subject to several limitations. First, the survey was conducted at a single academic medical center, with a modest response rate, and thus our findings may not be generalizable to other settings or residents of different training programs. Second, we did not validate residents' perception of whether or not tests were, in fact, unnecessary. We also did not validate residents' self‐reporting of their own behavior, which may vary from actual behavior. Lack of validation at the level of the tests and at the level of the residents' behavior are two distinct but inter‐related limitations. Although self‐reported responses among residents are an important indicator of their practice, validating these data with objective measures, such as a measure of necessity of ordered lab tests as determined by an expert physician or group of experienced physicians or the number of inpatient labs ordered by residents, may add further insights. Ordering of perceived unnecessary tests may be even more common if there was under‐reporting of this behavior. Third, although we provided a definition within the survey, interpretation among survey respondents of the term unnecessary may vary, and this variation may contribute to our findings. However, we did provide a clear definition in the survey and we attempted to mitigate this with feedback from residents on our preliminary pilot.
In conclusion, this is one of the first qualitative evaluations to explore residents' perceptions on why they order unnecessary inpatient laboratory tests. Our findings offer a rich understanding of residents' beliefs about their own role in unnecessary lab ordering and explore possible solutions through the lens of the resident. Yet, it is unclear whether tests deemed unnecessary by residents would also be considered unnecessary by attending physicians or even patients. Future efforts are needed to better define which inpatient tests are unnecessary from multiple perspectives including clinicians and patients.
Acknowledgements
The authors thank Patrick J. Brennan, MD, Jeffery S. Berns, MD, Lisa M. Bellini, MD, Jon B. Morris, MD, and Irving Nachamkin, DrPH, MPH, all from the Hospital of the University of Pennsylvania, for supporting this work. They received no compensation.
Disclosures: This work was presented in part at the AAMC Integrating Quality Meeting, June 11, 2015, Chicago, Illinois; and the Alliance for Academic Internal Medicine Fall Meeting, October 9, 2015, Atlanta, Georgia. The authors report no conflicts of interest.
- , , , . The impact of residents, interns, and attendings on inpatient laboratory ordering patterns: a report from one university's hospitalist service. Acad Med. 2011;86(1):139–145.
- , , , , . The landscape of inappropriate laboratory testing: a 15‐year meta‐analysis. PLoS One. 2013;8(11):e78962.
- , , , et al. Diagnostic blood loss from phlebotomy and hospital‐acquired anemia during acute myocardial infarction. Arch Intern Med. 2011;171(18):1646–1653.
- , , , et al. Choosing wisely in adult hospital medicine: five opportunities for improved healthcare value. J Hosp Med. 2013;8(9):486–492.
- . Charting the route to high‐value care the role of medical education. JAMA. 2016;314(22):2359–2361.
- , , , , . Spending patterns in region of residency training and subsequent expenditures for care provided by practicing physicians for Medicare beneficiaries. JAMA. 2014;312(22):2385–2393.
- , , , . The association between residency training and internists' ability to practice conservatively. JAMA Intern Med. 2014;174(10):1640–1648.
- , , , , . Effect of attending practice style on generic medication prescribing by residents in the clinic setting: an observational study. J Gen Intern Med. 2015;30(9):1286–1293.
- , , , . Role‐modeling cost‐conscious care—a national evaluation of perceptions of faculty at teaching hospitals in the United States. J Gen Intern Med. 2015;30(9):1294–1298.
- , . The discovery of grounded theory. Int J Qual Methods. 1967;5:1–10.
- , . A new model for medical education: celebrating restraint. JAMA. 2012;308(13):1329–1330.
- , , . A framework for the frontline: how hospitalists can improve healthcare value. J Hosp Med. 2016;11(4):297–302.
- , , , . The effect of charge display on cost of care and physician practice behaviors: a systematic review. J Gen Intern Med. 2015;30(6):835–842.
- , , , . Impact of price display on provider ordering: a systematic review. J Hosp Med. 2016;11(1):65–76.
- , . Merging the health system and education silos to better educate future physicians. JAMA. 2015;314(22):2349–2350.
Resident physicians routinely order inpatient laboratory tests,[1] and there is evidence to suggest that many of these tests are unnecessary[2] and potentially harmful.[3] The Society of Hospital Medicine has identified reducing the unnecessary ordering of inpatient laboratory testing as part of the Choosing Wisely campaign.[4] Hospitalists at academic medical centers face growing pressures to develop processes to reduce low‐value care and train residents to be stewards of healthcare resources.[5] Studies[6, 7, 8, 9] have described that institutional and training factors drive residents' resource utilization patterns, but, to our knowledge, none have described what factors contribute to residents' unnecessary laboratory testing. To better understand the factors associated with residents' ordering patterns, we conducted a qualitative analysis of internal medicine (IM) and general surgery (GS) residents at a large academic medical center in order to describe residents' perception of the: (1) frequency of ordering unnecessary inpatient laboratory tests, (2) factors contributing to that behavior, and (3) potential interventions to change it. We also explored differences in responses by specialty and training level.
METHODS
In October 2014, we surveyed all IM and GS residents at the Hospital of the University of Pennsylvania. We reviewed the literature and conducted focus groups with residents to formulate items for the survey instrument. A draft of the survey was administered to 8 residents from both specialties, and their feedback was collated and incorporated into the final version of the instrument. The final 15‐question survey was comprised of 4 components: (1) training information such as specialty and postgraduate year (PGY), (2) self‐reported frequency of perceived unnecessary ordering of inpatient laboratory tests, (3) perception of factors contributing to unnecessary ordering, and (4) potential interventions to reduce unnecessary ordering. An unnecessary test was defined as a test that would not change management regardless of its result. To increase response rates, participants were entered into drawings for $5 gift cards, a $200 air travel voucher, and an iPad mini.
Descriptive statistics and 2tests were conducted with Stata version 13 (StataCorp LP, College Station, TX) to explore differences in the frequency of responses by specialty and training level. To identify themes that emerged from free‐text responses, two independent reviewers (M.S.S. and E.J.K.) performed qualitative content analysis using grounded theory.[10] Reviewers read 10% of responses to create a coding guide. Another 10% of the responses were randomly selected to assess inter‐rater reliability by calculating scores. The reviewers independently coded the remaining 80% of responses. Discrepancies were adjudicated by consensus between the reviewers. The University of Pennsylvania Institutional Review Board deemed this study exempt from review.
RESULTS
The sample comprised 57.0% (85/149) of IM and 54.4% (31/57) of GS residents (Table 1). Among respondents, perceived unnecessary inpatient laboratory test ordering was self‐reported by 88.2% of IM and 67.7% of GS residents. This behavior was reported to occur on a daily basis by 43.5% and 32.3% of responding IM and GS residents, respectively. Across both specialties, the most commonly reported factors contributing to these behaviors were learned practice habit/routine (90.5%), a lack of understanding of the costs associated with lab tests (86.2%), diagnostic uncertainty (82.8%), and fear of not having the lab result information when requested by an attending (75.9%). There were no significant differences in any of these contributing factors by specialty or PGY level. Among respondents who completed a free‐text response (IM: 76 of 85; GS: 21 of 31), the most commonly proposed interventions to address these issues were increasing cost transparency (IM 40.8%; GS 33.3%), improvements to faculty role modeling (IM 30.2%; GS 33.3%), and computerized reminders or decision support (IM 21.1%; GS 28.6%) (Table 2).
| Residents (n = 116)* | |
|---|---|
| |
| Reported he or she orders unnecessary routine labs, no. (%) | 96 (82.8) |
| Frequency of ordering unnecessary labs, no. (%) | |
| Daily | 47 (49.0) |
| 23 times/week | 44 (45.8) |
| 1 time/week or less | 5 (5.2) |
| Agreement with statement as factors contributing to ordering unnecessary labs, no. (%) | |
| Practice habit; I am trained to order repeating daily labs | 105 (90.5) |
| Lack of cost transparency of labs | 100 (86.2) |
| Discomfort with diagnostic uncertainty | 96 (82.8) |
| Concern that the attending will ask for the data and I will not have it | 88 (75.9) |
| Lack of role modeling of cost conscious care | 78 (67.2) |
| Lack of cost conscious culture at our institution | 76 (65.5) |
| Lack of experience | 72 (62.1) |
| Ease of ordering repeating labs in EHR | 60 (51.7) |
| Fear of litigation from missed diagnosis related to lab data | 44 (37.9) |
| Categories* | Representative Quotes | IM, n = 76, No. (%) | GS, n = 21, No. (%) |
|---|---|---|---|
| |||
| Cost transparency | Let us know the costs of what we order and train us to remember that a patient gets a bill and we are contributing to a possible bankruptcy or hardship. | 31 (40.8) | 7 (33.3) |
| Display the cost of labs when [we're] ordering them [in the EHR]. | |||
| Post the prices so that MDs understand how much everything costs. | |||
| Role modeling restrain | Train attendings to be more critical about necessity of labs and overordering. Make it part of rounding practice to decide on the labs truly needed for each patient the next day. | 23 (30.2) | 7 (33.3) |
| Attendings could review daily lab orders and briefly explain which they do not believe we need. This would allow residents to learn from their experience and their thought processes. | |||
| Encouragement and modeling of this practice from the faculty perhaps by laying out more clear expectations for which clinical situations warrant daily labs and which do not. | |||
| Computerized or decision support | When someone orders labs and the previous day's lab was normal or labs were stable for 2 days, an alert should pop up to reconsider. | 16 (21.1) | 6 (28.6) |
| Prevent us from being able to order repeating [or standing] labs. | |||
| Track how many times labs changed management, and restrict certain labslike LFTs/coags. | |||
| High‐value care educational curricula | Increase awareness of issue by having a noon conference about it or some other forum for residents to discuss the issue. | 12 (15.8) | 4 (19.0) |
| Establish guidelines for housestaff to learn/follow from start of residency. | |||
| Integrate cost conscious care into training program curricula. | |||
| System improvements | Make it easier to get labs later [in the day] | 6 (7.9) | 2 (9.5) |
| Improve timeliness of phlebotomy/laboratory systems. | |||
| More responsive phlebotomy. | |||
DISCUSSION
A significant portion of inpatient laboratory testing is unnecessary,[2] creating an opportunity to reduce utilization and associated costs. Our findings demonstrate that these behaviors occur at high levels among residents (IM 88.2%; GS 67.7%) at a large academic medical center. These findings also reveal that residents attribute this behavior to practice habit, lack of access to cost data, and perceived expectations for daily lab ordering by faculty. Interventions to change these behaviors will need to involve changes to the health system culture, increasing transparency of the costs associated with healthcare services, and shifting to a model of education that celebrates restraint.[11]
Our study adds to the emerging quest for delivering value in healthcare and provides several important insights for hospitalists and medical educators at academic centers. First, our findings reflect the significant role that the clinical learning environment plays in influencing practice behaviors among residents. Residency training is a critical time when physicians begin to form habits that imprint upon their future practice patterns,[5] and our residents are aware that their behavior to order what they perceive to be unnecessary laboratory tests is driven by habit. Studies[6, 7] have shown that residents may implicitly accept certain styles of practice as correct and are more likely to adopt those styles during the early years of their training. In our institution, for example, the process of ordering standing or daily morning labs using a repeated copy‐forward function in the electronic health record is a common, learned practice (a ritual) that is passed down from senior to junior residents year after year. This practice is common across both training specialties. There is a need to better understand, measure, and change the culture in the clinical learning environment to demonstrate practices and values that model high‐value care for residents. Multipronged interventions that address culture, oversight, and systems change[12] are necessary to facilitate effective physician stewardship of inpatient laboratory testing and attack a problem so deeply ingrained in habit.
Second, residents in our study believe that access to cost information will better equip them to reduce unnecessary lab ordering. Two recent systematic reviews[13, 14] have shown that having real‐time access to charges changes physician ordering and prescribing behavior. Increasing cost transparency may not only be an important intervention for hospitals to reduce overuse and control cost, but also better arm resident physicians with the information they need to make higher‐value recommendations for their patients and be stewards of healthcare resources.
Third, our study highlights that residents' unnecessary laboratory utilization is driven by perceived, unspoken expectations for such ordering by faculty. This reflects an important undercurrent in the medical education system that has historically emphasized and rewarded thoroughness while often penalizing restraint.[11] Hospitalists can play a major role in changing these behaviors by sharing their expectations regarding test ordering at the beginning of teaching rotations, including teaching points that discourage overutilization during rounds, and role modeling high‐value care in their own practice. Taken together and practiced routinely, these hospitalist behaviors could prevent poor habits from forming in our trainees and discourage overinvestigation. Hospitalists must be responsible to disseminate the practice of restraint to achieve more cost‐effective care. Purposeful faculty development efforts in the area of high‐value care are needed. Additionally, supporting physician leaders that serve as the institutional bridge between graduate medical education and the health system[15] could foster an environment conducive to coaching residents and faculty to reduce unnecessary practice variation.
This study is subject to several limitations. First, the survey was conducted at a single academic medical center, with a modest response rate, and thus our findings may not be generalizable to other settings or residents of different training programs. Second, we did not validate residents' perception of whether or not tests were, in fact, unnecessary. We also did not validate residents' self‐reporting of their own behavior, which may vary from actual behavior. Lack of validation at the level of the tests and at the level of the residents' behavior are two distinct but inter‐related limitations. Although self‐reported responses among residents are an important indicator of their practice, validating these data with objective measures, such as a measure of necessity of ordered lab tests as determined by an expert physician or group of experienced physicians or the number of inpatient labs ordered by residents, may add further insights. Ordering of perceived unnecessary tests may be even more common if there was under‐reporting of this behavior. Third, although we provided a definition within the survey, interpretation among survey respondents of the term unnecessary may vary, and this variation may contribute to our findings. However, we did provide a clear definition in the survey and we attempted to mitigate this with feedback from residents on our preliminary pilot.
In conclusion, this is one of the first qualitative evaluations to explore residents' perceptions on why they order unnecessary inpatient laboratory tests. Our findings offer a rich understanding of residents' beliefs about their own role in unnecessary lab ordering and explore possible solutions through the lens of the resident. Yet, it is unclear whether tests deemed unnecessary by residents would also be considered unnecessary by attending physicians or even patients. Future efforts are needed to better define which inpatient tests are unnecessary from multiple perspectives including clinicians and patients.
Acknowledgements
The authors thank Patrick J. Brennan, MD, Jeffery S. Berns, MD, Lisa M. Bellini, MD, Jon B. Morris, MD, and Irving Nachamkin, DrPH, MPH, all from the Hospital of the University of Pennsylvania, for supporting this work. They received no compensation.
Disclosures: This work was presented in part at the AAMC Integrating Quality Meeting, June 11, 2015, Chicago, Illinois; and the Alliance for Academic Internal Medicine Fall Meeting, October 9, 2015, Atlanta, Georgia. The authors report no conflicts of interest.
- , , , . The impact of residents, interns, and attendings on inpatient laboratory ordering patterns: a report from one university's hospitalist service. Acad Med. 2011;86(1):139–145.
- , , , , . The landscape of inappropriate laboratory testing: a 15‐year meta‐analysis. PLoS One. 2013;8(11):e78962.
- , , , et al. Diagnostic blood loss from phlebotomy and hospital‐acquired anemia during acute myocardial infarction. Arch Intern Med. 2011;171(18):1646–1653.
- , , , et al. Choosing wisely in adult hospital medicine: five opportunities for improved healthcare value. J Hosp Med. 2013;8(9):486–492.
- . Charting the route to high‐value care the role of medical education. JAMA. 2016;314(22):2359–2361.
- , , , , . Spending patterns in region of residency training and subsequent expenditures for care provided by practicing physicians for Medicare beneficiaries. JAMA. 2014;312(22):2385–2393.
- , , , . The association between residency training and internists' ability to practice conservatively. JAMA Intern Med. 2014;174(10):1640–1648.
- , , , , . Effect of attending practice style on generic medication prescribing by residents in the clinic setting: an observational study. J Gen Intern Med. 2015;30(9):1286–1293.
- , , , . Role‐modeling cost‐conscious care—a national evaluation of perceptions of faculty at teaching hospitals in the United States. J Gen Intern Med. 2015;30(9):1294–1298.
- , . The discovery of grounded theory. Int J Qual Methods. 1967;5:1–10.
- , . A new model for medical education: celebrating restraint. JAMA. 2012;308(13):1329–1330.
- , , . A framework for the frontline: how hospitalists can improve healthcare value. J Hosp Med. 2016;11(4):297–302.
- , , , . The effect of charge display on cost of care and physician practice behaviors: a systematic review. J Gen Intern Med. 2015;30(6):835–842.
- , , , . Impact of price display on provider ordering: a systematic review. J Hosp Med. 2016;11(1):65–76.
- , . Merging the health system and education silos to better educate future physicians. JAMA. 2015;314(22):2349–2350.