User login
Development of a Simple Index to Measure Overuse of Diagnostic Testing at the Hospital Level Using Administrative Data
There is substantial geographic variation in intensity of healthcare use in the United States,1 yet areas with higher healthcare utilization do not demonstrate superior clinical outcomes.2 Low-value care exposes patients to unnecessary anxiety, radiation, and risk for adverse events.
Previous research has focused on measuring low-value care at the level of hospital referral regions,3-6 metropolitan statistical areas,7 provider organizations,8 and individual physicians.9,10 Hospital referral regions designate regional healthcare markets for tertiary care and generally include at least one major referral center.11 Well-calibrated and validated hospital-level measures of diagnostic overuse are lacking.
We sought to construct a novel index to measure hospital level overuse of diagnostic testing. We focused on diagnostic intensity rather than other forms of overuse such as screening or treatment intensity. Moreover, we aimed to create a parsimonious index—one that is simple, relies on a small number of inputs, is derived from readily available administrative data without the need for chart review or complex logic, and does not require exclusion criteria.
METHODS
Conceptual Framework for Choosing Index Components
To create our overuse index, we took advantage of the requirements for International Classification of Diseases, 9th Revision-Clinical Modification (ICD-9-CM) billing codes 780-796; these codes are based on “symptoms, signs, and ill-defined conditions” and can only be listed as the primary discharge diagnosis if no more specific diagnosis is made.12 As such, when coupled with expensive tests, a high prevalence of these symptom-based diagnosis codes at discharge may serve as a proxy for low-value care. One of the candidate metrics we selected was based on Choosing Wisely® recommendations.13 The other candidate metrics were based on clinical experience and consensus of the study team.
Data Sources
We used hospital-level data on primary discharge diagnosis codes and utilization of testing data from the State Inpatient Databases (SID), which are part of the Agency for Healthcare Research and Quality Healthcare Cost and Utilization Project (HCUP). Our derivation cohort used data from acute care hospitals in Maryland, New Jersey, and Washington state. Our validation cohort used data from acute care hospitals in Kentucky, North Carolina, New York, and West Virginia. States were selected based on availability of data (certain states lacked complete testing utilization data) and cost of data acquisition. The SID contains hospital-level utilization of computed tomography (CT) scans (CT of the body and head) and diagnostic testing, including stress testing and esophagogastroduodenoscopy (EGD).
Data on three prespecified Dartmouth Atlas of Health Care metrics at the hospital service area (HSA) level were obtained from the Dartmouth Atlas website.14 These metrics were (1) rate of inpatient coronary angiograms per 1,000 Medicare enrollees, (2) price-adjusted physician reimbursement per fee-for-service Medicare enrollee per year (adjusted for patient sex, race, and age), and (3) mean inpatient spending per decedent in the last 6 months of life.15 Data on three prespecified Medicare metrics at the county level were obtained from the Centers for Medicare & Medicaid Services (CMS) website.16 These metrics were standardized per capita cost per (1) procedure, (2) imaging, and (3) test of Medicare fee-for-service patients. The CMS uses the Berenson-Eggers Type of Service Codes to classify fee-generating interventions into a number of categories, including procedure, imaging, and test.17
Components of the Overuse Index
We tested five candidate metrics for index inclusion (Table 1). We utilized Clinical Classifications Software (CCS) codes provided by HCUP, which combine several ICD-9-CM codes into a single primary CCS discharge code for ease of use. The components were (1) primary CCS diagnosis of “nausea and vomiting” coupled with body CT scan or EGD, (2) primary CCS diagnosis of abdominal pain and body CT scan or EGD, (3) primary CCS diagnosis of “nonspecific chest pain” and body CT scan or stress test, (4) primary CCS diagnosis of syncope and stress test, and (5) primary CCS diagnosis for syncope and CT of the brain. For a given metric, the denominator was all patients with the particular primary CCS discharge diagnosis code. The numerator was patients with the diagnostic code who also had the specific test or procedure. We characterized the denominators of each metric in terms of mean, SD, and range.

Index Inclusion Criteria and Construction
Specialty, pediatric, rehabilitation, and long-term care hospitals were excluded. Moreover, any hospital with an overall denominator (for the entire index, not an individual metric) of five or fewer observations was excluded. Admissions to acute care hospitals between January 2011 and September 2015 (time of transition from ICD-9-CM to ICD-10-CM) that had one of the specified diagnosis codes were included. For a given hospital, the value of each of the five candidate metrics was defined as the ratio of all admissions that had the given testing and all admissions during the observation period with inclusion CCS diagnosis codes.
Derivation and Validation of the Index
In our derivation cohort (hospitals in Maryland, New Jersey, and Washington state), we tested the temporal stability of each candidate metric by year using the intraclass correlation coefficient (ICC). Using exploratory factor analysis (EFA) and Cronbach’s alpha, we then tested internal consistency of the index candidate components to ensure that all measured a common underlying factor (ie, diagnostic overuse). To standardize data, test rates for both of these analyses were converted to z-scores. For the EFA, we expected that if the index was reflecting only a single underlying factor, the Eigenvalue for one factor should be much higher (typically above 1.0) than that for multiple factors. We calculated item-test correlation for each candidate metric and Cronbach’s alpha for the entire index. A high and stable value for item-test correlation for each index component, as well as a high Cronbach’s alpha, suggests that index components measure a single common factor. Given the small number of test items, we considered a Cronbach’s alpha above 0.6 to be satisfactory.
This analysis showed satisfactory temporal stability of each candidate metric and good internal consistency of the candidate metrics in the derivation cohort. Therefore, we decided to keep all metrics rather than discard any of them. This same process was repeated with the validation cohort (Kentucky, New York, North Carolina, and West Virginia) and then with the combined group of seven states. Tests on the validation and entire cohort further supported our decision to keep all five metrics.
To determine the overall index value for a hospital, all of its metric numerators and denominators were added to calculate one fraction. In this way for a given hospital, a metric for which there were no observations was effectively excluded from the index. This essentially weights each index component by frequency. We chose to count syncope admissions only once in the denominator to avoid the index being unduly influenced by this diagnosis. The hospital index values were combined into their HSAs by adding numerators and denominators from each hospital to calculate HSA index values, effectively giving higher weight to hospitals with more observations. Spearman’s correlation coefficients were measured for these Dartmouth Atlas metrics, also at the HSA level. For the county level analysis, we used a hospital-county crosswalk (available from the American Hospital Association [AHA] Annual Survey; https://www.ahadata.com/aha-annual-survey-database) to link a hospital overuse index value to a county level cost value rather than aggregating data at the county level. We felt this was appropriate, as HSAs were constructed to represent a local healthcare market, whereas counties are less likely to be homogenous from a healthcare perspective.
Analysis of Entire Hospital Sample
The mean index value and SD were calculated for the entire sample of hospitals and for each state. The mean index value for each year of data was calculated to measure the temporal change of the index (representing a change in diagnostic intensity over the study period) using linear regression. We divided the cohort of hospitals into tertiles based on their index value. This is consistent with the CMS categorization of hospital payments and value of care as being “at,” “significantly above,” or “significantly below” a mean value.18 The characteristics of hospitals by tertile were described by mean total hospital beds, mean annual admissions, teaching status (nonteaching hospital, minor teaching hospital, major teaching hospital), and critical access hospital (yes/no). We utilized the AHA Annual Survey for data on hospital characteristics. We calculated P values using analysis of variance for hospital bed size and a chi-square test for teaching status and critical access hospital.
The entire group of hospitals from seven states was then used to apply the index to the HSA level. Numerators and denominators for each hospital in an HSA were added to calculate an HSA-level proportion. Thus, the HSA level index value, though unweighted, is dominated by hospitals with larger numbers of observations. For each of the Dartmouth metrics, the adjusted odds ratio of being in a higher diagnostic overuse index tertile given being in a certain Dartmouth Atlas metric tertile was calculated using ordinal logistic regression. This model controlled for the mean number of beds of hospitals in the HSA (continuous variable), mean Elixhauser Comorbidity Index (ECI) score (continuous variable; unweighted average among hospitals in an HSA), whether the HSA had a major or minor teaching hospital (yes/no) or was a critical access hospital (yes/no), and state fixed effects. The ECI score is a validated score that uses the presence or absence of 29 comorbidities to predict in-hospital mortality.19 For discriminant validity, we also tested two variables not expected to be associated with overuse—hospital ownership and affiliation with the Catholic Church.
For the county-level analysis, ordinal logistic regression was used to predict the adjusted odds ratio of being in a higher diagnostic overuse index tertile given being in a certain tertile of a given county-level spending metric. This model controlled for hospital bed size (continuous variable), hospital ECI score (continuous variable), teaching status (major, minor, nonteaching), critical access hospital status (yes/no), and state fixed effects.
RESULTS
Descriptive Statistics for Metrics
A total of 620 acute care hospitals were included in the index. Thirteen hospitals were excluded because their denominator was five or fewer. The vast majority of HSAs (85.9%) had only one hospital, 8.2% had two hospitals, and 2.4% had three hospitals. Similarly, the majority of counties (68.7%) had only one hospital, 15.1% had two hospitals, and 6.6% had three hospitals (Appendix Tables 1.1 and 1.2). Nonspecific chest pain was the metric with largest denominator mean (650), SD (1,012), and range (0-10,725) (Appendix Table 2). Overall, the metric denominators were a small fraction of total hospital discharges, with means at the hospital level ranging from 0.69% for nausea and vomiting to 5.81% for nonspecific chest pain, suggesting that our index relies on a relatively small fraction of discharges.
Tests for Temporal Stability and Internal Consistency by Derivation and Validation Strategy
Overall, the ICCs for the derivation, validation, and entire cohort suggested strong temporal stability (Appendix Table 3). The EFA of the derivation, validation, and entire cohort showed high Eigenvalues for one principal component, with no other factors close to 1, indicating strong internal consistency (Appendix Table 4). The Cronbach’s alpha analysis also suggested strong internal consistency, with alpha values ranging from 0.73 for the validation cohort to 0.80 for the derivation cohort (Table 2).

Correlation With External Validation Measures
For the entire cohort, the Spearman’s rho for correlation between our overuse index and inpatient rate of coronary angiography at the HSA level was 0.186 (95% CI, 0.089-0.283), Medicare reimbursement at the HSA level was 0.355 (95% CI, 0.272-0.437), and Medicare spending during the last 6 months of life at the HSA level was 0.149 (95% CI, 0.061-0.236) (Appendix Figures 5.1-5.3). The Spearman’s rho for correlation between our overuse index and county level standardized procedure cost was 0.284 (95% CI, 0.210-0.358), imaging cost was 0.268 (95% CI, 0.195-0.342), and testing cost was 0.226 (95% CI, 0.152-0.300) (Appendix Figures 6.1-6.3).
Overall Index Values and Change Over Time
The mean hospital index value was 0.541 (SD, 0.178) (Appendix Table 7). There was a slight but statistically significant annual increase in the overall mean index value over the study period, suggesting a small rise in overuse of diagnostic testing (coefficient 0.011; P <.001) (Appendix Figure 8).
Diagnostic Overuse Index Tertiles
Hospitals in the lowest tertile of the index tended to be smaller (based on number of beds) (P < .0001) and were more likely to be critical access hospitals (P <.0001). There was a significant difference in the proportion of nonteaching, minor teaching, and major teaching hospitals, with more nonteaching hospitals in tertile 1 (P = .001) (Table 3). The median ECI score was not significantly different among tertiles. Neither of the variables tested for discriminant validity (hospital ownership and Catholic Church affiliation) was associated with our index.

Adjusted Multilevel Mixed-Effects Ordinal Logistic Regression
Our overuse index correlated most closely with physician reimbursement, with an odds ratio of 2.02 (95% CI, 1.11-3.66) of being in a higher tertile of the overuse index when comparing tertiles 3 and 1 of this Dartmouth metric. Of the Medicare county-level metrics, our index correlated most closely with cost of procedures, with an odds ratio of 2.03 (95% CI, 1.21-3.39) of being in a higher overuse index tertile when comparing tertiles 3 and 1 of the cost per procedure metric (Figure 1).

DISCUSSION
Previous research shows variation among hospitals for overall physician spending,20 noninvasive cardiac imaging,21 and the rate of finding obstructive lesions during elective coronary angiography.22 However, there is a lack of standardized methods to study a broad range of diagnostic overuse at the hospital level. To our knowledge, no studies have attempted to develop a diagnostic overuse index at the hospital level. We used a derivation-validation approach to achieve our goal. Although the five metrics represent a range of conditions, the EFA and Cronbach’s alpha tests suggest that they measure a common phenomenon. To avoid systematically excluding smaller hospitals, we limited the extent to which we eliminated hospitals with few observations. Our findings suggest that it may be reasonable to make generalizations on the diagnostic intensity of a hospital based on a relatively small number of discharges. Moreover, our index is a proof of concept that rates of negative diagnostic testing can serve as a proxy for estimating diagnostic overuse.
Our hospital-level index values extrapolated to the HSA level weakly correlated with prespecified Dartmouth Atlas metrics. In a multivariate ordinal regression, there was a significant though weak association between hospitals in higher tertiles of the Dartmouth Atlas metrics and categorization in higher tertiles of our diagnostic overuse index. Similarly, our hospital-level index correlated with two of the three county-level metrics in a multivariate ordinal regression.
We do not assume that all of the metrics in our index track together. However, our results, including the wide dispersion of index values among the tertiles (Table 3), suggest that at least some hospitals are outliers in multiple metrics. We did not assume ex ante that our index should correlate with Dartmouth overuse metrics or Medicare county-level spending; however, we did believe that an association with these measures would assist in validating our index. Given that our index utilizes four common diagnoses, while the Dartmouth and Medicare cost metrics are based on a much broader range of conditions, we would not expect more than a weak correlation even if our index is a valid way to measure overuse.
All of the metrics were based on the concept that hospitals with high rates of negative testing are likely providing large amounts of low-value care. Prior studies on diagnostic yield of CT scans in the emergency department for pulmonary embolus (PE) found an increase in testing and decrease in yield over time; these studies also showed that physicians with more experience ordered fewer CT scans and had a higher yield.23 A review of electronic health records and billing data also showed that hospitals with higher rates of D-dimer testing had higher yields on CT scans ordered to test for PE.24
We took advantage of the coding convention that certain diagnoses only be listed as the primary discharge diagnosis if no more specific diagnosis is made. This allowed us to identify hospitals that likely had high rates of negative tests without granular data. Of course, the metrics are not measuring rates of negative testing per se, but a proxy for this, based instead on the proportion of patients with a symptom-based primary discharge diagnosis who underwent diagnostic testing.
Measuring diagnostic overuse at the hospital level may help to understand factors that drive overuse, given that institutional incentives and culture likely play important roles in ordering tests. There is evidence that financial incentives drive physicians’ decisions,25-27 and there is also evidence that institutional culture impacts outcomes.28 Further, quality improvement projects are typically designed at the hospital level and may be an effective way to curb overuse.29,30
Previous studies have focused on measuring variation among providers and identifying outlier physicians.9,10,20 Providing feedback to underperforming physicians has been shown to change practice habits.31,32 Efforts to improve the practice habits of outlier hospitals may have a number of advantages, including economies of scale and scope and the added benefit of improving the habits of all providers—not just those who are underperforming.
Ordering expensive diagnostic tests on patients with a low pretest probability of having an organic etiology for their symptoms contributes to high healthcare costs. Of course, we do not believe that the ideal rate of negative testing is zero. However, hospitals with high rates of negative diagnostic testing are more likely to be those with clinicians who use expensive tests as a substitute for clinical judgment or less-expensive tests (eg, D-dimer testing to rule out PE).
One challenge we faced is that there is no gold standard of hospital-level overuse with which to validate our index. Our index is weakly correlated with a number of regional metrics that may be proxies for overuse. We are reassured that there is a statistically significant correlation with measures at both HSA and county levels. These correlations are weak, but these regional metrics are themselves imperfect surrogates for overuse. Furthermore, our index is preliminary and will need refinement in future studies.
Limitations
Our analysis has multiple limitations. First, since it relies heavily on primary ICD discharge diagnosis codes, biases could exist due to variations in coding practices. Second, the SID does not include observation stays or tests conducted in the ED, so differential use of observation stays among hospitals might impact results. Finally, based on utilization data, we were not able to distinguish between CT scans of the chest, abdomen, and pelvis because the SID labels each of these as body CT.
CONCLUSION
We developed a novel index to measure diagnostic intensity at the hospital level. This index relies on the concept that high rates of negative diagnostic testing likely indicate some degree of overuse. Our index is parsimonious, does not require granular claims data, and measures a range of potentially overused tests for common clinical scenarios. Our next steps include further refining the index, testing it with granular data, and validating it with other datasets. Thereafter, this index may be useful at identifying positive and negative outliers to understand what processes of care contribute to outlier high and low levels of diagnostic testing. We suspect our index is more useful at identifying extremes than comparing hospitals in the middle of the utilization curve. Additionally, exploring the relationship among individual metrics and the relationship between our index and quality measures like mortality and readmissions may be informative.
1. Fisher ES, Wennberg JE, Stukel TA, et al. Associations among hospital capacity, utilization, and mortality of US Medicare beneficiaries, controlling for sociodemographic factors. Health Serv Res. 2000;34(6):1351-1362.
2. Fisher ES, Wennberg DE, Stukel TA, Gottlieb DJ, Lucas FL, Pinder ÉL. The implications of regional variations in Medicare spending. Part 2: health outcomes and satisfaction with care. Ann Intern Med. 2003;138(4):288-298. https://doi.org/10.7326/0003-4819-138-4-200302180-00007
3. Segal JB, Nassery N, Chang H-Y, Chang E, Chan K, Bridges JFP. An index for measuring overuse of health care resources with Medicare claims. Med Care. 2015;53(3):230-236. https://doi.org/10.1097/mlr.0000000000000304
4. Colla CH, Morden NE, Sequist TD, Schpero WL, Rosenthal MB. Choosing wisely: prevalence and correlates of low-value health care services in the United States. J Gen Intern Med. 2014;30(2):221-228. https://doi.org/10.1007/s11606-014-3070-z
5. Colla CH, Morden NE, Sequist TD, Mainor AJ, Li Z, Rosenthal MB. Payer type and low-value care: comparing Choosing Wisely services across commercial and Medicare populations. Health Serv Res. 2018;53(2):730-746. https://doi.org/10.1111/1475-6773.12665
6. Schwartz AL, Landon BE, Elshaug AG, Chernew ME, McWilliams JM. Measuring low-value care in Medicare. JAMA Intern Med. 2014;174(7):1067-1076. https://doi.org/10.1001/jamainternmed.2014.1541
7. Oakes AH, Chang H-Y, Segal JB. Systemic overuse of health care in a commercially insured US population, 2010–2015. BMC Health Serv Res. 2019;19(1). https://doi.org/10.1186/s12913-019-4079-0
8. Schwartz AL, Zaslavsky AM, Landon BE, Chernew ME, McWilliams JM. Low-value service use in provider organizations. Health Serv Res. 2018;53(1):87-119. https://doi.org/10.1111/1475-6773.12597
9. Schwartz AL, Jena AB, Zaslavsky AM, McWilliams JM. Analysis of physician variation in provision of low-value services. JAMA Intern Med. 2019;179(1):16-25. https://doi.org/10.1001/jamainternmed.2018.5086
10. Bouck Z, Ferguson J, Ivers NM, et al. Physician characteristics associated with ordering 4 low-value screening tests in primary care. JAMA Netw Open. 2018;1(6):e183506. https://doi.org/10.1001/jamanetworkopen.2018.3506
11. Dartmouth Atlas Project. Data By Region - Dartmouth Atlas of Health Care. Accessed August 29, 2019. http://archive.dartmouthatlas.org/data/region/
12. ICD-9-CM Official Guidelines for Coding and Reporting (Effective October 11, 2011). Accessed March 1, 2018. https://www.cdc.gov/nchs/data/icd/icd9cm_guidelines_2011.pdf
13. Cassel CK, Guest JA. Choosing wisely - helping physicians and patients make smart decisions about their care. JAMA. 2012;307(17):1801-1802. https://doi.org/10.1001/jama.2012.476
14. The Dartmouth Atlas of Health Care. Accessed July 17, 2018. http://www.dartmouthatlas.org/
15. The Dartmouth Atlas of Healthcare. Research Methods. Accessed January 27, 2019. http://archive.dartmouthatlas.org/downloads/methods/research_methods.pdf
16. Centers for Medicare & Medicaid Services. Medicare geographic variation, public use file. Accessed January 5, 2020. https://www.cms.gov/Research-Statistics-Data-and-Systems/Statistics-Trends-and-Reports/Medicare-Geographic-Variation/GV_PUF
17. Centers for Medicare & Medicaid Services. Berenson-Eggers Type of Service (BETOS) codes. Accessed January 10, 2020. https://www.cms.gov/Research-Statistics-Data-and-Systems/Statistics-Trends-and-Reports/MedicareFeeforSvcPartsAB/downloads/betosdesccodes.pdf
18. Data.Medicare.gov. Payment and value of care – hospital: hospital compare. Accessed August 21, 2019. https://data.medicare.gov/Hospital-Compare/Payment-and-value-of-care-Hospital/c7us-v4mf
19. Moore BJ, White S, Washington R, Coenen N, Elixhauser A. Identifying increased risk of readmission and in-hospital mortality using hospital administrative data: the AHRQ Elixhauser comorbidity index. Med Care. 2017;55(7):698-705. https://doi.org/10.1097/mlr.0000000000000735
20. Tsugawa Y, Jha AK, Newhouse JP, Zaslavsky AM, Jena AB. Variation in physician spending and association with patient outcomes. JAMA Intern Med. 2017;177(5):675-682. https://doi.org/10.1001/jamainternmed.2017.0059
21. Safavi KC, Li S-X, Dharmarajan K, et al. Hospital variation in the use of noninvasive cardiac imaging and its association with downstream testing, interventions, and outcomes. JAMA Intern Med. 2014;174(4):546-553. https://doi.org/10.1001/jamainternmed.2013.14407
22. Douglas PS, Patel MR, Bailey SR, et al. Hospital variability in the rate of finding obstructive coronary artery disease at elective, diagnostic coronary angiography. J Am Coll Cardiol. 2011;58(8):801-809. https://doi.org/10.1016/j.jacc.2011.05.019
23. Venkatesh AK, Agha L, Abaluck J, Rothenberg C, Kabrhel C, Raja AS. Trends and variation in the utilization and diagnostic yield of chest imaging for Medicare patients with suspected pulmonary embolism in the emergency department. Am J Roentgenol. 2018;210(3):572-577. https://doi.org/10.2214/ajr.17.18586
24. Kline JA, Garrett JS, Sarmiento EJ, Strachan CC, Courtney DM. Over-testing for suspected pulmonary embolism in american emergency departments: the continuing epidemic. Circ Cardiovasc Qual Outcomes. 2020;13(1):e005753. https://doi.org/10.1161/circoutcomes.119.005753
25. Welch HG, Fisher ES. Income and cancer overdiagnosis – when too much care is harmful. N Engl J Med. 2017;376(23):2208-2209. https://doi.org/10.1056/nejmp1615069
26. Nicholson S. Physician specialty choice under uncertainty. J Labor Econ. 2002;20(4):816-847. https://doi.org/10.1086/342039
27. Chang R-KR, Halfon N. Geographic distribution of pediatricians in the United States: an analysis of the fifty states and Washington, DC. Pediatrics. 1997;100(2 pt 1):172-179. https://doi.org/10.1542/peds.100.2.172
28. Braithwaite J, Herkes J, Ludlow K, Lamprell G, Testa L. Association between organisational and workplace cultures, and patient outcomes: systematic review protocol. BMJ Open. 2016;6(12):e013758. https://doi.org/10.1136/bmjopen-2016-013758
29. Bhatia RS, Milford CE, Picard MH, Weiner RB. An educational intervention reduces the rate of inappropriate echocardiograms on an inpatient medical service. JACC Cardiovasc Imaging. 2013;6(5):545-555. https://doi.org/10.1016/j.jcmg.2013.01.010
30. Blackmore CC, Watt D, Sicuro PL. The success and failure of a radiology quality metric: the case of OP-10. J Am Coll Radiol. 2016;13(6):630-637. https://doi.org/10.1016/j.jacr.2016.01.006
31. Albertini JG, Wang P, Fahim C, et al. Evaluation of a peer-to-peer data transparency intervention for Mohs micrographic surgery overuse. JAMA Dermatol. 2019;155(8):906-913. https://dx.doi.org/10.1001%2Fjamadermatol.2019.1259
32. Sacarny A, Barnett ML, Le J, Tetkoski F, Yokum D, Agrawal S. Effect of peer comparison letters for high-volume primary care prescribers of quetiapine in older and disabled adults: a randomized clinical trial. JAMA Psychiatry. 2018;75(10):1003-1011. https://doi.org/10.1001/jamapsychiatry.2018.1867
There is substantial geographic variation in intensity of healthcare use in the United States,1 yet areas with higher healthcare utilization do not demonstrate superior clinical outcomes.2 Low-value care exposes patients to unnecessary anxiety, radiation, and risk for adverse events.
Previous research has focused on measuring low-value care at the level of hospital referral regions,3-6 metropolitan statistical areas,7 provider organizations,8 and individual physicians.9,10 Hospital referral regions designate regional healthcare markets for tertiary care and generally include at least one major referral center.11 Well-calibrated and validated hospital-level measures of diagnostic overuse are lacking.
We sought to construct a novel index to measure hospital level overuse of diagnostic testing. We focused on diagnostic intensity rather than other forms of overuse such as screening or treatment intensity. Moreover, we aimed to create a parsimonious index—one that is simple, relies on a small number of inputs, is derived from readily available administrative data without the need for chart review or complex logic, and does not require exclusion criteria.
METHODS
Conceptual Framework for Choosing Index Components
To create our overuse index, we took advantage of the requirements for International Classification of Diseases, 9th Revision-Clinical Modification (ICD-9-CM) billing codes 780-796; these codes are based on “symptoms, signs, and ill-defined conditions” and can only be listed as the primary discharge diagnosis if no more specific diagnosis is made.12 As such, when coupled with expensive tests, a high prevalence of these symptom-based diagnosis codes at discharge may serve as a proxy for low-value care. One of the candidate metrics we selected was based on Choosing Wisely® recommendations.13 The other candidate metrics were based on clinical experience and consensus of the study team.
Data Sources
We used hospital-level data on primary discharge diagnosis codes and utilization of testing data from the State Inpatient Databases (SID), which are part of the Agency for Healthcare Research and Quality Healthcare Cost and Utilization Project (HCUP). Our derivation cohort used data from acute care hospitals in Maryland, New Jersey, and Washington state. Our validation cohort used data from acute care hospitals in Kentucky, North Carolina, New York, and West Virginia. States were selected based on availability of data (certain states lacked complete testing utilization data) and cost of data acquisition. The SID contains hospital-level utilization of computed tomography (CT) scans (CT of the body and head) and diagnostic testing, including stress testing and esophagogastroduodenoscopy (EGD).
Data on three prespecified Dartmouth Atlas of Health Care metrics at the hospital service area (HSA) level were obtained from the Dartmouth Atlas website.14 These metrics were (1) rate of inpatient coronary angiograms per 1,000 Medicare enrollees, (2) price-adjusted physician reimbursement per fee-for-service Medicare enrollee per year (adjusted for patient sex, race, and age), and (3) mean inpatient spending per decedent in the last 6 months of life.15 Data on three prespecified Medicare metrics at the county level were obtained from the Centers for Medicare & Medicaid Services (CMS) website.16 These metrics were standardized per capita cost per (1) procedure, (2) imaging, and (3) test of Medicare fee-for-service patients. The CMS uses the Berenson-Eggers Type of Service Codes to classify fee-generating interventions into a number of categories, including procedure, imaging, and test.17
Components of the Overuse Index
We tested five candidate metrics for index inclusion (Table 1). We utilized Clinical Classifications Software (CCS) codes provided by HCUP, which combine several ICD-9-CM codes into a single primary CCS discharge code for ease of use. The components were (1) primary CCS diagnosis of “nausea and vomiting” coupled with body CT scan or EGD, (2) primary CCS diagnosis of abdominal pain and body CT scan or EGD, (3) primary CCS diagnosis of “nonspecific chest pain” and body CT scan or stress test, (4) primary CCS diagnosis of syncope and stress test, and (5) primary CCS diagnosis for syncope and CT of the brain. For a given metric, the denominator was all patients with the particular primary CCS discharge diagnosis code. The numerator was patients with the diagnostic code who also had the specific test or procedure. We characterized the denominators of each metric in terms of mean, SD, and range.
Index Inclusion Criteria and Construction
Specialty, pediatric, rehabilitation, and long-term care hospitals were excluded. Moreover, any hospital with an overall denominator (for the entire index, not an individual metric) of five or fewer observations was excluded. Admissions to acute care hospitals between January 2011 and September 2015 (time of transition from ICD-9-CM to ICD-10-CM) that had one of the specified diagnosis codes were included. For a given hospital, the value of each of the five candidate metrics was defined as the ratio of all admissions that had the given testing and all admissions during the observation period with inclusion CCS diagnosis codes.
Derivation and Validation of the Index
In our derivation cohort (hospitals in Maryland, New Jersey, and Washington state), we tested the temporal stability of each candidate metric by year using the intraclass correlation coefficient (ICC). Using exploratory factor analysis (EFA) and Cronbach’s alpha, we then tested internal consistency of the index candidate components to ensure that all measured a common underlying factor (ie, diagnostic overuse). To standardize data, test rates for both of these analyses were converted to z-scores. For the EFA, we expected that if the index was reflecting only a single underlying factor, the Eigenvalue for one factor should be much higher (typically above 1.0) than that for multiple factors. We calculated item-test correlation for each candidate metric and Cronbach’s alpha for the entire index. A high and stable value for item-test correlation for each index component, as well as a high Cronbach’s alpha, suggests that index components measure a single common factor. Given the small number of test items, we considered a Cronbach’s alpha above 0.6 to be satisfactory.
This analysis showed satisfactory temporal stability of each candidate metric and good internal consistency of the candidate metrics in the derivation cohort. Therefore, we decided to keep all metrics rather than discard any of them. This same process was repeated with the validation cohort (Kentucky, New York, North Carolina, and West Virginia) and then with the combined group of seven states. Tests on the validation and entire cohort further supported our decision to keep all five metrics.
To determine the overall index value for a hospital, all of its metric numerators and denominators were added to calculate one fraction. In this way for a given hospital, a metric for which there were no observations was effectively excluded from the index. This essentially weights each index component by frequency. We chose to count syncope admissions only once in the denominator to avoid the index being unduly influenced by this diagnosis. The hospital index values were combined into their HSAs by adding numerators and denominators from each hospital to calculate HSA index values, effectively giving higher weight to hospitals with more observations. Spearman’s correlation coefficients were measured for these Dartmouth Atlas metrics, also at the HSA level. For the county level analysis, we used a hospital-county crosswalk (available from the American Hospital Association [AHA] Annual Survey; https://www.ahadata.com/aha-annual-survey-database) to link a hospital overuse index value to a county level cost value rather than aggregating data at the county level. We felt this was appropriate, as HSAs were constructed to represent a local healthcare market, whereas counties are less likely to be homogenous from a healthcare perspective.
Analysis of Entire Hospital Sample
The mean index value and SD were calculated for the entire sample of hospitals and for each state. The mean index value for each year of data was calculated to measure the temporal change of the index (representing a change in diagnostic intensity over the study period) using linear regression. We divided the cohort of hospitals into tertiles based on their index value. This is consistent with the CMS categorization of hospital payments and value of care as being “at,” “significantly above,” or “significantly below” a mean value.18 The characteristics of hospitals by tertile were described by mean total hospital beds, mean annual admissions, teaching status (nonteaching hospital, minor teaching hospital, major teaching hospital), and critical access hospital (yes/no). We utilized the AHA Annual Survey for data on hospital characteristics. We calculated P values using analysis of variance for hospital bed size and a chi-square test for teaching status and critical access hospital.
The entire group of hospitals from seven states was then used to apply the index to the HSA level. Numerators and denominators for each hospital in an HSA were added to calculate an HSA-level proportion. Thus, the HSA level index value, though unweighted, is dominated by hospitals with larger numbers of observations. For each of the Dartmouth metrics, the adjusted odds ratio of being in a higher diagnostic overuse index tertile given being in a certain Dartmouth Atlas metric tertile was calculated using ordinal logistic regression. This model controlled for the mean number of beds of hospitals in the HSA (continuous variable), mean Elixhauser Comorbidity Index (ECI) score (continuous variable; unweighted average among hospitals in an HSA), whether the HSA had a major or minor teaching hospital (yes/no) or was a critical access hospital (yes/no), and state fixed effects. The ECI score is a validated score that uses the presence or absence of 29 comorbidities to predict in-hospital mortality.19 For discriminant validity, we also tested two variables not expected to be associated with overuse—hospital ownership and affiliation with the Catholic Church.
For the county-level analysis, ordinal logistic regression was used to predict the adjusted odds ratio of being in a higher diagnostic overuse index tertile given being in a certain tertile of a given county-level spending metric. This model controlled for hospital bed size (continuous variable), hospital ECI score (continuous variable), teaching status (major, minor, nonteaching), critical access hospital status (yes/no), and state fixed effects.
RESULTS
Descriptive Statistics for Metrics
A total of 620 acute care hospitals were included in the index. Thirteen hospitals were excluded because their denominator was five or fewer. The vast majority of HSAs (85.9%) had only one hospital, 8.2% had two hospitals, and 2.4% had three hospitals. Similarly, the majority of counties (68.7%) had only one hospital, 15.1% had two hospitals, and 6.6% had three hospitals (Appendix Tables 1.1 and 1.2). Nonspecific chest pain was the metric with largest denominator mean (650), SD (1,012), and range (0-10,725) (Appendix Table 2). Overall, the metric denominators were a small fraction of total hospital discharges, with means at the hospital level ranging from 0.69% for nausea and vomiting to 5.81% for nonspecific chest pain, suggesting that our index relies on a relatively small fraction of discharges.
Tests for Temporal Stability and Internal Consistency by Derivation and Validation Strategy
Overall, the ICCs for the derivation, validation, and entire cohort suggested strong temporal stability (Appendix Table 3). The EFA of the derivation, validation, and entire cohort showed high Eigenvalues for one principal component, with no other factors close to 1, indicating strong internal consistency (Appendix Table 4). The Cronbach’s alpha analysis also suggested strong internal consistency, with alpha values ranging from 0.73 for the validation cohort to 0.80 for the derivation cohort (Table 2).
Correlation With External Validation Measures
For the entire cohort, the Spearman’s rho for correlation between our overuse index and inpatient rate of coronary angiography at the HSA level was 0.186 (95% CI, 0.089-0.283), Medicare reimbursement at the HSA level was 0.355 (95% CI, 0.272-0.437), and Medicare spending during the last 6 months of life at the HSA level was 0.149 (95% CI, 0.061-0.236) (Appendix Figures 5.1-5.3). The Spearman’s rho for correlation between our overuse index and county level standardized procedure cost was 0.284 (95% CI, 0.210-0.358), imaging cost was 0.268 (95% CI, 0.195-0.342), and testing cost was 0.226 (95% CI, 0.152-0.300) (Appendix Figures 6.1-6.3).
Overall Index Values and Change Over Time
The mean hospital index value was 0.541 (SD, 0.178) (Appendix Table 7). There was a slight but statistically significant annual increase in the overall mean index value over the study period, suggesting a small rise in overuse of diagnostic testing (coefficient 0.011; P <.001) (Appendix Figure 8).
Diagnostic Overuse Index Tertiles
Hospitals in the lowest tertile of the index tended to be smaller (based on number of beds) (P < .0001) and were more likely to be critical access hospitals (P <.0001). There was a significant difference in the proportion of nonteaching, minor teaching, and major teaching hospitals, with more nonteaching hospitals in tertile 1 (P = .001) (Table 3). The median ECI score was not significantly different among tertiles. Neither of the variables tested for discriminant validity (hospital ownership and Catholic Church affiliation) was associated with our index.
Adjusted Multilevel Mixed-Effects Ordinal Logistic Regression
Our overuse index correlated most closely with physician reimbursement, with an odds ratio of 2.02 (95% CI, 1.11-3.66) of being in a higher tertile of the overuse index when comparing tertiles 3 and 1 of this Dartmouth metric. Of the Medicare county-level metrics, our index correlated most closely with cost of procedures, with an odds ratio of 2.03 (95% CI, 1.21-3.39) of being in a higher overuse index tertile when comparing tertiles 3 and 1 of the cost per procedure metric (Figure 1).
DISCUSSION
Previous research shows variation among hospitals for overall physician spending,20 noninvasive cardiac imaging,21 and the rate of finding obstructive lesions during elective coronary angiography.22 However, there is a lack of standardized methods to study a broad range of diagnostic overuse at the hospital level. To our knowledge, no studies have attempted to develop a diagnostic overuse index at the hospital level. We used a derivation-validation approach to achieve our goal. Although the five metrics represent a range of conditions, the EFA and Cronbach’s alpha tests suggest that they measure a common phenomenon. To avoid systematically excluding smaller hospitals, we limited the extent to which we eliminated hospitals with few observations. Our findings suggest that it may be reasonable to make generalizations on the diagnostic intensity of a hospital based on a relatively small number of discharges. Moreover, our index is a proof of concept that rates of negative diagnostic testing can serve as a proxy for estimating diagnostic overuse.
Our hospital-level index values extrapolated to the HSA level weakly correlated with prespecified Dartmouth Atlas metrics. In a multivariate ordinal regression, there was a significant though weak association between hospitals in higher tertiles of the Dartmouth Atlas metrics and categorization in higher tertiles of our diagnostic overuse index. Similarly, our hospital-level index correlated with two of the three county-level metrics in a multivariate ordinal regression.
We do not assume that all of the metrics in our index track together. However, our results, including the wide dispersion of index values among the tertiles (Table 3), suggest that at least some hospitals are outliers in multiple metrics. We did not assume ex ante that our index should correlate with Dartmouth overuse metrics or Medicare county-level spending; however, we did believe that an association with these measures would assist in validating our index. Given that our index utilizes four common diagnoses, while the Dartmouth and Medicare cost metrics are based on a much broader range of conditions, we would not expect more than a weak correlation even if our index is a valid way to measure overuse.
All of the metrics were based on the concept that hospitals with high rates of negative testing are likely providing large amounts of low-value care. Prior studies on diagnostic yield of CT scans in the emergency department for pulmonary embolus (PE) found an increase in testing and decrease in yield over time; these studies also showed that physicians with more experience ordered fewer CT scans and had a higher yield.23 A review of electronic health records and billing data also showed that hospitals with higher rates of D-dimer testing had higher yields on CT scans ordered to test for PE.24
We took advantage of the coding convention that certain diagnoses only be listed as the primary discharge diagnosis if no more specific diagnosis is made. This allowed us to identify hospitals that likely had high rates of negative tests without granular data. Of course, the metrics are not measuring rates of negative testing per se, but a proxy for this, based instead on the proportion of patients with a symptom-based primary discharge diagnosis who underwent diagnostic testing.
Measuring diagnostic overuse at the hospital level may help to understand factors that drive overuse, given that institutional incentives and culture likely play important roles in ordering tests. There is evidence that financial incentives drive physicians’ decisions,25-27 and there is also evidence that institutional culture impacts outcomes.28 Further, quality improvement projects are typically designed at the hospital level and may be an effective way to curb overuse.29,30
Previous studies have focused on measuring variation among providers and identifying outlier physicians.9,10,20 Providing feedback to underperforming physicians has been shown to change practice habits.31,32 Efforts to improve the practice habits of outlier hospitals may have a number of advantages, including economies of scale and scope and the added benefit of improving the habits of all providers—not just those who are underperforming.
Ordering expensive diagnostic tests on patients with a low pretest probability of having an organic etiology for their symptoms contributes to high healthcare costs. Of course, we do not believe that the ideal rate of negative testing is zero. However, hospitals with high rates of negative diagnostic testing are more likely to be those with clinicians who use expensive tests as a substitute for clinical judgment or less-expensive tests (eg, D-dimer testing to rule out PE).
One challenge we faced is that there is no gold standard of hospital-level overuse with which to validate our index. Our index is weakly correlated with a number of regional metrics that may be proxies for overuse. We are reassured that there is a statistically significant correlation with measures at both HSA and county levels. These correlations are weak, but these regional metrics are themselves imperfect surrogates for overuse. Furthermore, our index is preliminary and will need refinement in future studies.
Limitations
Our analysis has multiple limitations. First, since it relies heavily on primary ICD discharge diagnosis codes, biases could exist due to variations in coding practices. Second, the SID does not include observation stays or tests conducted in the ED, so differential use of observation stays among hospitals might impact results. Finally, based on utilization data, we were not able to distinguish between CT scans of the chest, abdomen, and pelvis because the SID labels each of these as body CT.
CONCLUSION
We developed a novel index to measure diagnostic intensity at the hospital level. This index relies on the concept that high rates of negative diagnostic testing likely indicate some degree of overuse. Our index is parsimonious, does not require granular claims data, and measures a range of potentially overused tests for common clinical scenarios. Our next steps include further refining the index, testing it with granular data, and validating it with other datasets. Thereafter, this index may be useful at identifying positive and negative outliers to understand what processes of care contribute to outlier high and low levels of diagnostic testing. We suspect our index is more useful at identifying extremes than comparing hospitals in the middle of the utilization curve. Additionally, exploring the relationship among individual metrics and the relationship between our index and quality measures like mortality and readmissions may be informative.
1. Fisher ES, Wennberg JE, Stukel TA, et al. Associations among hospital capacity, utilization, and mortality of US Medicare beneficiaries, controlling for sociodemographic factors. Health Serv Res. 2000;34(6):1351-1362.
2. Fisher ES, Wennberg DE, Stukel TA, Gottlieb DJ, Lucas FL, Pinder ÉL. The implications of regional variations in Medicare spending. Part 2: health outcomes and satisfaction with care. Ann Intern Med. 2003;138(4):288-298. https://doi.org/10.7326/0003-4819-138-4-200302180-00007
3. Segal JB, Nassery N, Chang H-Y, Chang E, Chan K, Bridges JFP. An index for measuring overuse of health care resources with Medicare claims. Med Care. 2015;53(3):230-236. https://doi.org/10.1097/mlr.0000000000000304
4. Colla CH, Morden NE, Sequist TD, Schpero WL, Rosenthal MB. Choosing wisely: prevalence and correlates of low-value health care services in the United States. J Gen Intern Med. 2014;30(2):221-228. https://doi.org/10.1007/s11606-014-3070-z
5. Colla CH, Morden NE, Sequist TD, Mainor AJ, Li Z, Rosenthal MB. Payer type and low-value care: comparing Choosing Wisely services across commercial and Medicare populations. Health Serv Res. 2018;53(2):730-746. https://doi.org/10.1111/1475-6773.12665
6. Schwartz AL, Landon BE, Elshaug AG, Chernew ME, McWilliams JM. Measuring low-value care in Medicare. JAMA Intern Med. 2014;174(7):1067-1076. https://doi.org/10.1001/jamainternmed.2014.1541
7. Oakes AH, Chang H-Y, Segal JB. Systemic overuse of health care in a commercially insured US population, 2010–2015. BMC Health Serv Res. 2019;19(1). https://doi.org/10.1186/s12913-019-4079-0
8. Schwartz AL, Zaslavsky AM, Landon BE, Chernew ME, McWilliams JM. Low-value service use in provider organizations. Health Serv Res. 2018;53(1):87-119. https://doi.org/10.1111/1475-6773.12597
9. Schwartz AL, Jena AB, Zaslavsky AM, McWilliams JM. Analysis of physician variation in provision of low-value services. JAMA Intern Med. 2019;179(1):16-25. https://doi.org/10.1001/jamainternmed.2018.5086
10. Bouck Z, Ferguson J, Ivers NM, et al. Physician characteristics associated with ordering 4 low-value screening tests in primary care. JAMA Netw Open. 2018;1(6):e183506. https://doi.org/10.1001/jamanetworkopen.2018.3506
11. Dartmouth Atlas Project. Data By Region - Dartmouth Atlas of Health Care. Accessed August 29, 2019. http://archive.dartmouthatlas.org/data/region/
12. ICD-9-CM Official Guidelines for Coding and Reporting (Effective October 11, 2011). Accessed March 1, 2018. https://www.cdc.gov/nchs/data/icd/icd9cm_guidelines_2011.pdf
13. Cassel CK, Guest JA. Choosing wisely - helping physicians and patients make smart decisions about their care. JAMA. 2012;307(17):1801-1802. https://doi.org/10.1001/jama.2012.476
14. The Dartmouth Atlas of Health Care. Accessed July 17, 2018. http://www.dartmouthatlas.org/
15. The Dartmouth Atlas of Healthcare. Research Methods. Accessed January 27, 2019. http://archive.dartmouthatlas.org/downloads/methods/research_methods.pdf
16. Centers for Medicare & Medicaid Services. Medicare geographic variation, public use file. Accessed January 5, 2020. https://www.cms.gov/Research-Statistics-Data-and-Systems/Statistics-Trends-and-Reports/Medicare-Geographic-Variation/GV_PUF
17. Centers for Medicare & Medicaid Services. Berenson-Eggers Type of Service (BETOS) codes. Accessed January 10, 2020. https://www.cms.gov/Research-Statistics-Data-and-Systems/Statistics-Trends-and-Reports/MedicareFeeforSvcPartsAB/downloads/betosdesccodes.pdf
18. Data.Medicare.gov. Payment and value of care – hospital: hospital compare. Accessed August 21, 2019. https://data.medicare.gov/Hospital-Compare/Payment-and-value-of-care-Hospital/c7us-v4mf
19. Moore BJ, White S, Washington R, Coenen N, Elixhauser A. Identifying increased risk of readmission and in-hospital mortality using hospital administrative data: the AHRQ Elixhauser comorbidity index. Med Care. 2017;55(7):698-705. https://doi.org/10.1097/mlr.0000000000000735
20. Tsugawa Y, Jha AK, Newhouse JP, Zaslavsky AM, Jena AB. Variation in physician spending and association with patient outcomes. JAMA Intern Med. 2017;177(5):675-682. https://doi.org/10.1001/jamainternmed.2017.0059
21. Safavi KC, Li S-X, Dharmarajan K, et al. Hospital variation in the use of noninvasive cardiac imaging and its association with downstream testing, interventions, and outcomes. JAMA Intern Med. 2014;174(4):546-553. https://doi.org/10.1001/jamainternmed.2013.14407
22. Douglas PS, Patel MR, Bailey SR, et al. Hospital variability in the rate of finding obstructive coronary artery disease at elective, diagnostic coronary angiography. J Am Coll Cardiol. 2011;58(8):801-809. https://doi.org/10.1016/j.jacc.2011.05.019
23. Venkatesh AK, Agha L, Abaluck J, Rothenberg C, Kabrhel C, Raja AS. Trends and variation in the utilization and diagnostic yield of chest imaging for Medicare patients with suspected pulmonary embolism in the emergency department. Am J Roentgenol. 2018;210(3):572-577. https://doi.org/10.2214/ajr.17.18586
24. Kline JA, Garrett JS, Sarmiento EJ, Strachan CC, Courtney DM. Over-testing for suspected pulmonary embolism in american emergency departments: the continuing epidemic. Circ Cardiovasc Qual Outcomes. 2020;13(1):e005753. https://doi.org/10.1161/circoutcomes.119.005753
25. Welch HG, Fisher ES. Income and cancer overdiagnosis – when too much care is harmful. N Engl J Med. 2017;376(23):2208-2209. https://doi.org/10.1056/nejmp1615069
26. Nicholson S. Physician specialty choice under uncertainty. J Labor Econ. 2002;20(4):816-847. https://doi.org/10.1086/342039
27. Chang R-KR, Halfon N. Geographic distribution of pediatricians in the United States: an analysis of the fifty states and Washington, DC. Pediatrics. 1997;100(2 pt 1):172-179. https://doi.org/10.1542/peds.100.2.172
28. Braithwaite J, Herkes J, Ludlow K, Lamprell G, Testa L. Association between organisational and workplace cultures, and patient outcomes: systematic review protocol. BMJ Open. 2016;6(12):e013758. https://doi.org/10.1136/bmjopen-2016-013758
29. Bhatia RS, Milford CE, Picard MH, Weiner RB. An educational intervention reduces the rate of inappropriate echocardiograms on an inpatient medical service. JACC Cardiovasc Imaging. 2013;6(5):545-555. https://doi.org/10.1016/j.jcmg.2013.01.010
30. Blackmore CC, Watt D, Sicuro PL. The success and failure of a radiology quality metric: the case of OP-10. J Am Coll Radiol. 2016;13(6):630-637. https://doi.org/10.1016/j.jacr.2016.01.006
31. Albertini JG, Wang P, Fahim C, et al. Evaluation of a peer-to-peer data transparency intervention for Mohs micrographic surgery overuse. JAMA Dermatol. 2019;155(8):906-913. https://dx.doi.org/10.1001%2Fjamadermatol.2019.1259
32. Sacarny A, Barnett ML, Le J, Tetkoski F, Yokum D, Agrawal S. Effect of peer comparison letters for high-volume primary care prescribers of quetiapine in older and disabled adults: a randomized clinical trial. JAMA Psychiatry. 2018;75(10):1003-1011. https://doi.org/10.1001/jamapsychiatry.2018.1867
© 2021 Society of Hospital Medicine
Contemporary Rates of Preoperative Cardiac Testing Prior to Inpatient Hip Fracture Surgery
Hip fracture is a common reason for unexpected, urgent inpatient surgery in older patients. In 2005, the incidence of hip fracture was 369.0 and 793.5 per 100,000 in men and women respectively.1 These numbers declined over the preceding decade, potentially as a result of bisphosphonate use. Age- and risk-adjusted 30-day mortality rates for men and women in 2005 were approximately 10% and 5%, respectively.
Evidence suggests that timely surgical repair of hip fractures improves outcomes, although the optimal timing is controversial. Guidelines from the American College of Surgeons Committee on Trauma from 2015 recommend surgical intervention within 48 hours for geriatric hip fracures.2 A 2008 systematic review found that operative delay beyond 48 hours was associated with a 41% increase in 30-day all-cause mortality and a 32% increase in one-year all-cause mortality.3 Recent evidence suggests that the rate of complications begins to increase with delays beyond 24 hours.4
There has been a focus over the past decade on overuse of preoperative testing for low- and intermediate-risk surgeries.5-7 Beginning in 2012, the American Board of Internal Medicine initiated the Choosing Wisely® campaign in which numerous societies issued recommendations on reducing utilization of various diagnostic tests, a number of which have focused on preoperative tests. Two groups—the American Society of Anesthesiologists (ASA) and the American Society of Echocardiography (ASE)— issued specific recommendations on preoperative cardiac testing.8 In February 2013, the ASE recommended avoiding preoperative echocardiograms in patients without a history or symptoms of heart disease. In October 2013, the ASA recommended against transthoracic echocardiogram (TTE), transesophageal echocardiogram (TEE), or stress testing for low- or intermediate-risk noncardiac surgery for patients with stable cardiac disease.
Finally, in 2014, the American College of Cardiology (ACC)/American Heart Association (AHA) issued updated perioperative guidelines for patients undergoing noncardiac surgeries.9 They recommended preoperative stress testing only in a small subset of cases (patients with an elevated perioperative risk of major adverse cardiac event, a poor or unknown functional capacity, or those in whom stress testing would impact perioperative care).
Given the high cost of preoperative cardiac testing, the potential for delays in care that can adversely impact outcomes, and the recent recommendations, we sought to characterize the rates of inpatient preoperative cardiac testing prior to hip fracture surgery in recent years and to see whether recent recommendations to curb use of these tests were temporally associated with changing rates.
METHODS
Overview
We utilized two datasets—the Healthcare Cost and Utilization Project (HCUP) State Inpatient Databases (SID) and the American Hospital Association (AHA) Annual Survey—to characterize preoperative cardiac testing. SID data from Maryland, New Jersey, and Washington State from 2011 through September 2015 were used (the ICD coding system changed from ICD9 to ICD10 on October 1). This was combined with AHA data for these years. We included all hospitalizations with a primary ICD9 procedure code for hip fracture repair—78.55, 78.65, 79.05, 79.15, 79.25, 79.35, 79.45, 79.55, 79.65, 79.75, 79.85, and 79.95. We excluded all observations that involved an interhospital transfer. This study was exempt from institutional review board approval.
Measurement and Outcomes
We summarized demographic data for the hospitalizations that met the inclusion criteria as well as the associated hospitals. The primary outcome was the percentage of patients undergoing TTE, stress test, and cardiac catheterization during a hospitalization with a primary procedure code of hip fracture repair. Random effects logistic regression models for each type of diagnostic test were developed to determine the factors that might impact test utilization. In addition to running each test as a separate model, we also performed an analysis in which the outcome was performance of any of these three cardiac tests. Random effects were used to account for clustering of testing within hospitals. Variables included time (3-month intervals), state, age (continuous variable), gender, length of stay, payer (Medicare/Medicaid/private insurance/self-pay/other), hospital teaching status (major teaching/minor teaching/nonteaching), hospital size according to number of beds (continuous variable), and mortality score. Major teaching hospitals are defined as members of the Council of Teaching Hospitals. Minor teaching hospitals are defined as (1) those with one or more postgraduate training programs recognized by the American Council on Graduate Medical Education, (2) those with a medical school affiliation reported to the American Medical Association, or (3) those with an internship or residency approved by the American Osteopathic Association.
The SID has a specific binary indicator variable for each of the three diagnostic tests we evaluated. The use of the diagnostic test is evaluated through both UB-92 revenue codes and ICD9 procedure codes, with the presence of either leading to the indicator variable being positive.10 Finally, we performed a sensitivity analysis to evaluate the significance of changing utilization trends by interrupted time series analysis. A level of 0.05 was used to determine statistical significance. Analyses were done in STATA 15 (College Station, Texas).
RESULTS
The dataset included 75,144 hospitalizations with a primary procedure code of hip fracture over the study period (Table). The number of hospitalizations per year was fairly consistent over the study period in each state, although there were fewer hospitalizations for 2015 as this included only January through September. The mean age was 72.8 years, and 67% were female. The primary payer was Medicare for 71.7% of hospitalizations. Hospitalizations occurred at 181 hospitals, the plurality of which (42.9%) were minor teaching hospitals. The proportions of hospitalizations that included a TTE, stress test, and cardiac catheterization were 12.6%, 1.1%, and 0.5%, respectively. Overall, 13.5% of patients underwent any cardiac testing.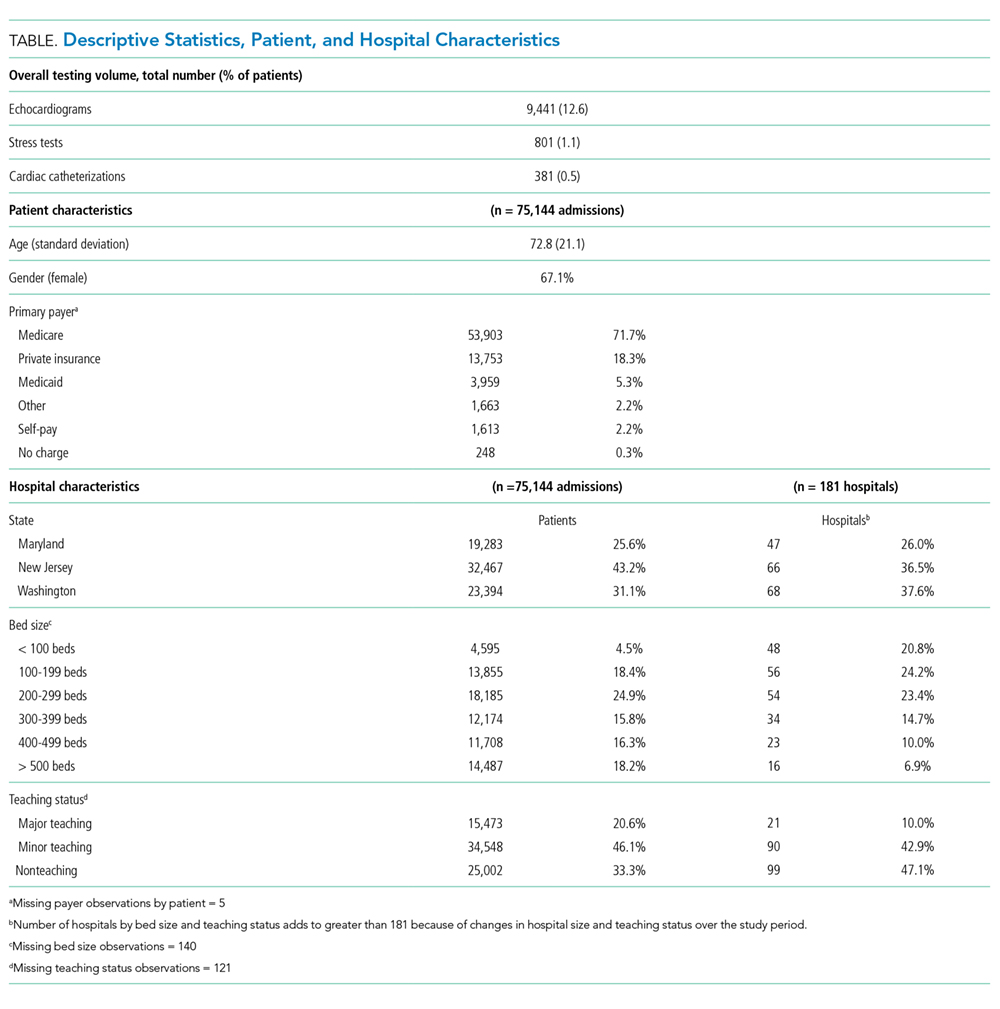
There was a statistically significantly lower rate of stress tests (odds ratio [OR], 0.32; 95% CI, 0.19-0.54) and cardiac catheterizations (OR, 0.46; 95% CI, 0.27-0.79) in Washington than in Maryland and New Jersey. Female gender was associated with significantly lower adjusted ORs for stress tests (OR, 0.74; 95% CI, 0.63-0.86) and cardiac catheterizations (OR, 0.73; 95% CI, 0.59-0.91), and increasing age was associated with higher adjusted ORs for each test (TTE, OR, 1.033; 95% CI, 1.031-1.035; stress tests, OR, 1.007; 95% CI, 1.001-1.013; cardiac catheterizations, OR, 1.011; 95% CI, 1.003-1.019). Private insurance was associated with a lower likelihood of stress tests (OR, 0.65; 95% CI, 0.50-0.85) and cardiac catheterizations (OR, 0.67; 95% CI,0.46-0.98), and self-pay was associated with a lower likelihood of TTE (OR, 0.76; 95% CI, 0.61-0.95) and stress test (OR, 0.43; 95% CI, 0.21-0.90), all compared with Medicare.
Larger hospitals were associated with a greater likelihood of cardiac catheterizations (OR, 1.18; 95% CI, 1.03-1.36) and a lower likelihood of TTE (OR, 0.89; 95% CI, 0.82-0.96). An unweighted average of these tests between 2011 and October 2015 showed a modest increase in TTEs and a modest decrease in stress tests and cardiac catheterizations (Figure). A multivariable random effects regression for use of TTEs revealed a significantly increasing trend from 2011 to 2014 (OR, 1.04, P < .0001), but the decreasing trend for 2015 was not statistically significant when analyzed according to quarters or months (for which data from only New Jersey and Washington are available).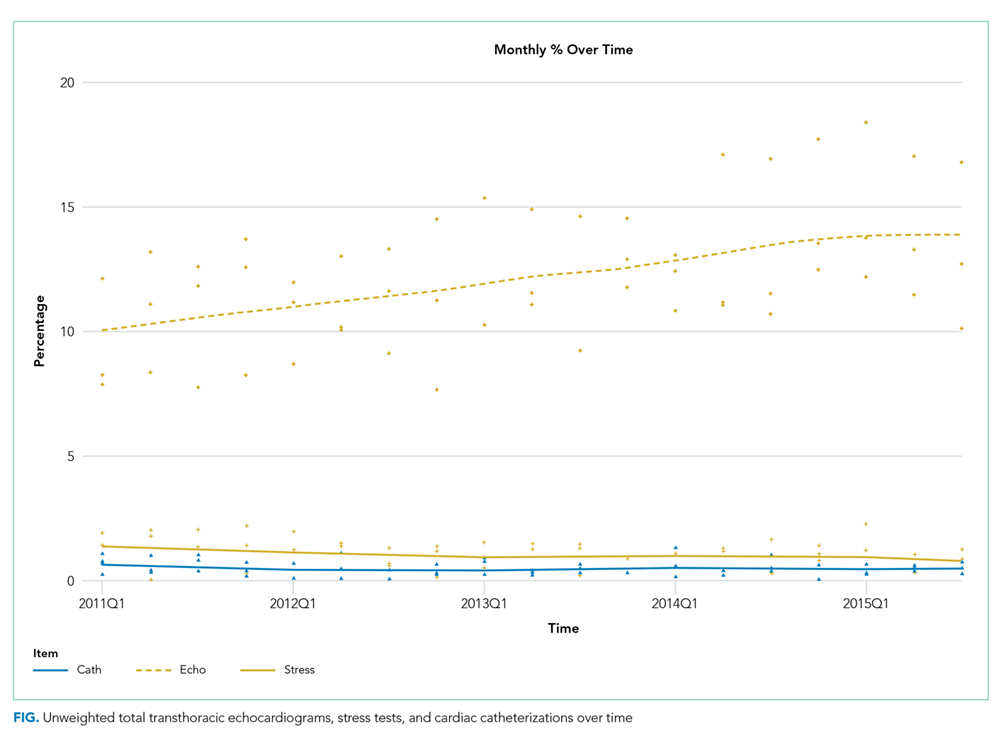
In the combined model with any cardiac testing as the outcome, the likelihood of testing was lower in Washington (OR, 0.56; 95% CI, 0.31-0.995). Primary payer status of self-pay was associated with a lower likelihood of cardiac testing (OR, 0.73; 95% CI, 0.58-0.90). Female gender was associated with a lower likelihood of testing (OR, 0.93; 95% CI, 0.88-0.98), and high mortality score was associated with a higher likelihood of testing (OR, 1.030; 95% CI, 1.027-1.033). TTEs were the major driver of this model as these were the most heavily utilized test.
DISCUSSION
There has been limited research into how often preoperative cardiac testing occurs in the inpatient setting. Our aim was to study its prevalence prior to hip fracture surgery during a time period when multiple recommendations had been issued to limit its use. We found rates of ischemic testing (stress tests and cardiac catheterizations) to be appropriately, and perhaps surprisingly, low. Our results on ischemic testing rates are consistent with previous studies, which have focused on the outpatient setting where much of the preoperative workup for nonurgent surgeries occurs. The rate of TTEs was higher than in previous studies of the outpatient preoperative setting, although it is unclear what an optimal rate of TTEs is.
A recent study examining outpatient preoperative stress tests within the 30 days before cataract surgeries, knee arthroscopies, or shoulder arthroscopies found a rate of 2.1% for Medicare fee-for-service patients in 2009 with little regional variation.11 Another evaluation using 2009 Medicare claims data found rates of preoperative TTEs and stress tests to be 0.8% and 0.7%, respectively.12 They included TTEs and stress tests performed within 30 days of a low- or intermediate-risk surgery. A study analyzing the rate of preoperative TTEs between 2009 and 2014 found that rates varied from 2.0% to 3.4% for commercially insured patients aged 50-64 years and Medicare-advantage patients, respectively, in 2009.13 These rates decreased by 7.0% and 12.6% from 2009 to 2014. These studies, like ours, suggest that preoperative cardiac testing has not been a major source of wasteful spending. One explanation for the higher rate of TTEs we observed in the inpatient setting might be that primary care physicians in the outpatient setting are more likely to have historical cardiac testing results compared with physicians in a hospital.
We found that the rate of stress testing and cardiac catheterization in Washington was significantly lower than that in Maryland and New Jersey. This is consistent with a number of measures of healthcare utilization – total Medicare reimbursement in the last six months of life, mean number of hospital days in the last six months of life, and healthcare intensity index—for all of which Washington was below the national mean and Maryland and New Jersey were above it.14
Finally, we found evidence of a lower rate of preoperative stress tests and cardiac catheterizations for women despite controlling for age and mortality score. Of course, we did not control directly for cardiovascular comorbidities; as a result, there could be residual confounding. However, these results are consistent with previous findings of gender bias in both pharmacologic management of coronary artery disease (CAD)15 and diagnostic testing for suspected CAD.16
We focused on hospitalizations with a primary procedure code to surgically treat hip fracture. We are unable to tell if the cardiac testing of these patients had occurred before or after the procedure. However, we suspect that the vast majority were completed for preoperative evaluation. It is likely that a small subset were done to diagnose and manage cardiac complications that either accompanied the hip fracture or occurred postoperatively. Another limitation is that we cannot determine if a patient had one of these tests recently in the emergency department or as an outpatient.
We also chose to include only patients who actually had hip fracture surgery. It is possible that the testing rate is higher for all patients admitted for hip fracture and that some of these patients did not have surgery because of abnormal cardiac testing. However, we suspect that this is a very small fraction given the high degree of morbidity and mortality associated with untreated hip fracture.
CONCLUSION
We found a low rate of preoperative cardiac testing in patients hospitalized for hip fracture surgery both in the years before and after the issuance of recommendations intended to curb its use. Although it is reassuring that the volume of low-value testing is lower than we expected, these findings highlight the importance of targeting utilization improvement efforts toward low-value tests and procedures that are more heavily used, since further curbing the use of infrequently utilized tests and procedures will have only a modest impact on overall healthcare expenditure. Our findings highlight the necessity that professional organizations ensure that they focus on true areas of inappropriate utilization. These are the areas in which improvements will have a major impact on healthcare spending. Further research should aim to quantify unwarranted cardiac testing for other inpatient surgeries that are less urgent, as the urgency of hip fracture repair may be driving the relatively low utilization of inpatient cardiac testing.
Disclosures
The authors have nothing to disclose.
Funding
This project was supported by the Johns Hopkins Hospitalist Scholars Fund and the Johns Hopkins School of Medicine Biostatistics, Epidemiology and Data Management (BEAD) Core.
1. Brauer CA, Coca-Perraillon M, Cutler DM, Rosen A. Incidence and mortality of hip fractures in the United States. JAMA. 2009;302(14):1573-1579. PubMed
2. ACS TQIP - Best Practices in the Management of Orthopaedic Trauma. https://www.facs.org/~/media/files/quality programs/trauma/tqip/tqip bpgs in the management of orthopaedic traumafinal.ashx. Published 2015. Accessed July 13, 2018.
3. Shiga T, Wajima Z, Ohe Y. Is operative delay associated with increased mortality of hip fracture patients? Systematic review, meta-analysis, and meta-regression. Can J Anesth. 2008;55(3):146-154. PubMed
4. Pincus D, Ravi B, Wasserstein D, et al. Association between wait time and 30-day mortality in adults undergoing hip fracture surgery. JAMA. 2017;318(20):1994. PubMed
5. Clair CM, Shah M, Diver EJ, et al. Adherence to evidence-based guidelines for preoperative testing in women undergoing gynecologic surgery. Obstet Gynecol. 2010;116(3):694-700. PubMed
6. Chen CL, Lin GA, Bardach NS, et al. Preoperative medical testing in Medicare patients undergoing cataract surgery. N Engl J Med. 2015;372(16):1530-1538. PubMed
7. Benarroch-Gampel J, Sheffield KM, Duncan CB, et al. Preoperative laboratory testing in patients undergoing elective, low-risk ambulatory surgery. Ann Surg. 2012; 256(3):518-528. PubMed
8. Choosing Wisely - An Initiative of the ABIM Foundation. http://www.choosingwisely.org/clinician-lists. Accessed July 16, 2018.
9. Fleisher LA, Fleischmann KE, Auerbach AD, et al. 2014 ACC/AHA Guideline on perioperative cardiovascular evaluation and management of patients undergoing noncardiac surgery. JACC. 2014;64(22):e278 LP-e333. PubMed
10. HCUP Methods Series - Development of Utilization Flags for Use with UB-92 Administrative Data; Report # 2006-04. https://www.hcup-us.ahrq.gov/reports/methods/2006_4.pdf.
11. Kerr EA, Chen J, Sussman JB, Klamerus ML, Nallamothu BK. Stress testing before low-risk surgery - so many recommendations, so little overuse. JAMA Intern Med. 2015;175(4):645-647. PubMed
12. Schwartz AL, Landon BE, Elshaug AG, Chernew ME, McWilliams JM. Measuring low-value care in medicare. JAMA Intern Med. 2014;174(7):1067-1076. PubMed
13. Carter EA, Morin PE, Lind KD. Costs and trends in utilization of low-value services among older adults with commercial insurance or Medicare advantage. Med Care. 2017;55(11):931-939. PubMed
14. The Dartmouth Atlas of Health Care. http://www.dartmouthatlas.org. Accessed December 7, 2017.
15. Williams D, Bennett K, Feely J. Evidence for an age and gender bias in the secondary prevention of ischaemic heart disease in primary care. Br J Clin Pharmacol. 2003;55(6):604-608. PubMed
16. Chang AM, Mumma B, Sease KL, Robey JL, Shofer FS, Hollander JE. Gender bias in cardiovascular testing persists after adjustment for presenting characteristics and cardiac risk. Acad Emerg Med. 2007;14(7):599-605. PubMed
Hip fracture is a common reason for unexpected, urgent inpatient surgery in older patients. In 2005, the incidence of hip fracture was 369.0 and 793.5 per 100,000 in men and women respectively.1 These numbers declined over the preceding decade, potentially as a result of bisphosphonate use. Age- and risk-adjusted 30-day mortality rates for men and women in 2005 were approximately 10% and 5%, respectively.
Evidence suggests that timely surgical repair of hip fractures improves outcomes, although the optimal timing is controversial. Guidelines from the American College of Surgeons Committee on Trauma from 2015 recommend surgical intervention within 48 hours for geriatric hip fracures.2 A 2008 systematic review found that operative delay beyond 48 hours was associated with a 41% increase in 30-day all-cause mortality and a 32% increase in one-year all-cause mortality.3 Recent evidence suggests that the rate of complications begins to increase with delays beyond 24 hours.4
There has been a focus over the past decade on overuse of preoperative testing for low- and intermediate-risk surgeries.5-7 Beginning in 2012, the American Board of Internal Medicine initiated the Choosing Wisely® campaign in which numerous societies issued recommendations on reducing utilization of various diagnostic tests, a number of which have focused on preoperative tests. Two groups—the American Society of Anesthesiologists (ASA) and the American Society of Echocardiography (ASE)— issued specific recommendations on preoperative cardiac testing.8 In February 2013, the ASE recommended avoiding preoperative echocardiograms in patients without a history or symptoms of heart disease. In October 2013, the ASA recommended against transthoracic echocardiogram (TTE), transesophageal echocardiogram (TEE), or stress testing for low- or intermediate-risk noncardiac surgery for patients with stable cardiac disease.
Finally, in 2014, the American College of Cardiology (ACC)/American Heart Association (AHA) issued updated perioperative guidelines for patients undergoing noncardiac surgeries.9 They recommended preoperative stress testing only in a small subset of cases (patients with an elevated perioperative risk of major adverse cardiac event, a poor or unknown functional capacity, or those in whom stress testing would impact perioperative care).
Given the high cost of preoperative cardiac testing, the potential for delays in care that can adversely impact outcomes, and the recent recommendations, we sought to characterize the rates of inpatient preoperative cardiac testing prior to hip fracture surgery in recent years and to see whether recent recommendations to curb use of these tests were temporally associated with changing rates.
METHODS
Overview
We utilized two datasets—the Healthcare Cost and Utilization Project (HCUP) State Inpatient Databases (SID) and the American Hospital Association (AHA) Annual Survey—to characterize preoperative cardiac testing. SID data from Maryland, New Jersey, and Washington State from 2011 through September 2015 were used (the ICD coding system changed from ICD9 to ICD10 on October 1). This was combined with AHA data for these years. We included all hospitalizations with a primary ICD9 procedure code for hip fracture repair—78.55, 78.65, 79.05, 79.15, 79.25, 79.35, 79.45, 79.55, 79.65, 79.75, 79.85, and 79.95. We excluded all observations that involved an interhospital transfer. This study was exempt from institutional review board approval.
Measurement and Outcomes
We summarized demographic data for the hospitalizations that met the inclusion criteria as well as the associated hospitals. The primary outcome was the percentage of patients undergoing TTE, stress test, and cardiac catheterization during a hospitalization with a primary procedure code of hip fracture repair. Random effects logistic regression models for each type of diagnostic test were developed to determine the factors that might impact test utilization. In addition to running each test as a separate model, we also performed an analysis in which the outcome was performance of any of these three cardiac tests. Random effects were used to account for clustering of testing within hospitals. Variables included time (3-month intervals), state, age (continuous variable), gender, length of stay, payer (Medicare/Medicaid/private insurance/self-pay/other), hospital teaching status (major teaching/minor teaching/nonteaching), hospital size according to number of beds (continuous variable), and mortality score. Major teaching hospitals are defined as members of the Council of Teaching Hospitals. Minor teaching hospitals are defined as (1) those with one or more postgraduate training programs recognized by the American Council on Graduate Medical Education, (2) those with a medical school affiliation reported to the American Medical Association, or (3) those with an internship or residency approved by the American Osteopathic Association.
The SID has a specific binary indicator variable for each of the three diagnostic tests we evaluated. The use of the diagnostic test is evaluated through both UB-92 revenue codes and ICD9 procedure codes, with the presence of either leading to the indicator variable being positive.10 Finally, we performed a sensitivity analysis to evaluate the significance of changing utilization trends by interrupted time series analysis. A level of 0.05 was used to determine statistical significance. Analyses were done in STATA 15 (College Station, Texas).
RESULTS
The dataset included 75,144 hospitalizations with a primary procedure code of hip fracture over the study period (Table). The number of hospitalizations per year was fairly consistent over the study period in each state, although there were fewer hospitalizations for 2015 as this included only January through September. The mean age was 72.8 years, and 67% were female. The primary payer was Medicare for 71.7% of hospitalizations. Hospitalizations occurred at 181 hospitals, the plurality of which (42.9%) were minor teaching hospitals. The proportions of hospitalizations that included a TTE, stress test, and cardiac catheterization were 12.6%, 1.1%, and 0.5%, respectively. Overall, 13.5% of patients underwent any cardiac testing.
There was a statistically significantly lower rate of stress tests (odds ratio [OR], 0.32; 95% CI, 0.19-0.54) and cardiac catheterizations (OR, 0.46; 95% CI, 0.27-0.79) in Washington than in Maryland and New Jersey. Female gender was associated with significantly lower adjusted ORs for stress tests (OR, 0.74; 95% CI, 0.63-0.86) and cardiac catheterizations (OR, 0.73; 95% CI, 0.59-0.91), and increasing age was associated with higher adjusted ORs for each test (TTE, OR, 1.033; 95% CI, 1.031-1.035; stress tests, OR, 1.007; 95% CI, 1.001-1.013; cardiac catheterizations, OR, 1.011; 95% CI, 1.003-1.019). Private insurance was associated with a lower likelihood of stress tests (OR, 0.65; 95% CI, 0.50-0.85) and cardiac catheterizations (OR, 0.67; 95% CI,0.46-0.98), and self-pay was associated with a lower likelihood of TTE (OR, 0.76; 95% CI, 0.61-0.95) and stress test (OR, 0.43; 95% CI, 0.21-0.90), all compared with Medicare.
Larger hospitals were associated with a greater likelihood of cardiac catheterizations (OR, 1.18; 95% CI, 1.03-1.36) and a lower likelihood of TTE (OR, 0.89; 95% CI, 0.82-0.96). An unweighted average of these tests between 2011 and October 2015 showed a modest increase in TTEs and a modest decrease in stress tests and cardiac catheterizations (Figure). A multivariable random effects regression for use of TTEs revealed a significantly increasing trend from 2011 to 2014 (OR, 1.04, P < .0001), but the decreasing trend for 2015 was not statistically significant when analyzed according to quarters or months (for which data from only New Jersey and Washington are available).
In the combined model with any cardiac testing as the outcome, the likelihood of testing was lower in Washington (OR, 0.56; 95% CI, 0.31-0.995). Primary payer status of self-pay was associated with a lower likelihood of cardiac testing (OR, 0.73; 95% CI, 0.58-0.90). Female gender was associated with a lower likelihood of testing (OR, 0.93; 95% CI, 0.88-0.98), and high mortality score was associated with a higher likelihood of testing (OR, 1.030; 95% CI, 1.027-1.033). TTEs were the major driver of this model as these were the most heavily utilized test.
DISCUSSION
There has been limited research into how often preoperative cardiac testing occurs in the inpatient setting. Our aim was to study its prevalence prior to hip fracture surgery during a time period when multiple recommendations had been issued to limit its use. We found rates of ischemic testing (stress tests and cardiac catheterizations) to be appropriately, and perhaps surprisingly, low. Our results on ischemic testing rates are consistent with previous studies, which have focused on the outpatient setting where much of the preoperative workup for nonurgent surgeries occurs. The rate of TTEs was higher than in previous studies of the outpatient preoperative setting, although it is unclear what an optimal rate of TTEs is.
A recent study examining outpatient preoperative stress tests within the 30 days before cataract surgeries, knee arthroscopies, or shoulder arthroscopies found a rate of 2.1% for Medicare fee-for-service patients in 2009 with little regional variation.11 Another evaluation using 2009 Medicare claims data found rates of preoperative TTEs and stress tests to be 0.8% and 0.7%, respectively.12 They included TTEs and stress tests performed within 30 days of a low- or intermediate-risk surgery. A study analyzing the rate of preoperative TTEs between 2009 and 2014 found that rates varied from 2.0% to 3.4% for commercially insured patients aged 50-64 years and Medicare-advantage patients, respectively, in 2009.13 These rates decreased by 7.0% and 12.6% from 2009 to 2014. These studies, like ours, suggest that preoperative cardiac testing has not been a major source of wasteful spending. One explanation for the higher rate of TTEs we observed in the inpatient setting might be that primary care physicians in the outpatient setting are more likely to have historical cardiac testing results compared with physicians in a hospital.
We found that the rate of stress testing and cardiac catheterization in Washington was significantly lower than that in Maryland and New Jersey. This is consistent with a number of measures of healthcare utilization – total Medicare reimbursement in the last six months of life, mean number of hospital days in the last six months of life, and healthcare intensity index—for all of which Washington was below the national mean and Maryland and New Jersey were above it.14
Finally, we found evidence of a lower rate of preoperative stress tests and cardiac catheterizations for women despite controlling for age and mortality score. Of course, we did not control directly for cardiovascular comorbidities; as a result, there could be residual confounding. However, these results are consistent with previous findings of gender bias in both pharmacologic management of coronary artery disease (CAD)15 and diagnostic testing for suspected CAD.16
We focused on hospitalizations with a primary procedure code to surgically treat hip fracture. We are unable to tell if the cardiac testing of these patients had occurred before or after the procedure. However, we suspect that the vast majority were completed for preoperative evaluation. It is likely that a small subset were done to diagnose and manage cardiac complications that either accompanied the hip fracture or occurred postoperatively. Another limitation is that we cannot determine if a patient had one of these tests recently in the emergency department or as an outpatient.
We also chose to include only patients who actually had hip fracture surgery. It is possible that the testing rate is higher for all patients admitted for hip fracture and that some of these patients did not have surgery because of abnormal cardiac testing. However, we suspect that this is a very small fraction given the high degree of morbidity and mortality associated with untreated hip fracture.
CONCLUSION
We found a low rate of preoperative cardiac testing in patients hospitalized for hip fracture surgery both in the years before and after the issuance of recommendations intended to curb its use. Although it is reassuring that the volume of low-value testing is lower than we expected, these findings highlight the importance of targeting utilization improvement efforts toward low-value tests and procedures that are more heavily used, since further curbing the use of infrequently utilized tests and procedures will have only a modest impact on overall healthcare expenditure. Our findings highlight the necessity that professional organizations ensure that they focus on true areas of inappropriate utilization. These are the areas in which improvements will have a major impact on healthcare spending. Further research should aim to quantify unwarranted cardiac testing for other inpatient surgeries that are less urgent, as the urgency of hip fracture repair may be driving the relatively low utilization of inpatient cardiac testing.
Disclosures
The authors have nothing to disclose.
Funding
This project was supported by the Johns Hopkins Hospitalist Scholars Fund and the Johns Hopkins School of Medicine Biostatistics, Epidemiology and Data Management (BEAD) Core.
1. Brauer CA, Coca-Perraillon M, Cutler DM, Rosen A. Incidence and mortality of hip fractures in the United States. JAMA. 2009;302(14):1573-1579. PubMed
2. ACS TQIP - Best Practices in the Management of Orthopaedic Trauma. https://www.facs.org/~/media/files/quality programs/trauma/tqip/tqip bpgs in the management of orthopaedic traumafinal.ashx. Published 2015. Accessed July 13, 2018.
3. Shiga T, Wajima Z, Ohe Y. Is operative delay associated with increased mortality of hip fracture patients? Systematic review, meta-analysis, and meta-regression. Can J Anesth. 2008;55(3):146-154. PubMed
4. Pincus D, Ravi B, Wasserstein D, et al. Association between wait time and 30-day mortality in adults undergoing hip fracture surgery. JAMA. 2017;318(20):1994. PubMed
5. Clair CM, Shah M, Diver EJ, et al. Adherence to evidence-based guidelines for preoperative testing in women undergoing gynecologic surgery. Obstet Gynecol. 2010;116(3):694-700. PubMed
6. Chen CL, Lin GA, Bardach NS, et al. Preoperative medical testing in Medicare patients undergoing cataract surgery. N Engl J Med. 2015;372(16):1530-1538. PubMed
7. Benarroch-Gampel J, Sheffield KM, Duncan CB, et al. Preoperative laboratory testing in patients undergoing elective, low-risk ambulatory surgery. Ann Surg. 2012; 256(3):518-528. PubMed
8. Choosing Wisely - An Initiative of the ABIM Foundation. http://www.choosingwisely.org/clinician-lists. Accessed July 16, 2018.
9. Fleisher LA, Fleischmann KE, Auerbach AD, et al. 2014 ACC/AHA Guideline on perioperative cardiovascular evaluation and management of patients undergoing noncardiac surgery. JACC. 2014;64(22):e278 LP-e333. PubMed
10. HCUP Methods Series - Development of Utilization Flags for Use with UB-92 Administrative Data; Report # 2006-04. https://www.hcup-us.ahrq.gov/reports/methods/2006_4.pdf.
11. Kerr EA, Chen J, Sussman JB, Klamerus ML, Nallamothu BK. Stress testing before low-risk surgery - so many recommendations, so little overuse. JAMA Intern Med. 2015;175(4):645-647. PubMed
12. Schwartz AL, Landon BE, Elshaug AG, Chernew ME, McWilliams JM. Measuring low-value care in medicare. JAMA Intern Med. 2014;174(7):1067-1076. PubMed
13. Carter EA, Morin PE, Lind KD. Costs and trends in utilization of low-value services among older adults with commercial insurance or Medicare advantage. Med Care. 2017;55(11):931-939. PubMed
14. The Dartmouth Atlas of Health Care. http://www.dartmouthatlas.org. Accessed December 7, 2017.
15. Williams D, Bennett K, Feely J. Evidence for an age and gender bias in the secondary prevention of ischaemic heart disease in primary care. Br J Clin Pharmacol. 2003;55(6):604-608. PubMed
16. Chang AM, Mumma B, Sease KL, Robey JL, Shofer FS, Hollander JE. Gender bias in cardiovascular testing persists after adjustment for presenting characteristics and cardiac risk. Acad Emerg Med. 2007;14(7):599-605. PubMed
© 2019 Society of Hospital Medicine