User login
Modifiable Factors Associated with Quality of Bowel Preparation Among Hospitalized Patients Undergoing Colonoscopy
Inadequate bowel preparation (IBP) at the time of inpatient colonoscopy is common and associated with increased length of stay and cost of care.1 The factors that contribute to IBP can be categorized into those that are modifiable and those that are nonmodifiable. While many factors have been associated with IBP, studies have been limited by small sample size or have combined inpatient/outpatient populations, thus limiting generalizability.1-5 Moreover, most factors associated with IBP, such as socioeconomic status, male gender, increased age, and comorbidities, are nonmodifiable. No studies have explicitly focused on modifiable risk factors, such as medication use, colonoscopy timing, or assessed the potential impact of modifying these factors.
In a large, multihospital system, we examine the frequency of IBP among inpatients undergoing colonoscopy along with factors associated with IBP. We attempted to identify
METHODS
Potential Predictors of IBP
Demographic data such as patient age, gender, ethnicity, body mass index (BMI), and insurance/payor status were obtained from the electronic health record (EHR). International Classification of Disease 9th and 10th revision, Clinical Modifications (ICD-9/10-CM) codes were used to obtain patient comorbidities including diabetes, coronary artery disease, heart failure, cirrhosis, gastroparesis, hypothyroidism, inflammatory bowel disease, constipation, stroke, dementia, dysphagia, and nausea/vomiting. Use of opioid medications within three days before colonoscopy was extracted from the medication administration record. These variables were chosen as biologically plausible modifiers of bowel preparation or had previously been assessed in the literature.1-6 The name and volume, classified as 4 L (GoLytely®) and < 4 liters (MoviPrep®) of bowel preparation, time of day when colonoscopy was performed, solid diet the day prior to colonoscopy, type of sedation used (conscious sedation or general anesthesia), and total colonoscopy time (defined as the time from scope insertion to removal) was recorded. Hospitalization-related variables, including the number of hospitalizations in the year before the current hospitalization, the year in which the colonoscopy was performed, and the number of days from admission to colonoscopy, were also obtained from the EHR.
Outcome Measures
An internally validated natural language algorithm, using Structured Queried Language was used to search through colonoscopy reports to identify adequacy of bowel preparation. ProVation® software allows the gastroenterologist to use some terms to describe bowel preparation in a drop-down menu format. In addition to the Aronchik scale (which allows the gastroenterologist to rate bowel preparation on a five-point scale: “excellent,” “good,” “fair,” “poor,” and “inadequate”) it also allows the provider to use terms such as “adequate” or “adequate to detect polyps >5 mm” as well as “unsatisfactory.”7 Mirroring prior literature, bowel preparation quality was classified into “adequate” and “inadequate”; “good” and “excellent” on the Aronchik scale were categorized as adequate as was the term “adequate” in any form; “fair,” “poor,” or “inadequate” on the Aronchik scale were classified as inadequate as was the term “unsatisfactory.” We evaluated the hospital length of stay (LOS) as a secondary outcome measure.
Statistical Analysis
After describing the frequency of IBP, the quality of bowel preparation (adequate vs inadequate) was compared based on the predictors described above. Categorical variables were reported as frequencies with percentages and continuous variables were reported as medians with 25th-75th percentile values. The significance of the difference between the proportion or median values of those who had inadequate versus adequate bowel preparation was assessed. Two-sided chi-square analysis was used to assess the significance of differences between categorical variables and the Wilcoxon Rank-Sum test was used to assess the significance of differences between continuous variables.
Multivariate logistic regression analysis was performed to assess factors associated with hospital predictors and outcomes, after adjusting for all the aforementioned factors and clustering the effect based on the endoscopist. To evaluate the potential impact of modifiable factors on IBP, we performed counterfactual analysis, in which the observed distribution was compared to a hypothetical population in which all the modifiable risk factors were optimal.
RESULTS
Overall, 8,819 patients were included in our study population. They had a median age of 64 [53-76] years; 50.5% were female and 51% had an IBP. Patient characteristics and rates of IBP are presented in Table 1.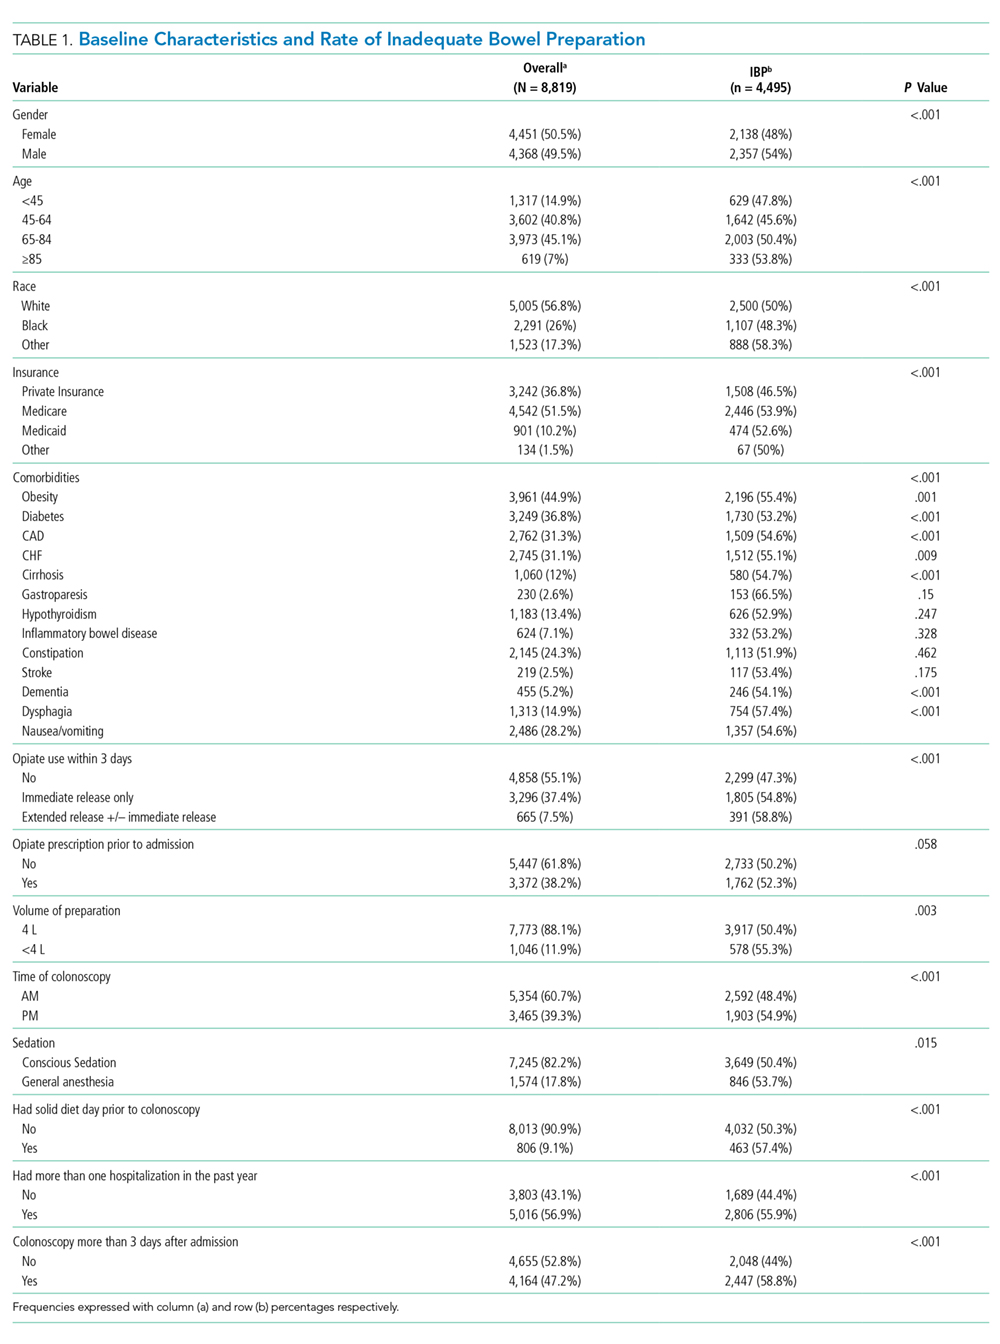
In unadjusted analyses, with regards to modifiable factors, opiate use within three days of colonoscopy was associated with a higher rate of IBP (55.4% vs 47.3%, P <.001), as was a lower volume (<4L) bowel preparation (55.3% vs 50.4%, P = .003). IBP was less frequent when colonoscopy was performed before noon vs afternoon (50.3% vs 57.4%, P < .001), and when patients were documented to receive a clear liquid diet or nil per os vs a solid diet the day prior to colonoscopy (50.3% vs 57.4%, P < .001). Overall bowel preparation quality improved over time (Figure 1). Median LOS was five [3-11] days. Patients who had IBP on their initial colonoscopy had a LOS one day longer than patients without IBP (six days vs five days, P < .001).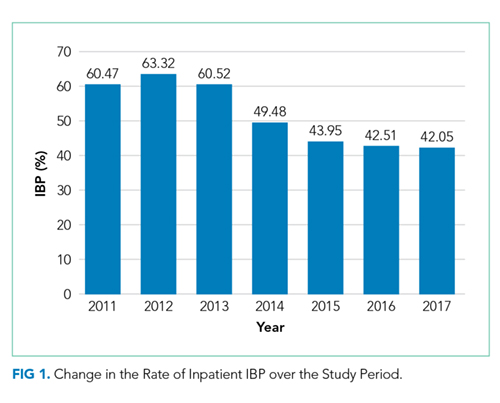
Multivariate Analysis
Table 2 shows the results of the multivariate analysis. The following modifiable factors were associated with IBP: opiate used within three days of the procedure (OR 1.31; 95% CI 1.8, 1.45), having the colonoscopy performed after12:00 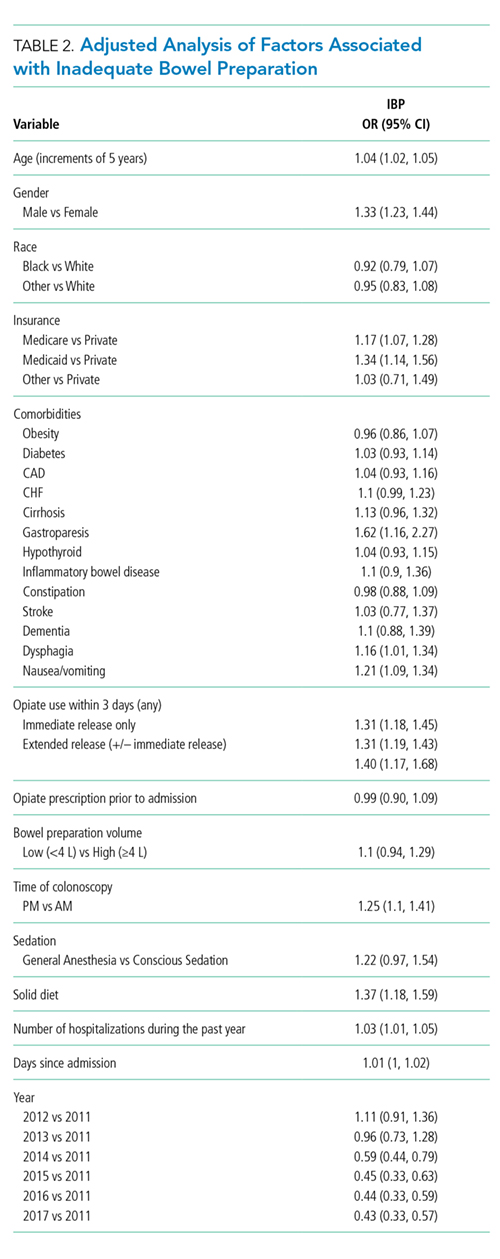
Potential Impact of Modifiable Variables
We conducted a counterfactual analysis based on a multivariate model to assess the impact of each modifiable risk factor on the IBP rate (Figure 1). In the included study population, 44.9% received an opiate, 39.3% had a colonoscopy after 12:00
DISCUSSION
In this large, multihospital cohort, IBP was documented in half (51%) of 8,819 inpatient colonoscopies performed. Nonmodifiable patient characteristics independently associated with IBP were age, male gender, white race, Medicare and Medicaid insurance, nausea/vomiting, dysphagia, and gastroparesis. Modifiable factors included not consuming opiates within three days of colonoscopy, avoidance of a solid diet the day prior to colonoscopy and performing the colonoscopy before noon. The volume of bowel preparation consumed was not associated with IBP. In a counterfactual analysis, we found that if all three modifiable factors were optimized, the predicted rate of IBP would drop to 45%.
Many studies, including our analysis, have shown significant differences between the frequency of IBP in inpatient versus outpatient bowel preparations.8-11 Therefore, it is crucial to study IBP in these settings separately. Three single-institution studies, including a total of 898 patients, have identified risk factors for inpatient IBP. Individual studies ranged in size from 130 to 524 patients with rates of IBP ranging from 22%-57%.1-3 They found IBP to be associated with increasing age, lower income, ASA Grade >3, diabetes, coronary artery disease (CAD), nausea or vomiting, BMI >25, and chronic constipation. Modifiable factors included opiates, afternoon procedures, and runway times >6 hours.
We also found IBP to be associated with increasing age and male gender. However, we found no association with diabetes, chronic constipation, CAD or BMI. As we were able to adjust for a wider variety of variables, it is possible that we were able to account for residual confounding better than previous studies. For example, we found that having nausea/vomiting, dysphagia, and gastroparesis was associated with IBP. Gastroparesis with associated nausea and vomiting may be the mechanism by which diabetes increases the risk for IBP. Further studies are needed to assess if interventions or alternative bowel cleansing in these patients can result in improved IBP. Finally, in contrast to studies with smaller cohorts which found that lower volume bowel preps improved IBP in the right colon,4,12 we found no association between IBP based and volume of bowel preparation consumed. Our impact analysis suggests that avoidance of opiates for at least three days before colonoscopy, avoidance of solid diet on the day before colonoscopy and performing all colonoscopies before noon would
The factors mentioned above may not always be amenable to modification. For example, for patients with active gastrointestinal bleeding, postponing colonoscopy by one day for the sake of maintaining a patient on a clear diet may not be feasible. Similarly, performing colonoscopies in the morning is highly dependent on endoscopy suite availability and hospital logistics. Denying opiates to patients experiencing severe pain is not ethical. In many scenarios, however, these variables could be modified, and institutional efforts to support these practices could yield considerable savings. Future prospective studies are needed to verify the real impact of these changes.
Further discussion is needed to contextualize the finding that colonoscopies scheduled in the afternoon are associated with improved bowel preparation quality. Previous research—albeit in the outpatient setting—has demonstrated 11.8 hours as the maximum upper time limit for the time elapsed between the end of bowel preparation to colonoscopy.14 Another study found an inverse relationship between the quality of bowel preparation and the time after completion of the bowel preparation.15 This makes sense from a physiological perspective as delaying the time between completion of bowel preparation, and the procedure allows chyme from the small intestine to reaccumulate in the colon. Anecdotally, at our institution as well as at many others, the bowel preparations are ordered to start in the evening to allow the consumption of complete bowel preparation by midnight. As a result of this practice, only patients who have their colonoscopies scheduled before noon fall within the optimal period of 11.8 hours. In the outpatient setting, the use of split preparations has led to the obliteration of the difference in the quality of bowel preparation between morning and afternoon colonoscopies.16 Prospective trials are needed to evaluate the use of split preparations to improve the quality of afternoon inpatient colonoscopies.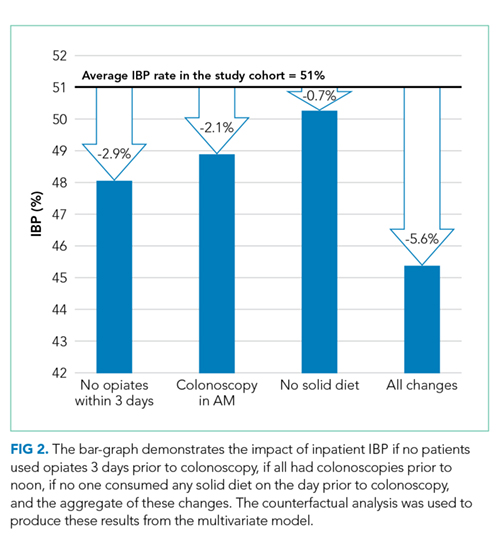
Few other strategies have been shown to mitigate IBP in the inpatient setting. In a small randomized controlled trial, Ergen et al. found that providing an educational booklet improved inpatient bowel preparation as measured by the Boston Bowel Preparation Scale.17 In a quasi-experimental design, Yadlapati et al. found that an automated split-dose bowel preparation resulted in decreased IBP, fewer repeated procedures, shorter LOS, and lower hospital cost.18 Our study adds to these tools by identifying three additional risk factors which could be optimized for inpatients. Because our findings are observational, they should be subjected to prospective trials. Our study also calls into question the impact of bowel preparation volume. We found no difference in the rate of IBP between low and large volume preparations. It is possible that other factors are more important than the specific preparation employed.
Interestingly, we found that IBP declined substantially in 2014 and continued to decline after that. The year was the most influential risk factor for IBP (on par with gastroparesis). The reason for this is unclear, as rates of our modifiable risk factors did not differ substantially by year. Other possibilities include improved access (including weekend access) to endoscopy coinciding with the development of a new endoscopy facility and use of integrated irrigation pump system instead of the use of manual syringes for flushing.
Our study has many strengths. It is by far the most extensive study of bowel preparation quality in inpatients to date and the only one that has included patient, procedural and bowel preparation characteristics. The study also has several significant limitations. This is a single center study, which could limit generalizability. Nonetheless, it was conducted within a health system with multiple hospitals in different parts of the United States (Ohio and Florida) and included a broad population mix with differing levels of acuity. The retrospective nature of the assessment precludes establishing causation. However, we mitigated confounding by adjusting for a wide variety of factors, and there is a plausible physiological mechanism for each of the factors we studied. Also, the retrospective nature of our study predisposes our data to omissions and misrepresentations during the documentation process. This is especially true with the use of ICD codes.19 Inaccuracies in coding are likely to bias toward the null, so observed associations may be an underestimate of the true association.
Our inability to ascertain if a patient completed the prescribed bowel preparation limited our ability to detect what may be a significant risk factor. Lastly, while clinically relevant, the Aronchik scale used to identify adequate from IBP has never been validated though it is frequently utilized and cited in the bowel preparation literature.20
CONCLUSIONS
In this large retrospective study evaluating bowel preparation quality in inpatients undergoing colonoscopy, we found that more than half of the patients have IBP and that IBP was associated with an extra day of hospitalization. Our study identifies those patients at highest risk and identifies modifiable risk factors for IBP. Specifically, we found that abstinence from opiates or solid diet before the colonoscopy, along with performing colonoscopies before noon were associated with improved outcomes. Prospective studies are needed to confirm the effects of these interventions on bowel preparation quality.
Disclosures
Carol A Burke, MD has received research funding from Ferring Pharmaceuticals. Other authors have no conflicts of interest to disclose.
1. Yadlapati R, Johnston ER, Gregory DL, Ciolino JD, Cooper A, Keswani RN. Predictors of inadequate inpatient colonoscopy preparation and its association with hospital length of stay and costs. Dig Dis Sci. 2015;60(11):3482-3490. doi: 10.1007/s10620-015-3761-2. PubMed
2. Jawa H, Mosli M, Alsamadani W, et al. Predictors of inadequate bowel preparation for inpatient colonoscopy. Turk J Gastroenterol. 2017;28(6):460-464. doi: 10.5152/tjg.2017.17196. PubMed
3. Mcnabb-Baltar J, Dorreen A, Dhahab HA, et al. Age is the only predictor of poor bowel preparation in the hospitalized patient. Can J Gastroenterol Hepatol. 2016;2016:1-5. doi: 10.1155/2016/2139264. PubMed
4. Rotondano G, Rispo A, Bottiglieri ME, et al. Tu1503 Quality of bowel cleansing in hospitalized patients is not worse than that of outpatients undergoing colonoscopy: results of a multicenter prospective regional study. Gastrointest Endosc. 2014;79(5):AB564. doi: 10.1016/j.gie.2014.02.949. PubMed
5. Ness R. Predictors of inadequate bowel preparation for colonoscopy. Am J Gastroenterol. 2001;96(6):1797-1802. doi: 10.1016/s0002-9270(01)02437-6. PubMed
6. Johnson DA, Barkun AN, Cohen LB, et al. Optimizing adequacy of bowel cleansing for colonoscopy: recommendations from the us multi-society task force on colorectal cancer. Gastroenterology. 2014;147(4):903-924. doi: 10.1053/j.gastro.2014.07.002. PubMed
7. Aronchick CA, Lipshutz WH, Wright SH, et al. A novel tableted purgative for colonoscopic preparation: efficacy and safety comparisons with Colyte and Fleet Phospho-Soda. Gastrointest Endosc. 2000;52(3):346-352. doi: 10.1067/mge.2000.108480. PubMed
8. Froehlich F, Wietlisbach V, Gonvers J-J, Burnand B, Vader J-P. Impact of colonic cleansing on quality and diagnostic yield of colonoscopy: the European Panel of Appropriateness of Gastrointestinal Endoscopy European multicenter study. Gastrointest Endosc. 2005;61(3):378-384. doi: 10.1016/s0016-5107(04)02776-2. PubMed
9. Sarvepalli S, Garber A, Rizk M, et al. 923 adjusted comparison of commercial bowel preparations based on inadequacy of bowel preparation in outpatient settings. Gastrointest Endosc. 2018;87(6):AB127. doi: 10.1016/j.gie.2018.04.1331.
10. Hendry PO, Jenkins JT, Diament RH. The impact of poor bowel preparation on colonoscopy: a prospective single center study of 10 571 colonoscopies. Colorectal Dis. 2007;9(8):745-748. doi: 10.1111/j.1463-1318.2007.01220.x. PubMed
11. Lebwohl B, Wang TC, Neugut AI. Socioeconomic and other predictors of colonoscopy preparation quality. Dig Dis Sci. 2010;55(7):2014-2020. doi: 10.1007/s10620-009-1079-7. PubMed
12. Chorev N, Chadad B, Segal N, et al. Preparation for colonoscopy in hospitalized patients. Dig Dis Sci. 2007;52(3):835-839. doi: 10.1007/s10620-006-9591-5. PubMed
13. Weiss AJ. Overview of Hospital Stays in the United States, 2012. HCUP Statistical Brief #180. Rockville, MD: Agency for Healthcare Research and Quality; 2014. PubMed
14. Kojecky V, Matous J, Keil R, et al. The optimal bowel preparation intervals before colonoscopy: a randomized study comparing polyethylene glycol and low-volume solutions. Dig Liver Dis. 2018;50(3):271-276. doi: 10.1016/j.dld.2017.10.010. PubMed
15. Siddiqui AA, Yang K, Spechler SJ, et al. Duration of the interval between the completion of bowel preparation and the start of colonoscopy predicts bowel-preparation quality. Gastrointest Endosc. 2009;69(3):700-706. doi: 10.1016/j.gie.2008.09.047. PubMed
16. Eun CS, Han DS, Hyun YS, et al. The timing of bowel preparation is more important than the timing of colonoscopy in determining the quality of bowel cleansing. Dig Dis Sci. 2010;56(2):539-544. doi: 10.1007/s10620-010-1457-1. PubMed
17. Ergen WF, Pasricha T, Hubbard FJ, et al. Providing hospitalized patients with an educational booklet increases the quality of colonoscopy bowel preparation. Clin Gastroenterol Hepatol. 2016;14(6):858-864. doi: 10.1016/j.cgh.2015.11.015. PubMed
18. Yadlapati R, Johnston ER, Gluskin AB, et al. An automated inpatient split-dose bowel preparation system improves colonoscopy quality and reduces repeat procedures. J Clin Gastroenterol. 2018;52(8):709-714. doi: 10.1097/mcg.0000000000000849. PubMed
19. Birman-Deych E, Waterman AD, Yan Y, Nilasena DS, Radford MJ, Gage BF. The accuracy of ICD-9-CM codes for identifying cardiovascular and stroke risk factors. Med Care. 2005;43(5):480-485. doi: 10.1097/01.mlr.0000160417.39497.a9. PubMed
20. Parmar R, Martel M, Rostom A, Barkun AN. Validated scales for colon cleansing: a systematic review. J Clin Gastroenterol. 2016;111(2):197-204. doi: 10.1038/ajg.2015.417. PubMed
Inadequate bowel preparation (IBP) at the time of inpatient colonoscopy is common and associated with increased length of stay and cost of care.1 The factors that contribute to IBP can be categorized into those that are modifiable and those that are nonmodifiable. While many factors have been associated with IBP, studies have been limited by small sample size or have combined inpatient/outpatient populations, thus limiting generalizability.1-5 Moreover, most factors associated with IBP, such as socioeconomic status, male gender, increased age, and comorbidities, are nonmodifiable. No studies have explicitly focused on modifiable risk factors, such as medication use, colonoscopy timing, or assessed the potential impact of modifying these factors.
In a large, multihospital system, we examine the frequency of IBP among inpatients undergoing colonoscopy along with factors associated with IBP. We attempted to identify
METHODS
Potential Predictors of IBP
Demographic data such as patient age, gender, ethnicity, body mass index (BMI), and insurance/payor status were obtained from the electronic health record (EHR). International Classification of Disease 9th and 10th revision, Clinical Modifications (ICD-9/10-CM) codes were used to obtain patient comorbidities including diabetes, coronary artery disease, heart failure, cirrhosis, gastroparesis, hypothyroidism, inflammatory bowel disease, constipation, stroke, dementia, dysphagia, and nausea/vomiting. Use of opioid medications within three days before colonoscopy was extracted from the medication administration record. These variables were chosen as biologically plausible modifiers of bowel preparation or had previously been assessed in the literature.1-6 The name and volume, classified as 4 L (GoLytely®) and < 4 liters (MoviPrep®) of bowel preparation, time of day when colonoscopy was performed, solid diet the day prior to colonoscopy, type of sedation used (conscious sedation or general anesthesia), and total colonoscopy time (defined as the time from scope insertion to removal) was recorded. Hospitalization-related variables, including the number of hospitalizations in the year before the current hospitalization, the year in which the colonoscopy was performed, and the number of days from admission to colonoscopy, were also obtained from the EHR.
Outcome Measures
An internally validated natural language algorithm, using Structured Queried Language was used to search through colonoscopy reports to identify adequacy of bowel preparation. ProVation® software allows the gastroenterologist to use some terms to describe bowel preparation in a drop-down menu format. In addition to the Aronchik scale (which allows the gastroenterologist to rate bowel preparation on a five-point scale: “excellent,” “good,” “fair,” “poor,” and “inadequate”) it also allows the provider to use terms such as “adequate” or “adequate to detect polyps >5 mm” as well as “unsatisfactory.”7 Mirroring prior literature, bowel preparation quality was classified into “adequate” and “inadequate”; “good” and “excellent” on the Aronchik scale were categorized as adequate as was the term “adequate” in any form; “fair,” “poor,” or “inadequate” on the Aronchik scale were classified as inadequate as was the term “unsatisfactory.” We evaluated the hospital length of stay (LOS) as a secondary outcome measure.
Statistical Analysis
After describing the frequency of IBP, the quality of bowel preparation (adequate vs inadequate) was compared based on the predictors described above. Categorical variables were reported as frequencies with percentages and continuous variables were reported as medians with 25th-75th percentile values. The significance of the difference between the proportion or median values of those who had inadequate versus adequate bowel preparation was assessed. Two-sided chi-square analysis was used to assess the significance of differences between categorical variables and the Wilcoxon Rank-Sum test was used to assess the significance of differences between continuous variables.
Multivariate logistic regression analysis was performed to assess factors associated with hospital predictors and outcomes, after adjusting for all the aforementioned factors and clustering the effect based on the endoscopist. To evaluate the potential impact of modifiable factors on IBP, we performed counterfactual analysis, in which the observed distribution was compared to a hypothetical population in which all the modifiable risk factors were optimal.
RESULTS
Overall, 8,819 patients were included in our study population. They had a median age of 64 [53-76] years; 50.5% were female and 51% had an IBP. Patient characteristics and rates of IBP are presented in Table 1.
In unadjusted analyses, with regards to modifiable factors, opiate use within three days of colonoscopy was associated with a higher rate of IBP (55.4% vs 47.3%, P <.001), as was a lower volume (<4L) bowel preparation (55.3% vs 50.4%, P = .003). IBP was less frequent when colonoscopy was performed before noon vs afternoon (50.3% vs 57.4%, P < .001), and when patients were documented to receive a clear liquid diet or nil per os vs a solid diet the day prior to colonoscopy (50.3% vs 57.4%, P < .001). Overall bowel preparation quality improved over time (Figure 1). Median LOS was five [3-11] days. Patients who had IBP on their initial colonoscopy had a LOS one day longer than patients without IBP (six days vs five days, P < .001).
Multivariate Analysis
Table 2 shows the results of the multivariate analysis. The following modifiable factors were associated with IBP: opiate used within three days of the procedure (OR 1.31; 95% CI 1.8, 1.45), having the colonoscopy performed after12:00
Potential Impact of Modifiable Variables
We conducted a counterfactual analysis based on a multivariate model to assess the impact of each modifiable risk factor on the IBP rate (Figure 1). In the included study population, 44.9% received an opiate, 39.3% had a colonoscopy after 12:00
DISCUSSION
In this large, multihospital cohort, IBP was documented in half (51%) of 8,819 inpatient colonoscopies performed. Nonmodifiable patient characteristics independently associated with IBP were age, male gender, white race, Medicare and Medicaid insurance, nausea/vomiting, dysphagia, and gastroparesis. Modifiable factors included not consuming opiates within three days of colonoscopy, avoidance of a solid diet the day prior to colonoscopy and performing the colonoscopy before noon. The volume of bowel preparation consumed was not associated with IBP. In a counterfactual analysis, we found that if all three modifiable factors were optimized, the predicted rate of IBP would drop to 45%.
Many studies, including our analysis, have shown significant differences between the frequency of IBP in inpatient versus outpatient bowel preparations.8-11 Therefore, it is crucial to study IBP in these settings separately. Three single-institution studies, including a total of 898 patients, have identified risk factors for inpatient IBP. Individual studies ranged in size from 130 to 524 patients with rates of IBP ranging from 22%-57%.1-3 They found IBP to be associated with increasing age, lower income, ASA Grade >3, diabetes, coronary artery disease (CAD), nausea or vomiting, BMI >25, and chronic constipation. Modifiable factors included opiates, afternoon procedures, and runway times >6 hours.
We also found IBP to be associated with increasing age and male gender. However, we found no association with diabetes, chronic constipation, CAD or BMI. As we were able to adjust for a wider variety of variables, it is possible that we were able to account for residual confounding better than previous studies. For example, we found that having nausea/vomiting, dysphagia, and gastroparesis was associated with IBP. Gastroparesis with associated nausea and vomiting may be the mechanism by which diabetes increases the risk for IBP. Further studies are needed to assess if interventions or alternative bowel cleansing in these patients can result in improved IBP. Finally, in contrast to studies with smaller cohorts which found that lower volume bowel preps improved IBP in the right colon,4,12 we found no association between IBP based and volume of bowel preparation consumed. Our impact analysis suggests that avoidance of opiates for at least three days before colonoscopy, avoidance of solid diet on the day before colonoscopy and performing all colonoscopies before noon would
The factors mentioned above may not always be amenable to modification. For example, for patients with active gastrointestinal bleeding, postponing colonoscopy by one day for the sake of maintaining a patient on a clear diet may not be feasible. Similarly, performing colonoscopies in the morning is highly dependent on endoscopy suite availability and hospital logistics. Denying opiates to patients experiencing severe pain is not ethical. In many scenarios, however, these variables could be modified, and institutional efforts to support these practices could yield considerable savings. Future prospective studies are needed to verify the real impact of these changes.
Further discussion is needed to contextualize the finding that colonoscopies scheduled in the afternoon are associated with improved bowel preparation quality. Previous research—albeit in the outpatient setting—has demonstrated 11.8 hours as the maximum upper time limit for the time elapsed between the end of bowel preparation to colonoscopy.14 Another study found an inverse relationship between the quality of bowel preparation and the time after completion of the bowel preparation.15 This makes sense from a physiological perspective as delaying the time between completion of bowel preparation, and the procedure allows chyme from the small intestine to reaccumulate in the colon. Anecdotally, at our institution as well as at many others, the bowel preparations are ordered to start in the evening to allow the consumption of complete bowel preparation by midnight. As a result of this practice, only patients who have their colonoscopies scheduled before noon fall within the optimal period of 11.8 hours. In the outpatient setting, the use of split preparations has led to the obliteration of the difference in the quality of bowel preparation between morning and afternoon colonoscopies.16 Prospective trials are needed to evaluate the use of split preparations to improve the quality of afternoon inpatient colonoscopies.
Few other strategies have been shown to mitigate IBP in the inpatient setting. In a small randomized controlled trial, Ergen et al. found that providing an educational booklet improved inpatient bowel preparation as measured by the Boston Bowel Preparation Scale.17 In a quasi-experimental design, Yadlapati et al. found that an automated split-dose bowel preparation resulted in decreased IBP, fewer repeated procedures, shorter LOS, and lower hospital cost.18 Our study adds to these tools by identifying three additional risk factors which could be optimized for inpatients. Because our findings are observational, they should be subjected to prospective trials. Our study also calls into question the impact of bowel preparation volume. We found no difference in the rate of IBP between low and large volume preparations. It is possible that other factors are more important than the specific preparation employed.
Interestingly, we found that IBP declined substantially in 2014 and continued to decline after that. The year was the most influential risk factor for IBP (on par with gastroparesis). The reason for this is unclear, as rates of our modifiable risk factors did not differ substantially by year. Other possibilities include improved access (including weekend access) to endoscopy coinciding with the development of a new endoscopy facility and use of integrated irrigation pump system instead of the use of manual syringes for flushing.
Our study has many strengths. It is by far the most extensive study of bowel preparation quality in inpatients to date and the only one that has included patient, procedural and bowel preparation characteristics. The study also has several significant limitations. This is a single center study, which could limit generalizability. Nonetheless, it was conducted within a health system with multiple hospitals in different parts of the United States (Ohio and Florida) and included a broad population mix with differing levels of acuity. The retrospective nature of the assessment precludes establishing causation. However, we mitigated confounding by adjusting for a wide variety of factors, and there is a plausible physiological mechanism for each of the factors we studied. Also, the retrospective nature of our study predisposes our data to omissions and misrepresentations during the documentation process. This is especially true with the use of ICD codes.19 Inaccuracies in coding are likely to bias toward the null, so observed associations may be an underestimate of the true association.
Our inability to ascertain if a patient completed the prescribed bowel preparation limited our ability to detect what may be a significant risk factor. Lastly, while clinically relevant, the Aronchik scale used to identify adequate from IBP has never been validated though it is frequently utilized and cited in the bowel preparation literature.20
CONCLUSIONS
In this large retrospective study evaluating bowel preparation quality in inpatients undergoing colonoscopy, we found that more than half of the patients have IBP and that IBP was associated with an extra day of hospitalization. Our study identifies those patients at highest risk and identifies modifiable risk factors for IBP. Specifically, we found that abstinence from opiates or solid diet before the colonoscopy, along with performing colonoscopies before noon were associated with improved outcomes. Prospective studies are needed to confirm the effects of these interventions on bowel preparation quality.
Disclosures
Carol A Burke, MD has received research funding from Ferring Pharmaceuticals. Other authors have no conflicts of interest to disclose.
1. Yadlapati R, Johnston ER, Gregory DL, Ciolino JD, Cooper A, Keswani RN. Predictors of inadequate inpatient colonoscopy preparation and its association with hospital length of stay and costs. Dig Dis Sci. 2015;60(11):3482-3490. doi: 10.1007/s10620-015-3761-2. PubMed
2. Jawa H, Mosli M, Alsamadani W, et al. Predictors of inadequate bowel preparation for inpatient colonoscopy. Turk J Gastroenterol. 2017;28(6):460-464. doi: 10.5152/tjg.2017.17196. PubMed
3. Mcnabb-Baltar J, Dorreen A, Dhahab HA, et al. Age is the only predictor of poor bowel preparation in the hospitalized patient. Can J Gastroenterol Hepatol. 2016;2016:1-5. doi: 10.1155/2016/2139264. PubMed
4. Rotondano G, Rispo A, Bottiglieri ME, et al. Tu1503 Quality of bowel cleansing in hospitalized patients is not worse than that of outpatients undergoing colonoscopy: results of a multicenter prospective regional study. Gastrointest Endosc. 2014;79(5):AB564. doi: 10.1016/j.gie.2014.02.949. PubMed
5. Ness R. Predictors of inadequate bowel preparation for colonoscopy. Am J Gastroenterol. 2001;96(6):1797-1802. doi: 10.1016/s0002-9270(01)02437-6. PubMed
6. Johnson DA, Barkun AN, Cohen LB, et al. Optimizing adequacy of bowel cleansing for colonoscopy: recommendations from the us multi-society task force on colorectal cancer. Gastroenterology. 2014;147(4):903-924. doi: 10.1053/j.gastro.2014.07.002. PubMed
7. Aronchick CA, Lipshutz WH, Wright SH, et al. A novel tableted purgative for colonoscopic preparation: efficacy and safety comparisons with Colyte and Fleet Phospho-Soda. Gastrointest Endosc. 2000;52(3):346-352. doi: 10.1067/mge.2000.108480. PubMed
8. Froehlich F, Wietlisbach V, Gonvers J-J, Burnand B, Vader J-P. Impact of colonic cleansing on quality and diagnostic yield of colonoscopy: the European Panel of Appropriateness of Gastrointestinal Endoscopy European multicenter study. Gastrointest Endosc. 2005;61(3):378-384. doi: 10.1016/s0016-5107(04)02776-2. PubMed
9. Sarvepalli S, Garber A, Rizk M, et al. 923 adjusted comparison of commercial bowel preparations based on inadequacy of bowel preparation in outpatient settings. Gastrointest Endosc. 2018;87(6):AB127. doi: 10.1016/j.gie.2018.04.1331.
10. Hendry PO, Jenkins JT, Diament RH. The impact of poor bowel preparation on colonoscopy: a prospective single center study of 10 571 colonoscopies. Colorectal Dis. 2007;9(8):745-748. doi: 10.1111/j.1463-1318.2007.01220.x. PubMed
11. Lebwohl B, Wang TC, Neugut AI. Socioeconomic and other predictors of colonoscopy preparation quality. Dig Dis Sci. 2010;55(7):2014-2020. doi: 10.1007/s10620-009-1079-7. PubMed
12. Chorev N, Chadad B, Segal N, et al. Preparation for colonoscopy in hospitalized patients. Dig Dis Sci. 2007;52(3):835-839. doi: 10.1007/s10620-006-9591-5. PubMed
13. Weiss AJ. Overview of Hospital Stays in the United States, 2012. HCUP Statistical Brief #180. Rockville, MD: Agency for Healthcare Research and Quality; 2014. PubMed
14. Kojecky V, Matous J, Keil R, et al. The optimal bowel preparation intervals before colonoscopy: a randomized study comparing polyethylene glycol and low-volume solutions. Dig Liver Dis. 2018;50(3):271-276. doi: 10.1016/j.dld.2017.10.010. PubMed
15. Siddiqui AA, Yang K, Spechler SJ, et al. Duration of the interval between the completion of bowel preparation and the start of colonoscopy predicts bowel-preparation quality. Gastrointest Endosc. 2009;69(3):700-706. doi: 10.1016/j.gie.2008.09.047. PubMed
16. Eun CS, Han DS, Hyun YS, et al. The timing of bowel preparation is more important than the timing of colonoscopy in determining the quality of bowel cleansing. Dig Dis Sci. 2010;56(2):539-544. doi: 10.1007/s10620-010-1457-1. PubMed
17. Ergen WF, Pasricha T, Hubbard FJ, et al. Providing hospitalized patients with an educational booklet increases the quality of colonoscopy bowel preparation. Clin Gastroenterol Hepatol. 2016;14(6):858-864. doi: 10.1016/j.cgh.2015.11.015. PubMed
18. Yadlapati R, Johnston ER, Gluskin AB, et al. An automated inpatient split-dose bowel preparation system improves colonoscopy quality and reduces repeat procedures. J Clin Gastroenterol. 2018;52(8):709-714. doi: 10.1097/mcg.0000000000000849. PubMed
19. Birman-Deych E, Waterman AD, Yan Y, Nilasena DS, Radford MJ, Gage BF. The accuracy of ICD-9-CM codes for identifying cardiovascular and stroke risk factors. Med Care. 2005;43(5):480-485. doi: 10.1097/01.mlr.0000160417.39497.a9. PubMed
20. Parmar R, Martel M, Rostom A, Barkun AN. Validated scales for colon cleansing: a systematic review. J Clin Gastroenterol. 2016;111(2):197-204. doi: 10.1038/ajg.2015.417. PubMed
© 2019 Society of Hospital Medicine
Resuming Anticoagulation following Upper Gastrointestinal Bleeding among Patients with Nonvalvular Atrial Fibrillation—A Microsimulation Analysis
Anticoagulation is commonly used in the management of atrial fibrillation to reduce the risk of ischemic stroke. Warfarin and other anticoagulants increase the risk of hemorrhagic complications, including upper gastrointestinal bleeding (UGIB). Following UGIB, management of anticoagulation is highly variable. Many patients permanently discontinue anticoagulation, while others continue without interruption.1-4 Among patients who resume warfarin, different cohorts have measured median times to resumption ranging from four days to 50 days.1-3 Outcomes data are sparse, and clinical guidelines offer little direction.5
Following UGIB, the balance between the risks and benefits of anticoagulation changes over time. Rebleeding risk is highest immediately after the event and declines quickly; therefore, rapid resumption of anticoagulation causes patient harm.3 Meanwhile, the risk of stroke remains constant, and delay in resumption of anticoagulation is associated with increased risk of stroke and death.1 At some point in time following the initial UGIB, the expected harm from bleeding would equal the expected harm from stroke. This time point would represent the optimal time to restart anticoagulation.
Trial data are unlikely to identify the optimal time for restarting anticoagulation. A randomized trial comparing discrete reinitiation times (eg, two weeks vs six weeks) may easily miss the optimal timing. Moreover, because the daily probability of thromboembolic events is low, large numbers of patients would be required to power such a study. In addition, a number of oral anticoagulants are now approved for prevention of thromboembolic stroke in atrial fibrillation, and each drug may have different optimal timing.
In contrast to randomized trials that would be impracticable for addressing this clinical issue, microsimulation modeling can provide granular information regarding the optimal time to restart anticoagulation. Herein, we set out to estimate the expected benefit of reinitiation of warfarin, the most commonly used oral anticoagulant,6 or apixaban, the direct oral anticoagulant with the most favorable risk profile,7 as a function of days after UGIB.
METHODS
We previously described a microsimulation model of anticoagulation among patients with nonvalvular atrial fibrillation (NVAF; hereafter, we refer to this model as the Personalized Anticoagulation Decision-Making Assistance model, or PADMA).8,9 For this study, we extended this model to incorporate the probability of rebleeding following UGIB and include apixaban as an alternative to warfarin. This model begins with a synthetic population following UGIB, the members of which are at varying risk for thromboembolism, recurrent UGIB, and other hemorrhages. For each patient, the model simulates a number of possible events (eg, thromboembolic stroke, intracranial hemorrhage, rebleeding, and other major extracranial hemorrhages) on each day of an acute period of 90 days after hemostasis. Patients who survive until the end of the acute period enter a simulation with annual, rather than daily, cycles. Our model then estimates total quality-adjusted life-years (QALYs) for each patient, discounted to the present. We report the average discounted QALYs produced by the model for the same population if all individuals in our input population were to resume either warfarin or apixaban on a specific day. Input parameters and ranges are summarized in Table 1, a simplified schematic of our model is shown in the Supplemental Appendix, and additional details regarding model structure and assumptions can be found in earlier work.8,9 We simulated from a health system perspective over a lifelong time horizon. All analyses were performed in version 14 of Stata (StataCorp, LLC, College Station, Texas).
Synthetic Population
To generate a population reflective of the comorbidities and age distribution of the US population with NVAF, we merged relevant variables from the National Health and Nutrition Examination Survey (NHANES; 2011-2012), using multiple imputation to correct for missing variables.10 We then bootstrapped to national population estimates by age and sex to arrive at a hypothetical population of the United States.11 Because NHANES does not include atrial fibrillation, we applied sex- and age-specific prevalence rates from the AnTicoagulation and Risk Factors In Atrial Fibrillation study.12 We then calculated commonly used risk scores (CHA2DS2-Vasc and HAS-BLED) for each patient and limited the population to patients with a CHA2DS2-Vasc score of one or greater.13,14 The population resuming apixaban was further limited to patients whose creatinine clearance was 25 mL/min or greater in keeping with the entry criteria in the phase 3 clinical trial on which the medication’s approval was based.15
To estimate patient-specific probability of rebleeding, we generated a Rockall score for each patient.16 Although the discrimination of the Rockall score is limited for individual patients, as with all other tools used to predict rebleeding following UGIB, the Rockall score has demonstrated reasonable calibration across a threefold risk gradient.17-19 International consensus guidelines recommend the Rockall score as one of two risk prediction tools for clinical use in the management of patients with UGIB.20 In addition, because the Rockall score includes some demographic components (five of a possible 11 points), our estimates of rebleeding risk are covariant with other patient-specific risks. We assumed that the endoscopic components of the Rockall score were present in our cohort at the same frequency as in the original derivation and are independent of known patient risk factors.16 For example, 441 out of 4,025 patients in the original Rockall derivation cohort presented with a systolic blood pressure less than 100 mm Hg. We assumed that an independent and random 10.96% of the cohort would present with shock, which confers two points in the Rockall score.
The population was replicated 60 times, with identical copies of the population resuming anticoagulation on each of days 1-60 (where day zero represents hemostasis). Intermediate data regarding our simulated population can be found in the Supplemental Appendix and in prior work.
Event Type, Severity, and Mortality
Each patient in our simulation could sustain several discrete and independent events: ischemic stroke, intracranial hemorrhage, recurrent UGIB, or extracranial major hemorrhage other than recurrent UGIB. As in prior analyses using the PADMA model, we did not consider minor hemorrhagic events.8
The probability of each event was conditional on the corresponding risk scoring system. Patient-specific probability of ischemic stroke was conditional on CHA2DS2-Vasc score.21,22 Patient-specific probability of intracranial hemorrhage was conditional on HAS-BLED score, with the proportions of intracranial hemorrhage of each considered subtype (intracerebral, subarachnoid, or subdural) bootstrapped from previously-published data.21-24 Patient-specific probability of rebleeding was conditional on Rockall score from the combined Rockall and Vreeburg validation cohorts.17 Patient-specific probability of extracranial major hemorrhage was conditional on HAS-BLED score.21 To avoid double-counting of UGIB, we subtracted the baseline risk of UGIB from the overall rate of extracranial major hemorrhages using previously-published data regarding relative frequency and a bootstrapping approach.25
Probability of Rebleeding Over Time
To estimate the decrease in rebleeding risk over time, we searched the Medline database for systematic reviews of recurrent bleeding following UGIB using the strategy detailed in the Supplemental Appendix. Using the interval rates of rebleeding we identified, we calculated implied daily rates of rebleeding at the midpoint of each interval. For example, 39.5% of rebleeding events occurred within three days of hemostasis, implying a daily rate of approximately 13.2% on day two (32 of 81 events over a three-day period). We repeated this process to estimate daily rates at the midpoint of each reported time interval and fitted an exponential decay function.26 Our exponential fitted these datapoints quite well, but we lacked sufficient data to test other survival functions (eg, Gompertz, lognormal, etc.). Our fitted exponential can be expressed as:
P rebleeding = b 0 *exp(b 1 *day)
where b0 = 0.1843 (SE: 0.0136) and b1 = –0.1563 (SE: 0.0188). For example, a mean of 3.9% of rebleeding episodes will occur on day 10 (0.1843 *exp(–0.1563 *10)).
Relative Risks of Events with Anticoagulation
For patients resuming warfarin, the probabilities of each event were adjusted based on patient-specific daily INR. All INRs were assumed to be 1.0 until the day of warfarin reinitiation, after which interpolated trajectories of postinitiation INR measurements were sampled for each patient from an earlier study of clinical warfarin initiation.27 Relative risks of ischemic stroke and hemorrhagic events were calculated based on each day’s INR.
For patients taking apixaban, we assumed that the medication would reach full therapeutic effect one day after reinitiation. Based on available evidence, we applied the relative risks of each event with apixaban compared with warfarin.25
Future Disability and Mortality
Each event in our simulation resulted in hospitalization. Length of stay was sampled for each diagnosis.28 The disutility of hospitalization was estimated based on length of stay.8 Inpatient mortality and future disability were predicted for each event as previously described.8 We assumed that recurrent episodes of UGIB conferred morbidity and mortality identical to extracranial major hemorrhages more broadly.29,30
Disutilities
We used a multiplicative model for disutility with baseline utilities conditional on age and sex.31 Each day after resumption of anticoagulation carried a disutility of 0.012 for warfarin or 0.002 for apixaban, which we assumed to be equivalent to aspirin in disutility.32 Long-term disutility and life expectancy were conditional on modified Rankin Score (mRS).33,34 We discounted all QALYs to day zero using standard exponential discounting and a discount rate centered at 3%. We then computed the average discounted QALYs among the cohort of patients that resumed anticoagulation on each day following the index UGIB.
Sensitivity Analyses and Metamodel
To assess sensitivity to continuously varying input parameters, such as discount rate, the proportion of extracranial major hemorrhages that are upper GI bleeds, and inpatient mortality from extracranial major hemorrhage, we constructed a metamodel (a regression model of our microsimulation results).35 We tested for interactions among input parameters and dropped parameters that were not statistically significant predictors of discounted QALYs from our metamodel. We then tested for interactions between each parameter and day resuming anticoagulation to determine which factors may impact the optimal day of reinitiation. Finally, we used predicted marginal effects from our metamodel to assess the change in optimal day across the ranges of each input parameter when other parameters were held at their medians.
RESULTS
Resuming warfarin on day zero produced the fewest QALYs. With delay in reinitiation of anticoagulation, expected QALYs increased, peaked, and then declined for all scenarios. In our base-case simulation of warfarin, peak utility was achieved by resumption 41 days after the index UGIB. Resumption between days 32 and 51 produced greater than 99.9% of peak utility. In our base-case simulation of apixaban, peak utility was achieved by resumption 32 days after the index UGIB. Resumption between days 21 and 47 produced greater than 99.9% of peak utility. Results for warfarin and apixaban are shown in Figures 1 and 2, respectively.
The optimal day of warfarin reinitiation was most sensitive to CHA2DS2-Vasc scores and varied by around 11 days between a CHA2DS2-Vasc score of one and a CHA2DS2-Vasc score of six (the 5th and 95th percentiles, respectively) when all other parameters are held at their medians. Results were comparatively insensitive to rebleeding risk. Varying Rockall score from two to seven (the 5th and 95th percentiles, respectively) added three days to optimal warfarin resumption. Varying other parameters from the 5th to the 95th percentile (including HAS-BLED score, sex, age, and discount rate) changed expected QALYs but did not change the optimal day of reinitiation of warfarin. Optimal day of reinitiation for warfarin stratified by CHA2DS2-Vasc score is shown in Table 2.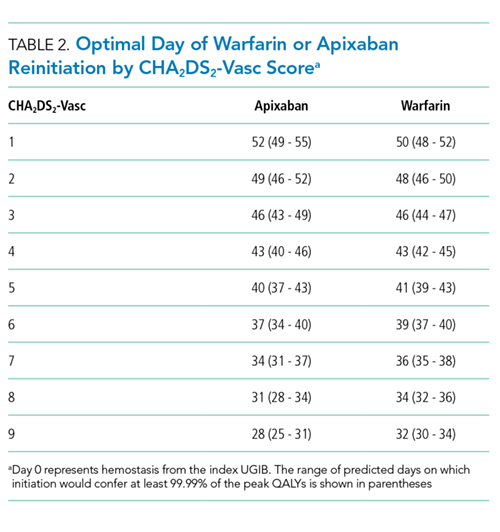
Sensitivity analyses for apixaban produced broadly similar results, but with greater sensitivity to rebleeding risk. Optimal day of reinitiation varied by 15 days over the examined range of CHA2DS2-Vasc scores (Table 2) and by six days over the range of Rockall scores (Supplemental Appendix). Other input parameters, including HAS-BLED score, age, sex, and discount rate, changed expected QALYs and were significant in our metamodel but did not affect the optimal day of reinitiation. Metamodel results for both warfarin and apixaban are included in the Supplemental Appendix.
DISCUSSION
Anticoagulation is frequently prescribed for patients with NVAF, and hemorrhagic complications are common. Although anticoagulants are withheld following hemorrhages, scant evidence to inform the optimal timing of reinitiation is available. In this microsimulation analysis, we found that the optimal time to reinitiate anticoagulation following UGIB is around 41 days for warfarin and around 32 days for apixaban. We have further demonstrated that the optimal timing of reinitiation can vary by nearly two weeks, depending on a patient’s underlying risk of stroke, and that early reinitiation is more sensitive to rebleeding risk than late reinitiation.
Prior work has shown that early reinitiation of anticoagulation leads to higher rates of recurrent hemorrhage while failure to reinitiate anticoagulation is associated with higher rates of stroke and mortality.1-4,36 Our results add to the literature in a number of important ways. First, our model not only confirms that anticoagulation should be restarted but also suggests when this action should be taken. The competing risks of bleeding and stroke have left clinicians with little guidance; we have quantified the clinical reasoning required for the decision to resume anticoagulation. Second, by including the disutility of hospitalization and long-term disability, our model more accurately represents the complex tradeoffs between recurrent hemorrhage and (potentially disabling) stroke than would a comparison of event rates. Third, our model is conditional upon patient risk factors, allowing clinicians to personalize the timing of anticoagulation resumption. Theory would suggest that patients at higher risk of ischemic stroke benefit from earlier resumption of anticoagulation, while patients at higher risk of hemorrhage benefit from delayed reinitiation. We have quantified the extent to which patient-specific risks should change timing. Fourth, we offer a means of improving expected health outcomes that requires little more than appropriate scheduling. Current practice regarding resuming anticoagulation is widely variable. Many patients never resume warfarin, and those that do resume do so after highly varied periods of time.1-5,36 We offer a means of standardizing clinical practice and improving expected patient outcomes.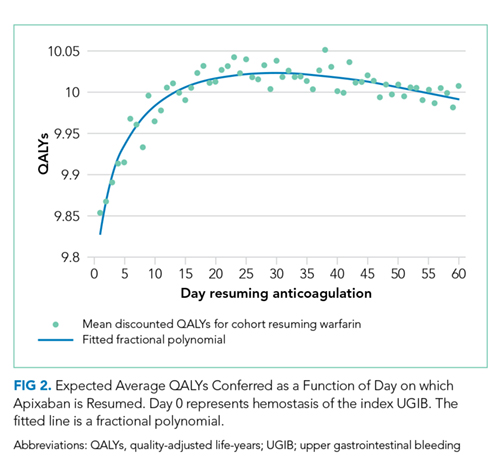
Interestingly, patient-specific risk of rebleeding had little effect on our primary outcome for warfarin, and a greater effect in our simulation of apixaban. It would seem that rebleeding risk, which decreases roughly exponentially, is sufficiently low by the time period at which warfarin should be resumed that patient-specific hemorrhage risk factors have little impact. Meanwhile, at the shorter post-event intervals at which apixaban can be resumed, both stroke risk and patient-specific bleeding risk are worthy considerations.
Our model is subject to several important limitations. First, our predictions of the optimal day as a function of risk scores can only be as well-calibrated as the input scoring systems. It is intuitive that patients with higher risk of rebleeding benefit from delayed reinitiation, while patients with higher risk of thromboembolic stroke benefit from earlier reinitiation. Still, clinicians seeking to operationalize competing risks through these two scores—or, indeed, any score—should be mindful of their limited calibration and shared variance. In other words, while the optimal day of reinitiation is likely in the range we have predicted and varies to the degree demonstrated here, the optimal day we have predicted for each score is likely overly precise. However, while better-calibrated prediction models would improve the accuracy of our model, we believe ours to be the best estimate of timing given available data and this approach to be the most appropriate way to personalize anticoagulation resumption.
Our simulation of apixaban carries an additional source of potential miscalibration. In the clinical trials that led to their approval, apixaban and other direct oral anticoagulants (DOACs) were compared with warfarin over longer periods of time than the acute period simulated in this work. Over a short period of time, patients treated with more rapidly therapeutic medications (in this case, apixaban) would receive more days of effective therapy compared with a slower-onset medication, such as warfarin. Therefore, the relative risks experienced by patients are likely different over the time period we have simulated compared with those measured over longer periods of time (as in phase 3 clinical trials). Our results for apixaban should be viewed as more limited than our estimates for warfarin. More broadly, simulation analyses are intended to predict overall outcomes that are difficult to measure. While other frameworks to assess model credibility exist, the fact remains that no extant datasets can directly validate our predictions.37
Our findings are limited to patients with NVAF. Anticoagulants are prescribed for a variety of indications with widely varied underlying risks and benefits. Models constructed for these conditions would likely produce different timing for resumption of anticoagulation. Unfortunately, large scale cohort studies to inform such models are lacking. Similarly, we simulated UGIB, and our results should not be generalized to populations with other types of bleeding (eg, intracranial hemorrhage). Again, cohort studies of other types of bleeding would be necessary to understand the risks of anticoagulation over time in such populations.
Higher-quality data regarding risk of rebleeding over time would improve our estimates. Our literature search identified only one systematic review that could be used to estimate the risk of recurrent UGIB over time. These data are not adequate to interrogate other forms this survival curve could take, such as Gompertz or Weibull distributions. Recurrence risk almost certainly declines over time, but how quickly it declines carries additional uncertainty.
Despite these limitations, we believe our results to be the best estimates to date of the optimal time of anticoagulation reinitiation following UGIB. Our findings could help inform clinical practice guidelines and reduce variation in care where current practice guidelines are largely silent. Given the potential ease of implementing scheduling changes, our results represent an opportunity to improve patient outcomes with little resource investment.
In conclusion, after UGIB associated with anticoagulation, our model suggests that warfarin is optimally restarted approximately six weeks following hemostasis and that apixaban is optimally restarted approximately one month following hemostasis. Modest changes to this timing based on probability of thromboembolic stroke are reasonable.
Disclosures
The authors have nothing to disclose.
Funding
The authors received no specific funding for this work.
1. Witt DM, Delate T, Garcia DA, et al. Risk of thromboembolism, recurrent hemorrhage, and death after warfarin therapy interruption for gastrointestinal tract bleeding. Arch Intern Med. 2012;172(19):1484-1491. doi: 10.1001/archinternmed.2012.4261. PubMed
2. Sengupta N, Feuerstein JD, Patwardhan VR, et al. The risks of thromboembolism vs recurrent gastrointestinal bleeding after interruption of systemic anticoagulation in hospitalized inpatients with gastrointestinal bleeding: a prospective study. Am J Gastroenterol. 2015;110(2):328-335. doi: 10.1038/ajg.2014.398. PubMed
3. Qureshi W, Mittal C, Patsias I, et al. Restarting anticoagulation and outcomes after major gastrointestinal bleeding in atrial fibrillation. Am J Cardiol. 2014;113(4):662-668. doi: 10.1016/j.amjcard.2013.10.044. PubMed
4. Milling TJ, Spyropoulos AC. Re-initiation of dabigatran and direct factor Xa antagonists after a major bleed. Am J Emerg Med. 2016;34(11):19-25. doi: 10.1016/j.ajem.2016.09.049. PubMed
5. Brotman DJ, Jaffer AK. Resuming anticoagulation in the first week following gastrointestinal tract hemorrhage. Arch Intern Med. 2012;172(19):1492-1493. doi: 10.1001/archinternmed.2012.4309. PubMed
6. Barnes GD, Lucas E, Alexander GC, Goldberger ZD. National trends in ambulatory oral anticoagulant use. Am J Med. 2015;128(12):1300-5. doi: 10.1016/j.amjmed.2015.05.044. PubMed
7. Noseworthy PA, Yao X, Abraham NS, Sangaralingham LR, McBane RD, Shah ND. Direct comparison of dabigatran, rivaroxaban, and apixaban for effectiveness and safety in nonvalvular atrial fibrillation. Chest. 2016;150(6):1302-1312. doi: 10.1016/j.chest.2016.07.013. PubMed
8. Pappas MA, Barnes GD, Vijan S. Personalizing bridging anticoagulation in patients with nonvalvular atrial fibrillation—a microsimulation analysis. J Gen Intern Med. 2017;32(4):464-470. doi: 10.1007/s11606-016-3932-7. PubMed
9. Pappas MA, Vijan S, Rothberg MB, Singer DE. Reducing age bias in decision analyses of anticoagulation for patients with nonvalvular atrial fibrillation – a microsimulation study. PloS One. 2018;13(7):e0199593. doi: 10.1371/journal.pone.0199593. PubMed
10. National Center for Health Statistics. National Health and Nutrition Examination Survey. https://www.cdc.gov/nchs/nhanes/about_nhanes.htm. Accessed August 30, 2018.
11. United States Census Bureau. Age and sex composition in the United States: 2014. https://www.census.gov/data/tables/2014/demo/age-and-sex/2014-age-sex-composition.html. Accessed August 30, 2018.
12. Go AS, Hylek EM, Phillips KA, et al. Prevalence of diagnosed atrial fibrillation in adults: national implications for rhythm management and stroke prevention: the AnTicoagulation and Risk Factors in Atrial Fibrillation (ATRIA) study. JAMA. 2001;285(18):2370-2375. doi: 10.1001/jama.285.18.2370. PubMed
13. Lip GYH, Nieuwlaat R, Pisters R, Lane DA, Crijns HJGM. Refining clinical risk stratification for predicting stroke and thromboembolism in atrial fibrillation using a novel risk factor-based approach: the euro heart survey on atrial fibrillation. Chest. 2010;137(2):263-272. doi: 10.1378/chest.09-1584. PubMed
14. Pisters R, Lane DA, Nieuwlaat R, de Vos CB, Crijns HJGM, Lip GYH. A novel user-friendly score (HAS-BLED) to assess 1-year risk of major bleeding in patients with atrial fibrillation. Chest. 2010;138(5):1093-1100. doi: 10.1378/chest.10-0134. PubMed
15. Granger CB, Alexander JH, McMurray JJV, et al. Apixaban versus warfarin in patients with atrial fibrillation. N Engl J Med. 2011;365(11):981-992. doi: 10.1056/NEJMoa1107039.
16. Rockall TA, Logan RF, Devlin HB, Northfield TC. Risk assessment after acute upper gastrointestinal haemorrhage. Gut. 1996;38(3):316-321. doi: 10.1136/gut.38.3.316. PubMed
17. Vreeburg EM, Terwee CB, Snel P, et al. Validation of the Rockall risk scoring system in upper gastrointestinal bleeding. Gut. 1999;44(3):331-335. doi: 10.1136/gut.44.3.331. PubMed
18. Enns RA, Gagnon YM, Barkun AN, et al. Validation of the Rockall scoring system for outcomes from non-variceal upper gastrointestinal bleeding in a Canadian setting. World J Gastroenterol. 2006;12(48):7779-7785. doi: 10.3748/wjg.v12.i48.7779. PubMed
19. Stanley AJ, Laine L, Dalton HR, et al. Comparison of risk scoring systems for patients presenting with upper gastrointestinal bleeding: international multicentre prospective study. BMJ. 2017;356:i6432. doi: 10.1136/bmj.i6432. PubMed
20. Barkun AN, Bardou M, Kuipers EJ, et al. International consensus recommendations on the management of patients with nonvariceal upper gastrointestinal bleeding. Ann Intern Med. 2010;152(2):101-113. doi: 10.7326/0003-4819-152-2-201001190-00009. PubMed
21. Friberg L, Rosenqvist M, Lip GYH. Evaluation of risk stratification schemes for ischaemic stroke and bleeding in 182 678 patients with atrial fibrillation: the Swedish atrial fibrillation cohort study. Eur Heart J. 2012;33(12):1500-1510. doi: 10.1093/eurheartj/ehr488. PubMed
22. Friberg L, Rosenqvist M, Lip GYH. Net clinical benefit of warfarin in patients with atrial fibrillation: a report from the Swedish atrial fibrillation cohort study. Circulation. 2012;125(19):2298-2307. doi: 10.1161/CIRCULATIONAHA.111.055079. PubMed
23. Hart RG, Diener HC, Yang S, et al. Intracranial hemorrhage in atrial fibrillation patients during anticoagulation with warfarin or dabigatran: the RE-LY trial. Stroke. 2012;43(6):1511-1517. doi: 10.1161/STROKEAHA.112.650614. PubMed
24. Hankey GJ, Stevens SR, Piccini JP, et al. Intracranial hemorrhage among patients with atrial fibrillation anticoagulated with warfarin or rivaroxaban: the rivaroxaban once daily, oral, direct factor Xa inhibition compared with vitamin K antagonism for prevention of stroke and embolism trial in atrial fibrillation. Stroke. 2014;45(5):1304-1312. doi: 10.1161/STROKEAHA.113.004506. PubMed
25. Eikelboom JW, Wallentin L, Connolly SJ, et al. Risk of bleeding with 2 doses of dabigatran compared with warfarin in older and younger patients with atrial fibrillation : an analysis of the randomized evaluation of long-term anticoagulant therapy (RE-LY trial). Circulation. 2011;123(21):2363-2372. doi: 10.1161/CIRCULATIONAHA.110.004747. PubMed
26. El Ouali S, Barkun A, Martel M, Maggio D. Timing of rebleeding in high-risk peptic ulcer bleeding after successful hemostasis: a systematic review. Can J Gastroenterol Hepatol. 2014;28(10):543-548. doi: 0.1016/S0016-5085(14)60738-1. PubMed
27. Kimmel SE, French B, Kasner SE, et al. A pharmacogenetic versus a clinical algorithm for warfarin dosing. N Engl J Med. 2013;369(24):2283-2293. doi: 10.1056/NEJMoa1310669. PubMed
28. Healthcare Cost and Utilization Project (HCUP), Agency for Healthcare Research and Quality. HCUP Databases. https://www.hcup-us.ahrq.gov/nisoverview.jsp. Accessed August 31, 2018.
29. Guerrouij M, Uppal CS, Alklabi A, Douketis JD. The clinical impact of bleeding during oral anticoagulant therapy: assessment of morbidity, mortality and post-bleed anticoagulant management. J Thromb Thrombolysis. 2011;31(4):419-423. doi: 10.1007/s11239-010-0536-7. PubMed
30. Fang MC, Go AS, Chang Y, et al. Death and disability from warfarin-associated intracranial and extracranial hemorrhages. Am J Med. 2007;120(8):700-705. doi: 10.1016/j.amjmed.2006.07.034. PubMed
31. Guertin JR, Feeny D, Tarride JE. Age- and sex-specific Canadian utility norms, based on the 2013-2014 Canadian Community Health Survey. CMAJ. 2018;190(6):E155-E161. doi: 10.1503/cmaj.170317. PubMed
32. Gage BF, Cardinalli AB, Albers GW, Owens DK. Cost-effectiveness of warfarin and aspirin for prophylaxis of stroke in patients with nonvalvular atrial fibrillation. JAMA. 1995;274(23):1839-1845. doi: 10.1001/jama.1995.03530230025025. PubMed
33. Fang MC, Go AS, Chang Y, et al. Long-term survival after ischemic stroke in patients with atrial fibrillation. Neurology. 2014;82(12):1033-1037. doi: 10.1212/WNL.0000000000000248. PubMed
34. Hong KS, Saver JL. Quantifying the value of stroke disability outcomes: WHO global burden of disease project disability weights for each level of the modified Rankin scale * Supplemental Mathematical Appendix. Stroke. 2009;40(12):3828-3833. doi: 10.1161/STROKEAHA.109.561365. PubMed
35. Jalal H, Dowd B, Sainfort F, Kuntz KM. Linear regression metamodeling as a tool to summarize and present simulation model results. Med Decis Mak. 2013;33(7):880-890. doi: 10.1177/0272989X13492014. PubMed
36. Staerk L, Lip GYH, Olesen JB, et al. Stroke and recurrent haemorrhage associated with antithrombotic treatment after gastrointestinal bleeding in patients with atrial fibrillation: nationwide cohort study. BMJ. 2015;351:h5876. doi: 10.1136/bmj.h5876. PubMed
37. Kopec JA, Finès P, Manuel DG, et al. Validation of population-based disease simulation models: a review of concepts and methods. BMC Public Health. 2010;10(1):710. doi: 10.1186/1471-2458-10-710. PubMed
38. Smith EE, Shobha N, Dai D, et al. Risk score for in-hospital ischemic stroke mortality derived and validated within the Get With The Guidelines-Stroke Program. Circulation. 2010;122(15):1496-1504. doi: 10.1161/CIRCULATIONAHA.109.932822. PubMed
39. Smith EE, Shobha N, Dai D, et al. A risk score for in-hospital death in patients admitted with ischemic or hemorrhagic stroke. J Am Heart Assoc. 2013;2(1):e005207. doi: 10.1161/JAHA.112.005207. PubMed
40. Busl KM, Prabhakaran S. Predictors of mortality in nontraumatic subdural hematoma. J Neurosurg. 2013;119(5):1296-1301. doi: 10.3171/2013.4.JNS122236. PubMed
41. Murphy SL, Kochanek KD, Xu J, Heron M. Deaths: final data for 2012. Natl Vital Stat Rep. 2015;63(9):1-117. http://www.ncbi.nlm.nih.gov/pubmed/26759855. Accessed August 31, 2018.
42. Dachs RJ, Burton JH, Joslin J. A user’s guide to the NINDS rt-PA stroke trial database. PLOS Med. 2008;5(5):e113. doi: 10.1371/journal.pmed.0050113. PubMed
43. Ashburner JM, Go AS, Reynolds K, et al. Comparison of frequency and outcome of major gastrointestinal hemorrhage in patients with atrial fibrillation on versus not receiving warfarin therapy (from the ATRIA and ATRIA-CVRN cohorts). Am J Cardiol. 2015;115(1):40-46. doi: 10.1016/j.amjcard.2014.10.006. PubMed
44. Weinstein MC, Siegel JE, Gold MR, Kamlet MS, Russell LB. Recommendations of the panel on cost-effectiveness in health and medicine. JAMA. 1996;276(15):1253-1258. doi: 10.1001/jama.1996.03540150055031. PubMed
Anticoagulation is commonly used in the management of atrial fibrillation to reduce the risk of ischemic stroke. Warfarin and other anticoagulants increase the risk of hemorrhagic complications, including upper gastrointestinal bleeding (UGIB). Following UGIB, management of anticoagulation is highly variable. Many patients permanently discontinue anticoagulation, while others continue without interruption.1-4 Among patients who resume warfarin, different cohorts have measured median times to resumption ranging from four days to 50 days.1-3 Outcomes data are sparse, and clinical guidelines offer little direction.5
Following UGIB, the balance between the risks and benefits of anticoagulation changes over time. Rebleeding risk is highest immediately after the event and declines quickly; therefore, rapid resumption of anticoagulation causes patient harm.3 Meanwhile, the risk of stroke remains constant, and delay in resumption of anticoagulation is associated with increased risk of stroke and death.1 At some point in time following the initial UGIB, the expected harm from bleeding would equal the expected harm from stroke. This time point would represent the optimal time to restart anticoagulation.
Trial data are unlikely to identify the optimal time for restarting anticoagulation. A randomized trial comparing discrete reinitiation times (eg, two weeks vs six weeks) may easily miss the optimal timing. Moreover, because the daily probability of thromboembolic events is low, large numbers of patients would be required to power such a study. In addition, a number of oral anticoagulants are now approved for prevention of thromboembolic stroke in atrial fibrillation, and each drug may have different optimal timing.
In contrast to randomized trials that would be impracticable for addressing this clinical issue, microsimulation modeling can provide granular information regarding the optimal time to restart anticoagulation. Herein, we set out to estimate the expected benefit of reinitiation of warfarin, the most commonly used oral anticoagulant,6 or apixaban, the direct oral anticoagulant with the most favorable risk profile,7 as a function of days after UGIB.
METHODS
We previously described a microsimulation model of anticoagulation among patients with nonvalvular atrial fibrillation (NVAF; hereafter, we refer to this model as the Personalized Anticoagulation Decision-Making Assistance model, or PADMA).8,9 For this study, we extended this model to incorporate the probability of rebleeding following UGIB and include apixaban as an alternative to warfarin. This model begins with a synthetic population following UGIB, the members of which are at varying risk for thromboembolism, recurrent UGIB, and other hemorrhages. For each patient, the model simulates a number of possible events (eg, thromboembolic stroke, intracranial hemorrhage, rebleeding, and other major extracranial hemorrhages) on each day of an acute period of 90 days after hemostasis. Patients who survive until the end of the acute period enter a simulation with annual, rather than daily, cycles. Our model then estimates total quality-adjusted life-years (QALYs) for each patient, discounted to the present. We report the average discounted QALYs produced by the model for the same population if all individuals in our input population were to resume either warfarin or apixaban on a specific day. Input parameters and ranges are summarized in Table 1, a simplified schematic of our model is shown in the Supplemental Appendix, and additional details regarding model structure and assumptions can be found in earlier work.8,9 We simulated from a health system perspective over a lifelong time horizon. All analyses were performed in version 14 of Stata (StataCorp, LLC, College Station, Texas).
Synthetic Population
To generate a population reflective of the comorbidities and age distribution of the US population with NVAF, we merged relevant variables from the National Health and Nutrition Examination Survey (NHANES; 2011-2012), using multiple imputation to correct for missing variables.10 We then bootstrapped to national population estimates by age and sex to arrive at a hypothetical population of the United States.11 Because NHANES does not include atrial fibrillation, we applied sex- and age-specific prevalence rates from the AnTicoagulation and Risk Factors In Atrial Fibrillation study.12 We then calculated commonly used risk scores (CHA2DS2-Vasc and HAS-BLED) for each patient and limited the population to patients with a CHA2DS2-Vasc score of one or greater.13,14 The population resuming apixaban was further limited to patients whose creatinine clearance was 25 mL/min or greater in keeping with the entry criteria in the phase 3 clinical trial on which the medication’s approval was based.15
To estimate patient-specific probability of rebleeding, we generated a Rockall score for each patient.16 Although the discrimination of the Rockall score is limited for individual patients, as with all other tools used to predict rebleeding following UGIB, the Rockall score has demonstrated reasonable calibration across a threefold risk gradient.17-19 International consensus guidelines recommend the Rockall score as one of two risk prediction tools for clinical use in the management of patients with UGIB.20 In addition, because the Rockall score includes some demographic components (five of a possible 11 points), our estimates of rebleeding risk are covariant with other patient-specific risks. We assumed that the endoscopic components of the Rockall score were present in our cohort at the same frequency as in the original derivation and are independent of known patient risk factors.16 For example, 441 out of 4,025 patients in the original Rockall derivation cohort presented with a systolic blood pressure less than 100 mm Hg. We assumed that an independent and random 10.96% of the cohort would present with shock, which confers two points in the Rockall score.
The population was replicated 60 times, with identical copies of the population resuming anticoagulation on each of days 1-60 (where day zero represents hemostasis). Intermediate data regarding our simulated population can be found in the Supplemental Appendix and in prior work.
Event Type, Severity, and Mortality
Each patient in our simulation could sustain several discrete and independent events: ischemic stroke, intracranial hemorrhage, recurrent UGIB, or extracranial major hemorrhage other than recurrent UGIB. As in prior analyses using the PADMA model, we did not consider minor hemorrhagic events.8
The probability of each event was conditional on the corresponding risk scoring system. Patient-specific probability of ischemic stroke was conditional on CHA2DS2-Vasc score.21,22 Patient-specific probability of intracranial hemorrhage was conditional on HAS-BLED score, with the proportions of intracranial hemorrhage of each considered subtype (intracerebral, subarachnoid, or subdural) bootstrapped from previously-published data.21-24 Patient-specific probability of rebleeding was conditional on Rockall score from the combined Rockall and Vreeburg validation cohorts.17 Patient-specific probability of extracranial major hemorrhage was conditional on HAS-BLED score.21 To avoid double-counting of UGIB, we subtracted the baseline risk of UGIB from the overall rate of extracranial major hemorrhages using previously-published data regarding relative frequency and a bootstrapping approach.25
Probability of Rebleeding Over Time
To estimate the decrease in rebleeding risk over time, we searched the Medline database for systematic reviews of recurrent bleeding following UGIB using the strategy detailed in the Supplemental Appendix. Using the interval rates of rebleeding we identified, we calculated implied daily rates of rebleeding at the midpoint of each interval. For example, 39.5% of rebleeding events occurred within three days of hemostasis, implying a daily rate of approximately 13.2% on day two (32 of 81 events over a three-day period). We repeated this process to estimate daily rates at the midpoint of each reported time interval and fitted an exponential decay function.26 Our exponential fitted these datapoints quite well, but we lacked sufficient data to test other survival functions (eg, Gompertz, lognormal, etc.). Our fitted exponential can be expressed as:
P rebleeding = b 0 *exp(b 1 *day)
where b0 = 0.1843 (SE: 0.0136) and b1 = –0.1563 (SE: 0.0188). For example, a mean of 3.9% of rebleeding episodes will occur on day 10 (0.1843 *exp(–0.1563 *10)).
Relative Risks of Events with Anticoagulation
For patients resuming warfarin, the probabilities of each event were adjusted based on patient-specific daily INR. All INRs were assumed to be 1.0 until the day of warfarin reinitiation, after which interpolated trajectories of postinitiation INR measurements were sampled for each patient from an earlier study of clinical warfarin initiation.27 Relative risks of ischemic stroke and hemorrhagic events were calculated based on each day’s INR.
For patients taking apixaban, we assumed that the medication would reach full therapeutic effect one day after reinitiation. Based on available evidence, we applied the relative risks of each event with apixaban compared with warfarin.25
Future Disability and Mortality
Each event in our simulation resulted in hospitalization. Length of stay was sampled for each diagnosis.28 The disutility of hospitalization was estimated based on length of stay.8 Inpatient mortality and future disability were predicted for each event as previously described.8 We assumed that recurrent episodes of UGIB conferred morbidity and mortality identical to extracranial major hemorrhages more broadly.29,30
Disutilities
We used a multiplicative model for disutility with baseline utilities conditional on age and sex.31 Each day after resumption of anticoagulation carried a disutility of 0.012 for warfarin or 0.002 for apixaban, which we assumed to be equivalent to aspirin in disutility.32 Long-term disutility and life expectancy were conditional on modified Rankin Score (mRS).33,34 We discounted all QALYs to day zero using standard exponential discounting and a discount rate centered at 3%. We then computed the average discounted QALYs among the cohort of patients that resumed anticoagulation on each day following the index UGIB.
Sensitivity Analyses and Metamodel
To assess sensitivity to continuously varying input parameters, such as discount rate, the proportion of extracranial major hemorrhages that are upper GI bleeds, and inpatient mortality from extracranial major hemorrhage, we constructed a metamodel (a regression model of our microsimulation results).35 We tested for interactions among input parameters and dropped parameters that were not statistically significant predictors of discounted QALYs from our metamodel. We then tested for interactions between each parameter and day resuming anticoagulation to determine which factors may impact the optimal day of reinitiation. Finally, we used predicted marginal effects from our metamodel to assess the change in optimal day across the ranges of each input parameter when other parameters were held at their medians.
RESULTS
Resuming warfarin on day zero produced the fewest QALYs. With delay in reinitiation of anticoagulation, expected QALYs increased, peaked, and then declined for all scenarios. In our base-case simulation of warfarin, peak utility was achieved by resumption 41 days after the index UGIB. Resumption between days 32 and 51 produced greater than 99.9% of peak utility. In our base-case simulation of apixaban, peak utility was achieved by resumption 32 days after the index UGIB. Resumption between days 21 and 47 produced greater than 99.9% of peak utility. Results for warfarin and apixaban are shown in Figures 1 and 2, respectively.
The optimal day of warfarin reinitiation was most sensitive to CHA2DS2-Vasc scores and varied by around 11 days between a CHA2DS2-Vasc score of one and a CHA2DS2-Vasc score of six (the 5th and 95th percentiles, respectively) when all other parameters are held at their medians. Results were comparatively insensitive to rebleeding risk. Varying Rockall score from two to seven (the 5th and 95th percentiles, respectively) added three days to optimal warfarin resumption. Varying other parameters from the 5th to the 95th percentile (including HAS-BLED score, sex, age, and discount rate) changed expected QALYs but did not change the optimal day of reinitiation of warfarin. Optimal day of reinitiation for warfarin stratified by CHA2DS2-Vasc score is shown in Table 2.
Sensitivity analyses for apixaban produced broadly similar results, but with greater sensitivity to rebleeding risk. Optimal day of reinitiation varied by 15 days over the examined range of CHA2DS2-Vasc scores (Table 2) and by six days over the range of Rockall scores (Supplemental Appendix). Other input parameters, including HAS-BLED score, age, sex, and discount rate, changed expected QALYs and were significant in our metamodel but did not affect the optimal day of reinitiation. Metamodel results for both warfarin and apixaban are included in the Supplemental Appendix.
DISCUSSION
Anticoagulation is frequently prescribed for patients with NVAF, and hemorrhagic complications are common. Although anticoagulants are withheld following hemorrhages, scant evidence to inform the optimal timing of reinitiation is available. In this microsimulation analysis, we found that the optimal time to reinitiate anticoagulation following UGIB is around 41 days for warfarin and around 32 days for apixaban. We have further demonstrated that the optimal timing of reinitiation can vary by nearly two weeks, depending on a patient’s underlying risk of stroke, and that early reinitiation is more sensitive to rebleeding risk than late reinitiation.
Prior work has shown that early reinitiation of anticoagulation leads to higher rates of recurrent hemorrhage while failure to reinitiate anticoagulation is associated with higher rates of stroke and mortality.1-4,36 Our results add to the literature in a number of important ways. First, our model not only confirms that anticoagulation should be restarted but also suggests when this action should be taken. The competing risks of bleeding and stroke have left clinicians with little guidance; we have quantified the clinical reasoning required for the decision to resume anticoagulation. Second, by including the disutility of hospitalization and long-term disability, our model more accurately represents the complex tradeoffs between recurrent hemorrhage and (potentially disabling) stroke than would a comparison of event rates. Third, our model is conditional upon patient risk factors, allowing clinicians to personalize the timing of anticoagulation resumption. Theory would suggest that patients at higher risk of ischemic stroke benefit from earlier resumption of anticoagulation, while patients at higher risk of hemorrhage benefit from delayed reinitiation. We have quantified the extent to which patient-specific risks should change timing. Fourth, we offer a means of improving expected health outcomes that requires little more than appropriate scheduling. Current practice regarding resuming anticoagulation is widely variable. Many patients never resume warfarin, and those that do resume do so after highly varied periods of time.1-5,36 We offer a means of standardizing clinical practice and improving expected patient outcomes.
Interestingly, patient-specific risk of rebleeding had little effect on our primary outcome for warfarin, and a greater effect in our simulation of apixaban. It would seem that rebleeding risk, which decreases roughly exponentially, is sufficiently low by the time period at which warfarin should be resumed that patient-specific hemorrhage risk factors have little impact. Meanwhile, at the shorter post-event intervals at which apixaban can be resumed, both stroke risk and patient-specific bleeding risk are worthy considerations.
Our model is subject to several important limitations. First, our predictions of the optimal day as a function of risk scores can only be as well-calibrated as the input scoring systems. It is intuitive that patients with higher risk of rebleeding benefit from delayed reinitiation, while patients with higher risk of thromboembolic stroke benefit from earlier reinitiation. Still, clinicians seeking to operationalize competing risks through these two scores—or, indeed, any score—should be mindful of their limited calibration and shared variance. In other words, while the optimal day of reinitiation is likely in the range we have predicted and varies to the degree demonstrated here, the optimal day we have predicted for each score is likely overly precise. However, while better-calibrated prediction models would improve the accuracy of our model, we believe ours to be the best estimate of timing given available data and this approach to be the most appropriate way to personalize anticoagulation resumption.
Our simulation of apixaban carries an additional source of potential miscalibration. In the clinical trials that led to their approval, apixaban and other direct oral anticoagulants (DOACs) were compared with warfarin over longer periods of time than the acute period simulated in this work. Over a short period of time, patients treated with more rapidly therapeutic medications (in this case, apixaban) would receive more days of effective therapy compared with a slower-onset medication, such as warfarin. Therefore, the relative risks experienced by patients are likely different over the time period we have simulated compared with those measured over longer periods of time (as in phase 3 clinical trials). Our results for apixaban should be viewed as more limited than our estimates for warfarin. More broadly, simulation analyses are intended to predict overall outcomes that are difficult to measure. While other frameworks to assess model credibility exist, the fact remains that no extant datasets can directly validate our predictions.37
Our findings are limited to patients with NVAF. Anticoagulants are prescribed for a variety of indications with widely varied underlying risks and benefits. Models constructed for these conditions would likely produce different timing for resumption of anticoagulation. Unfortunately, large scale cohort studies to inform such models are lacking. Similarly, we simulated UGIB, and our results should not be generalized to populations with other types of bleeding (eg, intracranial hemorrhage). Again, cohort studies of other types of bleeding would be necessary to understand the risks of anticoagulation over time in such populations.
Higher-quality data regarding risk of rebleeding over time would improve our estimates. Our literature search identified only one systematic review that could be used to estimate the risk of recurrent UGIB over time. These data are not adequate to interrogate other forms this survival curve could take, such as Gompertz or Weibull distributions. Recurrence risk almost certainly declines over time, but how quickly it declines carries additional uncertainty.
Despite these limitations, we believe our results to be the best estimates to date of the optimal time of anticoagulation reinitiation following UGIB. Our findings could help inform clinical practice guidelines and reduce variation in care where current practice guidelines are largely silent. Given the potential ease of implementing scheduling changes, our results represent an opportunity to improve patient outcomes with little resource investment.
In conclusion, after UGIB associated with anticoagulation, our model suggests that warfarin is optimally restarted approximately six weeks following hemostasis and that apixaban is optimally restarted approximately one month following hemostasis. Modest changes to this timing based on probability of thromboembolic stroke are reasonable.
Disclosures
The authors have nothing to disclose.
Funding
The authors received no specific funding for this work.
1. Witt DM, Delate T, Garcia DA, et al. Risk of thromboembolism, recurrent hemorrhage, and death after warfarin therapy interruption for gastrointestinal tract bleeding. Arch Intern Med. 2012;172(19):1484-1491. doi: 10.1001/archinternmed.2012.4261. PubMed
2. Sengupta N, Feuerstein JD, Patwardhan VR, et al. The risks of thromboembolism vs recurrent gastrointestinal bleeding after interruption of systemic anticoagulation in hospitalized inpatients with gastrointestinal bleeding: a prospective study. Am J Gastroenterol. 2015;110(2):328-335. doi: 10.1038/ajg.2014.398. PubMed
3. Qureshi W, Mittal C, Patsias I, et al. Restarting anticoagulation and outcomes after major gastrointestinal bleeding in atrial fibrillation. Am J Cardiol. 2014;113(4):662-668. doi: 10.1016/j.amjcard.2013.10.044. PubMed
4. Milling TJ, Spyropoulos AC. Re-initiation of dabigatran and direct factor Xa antagonists after a major bleed. Am J Emerg Med. 2016;34(11):19-25. doi: 10.1016/j.ajem.2016.09.049. PubMed
5. Brotman DJ, Jaffer AK. Resuming anticoagulation in the first week following gastrointestinal tract hemorrhage. Arch Intern Med. 2012;172(19):1492-1493. doi: 10.1001/archinternmed.2012.4309. PubMed
6. Barnes GD, Lucas E, Alexander GC, Goldberger ZD. National trends in ambulatory oral anticoagulant use. Am J Med. 2015;128(12):1300-5. doi: 10.1016/j.amjmed.2015.05.044. PubMed
7. Noseworthy PA, Yao X, Abraham NS, Sangaralingham LR, McBane RD, Shah ND. Direct comparison of dabigatran, rivaroxaban, and apixaban for effectiveness and safety in nonvalvular atrial fibrillation. Chest. 2016;150(6):1302-1312. doi: 10.1016/j.chest.2016.07.013. PubMed
8. Pappas MA, Barnes GD, Vijan S. Personalizing bridging anticoagulation in patients with nonvalvular atrial fibrillation—a microsimulation analysis. J Gen Intern Med. 2017;32(4):464-470. doi: 10.1007/s11606-016-3932-7. PubMed
9. Pappas MA, Vijan S, Rothberg MB, Singer DE. Reducing age bias in decision analyses of anticoagulation for patients with nonvalvular atrial fibrillation – a microsimulation study. PloS One. 2018;13(7):e0199593. doi: 10.1371/journal.pone.0199593. PubMed
10. National Center for Health Statistics. National Health and Nutrition Examination Survey. https://www.cdc.gov/nchs/nhanes/about_nhanes.htm. Accessed August 30, 2018.
11. United States Census Bureau. Age and sex composition in the United States: 2014. https://www.census.gov/data/tables/2014/demo/age-and-sex/2014-age-sex-composition.html. Accessed August 30, 2018.
12. Go AS, Hylek EM, Phillips KA, et al. Prevalence of diagnosed atrial fibrillation in adults: national implications for rhythm management and stroke prevention: the AnTicoagulation and Risk Factors in Atrial Fibrillation (ATRIA) study. JAMA. 2001;285(18):2370-2375. doi: 10.1001/jama.285.18.2370. PubMed
13. Lip GYH, Nieuwlaat R, Pisters R, Lane DA, Crijns HJGM. Refining clinical risk stratification for predicting stroke and thromboembolism in atrial fibrillation using a novel risk factor-based approach: the euro heart survey on atrial fibrillation. Chest. 2010;137(2):263-272. doi: 10.1378/chest.09-1584. PubMed
14. Pisters R, Lane DA, Nieuwlaat R, de Vos CB, Crijns HJGM, Lip GYH. A novel user-friendly score (HAS-BLED) to assess 1-year risk of major bleeding in patients with atrial fibrillation. Chest. 2010;138(5):1093-1100. doi: 10.1378/chest.10-0134. PubMed
15. Granger CB, Alexander JH, McMurray JJV, et al. Apixaban versus warfarin in patients with atrial fibrillation. N Engl J Med. 2011;365(11):981-992. doi: 10.1056/NEJMoa1107039.
16. Rockall TA, Logan RF, Devlin HB, Northfield TC. Risk assessment after acute upper gastrointestinal haemorrhage. Gut. 1996;38(3):316-321. doi: 10.1136/gut.38.3.316. PubMed
17. Vreeburg EM, Terwee CB, Snel P, et al. Validation of the Rockall risk scoring system in upper gastrointestinal bleeding. Gut. 1999;44(3):331-335. doi: 10.1136/gut.44.3.331. PubMed
18. Enns RA, Gagnon YM, Barkun AN, et al. Validation of the Rockall scoring system for outcomes from non-variceal upper gastrointestinal bleeding in a Canadian setting. World J Gastroenterol. 2006;12(48):7779-7785. doi: 10.3748/wjg.v12.i48.7779. PubMed
19. Stanley AJ, Laine L, Dalton HR, et al. Comparison of risk scoring systems for patients presenting with upper gastrointestinal bleeding: international multicentre prospective study. BMJ. 2017;356:i6432. doi: 10.1136/bmj.i6432. PubMed
20. Barkun AN, Bardou M, Kuipers EJ, et al. International consensus recommendations on the management of patients with nonvariceal upper gastrointestinal bleeding. Ann Intern Med. 2010;152(2):101-113. doi: 10.7326/0003-4819-152-2-201001190-00009. PubMed
21. Friberg L, Rosenqvist M, Lip GYH. Evaluation of risk stratification schemes for ischaemic stroke and bleeding in 182 678 patients with atrial fibrillation: the Swedish atrial fibrillation cohort study. Eur Heart J. 2012;33(12):1500-1510. doi: 10.1093/eurheartj/ehr488. PubMed
22. Friberg L, Rosenqvist M, Lip GYH. Net clinical benefit of warfarin in patients with atrial fibrillation: a report from the Swedish atrial fibrillation cohort study. Circulation. 2012;125(19):2298-2307. doi: 10.1161/CIRCULATIONAHA.111.055079. PubMed
23. Hart RG, Diener HC, Yang S, et al. Intracranial hemorrhage in atrial fibrillation patients during anticoagulation with warfarin or dabigatran: the RE-LY trial. Stroke. 2012;43(6):1511-1517. doi: 10.1161/STROKEAHA.112.650614. PubMed
24. Hankey GJ, Stevens SR, Piccini JP, et al. Intracranial hemorrhage among patients with atrial fibrillation anticoagulated with warfarin or rivaroxaban: the rivaroxaban once daily, oral, direct factor Xa inhibition compared with vitamin K antagonism for prevention of stroke and embolism trial in atrial fibrillation. Stroke. 2014;45(5):1304-1312. doi: 10.1161/STROKEAHA.113.004506. PubMed
25. Eikelboom JW, Wallentin L, Connolly SJ, et al. Risk of bleeding with 2 doses of dabigatran compared with warfarin in older and younger patients with atrial fibrillation : an analysis of the randomized evaluation of long-term anticoagulant therapy (RE-LY trial). Circulation. 2011;123(21):2363-2372. doi: 10.1161/CIRCULATIONAHA.110.004747. PubMed
26. El Ouali S, Barkun A, Martel M, Maggio D. Timing of rebleeding in high-risk peptic ulcer bleeding after successful hemostasis: a systematic review. Can J Gastroenterol Hepatol. 2014;28(10):543-548. doi: 0.1016/S0016-5085(14)60738-1. PubMed
27. Kimmel SE, French B, Kasner SE, et al. A pharmacogenetic versus a clinical algorithm for warfarin dosing. N Engl J Med. 2013;369(24):2283-2293. doi: 10.1056/NEJMoa1310669. PubMed
28. Healthcare Cost and Utilization Project (HCUP), Agency for Healthcare Research and Quality. HCUP Databases. https://www.hcup-us.ahrq.gov/nisoverview.jsp. Accessed August 31, 2018.
29. Guerrouij M, Uppal CS, Alklabi A, Douketis JD. The clinical impact of bleeding during oral anticoagulant therapy: assessment of morbidity, mortality and post-bleed anticoagulant management. J Thromb Thrombolysis. 2011;31(4):419-423. doi: 10.1007/s11239-010-0536-7. PubMed
30. Fang MC, Go AS, Chang Y, et al. Death and disability from warfarin-associated intracranial and extracranial hemorrhages. Am J Med. 2007;120(8):700-705. doi: 10.1016/j.amjmed.2006.07.034. PubMed
31. Guertin JR, Feeny D, Tarride JE. Age- and sex-specific Canadian utility norms, based on the 2013-2014 Canadian Community Health Survey. CMAJ. 2018;190(6):E155-E161. doi: 10.1503/cmaj.170317. PubMed
32. Gage BF, Cardinalli AB, Albers GW, Owens DK. Cost-effectiveness of warfarin and aspirin for prophylaxis of stroke in patients with nonvalvular atrial fibrillation. JAMA. 1995;274(23):1839-1845. doi: 10.1001/jama.1995.03530230025025. PubMed
33. Fang MC, Go AS, Chang Y, et al. Long-term survival after ischemic stroke in patients with atrial fibrillation. Neurology. 2014;82(12):1033-1037. doi: 10.1212/WNL.0000000000000248. PubMed
34. Hong KS, Saver JL. Quantifying the value of stroke disability outcomes: WHO global burden of disease project disability weights for each level of the modified Rankin scale * Supplemental Mathematical Appendix. Stroke. 2009;40(12):3828-3833. doi: 10.1161/STROKEAHA.109.561365. PubMed
35. Jalal H, Dowd B, Sainfort F, Kuntz KM. Linear regression metamodeling as a tool to summarize and present simulation model results. Med Decis Mak. 2013;33(7):880-890. doi: 10.1177/0272989X13492014. PubMed
36. Staerk L, Lip GYH, Olesen JB, et al. Stroke and recurrent haemorrhage associated with antithrombotic treatment after gastrointestinal bleeding in patients with atrial fibrillation: nationwide cohort study. BMJ. 2015;351:h5876. doi: 10.1136/bmj.h5876. PubMed
37. Kopec JA, Finès P, Manuel DG, et al. Validation of population-based disease simulation models: a review of concepts and methods. BMC Public Health. 2010;10(1):710. doi: 10.1186/1471-2458-10-710. PubMed
38. Smith EE, Shobha N, Dai D, et al. Risk score for in-hospital ischemic stroke mortality derived and validated within the Get With The Guidelines-Stroke Program. Circulation. 2010;122(15):1496-1504. doi: 10.1161/CIRCULATIONAHA.109.932822. PubMed
39. Smith EE, Shobha N, Dai D, et al. A risk score for in-hospital death in patients admitted with ischemic or hemorrhagic stroke. J Am Heart Assoc. 2013;2(1):e005207. doi: 10.1161/JAHA.112.005207. PubMed
40. Busl KM, Prabhakaran S. Predictors of mortality in nontraumatic subdural hematoma. J Neurosurg. 2013;119(5):1296-1301. doi: 10.3171/2013.4.JNS122236. PubMed
41. Murphy SL, Kochanek KD, Xu J, Heron M. Deaths: final data for 2012. Natl Vital Stat Rep. 2015;63(9):1-117. http://www.ncbi.nlm.nih.gov/pubmed/26759855. Accessed August 31, 2018.
42. Dachs RJ, Burton JH, Joslin J. A user’s guide to the NINDS rt-PA stroke trial database. PLOS Med. 2008;5(5):e113. doi: 10.1371/journal.pmed.0050113. PubMed
43. Ashburner JM, Go AS, Reynolds K, et al. Comparison of frequency and outcome of major gastrointestinal hemorrhage in patients with atrial fibrillation on versus not receiving warfarin therapy (from the ATRIA and ATRIA-CVRN cohorts). Am J Cardiol. 2015;115(1):40-46. doi: 10.1016/j.amjcard.2014.10.006. PubMed
44. Weinstein MC, Siegel JE, Gold MR, Kamlet MS, Russell LB. Recommendations of the panel on cost-effectiveness in health and medicine. JAMA. 1996;276(15):1253-1258. doi: 10.1001/jama.1996.03540150055031. PubMed
© 2019 Society of Hospital Medicine
Increasing Mobility via In-hospital Ambulation Protocol Delivered by Mobility Technicians: A Pilot Randomized Controlled Trial
Individuals aged 65 years and over represent 13% of the United States population and account for nearly 40% of hospital discharges.1 Bedrest hastens the functional decline of older patients2-5 and is associated with risk of serious complications, such as falls, delirium, venous thrombosis, and skin breakdown.6,7 Ambulation is widely recognized as important for improving hospital outcomes.8-10 Observational studies suggest that increases of 600 steps per day are associated with shortened length of hospital stay.9 However, randomized trials of assisted ambulation have not demonstrated consistent benefit.11-14 As a result, usual care at most hospitals in the United States does not include assisted ambulation. Even when ambulation is ordered, execution of the orders is inconsistent.15-17
Studies have demonstrated the benefits of various exercise protocols for older patients in rehabilitation facilities,18,19 medical intensive care units,20 and medical and surgical wards.13,18,21 These interventions are usually nursing centered; however, assisting patients with ambulation multiple times per day may be a burdensome addition to the myriad responsibilities of nurses.19,22,23 In fact, ambulation orders are the most frequently overlooked nursing task.24
We designed a graded protocol of assisted ambulation implemented by a dedicated patient care nursing assistant (PCNA) multiple times daily to increase patient mobility. The objective of this study was to assess the feasibility and effectiveness of such an intervention for older inpatients. We hypothesized that the intervention would prove feasible and improve hospital outcomes, including less need for inpatient rehabilitation and shorter length of stay.
METHODS
We conducted a single-blind randomized controlled trial of patients aged ≥60 years and admitted as medical inpatients to the Cleveland Clinic Main Campus, a tertiary care center with over 1,440 inpatient beds. The consent form and study protocol were approved by the Cleveland Clinic Institutional Review Board, and the study was registered with ClinicalTrials.gov (NCT02757131).
Patients
All patients who were admitted to study wards for a medical illness and evaluated by Physical Therapy (PT) were eligible for the study. PT evaluations were ordered by the medical team if deemed necessary on the basis of factors, such as age, estimated mobility, and concerns raised by the ancillary staff. All patients who were expected to be discharged to a skilled nursing facility placement or who required home PT received a PT evaluation. Assessment of mobility was documented via Activity Measure for Postacute Care Inpatient Basic Mobility “six-clicks” short form, hereafter abbreviated as “six-clicks.” Based on past experience, patients with scores <16 rarely go home (<20% of the time), and those with scores >20 usually go home regardless of ambulation. Therefore, only patients with scores of 16-20 were invited to participate in the study. Although patients who were not evaluated by PT might also benefit from the intervention, we required a six-clicks score to assess eligibility. The exclusion criteria included anticipated remaining length of stay less than three days, admission under observation status, admission to the intensive care unit (ICU,) patients receiving comfort care measures, and patients with medical conditions precluding ambulation, such as decompensated heart failure or unstable angina.
Randomization
Patients were randomized to “usual care” or “mobility technician” after baseline evaluation using a computerized system. A block randomization scheme with a size of four was used to ensure an approximately equal number of patients per group.
Intervention
Patients randomized to the intervention group were asked to participate in the ambulation protocol outlined by the PT three times daily under the supervision of the mobility technician. The protocol involved four exercise levels (sitting, standing, walking, and stairs), which were implemented depending on the patient’s physical capacity. The mobility technicians, who were PCNAs, were trained by the PT team. PCNAs have no specific degrees or certification. They are taught safe handling techniques during their job orientation, so they already had an understanding of how to transfer and assist a patient with ambulation. The mobility technician training consisted of one four-hour session run by the PT team in the physical therapy department and the nursing unit. The training included safe handling practices and basic mobility, such as transfers from bed to chair, bed to standing, walking with assistance, and walking independently with equipment such as cane, rolling walker, and walking belt. All instruction was demonstrated by the trainer, and the mobility technician was then able to practice. The mobility technician then shadowed the trainer and practiced the techniques under supervision. Competency was assessed by the trainer.
The cohort of patients randomized to “usual care” was not seen by the mobility technicians but was not otherwise restricted in nursing’s baseline ability to execute recommendations placed by the PT team. Compliance with the recommendations is highly variable and dependent on patient acuity during the shift, staffing issues, and competing duties. Cleveland Clinic promotes a “culture of mobility,” and nurses are encouraged to get patients out of bed and assist with ambulation.
Study Instruments—Measures of Mobility
The six-clicks instrument is a tool for measuring basic mobility. It was adapted from the Activity Measures for Post-Acute Care (AM-PAC) instrument.25 Although initially created for self-report in the post-acute care setting, six-clicks has been validated for use by PTs in the acute care setting26 and is currently in use at more than 1,000 US hospitals. Cleveland Clinic PTs have used this measure for routine evaluation since 2011. The instrument has high interrater reliability and can predict discharge disposition.27-29
Each patient was provided with a tracking device (Fitbit) attached at the wrist to record daily steps for measuring mobility. The use of Fitbit has been validated in ambulatory and inpatient settings.30 The device produces step counts within 3% of the observed step count for most patients but may undercount steps in patients with very slow gait.31 The device was provided to each enrollee and collected at discharge.
Variables
Demographic information, comorbid diagnoses, and discharge destination were extracted from the electronic medical record. Information on prehospitalization physical activity level was obtained from the initial PT assessment. Falls were tracked through the safety event reporting system.
Outcomes
The primary outcomes were discharge disposition and hospital length of stay. The secondary outcomes included average steps per day, change in six-clicks score from admission to discharge, inpatient mortality, admission to ICU, falls, deep vein thrombosis, pulmonary embolism, or pneumonia, and readmission within 30 days.
Statistical Analysis
Patient characteristics were summarized as means and standard deviations or medians and interquartile ranges for continuous variables and as frequencies and percentages for categorical variables. The t-test or Wilcoxon rank sum test was applied to compare continuous characteristics between the intervention and control groups. Chi-squared test or Fisher’s exact test was applied to compare categorical characteristics. Given its skewed distribution, the length of stay was log-transformed and compared between the two groups using Student’s t-test. Chi-squared test was used to compare categorical outcomes. The analysis of final six-clicks scores was adjusted for baseline scores, and the least-square estimates are provided. A linear mixed effects model was used to compare the number of daily steps taken because each participant had multiple steps measured. Results were adjusted for prehospital activity. In addition to comparing the total steps taken by each group, we determined the proportion of patients who exceeded a particular threshold by taking the average number of steps per day for all subjects and relating it to home discharge using the Receiver Operating Characteristics (ROC) curve. An optimal cut-off was determined to maximize the Youden index. We also compared the proportion of patients who exceeded 900 steps because this value was previously reported as an important threshold.32 All analyses were conducted using intention-to-treat principles. We also conducted a per-protocol analysis in which we limited the intervention group to those who received at least one assisted ambulation session. A dose-response analysis was also performed, in which patients were categorized as not receiving the therapy, receiving sessions on one or two days, or receiving them on more than two days.
All analyses were conducted using R-studio (Boston, MA). Statistical significance was defined as a P-value < .05. Given that this is a pilot study, the results were not adjusted for multiple comparisons.
RESULTS
Characteristics of patients in the intervention and control groups are shown in Table 1. The patients were mostly white and female, with an average age in the mid-70s (range 61-98). All measures evaluated were not significantly different between the intervention and control groups. However, more patients in the intervention group had a prehospital activity level classified as independent.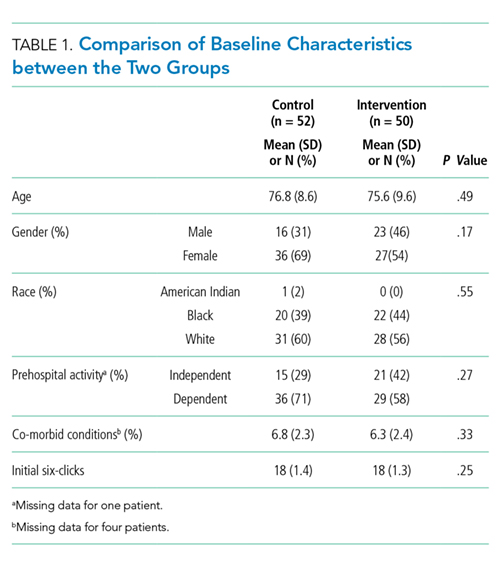
Table 2 demonstrates the feasibility of the intervention. Of patients randomized to the intervention group, 74% were ambulated at least once. Once enrolled, the patients successfully participated in assisted ambulation for about two-thirds of their hospital stay. However, the intervention was delivered for only one-third of the total length of stay because most patients were not enrolled on admission. On average, the mobility technicians made 11 attempts to ambulate each patient and 56% of these attempts were successful. The proportion of unsuccessful attempts did not change over the course of the study. The reasons for unsuccessful attempts included patient refusal (n = 102) or unavailability (n = 68), mobility technicians running out of time (n = 2), and other (n = 12).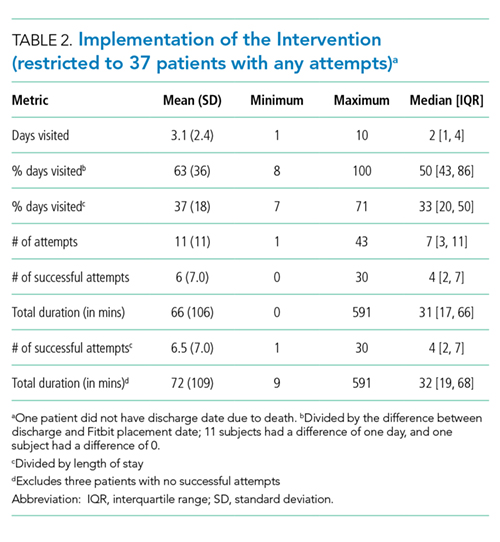
Initially, the mobility technicians were not available on weekends. In addition, they were often reassigned to other duties by their nurse managers, who were dealing with staffing shortages. As the study progressed, we were able to secure the mobility technicians to work seven days per week and to convince the nurse managers that their role should be protected. Consequently, the median number [IQR] of successful attempts increased from 1.5 [0, 2] in the first two months to 3 [0, 5] in the next three months and finally to 5 [1.5, 13] in the final months (P < .002). The median visit duration was 10 minutes, with an interquartile range of 6-15 minutes.
In the intention-to-treat analysis, patients in the intervention group took close to 50% more steps than did the control patients. After adjustment for prehospital activity level, the difference was not statistically significant. The intervention also did not significantly affect the length of stay or discharge disposition (Table 3). In the per protocol analysis, the difference in the step count was significant, even after adjustment. The six-clicks score also significantly increased.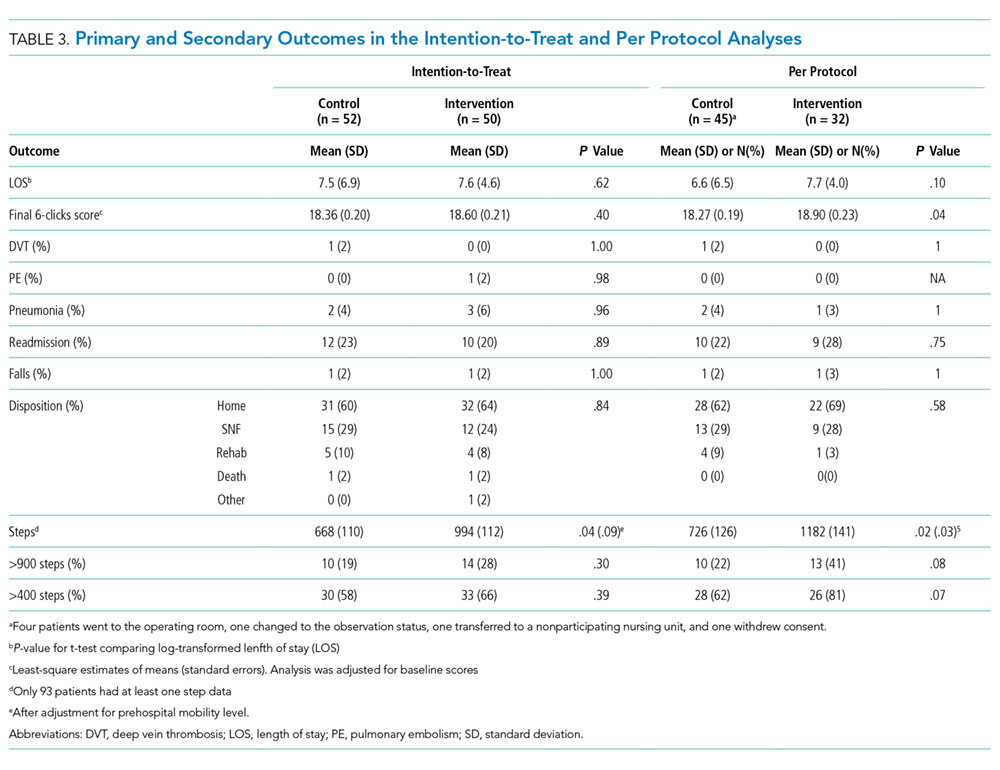
To assess for dose response, we compared outcomes among patients who received no intervention, those who received two or fewer days of intervention, and those who received more than two days of intervention (Table 4). The length of stay was significantly longer in patients with more than two days of intervention, likely reflecting greater opportunities for exposure to the intervention. The longer intervention time significantly increased the six-clicks score.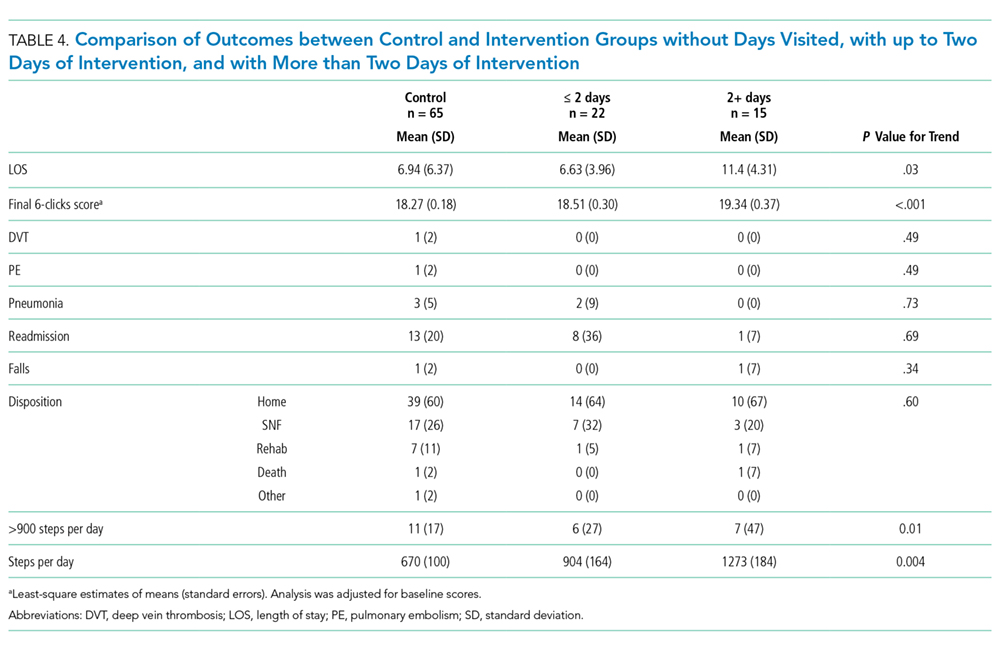
We examined the relationship between steps achieved and discharge disposition. Patients who achieved at least 900 steps more often went home than those who did not (79% vs. 56%, P < .05). The ROC for the model of discharge disposition using steps taken as the only predictor had an area under the curve of 0.67, with optimal discrimination at 411 steps. At a threshold of 400 steps, the model had a sensitivity of 75.9% and a specificity of 51.4%. Patients achieving 400 steps were more likely to go home than those who did not achieve that goal (71% vs. 46%, P =.01). More patients in the intervention group achieved the 900 step goal (28% vs. 19%, P = .30) and the 400 step goal (66% vs. 58%, P = .39), but neither association reached statistical significance.
DISCUSSION
In this pilot study conducted with older medical inpatients, we found that assisted ambulation provided by a dedicated mobility technician was feasible and increased the number of steps taken by patients. Not all patients in the treatment group received the intervention partly due to the fact that the program initially did not include weekends and the mobility technicians were sometimes redirected to other nursing duties. Both issues were addressed during the course of the study. In the per protocol analysis, the intervention increased the average six-clicks score and there was a nonsignificant reduction in the percentage of patients discharged to a rehabilitation facility.
A range of hospital-based mobility interventions have been described. Several of which were complex multidisciplinary interventions that included a mobility component. The compliance rates have ranged from 82% to 93.7%,12,13 although a systematic review noted that many studies do not provide this level of information.11 Interventions were carried out by nursing staff and PT with support from family members and social workers.33-35 Ambulation-specific programs have also relied on nurses and PT13,14,36 and, occasionally, on research assistants to implement assisted ambulation protocols.12,37 A recent study that employed research assistants to deliver inhospital ambulation reported achieving 51.3% of intended walks.37
In contradistinction to previous studies, we created a new role, employing PCNAs as dedicated mobility technicians. We did this for two reasons. First, the approach is less expensive than deploying registered nurses or PTs to ambulate patients and therefore more likely to be adopted by hospitals, especially if it can decrease the cost of an episode of care by avoiding subsequent inpatient rehabilitation. Mobility technicians have no degree or certification requirements and are therefore paid less than nurses or physical therapists. Second, by having a single responsibility, mobility technicians were more likely to engage in their task than nurses, who have competing responsibilities. However, when nurse staffing was short, nurse managers were tempted to recall the PCNAs for other nursing duties. It took time before PCNAs and supervisors prioritized this new responsibility. When they did, the number of attempted walks increased substantially, but the percentage of successful attempts remained constant at 56%, highlighting the difficulty of getting hospitalized patients to walk.
On average, patients who received the intervention engaged in 72 minutes of additional physical activity and averaged 990 steps per day. Observational data suggest patients accrue about 1,100 steps in the day before discharge, with older patients accruing closer to 900.21 One study found that older patients with fewer than 900 steps per day were likely to experience a functional decline.32 We also found that patients who achieved at least 900 steps were more likely to go home. However, we found that a lower threshold, namely, 400 steps, offered better discrimination between patients who go home and those who do not. Future prospective studies are needed to establish the appropriate goal for exercise interventions. A lower step goal could dramatically enhance the efficiency of the intervention.
A Cochrane review found that pooled analysis of multidisciplinary interventions that included exercise, often in the form of walking, achieved a small but significant increase in the proportion of patients discharged to home (RR 1.08, 95%CI 1.03 to 1.14).11 We found no significant change in the discharge disposition, but our study was underpowered for this endpoint. The six-clicks score showed a small but significant change in the per protocol analysis. The six-clicks score has been shown to correlate with discharge disposition,28,29 and an improvement in the score suggests that discharge disposition may be influenced.
The intervention may also not have been implemented for long enough. On average, visits were achieved for one-third of the hospital stay partly because of the delay in PT evaluation, which we required for eligibility. In practice, PT evaluation can occur just a few days before the anticipated discharge. We observed a dose dependent response among patients in the intervention group, suggesting that earlier intervention could be more effective. Earlier intervention might be achieved if the MT performed the six-clicks on potentially eligible patients.
The effects of hospitalization on mobility may be the most pronounced in the long term; one study found that 40% of hospitalized older patients manifested new ADL or IADL disability three months after discharge compared with 31% at discharge.7 Hospital-based mobility interventions may continue to affect subjects’ independence for weeks or months. In one RCT, an inpatient ambulation intervention improved mobility in the community one month after discharge.37 A hospital-based exercise program that included ambulation achieved better functional outcomes one month later.13 One RCT that combined inpatient exercise with outpatient care coordination also decreased readmission rates.34 We found that the intervention did not affect readmission.
This pilot study has several limitations. The sample size was small, and the findings need to be replicated in a larger randomized controlled trial. This is particularly important because the two study arms were not balanced in terms of their prehospital activity. After adjustment for prehospital activity, the differences in the step count in the intention-to-treat analysis were no longer significant. As we adjusted the intervention to hospital workflow, the intervention changed over time. The intention-to-treat analysis may therefore underestimate the effect of the intervention. This work provides a basis for future trial. Finally, discharge disposition depends on a complex interplay of factors, including social factors and preferences, which may not be affected by a mobility intervention.
In summary, an inhospital mobility protocol of attempting ambulation delivered by dedicated mobility technicians three times daily successfully increased the daily step counts and mobility scores of the patients. Studies with a larger sample size are needed to determine whether the proposed approach can affect length of hospital stay, discharge disposition, and overall cost of an episode of care.
Disclosures
Mary Stilphen reports consulting for CreCare and Adeo, which license and distribute AM-PAC short forms, including 6 clicks. All other authors report no conflicts of interest.
Funding
This study was supported by a Research Program Committee grant from the Cleveland Clinic.
1. National Center for Health Statistics. National Hospital Discharge Survey. 2010. PubMed
2. Corcoran PJ. Use it or lose it--the hazards of bed rest and inactivity. West J Med. 1991;154(5):536-538. PubMed
3. Gillick MR, Serrell NA, Gillick LS. Adverse consequences of hospitalization in the elderly. Soc Sci Med. 1982;16(10):1033-1038. doi: 10.1016/0277-9536(82)90175-7. PubMed
4. Hirsch CH, Sommers L, Olsen A, Mullen L, Winograd CH. The natural history of functional morbidity in hospitalized older patients. J Am Geriatr Soc. 1990;38(12):1296-1303. doi: 10.1111/j.1532-5415.1990.tb03451.x. PubMed
5. Zisberg A, Shadmi E, Sinoff G, Gur-Yaish N, Srulovici E, Admi H. Low mobility during hospitalization and functional decline in older adults. J Am Geriatr Soc. 2011;59(2):266-273. doi: 10.1111/j.1532-5415.2010.03276.x. PubMed
6. Heit JA, Silverstein MD, Mohr DN, Petterson TM, O’Fallon WM, Melton LJ, 3rd. Risk factors for deep vein thrombosis and pulmonary embolism: A population-based case-control study. Arch Intern Med. 2000;160(6):809-815. doi: 10.1067/mob.2001.107919. PubMed
7. Sager MA, Franke T, Inouye SK, et al. Functional outcomes of acute medical illness and hospitalization in older persons. Arch Intern Med. 1996;156(6):645-652. doi: 10.1001/archinte.1996.00440060067008. PubMed
8. Campbell AJ, Borrie MJ, Spears GF. Risk factors for falls in a community-based prospective study of people 70 years and older. J Gerontol. 1989;44(4):M112-M117. doi: 10.1093/geronj/44.4.M112. PubMed
9. Fisher SR, Kuo YF, Graham JE, Ottenbacher KJ, Ostir GV. Early ambulation and length of stay in older adults hospitalized for acute illness. Arch Intern Med. 2010;170(21):1942-1943. doi: 0.1001/archinternmed.2010.422. PubMed
10. Graf C. Functional decline in hospitalized older adults. Am J Nurs. 2006;106(1):58-67, quiz 67-58. PubMed
11. de Morton NA, Keating JL, Jeffs K. Exercise for acutely hospitalised older medical patients. Cochrane Database Syst Rev. 2007(1):CD005955. doi: 10.1002/14651858.CD005955. PubMed
12. Jones CT, Lowe AJ, MacGregor L, Brand CA, Tweddle N, Russell DM. A randomised controlled trial of an exercise intervention to reduce functional decline and health service utilisation in the hospitalised elderly. Australas J Ageing. 2006;25(3):126-133. doi: 10.1111/j.1741-6612.2006.00167.x.
13. Siebens H, Aronow H, Edwards D, Ghasemi Z. A randomized controlled trial of exercise to improve outcomes of acute hospitalization in older adults. J Am Geriatr Soc. 2000;48(12):1545-1552. doi: 10.1111/j.1532-5415.2000.tb03862.x. PubMed
14. Mundy LM, Leet TL, Darst K, Schnitzler MA, Dunagan WC. Early mobilization of patients hospitalized with community-acquired pneumonia. Chest. 2003;124(3):883-889. doi: 10.1378/chest.124.3.883. PubMed
15. Brown CJ, Redden DT, Flood KL, Allman RM. The underrecognized epidemic of low mobility during hospitalization of older adults. J Am Geriatr Soc. 2009;57(9):1660-1665. doi: 10.1111/j.1532-5415.2009.02393.x. PubMed
16. Callen BL, Mahoney JE, Grieves CB, Wells TJ, Enloe M. Frequency of hallway ambulation by hospitalized older adults on medical units of an academic hospital. Geriatr Nurs. 2004;25(4):212-217. doi: 10.1016/j.gerinurse.2004.06.016. PubMed
17. Fisher SR, Goodwin JS, Protas EJ, et al. Ambulatory activity of older adults hospitalized with acute medical illness. J Am Geriatr Soc. 2011;59(1):91-95. doi: 10.1111/j.1532-5415.2010.03202.x. PubMed
18. McVey LJ, Becker PM, Saltz CC, Feussner JR, Cohen HJ. Effect of a geriatric consultation team on functional status of elderly hospitalized patients: A randomized, controlled clinical trial. Ann Intern Med. 1989;110(1):79-84. doi: PubMed
19. Said CM, Morris ME, Woodward M, Churilov L, Bernhardt J. Enhancing physical activity in older adults receiving hospital based rehabilitation: A phase II feasibility study. BMC Geriatr. 2012;12:26. doi: 10.1186/1471-2318-12-26. PubMed
20. Timmerman RA. A mobility protocol for critically ill adults. Dimens Crit Care Nurs. 2007;26(5):175-179; quiz 180-171. doi: 10.1097/01.DCC.0000286816.40570.da. PubMed
21. Sallis R, Roddy-Sturm Y, Chijioke E, et al. Stepping toward discharge: Level of ambulation in hospitalized patients. J Hosp Med. 2015;10(6):384-389. doi: 10.1002/jhm.2343. PubMed
22. Inouye SK, Wagner DR, Acampora D, Horwitz RI, Cooney LM, Jr., Tinetii ME. A controlled trial of a nursing-centered intervention in hospitalized elderly medical patients: The yale geriatric care program. J Am Geriatr Soc. 1993;41(12):1353-1360. doi: 10.1111/j.1532-5415.1993.tb06487.x. PubMed
23. Kalisch BJ, Landstrom GL, Hinshaw AS. Missed nursing care: A concept analysis. J Adv Nurs. 2009;65(7):1509-1517. doi: 10.1111/j.1365-2648.2009.05027.x. PubMed
24. Kalisch BJ, Tschannen D, Lee H, Friese CR. Hospital variation in missed nursing care. Am J Med Qual. 2011;26(4):291-299. doi: 10.1177/1062860610395929. PubMed
25. Haley SM, Coster WJ, Andres PL, et al. Activity outcome measurement for postacute care. Med Care. 2004;42(1 Suppl):I49-161. doi: 10.1097/01.mlr.0000103520.43902.6c. PubMed
26. Jette DU, Stilphen M, Ranganathan VK, Passek SD, Frost FS, Jette AM. Validity of the AM-PAC “6-Clicks” inpatient daily activity and basic mobility short forms. Phys Ther. 2014;94(3):379-391. doi: 10.2522/ptj.20130199. PubMed
27. Jette DU, Stilphen M, Ranganathan VK, Passek S, Frost FS, Jette AM. Interrater reliability of AM-PAC 6-Clicks” basic mobility and daily activity short forms. Phys Ther. 2015;95(5):758-766. doi: 10.2522/ptj.20140174. PubMed
28. Jette DU, Stilphen M, Ranganathan VK, Passek SD, Frost FS, Jette AM. AM-PAC “6-Clicks” functional assessment scores predict acute care hospital discharge destination. Phys Ther. 2014;94(9):1252-1261. doi: 10.2522/ptj.20130359. PubMed
29. Menendez ME, Schumacher CS, Ring D, Freiberg AA, Rubash HE, Kwon YM. Does “6-Clicks” day 1 postoperative mobility score predict discharge disposition after total hip and knee arthroplasties? J Arthroplasty. 2016;31(9):1916-1920. doi: 10.1016/j.arth.2016.02.017. PubMed
30. Feehan LM, Geldman J, Sayre EC, et al. Accuracy of fitbit devices: Systematic review and narrative syntheses of quantitative data. JMIR Mhealth Uhealth. 2018;6(8):e10527-e10527. doi: 10.2196/10527. PubMed
31. Treacy D, Hassett L, Schurr K, Chagpar S, Paul SS, Sherrington C. Validity of different activity monitors to count steps in an inpatient rehabilitation setting. Phys Ther. 2017;97(5):581-588. doi: 10.1093/ptj/pzx010. PubMed
32. Agmon M, Zisberg A, Gil E, Rand D, Gur-Yaish N, Azriel M. Association between 900 steps a day and functional decline in older hospitalized patients. JAMA Intern Med. 2017;177(2):272-274. doi: 10.1001/jamainternmed.2016.7266. PubMed
33. Counsell SR, Holder CM, Liebenauer LL, et al. Effects of a multicomponent intervention on functional outcomes and process of care in hospitalized older patients: a randomized controlled trial of Acute Care for Elders (ACE) in a community hospital. J Am Geriatr Soc. 2000;48(12):1572-1581. doi: 10.1111/j.1532-5415.2000.tb03866.x. PubMed
34. Courtney M, Edwards H, Chang A, Parker A, Finlayson K, Hamilton K. Fewer emergency readmissions and better quality of life for older adults at risk of hospital readmission: a randomized controlled trial to determine the effectiveness of a 24-week exercise and telephone follow-up program. J Am Geriatr Soc. 2009;57(3):395-402. doi: 10.1111/j.1532-5415.2009.02138.x. PubMed
35. Landefeld CS, Palmer RM, Kresevic DM, Fortinsky RH, Kowal J. A randomized trial of care in a hospital medical unit especially designed to improve the functional outcomes of acutely ill older patients. N Engl J Med. 1995;332(20):1338-1344. doi: 10.1056/NEJM199505183322006. PubMed
36. Hoyer EH, Friedman M, Lavezza A, et al. Promoting mobility and reducing length of stay in hospitalized general medicine patients: A quality-improvement project. J Hosp Med. 2016;11(5):341-347. doi: 10.1002/jhm.2546. PubMed
37. Brown CJ, Foley KT, Lowman JD, Jr., et al. comparison of posthospitalization function and community mobility in hospital mobility program and usual care patients: a randomized clinical trial. JAMA Intern Med. 2016;176(7):921-927. doi: 10.1001/jamainternmed.2016.1870. PubMed
Individuals aged 65 years and over represent 13% of the United States population and account for nearly 40% of hospital discharges.1 Bedrest hastens the functional decline of older patients2-5 and is associated with risk of serious complications, such as falls, delirium, venous thrombosis, and skin breakdown.6,7 Ambulation is widely recognized as important for improving hospital outcomes.8-10 Observational studies suggest that increases of 600 steps per day are associated with shortened length of hospital stay.9 However, randomized trials of assisted ambulation have not demonstrated consistent benefit.11-14 As a result, usual care at most hospitals in the United States does not include assisted ambulation. Even when ambulation is ordered, execution of the orders is inconsistent.15-17
Studies have demonstrated the benefits of various exercise protocols for older patients in rehabilitation facilities,18,19 medical intensive care units,20 and medical and surgical wards.13,18,21 These interventions are usually nursing centered; however, assisting patients with ambulation multiple times per day may be a burdensome addition to the myriad responsibilities of nurses.19,22,23 In fact, ambulation orders are the most frequently overlooked nursing task.24
We designed a graded protocol of assisted ambulation implemented by a dedicated patient care nursing assistant (PCNA) multiple times daily to increase patient mobility. The objective of this study was to assess the feasibility and effectiveness of such an intervention for older inpatients. We hypothesized that the intervention would prove feasible and improve hospital outcomes, including less need for inpatient rehabilitation and shorter length of stay.
METHODS
We conducted a single-blind randomized controlled trial of patients aged ≥60 years and admitted as medical inpatients to the Cleveland Clinic Main Campus, a tertiary care center with over 1,440 inpatient beds. The consent form and study protocol were approved by the Cleveland Clinic Institutional Review Board, and the study was registered with ClinicalTrials.gov (NCT02757131).
Patients
All patients who were admitted to study wards for a medical illness and evaluated by Physical Therapy (PT) were eligible for the study. PT evaluations were ordered by the medical team if deemed necessary on the basis of factors, such as age, estimated mobility, and concerns raised by the ancillary staff. All patients who were expected to be discharged to a skilled nursing facility placement or who required home PT received a PT evaluation. Assessment of mobility was documented via Activity Measure for Postacute Care Inpatient Basic Mobility “six-clicks” short form, hereafter abbreviated as “six-clicks.” Based on past experience, patients with scores <16 rarely go home (<20% of the time), and those with scores >20 usually go home regardless of ambulation. Therefore, only patients with scores of 16-20 were invited to participate in the study. Although patients who were not evaluated by PT might also benefit from the intervention, we required a six-clicks score to assess eligibility. The exclusion criteria included anticipated remaining length of stay less than three days, admission under observation status, admission to the intensive care unit (ICU,) patients receiving comfort care measures, and patients with medical conditions precluding ambulation, such as decompensated heart failure or unstable angina.
Randomization
Patients were randomized to “usual care” or “mobility technician” after baseline evaluation using a computerized system. A block randomization scheme with a size of four was used to ensure an approximately equal number of patients per group.
Intervention
Patients randomized to the intervention group were asked to participate in the ambulation protocol outlined by the PT three times daily under the supervision of the mobility technician. The protocol involved four exercise levels (sitting, standing, walking, and stairs), which were implemented depending on the patient’s physical capacity. The mobility technicians, who were PCNAs, were trained by the PT team. PCNAs have no specific degrees or certification. They are taught safe handling techniques during their job orientation, so they already had an understanding of how to transfer and assist a patient with ambulation. The mobility technician training consisted of one four-hour session run by the PT team in the physical therapy department and the nursing unit. The training included safe handling practices and basic mobility, such as transfers from bed to chair, bed to standing, walking with assistance, and walking independently with equipment such as cane, rolling walker, and walking belt. All instruction was demonstrated by the trainer, and the mobility technician was then able to practice. The mobility technician then shadowed the trainer and practiced the techniques under supervision. Competency was assessed by the trainer.
The cohort of patients randomized to “usual care” was not seen by the mobility technicians but was not otherwise restricted in nursing’s baseline ability to execute recommendations placed by the PT team. Compliance with the recommendations is highly variable and dependent on patient acuity during the shift, staffing issues, and competing duties. Cleveland Clinic promotes a “culture of mobility,” and nurses are encouraged to get patients out of bed and assist with ambulation.
Study Instruments—Measures of Mobility
The six-clicks instrument is a tool for measuring basic mobility. It was adapted from the Activity Measures for Post-Acute Care (AM-PAC) instrument.25 Although initially created for self-report in the post-acute care setting, six-clicks has been validated for use by PTs in the acute care setting26 and is currently in use at more than 1,000 US hospitals. Cleveland Clinic PTs have used this measure for routine evaluation since 2011. The instrument has high interrater reliability and can predict discharge disposition.27-29
Each patient was provided with a tracking device (Fitbit) attached at the wrist to record daily steps for measuring mobility. The use of Fitbit has been validated in ambulatory and inpatient settings.30 The device produces step counts within 3% of the observed step count for most patients but may undercount steps in patients with very slow gait.31 The device was provided to each enrollee and collected at discharge.
Variables
Demographic information, comorbid diagnoses, and discharge destination were extracted from the electronic medical record. Information on prehospitalization physical activity level was obtained from the initial PT assessment. Falls were tracked through the safety event reporting system.
Outcomes
The primary outcomes were discharge disposition and hospital length of stay. The secondary outcomes included average steps per day, change in six-clicks score from admission to discharge, inpatient mortality, admission to ICU, falls, deep vein thrombosis, pulmonary embolism, or pneumonia, and readmission within 30 days.
Statistical Analysis
Patient characteristics were summarized as means and standard deviations or medians and interquartile ranges for continuous variables and as frequencies and percentages for categorical variables. The t-test or Wilcoxon rank sum test was applied to compare continuous characteristics between the intervention and control groups. Chi-squared test or Fisher’s exact test was applied to compare categorical characteristics. Given its skewed distribution, the length of stay was log-transformed and compared between the two groups using Student’s t-test. Chi-squared test was used to compare categorical outcomes. The analysis of final six-clicks scores was adjusted for baseline scores, and the least-square estimates are provided. A linear mixed effects model was used to compare the number of daily steps taken because each participant had multiple steps measured. Results were adjusted for prehospital activity. In addition to comparing the total steps taken by each group, we determined the proportion of patients who exceeded a particular threshold by taking the average number of steps per day for all subjects and relating it to home discharge using the Receiver Operating Characteristics (ROC) curve. An optimal cut-off was determined to maximize the Youden index. We also compared the proportion of patients who exceeded 900 steps because this value was previously reported as an important threshold.32 All analyses were conducted using intention-to-treat principles. We also conducted a per-protocol analysis in which we limited the intervention group to those who received at least one assisted ambulation session. A dose-response analysis was also performed, in which patients were categorized as not receiving the therapy, receiving sessions on one or two days, or receiving them on more than two days.
All analyses were conducted using R-studio (Boston, MA). Statistical significance was defined as a P-value < .05. Given that this is a pilot study, the results were not adjusted for multiple comparisons.
RESULTS
Characteristics of patients in the intervention and control groups are shown in Table 1. The patients were mostly white and female, with an average age in the mid-70s (range 61-98). All measures evaluated were not significantly different between the intervention and control groups. However, more patients in the intervention group had a prehospital activity level classified as independent.
Table 2 demonstrates the feasibility of the intervention. Of patients randomized to the intervention group, 74% were ambulated at least once. Once enrolled, the patients successfully participated in assisted ambulation for about two-thirds of their hospital stay. However, the intervention was delivered for only one-third of the total length of stay because most patients were not enrolled on admission. On average, the mobility technicians made 11 attempts to ambulate each patient and 56% of these attempts were successful. The proportion of unsuccessful attempts did not change over the course of the study. The reasons for unsuccessful attempts included patient refusal (n = 102) or unavailability (n = 68), mobility technicians running out of time (n = 2), and other (n = 12).
Initially, the mobility technicians were not available on weekends. In addition, they were often reassigned to other duties by their nurse managers, who were dealing with staffing shortages. As the study progressed, we were able to secure the mobility technicians to work seven days per week and to convince the nurse managers that their role should be protected. Consequently, the median number [IQR] of successful attempts increased from 1.5 [0, 2] in the first two months to 3 [0, 5] in the next three months and finally to 5 [1.5, 13] in the final months (P < .002). The median visit duration was 10 minutes, with an interquartile range of 6-15 minutes.
In the intention-to-treat analysis, patients in the intervention group took close to 50% more steps than did the control patients. After adjustment for prehospital activity level, the difference was not statistically significant. The intervention also did not significantly affect the length of stay or discharge disposition (Table 3). In the per protocol analysis, the difference in the step count was significant, even after adjustment. The six-clicks score also significantly increased.
To assess for dose response, we compared outcomes among patients who received no intervention, those who received two or fewer days of intervention, and those who received more than two days of intervention (Table 4). The length of stay was significantly longer in patients with more than two days of intervention, likely reflecting greater opportunities for exposure to the intervention. The longer intervention time significantly increased the six-clicks score.
We examined the relationship between steps achieved and discharge disposition. Patients who achieved at least 900 steps more often went home than those who did not (79% vs. 56%, P < .05). The ROC for the model of discharge disposition using steps taken as the only predictor had an area under the curve of 0.67, with optimal discrimination at 411 steps. At a threshold of 400 steps, the model had a sensitivity of 75.9% and a specificity of 51.4%. Patients achieving 400 steps were more likely to go home than those who did not achieve that goal (71% vs. 46%, P =.01). More patients in the intervention group achieved the 900 step goal (28% vs. 19%, P = .30) and the 400 step goal (66% vs. 58%, P = .39), but neither association reached statistical significance.
DISCUSSION
In this pilot study conducted with older medical inpatients, we found that assisted ambulation provided by a dedicated mobility technician was feasible and increased the number of steps taken by patients. Not all patients in the treatment group received the intervention partly due to the fact that the program initially did not include weekends and the mobility technicians were sometimes redirected to other nursing duties. Both issues were addressed during the course of the study. In the per protocol analysis, the intervention increased the average six-clicks score and there was a nonsignificant reduction in the percentage of patients discharged to a rehabilitation facility.
A range of hospital-based mobility interventions have been described. Several of which were complex multidisciplinary interventions that included a mobility component. The compliance rates have ranged from 82% to 93.7%,12,13 although a systematic review noted that many studies do not provide this level of information.11 Interventions were carried out by nursing staff and PT with support from family members and social workers.33-35 Ambulation-specific programs have also relied on nurses and PT13,14,36 and, occasionally, on research assistants to implement assisted ambulation protocols.12,37 A recent study that employed research assistants to deliver inhospital ambulation reported achieving 51.3% of intended walks.37
In contradistinction to previous studies, we created a new role, employing PCNAs as dedicated mobility technicians. We did this for two reasons. First, the approach is less expensive than deploying registered nurses or PTs to ambulate patients and therefore more likely to be adopted by hospitals, especially if it can decrease the cost of an episode of care by avoiding subsequent inpatient rehabilitation. Mobility technicians have no degree or certification requirements and are therefore paid less than nurses or physical therapists. Second, by having a single responsibility, mobility technicians were more likely to engage in their task than nurses, who have competing responsibilities. However, when nurse staffing was short, nurse managers were tempted to recall the PCNAs for other nursing duties. It took time before PCNAs and supervisors prioritized this new responsibility. When they did, the number of attempted walks increased substantially, but the percentage of successful attempts remained constant at 56%, highlighting the difficulty of getting hospitalized patients to walk.
On average, patients who received the intervention engaged in 72 minutes of additional physical activity and averaged 990 steps per day. Observational data suggest patients accrue about 1,100 steps in the day before discharge, with older patients accruing closer to 900.21 One study found that older patients with fewer than 900 steps per day were likely to experience a functional decline.32 We also found that patients who achieved at least 900 steps were more likely to go home. However, we found that a lower threshold, namely, 400 steps, offered better discrimination between patients who go home and those who do not. Future prospective studies are needed to establish the appropriate goal for exercise interventions. A lower step goal could dramatically enhance the efficiency of the intervention.
A Cochrane review found that pooled analysis of multidisciplinary interventions that included exercise, often in the form of walking, achieved a small but significant increase in the proportion of patients discharged to home (RR 1.08, 95%CI 1.03 to 1.14).11 We found no significant change in the discharge disposition, but our study was underpowered for this endpoint. The six-clicks score showed a small but significant change in the per protocol analysis. The six-clicks score has been shown to correlate with discharge disposition,28,29 and an improvement in the score suggests that discharge disposition may be influenced.
The intervention may also not have been implemented for long enough. On average, visits were achieved for one-third of the hospital stay partly because of the delay in PT evaluation, which we required for eligibility. In practice, PT evaluation can occur just a few days before the anticipated discharge. We observed a dose dependent response among patients in the intervention group, suggesting that earlier intervention could be more effective. Earlier intervention might be achieved if the MT performed the six-clicks on potentially eligible patients.
The effects of hospitalization on mobility may be the most pronounced in the long term; one study found that 40% of hospitalized older patients manifested new ADL or IADL disability three months after discharge compared with 31% at discharge.7 Hospital-based mobility interventions may continue to affect subjects’ independence for weeks or months. In one RCT, an inpatient ambulation intervention improved mobility in the community one month after discharge.37 A hospital-based exercise program that included ambulation achieved better functional outcomes one month later.13 One RCT that combined inpatient exercise with outpatient care coordination also decreased readmission rates.34 We found that the intervention did not affect readmission.
This pilot study has several limitations. The sample size was small, and the findings need to be replicated in a larger randomized controlled trial. This is particularly important because the two study arms were not balanced in terms of their prehospital activity. After adjustment for prehospital activity, the differences in the step count in the intention-to-treat analysis were no longer significant. As we adjusted the intervention to hospital workflow, the intervention changed over time. The intention-to-treat analysis may therefore underestimate the effect of the intervention. This work provides a basis for future trial. Finally, discharge disposition depends on a complex interplay of factors, including social factors and preferences, which may not be affected by a mobility intervention.
In summary, an inhospital mobility protocol of attempting ambulation delivered by dedicated mobility technicians three times daily successfully increased the daily step counts and mobility scores of the patients. Studies with a larger sample size are needed to determine whether the proposed approach can affect length of hospital stay, discharge disposition, and overall cost of an episode of care.
Disclosures
Mary Stilphen reports consulting for CreCare and Adeo, which license and distribute AM-PAC short forms, including 6 clicks. All other authors report no conflicts of interest.
Funding
This study was supported by a Research Program Committee grant from the Cleveland Clinic.
1. National Center for Health Statistics. National Hospital Discharge Survey. 2010. PubMed
2. Corcoran PJ. Use it or lose it--the hazards of bed rest and inactivity. West J Med. 1991;154(5):536-538. PubMed
3. Gillick MR, Serrell NA, Gillick LS. Adverse consequences of hospitalization in the elderly. Soc Sci Med. 1982;16(10):1033-1038. doi: 10.1016/0277-9536(82)90175-7. PubMed
4. Hirsch CH, Sommers L, Olsen A, Mullen L, Winograd CH. The natural history of functional morbidity in hospitalized older patients. J Am Geriatr Soc. 1990;38(12):1296-1303. doi: 10.1111/j.1532-5415.1990.tb03451.x. PubMed
5. Zisberg A, Shadmi E, Sinoff G, Gur-Yaish N, Srulovici E, Admi H. Low mobility during hospitalization and functional decline in older adults. J Am Geriatr Soc. 2011;59(2):266-273. doi: 10.1111/j.1532-5415.2010.03276.x. PubMed
6. Heit JA, Silverstein MD, Mohr DN, Petterson TM, O’Fallon WM, Melton LJ, 3rd. Risk factors for deep vein thrombosis and pulmonary embolism: A population-based case-control study. Arch Intern Med. 2000;160(6):809-815. doi: 10.1067/mob.2001.107919. PubMed
7. Sager MA, Franke T, Inouye SK, et al. Functional outcomes of acute medical illness and hospitalization in older persons. Arch Intern Med. 1996;156(6):645-652. doi: 10.1001/archinte.1996.00440060067008. PubMed
8. Campbell AJ, Borrie MJ, Spears GF. Risk factors for falls in a community-based prospective study of people 70 years and older. J Gerontol. 1989;44(4):M112-M117. doi: 10.1093/geronj/44.4.M112. PubMed
9. Fisher SR, Kuo YF, Graham JE, Ottenbacher KJ, Ostir GV. Early ambulation and length of stay in older adults hospitalized for acute illness. Arch Intern Med. 2010;170(21):1942-1943. doi: 0.1001/archinternmed.2010.422. PubMed
10. Graf C. Functional decline in hospitalized older adults. Am J Nurs. 2006;106(1):58-67, quiz 67-58. PubMed
11. de Morton NA, Keating JL, Jeffs K. Exercise for acutely hospitalised older medical patients. Cochrane Database Syst Rev. 2007(1):CD005955. doi: 10.1002/14651858.CD005955. PubMed
12. Jones CT, Lowe AJ, MacGregor L, Brand CA, Tweddle N, Russell DM. A randomised controlled trial of an exercise intervention to reduce functional decline and health service utilisation in the hospitalised elderly. Australas J Ageing. 2006;25(3):126-133. doi: 10.1111/j.1741-6612.2006.00167.x.
13. Siebens H, Aronow H, Edwards D, Ghasemi Z. A randomized controlled trial of exercise to improve outcomes of acute hospitalization in older adults. J Am Geriatr Soc. 2000;48(12):1545-1552. doi: 10.1111/j.1532-5415.2000.tb03862.x. PubMed
14. Mundy LM, Leet TL, Darst K, Schnitzler MA, Dunagan WC. Early mobilization of patients hospitalized with community-acquired pneumonia. Chest. 2003;124(3):883-889. doi: 10.1378/chest.124.3.883. PubMed
15. Brown CJ, Redden DT, Flood KL, Allman RM. The underrecognized epidemic of low mobility during hospitalization of older adults. J Am Geriatr Soc. 2009;57(9):1660-1665. doi: 10.1111/j.1532-5415.2009.02393.x. PubMed
16. Callen BL, Mahoney JE, Grieves CB, Wells TJ, Enloe M. Frequency of hallway ambulation by hospitalized older adults on medical units of an academic hospital. Geriatr Nurs. 2004;25(4):212-217. doi: 10.1016/j.gerinurse.2004.06.016. PubMed
17. Fisher SR, Goodwin JS, Protas EJ, et al. Ambulatory activity of older adults hospitalized with acute medical illness. J Am Geriatr Soc. 2011;59(1):91-95. doi: 10.1111/j.1532-5415.2010.03202.x. PubMed
18. McVey LJ, Becker PM, Saltz CC, Feussner JR, Cohen HJ. Effect of a geriatric consultation team on functional status of elderly hospitalized patients: A randomized, controlled clinical trial. Ann Intern Med. 1989;110(1):79-84. doi: PubMed
19. Said CM, Morris ME, Woodward M, Churilov L, Bernhardt J. Enhancing physical activity in older adults receiving hospital based rehabilitation: A phase II feasibility study. BMC Geriatr. 2012;12:26. doi: 10.1186/1471-2318-12-26. PubMed
20. Timmerman RA. A mobility protocol for critically ill adults. Dimens Crit Care Nurs. 2007;26(5):175-179; quiz 180-171. doi: 10.1097/01.DCC.0000286816.40570.da. PubMed
21. Sallis R, Roddy-Sturm Y, Chijioke E, et al. Stepping toward discharge: Level of ambulation in hospitalized patients. J Hosp Med. 2015;10(6):384-389. doi: 10.1002/jhm.2343. PubMed
22. Inouye SK, Wagner DR, Acampora D, Horwitz RI, Cooney LM, Jr., Tinetii ME. A controlled trial of a nursing-centered intervention in hospitalized elderly medical patients: The yale geriatric care program. J Am Geriatr Soc. 1993;41(12):1353-1360. doi: 10.1111/j.1532-5415.1993.tb06487.x. PubMed
23. Kalisch BJ, Landstrom GL, Hinshaw AS. Missed nursing care: A concept analysis. J Adv Nurs. 2009;65(7):1509-1517. doi: 10.1111/j.1365-2648.2009.05027.x. PubMed
24. Kalisch BJ, Tschannen D, Lee H, Friese CR. Hospital variation in missed nursing care. Am J Med Qual. 2011;26(4):291-299. doi: 10.1177/1062860610395929. PubMed
25. Haley SM, Coster WJ, Andres PL, et al. Activity outcome measurement for postacute care. Med Care. 2004;42(1 Suppl):I49-161. doi: 10.1097/01.mlr.0000103520.43902.6c. PubMed
26. Jette DU, Stilphen M, Ranganathan VK, Passek SD, Frost FS, Jette AM. Validity of the AM-PAC “6-Clicks” inpatient daily activity and basic mobility short forms. Phys Ther. 2014;94(3):379-391. doi: 10.2522/ptj.20130199. PubMed
27. Jette DU, Stilphen M, Ranganathan VK, Passek S, Frost FS, Jette AM. Interrater reliability of AM-PAC 6-Clicks” basic mobility and daily activity short forms. Phys Ther. 2015;95(5):758-766. doi: 10.2522/ptj.20140174. PubMed
28. Jette DU, Stilphen M, Ranganathan VK, Passek SD, Frost FS, Jette AM. AM-PAC “6-Clicks” functional assessment scores predict acute care hospital discharge destination. Phys Ther. 2014;94(9):1252-1261. doi: 10.2522/ptj.20130359. PubMed
29. Menendez ME, Schumacher CS, Ring D, Freiberg AA, Rubash HE, Kwon YM. Does “6-Clicks” day 1 postoperative mobility score predict discharge disposition after total hip and knee arthroplasties? J Arthroplasty. 2016;31(9):1916-1920. doi: 10.1016/j.arth.2016.02.017. PubMed
30. Feehan LM, Geldman J, Sayre EC, et al. Accuracy of fitbit devices: Systematic review and narrative syntheses of quantitative data. JMIR Mhealth Uhealth. 2018;6(8):e10527-e10527. doi: 10.2196/10527. PubMed
31. Treacy D, Hassett L, Schurr K, Chagpar S, Paul SS, Sherrington C. Validity of different activity monitors to count steps in an inpatient rehabilitation setting. Phys Ther. 2017;97(5):581-588. doi: 10.1093/ptj/pzx010. PubMed
32. Agmon M, Zisberg A, Gil E, Rand D, Gur-Yaish N, Azriel M. Association between 900 steps a day and functional decline in older hospitalized patients. JAMA Intern Med. 2017;177(2):272-274. doi: 10.1001/jamainternmed.2016.7266. PubMed
33. Counsell SR, Holder CM, Liebenauer LL, et al. Effects of a multicomponent intervention on functional outcomes and process of care in hospitalized older patients: a randomized controlled trial of Acute Care for Elders (ACE) in a community hospital. J Am Geriatr Soc. 2000;48(12):1572-1581. doi: 10.1111/j.1532-5415.2000.tb03866.x. PubMed
34. Courtney M, Edwards H, Chang A, Parker A, Finlayson K, Hamilton K. Fewer emergency readmissions and better quality of life for older adults at risk of hospital readmission: a randomized controlled trial to determine the effectiveness of a 24-week exercise and telephone follow-up program. J Am Geriatr Soc. 2009;57(3):395-402. doi: 10.1111/j.1532-5415.2009.02138.x. PubMed
35. Landefeld CS, Palmer RM, Kresevic DM, Fortinsky RH, Kowal J. A randomized trial of care in a hospital medical unit especially designed to improve the functional outcomes of acutely ill older patients. N Engl J Med. 1995;332(20):1338-1344. doi: 10.1056/NEJM199505183322006. PubMed
36. Hoyer EH, Friedman M, Lavezza A, et al. Promoting mobility and reducing length of stay in hospitalized general medicine patients: A quality-improvement project. J Hosp Med. 2016;11(5):341-347. doi: 10.1002/jhm.2546. PubMed
37. Brown CJ, Foley KT, Lowman JD, Jr., et al. comparison of posthospitalization function and community mobility in hospital mobility program and usual care patients: a randomized clinical trial. JAMA Intern Med. 2016;176(7):921-927. doi: 10.1001/jamainternmed.2016.1870. PubMed
© 2019 Society of Hospital Medicine