User login
Excess Readmission vs Excess Penalties: Maximum Readmission Penalties as a Function of Socioeconomics and Geography
INTRODUCTION
According to Centers for Medicare & Medicaid Services (CMS), approximately 1 in 5 patients discharged from a hospital will be readmitted within 30 days.1 The Hospital Readmission Reduction Program (HRRP) is designed to reduce readmission by withholding up to 3% of all Medicare reimbursement from hospitals with “excess” readmissions; however, absent from the HRRP is adjustment for socioeconomic status (SES), which CMS holds may undermine incentives to reduce health disparities and institutionalize lower standards for hospitals serving disadvantaged populations.2
Lack of SES adjustment has been criticized by those who point to evidence highlighting postdischarge environment and patient SES as drivers of readmission and suggest hospitals that serve low SES individuals will bear a disproportionate share of penalties.3-6 Single-center,3,7,8 regional,9,10 and nationwide6,11 studies highlight census tract level socioeconomic variables as predictive of readmission. Single-center studies, robust in controlling for confounders, including staffing, training, electronic medical record utilization, and transitional care processes, do not allow comparisons between hospitals, limiting utility in HRRP evaluation. Multicenter cohorts, on the other hand, allow for comparisons between high and low penalty hospitals, pioneered by Joynt et al12 after the first round of HRRP penalties; yet this technique may not account for confounding caused by extensive demographic, socioeconomic, and hospital characteristic heterogeneity inherent in a national cohort. Analysis of the 2015 HRRP penalty data by Sjoding et al.6 revealed higher chronic obstructive pulmonary disease (COPD) readmission rates in the Mid-Atlantic, Midwest, and South relative to other regions; however, the magnitude of small-area variation and its relationship to population SES have yet to be characterized.
Therefore, we conducted a matched case-control design, whereby each maximum penalty hospital was matched to a nonpenalty hospital using key hospital characteristics. We then used geographic matching to isolate SES factors predictive of readmission within specific geographies in an effort to control for regional population differences. We hypothesized that, among both matched and localized hospital pairs, the disparities in population SES are the most significant predictors of a maximum penalty. Now in the 3rd year of the HRRP with approximately 75% of eligible hospitals to receive penalties worth an estimated $428 million in the 2015 fiscal year,13 we offer a small-area analysis of bipolar extremes to inform debate surrounding the HRRP with evidence regarding the causes and implications of readmission penalties.
METHODS
Study Design and Sample
This study relies on a case-control design. The cases were defined as US hospitals to receive the maximum 3% HRRP penalty in fiscal year 2015. Controls were drawn from the cohort of hospitals potentially subject to HRRP penalties that received no readmission penalty in the 2015 fiscal year with at least 1 admission for any of the following conditions: heart failure (HF), acute myocardial infarction (AMI), pneumonia (PN), total knee arthroscopy or total hip arthroscopy (THA/TKA), or chronic obstructive pulmonary disease (COPD).
Data Sources
Penalty data were drawn from the 2015 master penalty file,14 which were accessed via CMS.gov. County-level demographic and socioeconomic data were gathered from the 2015 American Community Survey (ACS), a subsidiary of the US Census. Data on hospital characteristics, capacity, and regional healthcare utilization were drawn from 2012 Dartmouth Atlas,15 2012 Medicare Cost Report,16 2012 American Hospital Association Hospital Statistics Database, and 2014 Hospital Care Downloadable Database.
Hospital-level CMS data were linked to the master 2015 penalty file. Dartmouth Atlas data were subsequently linked to the file using the Dartmouth Atlas “Hospital to HSA/HRR Crosswalk” file (accessed via DartmouthAtlas.org.) Each hospital was assigned the profile of the hospital service area (HSA) and hospital referral region (HRR) in which it is located. An HSA is a geographic region defined by hospital admissions; the majority, but not entirety, of residents of a given HSA utilize the corresponding hospital. Similarly, an HRR is a geographic region defined by referrals for major cardiovascular and neurosurgery procedures. County-level socioeconomic data were linked to the dataset by county name; thus, hospital socioeconomic profiles are based on the county in which they are located.
Case-Control Matching
In the primary analysis, coarsened exact matching (CEM) matched controls to cases by potential confounding hospital characteristics, including the following: ownership, number of beds, case mix index (measure of acuity), ambulatory care visit rates within 14 days of discharge, and total number of penalty-eligible cases, including HF, AMI, COPD, PN, and THA/TKA.
In the secondary analysis, hospitals were geocoded by zip code. Geographic Information Systems mapping software (ESRI ArcGIS, Redlands, CA) relied upon Euclidean allocation distance spatial analysis17,18 to match each maximum-penalty hospital to the nearest nonpenalty hospital. Each case was matched to a distinct control; duplicate controls were replaced with the nearest unmatched no-penalty hospital.
Statistical Analysis
Univariate analyses utilized unpaired Student t tests (primary analysis) and paired Student t tests (secondary analysis). The CEM algorithm matches by strata rather than pairs, precluding paired Student t tests in the primary analysis. Statistical analyses were conducted using STATA (StataCorp. 2013. Stata Statistical Software: Release 13. College Station, TX).
RESULTS
Maximum Penalty and Nonpenalty Hospital Matching
Of 3383 hospitals eligible for the HRRP, 39 received the maximum penalty and 770 received no penalty. Thirty-eight control hospitals were identified using CEM algorithm; 1 maximum-penalty hospital could not be matched and was excluded from primary analy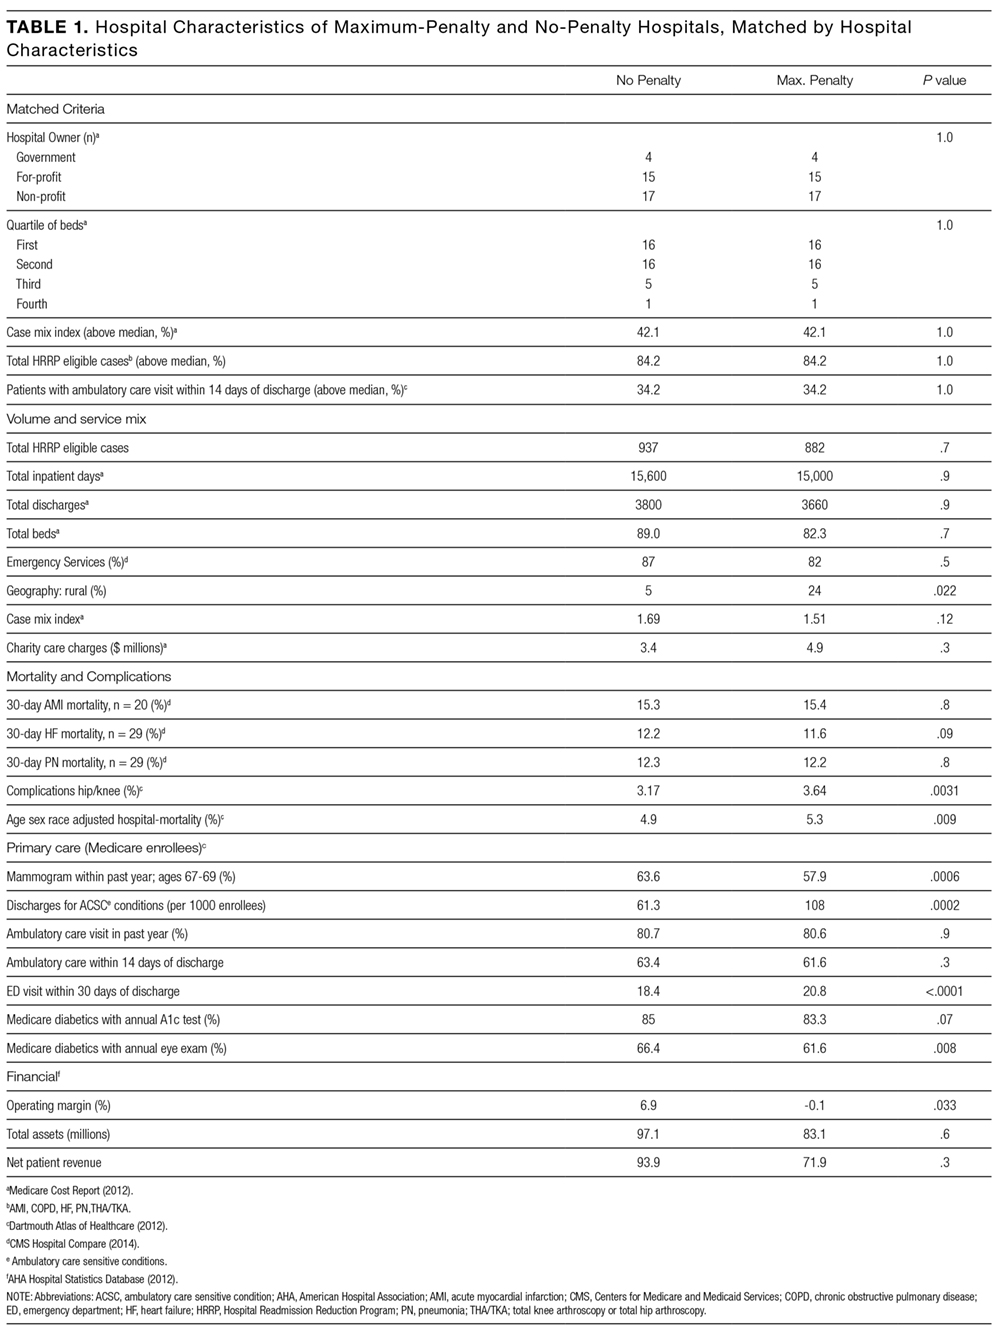
Hospital Characteristics
Case and control profiles are presented in Table 1. Cases and controls were matched by characteristics which may impact readmission rates (Table 1). CEM yielded cohorts similar across a spectrum of metrics, and identical in terms of matching criteria including ownership, beds (quartile), case mix index (above median), ambulatory care visit within 14 days of discharge (above median), and total number of penalty-eligible cases (above median). Relative to no-penalty hospitals, maximum-penalty hospitals were more likely rural (n = 9 vs n = 2, P = 0.022) and have a less profitable operating margin (0.1% vs 6.9%), and location within HSAs with higher age, sex, and race adjusted hospital-wide mortality rate (5.3% vs 4.9%, P = 0.009) and higher rates of discharge for ambulatory care sensitive conditions (108 vs 63 discharges per 1000 Medicare enrollees).
Demographic and Socioeconomic Characteristics
As presented in Table 2, cases a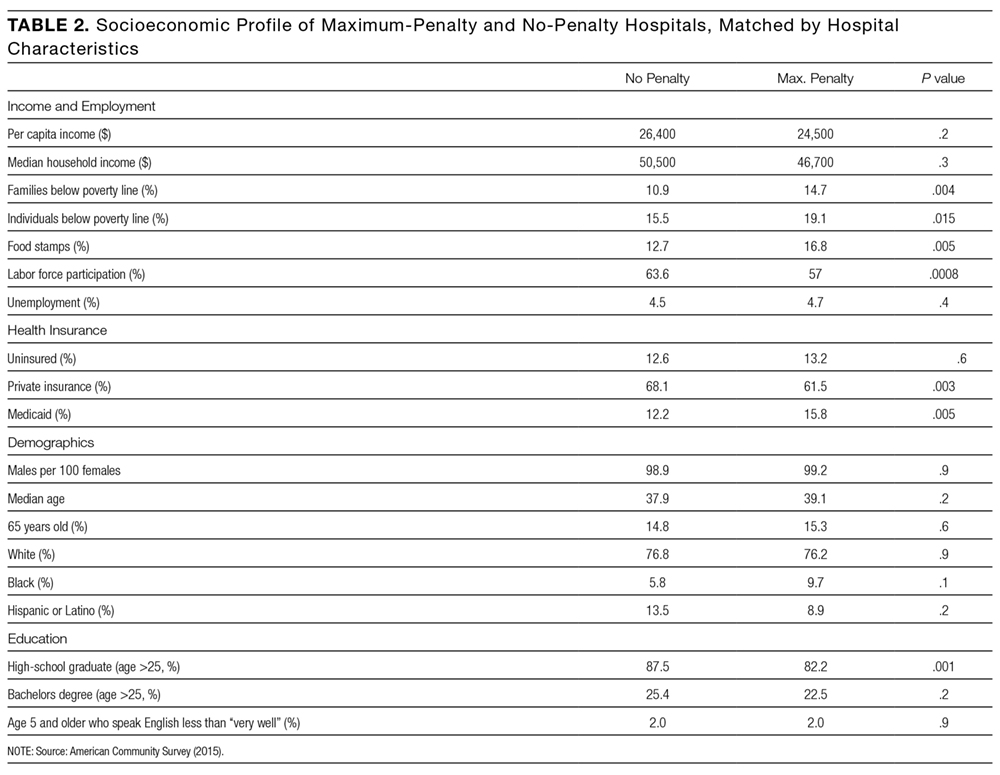
Secondary Analysis: Geographical Matching
Secondary analysis matched each maximum-penalty hospital to the nearest no-penalty hospital using a global information system vector analysis algorithm. As shown in the Figure, median distance between the case and the control was 42.5 miles (interquartile range: 25th percentile, 15.4 miles; 75th percentile, 98.4 miles). Seventeen pairs (44%) were in the same HRR, 6 of which were in the same HSA. Seven pairs (18%) were within the same county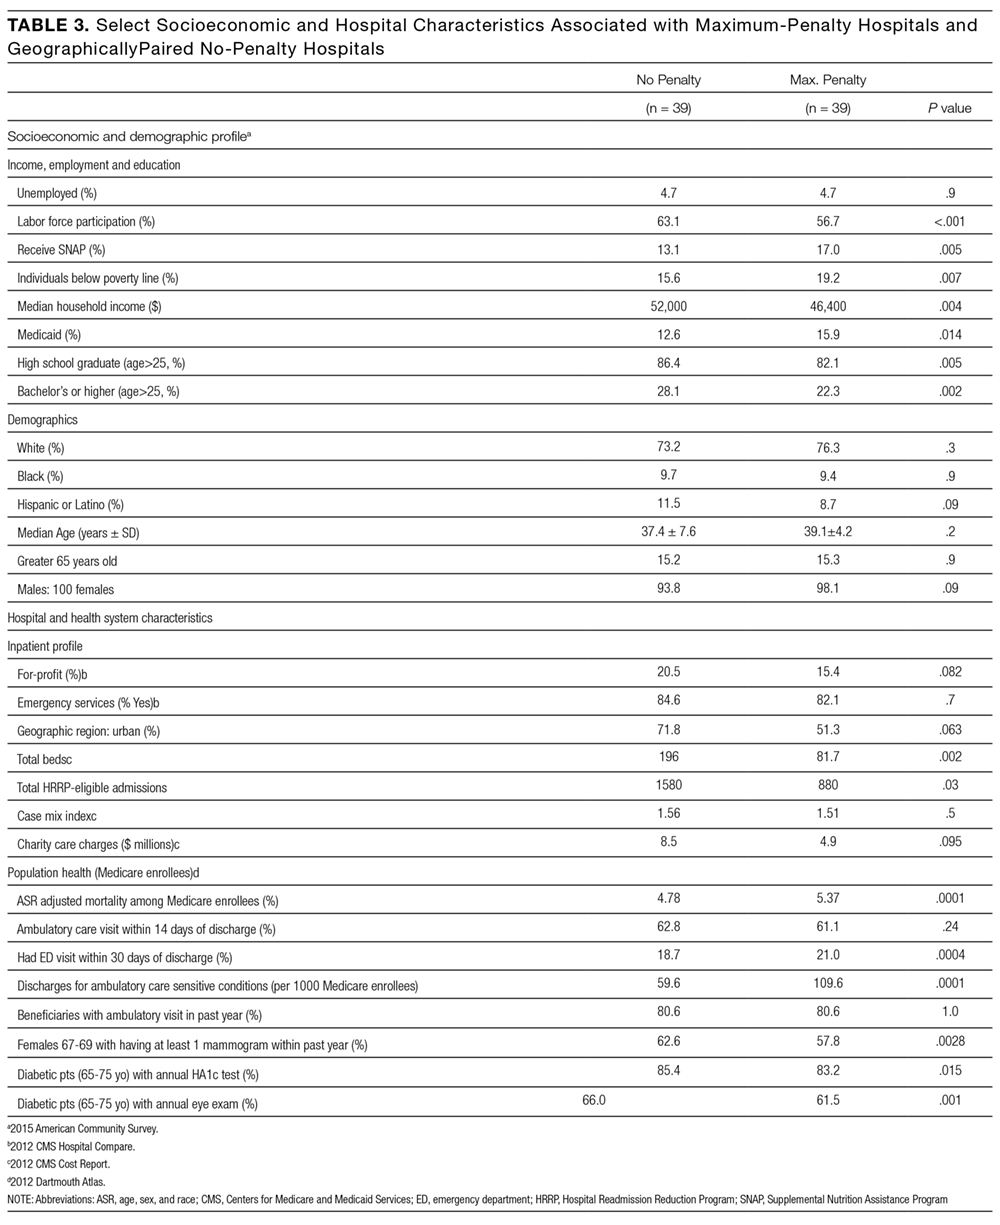
Secondary Analysis: Economic and Demographic Profiles of Geographically Matched Pairs
Demographic and socioeconomic profiles are presented in Table 3. The cases and controls are in counties with similar age, sex, and ethnicity distributions. Relative to no-penalty hospitals, maximum-penalty hospitals are in counties with lower socioeconomic profiles, including increased rates of poverty (15.6% vs 19.2%, P = 0.007) and lower rates of high school (86.4% vs 82.1%, P = 0.005) or college graduation (22.3% vs 28.1%, P = 0.002). Seven pairs were in the same county; a sensitivity analysis excluding these hospitals revealed similarly lower SES profile in cases relative to controls (Supplementary Table 1).
DISCUSSION
Our analysis reveals that county-level socioeconomic profiles are predictors of maximum HRRP penalties. Specifically, after matching cases and controls on 5 hospital characteristics that may influence readmission, maximum-penalty hospitals were more likely to be in rural counties with higher rates of poverty and lower rates of education relative to no-penalty hospitals. We observed no difference between cases and controls with respect to age, sex, or ethnicity.
Our study complement
Maximum Penalties as a Function of Population Health
The Dartmouth Atlas of Healthcare measures health outcomes, which are regionally aggregated among local hospitals by either HSA or HRR; see Methods. Such small-area aggregation does not precisely reflect outcomes from a specific hospital, but rather it describes the health status of localities. Disparities in health outcomes exist between maximum-penalty and no-penalty HSAs. Complication rates were slightly higher in maximum penalty HSAs, consistent with studies highlighting complications as drivers of surgical readmissions.22,23 Moreover, hospital-wide mortality rates were higher in maximum-penalty areas relative to nonpenalty HSAs (5.3 vs 4.9, P = 0.009).
Using national data, Krumholz et al. found no correlation between rates of readmission and mortality for HF, AMI, and PN24, which is a phenomenon acknowledged by the Medicare Payment Advisory Commission (MedPac) in a 2013 report titled, “Refining the hospital readmission reduction program.”25 In large national studies, others have shown low SES to be associated with elevated readmission but not mortality.10,11 In contrast, we restricted our analysis to matched cohorts and are, to our knowledge, the first to present evidence of an association between readmission and hospital-wide mortality adjusted for age, sex, and ethnicity.
Our results suggest maximum readmission penalties are a function of population health and public health capacity. The rates of ambulatory care sensitive condition (ACSC) discharges were substantially higher in HSAs of maximum penalty hospitals relative to nonpenalty hospitals (108 vs 63 per 1000 Medicare enrollees, P < 0.001). ACSC discharges have been used to measure primary care quality for 30 years, with the assumption being that admission for chronic conditions, such as HF, can be prevented with effective primary care.26,27 Moreover, patients discharged from maximum-penalty hospitals were more likely to have an emergency room visit within 30 days of discharge (20.8% vs 18.4%, P < 0.001). Higher rates of ACSCs and postdischarge emergency department visits suggest outpatient resources in maximum-penalty service areas struggle to manage the disease burden of high-risk populations. Geography may be a contributor; maximum-penalty hospitals were more likely to be rural than no-penalty hospitals (24% vs 5%, P = 0.022).
Our findings suggest hospitals providing care to vulnerable communities (defined by low income, low education, and high rates of ambulatory sensitive discharges) are disproportionately penalized. McHugh et al. revealed high nurse staffing levels to be protective against readmission penalties28, yet high penalties to low-margin hospitals may encourage reduced rather than increased staff. It may be better policy to direct resources rather than penalties to underserved communities; our findings echo others with concern about disproportionate penalties to hospitals serving low SES patients.2,5,6,29
Secondary Analysis: Geographic Matching
Geographic matching paired each maximum-penalty hospital to the nearest no-penalty hospital in an attempt to control for unmeasured regional factors that may confound an association between socioeconomic profile and health outcomes. For example, cost of living 30, 31 and obesity 32,33 vary regionally. Our study was unequipped to assess potential regional confounders; we attempted to control for them with geographical matching.
Median distance between maximum-penalty and no-penalty hospitals was 42.5 miles. Seven pairs were located within the same county, thus both case and control were assigned the same socioeconomic profile. Despite close proximity and identical SES profile in 7 of 39 pairs, maximum-penalty hospitals were in counties with lower income and lower rates of education, strengthening the association between SES and maximum readmission penalties.
Implications and Future Directions
In response to criticism surrounding the HRRP, the National Quality Forum endorsed the general concept of SES adjustment for hospital quality measures.34 Subsequently, in a briefing dated March 24, 2015, MedPAC, a government agency which provides Medicare policy analysis to Congress, proposed an SES adjustment methodology of “dividing hospitals into peer groups based on their overall share of low-income Medicare patients, and then setting a benchmark readmissions target for each peer group”;35 in other words, lower standards for hospitals that serve low-income populations. MedPAC’s proposal will reduce penalties to “safety net” institutions, which is progress but not a solution. Although the HRRP appears to be working, according to the US Department of Health and Human Services, readmissions fell by 150,000 between January 2012 and February 2013,36 we are concerned neither the HRRP nor the MedPac revision proposal considers geographic and environmental components of readmission. The HRRP promotes national improvement in exchange for regional regression.
Fair quality measures are key to value-based reimbursement models; yet, implicit in penalties for excess readmissions is the assumed ability to calculate hospital performance targets. Benchmarks for safety, timely care, and patient satisfaction can be uniform; rates of central line infections should not be influenced by patient mix. However, 9 of the 39 maximum-penalty hospitals under the HRRP are in rural Kentucky; one could hypothesize many reasons why rural Kentucky is a hotbed for excess readmission, including the regional production of tobacco and bourbon.
The fundamental question raised by our study is whether poor performance on quality measures is a function of underperforming hospitals or a manifestation of underserved communities. Moving forward, we encourage data systems and study designs that focus research on geospatial distribution of population health within the context of social and behavioral health determinants.37 Small-area studies of factors that drive health outcomes will inform rational alignment of healthcare policies and resources (including penalties and incentives) with underlying population needs.
Strengths and Weaknesses
Matching is a strength of the study. Primary analysis matched case and controls by hospital characteristics, generating cohorts similar across a spectrum of hospital metrics. Therefore, variation in readmission rates was less likely confounded by hospital characteristics. The secondary analysis was matched by geography in an effort to adjust for unmeasured, regional factors, including obesity and cost of living that may confound an association between SES and health outcomes. Geographic matching adds strength to our assertion that SES drives distinction between maximum-penalty hospitals and nonpenalty hospitals.
One weakness was the regional unit of analysis for socioeconomic and Dartmouth Atlas data, which is not a precise profile of the corresponding hospital. Each hospital was assigned a county-level socioeconomic profile. A more robust methodology would analyze patient-level SES data; this was impractical given a cohort of 78 hospitals. Regional health outcomes data limits analysis of readmission penalties as a function of hospital quality. Instead, regional data facilitated associations between readmission and population health, consistent with the aim of our study.
We analyzed 116 of 3668 hospitals eligible for the HRRP (3.2%), limiting the generalizability of our findings. Eighty-four percent of hospitals in the primary analysis have below the median number of beds, and none of them are teaching hospitals. Our analysis, restricted to maximum-penalty and no-penalty cohorts, does not address potential association between submaximal readmission penalties and socioeconomics.
Both matching techniques potentially controlled for similar SES factors and skewed our results towards null, especially in terms of race and ethnicity. Geographic matching generated 7 pairs (18%) within in the same county; both maximum-penalty and no-penalty hospitals were assigned the same socioeconomic profile, as well as 6 pairs (15%) within the same HSA, and both cases and controls had identical Dartmouth Atlas health outcomes profiles. We retained these pairs in our analysis to avoid artificially inflating SES and population health differences between cohorts.
Thirty-nine hospitals received a maximum penalty in the 3rd year of the HRRP. Relative to geographically matched no-penalty hospitals, maximum-penalty hospitals were more likely to be rural and located in counties with less educational attainment, more poverty and more poorly controlled chronic disease. In contrast to nationwide studies, a matched analysis plan revealed no difference between the cohorts in terms of race and ethnicity and provided evidence that maximum penalty hospitals had higher rates of age-, sex-, and race-adjusted hospital-wide mortality.
Our results highlight potential consequences of nationally derived benchmarks for phenomena underpinned by social, behavioral, and environmental factors and raise the question of whether maximum HRRP penalties are a consequence of underperforming hospitals or a manifestation of underserved communities. We are encouraged by MedPAC’s proposal to stratify HRRP by SES, yet recommend further small-area geographic analyses to better align quality measures, penalties, and incentives with resources and needs of distinct populations.
Acknowledgments
The authors thank William Hisey, who laid the foundation for the analysis and without whom the project would not have been possible.
DISCLOSURE
The authors certify that none of the material in this manuscript has been previously published and that none of this material is currently under consideration for publication elsewhere. This project received no funding. None of the authors on this manuscript have any commercial relationships to disclose in relation to this manuscript. All authors have reviewed and approved this manuscript and have contributed significantly to the design, conduct, and/or analysis of the research. No authors have any financial interests to disclose. No authors have any potential conflicts of interest to disclose. No authors have financial or personal relationships with any of the subject material presented in the manuscript.
1. Jencks SF, Williams MV, Coleman EA. Rehospitalizations among patients in the Medicare fee-for-service program. N Engl J Med. 2009;360(14):1418-1428. PubMed
30. Bethell C, Simpson L, Stumbo S, Carle AC, Gombojav N. National, state and local disparities in childhood obesity. Health Aff. 2010; 29(3): 347-356. PubMed
31. Singh GK, Kogan MD, van Dyck PC. Changes in state-specific childhood obesity and overweight prevalence in the United States from 2003 to 2007. Arch Pediatr Adolesc Med. 2010;164(7):598-607. PubMed
32. Aten BH, Figueroa EB, Martin TB. Regional Price Parities for States and Metropolitan Areas, 2006–2010. Survey of Current Business 2012;92:229-242.
33. Dubay L, Wheaton L, Zedlewski S. Geographic variation in the cost of living: implications for poverty guidelines and program eligibility. Urban Institute. 2013. https://aspe.hhs.gov/system/files/pdf/174186/UrbanGeographicVariation.pdf. Accessed on February 22, 2017. Last accessed July 10, 2017
34. National Quality Forum. Risk Adjustment for Socioeconomic Status or Other Sociodemographic Factors: a Technical Report. 2014. http://www.qualityforum. org/Publications/2014/08/Risk_Adjustment_for_Socioeconomic_Status_or_Other_Sociodemographic_Factors.aspx. Accessed July 10, 2017.
36. Services CfMaM. New HHS Data Shows Major Strides Made in Patient Safety, Leading to Improved Care and Savings. In: Services USDoHaH, ed. https://innovation.cms.gov/Files/reports/patient-safety-results.pdf. Accessed July 10, 2017.
37. Harrison KM, Dean HD. Use of data systems to address social determinants of health: a need to do more. Public Health Reports (Washington, DC:1974). 2011;126 Suppl 3:1-5. PubMed
INTRODUCTION
According to Centers for Medicare & Medicaid Services (CMS), approximately 1 in 5 patients discharged from a hospital will be readmitted within 30 days.1 The Hospital Readmission Reduction Program (HRRP) is designed to reduce readmission by withholding up to 3% of all Medicare reimbursement from hospitals with “excess” readmissions; however, absent from the HRRP is adjustment for socioeconomic status (SES), which CMS holds may undermine incentives to reduce health disparities and institutionalize lower standards for hospitals serving disadvantaged populations.2
Lack of SES adjustment has been criticized by those who point to evidence highlighting postdischarge environment and patient SES as drivers of readmission and suggest hospitals that serve low SES individuals will bear a disproportionate share of penalties.3-6 Single-center,3,7,8 regional,9,10 and nationwide6,11 studies highlight census tract level socioeconomic variables as predictive of readmission. Single-center studies, robust in controlling for confounders, including staffing, training, electronic medical record utilization, and transitional care processes, do not allow comparisons between hospitals, limiting utility in HRRP evaluation. Multicenter cohorts, on the other hand, allow for comparisons between high and low penalty hospitals, pioneered by Joynt et al12 after the first round of HRRP penalties; yet this technique may not account for confounding caused by extensive demographic, socioeconomic, and hospital characteristic heterogeneity inherent in a national cohort. Analysis of the 2015 HRRP penalty data by Sjoding et al.6 revealed higher chronic obstructive pulmonary disease (COPD) readmission rates in the Mid-Atlantic, Midwest, and South relative to other regions; however, the magnitude of small-area variation and its relationship to population SES have yet to be characterized.
Therefore, we conducted a matched case-control design, whereby each maximum penalty hospital was matched to a nonpenalty hospital using key hospital characteristics. We then used geographic matching to isolate SES factors predictive of readmission within specific geographies in an effort to control for regional population differences. We hypothesized that, among both matched and localized hospital pairs, the disparities in population SES are the most significant predictors of a maximum penalty. Now in the 3rd year of the HRRP with approximately 75% of eligible hospitals to receive penalties worth an estimated $428 million in the 2015 fiscal year,13 we offer a small-area analysis of bipolar extremes to inform debate surrounding the HRRP with evidence regarding the causes and implications of readmission penalties.
METHODS
Study Design and Sample
This study relies on a case-control design. The cases were defined as US hospitals to receive the maximum 3% HRRP penalty in fiscal year 2015. Controls were drawn from the cohort of hospitals potentially subject to HRRP penalties that received no readmission penalty in the 2015 fiscal year with at least 1 admission for any of the following conditions: heart failure (HF), acute myocardial infarction (AMI), pneumonia (PN), total knee arthroscopy or total hip arthroscopy (THA/TKA), or chronic obstructive pulmonary disease (COPD).
Data Sources
Penalty data were drawn from the 2015 master penalty file,14 which were accessed via CMS.gov. County-level demographic and socioeconomic data were gathered from the 2015 American Community Survey (ACS), a subsidiary of the US Census. Data on hospital characteristics, capacity, and regional healthcare utilization were drawn from 2012 Dartmouth Atlas,15 2012 Medicare Cost Report,16 2012 American Hospital Association Hospital Statistics Database, and 2014 Hospital Care Downloadable Database.
Hospital-level CMS data were linked to the master 2015 penalty file. Dartmouth Atlas data were subsequently linked to the file using the Dartmouth Atlas “Hospital to HSA/HRR Crosswalk” file (accessed via DartmouthAtlas.org.) Each hospital was assigned the profile of the hospital service area (HSA) and hospital referral region (HRR) in which it is located. An HSA is a geographic region defined by hospital admissions; the majority, but not entirety, of residents of a given HSA utilize the corresponding hospital. Similarly, an HRR is a geographic region defined by referrals for major cardiovascular and neurosurgery procedures. County-level socioeconomic data were linked to the dataset by county name; thus, hospital socioeconomic profiles are based on the county in which they are located.
Case-Control Matching
In the primary analysis, coarsened exact matching (CEM) matched controls to cases by potential confounding hospital characteristics, including the following: ownership, number of beds, case mix index (measure of acuity), ambulatory care visit rates within 14 days of discharge, and total number of penalty-eligible cases, including HF, AMI, COPD, PN, and THA/TKA.
In the secondary analysis, hospitals were geocoded by zip code. Geographic Information Systems mapping software (ESRI ArcGIS, Redlands, CA) relied upon Euclidean allocation distance spatial analysis17,18 to match each maximum-penalty hospital to the nearest nonpenalty hospital. Each case was matched to a distinct control; duplicate controls were replaced with the nearest unmatched no-penalty hospital.
Statistical Analysis
Univariate analyses utilized unpaired Student t tests (primary analysis) and paired Student t tests (secondary analysis). The CEM algorithm matches by strata rather than pairs, precluding paired Student t tests in the primary analysis. Statistical analyses were conducted using STATA (StataCorp. 2013. Stata Statistical Software: Release 13. College Station, TX).
RESULTS
Maximum Penalty and Nonpenalty Hospital Matching
Of 3383 hospitals eligible for the HRRP, 39 received the maximum penalty and 770 received no penalty. Thirty-eight control hospitals were identified using CEM algorithm; 1 maximum-penalty hospital could not be matched and was excluded from primary analy
Hospital Characteristics
Case and control profiles are presented in Table 1. Cases and controls were matched by characteristics which may impact readmission rates (Table 1). CEM yielded cohorts similar across a spectrum of metrics, and identical in terms of matching criteria including ownership, beds (quartile), case mix index (above median), ambulatory care visit within 14 days of discharge (above median), and total number of penalty-eligible cases (above median). Relative to no-penalty hospitals, maximum-penalty hospitals were more likely rural (n = 9 vs n = 2, P = 0.022) and have a less profitable operating margin (0.1% vs 6.9%), and location within HSAs with higher age, sex, and race adjusted hospital-wide mortality rate (5.3% vs 4.9%, P = 0.009) and higher rates of discharge for ambulatory care sensitive conditions (108 vs 63 discharges per 1000 Medicare enrollees).
Demographic and Socioeconomic Characteristics
As presented in Table 2, cases a
Secondary Analysis: Geographical Matching
Secondary analysis matched each maximum-penalty hospital to the nearest no-penalty hospital using a global information system vector analysis algorithm. As shown in the Figure, median distance between the case and the control was 42.5 miles (interquartile range: 25th percentile, 15.4 miles; 75th percentile, 98.4 miles). Seventeen pairs (44%) were in the same HRR, 6 of which were in the same HSA. Seven pairs (18%) were within the same county
Secondary Analysis: Economic and Demographic Profiles of Geographically Matched Pairs
Demographic and socioeconomic profiles are presented in Table 3. The cases and controls are in counties with similar age, sex, and ethnicity distributions. Relative to no-penalty hospitals, maximum-penalty hospitals are in counties with lower socioeconomic profiles, including increased rates of poverty (15.6% vs 19.2%, P = 0.007) and lower rates of high school (86.4% vs 82.1%, P = 0.005) or college graduation (22.3% vs 28.1%, P = 0.002). Seven pairs were in the same county; a sensitivity analysis excluding these hospitals revealed similarly lower SES profile in cases relative to controls (Supplementary Table 1).
DISCUSSION
Our analysis reveals that county-level socioeconomic profiles are predictors of maximum HRRP penalties. Specifically, after matching cases and controls on 5 hospital characteristics that may influence readmission, maximum-penalty hospitals were more likely to be in rural counties with higher rates of poverty and lower rates of education relative to no-penalty hospitals. We observed no difference between cases and controls with respect to age, sex, or ethnicity.
Our study complement
Maximum Penalties as a Function of Population Health
The Dartmouth Atlas of Healthcare measures health outcomes, which are regionally aggregated among local hospitals by either HSA or HRR; see Methods. Such small-area aggregation does not precisely reflect outcomes from a specific hospital, but rather it describes the health status of localities. Disparities in health outcomes exist between maximum-penalty and no-penalty HSAs. Complication rates were slightly higher in maximum penalty HSAs, consistent with studies highlighting complications as drivers of surgical readmissions.22,23 Moreover, hospital-wide mortality rates were higher in maximum-penalty areas relative to nonpenalty HSAs (5.3 vs 4.9, P = 0.009).
Using national data, Krumholz et al. found no correlation between rates of readmission and mortality for HF, AMI, and PN24, which is a phenomenon acknowledged by the Medicare Payment Advisory Commission (MedPac) in a 2013 report titled, “Refining the hospital readmission reduction program.”25 In large national studies, others have shown low SES to be associated with elevated readmission but not mortality.10,11 In contrast, we restricted our analysis to matched cohorts and are, to our knowledge, the first to present evidence of an association between readmission and hospital-wide mortality adjusted for age, sex, and ethnicity.
Our results suggest maximum readmission penalties are a function of population health and public health capacity. The rates of ambulatory care sensitive condition (ACSC) discharges were substantially higher in HSAs of maximum penalty hospitals relative to nonpenalty hospitals (108 vs 63 per 1000 Medicare enrollees, P < 0.001). ACSC discharges have been used to measure primary care quality for 30 years, with the assumption being that admission for chronic conditions, such as HF, can be prevented with effective primary care.26,27 Moreover, patients discharged from maximum-penalty hospitals were more likely to have an emergency room visit within 30 days of discharge (20.8% vs 18.4%, P < 0.001). Higher rates of ACSCs and postdischarge emergency department visits suggest outpatient resources in maximum-penalty service areas struggle to manage the disease burden of high-risk populations. Geography may be a contributor; maximum-penalty hospitals were more likely to be rural than no-penalty hospitals (24% vs 5%, P = 0.022).
Our findings suggest hospitals providing care to vulnerable communities (defined by low income, low education, and high rates of ambulatory sensitive discharges) are disproportionately penalized. McHugh et al. revealed high nurse staffing levels to be protective against readmission penalties28, yet high penalties to low-margin hospitals may encourage reduced rather than increased staff. It may be better policy to direct resources rather than penalties to underserved communities; our findings echo others with concern about disproportionate penalties to hospitals serving low SES patients.2,5,6,29
Secondary Analysis: Geographic Matching
Geographic matching paired each maximum-penalty hospital to the nearest no-penalty hospital in an attempt to control for unmeasured regional factors that may confound an association between socioeconomic profile and health outcomes. For example, cost of living 30, 31 and obesity 32,33 vary regionally. Our study was unequipped to assess potential regional confounders; we attempted to control for them with geographical matching.
Median distance between maximum-penalty and no-penalty hospitals was 42.5 miles. Seven pairs were located within the same county, thus both case and control were assigned the same socioeconomic profile. Despite close proximity and identical SES profile in 7 of 39 pairs, maximum-penalty hospitals were in counties with lower income and lower rates of education, strengthening the association between SES and maximum readmission penalties.
Implications and Future Directions
In response to criticism surrounding the HRRP, the National Quality Forum endorsed the general concept of SES adjustment for hospital quality measures.34 Subsequently, in a briefing dated March 24, 2015, MedPAC, a government agency which provides Medicare policy analysis to Congress, proposed an SES adjustment methodology of “dividing hospitals into peer groups based on their overall share of low-income Medicare patients, and then setting a benchmark readmissions target for each peer group”;35 in other words, lower standards for hospitals that serve low-income populations. MedPAC’s proposal will reduce penalties to “safety net” institutions, which is progress but not a solution. Although the HRRP appears to be working, according to the US Department of Health and Human Services, readmissions fell by 150,000 between January 2012 and February 2013,36 we are concerned neither the HRRP nor the MedPac revision proposal considers geographic and environmental components of readmission. The HRRP promotes national improvement in exchange for regional regression.
Fair quality measures are key to value-based reimbursement models; yet, implicit in penalties for excess readmissions is the assumed ability to calculate hospital performance targets. Benchmarks for safety, timely care, and patient satisfaction can be uniform; rates of central line infections should not be influenced by patient mix. However, 9 of the 39 maximum-penalty hospitals under the HRRP are in rural Kentucky; one could hypothesize many reasons why rural Kentucky is a hotbed for excess readmission, including the regional production of tobacco and bourbon.
The fundamental question raised by our study is whether poor performance on quality measures is a function of underperforming hospitals or a manifestation of underserved communities. Moving forward, we encourage data systems and study designs that focus research on geospatial distribution of population health within the context of social and behavioral health determinants.37 Small-area studies of factors that drive health outcomes will inform rational alignment of healthcare policies and resources (including penalties and incentives) with underlying population needs.
Strengths and Weaknesses
Matching is a strength of the study. Primary analysis matched case and controls by hospital characteristics, generating cohorts similar across a spectrum of hospital metrics. Therefore, variation in readmission rates was less likely confounded by hospital characteristics. The secondary analysis was matched by geography in an effort to adjust for unmeasured, regional factors, including obesity and cost of living that may confound an association between SES and health outcomes. Geographic matching adds strength to our assertion that SES drives distinction between maximum-penalty hospitals and nonpenalty hospitals.
One weakness was the regional unit of analysis for socioeconomic and Dartmouth Atlas data, which is not a precise profile of the corresponding hospital. Each hospital was assigned a county-level socioeconomic profile. A more robust methodology would analyze patient-level SES data; this was impractical given a cohort of 78 hospitals. Regional health outcomes data limits analysis of readmission penalties as a function of hospital quality. Instead, regional data facilitated associations between readmission and population health, consistent with the aim of our study.
We analyzed 116 of 3668 hospitals eligible for the HRRP (3.2%), limiting the generalizability of our findings. Eighty-four percent of hospitals in the primary analysis have below the median number of beds, and none of them are teaching hospitals. Our analysis, restricted to maximum-penalty and no-penalty cohorts, does not address potential association between submaximal readmission penalties and socioeconomics.
Both matching techniques potentially controlled for similar SES factors and skewed our results towards null, especially in terms of race and ethnicity. Geographic matching generated 7 pairs (18%) within in the same county; both maximum-penalty and no-penalty hospitals were assigned the same socioeconomic profile, as well as 6 pairs (15%) within the same HSA, and both cases and controls had identical Dartmouth Atlas health outcomes profiles. We retained these pairs in our analysis to avoid artificially inflating SES and population health differences between cohorts.
Thirty-nine hospitals received a maximum penalty in the 3rd year of the HRRP. Relative to geographically matched no-penalty hospitals, maximum-penalty hospitals were more likely to be rural and located in counties with less educational attainment, more poverty and more poorly controlled chronic disease. In contrast to nationwide studies, a matched analysis plan revealed no difference between the cohorts in terms of race and ethnicity and provided evidence that maximum penalty hospitals had higher rates of age-, sex-, and race-adjusted hospital-wide mortality.
Our results highlight potential consequences of nationally derived benchmarks for phenomena underpinned by social, behavioral, and environmental factors and raise the question of whether maximum HRRP penalties are a consequence of underperforming hospitals or a manifestation of underserved communities. We are encouraged by MedPAC’s proposal to stratify HRRP by SES, yet recommend further small-area geographic analyses to better align quality measures, penalties, and incentives with resources and needs of distinct populations.
Acknowledgments
The authors thank William Hisey, who laid the foundation for the analysis and without whom the project would not have been possible.
DISCLOSURE
The authors certify that none of the material in this manuscript has been previously published and that none of this material is currently under consideration for publication elsewhere. This project received no funding. None of the authors on this manuscript have any commercial relationships to disclose in relation to this manuscript. All authors have reviewed and approved this manuscript and have contributed significantly to the design, conduct, and/or analysis of the research. No authors have any financial interests to disclose. No authors have any potential conflicts of interest to disclose. No authors have financial or personal relationships with any of the subject material presented in the manuscript.
1. Jencks SF, Williams MV, Coleman EA. Rehospitalizations among patients in the Medicare fee-for-service program. N Engl J Med. 2009;360(14):1418-1428. PubMed
30. Bethell C, Simpson L, Stumbo S, Carle AC, Gombojav N. National, state and local disparities in childhood obesity. Health Aff. 2010; 29(3): 347-356. PubMed
31. Singh GK, Kogan MD, van Dyck PC. Changes in state-specific childhood obesity and overweight prevalence in the United States from 2003 to 2007. Arch Pediatr Adolesc Med. 2010;164(7):598-607. PubMed
32. Aten BH, Figueroa EB, Martin TB. Regional Price Parities for States and Metropolitan Areas, 2006–2010. Survey of Current Business 2012;92:229-242.
33. Dubay L, Wheaton L, Zedlewski S. Geographic variation in the cost of living: implications for poverty guidelines and program eligibility. Urban Institute. 2013. https://aspe.hhs.gov/system/files/pdf/174186/UrbanGeographicVariation.pdf. Accessed on February 22, 2017. Last accessed July 10, 2017
34. National Quality Forum. Risk Adjustment for Socioeconomic Status or Other Sociodemographic Factors: a Technical Report. 2014. http://www.qualityforum. org/Publications/2014/08/Risk_Adjustment_for_Socioeconomic_Status_or_Other_Sociodemographic_Factors.aspx. Accessed July 10, 2017.
36. Services CfMaM. New HHS Data Shows Major Strides Made in Patient Safety, Leading to Improved Care and Savings. In: Services USDoHaH, ed. https://innovation.cms.gov/Files/reports/patient-safety-results.pdf. Accessed July 10, 2017.
37. Harrison KM, Dean HD. Use of data systems to address social determinants of health: a need to do more. Public Health Reports (Washington, DC:1974). 2011;126 Suppl 3:1-5. PubMed