User login
Development of Hospitalization Resource Intensity Scores for Kids (H-RISK) and Comparison across Pediatric Populations
Hospitals are increasingly assessed comparatively in terms of costs and quality for benchmarking purposes. These comparisons can be used by patients and families to determine where to seek care, to report compliance and grant certifications by oversight organizations (eg, Leapfrog, Magnet, Joint Commission), and by payers, to determine reimbursement models and/or to assess financial penalty or bonuses for underperforming or overperforming hospitals. As these efforts can cause substantial reputational and financial consequences for hospitals, these metrics must be contextualized within the population of patients that each hospital serves.
In adult Medicare patient populations, methods have been developed to assess the relative severity of a hospital’s full complement of patients.1,2 These methods assume a relationship between severity and hospital resource intensity (ie, cost) and typically assume the form of relative weights (RWs), which are developed for clinically similar groups of patients (eg, Medicare Diagnosis Related Groups; MS-DRG) from a reference population. A RW for each MS-DRG is calculated as the average cost of patients within the group divided by the average cost for all patients in the reference population. These weights are then applied to a hospital’s discharges over a specific time period and averaged to obtain a hospital-level case-mix index (CMI). A value of 1 indicates that a hospital serves a mix of patients with similar severity (or resource intensity) to that of an “average” hospital discharge in the reference population, whereas a value of 1.2 indicates that a hospital serves a population of patients with 20% more severity than that of an “average” hospital discharge. Since 1983, the Centers for Medicare and Medicaid Services (CMS) has used RWs in their inpatient prospective payment system.3
Similar pediatric methods are less developed and necessitate special consideration as the use of existing weights may be inappropriate for a pediatric population. First, MS-DRGs were developed primarily for the Medicare population and lack sufficient granularity for pediatric populations, specifically newborns. Second, a severity stratification which incorporates important patient characteristics, such as age in pediatrics, does not exist in the MS-DRG system . Finally, although the reference populations that are used to develop MS-DRG weights do not explicitly exclude children, children typically account for approximately 15% of hospitalizations (6% excluding neonatal/maternal) and possibly feature different utilization patterns than adults with similar conditions. Thus, weights developed from a combined pediatric/adult reference population primarily reflect an adult population.
With valid pediatric RWs, stakeholders can assess a hospital’s severity mix of patients in a comparable fashion and contextualize outcome metrics. Additionally, these same weights can be used to estimate expected costs for hospitalizations or for risk adjusting various outcomes at the discharge- or hospital-level. Thus, we sought to develop hospitalization resource intensity scores for kids (H-RISK) using pediatric-specific weights and compare hospital-level CMIs across various hospital types and locations as an example of the application of this novel methodology.
METHODS
Dataset
Data for this analysis were obtained from the 2012 Healthcare Cost and Utilization Project (HCUP) Kids’ Inpatient Database (KID).4 KID is the largest publicly available all-payer inpatient administrative database in the United States and is sponsored by the Agency for Healthcare Research and Quality as part of the HCUP. The 2012 KID included a sample of approximately 3.2 million discharge records of children <21 years old from 44 states and 4,179 community, nonrehabilitation hospitals weighted for national estimates.
Hospital discharge costs were estimated from charges using cost-to-charge ratios (CCR) provided by HCUP as a supplement to the 2012 KID.5 Cost estimates associated with a specific discharge were estimated by multiplying the total charges reported in the data by the appropriate hospital-specific CCR and then adjusted for price factors beyond a hospital’s control using the area wage index also provided by HCUP as a supplement.
H-RISK and Case-Mix Index Calculations
We calculated H-RISK as pediatric-specific RWs based on version 30 of 3M’s All Patient Refined DRG (APR-DRG; 3M Health Information Systems, Salt Lake City, Utah) system as a measure of resource intensity. The APR-DRG system classifies hospital discharges into over 300 base DRGs based on demographic, diagnostic, and therapeutic characteristics. Each APR-DRG is further sub-divided into 4 subclasses of severity of illness (SOI; eg, minor, moderate, major, and extreme) to indicate the intensity of resource utilization during hospitalization. However, SOI levels for differing APR-DRGs are not comparable.
For every APR-DRG SOI combinations available in the 2012 KID, calculation of RW was based on the ratio of the mean cost for patients assigned to a particular APR-DRG SOI compared with the mean cost for all patients in the database. Inpatient costs less than $0.50 were set to missing and removed from analysis. Mortalities and discharges with missing CCR and wage index values were also excluded from analysis. We required that estimates for RWs be based on a reasonable set of data (ie, 10 or more discharges) for each APR-DRG SOI, and that estimates across the 4 SOI levels within an APR-DRG be monotonically nondecreasing (ie, as SOI level increases, weights must either be the same or increasing). Winsorized means were used as point estimates for mean cost in both the numerator and denominator of RW computation. Winsorizing refers to an analytic transformation by which the influence of outliers (eg, values beyond a certain threshold) is mitigated by replacing the value of outliers with the value of the threshold. We used the 5th and 95th percentiles as thresholds for Winsorizing our point estimates.
Winsorized point estimates failing to meet the minimum sample size of 10 or nondecreasing monotonicity requirement were modified by one of the two following methods:
- Cost data were modeled using a generalized linear model assuming an exponential distribution. Covariates in the model included APR-DRG and SOI within APR-DRG as a continuous variable. Where applicable, Winsorized estimates of the mean were replaced with modeled estimates.
- Data from an APR-DRG SOI in question were combined with other SOIs within the same APR-DRG with the closest Winsorized mean value. Once data were combined, a common Winsorized value was re-computed and values across SOIs were checked to ensure that nondecreasing monotonicity was maintained. In some APR-DRGs with sparse data, this involved combining pairs of severity levels; in others, it involved combining three or four severity levels together.
For APR-DRGs in which no discharges at any SOI were recorded in the 2012 KID, we used the Winsorized mean of all encounters with a common major diagnostic category (MDC) as the missing APR-DRG as point estimate for all 4 SOI levels.
To calculate the CMI for a set of discharges (eg, discharges at a hospital in a year), RWs were assigned to each discharge based on APR-DRG SOI designation. Consequently, all discharges from a specific APR-DRG SOI were assigned the same RW. Once RWs were assigned, CMI was calculated as the mean RW across all discharges. To compare hospital types based on acute-care hospital stays which are usually considered with the realm of pediatric care, we excluded RWs for normal newborns, defined as APR-DRG 626 (neonate birthweight of 2000–2499 g, normal newborn or neonate with other problems) and 640 (neonate birthweight >2499 g, normal newborn or neonate with other problems), and maternal hospitalizations, defined as APR-DRG 540 (cesarean delivery) and 560 (vaginal delivery), from our CMI calculations.
Statistical Methodology
Categorical variables were summarized using frequencies and percentages; continuous variables were summarized using medians and interquartile ranges. Differences between hospital
types (eg, rural, urban nonteaching, urban teaching, and
free-standing) were assessed using a Chi-square test for association for categorical variables. Differences in continuous variables including comparisons of neonatal (MDC 15) and nonneonatal discharges, and medical versus procedural discharges as defined by the APR-DRG grouper were assessed using a Kruskal–Wallis test. All analyses were performed using SAS, Version 9.4 (SAS Institute, Cary, North Carolina); P values <.05 were considered statistically significant.
This study was considered nonhuman subjects research by the Institutional Review Board of Vanderbilt University Medical Center.
RESULTS
Patient Population
Table 1 summarizes the patient characteristics for all 4 hospital types. All comparisons of patient characteristics across the four hospital types are significant (P < .001). Of the 6,675,222 weighted discharges in HCUP KID 2012, almost two-thirds were less than one year old (4,269,984). Three-quarters of those infant discharges (3,733,760) were in-hospital births. The South was the Census region with the most number of discharges (38.8%), and over half of discharges (53.2%) included patients who lived in metro areas with more than 1 million residents. Patients disproportionately originated from lower-income areas with 30.9% living in zip codes with median incomes in the first quartile.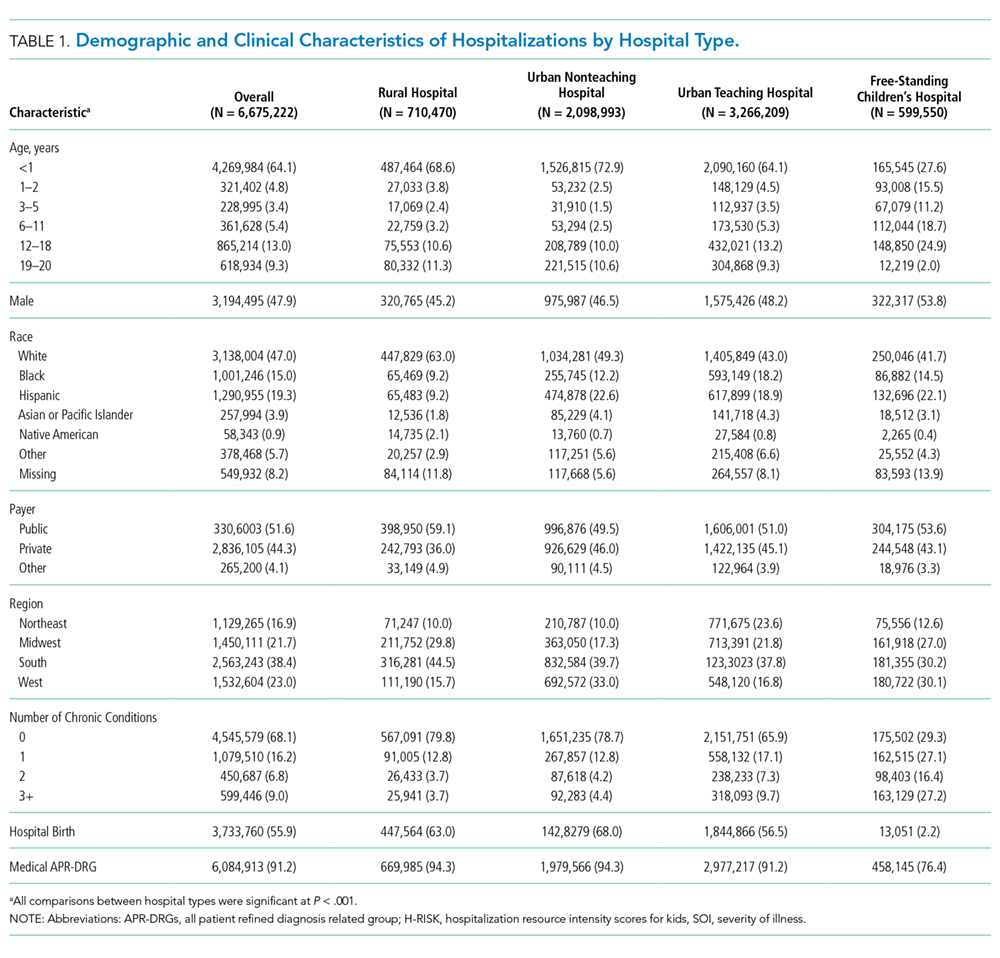
H-RISK Generation
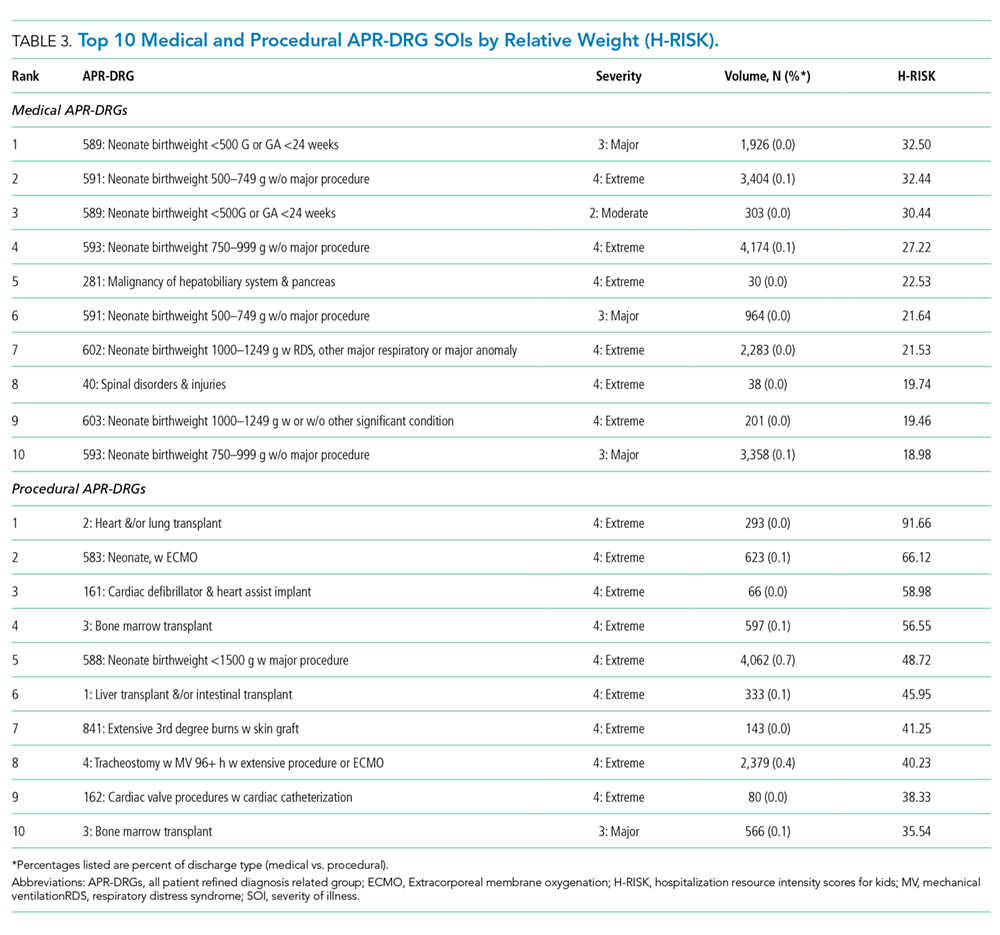
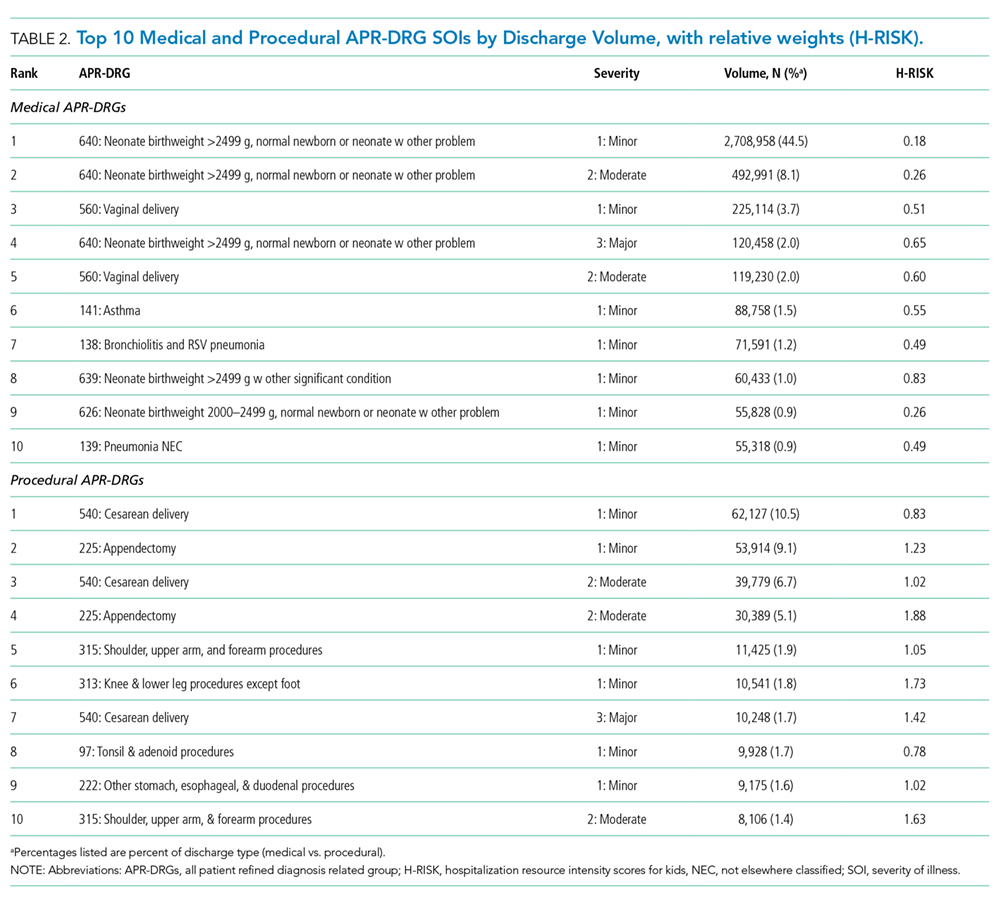
The weighted Winsorized mean cost of all discharges was $6,135 per discharge. The majority of cost-based H-RISK were higher than 1, with 1,038 (82.5%) of APR-DRG SOIs incurring an estimated cost higher than $6,135. Solid organ and bone marrow transplantations represented 4 of the 10 highest cost-based RWs for procedural APR-DRG SOIs (Table 3). Neonatal APR-DRG SOIs accounted for 8 of the 10 highest medical RWs. A list of all APR-DRG SOIs and H-RISK can be found in Appendix A.
Hospital-Level Case-Mix Index for Acute Hospitalizations
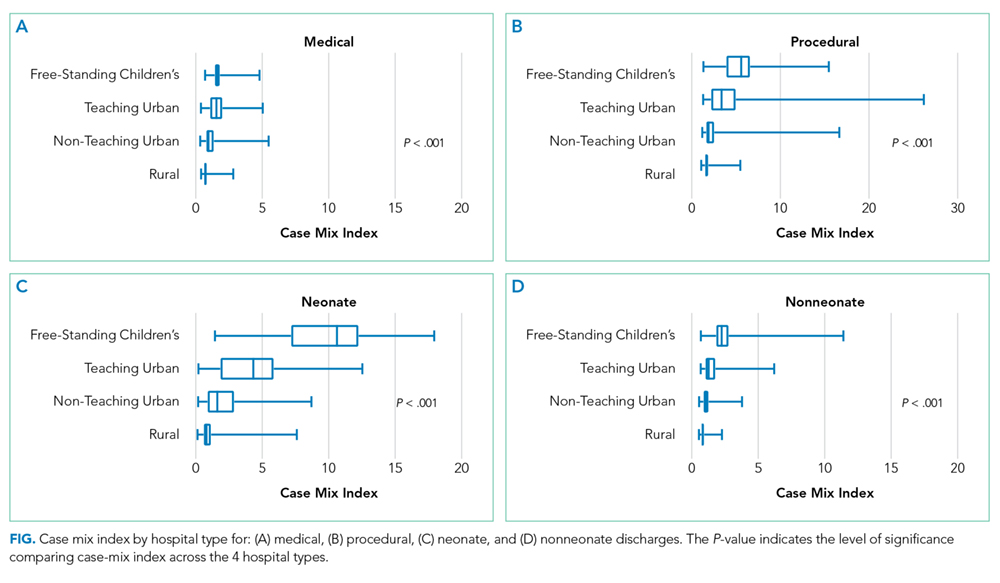
After excluding normal newborn and maternal hospitalizations, median CMI of the 3117 hospitals with at least 20 unweighted discharges was 1.0 (interquartile range [IQR]: 0.8, 1.7). CMI varied significantly across hospital types (P < .001). Free-standing children’s hospitals exhibited the highest cost-based CMI (median: 2.7, IQR: 2.2–3.1), followed by urban teaching hospitals (median: 1.8, IQR: 1.3–2.6), urban nonteaching hospitals (median: 1.1, IQR: 0.9–1.5), and rural hospitals (median: 0.9, IQR: 0.7–0.9).
DISCUSSION
Currently, no widely available measures can compare the relative intensity of hospital care specific for inpatient pediatric populations. To meet this important need, we have developed a methodology to determine valid pediatric RWs (H-RISK) which can be used to estimate the intensity of care for applications across entire hospital patient populations and specific subpopulations. H-RISK allow calculation of CMIs for risk adjustment of various outcomes at the discharge- or hospital-level and for comparisons among hospitals and populations. Using this methodology, we demonstrated that the CMI for free-standing children’s hospitals was significantly higher than those of rural, urban, nonteaching and urban teaching hospitals for all discharges and medical or procedural subgroups.
CMS has used RWs based on DRGs since the inception of the prospective payment system in 1983. The sequence of DRGs used by CMS has purposely focused on older adult Medicare population, and CMS itself recommends applying Medicare-focused DRGs (MS-DRGs being the current iteration) only for the >65 year population.6 Nevertheless, many payers, both government and commercial, utilize MS-DRGs and their RWs for payment purposes when reimbursing children’s hospitals. The validity of using weights developed using this grouper in hospitals treating large numbers of pediatric patients and childhood illnesses has been called into question, particularly when such weights are used in reimbursement of children’s hospitals.7
Several factors contribute to the validity of a model for developing RWs. First, the system used to describe patient hospitalizations and illnesses should be appropriate to the population in question. As described above, the original DRG system and its subsequent iterations were designed to describe hospitalizations for adults >65 years of age.8, 9 Over the years, CMS DRGs incorporated rudimentary categories for neonatal and obstetrical hospitalizations. Still, the current MS-DRGs lack sufficient focus on common inpatient pediatric conditions to adequately describe pediatric hospitalizations, particularly those in free-standing children’s hospitals delivering tertiary and quaternary care. Thus, a more appropriate classification schema for developing RWs specific for pediatric hospitalization should include patients across the entire age spectrum. APR-DRGs represent one such classification system.
Once an appropriate patient classification system is selected, then the population of hospitalized patients to be used as the reference group becomes important. For a system targeting a pediatric inpatient population, a hospital discharge database representing a broad sample of pediatric hospitalizations offers the best basis for developing a system of weights applicable to different types of hospitals providing care for children. For this purpose, we selected the 2012 KID database, a nationally representative dataset containing data on newborn and pediatric discharges from the majority of states within the US. This choice assured that the RWs developed were based on and applicable to pediatric hospitalizations across the entire spectrum of SOI and resource intensity.
A number of measures of hospital performance and quality have been developed and are used by various entities, including individual hospitals, CMS, Leapfrog, Magnet, Joint Commission, and payers, for purposes ranging from benchmarking for improvement to payment models to reimbursement penalties. However, SOI of a hospital’s patient population influences not only the intensity of care that a hospital provides but also presents a potential impact on process and outcome measures. Thus, fair and appropriate measures must consider differences in SOI when comparing hospital performances. Using the weights derived in this paper, these adjustments can be possibly made at either the discharge- or hospital-level, depending on the application, and may include comparisons by hospital location, ownership, payer mix, or socioeconomic strata.
It is also common for hospitals to quantitatively express the uniqueness of services that they deliver to payers or the general public. A hospital-level CMI (derived as the average discharge weight for patients within a hospital) is one way that hospitals may differentiate themselves. This can be accomplished by considering the ratio of one hospital’s CMI to another hospital’s (or an average of a group of hospitals) as an expression of the relative intensity of services. For example, if hospital x has a CMI of 2.3, and hospital y has a CMI of 1.4, the population of children hospitalized at hospital x was 64.3% (1–2.3/1.4) more resource intensive than the children seen at hospital y.
This study should be considered in terms of several limitations. We used costs as the basis for determining intensity of service. Thus, the difference in cost structure among children’s hospitals and between children’s hospitals and other hospital types in the KID could have affected the final calculated weights. Also, the RWs calculated in this study rely on hospital discharge data. Thus, complications which were not “present on admission” and occurred during a hospitalization could have reflected poor quality of care yet still increase resource intensity as measured by total costs. Future studies should examine the potential impact of using present-on-admission diagnoses only for the APR-DRG grouping on the values of RWs. Significant variation may have existed among hospitals in resource utilization, and some hospitals may have exhibited significant overutilization of resources for the same conditions. However, as we used Winsorized means, the impact of potential outliers should have been reduced. Some APR-DRG-SOI combinations were seen mainly at children’s hospitals. Thus, cost structure and resource utilization practices of this subset of hospitals would have been the only contributors to weights for these patients. Given that the 2012 KID contained a broad representation of pediatric hospitalizations, with age 0–20 years, newborns accounted for the majority of total cases in the database. While providing a full range of pediatric weights, inclusion of these patients lowered the overall average RW. For this reason, we excluded normal newborn categories and maternal categories from analysis of CMI across hospital types and focused on acute-care hospitalizations. Lastly, as with any study relying on administrative data, there is always the possibility of coding errors or data entry errors in the reference dataset.
CONCLUSIONS
H-RISK can be used to risk adjust measures to account for severity differences across populations. These weights can also be averaged across hospitals’ patient populations to compare relative resource intensities of the patients served.
Disclosures
The authors have nothing to disclose.
1. Pettengill J, Vertrees J. Reliability and Validity in Hospital Case-Mix Measurement. Health Care Financ Rev. 1982; 4(2): 101-128. PubMed
2. Centers for Medicare & Medicaid Services. Details for title: Case Mix Index. https://www.cms.gov/Medicare/Medicare-Fee-for-Service-Payment/AcuteInpatientPPS/Acute-Inpatient-Files-for-Download-Items/CMS022630.html#. Accessed August 30, 2017.
3. Iglehart JK. Medicare begins prospective payment of hospitals. N. Engl. J. Med 1983; 308(23): 1428-1432. PubMed
4. Healthcare Cost Utilization Project. Overview of the Kids’ Inpatient Database (KID). 2017; https://www.hcup-us.ahrq.gov/kidoverview.jsp. Accessed August 30, 2017.
5. Healthcare Cost Utilization Project. Cost-to-Charge Ratio Files: 2012 Kids’ Inpatient Database (KID) User Guide. 2014; https://www.hcup-us.ahrq.gov/db/state/CCR2012KIDUserGuide.pdf. Accessed August 30, 2017.
6. Centers for Medicare & Medicaid Services. Medicare Program; Changes to the Hospital Inpatient Prospective Payment Systems and Fiscal Year 2005 Rates; Final Rule. Federal Register. 2004;69(154):48,939. PubMed
7. Muldoon JH. Structure and performance of different DRG classification systems for neonatal medicine. Pediatrics. 1999; 103(1 Suppl E): 302-318. PubMed
8. Averill R, Goldfield N, Muldoon J, Steinbeck B, Grant T. A Closer Look at All Patient Refined DRGs. J AHIMA. 2002; 73(1): 46-50. PubMed
9. Centers for Medicare & Medicaid Services. Design and development of the Diagnosis Related Group (DRG). https://www.cms.gov/ICD10Manual/version34-fullcode-cms/fullcode_cms/Design_and_development_of_the_Diagnosis_Related_Group_(DRGs)_PBL-038.pdf. Accessed December 6, 2017.
Hospitals are increasingly assessed comparatively in terms of costs and quality for benchmarking purposes. These comparisons can be used by patients and families to determine where to seek care, to report compliance and grant certifications by oversight organizations (eg, Leapfrog, Magnet, Joint Commission), and by payers, to determine reimbursement models and/or to assess financial penalty or bonuses for underperforming or overperforming hospitals. As these efforts can cause substantial reputational and financial consequences for hospitals, these metrics must be contextualized within the population of patients that each hospital serves.
In adult Medicare patient populations, methods have been developed to assess the relative severity of a hospital’s full complement of patients.1,2 These methods assume a relationship between severity and hospital resource intensity (ie, cost) and typically assume the form of relative weights (RWs), which are developed for clinically similar groups of patients (eg, Medicare Diagnosis Related Groups; MS-DRG) from a reference population. A RW for each MS-DRG is calculated as the average cost of patients within the group divided by the average cost for all patients in the reference population. These weights are then applied to a hospital’s discharges over a specific time period and averaged to obtain a hospital-level case-mix index (CMI). A value of 1 indicates that a hospital serves a mix of patients with similar severity (or resource intensity) to that of an “average” hospital discharge in the reference population, whereas a value of 1.2 indicates that a hospital serves a population of patients with 20% more severity than that of an “average” hospital discharge. Since 1983, the Centers for Medicare and Medicaid Services (CMS) has used RWs in their inpatient prospective payment system.3
Similar pediatric methods are less developed and necessitate special consideration as the use of existing weights may be inappropriate for a pediatric population. First, MS-DRGs were developed primarily for the Medicare population and lack sufficient granularity for pediatric populations, specifically newborns. Second, a severity stratification which incorporates important patient characteristics, such as age in pediatrics, does not exist in the MS-DRG system . Finally, although the reference populations that are used to develop MS-DRG weights do not explicitly exclude children, children typically account for approximately 15% of hospitalizations (6% excluding neonatal/maternal) and possibly feature different utilization patterns than adults with similar conditions. Thus, weights developed from a combined pediatric/adult reference population primarily reflect an adult population.
With valid pediatric RWs, stakeholders can assess a hospital’s severity mix of patients in a comparable fashion and contextualize outcome metrics. Additionally, these same weights can be used to estimate expected costs for hospitalizations or for risk adjusting various outcomes at the discharge- or hospital-level. Thus, we sought to develop hospitalization resource intensity scores for kids (H-RISK) using pediatric-specific weights and compare hospital-level CMIs across various hospital types and locations as an example of the application of this novel methodology.
METHODS
Dataset
Data for this analysis were obtained from the 2012 Healthcare Cost and Utilization Project (HCUP) Kids’ Inpatient Database (KID).4 KID is the largest publicly available all-payer inpatient administrative database in the United States and is sponsored by the Agency for Healthcare Research and Quality as part of the HCUP. The 2012 KID included a sample of approximately 3.2 million discharge records of children <21 years old from 44 states and 4,179 community, nonrehabilitation hospitals weighted for national estimates.
Hospital discharge costs were estimated from charges using cost-to-charge ratios (CCR) provided by HCUP as a supplement to the 2012 KID.5 Cost estimates associated with a specific discharge were estimated by multiplying the total charges reported in the data by the appropriate hospital-specific CCR and then adjusted for price factors beyond a hospital’s control using the area wage index also provided by HCUP as a supplement.
H-RISK and Case-Mix Index Calculations
We calculated H-RISK as pediatric-specific RWs based on version 30 of 3M’s All Patient Refined DRG (APR-DRG; 3M Health Information Systems, Salt Lake City, Utah) system as a measure of resource intensity. The APR-DRG system classifies hospital discharges into over 300 base DRGs based on demographic, diagnostic, and therapeutic characteristics. Each APR-DRG is further sub-divided into 4 subclasses of severity of illness (SOI; eg, minor, moderate, major, and extreme) to indicate the intensity of resource utilization during hospitalization. However, SOI levels for differing APR-DRGs are not comparable.
For every APR-DRG SOI combinations available in the 2012 KID, calculation of RW was based on the ratio of the mean cost for patients assigned to a particular APR-DRG SOI compared with the mean cost for all patients in the database. Inpatient costs less than $0.50 were set to missing and removed from analysis. Mortalities and discharges with missing CCR and wage index values were also excluded from analysis. We required that estimates for RWs be based on a reasonable set of data (ie, 10 or more discharges) for each APR-DRG SOI, and that estimates across the 4 SOI levels within an APR-DRG be monotonically nondecreasing (ie, as SOI level increases, weights must either be the same or increasing). Winsorized means were used as point estimates for mean cost in both the numerator and denominator of RW computation. Winsorizing refers to an analytic transformation by which the influence of outliers (eg, values beyond a certain threshold) is mitigated by replacing the value of outliers with the value of the threshold. We used the 5th and 95th percentiles as thresholds for Winsorizing our point estimates.
Winsorized point estimates failing to meet the minimum sample size of 10 or nondecreasing monotonicity requirement were modified by one of the two following methods:
- Cost data were modeled using a generalized linear model assuming an exponential distribution. Covariates in the model included APR-DRG and SOI within APR-DRG as a continuous variable. Where applicable, Winsorized estimates of the mean were replaced with modeled estimates.
- Data from an APR-DRG SOI in question were combined with other SOIs within the same APR-DRG with the closest Winsorized mean value. Once data were combined, a common Winsorized value was re-computed and values across SOIs were checked to ensure that nondecreasing monotonicity was maintained. In some APR-DRGs with sparse data, this involved combining pairs of severity levels; in others, it involved combining three or four severity levels together.
For APR-DRGs in which no discharges at any SOI were recorded in the 2012 KID, we used the Winsorized mean of all encounters with a common major diagnostic category (MDC) as the missing APR-DRG as point estimate for all 4 SOI levels.
To calculate the CMI for a set of discharges (eg, discharges at a hospital in a year), RWs were assigned to each discharge based on APR-DRG SOI designation. Consequently, all discharges from a specific APR-DRG SOI were assigned the same RW. Once RWs were assigned, CMI was calculated as the mean RW across all discharges. To compare hospital types based on acute-care hospital stays which are usually considered with the realm of pediatric care, we excluded RWs for normal newborns, defined as APR-DRG 626 (neonate birthweight of 2000–2499 g, normal newborn or neonate with other problems) and 640 (neonate birthweight >2499 g, normal newborn or neonate with other problems), and maternal hospitalizations, defined as APR-DRG 540 (cesarean delivery) and 560 (vaginal delivery), from our CMI calculations.
Statistical Methodology
Categorical variables were summarized using frequencies and percentages; continuous variables were summarized using medians and interquartile ranges. Differences between hospital
types (eg, rural, urban nonteaching, urban teaching, and
free-standing) were assessed using a Chi-square test for association for categorical variables. Differences in continuous variables including comparisons of neonatal (MDC 15) and nonneonatal discharges, and medical versus procedural discharges as defined by the APR-DRG grouper were assessed using a Kruskal–Wallis test. All analyses were performed using SAS, Version 9.4 (SAS Institute, Cary, North Carolina); P values <.05 were considered statistically significant.
This study was considered nonhuman subjects research by the Institutional Review Board of Vanderbilt University Medical Center.
RESULTS
Patient Population
Table 1 summarizes the patient characteristics for all 4 hospital types. All comparisons of patient characteristics across the four hospital types are significant (P < .001). Of the 6,675,222 weighted discharges in HCUP KID 2012, almost two-thirds were less than one year old (4,269,984). Three-quarters of those infant discharges (3,733,760) were in-hospital births. The South was the Census region with the most number of discharges (38.8%), and over half of discharges (53.2%) included patients who lived in metro areas with more than 1 million residents. Patients disproportionately originated from lower-income areas with 30.9% living in zip codes with median incomes in the first quartile.
H-RISK Generation
The weighted Winsorized mean cost of all discharges was $6,135 per discharge. The majority of cost-based H-RISK were higher than 1, with 1,038 (82.5%) of APR-DRG SOIs incurring an estimated cost higher than $6,135. Solid organ and bone marrow transplantations represented 4 of the 10 highest cost-based RWs for procedural APR-DRG SOIs (Table 3). Neonatal APR-DRG SOIs accounted for 8 of the 10 highest medical RWs. A list of all APR-DRG SOIs and H-RISK can be found in Appendix A.
Hospital-Level Case-Mix Index for Acute Hospitalizations
After excluding normal newborn and maternal hospitalizations, median CMI of the 3117 hospitals with at least 20 unweighted discharges was 1.0 (interquartile range [IQR]: 0.8, 1.7). CMI varied significantly across hospital types (P < .001). Free-standing children’s hospitals exhibited the highest cost-based CMI (median: 2.7, IQR: 2.2–3.1), followed by urban teaching hospitals (median: 1.8, IQR: 1.3–2.6), urban nonteaching hospitals (median: 1.1, IQR: 0.9–1.5), and rural hospitals (median: 0.9, IQR: 0.7–0.9).
DISCUSSION
Currently, no widely available measures can compare the relative intensity of hospital care specific for inpatient pediatric populations. To meet this important need, we have developed a methodology to determine valid pediatric RWs (H-RISK) which can be used to estimate the intensity of care for applications across entire hospital patient populations and specific subpopulations. H-RISK allow calculation of CMIs for risk adjustment of various outcomes at the discharge- or hospital-level and for comparisons among hospitals and populations. Using this methodology, we demonstrated that the CMI for free-standing children’s hospitals was significantly higher than those of rural, urban, nonteaching and urban teaching hospitals for all discharges and medical or procedural subgroups.
CMS has used RWs based on DRGs since the inception of the prospective payment system in 1983. The sequence of DRGs used by CMS has purposely focused on older adult Medicare population, and CMS itself recommends applying Medicare-focused DRGs (MS-DRGs being the current iteration) only for the >65 year population.6 Nevertheless, many payers, both government and commercial, utilize MS-DRGs and their RWs for payment purposes when reimbursing children’s hospitals. The validity of using weights developed using this grouper in hospitals treating large numbers of pediatric patients and childhood illnesses has been called into question, particularly when such weights are used in reimbursement of children’s hospitals.7
Several factors contribute to the validity of a model for developing RWs. First, the system used to describe patient hospitalizations and illnesses should be appropriate to the population in question. As described above, the original DRG system and its subsequent iterations were designed to describe hospitalizations for adults >65 years of age.8, 9 Over the years, CMS DRGs incorporated rudimentary categories for neonatal and obstetrical hospitalizations. Still, the current MS-DRGs lack sufficient focus on common inpatient pediatric conditions to adequately describe pediatric hospitalizations, particularly those in free-standing children’s hospitals delivering tertiary and quaternary care. Thus, a more appropriate classification schema for developing RWs specific for pediatric hospitalization should include patients across the entire age spectrum. APR-DRGs represent one such classification system.
Once an appropriate patient classification system is selected, then the population of hospitalized patients to be used as the reference group becomes important. For a system targeting a pediatric inpatient population, a hospital discharge database representing a broad sample of pediatric hospitalizations offers the best basis for developing a system of weights applicable to different types of hospitals providing care for children. For this purpose, we selected the 2012 KID database, a nationally representative dataset containing data on newborn and pediatric discharges from the majority of states within the US. This choice assured that the RWs developed were based on and applicable to pediatric hospitalizations across the entire spectrum of SOI and resource intensity.
A number of measures of hospital performance and quality have been developed and are used by various entities, including individual hospitals, CMS, Leapfrog, Magnet, Joint Commission, and payers, for purposes ranging from benchmarking for improvement to payment models to reimbursement penalties. However, SOI of a hospital’s patient population influences not only the intensity of care that a hospital provides but also presents a potential impact on process and outcome measures. Thus, fair and appropriate measures must consider differences in SOI when comparing hospital performances. Using the weights derived in this paper, these adjustments can be possibly made at either the discharge- or hospital-level, depending on the application, and may include comparisons by hospital location, ownership, payer mix, or socioeconomic strata.
It is also common for hospitals to quantitatively express the uniqueness of services that they deliver to payers or the general public. A hospital-level CMI (derived as the average discharge weight for patients within a hospital) is one way that hospitals may differentiate themselves. This can be accomplished by considering the ratio of one hospital’s CMI to another hospital’s (or an average of a group of hospitals) as an expression of the relative intensity of services. For example, if hospital x has a CMI of 2.3, and hospital y has a CMI of 1.4, the population of children hospitalized at hospital x was 64.3% (1–2.3/1.4) more resource intensive than the children seen at hospital y.
This study should be considered in terms of several limitations. We used costs as the basis for determining intensity of service. Thus, the difference in cost structure among children’s hospitals and between children’s hospitals and other hospital types in the KID could have affected the final calculated weights. Also, the RWs calculated in this study rely on hospital discharge data. Thus, complications which were not “present on admission” and occurred during a hospitalization could have reflected poor quality of care yet still increase resource intensity as measured by total costs. Future studies should examine the potential impact of using present-on-admission diagnoses only for the APR-DRG grouping on the values of RWs. Significant variation may have existed among hospitals in resource utilization, and some hospitals may have exhibited significant overutilization of resources for the same conditions. However, as we used Winsorized means, the impact of potential outliers should have been reduced. Some APR-DRG-SOI combinations were seen mainly at children’s hospitals. Thus, cost structure and resource utilization practices of this subset of hospitals would have been the only contributors to weights for these patients. Given that the 2012 KID contained a broad representation of pediatric hospitalizations, with age 0–20 years, newborns accounted for the majority of total cases in the database. While providing a full range of pediatric weights, inclusion of these patients lowered the overall average RW. For this reason, we excluded normal newborn categories and maternal categories from analysis of CMI across hospital types and focused on acute-care hospitalizations. Lastly, as with any study relying on administrative data, there is always the possibility of coding errors or data entry errors in the reference dataset.
CONCLUSIONS
H-RISK can be used to risk adjust measures to account for severity differences across populations. These weights can also be averaged across hospitals’ patient populations to compare relative resource intensities of the patients served.
Disclosures
The authors have nothing to disclose.
1. Pettengill J, Vertrees J. Reliability and Validity in Hospital Case-Mix Measurement. Health Care Financ Rev. 1982; 4(2): 101-128. PubMed
2. Centers for Medicare & Medicaid Services. Details for title: Case Mix Index. https://www.cms.gov/Medicare/Medicare-Fee-for-Service-Payment/AcuteInpatientPPS/Acute-Inpatient-Files-for-Download-Items/CMS022630.html#. Accessed August 30, 2017.
3. Iglehart JK. Medicare begins prospective payment of hospitals. N. Engl. J. Med 1983; 308(23): 1428-1432. PubMed
4. Healthcare Cost Utilization Project. Overview of the Kids’ Inpatient Database (KID). 2017; https://www.hcup-us.ahrq.gov/kidoverview.jsp. Accessed August 30, 2017.
5. Healthcare Cost Utilization Project. Cost-to-Charge Ratio Files: 2012 Kids’ Inpatient Database (KID) User Guide. 2014; https://www.hcup-us.ahrq.gov/db/state/CCR2012KIDUserGuide.pdf. Accessed August 30, 2017.
6. Centers for Medicare & Medicaid Services. Medicare Program; Changes to the Hospital Inpatient Prospective Payment Systems and Fiscal Year 2005 Rates; Final Rule. Federal Register. 2004;69(154):48,939. PubMed
7. Muldoon JH. Structure and performance of different DRG classification systems for neonatal medicine. Pediatrics. 1999; 103(1 Suppl E): 302-318. PubMed
8. Averill R, Goldfield N, Muldoon J, Steinbeck B, Grant T. A Closer Look at All Patient Refined DRGs. J AHIMA. 2002; 73(1): 46-50. PubMed
9. Centers for Medicare & Medicaid Services. Design and development of the Diagnosis Related Group (DRG). https://www.cms.gov/ICD10Manual/version34-fullcode-cms/fullcode_cms/Design_and_development_of_the_Diagnosis_Related_Group_(DRGs)_PBL-038.pdf. Accessed December 6, 2017.
© 2018 Society of Hospital Medicine