User login
Hospitalists as Triagists: Description of the Triagist Role across Academic Medical Centers
Hospital medicine has grown dramatically over the past 20 years.1,2 A recent survey regarding hospitalists’ clinical roles showed an expansion to triaging emergency department (ED) medical admissions and transfers from outside hospitals.3 From the hospitalist perspective, triaging involves the evaluation of patients for potential admission.4 With scrutiny on ED metrics, such as wait times (https://www.medicare.gov/hospitalcompare/search.html), health system administrators have heightened expectations for efficient patient flow, which increasingly falls to hospitalists.5-7
Despite the growth in hospitalists’ triagist activities, there has been little formal assessment of their role. We hypothesized that this role differs from inpatient care in significant ways.6-8 We sought to describe the triagist role in adult academic inpatient medicine settings to understand the responsibilities and skill set required.
METHODS
Ten academic medical center (AMC) sites were recruited from Research Committee session attendees at the 2014 Society of Hospital Medicine national meeting and the 2014 Society of General Internal Medicine southern regional meeting. The AMCs were geographically diverse: three Western, two Midwestern, two Southern, one Northeastern, and two Southeastern. Site representatives were identified and completed a web-based questionnaire about their AMC (see Appendix 1 for the information collected). Clarifications regarding survey responses were performed via conference calls between the authors (STV, ESW) and site representatives.
Hospitalist Survey
In January 2018, surveys were sent to 583 physicians who worked as triagists. Participants received an anonymous 28-item RedCap survey by e-mail and were sent up to five reminder e-mails over six weeks (see Appendix 2 for the questions analyzed in this paper). Respondents were given the option to be entered in a gift card drawing.
Demographic information and individual workflow/practices were obtained. A 5-point Likert scale (strongly disagree – strongly agree) was used to assess hospitalists’ concurrence with current providers (eg, ED, clinic providers) regarding the management and whether patients must meet the utilization management (UM) criteria for admission. Time estimates used 5% increments and were categorized into four frequency categories based on the local modes provided in responses: Seldom (0%-10%), Occasional (15%-35%), Half-the-Time (40%-60%), and Frequently (65%-100%). Free text responses on effective/ineffective triagist qualities were elicited. Responses were included for analysis if at least 70% of questions were completed.
Data Analysis
Quantitative
Descriptive statistics were calculated for each variable. The Kruskal-Wallis test was used to evaluate differences across AMCs in the time spent on in-person evaluation and communication. Weighting, based on the ratio of hospitalists to survey respondents at each AMC, was used to calculate the average institutional percentages across the study sample.
Qualitative
Responses to open-ended questions were analyzed using thematic analysis.9 Three independent reviewers (STV, JC, ESW) read, analyzed, and grouped the responses by codes. Codes were then assessed for overlap and grouped into themes by one reviewer (STV). A table of themes with supporting quotes and the number of mentions was subsequently developed by all three reviewers. Similar themes were combined to create domains. The domains were reviewed by the steering committee members to create a consensus description (Appendix 3).
The University of Texas Health San Antonio’s Institutional Review Board and participating institutions approved the study as exempt.
RESULTS
Site Characteristics
Representatives from 10 AMCs reported data on a range of one to four hospitals for a total of 22 hospitals. The median reported that the number of medical patients admitted in a 24-hour period was 31-40 (range, 11-20 to >50). The median group size of hospitalists was 41-50 (range, 0-10 to >70).
The survey response rate was 40% (n = 235), ranging from 9%-70% between institutions. Self-identified female hospitalists accounted for 52% of respondents. Four percent were 25-29 years old, 66% were 30-39 years old, 24% were 40-49 years old, and 6% were ≥50 years old. The average clinical time spent as a triagist was 16%.
Description of Triagist Activities
The activities identified by the majority of respondents across all sites included transferring patients within the hospital (73%), and assessing/approving patient transfers from outside hospitals and clinics (82%). Internal transfer activities reported by >50% of respondents included allocating patients within the hospital or bed capacity coordination, assessing intensive care unit transfers, assigning ED admissions, and consulting other services. The ED accounted for an average of 55% of calls received. Respondents also reported being involved with the documentation related to these activities.
Similarities and Differences across AMCs
Two AMCs did not have a dedicated triagist; instead, physicians supervised residents and advanced practice providers. Among the eight sites with triagists, triaging was predominantly done by faculty physicians contacted via pagers. At seven of these sites, 100% of hospitalists worked as triagists. The triage service was covered by faculty physicians from 8-24 hours per day.
Bed boards and transfer centers staffed by registered nurses, nurse coordinators, house supervisors, or physicians were common support systems, though this infrastructure was organized differently across institutions. A UM review before admission was performed at three institutions 24 hours/day. The remaining institutions reviewed patients retrospectively.
Twenty-eight percent of hospitalists across all sites “Disagreed” or “Strongly disagreed” that a patient must meet UM criteria for admission. Forty-two percent had “Frequent” different opinions regarding patient management than the consulting provider.
Triagist and current provider communication practices varied widely across AMCs (Figure). There was significant variability in verbal communication (P = .02), with >70% of respondents at two AMCs reporting verbal communication at least half the time, but <30% reporting this frequency at two other AMCs. Respondents reported variable use of electronic communication (ie, notes/orders in the electronic health record) across AMCs (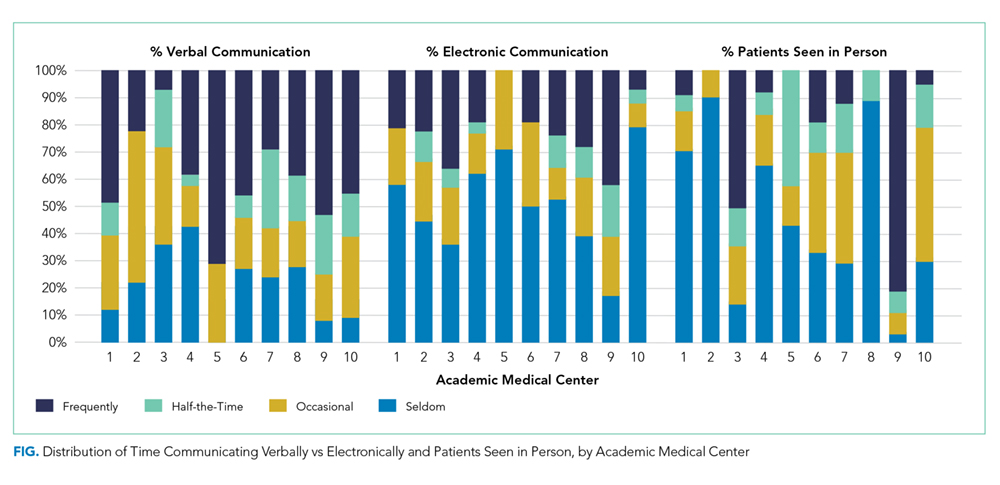
The practice of evaluating patients in person also varied significantly across AMCs (P < .0001, Figure). Across hospitalists, only 28% see patients in person about “Half-the-Time” or more.
Differences within AMCs
Variability within AMCs was greatest for the rate of verbal communication practices, with a typical interquartile range (IQR) of 20% to 90% among the hospitalists within a given AMC and for the rate of electronic communication with a typical IQR of 0% to 50%. For other survey questions, the IQR was typically 15 to 20 percentage points.
Thematic Analysis
We received 207 and 203 responses (88% and 86%, respectively) to the open-ended questions “What qualities does an effective triagist have?’ and ‘What qualities make a triagist ineffective?” We identified 22 themes for effective and ineffective qualities, which were grouped into seven domains (Table). All themes had at least three mentions by respondents. The three most frequently mentioned themes, communication skills, efficiency, and systems knowledge, had greater than 60 mentions.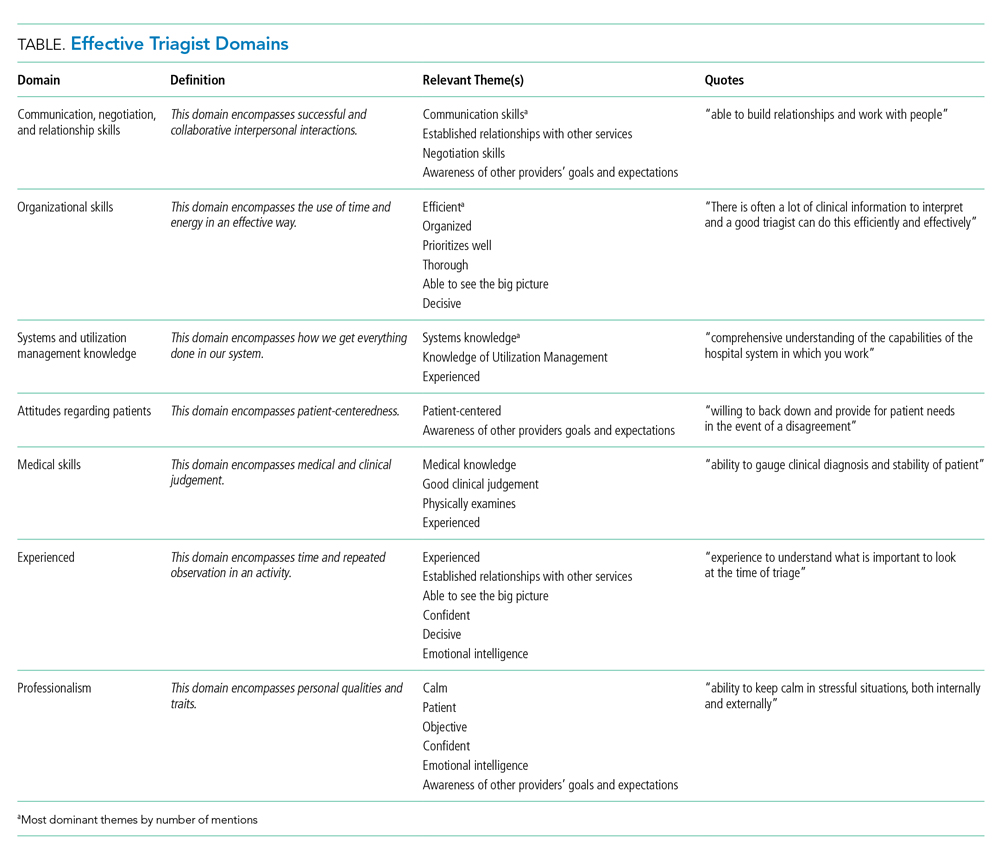
DISCUSSION
Our study of the triagist role at 10 AMCs describes critical triagist functions and identifies key findings across and within AMCs. Twenty-eight percent of hospitalists reported admitting patients even when the patient did not meet the admission criteria, consistent with previous research demonstrating the influence of factors other than clinical disease severity on triage decisions.10 However, preventable admissions remain a hospital-level quality metric.11,12 Triagists must often balance each patient’s circumstances with the complexities of the system. Juggling the competing demands of the system while providing patient-centered care can be challenging and may explain why attending physicians are more frequently filling this role.13
Local context/culture is likely to play a role in the variation across sites; however, compensation for the time spent may also be a factor. If triage activities are not reimbursable, this could lead to less documentation and a lower likelihood that patients are evaluated in person.14 This reason may also explain why all hospitalists were required to serve as a triagist at most sites.
Currently, no consensus definition of the triagist role has been developed. Our results demonstrate that this role is heterogeneous and grounded in the local healthcare system practices. We propose the following working definition of the triagist: a physician who assesses patients for admission, actively supporting the transition of the patient from the outpatient to the inpatient setting. A triagist should be equipped with a skill set that includes not only clinical knowledge but also emphasizes systems knowledge, awareness of others’ goals, efficiency, an ability to communicate effectively, and the knowledge of UM. We recommend that medical directors of hospitalist programs focus their attention on locally specific, systems-based skills development when orienting new hospitalists. The financial aspects of cost should be considered and delineated as well.
Our analysis is limited in several respects. Participant AMCs were not randomly chosen, but do represent a broad array of facility types, group size, and geographic regions. The low response rates at some AMCs may result in an inaccurate representation of those sites. Data was not obtained on hospitalists that did not respond to the survey; therefore, nonresponse bias may affect outcomes. This research used self-report rather than direct observation, which could be subject to recall and social desirability bias. Finally, our results may not be generalizable to nonacademic institutions.
CONCLUSION
The hospitalist role as triagist at AMCs emphasizes communication, organizational skills, efficiency, systems-based practice, and UM knowledge. Although we found significant variation across and within AMCs, internal transfer activities were common across programs. Hospitalist programs should focus on systems-based skills development to prepare hospitalists for the role. The skill set necessary for triagist responsibilities also has implications for internal medicine resident education.4 With increasing emphasis on value and system effectiveness in care delivery, further studies of the triagist role should be undertaken.
Acknowledgments
The TRIAGIST Collaborative Group consists of: Maralyssa Bann, MD, Andrew White, MD (University of Washington); Jagriti Chadha, MD (University of Kentucky); Joel Boggan, MD (Duke University); Sherwin Hsu, MD (UCLA); Jeff Liao, MD (Harvard Medical School); Tabatha Matthias, DO (University of Nebraska Medical Center); Tresa McNeal, MD (Scott and White Texas A&M); Roxana Naderi, MD, Khooshbu Shah, MD (University of Colorado); David Schmit, MD (University of Texas Health San Antonio); Manivannan Veerasamy, MD (Michigan State University).
Disclaimer
The views expressed in this article are those of the authors and do not necessarily reflect the po
1. Kisuule F, Howell EE. Hospitalists and their impact on quality, patient safety, and satisfaction. Obstet Gynecol Clin North Am. 2015; 42(3):433-446. https://doi.org/10.1016/j.ogc.2015.05.003.
2. Wachter, RM, Goldman, L. Zero to 50,000-The 20th anniversary of the hospitalist. N Engl J Med. 2016;375(11): 1009-1011. https://doi.org/10.1056/NEJMp1607958.
3. Vasilevskis EE, Knebel RJ, Wachter RM, Auerbach AD. California hospital leaders’ views of hospitalists: meeting needs of the present and future. J Hosp Med. 2009;4:528-534. https://doi.org/10.1002/jhm.529.
4. Wang ES, Velásquez ST, Smith CJ, et al. Triaging inpatient admissions: an opportunity for resident education. J Gen Intern Med. 2019; 34(5):754-757. https://doi.org/10.1007/s11606-019-04882-2.
5. Briones A, Markoff B, Kathuria N, et al. A model of a hospitalist role in the care of admitted patients in the emergency department. J Hosp Med. 2010;5(6):360-364. https://doi.org/10.1002/jhm.636.
6. Howell EE, Bessman ES, Rubin HR. Hospitalists and an innovative emergency department admission process. J Gen Intern Med. 2004;19:266-268. https://doi.org/10.1111/j.1525-1497.2004.30431.x.
7. Howell E, Bessman E, Marshall R, Wright S. Hospitalist bed management effecting throughput from the emergency department to the intensive care unit. J Crit Care. 2010;25:184-189. https://doi.org/10.1016/j.jcrc.2009.08.004.
8. Chadaga SR, Shockley L, Keniston A, et al. Hospitalist-led medicine emergency department team: associations with throughput, timeliness of patient care, and satisfaction. J Hosp Med. 2012;7:562-566. https://doi.org/10.1002/jhm.1957.
9. Braun, V. Clarke, V. Using thematic analysis in psychology. Qualitative Research in Psychology. 2006;77-101. https://doi.org/10.1191/1478088706qp063oa.
10. Lewis Hunter AE, Spatz ES, Bernstein SL, Rosenthal MS. Factors influencing hospital admission of non-critically ill patients presenting to the emergency department: a cross-sectional study. J Gen Intern Med. 2016;31(1):37-44. https://doi.org/10.1007/s11606-015-3438-8.
11. Patel KK, Vakharia N, Pile J, Howell EH, Rothberg MB. Preventable admissions on a general medicine service: prevalence, causes and comparison with AHRQ prevention quality indicators-a cross-sectional analysis. J Gen Intern Med. 2016;31(6):597-601. https://doi.org/10.1007/s11606-016-3615-4.
12. Daniels LM1, Sorita A2, Kashiwagi DT, et al. Characterizing potentially preventable admissions: a mixed methods study of rates, associated factors, outcomes, and physician decision-making. J Gen Intern Med. 2018;33(5):737-744. https://doi.org/10.1007/s11606-017-4285-6.
13. Howard-Anderson J, Lonowski S, Vangala S, Tseng CH, Busuttil A, Afsar-Manesh N. Readmissions in the era of patient engagement. JAMA Intern Med. 2014;174(11):1870-1872. https://doi.org/10.1001/jamainternmed.2014.4782.
14. Hinami K, Whelan CT, Miller JA, Wolosin RJ, Wetterneck TB, Society of Hospital Medicine Career Satisfaction Task Force. Job characteristics, satisfaction, and burnout across hospitalist practice models. J Hosp Med. 2012;7(5):402-410. https://doi.org/10.1002/jhm.1907
Hospital medicine has grown dramatically over the past 20 years.1,2 A recent survey regarding hospitalists’ clinical roles showed an expansion to triaging emergency department (ED) medical admissions and transfers from outside hospitals.3 From the hospitalist perspective, triaging involves the evaluation of patients for potential admission.4 With scrutiny on ED metrics, such as wait times (https://www.medicare.gov/hospitalcompare/search.html), health system administrators have heightened expectations for efficient patient flow, which increasingly falls to hospitalists.5-7
Despite the growth in hospitalists’ triagist activities, there has been little formal assessment of their role. We hypothesized that this role differs from inpatient care in significant ways.6-8 We sought to describe the triagist role in adult academic inpatient medicine settings to understand the responsibilities and skill set required.
METHODS
Ten academic medical center (AMC) sites were recruited from Research Committee session attendees at the 2014 Society of Hospital Medicine national meeting and the 2014 Society of General Internal Medicine southern regional meeting. The AMCs were geographically diverse: three Western, two Midwestern, two Southern, one Northeastern, and two Southeastern. Site representatives were identified and completed a web-based questionnaire about their AMC (see Appendix 1 for the information collected). Clarifications regarding survey responses were performed via conference calls between the authors (STV, ESW) and site representatives.
Hospitalist Survey
In January 2018, surveys were sent to 583 physicians who worked as triagists. Participants received an anonymous 28-item RedCap survey by e-mail and were sent up to five reminder e-mails over six weeks (see Appendix 2 for the questions analyzed in this paper). Respondents were given the option to be entered in a gift card drawing.
Demographic information and individual workflow/practices were obtained. A 5-point Likert scale (strongly disagree – strongly agree) was used to assess hospitalists’ concurrence with current providers (eg, ED, clinic providers) regarding the management and whether patients must meet the utilization management (UM) criteria for admission. Time estimates used 5% increments and were categorized into four frequency categories based on the local modes provided in responses: Seldom (0%-10%), Occasional (15%-35%), Half-the-Time (40%-60%), and Frequently (65%-100%). Free text responses on effective/ineffective triagist qualities were elicited. Responses were included for analysis if at least 70% of questions were completed.
Data Analysis
Quantitative
Descriptive statistics were calculated for each variable. The Kruskal-Wallis test was used to evaluate differences across AMCs in the time spent on in-person evaluation and communication. Weighting, based on the ratio of hospitalists to survey respondents at each AMC, was used to calculate the average institutional percentages across the study sample.
Qualitative
Responses to open-ended questions were analyzed using thematic analysis.9 Three independent reviewers (STV, JC, ESW) read, analyzed, and grouped the responses by codes. Codes were then assessed for overlap and grouped into themes by one reviewer (STV). A table of themes with supporting quotes and the number of mentions was subsequently developed by all three reviewers. Similar themes were combined to create domains. The domains were reviewed by the steering committee members to create a consensus description (Appendix 3).
The University of Texas Health San Antonio’s Institutional Review Board and participating institutions approved the study as exempt.
RESULTS
Site Characteristics
Representatives from 10 AMCs reported data on a range of one to four hospitals for a total of 22 hospitals. The median reported that the number of medical patients admitted in a 24-hour period was 31-40 (range, 11-20 to >50). The median group size of hospitalists was 41-50 (range, 0-10 to >70).
The survey response rate was 40% (n = 235), ranging from 9%-70% between institutions. Self-identified female hospitalists accounted for 52% of respondents. Four percent were 25-29 years old, 66% were 30-39 years old, 24% were 40-49 years old, and 6% were ≥50 years old. The average clinical time spent as a triagist was 16%.
Description of Triagist Activities
The activities identified by the majority of respondents across all sites included transferring patients within the hospital (73%), and assessing/approving patient transfers from outside hospitals and clinics (82%). Internal transfer activities reported by >50% of respondents included allocating patients within the hospital or bed capacity coordination, assessing intensive care unit transfers, assigning ED admissions, and consulting other services. The ED accounted for an average of 55% of calls received. Respondents also reported being involved with the documentation related to these activities.
Similarities and Differences across AMCs
Two AMCs did not have a dedicated triagist; instead, physicians supervised residents and advanced practice providers. Among the eight sites with triagists, triaging was predominantly done by faculty physicians contacted via pagers. At seven of these sites, 100% of hospitalists worked as triagists. The triage service was covered by faculty physicians from 8-24 hours per day.
Bed boards and transfer centers staffed by registered nurses, nurse coordinators, house supervisors, or physicians were common support systems, though this infrastructure was organized differently across institutions. A UM review before admission was performed at three institutions 24 hours/day. The remaining institutions reviewed patients retrospectively.
Twenty-eight percent of hospitalists across all sites “Disagreed” or “Strongly disagreed” that a patient must meet UM criteria for admission. Forty-two percent had “Frequent” different opinions regarding patient management than the consulting provider.
Triagist and current provider communication practices varied widely across AMCs (Figure). There was significant variability in verbal communication (P = .02), with >70% of respondents at two AMCs reporting verbal communication at least half the time, but <30% reporting this frequency at two other AMCs. Respondents reported variable use of electronic communication (ie, notes/orders in the electronic health record) across AMCs (
The practice of evaluating patients in person also varied significantly across AMCs (P < .0001, Figure). Across hospitalists, only 28% see patients in person about “Half-the-Time” or more.
Differences within AMCs
Variability within AMCs was greatest for the rate of verbal communication practices, with a typical interquartile range (IQR) of 20% to 90% among the hospitalists within a given AMC and for the rate of electronic communication with a typical IQR of 0% to 50%. For other survey questions, the IQR was typically 15 to 20 percentage points.
Thematic Analysis
We received 207 and 203 responses (88% and 86%, respectively) to the open-ended questions “What qualities does an effective triagist have?’ and ‘What qualities make a triagist ineffective?” We identified 22 themes for effective and ineffective qualities, which were grouped into seven domains (Table). All themes had at least three mentions by respondents. The three most frequently mentioned themes, communication skills, efficiency, and systems knowledge, had greater than 60 mentions.
DISCUSSION
Our study of the triagist role at 10 AMCs describes critical triagist functions and identifies key findings across and within AMCs. Twenty-eight percent of hospitalists reported admitting patients even when the patient did not meet the admission criteria, consistent with previous research demonstrating the influence of factors other than clinical disease severity on triage decisions.10 However, preventable admissions remain a hospital-level quality metric.11,12 Triagists must often balance each patient’s circumstances with the complexities of the system. Juggling the competing demands of the system while providing patient-centered care can be challenging and may explain why attending physicians are more frequently filling this role.13
Local context/culture is likely to play a role in the variation across sites; however, compensation for the time spent may also be a factor. If triage activities are not reimbursable, this could lead to less documentation and a lower likelihood that patients are evaluated in person.14 This reason may also explain why all hospitalists were required to serve as a triagist at most sites.
Currently, no consensus definition of the triagist role has been developed. Our results demonstrate that this role is heterogeneous and grounded in the local healthcare system practices. We propose the following working definition of the triagist: a physician who assesses patients for admission, actively supporting the transition of the patient from the outpatient to the inpatient setting. A triagist should be equipped with a skill set that includes not only clinical knowledge but also emphasizes systems knowledge, awareness of others’ goals, efficiency, an ability to communicate effectively, and the knowledge of UM. We recommend that medical directors of hospitalist programs focus their attention on locally specific, systems-based skills development when orienting new hospitalists. The financial aspects of cost should be considered and delineated as well.
Our analysis is limited in several respects. Participant AMCs were not randomly chosen, but do represent a broad array of facility types, group size, and geographic regions. The low response rates at some AMCs may result in an inaccurate representation of those sites. Data was not obtained on hospitalists that did not respond to the survey; therefore, nonresponse bias may affect outcomes. This research used self-report rather than direct observation, which could be subject to recall and social desirability bias. Finally, our results may not be generalizable to nonacademic institutions.
CONCLUSION
The hospitalist role as triagist at AMCs emphasizes communication, organizational skills, efficiency, systems-based practice, and UM knowledge. Although we found significant variation across and within AMCs, internal transfer activities were common across programs. Hospitalist programs should focus on systems-based skills development to prepare hospitalists for the role. The skill set necessary for triagist responsibilities also has implications for internal medicine resident education.4 With increasing emphasis on value and system effectiveness in care delivery, further studies of the triagist role should be undertaken.
Acknowledgments
The TRIAGIST Collaborative Group consists of: Maralyssa Bann, MD, Andrew White, MD (University of Washington); Jagriti Chadha, MD (University of Kentucky); Joel Boggan, MD (Duke University); Sherwin Hsu, MD (UCLA); Jeff Liao, MD (Harvard Medical School); Tabatha Matthias, DO (University of Nebraska Medical Center); Tresa McNeal, MD (Scott and White Texas A&M); Roxana Naderi, MD, Khooshbu Shah, MD (University of Colorado); David Schmit, MD (University of Texas Health San Antonio); Manivannan Veerasamy, MD (Michigan State University).
Disclaimer
The views expressed in this article are those of the authors and do not necessarily reflect the po
1. Kisuule F, Howell EE. Hospitalists and their impact on quality, patient safety, and satisfaction. Obstet Gynecol Clin North Am. 2015; 42(3):433-446. https://doi.org/10.1016/j.ogc.2015.05.003.
2. Wachter, RM, Goldman, L. Zero to 50,000-The 20th anniversary of the hospitalist. N Engl J Med. 2016;375(11): 1009-1011. https://doi.org/10.1056/NEJMp1607958.
3. Vasilevskis EE, Knebel RJ, Wachter RM, Auerbach AD. California hospital leaders’ views of hospitalists: meeting needs of the present and future. J Hosp Med. 2009;4:528-534. https://doi.org/10.1002/jhm.529.
4. Wang ES, Velásquez ST, Smith CJ, et al. Triaging inpatient admissions: an opportunity for resident education. J Gen Intern Med. 2019; 34(5):754-757. https://doi.org/10.1007/s11606-019-04882-2.
5. Briones A, Markoff B, Kathuria N, et al. A model of a hospitalist role in the care of admitted patients in the emergency department. J Hosp Med. 2010;5(6):360-364. https://doi.org/10.1002/jhm.636.
6. Howell EE, Bessman ES, Rubin HR. Hospitalists and an innovative emergency department admission process. J Gen Intern Med. 2004;19:266-268. https://doi.org/10.1111/j.1525-1497.2004.30431.x.
7. Howell E, Bessman E, Marshall R, Wright S. Hospitalist bed management effecting throughput from the emergency department to the intensive care unit. J Crit Care. 2010;25:184-189. https://doi.org/10.1016/j.jcrc.2009.08.004.
8. Chadaga SR, Shockley L, Keniston A, et al. Hospitalist-led medicine emergency department team: associations with throughput, timeliness of patient care, and satisfaction. J Hosp Med. 2012;7:562-566. https://doi.org/10.1002/jhm.1957.
9. Braun, V. Clarke, V. Using thematic analysis in psychology. Qualitative Research in Psychology. 2006;77-101. https://doi.org/10.1191/1478088706qp063oa.
10. Lewis Hunter AE, Spatz ES, Bernstein SL, Rosenthal MS. Factors influencing hospital admission of non-critically ill patients presenting to the emergency department: a cross-sectional study. J Gen Intern Med. 2016;31(1):37-44. https://doi.org/10.1007/s11606-015-3438-8.
11. Patel KK, Vakharia N, Pile J, Howell EH, Rothberg MB. Preventable admissions on a general medicine service: prevalence, causes and comparison with AHRQ prevention quality indicators-a cross-sectional analysis. J Gen Intern Med. 2016;31(6):597-601. https://doi.org/10.1007/s11606-016-3615-4.
12. Daniels LM1, Sorita A2, Kashiwagi DT, et al. Characterizing potentially preventable admissions: a mixed methods study of rates, associated factors, outcomes, and physician decision-making. J Gen Intern Med. 2018;33(5):737-744. https://doi.org/10.1007/s11606-017-4285-6.
13. Howard-Anderson J, Lonowski S, Vangala S, Tseng CH, Busuttil A, Afsar-Manesh N. Readmissions in the era of patient engagement. JAMA Intern Med. 2014;174(11):1870-1872. https://doi.org/10.1001/jamainternmed.2014.4782.
14. Hinami K, Whelan CT, Miller JA, Wolosin RJ, Wetterneck TB, Society of Hospital Medicine Career Satisfaction Task Force. Job characteristics, satisfaction, and burnout across hospitalist practice models. J Hosp Med. 2012;7(5):402-410. https://doi.org/10.1002/jhm.1907
© 2019 Society of Hospital Medicine
Housestaff Teams and Patient Outcomes
Since the Institute of Medicine Report To Err is Human, increased attention has been paid to improving the care of hospitalized patients.[1] Strategies include utilization of guidelines and pathways, and the application of quality improvement techniques to improve or standardize processes. Despite improvements in focused areas such as prevention of hospital‐acquired infections, evidence suggests that outcomes for hospitalized patients remain suboptimal.[2] Rates of errors and hospital‐related complications such as falls, decubitus ulcers, and infections remain high,[3, 4, 5] and not all patients receive what is known to be appropriate care.[6]
Many attempts to improve inpatient care have used process‐improvement approaches, focusing on impacting individuals' behaviors, or on breaking down processes into component parts. Examples include central line bundles or checklists.[7, 8] These approaches attempt to ensure that providers do things in a standardized way, but are implicitly based on the reductionist assumption that we can break processes down into predictable parts to improve the system. An alternative way to understand clinical systems is based on interdependencies between individuals in the system, or the ways in which parts of the system interact with each other, which may be unpredictable over time.[1, 9] Whereas these interdependencies include care processes, they also encompass the providers who care for patients. Providers working together vary in terms of the kinds of relationships they have with each other. Those relationships are crucial to system function because they are the foundation for the interactions that lead to effective patient care.
The application of several frameworks or approaches for considering healthcare systems in terms of relationships highlights the importance of this way of understanding system function. The include complexity science,[1, 7] relational coordination (which is grounded in complexity science),[10] high reliability,[11] and the Big Five for teamwork.[12]
Research indicates that interactions among healthcare providers can have important influences on outcomes.[13, 14, 15, 16, 17] Additionally, the initial implementation of checklists to prevent central‐line associated infections appeared to change provider relationships in a way that significantly influenced their success.[18] For example, positive primary care clinic member relationships as assessed by the Lanham framework have been associated with better chronic care model implementation, learning, and patient experience of care.[19, 20] This framework, which we apply here, identifies 7 relationship characteristics: (1) trust; (2) diversity; (3) respect; (4) mindfulness, or being open to new ideas from others; (5) heedfulness, or an understanding of how one's roles influence those of others; (6) use of rich in‐person or verbal communication, particularly for potentially ambiguous information open to multiple interpretations; and (7) having a mixture of social and task relatedness among teams, or relatedness outside of only work‐related tasks.[19] Relationships within surgical teams that are characterized by psychological safety and diversity are associated with successful uptake of new techniques and decreased mortality.[13, 14] Relationships are important because the ability of patients and providers to learn and make sense of their patients' illnesses is grounded in relationships.
We sought to better understand and characterize inpatient physician teams' relationships, and assess the association between team relationships as evaluated by Lanham's framework and outcomes for hospitalized patients. Data on relationships among inpatient medical teams are few, despite the fact that these teams provide a great proportion of inpatient care. Additionally, the care of hospitalized medical patients is complex and uncertain, often involving multiple providers, making provider relationships potentially even more important to outcomes than in other settings.
METHODS
Overview
We conducted an observational, convergent mixed‐methods study of inpatient medicine teams.[21, 22, 23] We focused on inpatient physician teams, defining them as the functional work group responsible for medical decision making in academic medical centers. Physician teams in this context have been studied in terms of social hierarchy, authority, and delegation.[24, 25, 26] Focusing on the relationships within these groups could provide insights into strategies to mitigate potential negative effects of hierarchy. We recognize that other providers are closely involved in the care of hospitalized patients, and although we did not have standard interactions between physicians, nurses, case managers, and other providers that we could consistently observe, we did include interactions with these other providers in our observations and assessments of team relationships. Because this work is among the first in inpatient medical teams, we chose to study a small number of teams in great depth, allowing us to make rich assessments of team relationships.
We chose patient outcomes of length of stay (LOS), unnecessary LOS (ULOS), and complication rates, adjusted for patient characteristics and team workload. LOS is an important metric of inpatient care delivery. We feel ULOS is an aspect of LOS that is dependent on the physician team, as it reflects their preparation of the patient for discharge. Finally, we chose complication rates because hospital‐acquired conditions and complications are important contributors to inpatient morbidity, and because recent surgical literature has identified complication rates as a contributor to mortality that could be related to providers' collective ability to recognize complications and act quickly.
This study was approved by the institutional review board at the University of Texas Health Science Center at San Antonio (UTHSCSA), the Research and Development Committee for the South Texas Veterans Health Care System (STVHCS), and the Research Committee at University Health System (UHS). All physicians consented to participate in the study. We obtained a waiver of consent for inclusion of patient data.
Setting and Study Participants
This study was conducted at the 2 UTHSCSA primary teaching affiliates. The Audie L. Murphy Veterans Affairs Hospital is the 220‐bed acute‐care hospital of the STVHCS. University Hospital is the 614‐bed, level‐I trauma, acute‐care facility for UHS, the county system for Bexar County, which includes the San Antonio, Texas major metropolitan area.
The inpatient internal medicine physician team was our unit of study. Inpatient medicine teams consisted of 1 faculty attending physician, 1 postgraduate year (PGY)‐2 or PGY‐3 resident, and 2 PGY‐1 members. In addition, typically 2 to 3 third‐year medical students were part of the team, and a subintern was sometimes present. Doctor of Pharmacy faculty and students were also occasionally part of the team. Social workers and case managers often joined team rounds for portions of the time, and nurses sometimes joined bedside rounds on specific patients. These teams admit all medicine patients with the exception of those with acute coronary syndromes, new onset congestive heart failure, or arrhythmias. Patients are randomly assigned to teams based on time of admission and call schedules.
Between these 2 hospitals, there are 10 inpatient medicine teams caring for patients, with a pool of over 40 potential faculty attendings. Our goal was to observe teams that would be most likely to vary in terms of their relationship characteristics and patient outcomes through observing teams with a range of individual members. We used a purposeful sampling approach to obtain a diverse sample, sampling based on physician attributes and time of year.[16, 17] Three characteristics were most important: attending physician years of experience, attending involvement in educational and administrative leadership, and the presence of struggling resident members, as defined by being on probation or having been discussed in the residency Clinical Competency Committee. We did not set explicit thresholds in terms of attending experience, but instead sought to ensure a range. The attendings we observed were more likely to be involved in education and administrative leadership activities, but were otherwise similar to those we did not observe in terms of years of experience. We included struggling residents to observe individuals with a range of skill sets, and not just high‐performing individuals. We obtained attending information based on our knowledge of the attending faculty pool, and from the internal medicine residency program. We sampled across the year to ensure a diversity of trainee experience, but did not observe teams in either July or August, as these months were early in the academic year. Interns spend approximately 5 months per year on inpatient services, whereas residents spend 2 to 3 months per year. Thus, interns but not residents observed later in the year might have spent significantly more time on an inpatient service. However, in all instances, none of the team members observed had worked together previously.
Data Collection
Data were collected over nine 1‐month periods from September 2008 through June 2011. Teams were observed daily for 2‐ to 4‐week periods during morning rounds, the time when the team discusses each patient and makes clinical decisions. Data collection started on the first day of the month, the first day that all team members worked together, and continued for approximately 27 days, the last day before the resident rotated to a different service. By comprehensively and systematically observing these teams' daily rounds, we obtained rich, in‐depth data with multiple data points, enabling us to assess specific team behaviors and interactions.
During the third and fourth months, we collected data on teams in which the attending changed partway through. We did this to understand the impact of individual attending change on team relationships. Because the team relationships differed with each attending, we analyzed them separately. Thus, we observed 7 teams for approximately 4‐week periods and 4 teams for approximately 2‐week periods.
Observers arrived in the team room prior to rounds to begin observations, staying until after rounds were completed. Detailed free‐text field notes were taken regarding team activities and behaviors, including how the teams made patient care decisions. Field notes included: length of rounds, which team members spoke during each patient discussion, who contributed to management discussions, how information from consultants was incorporated, how communication with others outside of the team occurred, how team members spoke with each other including the types of words used, and team member willingness to perform tasks outside of their usually defined role, among others. Field notes were collected in an open‐ended format to allow for inductive observations. Observers also recorded clinical data daily regarding each patient, including admission and discharge dates, and presenting complaint.
The observation team consisted of the principle investigator (PI) (hospitalist) and 2 research assistants (a graduate‐level medical anthropologist and social psychologist), all of whom were trained by a qualitative research expert to systematically collect data related to topics of interest. Observers were instructed to record what the teams were doing and talking about at all times, noting any behaviors that they felt reflected how team members related to each other and came to decisions about their patients, or that were characteristic of the team. To ensure consistency, the PI and 1 research assistant conducted observations jointly at the start of data collection for each team, checking concordance of observations daily using a percent agreement until general agreement on field note content and patient information reached 90%. Two individuals observed 24 days of data collection, representing 252 patient discussions (13% of observed discussions).
An age‐adjusted Charlson‐Deyo comorbidity score was calculated for each patient admitted to each team, using data from rounds and from each hospital's electronic health records (EHR).[27] We collected data regarding mental health conditions for each patient (substance use, mood disorder, cognitive disorder, or a combination) because these comorbidities could impact LOS or ULOS. Discharge diagnoses were based on the discharge summary in the EHR. We also collected data daily regarding team census and numbers of admissions to and discharges from each team to assess workload.
Three patient outcomes were measured: LOS, ULOS, and complications. LOS was defined as the total number of days the patient was in the hospital. ULOS was defined as the number of days a patient remained in the hospital after the day the team determined the patient was medically ready for discharge (assessed by either discussion on rounds or EHR documentation). ULOS may occur when postdischarge needs have been adequately assessed, or because of delays in care, which may be related to provider communication during the hospitalization. Complications were defined on a per‐patient, per‐day basis in 2 ways: the development of a new problem in the hospital, for example acute kidney injury, a hospital‐acquired infection, or delirium, or by the team noting a clinical deterioration after at least 24 hours of clinical stability, such as the patient requiring transfer to a higher level of care. Complications were determined based on discussions during rounds, with EHR verification if needed.
Analysis Phase I: Assessment of Relationship Characteristics
After the completion of data collection, field notes were reviewed by a research team member not involved in the original study design or primary data collection (senior medical student). We took this approach to guard against biasing the reviewer's view of team behaviors, both in terms of not having conducted observations of the teams and being blinded to patient outcomes.
The reviewer completed a series of 3 readings of all field notes. The first reading provided a summary of the content of the data and the individual teams. Behavioral patterns of each team were used to create an initial team profile. The field notes and profiles were reviewed by the PI and a coauthor not involved in data collection to ensure that the profiles adequately reflected the field notes. No significant changes to the profiles were made based on this review. The profiles were discussed at a meeting with members of the larger research team, including the PI, research assistants, and coinvestigators (with backgrounds in medicine, anthropology, and information and organization management). Behavior characteristics that could be used to distinguish teams were identified in the profiles using a grounded theory approach.
The second review of field notes was conducted to test the applicability of the characteristics identified in the first review. To systematically record the appearance of the behaviors, we created a matrix with a row for each behavior and columns for each team to note whether they exhibited each behavior. If the behavior was exhibited, specific examples were cataloged in the matrix. This matrix was reviewed and refined by the research team. During the final field note review meeting, the research team compared the summary matrix for each team, with the specific behaviors noted during the first reading of the field notes to ensure that all behaviors were recorded.
After cataloging behaviors, the research team assigned each behavior to 1 of the 7 Lanham relationship characteristics. We wanted to assess our observations against a relationship framework to ensure that we were able to systematically assess all aspects of relationships. The Lanham framework was initially developed based on a systematic review of the organizational and educational literatures, making it relevant to the complex environment of an academic medical inpatient team and allowing us to assess relationships at a fine‐grained, richly detailed level. This assignment was done by the author team as a group. Any questions were discussed and different interpretations resolved through consensus. The Lanham framework has 7 characteristics.[19] Based on the presence of behaviors associated with each relationship characteristic, we assigned a point to each team for each relationship characteristic observed. We considered a behavior type to be present if we observed it on at least 3 occasions on separate days. Though we used a threshold of at least 3 occurrences, most teams that did not receive a point for a particular characteristic did not have any instances in which we observed the characteristic. This was particularly true for trust and mindfulness, and least so for social/task relatedness. By summing these points, we calculated a total relationship score for each team, with potential scores ranging from 0 (for teams exhibiting no behaviors reflecting a particular relationship characteristic) to 7.
Analysis Phase II: Factor Analysis
To formally determine which relationship characteristics were most highly related, data were submitted to a principal components factor analysis using oblique rotation. Item separation was determined by visual inspection of the scree plot and eigenvalues over 1.
Analysis Phase III: Assessing the Association between Physician Team Relationship Characteristics and Patient Outcomes
We examined the association between team relationships and patient outcomes using team relationship scores. For the LOS/ULOS analysis, we only included patients whose entire hospitalization occurred under the care of the team we observed. Patients who were on the team at the start of the month, were transferred from another service, or who remained hospitalized after the end of the team's time together were excluded. The longest possible LOS for patients whose entire hospitalization occurred on teams that were observed for half a month was 12 days. To facilitate accurate comparison between teams, we only included patients whose LOS was 12 days.
Complication rates were defined on a per‐patient per‐day basis to normalize for different team volumes and days of observation. For this analysis, we included patients who remained on the team after data collection completion, patients transferred to another team, or patients transferred from another team. However, we only counted complications that occurred at least 24 hours following transfer to minimize the likelihood that the complication was related to the care of other physicians.
Preliminary analysis involved inspection and assessment of the distribution of all variables followed, by a general linear modeling approach to assess the association between patient and workload covariates and outcomes.[28, 29] Because we anticipated that outcome variables would be markedly skewed, we also planned to assess the association between relationship characteristics with outcomes using the Kruskal‐Wallis rank sum test to compare groups with Dunn's test[30] for pairwise comparisons if overall significance occurred.[31] There are no known acceptable methods for covariate adjustments using the Kruskal‐Wallis method. All models were run using SAS software (SAS Institute Inc., Cary, NC).[32]
RESULTS
The research team observed 1941 discussions of 576 individual patients. Observations were conducted over 352 hours and 54 minutes, resulting in 741 pages of notes (see Supporting Table 1 in the online version of this article for data regarding individual team members). Teams observed over half‐months are referred to with a and b designations.
| Relationship Characteristic | Definition | Thirteen Types of Behaviors Observed in Field Notes | Observed Examples |
|---|---|---|---|
| Trust | Willingness to be vulnerable to others | Use of we instead of you or I by the attending | Where are we going with this guy? |
| Attending admitting I don't know | Let's go talk to him, I can't figure this out | ||
| Asking questions to help team members to think through problems | Will the echo change our management? How will it help us? | ||
| Diversity | Including different perspectives and different thinking | Team member participation in conversations about patients that are not theirs | One intern is presenting, another intern asks a question, and the resident joins the discussion |
| Inclusion of perspectives of those outside the team (nursing and family members) | Taking a break to call the nurse, having a family meeting | ||
| Respect | Valuing the opinions of others, honest and tactful interactions | Use of positive reinforcement by the attending | Being encouraging of the medical student's differential, saying excellent |
| How the team talks with patients | Asking if the patient has any concerns, what they can do to make them comfortable | ||
| Heedfulness | Awareness of how each person's roles impact the rest of the team | Team members performing tasks not expected of their role | One intern helping another with changing orders to transfer a patient |
| Summarizing plans and strategizing | Attending recaps the plan for the day, asks what they can do | ||
| Mindfulness | Openness to new ideas/free discussion about what is and is not working | Entire team engaged in discussion | Attending asks the medical student, intern, and resident what they think is going on |
| Social relatedness | Having socially related interactions | Social conversation among team members | Intern talks about their day off |
| Jokes by the attending | Showers and a bowel movement is the key to making people happy | ||
| Appropriate use of rich communication | Use of in‐person communication for sensitive or difficult issues | Using verbal communication with consultants or family | Intern is on the phone with the pharm D because there is a problem with the medication |
Creation of team profiles yielded 13 common behavior characteristics that were inductively identified and that could potentially distinguish teams, including consideration of perspectives outside of the team and team members performing tasks normally outside of their roles. Table 1 provides examples of and summarizes observed behaviors using examples from the field notes, mapping these behavior characteristics onto the Lanham relationship characteristics. The distribution of relationship characteristics and scores for each team are shown in Table 2.
| Relationship Characteristic | Team | ||||||||||
|---|---|---|---|---|---|---|---|---|---|---|---|
| 1 | 2 | 3a | 3b | 4a | 4b | 5 | 6 | 7 | 8 | 9 | |
| Trust | 0 | 0 | 1 | 0 | 0 | 0 | 1 | 0 | 1 | 1 | 1 |
| Diversity | 0 | 1 | 1 | 1 | 0 | 0 | 0 | 0 | 1 | 1 | 1 |
| Respect | 0 | 1 | 1 | 1 | 0 | 1 | 0 | 0 | 1 | 1 | 1 |
| Heedfulness | 0 | 1 | 1 | 0 | 1 | 0 | 1 | 0 | 1 | 1 | 1 |
| Mindfulness | 0 | 0 | 1 | 0 | 0 | 1 | 1 | 0 | 1 | 1 | 1 |
| Social/task relatedness | 0 | 1 | 1 | 0 | 1 | 1 | 1 | 0 | 1 | 1 | 1 |
| Rich/lean communication | 0 | 1 | 1 | 0 | 0 | 0 | 1 | 0 | 1 | 1 | 0 |
| Relationship score (no. of characteristics observed) | 0 | 5 | 7 | 2 | 2 | 3 | 5 | 0 | 7 | 7 | 6 |
Correlation between relationship characteristics ranged from 0.32 to 0.95 (see Supporting Table 2 in the online version of this article). Mindfulness and trust are more highly correlated with each other than with other variables, as are diversity and respect. We performed a principal components factor analysis. Based on scree plot inspection and eigenvalues >1, we kept 3 factors that explained 85% of the total variance (see Supporting Table 3 in the online version of this article).
| No. of Relationship Characteristics | |||
|---|---|---|---|
| 02 | 35 | 67 | |
| |||
| LOS, d, n=293 | |||
| Median | 4 | 5 | 3 |
| IQR | 5 | 4 | 3 |
| Mean | 4.7 (2.72) | 4.7 (2.52) | 4.1 (2.51), P=0.12a |
| ULOS, d, n=293 | |||
| Median | 0 | 0 | 0 |
| IQR | 0 | 0 | 0 |
| Mean | 0.37 (0.99) | 0.33 (0.96) | 0.13 (0.56), P=0.09a |
| Complications (per patient per day), n=398 | |||
| Median | 0 | 0 | 0 |
| IQR | 1 | 1 | 0 |
| Mean | 0.58 (1.06) | 0.45 (0.77) | 0.18 (0.59), P=0.001 compared to teams with 02 or 35 characteristics |
Our analyses of LOS and ULOS included 298 of the 576 patients. Two hundred sixty‐seven patients were excluded because their entire LOS did not occur while under the care of the observed teams. Eleven patients were removed from the analysis because their LOS was >12 days. The analysis of complications included 398 patients. In our preliminary general linear modeling approach, only patient workload was significantly associated with outcomes using a cutoff of P=0.05. Charlson‐Deyo score and mental health comorbidities were not associated with outcomes.
The results of the Kruskal‐Wallis test show the patient average ranking on each of the outcome variables by 3 groups (Table 3). Overall, teams with higher relationship scores had lower rank scores on all outcomes measures. However, the only statistically significant comparisons were for complications. Teams having 6 to 7 characteristics had a significantly lower complication rate ranking than teams with 0 to 2 and 3 to 5 (P=0.001). We did not find consistent differences between individual teams or groups of teams with relationship scores from 0 to 2, 3 to 5, and 6 to 7 with regard to Charlson score, mental health issues, or workload. The only significant differences were between Charlson‐Deyo scores for patients admitted to teams with low relationship scores of 0 to 2 versus high relationship scores of 6 to 7 (6.7 vs 5.1); scores for teams with relationship scores of 3 to 5 were not significantly different from the low or high groups.
Table 4 shows the Kruskal‐Wallace rank test results for each group of relationship characteristics identified in the factor analysis based on whether teams displayed all or none of the characteristics in the factor. There were no differences in these groupings for LOS. Teams that exhibited both mindfulness and trust had lower ranks on ULOS than teams that did not have either. Similarly, teams with heedfulness, social‐task relatedness, and more rich communication demonstrated lower ULOS rankings than teams who did not have all 3 characteristics.
| Mind/Trust | Diversity/Respect | Heed/Relate/Communicate | ||||
|---|---|---|---|---|---|---|
| Patient Outcome | None | Both | None | Both | None | All 3 |
| ||||||
| LOS, d, n=293 | ||||||
| Median | 4 | 4 | 4 | 4 | 4 | 4 |
| IQR | 5 | 3 | 4.5 | 3 | 4 | 4 |
| Mean | 4.7 (2.6) | 4.2 (2.5) | 4.7 (2.6) | 4.3 (2.5) | 4.4 (2.6) | 4.4 (2.6) |
| P value | 0.06a | 0.23a | 0.85a | |||
| ULOS, d, n=293 | ||||||
| Median | 0 | 0 | 0 | 0 | 0 | 0 |
| IQR | 0 | 0 | 0 | 0 | 0 | 0 |
| Mean | 0.39 (1.01) | 0.15 (0.62) | 0.33 (0.92) | 0.18 (0.71) | 0.32 (0.93) | 0.18 (0.69) |
| P value | 0.009 | 0.06 | 0.03 | |||
| Complications (per patient), n=389 | ||||||
| Median | 0 | 0 | 0 | 0 | 0 | 0 |
| IQR | 1 | 0 | 1 | 0 | 1 | 0 |
| Mean | 0.58 (1.01) | 0.19 (0.58) | 0.47 (0.81) | 0.29 (0.82) | 0.26 (0.92) | 0.28 (0.70) |
| P value | <0.0001 | 0.001 | 0.02 | |||
DISCUSSION
Relationships are critical to team function because they are the basis for the social interactions that are central to patient care. These interactions include how providers recognize and make sense of what is happening with patients, and how they learn to care for patients more effectively. Additionally, the high task interdependencies among inpatient providers require effective relationships for optimal care. In our study, inpatient medicine physician teams' relationships varied, and these differences were associated with ULOS and complications. Relationship characteristics are not mutually exclusive, and as our factor analysis demonstrates, are intercorrelated. Trust and mindfulness appear to be particularly important. Trust may foster psychological safety that in turn promotes the willingness of individuals to contribute their thoughts and ideas.[13] In low‐trust teams, providers may fear a negative impact for bringing forward a concern based on limited data. Mindful teams may be more likely to notice nuanced changes, or are more likely to talk when things just do not appear to be going in the right direction with the patient. In the case of acutely ill medical patients, trust and mindfulness may lead to an increased likelihood that clinical changes are recognized and discussed quickly. For example, on a team characterized by trust and mindfulness, the entire team was typically involved in care discussions, and the interns and students frequently asked a lot of questions, even regarding the care of patients they were not directly following. We observed that these questions and discussions often led the team to realize that they needed to make a change in management decisions (eg, discontinuing Bactrim, lowering insulin doses, adjusting antihypertensives, premedicating for intravenous contrast) that they had not caught in the assessment and plan portion of the patient care discussion. In another example, a medical student asked a tentative question after a patient needed to go quickly to the bathroom while they were examining her, leading the team to ask more questions that led to a more rapid evaluation of a potential urinary tract infection. This finding is consistent with the description of failure to rescue among surgical patients, in which mortality has been associated with the failure to recognize complications rapidly and act effectively.[33]
Our findings are limited in several ways. First, these data are from a single academic institution. Although we sought diversity among our teams and collected data across 2 hospitals, there may be local contextual factors that influenced our results. Second, our data demonstrate an association, but not causality. Our findings should be tested in studies that assess causality and potential mechanisms through which relationships influence outcomes. Third, the individuals observing the teams had some knowledge of patient outcomes through hearing patient discussions. However, by involving individuals who did not participate in observations and were blinded to outcomes in assessing team relationships, we addressed this potential bias. Fourth, our observations were largely focused on physician teams, not directly including other providers. Our difficulty in observing regular interactions between physicians and other providers underscores the need to increase contact among those caring for hospitalized patients, such as occurs through multidisciplinary rounds. We did include team communication with other disciplines in our assessment of the relationship characteristics of diversity and rich communication. Finally, our analysis was limited by our sample size. We observed a relatively small number of teams. Although we benefitted from seeing the change in team relationships that occurred with attending changes halfway through some of our data collection months, this did limit the number of patients we could include in our analyses. Though we did not observe obvious differences in relationships between the teams observed across the 2 hospitals, the small number of teams and hospitals precluded our ability to perform multilevel modeling analyses, which would have allowed us to assess or account for the influence of team or organizational factors. However, this small sample size did allow for a richer assessment of team behaviors.
Although preliminary, our findings are an important step in understanding the function of inpatient medical teams not only in terms of processes of care, but also in terms of relationships. Patient care is a social activity, requiring effective communication to develop working diagnoses, recognize changes in patients' clinical courses, and formulate effective treatment plans during and after hospitalization. Future work could follow several directions. One would be to assess the causal mechanisms through which relationships influence patient outcomes. These may include sensemaking, learning, and improved coordination. Positive relationships may facilitate interaction of tacit and explicit information, facilitating the creation of understandings that foster more effective patient care.[34] The dynamic nature of relationships and how patient outcomes in turn feed back into relationships could be an area of exploration. This line of research could build on the idea of teaming.[35] Understanding relationships across multidisciplinary teams or with patients and families would be another direction. Finally, our results could point to potential interventions to improve patient outcomes through improving relationships. Better understanding of the nature of effective relationships among providers should enable us to develop more effective strategies to improve the care of hospitalized patients. In the larger context of payment reforms that require greater coordination and communication among and across providers, a greater understanding of how relationships influence patient outcomes will be important.
Acknowledgements
The authors thank the physicians involved in this study and Ms. Shannon Provost for her involvement in discussions of this work.
Disclosures: The research reported herein was supported by the Department of Veterans Affairs, Veterans Health Administration, Health Services Research and Development Service (CDA 07‐022). Investigator salary support was provided through this funding, and through the South Texas Veterans Health Care System. The views expressed in this article are those of the authors and do not necessarily reflect the position or policy of the Department of Veterans Affairs. Dr. McDaniel receives support from the IC[2] Institute of the University of Texas at Austin. Dr. Luci Leykum had full access to all of the data in the study and takes responsibility for the integrity of the data and the accuracy of the data analysis. The authors report no conflicts of interest.
- . Redesigning health care with insights from the science of complex adaptive systems. In: Crossing the Quality Chasm: A New Heath System for the 21st Century. Washington, DC: National Academy of Sciences; 2000:309–322.
- , , , , , . Temporal trends in rates of patient harm resulting from medical care. N Engl J Med. 2010;323(22):2124–2135.
- , , , et al. Circumstances of patient falls and injuries in 9 hospitals in a mid‐western healthcare system. Infect Control Hosp Epidemiol. 2007;28(5):544–550.
- , . Point prevalence of wounds in a sample of acute hospitals in Canada. Int Wound J. 2009;6(4):287–293.
- , , , , , . Non‐adherence to guidelines: an avoidable cause of failure of empirical antimicrobial therapy in the presence of difficult‐to‐treat bacteria. Intensive Care Med. 2010;36(1):75–82.
- , , , , . Quality of care in U.S. hospitals as reflected by standardized measures, 2002–2004. N Engl J Med. 2005;353(3):255–264.
- Centers for Disease Control and Prevention. National Center for Emerging and Zoonotic Infectious Diseases. Division of Healthcare Quality Promotion. Checklist for prevention of central line associated blood stream infections. Available at: http://www.cdc.gov/HAI/pdfs/bsi/checklist‐for‐CLABSI.pdf. Accessed August 3, 2014.
- Safer Healthcare Partners, LLC. Checklists: a critical patient safety tool. Available at: http://www.saferhealthcare.com/high‐reliability‐topics/checklists. Accessed July 31, 2014.
- . Making Things Work: Solving Complex Problems in a Complex World. Boston, MA: Knowledge Press; 2004:117–160.
- . High Performance Healthcare: Using The Power of Relationships to Achieve Quality, Efficiency, and Resilience. 1st ed. New York, NY: McGraw‐Hill; 2009.
- , . Design of high reliability organizations in health care. Qual Saf Health Care. 2006;15(suppl 1):i4–i9.
- , , , . Does team training work? Principles for health care. Acad Emerg Med. 2008;15(11):1002–1009.
- . Speaking up in the operating room: how team leaders promote learning in interdisciplinary action teams. J Manag Stud. 2003;40(6):1419–1452.
- , , , et al. Association between implementation of a medical team training program and surgical mortality. JAMA. 2010;304(15):1693–1700.
- , , , . Group cognition, membership change, and performance: Investigating the benefits and detriments of collective knowledge. Organ Behav Hum Decis Process. 2007;103(2):159–178.
- , , , , , . Reciprocal learning and chronic care model implementation in primary care: results from a new scale of learning in primary care settings. BMC Health Serv Res. 2011;11:44.
- , , , , . The importance of relational coordination and reciprocal learning for chronic illness care within primary care teams. Health Care Manage Rev. 2012;38(1):20–28.
- , , , , . Explaining Michigan: developing an ex post theory of a quality improvement program. Milbank Q. 2011;89(2):167–205.
- , , , et al. How improving practice relationships among clinicians and nonclinicians can improve quality in primary care. Jt Comm J Qual Patient Saf. 2009;35(9):457–466.
- , , , et al. Relationship quality and patient‐assessed quality of care in VA primary care clinics: development and validation of the work relationships scale. Ann Fam Med. 2013;11(6):543–549.
- , . Designing and Conducting Mixed Methods Research. 2nd ed. Thousand Oaks, CA: Sage; 2011.
- . Qualitative Evaluation Methods. Thousand Oaks, CA: Sage; 2002.
- , , . Qualitative methods in research on health care quality. Qual Saf Health Care. 2002;11:148–152.
- . Managing the negatives of experience in physician teams. Health Care Manage Rev. 2010;35(1):65–76.
- , , , , . Rethinking resident supervision to improve safety: from hierarchical to interprofessional models. J Hosp Med. 2011;6(8):445 b452.
- , , , . Dynamic delegation: shared, hierarchical, and deindividualized leadership in extreme action teams. Adm Sci Q. 2006;51(4):590–621.
- , , . Adapting a clinical comorbidity index for use with ICD‐9‐CM administrative databases. J Clin Epidemiol. 1992;45(6):613–619.
- . Exploratory Data Analysis. Reading, MA: Addison‐Wesley; 1977.
- . Biostatistical Analysis. 4th ed. Upper Saddle River, NJ: Pearson Prentice‐Hall; 2010.
- . Multiple contrasts using rank sums. Technometrics. 1964;6:241–252.
- , . A SAS macro implementation of a multiple comparison post hoc test for a Kruskal–Wallis analysis. Comput Methods Programs Biomed. 2011;102:75–80.
- SAS/STAT Software [computer program]. Version 9.1. Cary, NC: SAS Institute Inc.; 2003.
- , , . Complications, failure to rescue, and mortality with major inpatient surgery in Medicare patients. Ann Surg. 2009;250(6):1029–1034.
- . A dynamic theory of organizational knowledge creation. Org Sci. 1994;5(1):14–37.
- . Teaming: How Organizations Learn, Innovate, and Compete in the Knowledge Economy. 1st ed. Boston, MA: Harvard Business School; 2012.
Since the Institute of Medicine Report To Err is Human, increased attention has been paid to improving the care of hospitalized patients.[1] Strategies include utilization of guidelines and pathways, and the application of quality improvement techniques to improve or standardize processes. Despite improvements in focused areas such as prevention of hospital‐acquired infections, evidence suggests that outcomes for hospitalized patients remain suboptimal.[2] Rates of errors and hospital‐related complications such as falls, decubitus ulcers, and infections remain high,[3, 4, 5] and not all patients receive what is known to be appropriate care.[6]
Many attempts to improve inpatient care have used process‐improvement approaches, focusing on impacting individuals' behaviors, or on breaking down processes into component parts. Examples include central line bundles or checklists.[7, 8] These approaches attempt to ensure that providers do things in a standardized way, but are implicitly based on the reductionist assumption that we can break processes down into predictable parts to improve the system. An alternative way to understand clinical systems is based on interdependencies between individuals in the system, or the ways in which parts of the system interact with each other, which may be unpredictable over time.[1, 9] Whereas these interdependencies include care processes, they also encompass the providers who care for patients. Providers working together vary in terms of the kinds of relationships they have with each other. Those relationships are crucial to system function because they are the foundation for the interactions that lead to effective patient care.
The application of several frameworks or approaches for considering healthcare systems in terms of relationships highlights the importance of this way of understanding system function. The include complexity science,[1, 7] relational coordination (which is grounded in complexity science),[10] high reliability,[11] and the Big Five for teamwork.[12]
Research indicates that interactions among healthcare providers can have important influences on outcomes.[13, 14, 15, 16, 17] Additionally, the initial implementation of checklists to prevent central‐line associated infections appeared to change provider relationships in a way that significantly influenced their success.[18] For example, positive primary care clinic member relationships as assessed by the Lanham framework have been associated with better chronic care model implementation, learning, and patient experience of care.[19, 20] This framework, which we apply here, identifies 7 relationship characteristics: (1) trust; (2) diversity; (3) respect; (4) mindfulness, or being open to new ideas from others; (5) heedfulness, or an understanding of how one's roles influence those of others; (6) use of rich in‐person or verbal communication, particularly for potentially ambiguous information open to multiple interpretations; and (7) having a mixture of social and task relatedness among teams, or relatedness outside of only work‐related tasks.[19] Relationships within surgical teams that are characterized by psychological safety and diversity are associated with successful uptake of new techniques and decreased mortality.[13, 14] Relationships are important because the ability of patients and providers to learn and make sense of their patients' illnesses is grounded in relationships.
We sought to better understand and characterize inpatient physician teams' relationships, and assess the association between team relationships as evaluated by Lanham's framework and outcomes for hospitalized patients. Data on relationships among inpatient medical teams are few, despite the fact that these teams provide a great proportion of inpatient care. Additionally, the care of hospitalized medical patients is complex and uncertain, often involving multiple providers, making provider relationships potentially even more important to outcomes than in other settings.
METHODS
Overview
We conducted an observational, convergent mixed‐methods study of inpatient medicine teams.[21, 22, 23] We focused on inpatient physician teams, defining them as the functional work group responsible for medical decision making in academic medical centers. Physician teams in this context have been studied in terms of social hierarchy, authority, and delegation.[24, 25, 26] Focusing on the relationships within these groups could provide insights into strategies to mitigate potential negative effects of hierarchy. We recognize that other providers are closely involved in the care of hospitalized patients, and although we did not have standard interactions between physicians, nurses, case managers, and other providers that we could consistently observe, we did include interactions with these other providers in our observations and assessments of team relationships. Because this work is among the first in inpatient medical teams, we chose to study a small number of teams in great depth, allowing us to make rich assessments of team relationships.
We chose patient outcomes of length of stay (LOS), unnecessary LOS (ULOS), and complication rates, adjusted for patient characteristics and team workload. LOS is an important metric of inpatient care delivery. We feel ULOS is an aspect of LOS that is dependent on the physician team, as it reflects their preparation of the patient for discharge. Finally, we chose complication rates because hospital‐acquired conditions and complications are important contributors to inpatient morbidity, and because recent surgical literature has identified complication rates as a contributor to mortality that could be related to providers' collective ability to recognize complications and act quickly.
This study was approved by the institutional review board at the University of Texas Health Science Center at San Antonio (UTHSCSA), the Research and Development Committee for the South Texas Veterans Health Care System (STVHCS), and the Research Committee at University Health System (UHS). All physicians consented to participate in the study. We obtained a waiver of consent for inclusion of patient data.
Setting and Study Participants
This study was conducted at the 2 UTHSCSA primary teaching affiliates. The Audie L. Murphy Veterans Affairs Hospital is the 220‐bed acute‐care hospital of the STVHCS. University Hospital is the 614‐bed, level‐I trauma, acute‐care facility for UHS, the county system for Bexar County, which includes the San Antonio, Texas major metropolitan area.
The inpatient internal medicine physician team was our unit of study. Inpatient medicine teams consisted of 1 faculty attending physician, 1 postgraduate year (PGY)‐2 or PGY‐3 resident, and 2 PGY‐1 members. In addition, typically 2 to 3 third‐year medical students were part of the team, and a subintern was sometimes present. Doctor of Pharmacy faculty and students were also occasionally part of the team. Social workers and case managers often joined team rounds for portions of the time, and nurses sometimes joined bedside rounds on specific patients. These teams admit all medicine patients with the exception of those with acute coronary syndromes, new onset congestive heart failure, or arrhythmias. Patients are randomly assigned to teams based on time of admission and call schedules.
Between these 2 hospitals, there are 10 inpatient medicine teams caring for patients, with a pool of over 40 potential faculty attendings. Our goal was to observe teams that would be most likely to vary in terms of their relationship characteristics and patient outcomes through observing teams with a range of individual members. We used a purposeful sampling approach to obtain a diverse sample, sampling based on physician attributes and time of year.[16, 17] Three characteristics were most important: attending physician years of experience, attending involvement in educational and administrative leadership, and the presence of struggling resident members, as defined by being on probation or having been discussed in the residency Clinical Competency Committee. We did not set explicit thresholds in terms of attending experience, but instead sought to ensure a range. The attendings we observed were more likely to be involved in education and administrative leadership activities, but were otherwise similar to those we did not observe in terms of years of experience. We included struggling residents to observe individuals with a range of skill sets, and not just high‐performing individuals. We obtained attending information based on our knowledge of the attending faculty pool, and from the internal medicine residency program. We sampled across the year to ensure a diversity of trainee experience, but did not observe teams in either July or August, as these months were early in the academic year. Interns spend approximately 5 months per year on inpatient services, whereas residents spend 2 to 3 months per year. Thus, interns but not residents observed later in the year might have spent significantly more time on an inpatient service. However, in all instances, none of the team members observed had worked together previously.
Data Collection
Data were collected over nine 1‐month periods from September 2008 through June 2011. Teams were observed daily for 2‐ to 4‐week periods during morning rounds, the time when the team discusses each patient and makes clinical decisions. Data collection started on the first day of the month, the first day that all team members worked together, and continued for approximately 27 days, the last day before the resident rotated to a different service. By comprehensively and systematically observing these teams' daily rounds, we obtained rich, in‐depth data with multiple data points, enabling us to assess specific team behaviors and interactions.
During the third and fourth months, we collected data on teams in which the attending changed partway through. We did this to understand the impact of individual attending change on team relationships. Because the team relationships differed with each attending, we analyzed them separately. Thus, we observed 7 teams for approximately 4‐week periods and 4 teams for approximately 2‐week periods.
Observers arrived in the team room prior to rounds to begin observations, staying until after rounds were completed. Detailed free‐text field notes were taken regarding team activities and behaviors, including how the teams made patient care decisions. Field notes included: length of rounds, which team members spoke during each patient discussion, who contributed to management discussions, how information from consultants was incorporated, how communication with others outside of the team occurred, how team members spoke with each other including the types of words used, and team member willingness to perform tasks outside of their usually defined role, among others. Field notes were collected in an open‐ended format to allow for inductive observations. Observers also recorded clinical data daily regarding each patient, including admission and discharge dates, and presenting complaint.
The observation team consisted of the principle investigator (PI) (hospitalist) and 2 research assistants (a graduate‐level medical anthropologist and social psychologist), all of whom were trained by a qualitative research expert to systematically collect data related to topics of interest. Observers were instructed to record what the teams were doing and talking about at all times, noting any behaviors that they felt reflected how team members related to each other and came to decisions about their patients, or that were characteristic of the team. To ensure consistency, the PI and 1 research assistant conducted observations jointly at the start of data collection for each team, checking concordance of observations daily using a percent agreement until general agreement on field note content and patient information reached 90%. Two individuals observed 24 days of data collection, representing 252 patient discussions (13% of observed discussions).
An age‐adjusted Charlson‐Deyo comorbidity score was calculated for each patient admitted to each team, using data from rounds and from each hospital's electronic health records (EHR).[27] We collected data regarding mental health conditions for each patient (substance use, mood disorder, cognitive disorder, or a combination) because these comorbidities could impact LOS or ULOS. Discharge diagnoses were based on the discharge summary in the EHR. We also collected data daily regarding team census and numbers of admissions to and discharges from each team to assess workload.
Three patient outcomes were measured: LOS, ULOS, and complications. LOS was defined as the total number of days the patient was in the hospital. ULOS was defined as the number of days a patient remained in the hospital after the day the team determined the patient was medically ready for discharge (assessed by either discussion on rounds or EHR documentation). ULOS may occur when postdischarge needs have been adequately assessed, or because of delays in care, which may be related to provider communication during the hospitalization. Complications were defined on a per‐patient, per‐day basis in 2 ways: the development of a new problem in the hospital, for example acute kidney injury, a hospital‐acquired infection, or delirium, or by the team noting a clinical deterioration after at least 24 hours of clinical stability, such as the patient requiring transfer to a higher level of care. Complications were determined based on discussions during rounds, with EHR verification if needed.
Analysis Phase I: Assessment of Relationship Characteristics
After the completion of data collection, field notes were reviewed by a research team member not involved in the original study design or primary data collection (senior medical student). We took this approach to guard against biasing the reviewer's view of team behaviors, both in terms of not having conducted observations of the teams and being blinded to patient outcomes.
The reviewer completed a series of 3 readings of all field notes. The first reading provided a summary of the content of the data and the individual teams. Behavioral patterns of each team were used to create an initial team profile. The field notes and profiles were reviewed by the PI and a coauthor not involved in data collection to ensure that the profiles adequately reflected the field notes. No significant changes to the profiles were made based on this review. The profiles were discussed at a meeting with members of the larger research team, including the PI, research assistants, and coinvestigators (with backgrounds in medicine, anthropology, and information and organization management). Behavior characteristics that could be used to distinguish teams were identified in the profiles using a grounded theory approach.
The second review of field notes was conducted to test the applicability of the characteristics identified in the first review. To systematically record the appearance of the behaviors, we created a matrix with a row for each behavior and columns for each team to note whether they exhibited each behavior. If the behavior was exhibited, specific examples were cataloged in the matrix. This matrix was reviewed and refined by the research team. During the final field note review meeting, the research team compared the summary matrix for each team, with the specific behaviors noted during the first reading of the field notes to ensure that all behaviors were recorded.
After cataloging behaviors, the research team assigned each behavior to 1 of the 7 Lanham relationship characteristics. We wanted to assess our observations against a relationship framework to ensure that we were able to systematically assess all aspects of relationships. The Lanham framework was initially developed based on a systematic review of the organizational and educational literatures, making it relevant to the complex environment of an academic medical inpatient team and allowing us to assess relationships at a fine‐grained, richly detailed level. This assignment was done by the author team as a group. Any questions were discussed and different interpretations resolved through consensus. The Lanham framework has 7 characteristics.[19] Based on the presence of behaviors associated with each relationship characteristic, we assigned a point to each team for each relationship characteristic observed. We considered a behavior type to be present if we observed it on at least 3 occasions on separate days. Though we used a threshold of at least 3 occurrences, most teams that did not receive a point for a particular characteristic did not have any instances in which we observed the characteristic. This was particularly true for trust and mindfulness, and least so for social/task relatedness. By summing these points, we calculated a total relationship score for each team, with potential scores ranging from 0 (for teams exhibiting no behaviors reflecting a particular relationship characteristic) to 7.
Analysis Phase II: Factor Analysis
To formally determine which relationship characteristics were most highly related, data were submitted to a principal components factor analysis using oblique rotation. Item separation was determined by visual inspection of the scree plot and eigenvalues over 1.
Analysis Phase III: Assessing the Association between Physician Team Relationship Characteristics and Patient Outcomes
We examined the association between team relationships and patient outcomes using team relationship scores. For the LOS/ULOS analysis, we only included patients whose entire hospitalization occurred under the care of the team we observed. Patients who were on the team at the start of the month, were transferred from another service, or who remained hospitalized after the end of the team's time together were excluded. The longest possible LOS for patients whose entire hospitalization occurred on teams that were observed for half a month was 12 days. To facilitate accurate comparison between teams, we only included patients whose LOS was 12 days.
Complication rates were defined on a per‐patient per‐day basis to normalize for different team volumes and days of observation. For this analysis, we included patients who remained on the team after data collection completion, patients transferred to another team, or patients transferred from another team. However, we only counted complications that occurred at least 24 hours following transfer to minimize the likelihood that the complication was related to the care of other physicians.
Preliminary analysis involved inspection and assessment of the distribution of all variables followed, by a general linear modeling approach to assess the association between patient and workload covariates and outcomes.[28, 29] Because we anticipated that outcome variables would be markedly skewed, we also planned to assess the association between relationship characteristics with outcomes using the Kruskal‐Wallis rank sum test to compare groups with Dunn's test[30] for pairwise comparisons if overall significance occurred.[31] There are no known acceptable methods for covariate adjustments using the Kruskal‐Wallis method. All models were run using SAS software (SAS Institute Inc., Cary, NC).[32]
RESULTS
The research team observed 1941 discussions of 576 individual patients. Observations were conducted over 352 hours and 54 minutes, resulting in 741 pages of notes (see Supporting Table 1 in the online version of this article for data regarding individual team members). Teams observed over half‐months are referred to with a and b designations.
| Relationship Characteristic | Definition | Thirteen Types of Behaviors Observed in Field Notes | Observed Examples |
|---|---|---|---|
| Trust | Willingness to be vulnerable to others | Use of we instead of you or I by the attending | Where are we going with this guy? |
| Attending admitting I don't know | Let's go talk to him, I can't figure this out | ||
| Asking questions to help team members to think through problems | Will the echo change our management? How will it help us? | ||
| Diversity | Including different perspectives and different thinking | Team member participation in conversations about patients that are not theirs | One intern is presenting, another intern asks a question, and the resident joins the discussion |
| Inclusion of perspectives of those outside the team (nursing and family members) | Taking a break to call the nurse, having a family meeting | ||
| Respect | Valuing the opinions of others, honest and tactful interactions | Use of positive reinforcement by the attending | Being encouraging of the medical student's differential, saying excellent |
| How the team talks with patients | Asking if the patient has any concerns, what they can do to make them comfortable | ||
| Heedfulness | Awareness of how each person's roles impact the rest of the team | Team members performing tasks not expected of their role | One intern helping another with changing orders to transfer a patient |
| Summarizing plans and strategizing | Attending recaps the plan for the day, asks what they can do | ||
| Mindfulness | Openness to new ideas/free discussion about what is and is not working | Entire team engaged in discussion | Attending asks the medical student, intern, and resident what they think is going on |
| Social relatedness | Having socially related interactions | Social conversation among team members | Intern talks about their day off |
| Jokes by the attending | Showers and a bowel movement is the key to making people happy | ||
| Appropriate use of rich communication | Use of in‐person communication for sensitive or difficult issues | Using verbal communication with consultants or family | Intern is on the phone with the pharm D because there is a problem with the medication |
Creation of team profiles yielded 13 common behavior characteristics that were inductively identified and that could potentially distinguish teams, including consideration of perspectives outside of the team and team members performing tasks normally outside of their roles. Table 1 provides examples of and summarizes observed behaviors using examples from the field notes, mapping these behavior characteristics onto the Lanham relationship characteristics. The distribution of relationship characteristics and scores for each team are shown in Table 2.
| Relationship Characteristic | Team | ||||||||||
|---|---|---|---|---|---|---|---|---|---|---|---|
| 1 | 2 | 3a | 3b | 4a | 4b | 5 | 6 | 7 | 8 | 9 | |
| Trust | 0 | 0 | 1 | 0 | 0 | 0 | 1 | 0 | 1 | 1 | 1 |
| Diversity | 0 | 1 | 1 | 1 | 0 | 0 | 0 | 0 | 1 | 1 | 1 |
| Respect | 0 | 1 | 1 | 1 | 0 | 1 | 0 | 0 | 1 | 1 | 1 |
| Heedfulness | 0 | 1 | 1 | 0 | 1 | 0 | 1 | 0 | 1 | 1 | 1 |
| Mindfulness | 0 | 0 | 1 | 0 | 0 | 1 | 1 | 0 | 1 | 1 | 1 |
| Social/task relatedness | 0 | 1 | 1 | 0 | 1 | 1 | 1 | 0 | 1 | 1 | 1 |
| Rich/lean communication | 0 | 1 | 1 | 0 | 0 | 0 | 1 | 0 | 1 | 1 | 0 |
| Relationship score (no. of characteristics observed) | 0 | 5 | 7 | 2 | 2 | 3 | 5 | 0 | 7 | 7 | 6 |
Correlation between relationship characteristics ranged from 0.32 to 0.95 (see Supporting Table 2 in the online version of this article). Mindfulness and trust are more highly correlated with each other than with other variables, as are diversity and respect. We performed a principal components factor analysis. Based on scree plot inspection and eigenvalues >1, we kept 3 factors that explained 85% of the total variance (see Supporting Table 3 in the online version of this article).
| No. of Relationship Characteristics | |||
|---|---|---|---|
| 02 | 35 | 67 | |
| |||
| LOS, d, n=293 | |||
| Median | 4 | 5 | 3 |
| IQR | 5 | 4 | 3 |
| Mean | 4.7 (2.72) | 4.7 (2.52) | 4.1 (2.51), P=0.12a |
| ULOS, d, n=293 | |||
| Median | 0 | 0 | 0 |
| IQR | 0 | 0 | 0 |
| Mean | 0.37 (0.99) | 0.33 (0.96) | 0.13 (0.56), P=0.09a |
| Complications (per patient per day), n=398 | |||
| Median | 0 | 0 | 0 |
| IQR | 1 | 1 | 0 |
| Mean | 0.58 (1.06) | 0.45 (0.77) | 0.18 (0.59), P=0.001 compared to teams with 02 or 35 characteristics |
Our analyses of LOS and ULOS included 298 of the 576 patients. Two hundred sixty‐seven patients were excluded because their entire LOS did not occur while under the care of the observed teams. Eleven patients were removed from the analysis because their LOS was >12 days. The analysis of complications included 398 patients. In our preliminary general linear modeling approach, only patient workload was significantly associated with outcomes using a cutoff of P=0.05. Charlson‐Deyo score and mental health comorbidities were not associated with outcomes.
The results of the Kruskal‐Wallis test show the patient average ranking on each of the outcome variables by 3 groups (Table 3). Overall, teams with higher relationship scores had lower rank scores on all outcomes measures. However, the only statistically significant comparisons were for complications. Teams having 6 to 7 characteristics had a significantly lower complication rate ranking than teams with 0 to 2 and 3 to 5 (P=0.001). We did not find consistent differences between individual teams or groups of teams with relationship scores from 0 to 2, 3 to 5, and 6 to 7 with regard to Charlson score, mental health issues, or workload. The only significant differences were between Charlson‐Deyo scores for patients admitted to teams with low relationship scores of 0 to 2 versus high relationship scores of 6 to 7 (6.7 vs 5.1); scores for teams with relationship scores of 3 to 5 were not significantly different from the low or high groups.
Table 4 shows the Kruskal‐Wallace rank test results for each group of relationship characteristics identified in the factor analysis based on whether teams displayed all or none of the characteristics in the factor. There were no differences in these groupings for LOS. Teams that exhibited both mindfulness and trust had lower ranks on ULOS than teams that did not have either. Similarly, teams with heedfulness, social‐task relatedness, and more rich communication demonstrated lower ULOS rankings than teams who did not have all 3 characteristics.
| Mind/Trust | Diversity/Respect | Heed/Relate/Communicate | ||||
|---|---|---|---|---|---|---|
| Patient Outcome | None | Both | None | Both | None | All 3 |
| ||||||
| LOS, d, n=293 | ||||||
| Median | 4 | 4 | 4 | 4 | 4 | 4 |
| IQR | 5 | 3 | 4.5 | 3 | 4 | 4 |
| Mean | 4.7 (2.6) | 4.2 (2.5) | 4.7 (2.6) | 4.3 (2.5) | 4.4 (2.6) | 4.4 (2.6) |
| P value | 0.06a | 0.23a | 0.85a | |||
| ULOS, d, n=293 | ||||||
| Median | 0 | 0 | 0 | 0 | 0 | 0 |
| IQR | 0 | 0 | 0 | 0 | 0 | 0 |
| Mean | 0.39 (1.01) | 0.15 (0.62) | 0.33 (0.92) | 0.18 (0.71) | 0.32 (0.93) | 0.18 (0.69) |
| P value | 0.009 | 0.06 | 0.03 | |||
| Complications (per patient), n=389 | ||||||
| Median | 0 | 0 | 0 | 0 | 0 | 0 |
| IQR | 1 | 0 | 1 | 0 | 1 | 0 |
| Mean | 0.58 (1.01) | 0.19 (0.58) | 0.47 (0.81) | 0.29 (0.82) | 0.26 (0.92) | 0.28 (0.70) |
| P value | <0.0001 | 0.001 | 0.02 | |||
DISCUSSION
Relationships are critical to team function because they are the basis for the social interactions that are central to patient care. These interactions include how providers recognize and make sense of what is happening with patients, and how they learn to care for patients more effectively. Additionally, the high task interdependencies among inpatient providers require effective relationships for optimal care. In our study, inpatient medicine physician teams' relationships varied, and these differences were associated with ULOS and complications. Relationship characteristics are not mutually exclusive, and as our factor analysis demonstrates, are intercorrelated. Trust and mindfulness appear to be particularly important. Trust may foster psychological safety that in turn promotes the willingness of individuals to contribute their thoughts and ideas.[13] In low‐trust teams, providers may fear a negative impact for bringing forward a concern based on limited data. Mindful teams may be more likely to notice nuanced changes, or are more likely to talk when things just do not appear to be going in the right direction with the patient. In the case of acutely ill medical patients, trust and mindfulness may lead to an increased likelihood that clinical changes are recognized and discussed quickly. For example, on a team characterized by trust and mindfulness, the entire team was typically involved in care discussions, and the interns and students frequently asked a lot of questions, even regarding the care of patients they were not directly following. We observed that these questions and discussions often led the team to realize that they needed to make a change in management decisions (eg, discontinuing Bactrim, lowering insulin doses, adjusting antihypertensives, premedicating for intravenous contrast) that they had not caught in the assessment and plan portion of the patient care discussion. In another example, a medical student asked a tentative question after a patient needed to go quickly to the bathroom while they were examining her, leading the team to ask more questions that led to a more rapid evaluation of a potential urinary tract infection. This finding is consistent with the description of failure to rescue among surgical patients, in which mortality has been associated with the failure to recognize complications rapidly and act effectively.[33]
Our findings are limited in several ways. First, these data are from a single academic institution. Although we sought diversity among our teams and collected data across 2 hospitals, there may be local contextual factors that influenced our results. Second, our data demonstrate an association, but not causality. Our findings should be tested in studies that assess causality and potential mechanisms through which relationships influence outcomes. Third, the individuals observing the teams had some knowledge of patient outcomes through hearing patient discussions. However, by involving individuals who did not participate in observations and were blinded to outcomes in assessing team relationships, we addressed this potential bias. Fourth, our observations were largely focused on physician teams, not directly including other providers. Our difficulty in observing regular interactions between physicians and other providers underscores the need to increase contact among those caring for hospitalized patients, such as occurs through multidisciplinary rounds. We did include team communication with other disciplines in our assessment of the relationship characteristics of diversity and rich communication. Finally, our analysis was limited by our sample size. We observed a relatively small number of teams. Although we benefitted from seeing the change in team relationships that occurred with attending changes halfway through some of our data collection months, this did limit the number of patients we could include in our analyses. Though we did not observe obvious differences in relationships between the teams observed across the 2 hospitals, the small number of teams and hospitals precluded our ability to perform multilevel modeling analyses, which would have allowed us to assess or account for the influence of team or organizational factors. However, this small sample size did allow for a richer assessment of team behaviors.
Although preliminary, our findings are an important step in understanding the function of inpatient medical teams not only in terms of processes of care, but also in terms of relationships. Patient care is a social activity, requiring effective communication to develop working diagnoses, recognize changes in patients' clinical courses, and formulate effective treatment plans during and after hospitalization. Future work could follow several directions. One would be to assess the causal mechanisms through which relationships influence patient outcomes. These may include sensemaking, learning, and improved coordination. Positive relationships may facilitate interaction of tacit and explicit information, facilitating the creation of understandings that foster more effective patient care.[34] The dynamic nature of relationships and how patient outcomes in turn feed back into relationships could be an area of exploration. This line of research could build on the idea of teaming.[35] Understanding relationships across multidisciplinary teams or with patients and families would be another direction. Finally, our results could point to potential interventions to improve patient outcomes through improving relationships. Better understanding of the nature of effective relationships among providers should enable us to develop more effective strategies to improve the care of hospitalized patients. In the larger context of payment reforms that require greater coordination and communication among and across providers, a greater understanding of how relationships influence patient outcomes will be important.
Acknowledgements
The authors thank the physicians involved in this study and Ms. Shannon Provost for her involvement in discussions of this work.
Disclosures: The research reported herein was supported by the Department of Veterans Affairs, Veterans Health Administration, Health Services Research and Development Service (CDA 07‐022). Investigator salary support was provided through this funding, and through the South Texas Veterans Health Care System. The views expressed in this article are those of the authors and do not necessarily reflect the position or policy of the Department of Veterans Affairs. Dr. McDaniel receives support from the IC[2] Institute of the University of Texas at Austin. Dr. Luci Leykum had full access to all of the data in the study and takes responsibility for the integrity of the data and the accuracy of the data analysis. The authors report no conflicts of interest.
- . Redesigning health care with insights from the science of complex adaptive systems. In: Crossing the Quality Chasm: A New Heath System for the 21st Century. Washington, DC: National Academy of Sciences; 2000:309–322.
- , , , , , . Temporal trends in rates of patient harm resulting from medical care. N Engl J Med. 2010;323(22):2124–2135.
- , , , et al. Circumstances of patient falls and injuries in 9 hospitals in a mid‐western healthcare system. Infect Control Hosp Epidemiol. 2007;28(5):544–550.
- , . Point prevalence of wounds in a sample of acute hospitals in Canada. Int Wound J. 2009;6(4):287–293.
- , , , , , . Non‐adherence to guidelines: an avoidable cause of failure of empirical antimicrobial therapy in the presence of difficult‐to‐treat bacteria. Intensive Care Med. 2010;36(1):75–82.
- , , , , . Quality of care in U.S. hospitals as reflected by standardized measures, 2002–2004. N Engl J Med. 2005;353(3):255–264.
- Centers for Disease Control and Prevention. National Center for Emerging and Zoonotic Infectious Diseases. Division of Healthcare Quality Promotion. Checklist for prevention of central line associated blood stream infections. Available at: http://www.cdc.gov/HAI/pdfs/bsi/checklist‐for‐CLABSI.pdf. Accessed August 3, 2014.
- Safer Healthcare Partners, LLC. Checklists: a critical patient safety tool. Available at: http://www.saferhealthcare.com/high‐reliability‐topics/checklists. Accessed July 31, 2014.
- . Making Things Work: Solving Complex Problems in a Complex World. Boston, MA: Knowledge Press; 2004:117–160.
- . High Performance Healthcare: Using The Power of Relationships to Achieve Quality, Efficiency, and Resilience. 1st ed. New York, NY: McGraw‐Hill; 2009.
- , . Design of high reliability organizations in health care. Qual Saf Health Care. 2006;15(suppl 1):i4–i9.
- , , , . Does team training work? Principles for health care. Acad Emerg Med. 2008;15(11):1002–1009.
- . Speaking up in the operating room: how team leaders promote learning in interdisciplinary action teams. J Manag Stud. 2003;40(6):1419–1452.
- , , , et al. Association between implementation of a medical team training program and surgical mortality. JAMA. 2010;304(15):1693–1700.
- , , , . Group cognition, membership change, and performance: Investigating the benefits and detriments of collective knowledge. Organ Behav Hum Decis Process. 2007;103(2):159–178.
- , , , , , . Reciprocal learning and chronic care model implementation in primary care: results from a new scale of learning in primary care settings. BMC Health Serv Res. 2011;11:44.
- , , , , . The importance of relational coordination and reciprocal learning for chronic illness care within primary care teams. Health Care Manage Rev. 2012;38(1):20–28.
- , , , , . Explaining Michigan: developing an ex post theory of a quality improvement program. Milbank Q. 2011;89(2):167–205.
- , , , et al. How improving practice relationships among clinicians and nonclinicians can improve quality in primary care. Jt Comm J Qual Patient Saf. 2009;35(9):457–466.
- , , , et al. Relationship quality and patient‐assessed quality of care in VA primary care clinics: development and validation of the work relationships scale. Ann Fam Med. 2013;11(6):543–549.
- , . Designing and Conducting Mixed Methods Research. 2nd ed. Thousand Oaks, CA: Sage; 2011.
- . Qualitative Evaluation Methods. Thousand Oaks, CA: Sage; 2002.
- , , . Qualitative methods in research on health care quality. Qual Saf Health Care. 2002;11:148–152.
- . Managing the negatives of experience in physician teams. Health Care Manage Rev. 2010;35(1):65–76.
- , , , , . Rethinking resident supervision to improve safety: from hierarchical to interprofessional models. J Hosp Med. 2011;6(8):445 b452.
- , , , . Dynamic delegation: shared, hierarchical, and deindividualized leadership in extreme action teams. Adm Sci Q. 2006;51(4):590–621.
- , , . Adapting a clinical comorbidity index for use with ICD‐9‐CM administrative databases. J Clin Epidemiol. 1992;45(6):613–619.
- . Exploratory Data Analysis. Reading, MA: Addison‐Wesley; 1977.
- . Biostatistical Analysis. 4th ed. Upper Saddle River, NJ: Pearson Prentice‐Hall; 2010.
- . Multiple contrasts using rank sums. Technometrics. 1964;6:241–252.
- , . A SAS macro implementation of a multiple comparison post hoc test for a Kruskal–Wallis analysis. Comput Methods Programs Biomed. 2011;102:75–80.
- SAS/STAT Software [computer program]. Version 9.1. Cary, NC: SAS Institute Inc.; 2003.
- , , . Complications, failure to rescue, and mortality with major inpatient surgery in Medicare patients. Ann Surg. 2009;250(6):1029–1034.
- . A dynamic theory of organizational knowledge creation. Org Sci. 1994;5(1):14–37.
- . Teaming: How Organizations Learn, Innovate, and Compete in the Knowledge Economy. 1st ed. Boston, MA: Harvard Business School; 2012.
© 2014 Society of Hospital Medicine
Cost Utility of Enoxaparin for DVT Prophylaxis
Several groups of medical patients at risk for venous thromboembolism (VTE) while hospitalized have been identified. These include patients with certain acute medical illnesses such as acute myocardial infarction, stroke, or chronic obstructive pulmonary disease and those with acute medical illness combined with additional risk factors including advanced age, cancer, obesity, or prior VTE.13
Heparin‐induced thrombocytopenia (HIT) and heparin‐induced thrombocytopenia with thrombosis (HITT), a spectrum of disease also known as type 2 HIT, are potentially devastating hematologic consequences of VTE prophylaxis that result from heparin binding to platelet factor IV, leading to IgG antibodymediated platelet activation.46 These complications manifest along a spectrum from thrombocytopenia alone (HIT) to more severe sequelae that include death, amputation, venous and arterial thrombosis. Unfractionated heparin (UFH) has traditionally been used for VTE prophylaxis in these populations at risk. More recently, evidence has indicated that enoxaparin, a low‐molecular‐weight heparin, is at least as effective for VTE prophylaxis1, 7 and carries a significantly lower risk for the development of the complications of HIT and HITT. Despite the superior side‐effect profile of enoxaparin, many institutions encourage the use of heparin for DVT prophylaxis because of its lower price. However, when the costs of treating these complications are considered, using unfractionated heparin may actually be more costly.
Two studies of the cost effectiveness of heparin compared with enoxaparin when used for VTE prophylaxis in medical inpatients have recently been published.8, 9 However, one of these studies focused only on pharmacy‐related costs and did not consider patient‐related outcomes, and the other was published by a for‐profit research company. Studies of treatment with enoxaparin versus UFH in other medical settings, including non‐Q‐wave myocardial infarction10 and treatment of acute deep‐vein thrombosis,11 suggest that enoxaparin is more cost effective. Studies of prophylaxis of surgical patients have been contradictory. Data suggest that in orthopedic patients the use of enoxaparin is more cost effective for both short‐ and long‐term VTE prophylaxis,1214 but low‐dose heparin appeared more cost effective for patients undergoing colorectal surgery, in large part because of an assumption of a smaller risk of bleeding.15
The purpose of this analysis was to determine the cost utility of heparin compared with enoxaparin for VTE prophylaxis for medical inpatients at risk. In such an analysis, it is important to consider the possibly different meanings that entities may attach to cost utility and effectiveness according to their different roles in the health care system. Individual institutions pay inpatient medication costs, but they often do not directly bear the costs of complications of treatment and may actually receive reimbursements for them. In contrast, payers must provide that reimbursement. For this reason, costs were analyzed from 2 perspectives, that of a payer (Medicare) and that of a health care system or institution.
METHODS
This protocol was declared exempt by the Institutional Review Board at the University of Texas Health Science Center at San Antonio.
Estimates of Effectiveness
Estimates of effectiveness include those related both to efficacy in preventing VTE, and those related to adverse drug events. They are summarized in Table 1.
| Base Case | Range for Sensitivity Analysis | |
|---|---|---|
| Rate of development of HIT on heparin | 2.70% | 0.80%4.90% |
| Rate of development of HIT on enoxaparin | 0.30% | 0.09%0.54% |
| Rate of progression to HITT | 40% | 25%50% |
| Mortality rate despite treatment, HITT | 8% | 0%20% |
| Assumed extension in length of stayHIT | 1 day | 05 days |
| Assumed extension in length of stayHITT | 7 days | 510 days |
| Life expectancy (2001) | 77.2 years | |
| Average age of medical inpatient | 71.9 years | |
| QALY adjustment for: | ||
| CHFsevere | 0.6 | |
| COPD | 0.4 | |
| Cancer | 0.9 |
Assumptions about the efficacy of heparin and enoxaparin when used for VTE prophylaxis were based on the following published data. The rate of development of VTE reported in the Medenox trial, 5.5%,1 is consistent with rates reported for patients receiving heparin (2%13%).1618 More recently, the PRINCE study demonstrated that enoxaparin was at least as effective as heparin in patients with severe heart failure or respiratory disease and was more effective in the former group of patients.7 Finally, data from patients with acute stroke indicated that low‐molecular‐weight heparins are at least as effective as heparin for this indication.19, 20 Equal efficacy was assumed for this analysis for several reasons, primarily to avoid the creation or amplification of errors through the introduction of more assumptions about the proportion of patients with specific diagnoses and about the magnitude and range of differences in efficacy. Only one study has examined the relative efficacy in patients with congestive heart failure, and not all the results of studies in stroke patients pointed to enoxaparin having improved efficacy. Therefore, making valid assumptions about the magnitude of the difference between the drugs on the basis of the available evidence may not be possible.
It was also assumed that aside from HIT and HITT, the 2 drugs had the same rates of adverse events, including bleeding complications, in this patient population.1
A Medline search combining MeSH terms thrombocytopenia and heparin was done to find the appropriate incidence of HIT and HITT. The resulting group was further limited in 3 separate searches using the terms prophylaxis (keyword), incidence (MeSH term), and thromboembolism or venous thrombosis (MeSH terms). Heparin‐induced thrombocytopenia was searched for as a keyword and combined with the MeSH term prophylaxis in a separate search. Finally, reference lists were searched to find additional articles.
The range of reported rates of development of HIT among patients receiving heparin was wide. In part, this is related to the different subgroups of patients studied and to the inclusion of patients receiving both prophylaxis and treatment doses of heparin. The one study that looked specifically at medical inpatients included patients receiving treatment‐dose heparin. The rate of HIT in this study was 0.8%.21 A study of both prophylactic and therapeutic use in neurologic patients reported a rate of 2.5%.22 Studies specific to VTE prophylaxis in surgical patients reported a range of 0.8%4.9%.2326 Based on these results, a rate of 2.7%, the median of the reported ranges, was used for the base case, and 0.8% and 4.9% were used for sensitivity analysis.
The reported rates of progression to thrombosis for patients with HIT ranged from 25 to more than 50%.21, 27, 28 A median rate of 40% was used for the base case, and 25% and 50% were used for sensitivity analysis. It was assumed that 0.3% of patients receiving enoxaparin developed HIT, 1/9 as frequently as those receiving heparin,24, 25, 29 but that the same percentage of those with HIT would develop thrombosis.
Mortality secondary to thrombosis in patients with untreated HIT has been reported to be 4%5%.30, 31 All‐cause mortality in untreated patients with HITT has been reported to be as high as >20%,31, 32 but in treated patients it has been reported as 8%.30 A mortality rate of 8% for HITT despite treatment was assumed with a range in the sensitivity analysis from 0% to 20%.
Life expectancy data were obtained from the National Center for Health Statistics, and the average age of medical inpatients potentially eligible for DVT prophylaxis was calculated from this data. The catalog of preference scores was obtained from the Cost Effectiveness Analysis Registry at the Harvard Center for Risk Analysis.33 These preference scores adjust the quality of a year of life for chronic diseases and provide a more accurate assessment of quality‐adjusted life years.
It was assumed that patients with HIT alone would be treated with argatroban, consistent with evidence that this is superior to withdrawal of heparin alone in patients with HIT.28 Using other agents such as lepirudin for the treatment of HIT was not considered in this analysis because there is no data on which to base their efficacy in patients with HIT.
For treatment of patients with HITT, again only the use of argatroban was considered. Though other agents are as efficacious in treating HITT, they are also more expensive. Therefore, using argatroban allowed for a more conservative estimate.
Platelet counts typically fall after 5 days of heparin administration in patients developing HIT34 and typically recover within 35 days of initiation of treatment.4, 29 In the past, patients may not have been kept in the hospital for resolution of their platelet count. However, with evidence that HIT should be aggressively treated, patients with HIT will likely have a longer length of stay. A study of treatment of HIT reported a mean time on argatroban of 57 days.23 This is greater than the average length of stay for medical diagnosis, which is 45 days.35 Therefore, an additional length of stay of 1 day was assumed for patients given a diagnosis of HIT, with a range of 05 days used for the sensitivity analysis. An additional length of stay totaling 7 days was assumed for those with thrombosis, based on patients requiring 7 days of argatroban therapy for treatment of HITT in a recent study.28
Estimates of Costs
Costs were analyzed from institutional and Medicare perspectives. Only direct medical expenditures related to hospitalization were considered; indirect patient costs resulting from the sequelae of HITT, while potentially severe, were not included. An incremental analysis was performed to express the increase in resources used when a person develops HIT/T, with the final result expressed as a daily cost of each medication. Cost assumptions are summarized in Table 2.
| Medicarerelated | Institutionrelated | |||
|---|---|---|---|---|
| Base case | Range | Base case | Range | |
| Additional reimbursement for HIT (if considered a complicating condition) | $ 765.06 | $ 0.00 | $ 765.06 | $0.00 |
| Additional reimbursement for HITT (if coagulation disorder DRG used) | $1135.56 | $ 0.00 | $1135.56 | $0.00 |
| Primary provider visit (99232) | $ 54.89 | $33.00$ 78.04 | n/a | |
| Consultant initial visit (99254) | $ 140.39 | $35.84$193.03 | n/a | |
| Consultant followup (99263) | $ 44.80 | $22.40$ 66.09 | n/a | |
| Medication (per day) | ||||
| Heparin | n/a | $ 4.00 | ||
| Enoxaparin | n/a | $ 84.00 | ||
| Argatroban | n/a | $ 150.00 | ||
| Coumadin | n/a | $ 0.50 | ||
| Laboratory tests (per test) | ||||
| Complete blood count | n/a | $ 2.14 | ||
| Prothrombin time/partial thromboplastin time | n/a | $ 9.85 | ||
| Opportunity cost per additional day of hospitalization (if hospital at capacity) | n/a | $1096.72 | ||
Medicare Related
Diagnosis‐related group (DRG) reimbursement to institutions and physicians were considered the only payer‐related costs. These were based on the 2005 Medicare reimbursement.36 Costs related to laboratory, medication, or other diagnostic studies were assumed to be covered by the DRG payment and not to be billed separately.
The average Medicare reimbursement to institutions for all diagnosis‐related groups is the national standard number, or $4971.81. To determine the additional potential charges resulting from the development of HIT, it was considered a complicating condition. The average adjustment factor for complicating conditions of medical diagnoses is .1539, leading to an increase in charges of $765.06. No additional adjustments for geographic location were made. Sensitivity analysis was performed with no additional reimbursement for HIT as a complicating condition.
To quantify additional charges related to caring for patients with HITT, we used the amount of additional charges for the coagulation disorder DRG (#397) above those of the average reimbursement. This amount is $1135.56, the difference between the higher charge of $6107.37 for this DRG, and the national standard number. Sensitivity analysis with no additional charges was performed.
Physician charges used were based on the 2004 Medicare reimbursement.36 It was assumed that each patient with HIT would have a daily visit of moderate complexity (CPT 99232), which carries a reimbursement rate of $54.89. Patients with thrombotic complications were assumed to also have a hematology consult consisting of one initial visit and one followup, both of midlevel complexity (CPTs 99253 and 99262). The reimbursement rates for these visits are $97.45 and $44.80. Sensitivity analysis using both lower‐ and higher‐level visits was performed (Table 2).
Based on the above DRG and physician reimbursements, the total cost to Medicare of treating a patient with HIT is $820.05 and of treating a patient with HITT is $1749.98. For the situation in which a patient with HIT also developed HITT, only the cost of reimbursement for HITT was modeled.
Hospital‐Related
To calculate the benefit or cost to an institution, 2 scenarios were modeled. In the first scenario, only the DRG‐related revenues collected and the costs of caring for patients with HIT/T were considered. The revenues used are described above. The cost of medications at a multi‐institutional health care system (MIHCS) was obtained from the pharmacy and used in this analysis. This system is composed of a network of urban and suburban acute care facilities with academic affiliations with 2 universities. Costs are representative of the entire system. The cost of heparin is $2.00 per unit dose; daily cost for b.i.d. prophylaxis is $4.00. The cost of one daily dose of enoxaparin is $84.00. One unit (50 mg) of argatroban costs $50.00. For a 70‐kg man at a standard dosing rate of 2 g/kg per minute, the daily cost would be approximately $150.00. The daily cost of coumadin was estimated at $0.50 regardless of the dose. The cost of laboratory tests within the MIHCS is $2.14 per complete blood count and $9.85 for each PT/PTT.
Other costs, such as those related to the additional time spent by nursing and pharmacy staff in the mixing and administration of argatroban or caring for patients with HIT and HITT were not included in this analysis, as it was believed that they would have no impact on actual staffing levels and would not lead to a tangible or easily quantifiable increase in expenditures.
In the second scenario, the potential loss of income from additional days of hospitalization for HIT and HITT was considered. An institution could potentially lose money if a patient with HIT or HITT stayed longer than the number of days that is economically attractive given the DRG reimbursement. In this scenario, a longer length of stay of a patient with HIT or HITT could lead to the bed not being used by other patients for whom the hospital could be collecting revenue. This would only be applicable with high occupancy rates. The average revenue per day that a hospital could receive for a patient was calculated by dividing the average reimbursement, $4971.81, by the average length of stay for medical inpatients, 4.5 days. This amount is $1096.72. The amount of additional reimbursement for a complicating condition, $754.06, then covers 0.7 days of additional hospitalization. As described above, the average additional reimbursement for using the coagulation disorder DRG for patients with HITT, instead of using the DRG for which they were otherwise admitted, was $1135.56. This would cover an additional 1.04 days of hospitalization. If the hospital stay of patients with HIT/T were to be longer, an amount computed as $1096.72 multiplied by the number of additional days of hospitalization was considered a loss of income borne by the hospital.
Sensitivity Analysis
Sensitivity analysis was performed to ensure the validity of results over a range of values and to assess the effect of medication prices on our findings. The analysis used these parameters, both alone and in combination: rate of development of HIT, rate of development on enoxaparin compared with on heparin, percentage of those with HIT who developed thrombosis, mortality related to HITT, length of stay of patients with both HIT and HITT, reimbursement rates, and costs of medication.
RESULTS
The decision tree used for the base‐case analysis is shown in Figure 1. The gain in quality‐adjusted life years (QALYs) for medical patients who used enoxaparin rather than heparin for VTE prophylaxis was 0.00629 (approximately 55 hours). This was based on the decrease in HITT‐related premature death resulting from the use of enoxaparin. From a payer perspective, the daily cost of enoxaparin is $3.58, compared with $32.18 for heparin. The difference is a savings of $28.61, leading to a savings/QALY of $4550.17. Therefore, the use of enoxaparin is both more effective and less costly.

Sensitivity analysis showed that from a payer perspective, enoxaparin remained both less costly and more effective in all cases. The factors that had the largest impact on cost/QALY were incidence of HIT and rate of thrombosis among those with HIT. Decreasing length of stay to 0 for patients with HIT, decreasing reimbursement to $0 for both HIT and HITT, and billing at a high or low level did not change the general finding. Decreasing the cost of enoxaparin or heparin also did not affect these findings. The results of the sensitivity analysis are summarized in Table 3.
| Enoxaparin (cost/day) | Heparin (cost/day) | QALYs saved | Savings/QALY | |
|---|---|---|---|---|
| Base case | $3.58 | $32.18 | 0.00629 | $4550.17 |
| Sensitivity analysis | ||||
| Incidence of HIT | $1.06$6.49 | $ 9.54$58.11 | 0.001860.01141 | $4550.17 |
| Progression of HIT to HITT | $3.12$3.77 | $28.05$33.95 | 0.003930.00786 | $6344.53$3840.30 |
| Level of physician visit billed | $3.23$3.81 | $28.45$34.27 | 0.00629 | $4021.85$4844.35 |
| HIT length of stay | $3.48$3.64 | $31.30$32.78 | 0.00629 | $4424.46$4633.98 |
| No reimbursement for HIT | $2.13 | $19.20 | 0.00629 | $2713.90 |
| No reimbursement for HITT | $0.77 | $ 6.93 | 0.00629 | $ 980.05 |
From an institutional perspective, the effect of considering the costs of HIT and HITT did not necessarily make enoxaparin a more attractive choice. When potential reimbursement for drug‐related complications was considered, an institution actually make $7.27/day by choosing heparin, whereas the cost of enoxaparin decreases only minimally from $84.00 to $82.75/day (Table 4). Factoring opportunity costs into the analysis showed that an institution does not make money by using heparin, but heparin still costs less on a daily basis. This finding changes only at rates of HIT over 4%.
| Heparin | Enoxaparin | |||
|---|---|---|---|---|
| Drug cost alone | Drug cost + cost of increased LOS | Drug cost alone | Drug cost + cost of increased LOS | |
| Base case | ($7.27) | $72.33 | $82.75 | $91.59 |
| Sensitivity Analysis | ||||
| Incidence of HIT | $ 0.66($16.45) | $24.25$128.01 | $83.63$81.75 | $86.25$ 97.18 |
| Length of stay HIT | ($ 7.27) | $42.72$190.78 | $82.75 | $88.30$104.75 |
| Length of stay HITT | ($ 7.27) | $48.64$101.57 | $82.75 | $88.96$ 95.54 |
| Drug costs below which enoxaparin is more attractive | $ 0.50$ 4.00 | $ 0.50$ 4.00 | $33.00$37.00 | < $1.00 |
Sensitivity analyses of institutional costs are summarized in Table 4. These analyses demonstrated that potential increases in length of stay for patients with HIT or HITT could make heparin less attractive when opportunity costs to the hospital are considered. If the additional length of stay for patients with HIT increased to greater than 1.75 days or the additional length of stay for those with HITT increased to more than 9 days, heparin becomes a less attractive choice. Loss of reimbursement for HIT or HITT alone does not make enoxaparin less costly than heparin.
Sensitivity analysis also demonstrated that variation in the price of enoxaparin could potentially make heparin less attractive. If the price of heparin were held constant at $4.00/day, enoxaparin would become less costly at a price of $37.00. If the price of heparin were to decrease to as low as $0.50/day, the price at which enoxaparin would be more attractive decreased to $33.00. These prices are only applicable when the opportunity costs of having occupied beds are consideredthat is, only when an institution is operating at full capacity. When this is not the case, enoxaparin would have to cost less than $1.00 to be more financially attractive than heparin. In practical terms, unless a hospital is at full capacity and needs hospital beds for other patients, the cost of enoxaparin would have to be less than $1 for an institution to choose it instead of heparin.
DISCUSSION
This study demonstrates that from a payer perspective, there is greater cost utility in the use of enoxaparin in place of heparin for the prevention of venous thromboembolism in at‐risk medical patients. This benefit is based on a single advantage of enoxaparin: its decreased tendency to cause HIT/T. Despite the simplicity of this assumption, it is well supported by published data. Sensitivity analyses supported the finding that enoxaparin was a superior choice in all scenarios modeled. This payer data can be extrapolated to a societal level because the costs used were based on Medicare reimbursements.
The benefit of using enoxaparin when expressed in an absolute number of quality‐adjusted life years was small, approximately 55 hours. This reflects that although the effects of HIT and HITT are potentially devastating, they occur infrequently. However, our calculation was conservative in several respects. We calculated the highest possible average age for a medical inpatient based on the available statistics. This was done to ensure that we were not overestimating the number of QALYs saved by preventing death secondary to HITT. We also considered only 2 outcomes of HITT: death and recovery. This underestimates the significant potential thrombotic complications, notably amputation or other loss of function, which would increase the number of QALYs saved by using enoxaparin. The inclusion of these complications would only strengthen this finding. Finally, we assumed equal efficacy for heparin and enoxaparin. The inclusion of superior efficacy of enoxaparin in subpopulations of medical inpatients would again only strengthen this finding.
Apart from the price of the medication, the incidence of HIT had the largest impact on costs and QALYs saved in the sensitivity analysis. Studies specific to VTE prophylaxis in medical inpatients could better define the incidence of HIT/T in this population, but this would not change our overall finding.
From an institutional perspective, the choice of heparin or enoxaparin is more complicated. In most but not all scenarios, the use of heparin appears to be more financially attractive. The prices of enoxaparin and heparin, the additional length of stay required to care for patients with HIT and HITT, and the percentage of total beds occupied all affect this decision. Several pieces of cost data, specifically those related to medication and laboratory testing, were specific to an MIHCS health care system, the type considered in the analysis and could potentially limit the applicability of this study to other institutions. However, the sensitivity analysis demonstrated that the cost of enoxaparin would have to be at least 60% lower, below $33/day, before affecting our conclusion, and then only if an institution were at full capacity. Thus, we expect that our results are generally applicable.
The potential limitations of this study are related to the assumptions required. However, our efficacy assumptions were conservatively based on published data. It is possible that a decrease in the rate of thrombosis if all cases of HIT were treated with argatroban could affect our findings. However, in the study by Lewis et al., the complication rate for those with HIT in the treatment group was 28% (versus 38.8% in the untreated group), consistent with rates used in our sensitivity analysis. DRG and physician reimbursements are based on published Medicare data. The greatest variation is likely to be in drug cost, as different institutions may negotiate lower prices. From a payer perspective, drug costs do not affect the conclusions; from an institutional perspective, drug cost may make the choice a complicated one. One factor not included in our analysis that may affect this decision is the possible impact of legal action on the medications institutions choose for VTE prophylaxis. Because the potential consequences of HITT can be so devastating, an institution could have difficulty defending the choice of heparin when an equally effective alternative with fewer adverse events was available. A settlement of $1 million could potentially pay for prophylaxis with enoxaparin for at least 2500 patients.
This analysis has highlighted one of the unfortunate paradoxes caused by the different, potentially competing incentives in our health care system. Payers and institutions often face different financial incentives. From a hospital's perspective, it may cost less to use an intervention that can potentially cause a greater number of complications and higher payer costs. We believe that for VTE prophylaxis for medical inpatients, improved patient outcomes coupled with decreased payer/societal costs argue strongly for the use of enoxaparin over unfractionated heparin and outweigh any institutional benefits.
- ,,, et al.A comparison of enoxaparin with placebo for the prevention of venous thromboembolism in acutely ill medical patients.N Eng J Med.1999;322:793–800.
- .Recommendations for prophylaxis of venous thromboembolism: International consensus and the American College of Chest Physicians Fifth Consensus Conference on Antithrombotic therapy.Curr Opin Pulm Med.2000;6:314–320.
- ,,, et al.Risk factors for venous thromboembolism in hospitalized patients with acute medical illness: analysis of the MEDENOX study.Arch Intern Med.2004;164:963–968.
- .Heparin–induced thrombocytopenia: pathogenesis and management.Br J Haematology.1003;121:535–555.
- .Heparin–induced thrombocytopenia diagnosis and management.Circulation.2004;110:e454–e458.
- .New approaches to the diagnosis of heparin–induced thrombocytopenia.Chest.2005;27(2 suppl):35S–45S.
- ,,, et al.Randomized comparison of enoxaparin with unfractionated heparin for the prevention of venous thromboembolism in medical patients with heart failure or severe respiratory disease.Am Heart J.2003;145:614–621.
- ,.Cost–effectiveness analysis of deep vein thrombosis prophylaxis in internal medicine patients.Thrombosis Res.1999;94:65–68.
- ,.,.Cost effectiveness of thromboprophylaxis with low–molecular–weight heparin versus unfractionated heparin in acutely ill medical inpatients.Am J Manag Care.2004;10:632–642.
- ,,, et al.Economic assessment of low–molecular–weight heparin (enoxaparin) versus unfractionated heparin in acute coronary syndrome patients: results from the ESSENCE Randomized Trial.Circulation.1998;97:1702–1707.
- ,, et al.Management of acute proximal deep vein thrombosis: pharmacoeconomic evaluation of outpatient treatment with enoxaparin vs inpatient treatment with unfractionated heparin.Chest.2002;122(1);108–114.
- ,,, et al.Prevention of deep–vein thrombosis following total hip replacement surgery with enoxaparin versus unfractionated heparin: a pharmacoeconomic evaluation.Ann Pharmacother.1994:28(2):271–275.
- ,.Cost–effectiveness of prolonged out–of–hospital prophylaxis with low–molecular–weight heparin following total hip replacement.Haemostasis.2000;30(suppl 2):130–135.
- ,,, et al.Cost effectiveness of a low–molecular–weight heparin in prolonged prophylaxis against deep vein thrombosis after total hip replacement.Pharmacoeconomics.1998;13:81–89.
- ,,, et al.Economic analysis of low–dose heparin vs the low–molecular–weight heparin enoxaparin for prevention of venous thromboembolism after colorectal surgery.Arch Intern Med.1999;159:1221–1228.
- .High risk of the critically ill for venous thromboembolism.Crit Care Med.1982;10:448–450.
- ,,, et al.Prevention of deep vein thrombosis in medical patients by low dose heparin.Scott Med J.1981;26:115–117.
- ,,, et al.Prevalence and prevention of deep venous thrombosis of the lower extremities in high–risk pulmonary patients.Angiology.1988;39:505–513.
- ,,, et al.A double–blind randomized trial of ORG 10172 low–molecular weight heparinoid versus unfractionated heparin in the prevention of deep venous thrombosis in patients with thrombotic stroke.Thromb Haemost.1991;65(suppl):753.
- ,,, et al.A double–blind and randomized placebo controlled trial of low molecular weight heparin once daily to prevent deep vein thrombosis in acute ischemic stroke.Semin Thromb Hemost.1990;16(suppl):25–33.
- ,,, et al.The incidence of heparin–induced thrombocytopenia in hospitalized medical patients treated with subcutaneous unfractionated heparin: a prospective cohort study.Blood.2003;101:2955–2959.
- ,,, et al.Heparin–induced thrombocytopenia in neurologic disease treated with unfractionated heparin.Neurology.2004;62:657–659.
- ,,, et al.Subcutaneous heparin versus low–molecular–weight heparin as thromboprophylaxis in patients undergoing colorectal surgery.Ann Surg2001;233:438–44.
- ,,, et al.Heparin–induced thrombocytopenia inpatients treated with low–molecular weight heparin or unfractionated heparin.N Eng J Med.1995;332:1330–1335.
- ,,, et al.An improved definition of heparin–induced thrombocytopenia in postoperative orthopedic patients.Arch Intern Med.2003;163:2518–2524.
- ,,, et al.Impact of patient population on the risk for heparin–induced thrombocytopenia.Blood.2000;96:1703–1708.
- ,,, et al.Heparin–induced thrombocytopenia and thrombosis: incidence, analysis of risk factors, and clinical outcomes in 108 consecutive patients treated at a single institution.Am J Hematol.1997;56(1):12–16.
- .., et al.Argatroban anticoagulation in patients with heparin–induced thrombocytopenia.Arch Intern Med.2003:163:1849–1856.
- ,,, et al.Antibodies to platelet factor 4–heparin after cardiopulmonary bypass in patients anticoagulated with unfractionated heparin or a low–molecular–weight heparin: clinical implications for heparin–induced thrombocytopenia.Circulation.1999;99:2530–2536.
- ,,, et.Al. Argatroban anticoagulant therapy in patients with heparin–induced thrombocytopenia.Circulation.2001;103:1838–1843.
- ,.A 14 year study of heparin–induced thrombocytopenia.Am J Med.1996;101:502–507.
- ,,, et al.Failure of early heparin cessation as treatment for heparin–induced thrombocytopenia.Am J Med.1999;106:629–635.
- CEA Registry,Harvard Center for Risk Analysis. Available at: http://www.hcra.harvard.edu/pdf/preferencescores.pdf.
- .Temporal aspects of heparin–induced thrombocytopenia.N Eng J Med.2001;344:1286–1292.
- National Center for Health Statistics. Available at: http://www.cdc.gov/nchs/.
- Centers for Medicare and Medicaid Services. Available at: http://www.cms.hhs.gov/.
Several groups of medical patients at risk for venous thromboembolism (VTE) while hospitalized have been identified. These include patients with certain acute medical illnesses such as acute myocardial infarction, stroke, or chronic obstructive pulmonary disease and those with acute medical illness combined with additional risk factors including advanced age, cancer, obesity, or prior VTE.13
Heparin‐induced thrombocytopenia (HIT) and heparin‐induced thrombocytopenia with thrombosis (HITT), a spectrum of disease also known as type 2 HIT, are potentially devastating hematologic consequences of VTE prophylaxis that result from heparin binding to platelet factor IV, leading to IgG antibodymediated platelet activation.46 These complications manifest along a spectrum from thrombocytopenia alone (HIT) to more severe sequelae that include death, amputation, venous and arterial thrombosis. Unfractionated heparin (UFH) has traditionally been used for VTE prophylaxis in these populations at risk. More recently, evidence has indicated that enoxaparin, a low‐molecular‐weight heparin, is at least as effective for VTE prophylaxis1, 7 and carries a significantly lower risk for the development of the complications of HIT and HITT. Despite the superior side‐effect profile of enoxaparin, many institutions encourage the use of heparin for DVT prophylaxis because of its lower price. However, when the costs of treating these complications are considered, using unfractionated heparin may actually be more costly.
Two studies of the cost effectiveness of heparin compared with enoxaparin when used for VTE prophylaxis in medical inpatients have recently been published.8, 9 However, one of these studies focused only on pharmacy‐related costs and did not consider patient‐related outcomes, and the other was published by a for‐profit research company. Studies of treatment with enoxaparin versus UFH in other medical settings, including non‐Q‐wave myocardial infarction10 and treatment of acute deep‐vein thrombosis,11 suggest that enoxaparin is more cost effective. Studies of prophylaxis of surgical patients have been contradictory. Data suggest that in orthopedic patients the use of enoxaparin is more cost effective for both short‐ and long‐term VTE prophylaxis,1214 but low‐dose heparin appeared more cost effective for patients undergoing colorectal surgery, in large part because of an assumption of a smaller risk of bleeding.15
The purpose of this analysis was to determine the cost utility of heparin compared with enoxaparin for VTE prophylaxis for medical inpatients at risk. In such an analysis, it is important to consider the possibly different meanings that entities may attach to cost utility and effectiveness according to their different roles in the health care system. Individual institutions pay inpatient medication costs, but they often do not directly bear the costs of complications of treatment and may actually receive reimbursements for them. In contrast, payers must provide that reimbursement. For this reason, costs were analyzed from 2 perspectives, that of a payer (Medicare) and that of a health care system or institution.
METHODS
This protocol was declared exempt by the Institutional Review Board at the University of Texas Health Science Center at San Antonio.
Estimates of Effectiveness
Estimates of effectiveness include those related both to efficacy in preventing VTE, and those related to adverse drug events. They are summarized in Table 1.
| Base Case | Range for Sensitivity Analysis | |
|---|---|---|
| Rate of development of HIT on heparin | 2.70% | 0.80%4.90% |
| Rate of development of HIT on enoxaparin | 0.30% | 0.09%0.54% |
| Rate of progression to HITT | 40% | 25%50% |
| Mortality rate despite treatment, HITT | 8% | 0%20% |
| Assumed extension in length of stayHIT | 1 day | 05 days |
| Assumed extension in length of stayHITT | 7 days | 510 days |
| Life expectancy (2001) | 77.2 years | |
| Average age of medical inpatient | 71.9 years | |
| QALY adjustment for: | ||
| CHFsevere | 0.6 | |
| COPD | 0.4 | |
| Cancer | 0.9 |
Assumptions about the efficacy of heparin and enoxaparin when used for VTE prophylaxis were based on the following published data. The rate of development of VTE reported in the Medenox trial, 5.5%,1 is consistent with rates reported for patients receiving heparin (2%13%).1618 More recently, the PRINCE study demonstrated that enoxaparin was at least as effective as heparin in patients with severe heart failure or respiratory disease and was more effective in the former group of patients.7 Finally, data from patients with acute stroke indicated that low‐molecular‐weight heparins are at least as effective as heparin for this indication.19, 20 Equal efficacy was assumed for this analysis for several reasons, primarily to avoid the creation or amplification of errors through the introduction of more assumptions about the proportion of patients with specific diagnoses and about the magnitude and range of differences in efficacy. Only one study has examined the relative efficacy in patients with congestive heart failure, and not all the results of studies in stroke patients pointed to enoxaparin having improved efficacy. Therefore, making valid assumptions about the magnitude of the difference between the drugs on the basis of the available evidence may not be possible.
It was also assumed that aside from HIT and HITT, the 2 drugs had the same rates of adverse events, including bleeding complications, in this patient population.1
A Medline search combining MeSH terms thrombocytopenia and heparin was done to find the appropriate incidence of HIT and HITT. The resulting group was further limited in 3 separate searches using the terms prophylaxis (keyword), incidence (MeSH term), and thromboembolism or venous thrombosis (MeSH terms). Heparin‐induced thrombocytopenia was searched for as a keyword and combined with the MeSH term prophylaxis in a separate search. Finally, reference lists were searched to find additional articles.
The range of reported rates of development of HIT among patients receiving heparin was wide. In part, this is related to the different subgroups of patients studied and to the inclusion of patients receiving both prophylaxis and treatment doses of heparin. The one study that looked specifically at medical inpatients included patients receiving treatment‐dose heparin. The rate of HIT in this study was 0.8%.21 A study of both prophylactic and therapeutic use in neurologic patients reported a rate of 2.5%.22 Studies specific to VTE prophylaxis in surgical patients reported a range of 0.8%4.9%.2326 Based on these results, a rate of 2.7%, the median of the reported ranges, was used for the base case, and 0.8% and 4.9% were used for sensitivity analysis.
The reported rates of progression to thrombosis for patients with HIT ranged from 25 to more than 50%.21, 27, 28 A median rate of 40% was used for the base case, and 25% and 50% were used for sensitivity analysis. It was assumed that 0.3% of patients receiving enoxaparin developed HIT, 1/9 as frequently as those receiving heparin,24, 25, 29 but that the same percentage of those with HIT would develop thrombosis.
Mortality secondary to thrombosis in patients with untreated HIT has been reported to be 4%5%.30, 31 All‐cause mortality in untreated patients with HITT has been reported to be as high as >20%,31, 32 but in treated patients it has been reported as 8%.30 A mortality rate of 8% for HITT despite treatment was assumed with a range in the sensitivity analysis from 0% to 20%.
Life expectancy data were obtained from the National Center for Health Statistics, and the average age of medical inpatients potentially eligible for DVT prophylaxis was calculated from this data. The catalog of preference scores was obtained from the Cost Effectiveness Analysis Registry at the Harvard Center for Risk Analysis.33 These preference scores adjust the quality of a year of life for chronic diseases and provide a more accurate assessment of quality‐adjusted life years.
It was assumed that patients with HIT alone would be treated with argatroban, consistent with evidence that this is superior to withdrawal of heparin alone in patients with HIT.28 Using other agents such as lepirudin for the treatment of HIT was not considered in this analysis because there is no data on which to base their efficacy in patients with HIT.
For treatment of patients with HITT, again only the use of argatroban was considered. Though other agents are as efficacious in treating HITT, they are also more expensive. Therefore, using argatroban allowed for a more conservative estimate.
Platelet counts typically fall after 5 days of heparin administration in patients developing HIT34 and typically recover within 35 days of initiation of treatment.4, 29 In the past, patients may not have been kept in the hospital for resolution of their platelet count. However, with evidence that HIT should be aggressively treated, patients with HIT will likely have a longer length of stay. A study of treatment of HIT reported a mean time on argatroban of 57 days.23 This is greater than the average length of stay for medical diagnosis, which is 45 days.35 Therefore, an additional length of stay of 1 day was assumed for patients given a diagnosis of HIT, with a range of 05 days used for the sensitivity analysis. An additional length of stay totaling 7 days was assumed for those with thrombosis, based on patients requiring 7 days of argatroban therapy for treatment of HITT in a recent study.28
Estimates of Costs
Costs were analyzed from institutional and Medicare perspectives. Only direct medical expenditures related to hospitalization were considered; indirect patient costs resulting from the sequelae of HITT, while potentially severe, were not included. An incremental analysis was performed to express the increase in resources used when a person develops HIT/T, with the final result expressed as a daily cost of each medication. Cost assumptions are summarized in Table 2.
| Medicarerelated | Institutionrelated | |||
|---|---|---|---|---|
| Base case | Range | Base case | Range | |
| Additional reimbursement for HIT (if considered a complicating condition) | $ 765.06 | $ 0.00 | $ 765.06 | $0.00 |
| Additional reimbursement for HITT (if coagulation disorder DRG used) | $1135.56 | $ 0.00 | $1135.56 | $0.00 |
| Primary provider visit (99232) | $ 54.89 | $33.00$ 78.04 | n/a | |
| Consultant initial visit (99254) | $ 140.39 | $35.84$193.03 | n/a | |
| Consultant followup (99263) | $ 44.80 | $22.40$ 66.09 | n/a | |
| Medication (per day) | ||||
| Heparin | n/a | $ 4.00 | ||
| Enoxaparin | n/a | $ 84.00 | ||
| Argatroban | n/a | $ 150.00 | ||
| Coumadin | n/a | $ 0.50 | ||
| Laboratory tests (per test) | ||||
| Complete blood count | n/a | $ 2.14 | ||
| Prothrombin time/partial thromboplastin time | n/a | $ 9.85 | ||
| Opportunity cost per additional day of hospitalization (if hospital at capacity) | n/a | $1096.72 | ||
Medicare Related
Diagnosis‐related group (DRG) reimbursement to institutions and physicians were considered the only payer‐related costs. These were based on the 2005 Medicare reimbursement.36 Costs related to laboratory, medication, or other diagnostic studies were assumed to be covered by the DRG payment and not to be billed separately.
The average Medicare reimbursement to institutions for all diagnosis‐related groups is the national standard number, or $4971.81. To determine the additional potential charges resulting from the development of HIT, it was considered a complicating condition. The average adjustment factor for complicating conditions of medical diagnoses is .1539, leading to an increase in charges of $765.06. No additional adjustments for geographic location were made. Sensitivity analysis was performed with no additional reimbursement for HIT as a complicating condition.
To quantify additional charges related to caring for patients with HITT, we used the amount of additional charges for the coagulation disorder DRG (#397) above those of the average reimbursement. This amount is $1135.56, the difference between the higher charge of $6107.37 for this DRG, and the national standard number. Sensitivity analysis with no additional charges was performed.
Physician charges used were based on the 2004 Medicare reimbursement.36 It was assumed that each patient with HIT would have a daily visit of moderate complexity (CPT 99232), which carries a reimbursement rate of $54.89. Patients with thrombotic complications were assumed to also have a hematology consult consisting of one initial visit and one followup, both of midlevel complexity (CPTs 99253 and 99262). The reimbursement rates for these visits are $97.45 and $44.80. Sensitivity analysis using both lower‐ and higher‐level visits was performed (Table 2).
Based on the above DRG and physician reimbursements, the total cost to Medicare of treating a patient with HIT is $820.05 and of treating a patient with HITT is $1749.98. For the situation in which a patient with HIT also developed HITT, only the cost of reimbursement for HITT was modeled.
Hospital‐Related
To calculate the benefit or cost to an institution, 2 scenarios were modeled. In the first scenario, only the DRG‐related revenues collected and the costs of caring for patients with HIT/T were considered. The revenues used are described above. The cost of medications at a multi‐institutional health care system (MIHCS) was obtained from the pharmacy and used in this analysis. This system is composed of a network of urban and suburban acute care facilities with academic affiliations with 2 universities. Costs are representative of the entire system. The cost of heparin is $2.00 per unit dose; daily cost for b.i.d. prophylaxis is $4.00. The cost of one daily dose of enoxaparin is $84.00. One unit (50 mg) of argatroban costs $50.00. For a 70‐kg man at a standard dosing rate of 2 g/kg per minute, the daily cost would be approximately $150.00. The daily cost of coumadin was estimated at $0.50 regardless of the dose. The cost of laboratory tests within the MIHCS is $2.14 per complete blood count and $9.85 for each PT/PTT.
Other costs, such as those related to the additional time spent by nursing and pharmacy staff in the mixing and administration of argatroban or caring for patients with HIT and HITT were not included in this analysis, as it was believed that they would have no impact on actual staffing levels and would not lead to a tangible or easily quantifiable increase in expenditures.
In the second scenario, the potential loss of income from additional days of hospitalization for HIT and HITT was considered. An institution could potentially lose money if a patient with HIT or HITT stayed longer than the number of days that is economically attractive given the DRG reimbursement. In this scenario, a longer length of stay of a patient with HIT or HITT could lead to the bed not being used by other patients for whom the hospital could be collecting revenue. This would only be applicable with high occupancy rates. The average revenue per day that a hospital could receive for a patient was calculated by dividing the average reimbursement, $4971.81, by the average length of stay for medical inpatients, 4.5 days. This amount is $1096.72. The amount of additional reimbursement for a complicating condition, $754.06, then covers 0.7 days of additional hospitalization. As described above, the average additional reimbursement for using the coagulation disorder DRG for patients with HITT, instead of using the DRG for which they were otherwise admitted, was $1135.56. This would cover an additional 1.04 days of hospitalization. If the hospital stay of patients with HIT/T were to be longer, an amount computed as $1096.72 multiplied by the number of additional days of hospitalization was considered a loss of income borne by the hospital.
Sensitivity Analysis
Sensitivity analysis was performed to ensure the validity of results over a range of values and to assess the effect of medication prices on our findings. The analysis used these parameters, both alone and in combination: rate of development of HIT, rate of development on enoxaparin compared with on heparin, percentage of those with HIT who developed thrombosis, mortality related to HITT, length of stay of patients with both HIT and HITT, reimbursement rates, and costs of medication.
RESULTS
The decision tree used for the base‐case analysis is shown in Figure 1. The gain in quality‐adjusted life years (QALYs) for medical patients who used enoxaparin rather than heparin for VTE prophylaxis was 0.00629 (approximately 55 hours). This was based on the decrease in HITT‐related premature death resulting from the use of enoxaparin. From a payer perspective, the daily cost of enoxaparin is $3.58, compared with $32.18 for heparin. The difference is a savings of $28.61, leading to a savings/QALY of $4550.17. Therefore, the use of enoxaparin is both more effective and less costly.
Sensitivity analysis showed that from a payer perspective, enoxaparin remained both less costly and more effective in all cases. The factors that had the largest impact on cost/QALY were incidence of HIT and rate of thrombosis among those with HIT. Decreasing length of stay to 0 for patients with HIT, decreasing reimbursement to $0 for both HIT and HITT, and billing at a high or low level did not change the general finding. Decreasing the cost of enoxaparin or heparin also did not affect these findings. The results of the sensitivity analysis are summarized in Table 3.
| Enoxaparin (cost/day) | Heparin (cost/day) | QALYs saved | Savings/QALY | |
|---|---|---|---|---|
| Base case | $3.58 | $32.18 | 0.00629 | $4550.17 |
| Sensitivity analysis | ||||
| Incidence of HIT | $1.06$6.49 | $ 9.54$58.11 | 0.001860.01141 | $4550.17 |
| Progression of HIT to HITT | $3.12$3.77 | $28.05$33.95 | 0.003930.00786 | $6344.53$3840.30 |
| Level of physician visit billed | $3.23$3.81 | $28.45$34.27 | 0.00629 | $4021.85$4844.35 |
| HIT length of stay | $3.48$3.64 | $31.30$32.78 | 0.00629 | $4424.46$4633.98 |
| No reimbursement for HIT | $2.13 | $19.20 | 0.00629 | $2713.90 |
| No reimbursement for HITT | $0.77 | $ 6.93 | 0.00629 | $ 980.05 |
From an institutional perspective, the effect of considering the costs of HIT and HITT did not necessarily make enoxaparin a more attractive choice. When potential reimbursement for drug‐related complications was considered, an institution actually make $7.27/day by choosing heparin, whereas the cost of enoxaparin decreases only minimally from $84.00 to $82.75/day (Table 4). Factoring opportunity costs into the analysis showed that an institution does not make money by using heparin, but heparin still costs less on a daily basis. This finding changes only at rates of HIT over 4%.
| Heparin | Enoxaparin | |||
|---|---|---|---|---|
| Drug cost alone | Drug cost + cost of increased LOS | Drug cost alone | Drug cost + cost of increased LOS | |
| Base case | ($7.27) | $72.33 | $82.75 | $91.59 |
| Sensitivity Analysis | ||||
| Incidence of HIT | $ 0.66($16.45) | $24.25$128.01 | $83.63$81.75 | $86.25$ 97.18 |
| Length of stay HIT | ($ 7.27) | $42.72$190.78 | $82.75 | $88.30$104.75 |
| Length of stay HITT | ($ 7.27) | $48.64$101.57 | $82.75 | $88.96$ 95.54 |
| Drug costs below which enoxaparin is more attractive | $ 0.50$ 4.00 | $ 0.50$ 4.00 | $33.00$37.00 | < $1.00 |
Sensitivity analyses of institutional costs are summarized in Table 4. These analyses demonstrated that potential increases in length of stay for patients with HIT or HITT could make heparin less attractive when opportunity costs to the hospital are considered. If the additional length of stay for patients with HIT increased to greater than 1.75 days or the additional length of stay for those with HITT increased to more than 9 days, heparin becomes a less attractive choice. Loss of reimbursement for HIT or HITT alone does not make enoxaparin less costly than heparin.
Sensitivity analysis also demonstrated that variation in the price of enoxaparin could potentially make heparin less attractive. If the price of heparin were held constant at $4.00/day, enoxaparin would become less costly at a price of $37.00. If the price of heparin were to decrease to as low as $0.50/day, the price at which enoxaparin would be more attractive decreased to $33.00. These prices are only applicable when the opportunity costs of having occupied beds are consideredthat is, only when an institution is operating at full capacity. When this is not the case, enoxaparin would have to cost less than $1.00 to be more financially attractive than heparin. In practical terms, unless a hospital is at full capacity and needs hospital beds for other patients, the cost of enoxaparin would have to be less than $1 for an institution to choose it instead of heparin.
DISCUSSION
This study demonstrates that from a payer perspective, there is greater cost utility in the use of enoxaparin in place of heparin for the prevention of venous thromboembolism in at‐risk medical patients. This benefit is based on a single advantage of enoxaparin: its decreased tendency to cause HIT/T. Despite the simplicity of this assumption, it is well supported by published data. Sensitivity analyses supported the finding that enoxaparin was a superior choice in all scenarios modeled. This payer data can be extrapolated to a societal level because the costs used were based on Medicare reimbursements.
The benefit of using enoxaparin when expressed in an absolute number of quality‐adjusted life years was small, approximately 55 hours. This reflects that although the effects of HIT and HITT are potentially devastating, they occur infrequently. However, our calculation was conservative in several respects. We calculated the highest possible average age for a medical inpatient based on the available statistics. This was done to ensure that we were not overestimating the number of QALYs saved by preventing death secondary to HITT. We also considered only 2 outcomes of HITT: death and recovery. This underestimates the significant potential thrombotic complications, notably amputation or other loss of function, which would increase the number of QALYs saved by using enoxaparin. The inclusion of these complications would only strengthen this finding. Finally, we assumed equal efficacy for heparin and enoxaparin. The inclusion of superior efficacy of enoxaparin in subpopulations of medical inpatients would again only strengthen this finding.
Apart from the price of the medication, the incidence of HIT had the largest impact on costs and QALYs saved in the sensitivity analysis. Studies specific to VTE prophylaxis in medical inpatients could better define the incidence of HIT/T in this population, but this would not change our overall finding.
From an institutional perspective, the choice of heparin or enoxaparin is more complicated. In most but not all scenarios, the use of heparin appears to be more financially attractive. The prices of enoxaparin and heparin, the additional length of stay required to care for patients with HIT and HITT, and the percentage of total beds occupied all affect this decision. Several pieces of cost data, specifically those related to medication and laboratory testing, were specific to an MIHCS health care system, the type considered in the analysis and could potentially limit the applicability of this study to other institutions. However, the sensitivity analysis demonstrated that the cost of enoxaparin would have to be at least 60% lower, below $33/day, before affecting our conclusion, and then only if an institution were at full capacity. Thus, we expect that our results are generally applicable.
The potential limitations of this study are related to the assumptions required. However, our efficacy assumptions were conservatively based on published data. It is possible that a decrease in the rate of thrombosis if all cases of HIT were treated with argatroban could affect our findings. However, in the study by Lewis et al., the complication rate for those with HIT in the treatment group was 28% (versus 38.8% in the untreated group), consistent with rates used in our sensitivity analysis. DRG and physician reimbursements are based on published Medicare data. The greatest variation is likely to be in drug cost, as different institutions may negotiate lower prices. From a payer perspective, drug costs do not affect the conclusions; from an institutional perspective, drug cost may make the choice a complicated one. One factor not included in our analysis that may affect this decision is the possible impact of legal action on the medications institutions choose for VTE prophylaxis. Because the potential consequences of HITT can be so devastating, an institution could have difficulty defending the choice of heparin when an equally effective alternative with fewer adverse events was available. A settlement of $1 million could potentially pay for prophylaxis with enoxaparin for at least 2500 patients.
This analysis has highlighted one of the unfortunate paradoxes caused by the different, potentially competing incentives in our health care system. Payers and institutions often face different financial incentives. From a hospital's perspective, it may cost less to use an intervention that can potentially cause a greater number of complications and higher payer costs. We believe that for VTE prophylaxis for medical inpatients, improved patient outcomes coupled with decreased payer/societal costs argue strongly for the use of enoxaparin over unfractionated heparin and outweigh any institutional benefits.
- ,,, et al.A comparison of enoxaparin with placebo for the prevention of venous thromboembolism in acutely ill medical patients.N Eng J Med.1999;322:793–800.
- .Recommendations for prophylaxis of venous thromboembolism: International consensus and the American College of Chest Physicians Fifth Consensus Conference on Antithrombotic therapy.Curr Opin Pulm Med.2000;6:314–320.
- ,,, et al.Risk factors for venous thromboembolism in hospitalized patients with acute medical illness: analysis of the MEDENOX study.Arch Intern Med.2004;164:963–968.
- .Heparin–induced thrombocytopenia: pathogenesis and management.Br J Haematology.1003;121:535–555.
- .Heparin–induced thrombocytopenia diagnosis and management.Circulation.2004;110:e454–e458.
- .New approaches to the diagnosis of heparin–induced thrombocytopenia.Chest.2005;27(2 suppl):35S–45S.
- ,,, et al.Randomized comparison of enoxaparin with unfractionated heparin for the prevention of venous thromboembolism in medical patients with heart failure or severe respiratory disease.Am Heart J.2003;145:614–621.
- ,.Cost–effectiveness analysis of deep vein thrombosis prophylaxis in internal medicine patients.Thrombosis Res.1999;94:65–68.
- ,.,.Cost effectiveness of thromboprophylaxis with low–molecular–weight heparin versus unfractionated heparin in acutely ill medical inpatients.Am J Manag Care.2004;10:632–642.
- ,,, et al.Economic assessment of low–molecular–weight heparin (enoxaparin) versus unfractionated heparin in acute coronary syndrome patients: results from the ESSENCE Randomized Trial.Circulation.1998;97:1702–1707.
- ,, et al.Management of acute proximal deep vein thrombosis: pharmacoeconomic evaluation of outpatient treatment with enoxaparin vs inpatient treatment with unfractionated heparin.Chest.2002;122(1);108–114.
- ,,, et al.Prevention of deep–vein thrombosis following total hip replacement surgery with enoxaparin versus unfractionated heparin: a pharmacoeconomic evaluation.Ann Pharmacother.1994:28(2):271–275.
- ,.Cost–effectiveness of prolonged out–of–hospital prophylaxis with low–molecular–weight heparin following total hip replacement.Haemostasis.2000;30(suppl 2):130–135.
- ,,, et al.Cost effectiveness of a low–molecular–weight heparin in prolonged prophylaxis against deep vein thrombosis after total hip replacement.Pharmacoeconomics.1998;13:81–89.
- ,,, et al.Economic analysis of low–dose heparin vs the low–molecular–weight heparin enoxaparin for prevention of venous thromboembolism after colorectal surgery.Arch Intern Med.1999;159:1221–1228.
- .High risk of the critically ill for venous thromboembolism.Crit Care Med.1982;10:448–450.
- ,,, et al.Prevention of deep vein thrombosis in medical patients by low dose heparin.Scott Med J.1981;26:115–117.
- ,,, et al.Prevalence and prevention of deep venous thrombosis of the lower extremities in high–risk pulmonary patients.Angiology.1988;39:505–513.
- ,,, et al.A double–blind randomized trial of ORG 10172 low–molecular weight heparinoid versus unfractionated heparin in the prevention of deep venous thrombosis in patients with thrombotic stroke.Thromb Haemost.1991;65(suppl):753.
- ,,, et al.A double–blind and randomized placebo controlled trial of low molecular weight heparin once daily to prevent deep vein thrombosis in acute ischemic stroke.Semin Thromb Hemost.1990;16(suppl):25–33.
- ,,, et al.The incidence of heparin–induced thrombocytopenia in hospitalized medical patients treated with subcutaneous unfractionated heparin: a prospective cohort study.Blood.2003;101:2955–2959.
- ,,, et al.Heparin–induced thrombocytopenia in neurologic disease treated with unfractionated heparin.Neurology.2004;62:657–659.
- ,,, et al.Subcutaneous heparin versus low–molecular–weight heparin as thromboprophylaxis in patients undergoing colorectal surgery.Ann Surg2001;233:438–44.
- ,,, et al.Heparin–induced thrombocytopenia inpatients treated with low–molecular weight heparin or unfractionated heparin.N Eng J Med.1995;332:1330–1335.
- ,,, et al.An improved definition of heparin–induced thrombocytopenia in postoperative orthopedic patients.Arch Intern Med.2003;163:2518–2524.
- ,,, et al.Impact of patient population on the risk for heparin–induced thrombocytopenia.Blood.2000;96:1703–1708.
- ,,, et al.Heparin–induced thrombocytopenia and thrombosis: incidence, analysis of risk factors, and clinical outcomes in 108 consecutive patients treated at a single institution.Am J Hematol.1997;56(1):12–16.
- .., et al.Argatroban anticoagulation in patients with heparin–induced thrombocytopenia.Arch Intern Med.2003:163:1849–1856.
- ,,, et al.Antibodies to platelet factor 4–heparin after cardiopulmonary bypass in patients anticoagulated with unfractionated heparin or a low–molecular–weight heparin: clinical implications for heparin–induced thrombocytopenia.Circulation.1999;99:2530–2536.
- ,,, et.Al. Argatroban anticoagulant therapy in patients with heparin–induced thrombocytopenia.Circulation.2001;103:1838–1843.
- ,.A 14 year study of heparin–induced thrombocytopenia.Am J Med.1996;101:502–507.
- ,,, et al.Failure of early heparin cessation as treatment for heparin–induced thrombocytopenia.Am J Med.1999;106:629–635.
- CEA Registry,Harvard Center for Risk Analysis. Available at: http://www.hcra.harvard.edu/pdf/preferencescores.pdf.
- .Temporal aspects of heparin–induced thrombocytopenia.N Eng J Med.2001;344:1286–1292.
- National Center for Health Statistics. Available at: http://www.cdc.gov/nchs/.
- Centers for Medicare and Medicaid Services. Available at: http://www.cms.hhs.gov/.
Copyright © 2006 Society of Hospital Medicine