User login
Hyperkalemia Treatment and Hypoglycemia
Hyperkalemia occurs in as many as 10% of all hospitalized patients,[1] leading to potentially fatal arrhythmias or cardiac arrest that results from ionic imbalance within the resting membrane potential of myocardial tissue.[2] Acute instances may be stabilized with insulin to stimulate intracellular uptake of potassium, but this increases the risk of hypoglycemia.[2] Centers for Medicare and Medicaid Services quality measures require hospitals to minimize hypoglycemic events, particularly serious events with blood glucose (BG) <40 mg/dL,[3] due to an association with an increase in mortality in the hospital setting.[4] Previous research at our tertiary care hospital found that 8.7% of patients had suffered a hypoglycemic event following insulin administration pursuant to acute hyperkalemia treatment, and that patients with a lower body weight are at increased risk of hypoglycemia, particularly severe hypoglycemia (BG <40 mg/dL).[5] Increasing the total dose of dextrose provided around the time of insulin administration is suggested to reduce this concern.[5]
Patients at our institution receive 50 g of dextrose in conjunction with intravenous (IV) insulin for hyperkalemia treatment. To further reduce the potential for hypoglycemia, our institution amended the acute hyperkalemia order set to provide prescribers an alternative dosing strategy to the standard 10 U of IV insulin traditionally used for this purpose. Beginning November 10, 2013, our computer prescriber order entry (CPOE) system automatically prepopulated a dose of 0.1 U/kg of body weight for any patients weighing <95 kg (doses rounded to the nearest whole unit) when the acute hyperkalemia order set was utilized. The maximum dose allowed continued to be 10 U. The revised order set also changed nursing orders to require BG monitoring as frequently as every hour following the administration of insulin and dextrose for the treatment of hyperkalemia.
The purpose of this study is to investigate whether weight‐based insulin dosing (0.1 U/kg) for patients weighing <95 kg, rather than a standard 10‐U insulin dose, resulted in fewer hypoglycemic episodes and patients affected. Secondarily, this study sought to determine the impact of weight‐based insulin dosing on potassium‐lowering effects of therapy and to detect any risk factors for development of hypoglycemia among this patient population.
METHODS
This institutional review boardapproved, single‐center, retrospective chart review examined patients for whom the physician order entry set for hyperkalemia therapy was utilized, including patients who weighed less than 95 kg and received regular insulin via weight‐based dosing (0.1 U/kg of body weight up to a maximum of 10 U) during the period November 10, 2013 to May 31, 2014, versus those who received fixed insulin dosing (10 U regardless of body weight) during the period May 1, 2013 to November 9, 2013. During each of these periods, the CPOE system autopopulated the recommended insulin dose, with the possibility for physician manual dose entry. Data collection was limited to the first use of insulin for hyperkalemia treatment per patient in each period.
Patients weighing <95 kg were the focus of this study because they received <10 U of insulin under the weight‐based dosing strategy. Patients were excluded from the study if they had a body weight >95 kg or no weight recorded, were not administered insulin as ordered, received greater than the CPOE‐specified insulin dose, or had no BG readings recorded within 24 hours of insulin administration. The first 66 patients within each group meeting all inclusion and exclusion criteria were randomly selected for analysis. This recruitment target was developed to provide enough patients for a meaningful analysis of hypoglycemia events based on previous reports from our institution.[5]
Hypoglycemia was defined as a recorded BG level <70 mg/dL within 24 hours after insulin administration; severe hypoglycemia was defined as a recorded BG <40 mg/dL within 24 hours. Individual episodes of hypoglycemia and severe hypoglycemia were recorded for each instance of such event separated by at least 1 hour from the time of the first recorded event. In addition, episodes of hypoglycemia or severe hypoglycemia and number of patients affected were assessed at within 6 hours, 6 to 12 hours, and 12 to 24 hours after insulin administration as separate subsets for statistical analysis.
For the purpose of assessing the potassium‐lowering efficacy of weight‐based versus traditional dosing of insulin, maximum serum potassium levels were examined in the 12‐hour interval before the hyperkalemia order set was implemented and compared with minimum potassium levels in the 12 hours after insulin was administered. A comparison of the treatment groups assessed differences between the mean decrease in serum potassium from baseline, the mean minimum potassium achieved, the number of patients achieving minimum potassium below 5.0 mEq/L, and the number of patients who subsequently received repeat treatment for hyperkalemia within 24 hours of treatment with insulin.
Statistical analysis was conducted utilizing 2 and Fisher exact tests for nominal data and Student t test for continuous data to detect statistically significant differences between the groups. Binomial logistic multivariable analysis using a backward stepwise approach was used to determine factors for development of hypoglycemia, analyzed on a per‐patient basis to prevent characteristics from being over‐represented when events occurred multiple times to a single patient. All analyses were completed by using SPSS version 18 (SPSS Inc., Chicago, IL).
RESULTS
In total, 1734 entries were available for the acute hyperkalemia order set with insulin during the 2 periods investigated. Only 464 patients were eligible for manual chart review once weight‐based exclusions were identified by electronic database, with additional exclusion criteria later extracted from patient charts. Patients in both treatment groups were fairly well balanced, with a slightly lower body weight in the 10‐U insulin group recorded (Table 1). Patients in the weight‐based dosing group received between 4 and 9 U of insulin, depending on body weight.
| Characteristics | 10 U Insulin, n = 66 | 0.1 U/kg Insulin, n = 66 | P Value (2‐Sided) |
|---|---|---|---|
| |||
| Weight, kg | 69.9 (14.2) | 74.2 (12.6) | 0.07 |
| Age, y | 55.7 (15.7) | 61.9 (17.6) | 0.36 |
| Male gender | 37 (56.1%) | 41 (62.1%) | 0.60 |
| Caucasian race | 40 (60.6%) | 37 (56.1%) | 0.55 |
| Serum creatinine, mg/dL | 3.16 (4.38) | 3.04 (4.61) | 0.9 |
| Creatinine clearance <30 mL/min | 41 (62.1%) | 41 (62.1%) | 0.6 |
| Dialysis | 20 (30.3%) | 16 (24.2%) | 0.56 |
| Baseline blood glucose, mg/dL | 166.0 (71.7) | 147.3 (48.0) | 0.08 |
| Received other insulin within 24 hours of hyperkalemia treatment | 30 (45.4%) | 25 (37.9%) | 0.48 |
| Received K+ supplement within 24 hours of hyperkalemia treatment | 9 (13.6%) | 11 (16.7%) | 0.81 |
| Baseline serum K+, mmol/L | 6.1 (0.5) | 6.1 (0.7) | 0.76 |
| Baseline serum K+ >6.0 mmol/L | 41 (62.1%) | 33 (50%) | 0.22 |
| No. of additional treatments for hyperkalemia in addition to insulin/dextrose | 1.5 (0.8) | 1.4 (0.9) | 0.49 |
A reduction in the number of hypoglycemic episodes was detected in the weight‐based dosing group of 56% within 24 hours, from 18 to 8 events (P = 0.05) (Table 2). The number of hypoglycemic events in every subset of time intervals was likewise reduced by at least 50% using weight‐based dosing (from 7 to 3 events within 6 hours, from 5 to 2 events in 612 hours, from 6 to 3 events in 1224 hours). The number of patients who experienced hypoglycemia within 24 hours after receiving insulin also was reduced in the weight‐based dosing group by 46% (P = 0.22).
| Outcomes | 10 U Insulin, n = 66 | 0.1 U/kg Insulin, n = 66 | P Value (2‐Sided) |
|---|---|---|---|
| |||
| Hypoglycemia, <70 mg/dL | |||
| No. of patients | 13 (19.7%) | 7 (10.6%) | 0.22 |
| No. of events total | 18 (27.3%) | 8 (12.1%) | 0.05 |
| No. of events 06 hours | 7 (10.6%) | 3 (4.5%) | 0.32 |
| No. of events 612 hours | 5 (7.6%) | 2 (3.0%) | 0.44 |
| No. of events 1224 hours | 6 (9.1%) | 3 (4.5%) | 0.49 |
| Severe hypoglycemia | |||
| No. of patients | 2 (3.0%) | 1 (1.5%) | >0.99 |
| No. of events total | 2 (3%) | 1 (1.5%) | >0.99 |
| Potassium‐lowering effects | |||
| Minimum K+ after therapy, mmol/L (SD) | 4.9 (0.7) | 4.8 (0.7) | 0.84 |
| Minimum serum K+ < 5.0 mmol/L (%) | 37 (56.1%) | 35 (53.0%) | 0.32 |
| Average K+ decrease, mmol/L (SD) | 1.35 (0.97) | 1.34 (0.94) | 0.94 |
| Repeat treatment given (%) | 24 (36.4%) | 24 (36.4%) | >0.99 |
Potassium lowering was comparable across both dosing strategies in every measure assessed (Table 2). Multivariate analysis revealed that baseline BG <140 mg/dL (adjusted odds ratio: 4.3, 95% confidence interval [CI]: 1.4‐13.7, P = 0.01) and female gender (adjusted odds ratio: 3.2, 95% CI: 1.1‐9.1, P = 0.03) were associated with an increased risk of hypoglycemia. Other factors, including administration of insulin beyond that for hyperkalemia treatment and use of additional hypoglycemic agents, were not associated with the development of hypoglycemia, which is consistent with previous reports.[6]
CONCLUSIONS
Our findings indicate that using a weight‐based approach to insulin dosing when treating hyperkalemia may lead to a reduction in hypoglycemia without sacrificing the efficacy of potassium lowering. Females and patients with glucose values <140 mg/dL were at increased risk of hypoglycemia in this cohort. Based on the results of this research, a weight‐based dosing strategy of 0.1 U/kg IV insulin up to a maximum of 10 U should be considered, with further research desirable to validate these results.
This study was strengthened by the inclusion of all patients regardless of baseline glucose, baseline potassium, administration of other insulins, level of renal impairment, or symptomatic display of hypoglycemia or cardiac dysfunction, thus providing a broad representation of patients treated for acute hyperkalemia. This pilot study was limited in its scope by data collection for only 66 randomized patients per group rather than the entire patient population. In addition, the study utilized patient information from a single site, with few ethnicities represented. Validation of this research using a larger sample size should include greater variation in the patients served. Our inclusion of a hypoglycemia definition up to 24 hours after treatment may also be criticized. However, this is similar to previous reports and allows for a liberal time period for follow‐up glucose monitoring to be recorded.[7]
Because of its small sample size and the low event rate, this study was unable to draw conclusions about the ability of weight‐based insulin dosing to affect severe hypoglycemic events (<40 mg/dL). A study of more than 400 patients would be necessary to find statistically significant differences in the risk of severe hypoglycemia. Furthermore, because we did not examine the results from all patients in this cohort, we cannot conclusively determine the impact of treatment. The retrospective nature of this study limited our ability to capture hypoglycemic episodes during periods in which BG levels were not recorded. Additionally, changes to the post‐treatment glucose monitoring protocol may have also affected the incidence of hypoglycemia in 2 potential ways. First, early and unrecorded interventions may have occurred in patients with a trend toward hypoglycemia. Second, the longer time to follow‐up in the nonweight‐based group may have led to additional hypoglycemic episodes being missed. A prospective trial design could provide more comprehensive information about patient response to weight‐based versus traditional dosing of IV insulin for hyperkalemia. Further investigations on reducing adverse effects of insulin when treating hyperkalemia should focus on female patients and those with lower baseline BG values. Additionally, as newer agents to treat hyperkalemia are developed and tested, the approach to management should be revisited.[8, 9, 10]
Disclosures: Garry S. Tobin, MD, lectures or is on the speakers bureau for Eli Lilly, Jansen, Boehringher Ingelheim, and Novo Nordisk, and performs data safety monitoring for Novo Nordisk. The authors report no other potential conflicts of interest.
- , , , . Hyperkalemia in hospitalized patients: causes, adequacy of treatment, and results of an attempt to improve physician compliance with published therapy guidelines. Arch Intern Med. 1998;158:917–924.
- 2010 American Heart Association guidelines for cardiopulmonary resuscitation and emergency cardiovascular care. Part 12.6: cardiac arrest associated with life‐threatening electrolyte disturbances. Circulation. 2010;122:S829–S861.
- Centers for Medicare 29(2):101–107.
- , , , . Incidence of hypoglycemia following insulin‐based acute stabilization of hyperkalemia treatment. J Hosp Med. 2012;7(3):239–242.
- , , . Hypoglycemia in the treatment of hyperkalemia with insulin in patients with end‐stage renal disease. Clin Kidney J. 2014;7(3):248–250.
- , , , . Prediction and prevention of treatment‐related inpatient hypoglycemia. J Diabetes Sci Technol. 2012;6(2):302–309.
- , , , et al. Effect of sodium zirconium cyclosilicate on potassium lowering for 28 days among outpatients with hyperkalemia: the HARMONIZE randomized clinical trial. JAMA. 2014;312(21):2223–2233.
- , , , et al. Zirconium cyclosilicate in hyperkalemia. N Engl J Med. 2015;372:222–231.
- , , , et al. Patiromer in patients with kidney disease and hyperkalemia receiving RAAS inhibitors. N Engl J Med. 2015;372:211–221.
Hyperkalemia occurs in as many as 10% of all hospitalized patients,[1] leading to potentially fatal arrhythmias or cardiac arrest that results from ionic imbalance within the resting membrane potential of myocardial tissue.[2] Acute instances may be stabilized with insulin to stimulate intracellular uptake of potassium, but this increases the risk of hypoglycemia.[2] Centers for Medicare and Medicaid Services quality measures require hospitals to minimize hypoglycemic events, particularly serious events with blood glucose (BG) <40 mg/dL,[3] due to an association with an increase in mortality in the hospital setting.[4] Previous research at our tertiary care hospital found that 8.7% of patients had suffered a hypoglycemic event following insulin administration pursuant to acute hyperkalemia treatment, and that patients with a lower body weight are at increased risk of hypoglycemia, particularly severe hypoglycemia (BG <40 mg/dL).[5] Increasing the total dose of dextrose provided around the time of insulin administration is suggested to reduce this concern.[5]
Patients at our institution receive 50 g of dextrose in conjunction with intravenous (IV) insulin for hyperkalemia treatment. To further reduce the potential for hypoglycemia, our institution amended the acute hyperkalemia order set to provide prescribers an alternative dosing strategy to the standard 10 U of IV insulin traditionally used for this purpose. Beginning November 10, 2013, our computer prescriber order entry (CPOE) system automatically prepopulated a dose of 0.1 U/kg of body weight for any patients weighing <95 kg (doses rounded to the nearest whole unit) when the acute hyperkalemia order set was utilized. The maximum dose allowed continued to be 10 U. The revised order set also changed nursing orders to require BG monitoring as frequently as every hour following the administration of insulin and dextrose for the treatment of hyperkalemia.
The purpose of this study is to investigate whether weight‐based insulin dosing (0.1 U/kg) for patients weighing <95 kg, rather than a standard 10‐U insulin dose, resulted in fewer hypoglycemic episodes and patients affected. Secondarily, this study sought to determine the impact of weight‐based insulin dosing on potassium‐lowering effects of therapy and to detect any risk factors for development of hypoglycemia among this patient population.
METHODS
This institutional review boardapproved, single‐center, retrospective chart review examined patients for whom the physician order entry set for hyperkalemia therapy was utilized, including patients who weighed less than 95 kg and received regular insulin via weight‐based dosing (0.1 U/kg of body weight up to a maximum of 10 U) during the period November 10, 2013 to May 31, 2014, versus those who received fixed insulin dosing (10 U regardless of body weight) during the period May 1, 2013 to November 9, 2013. During each of these periods, the CPOE system autopopulated the recommended insulin dose, with the possibility for physician manual dose entry. Data collection was limited to the first use of insulin for hyperkalemia treatment per patient in each period.
Patients weighing <95 kg were the focus of this study because they received <10 U of insulin under the weight‐based dosing strategy. Patients were excluded from the study if they had a body weight >95 kg or no weight recorded, were not administered insulin as ordered, received greater than the CPOE‐specified insulin dose, or had no BG readings recorded within 24 hours of insulin administration. The first 66 patients within each group meeting all inclusion and exclusion criteria were randomly selected for analysis. This recruitment target was developed to provide enough patients for a meaningful analysis of hypoglycemia events based on previous reports from our institution.[5]
Hypoglycemia was defined as a recorded BG level <70 mg/dL within 24 hours after insulin administration; severe hypoglycemia was defined as a recorded BG <40 mg/dL within 24 hours. Individual episodes of hypoglycemia and severe hypoglycemia were recorded for each instance of such event separated by at least 1 hour from the time of the first recorded event. In addition, episodes of hypoglycemia or severe hypoglycemia and number of patients affected were assessed at within 6 hours, 6 to 12 hours, and 12 to 24 hours after insulin administration as separate subsets for statistical analysis.
For the purpose of assessing the potassium‐lowering efficacy of weight‐based versus traditional dosing of insulin, maximum serum potassium levels were examined in the 12‐hour interval before the hyperkalemia order set was implemented and compared with minimum potassium levels in the 12 hours after insulin was administered. A comparison of the treatment groups assessed differences between the mean decrease in serum potassium from baseline, the mean minimum potassium achieved, the number of patients achieving minimum potassium below 5.0 mEq/L, and the number of patients who subsequently received repeat treatment for hyperkalemia within 24 hours of treatment with insulin.
Statistical analysis was conducted utilizing 2 and Fisher exact tests for nominal data and Student t test for continuous data to detect statistically significant differences between the groups. Binomial logistic multivariable analysis using a backward stepwise approach was used to determine factors for development of hypoglycemia, analyzed on a per‐patient basis to prevent characteristics from being over‐represented when events occurred multiple times to a single patient. All analyses were completed by using SPSS version 18 (SPSS Inc., Chicago, IL).
RESULTS
In total, 1734 entries were available for the acute hyperkalemia order set with insulin during the 2 periods investigated. Only 464 patients were eligible for manual chart review once weight‐based exclusions were identified by electronic database, with additional exclusion criteria later extracted from patient charts. Patients in both treatment groups were fairly well balanced, with a slightly lower body weight in the 10‐U insulin group recorded (Table 1). Patients in the weight‐based dosing group received between 4 and 9 U of insulin, depending on body weight.
| Characteristics | 10 U Insulin, n = 66 | 0.1 U/kg Insulin, n = 66 | P Value (2‐Sided) |
|---|---|---|---|
| |||
| Weight, kg | 69.9 (14.2) | 74.2 (12.6) | 0.07 |
| Age, y | 55.7 (15.7) | 61.9 (17.6) | 0.36 |
| Male gender | 37 (56.1%) | 41 (62.1%) | 0.60 |
| Caucasian race | 40 (60.6%) | 37 (56.1%) | 0.55 |
| Serum creatinine, mg/dL | 3.16 (4.38) | 3.04 (4.61) | 0.9 |
| Creatinine clearance <30 mL/min | 41 (62.1%) | 41 (62.1%) | 0.6 |
| Dialysis | 20 (30.3%) | 16 (24.2%) | 0.56 |
| Baseline blood glucose, mg/dL | 166.0 (71.7) | 147.3 (48.0) | 0.08 |
| Received other insulin within 24 hours of hyperkalemia treatment | 30 (45.4%) | 25 (37.9%) | 0.48 |
| Received K+ supplement within 24 hours of hyperkalemia treatment | 9 (13.6%) | 11 (16.7%) | 0.81 |
| Baseline serum K+, mmol/L | 6.1 (0.5) | 6.1 (0.7) | 0.76 |
| Baseline serum K+ >6.0 mmol/L | 41 (62.1%) | 33 (50%) | 0.22 |
| No. of additional treatments for hyperkalemia in addition to insulin/dextrose | 1.5 (0.8) | 1.4 (0.9) | 0.49 |
A reduction in the number of hypoglycemic episodes was detected in the weight‐based dosing group of 56% within 24 hours, from 18 to 8 events (P = 0.05) (Table 2). The number of hypoglycemic events in every subset of time intervals was likewise reduced by at least 50% using weight‐based dosing (from 7 to 3 events within 6 hours, from 5 to 2 events in 612 hours, from 6 to 3 events in 1224 hours). The number of patients who experienced hypoglycemia within 24 hours after receiving insulin also was reduced in the weight‐based dosing group by 46% (P = 0.22).
| Outcomes | 10 U Insulin, n = 66 | 0.1 U/kg Insulin, n = 66 | P Value (2‐Sided) |
|---|---|---|---|
| |||
| Hypoglycemia, <70 mg/dL | |||
| No. of patients | 13 (19.7%) | 7 (10.6%) | 0.22 |
| No. of events total | 18 (27.3%) | 8 (12.1%) | 0.05 |
| No. of events 06 hours | 7 (10.6%) | 3 (4.5%) | 0.32 |
| No. of events 612 hours | 5 (7.6%) | 2 (3.0%) | 0.44 |
| No. of events 1224 hours | 6 (9.1%) | 3 (4.5%) | 0.49 |
| Severe hypoglycemia | |||
| No. of patients | 2 (3.0%) | 1 (1.5%) | >0.99 |
| No. of events total | 2 (3%) | 1 (1.5%) | >0.99 |
| Potassium‐lowering effects | |||
| Minimum K+ after therapy, mmol/L (SD) | 4.9 (0.7) | 4.8 (0.7) | 0.84 |
| Minimum serum K+ < 5.0 mmol/L (%) | 37 (56.1%) | 35 (53.0%) | 0.32 |
| Average K+ decrease, mmol/L (SD) | 1.35 (0.97) | 1.34 (0.94) | 0.94 |
| Repeat treatment given (%) | 24 (36.4%) | 24 (36.4%) | >0.99 |
Potassium lowering was comparable across both dosing strategies in every measure assessed (Table 2). Multivariate analysis revealed that baseline BG <140 mg/dL (adjusted odds ratio: 4.3, 95% confidence interval [CI]: 1.4‐13.7, P = 0.01) and female gender (adjusted odds ratio: 3.2, 95% CI: 1.1‐9.1, P = 0.03) were associated with an increased risk of hypoglycemia. Other factors, including administration of insulin beyond that for hyperkalemia treatment and use of additional hypoglycemic agents, were not associated with the development of hypoglycemia, which is consistent with previous reports.[6]
CONCLUSIONS
Our findings indicate that using a weight‐based approach to insulin dosing when treating hyperkalemia may lead to a reduction in hypoglycemia without sacrificing the efficacy of potassium lowering. Females and patients with glucose values <140 mg/dL were at increased risk of hypoglycemia in this cohort. Based on the results of this research, a weight‐based dosing strategy of 0.1 U/kg IV insulin up to a maximum of 10 U should be considered, with further research desirable to validate these results.
This study was strengthened by the inclusion of all patients regardless of baseline glucose, baseline potassium, administration of other insulins, level of renal impairment, or symptomatic display of hypoglycemia or cardiac dysfunction, thus providing a broad representation of patients treated for acute hyperkalemia. This pilot study was limited in its scope by data collection for only 66 randomized patients per group rather than the entire patient population. In addition, the study utilized patient information from a single site, with few ethnicities represented. Validation of this research using a larger sample size should include greater variation in the patients served. Our inclusion of a hypoglycemia definition up to 24 hours after treatment may also be criticized. However, this is similar to previous reports and allows for a liberal time period for follow‐up glucose monitoring to be recorded.[7]
Because of its small sample size and the low event rate, this study was unable to draw conclusions about the ability of weight‐based insulin dosing to affect severe hypoglycemic events (<40 mg/dL). A study of more than 400 patients would be necessary to find statistically significant differences in the risk of severe hypoglycemia. Furthermore, because we did not examine the results from all patients in this cohort, we cannot conclusively determine the impact of treatment. The retrospective nature of this study limited our ability to capture hypoglycemic episodes during periods in which BG levels were not recorded. Additionally, changes to the post‐treatment glucose monitoring protocol may have also affected the incidence of hypoglycemia in 2 potential ways. First, early and unrecorded interventions may have occurred in patients with a trend toward hypoglycemia. Second, the longer time to follow‐up in the nonweight‐based group may have led to additional hypoglycemic episodes being missed. A prospective trial design could provide more comprehensive information about patient response to weight‐based versus traditional dosing of IV insulin for hyperkalemia. Further investigations on reducing adverse effects of insulin when treating hyperkalemia should focus on female patients and those with lower baseline BG values. Additionally, as newer agents to treat hyperkalemia are developed and tested, the approach to management should be revisited.[8, 9, 10]
Disclosures: Garry S. Tobin, MD, lectures or is on the speakers bureau for Eli Lilly, Jansen, Boehringher Ingelheim, and Novo Nordisk, and performs data safety monitoring for Novo Nordisk. The authors report no other potential conflicts of interest.
- , , , . Hyperkalemia in hospitalized patients: causes, adequacy of treatment, and results of an attempt to improve physician compliance with published therapy guidelines. Arch Intern Med. 1998;158:917–924.
- 2010 American Heart Association guidelines for cardiopulmonary resuscitation and emergency cardiovascular care. Part 12.6: cardiac arrest associated with life‐threatening electrolyte disturbances. Circulation. 2010;122:S829–S861.
- Centers for Medicare 29(2):101–107.
- , , , . Incidence of hypoglycemia following insulin‐based acute stabilization of hyperkalemia treatment. J Hosp Med. 2012;7(3):239–242.
- , , . Hypoglycemia in the treatment of hyperkalemia with insulin in patients with end‐stage renal disease. Clin Kidney J. 2014;7(3):248–250.
- , , , . Prediction and prevention of treatment‐related inpatient hypoglycemia. J Diabetes Sci Technol. 2012;6(2):302–309.
- , , , et al. Effect of sodium zirconium cyclosilicate on potassium lowering for 28 days among outpatients with hyperkalemia: the HARMONIZE randomized clinical trial. JAMA. 2014;312(21):2223–2233.
- , , , et al. Zirconium cyclosilicate in hyperkalemia. N Engl J Med. 2015;372:222–231.
- , , , et al. Patiromer in patients with kidney disease and hyperkalemia receiving RAAS inhibitors. N Engl J Med. 2015;372:211–221.
Prevention of Inpatient Hypoglycemia
Insulin therapy in the hospital setting can cause hypoglycemia, which may lead to increased mortality and length of stay (LOS).[1, 2, 3] Hypoglycemia is associated with cardiovascular, cerebrovascular, and patient fall events.[4, 5] The Centers for Medicare and Medicaid Services have designated both severe hypoglycemia (SH) with harm and diabetic ketoacidosis as hospital acquired conditions (HAC) or never events. The Society for Hospital Medicine (SHM) defines SH in the hospital as a blood glucose (BG) <40 mg/dL. Minimizing episodes of SH is important for patient health outcomes, patient safety, and for healthcare facilities' safety metrics.
Many factors contribute to SH including excessive insulin doses, medication errors, inappropriate timing of insulin doses with food intake, changes in nutritional status, impaired renal function, and changes in medications such as steroids.[6] As part of a multiyear project in patient safety, an inpatient hypoglycemia alert algorithm was developed based on a multivariate analysis of individual patient demographic, pharmacy, laboratory, and glucometric data. The algorithm was previously shown to have a 75% sensitivity to predict episodes of SH.[7] In this study, we tested whether a predictive real‐time informatics hypoglycemia alert based on the tested algorithm, along with trained nurses, would result in a decreased frequency of SH events compared to usual care. We hypothesized that this alert would result in a reduction of SH events in those patients at high risk for hypoglycemia.
METHODS
Study Design and Population
This prospective cohort‐intervention study involved inpatients admitted to Barnes‐Jewish Hospital in St. Louis, Missouri, the academic hospital of Washington University School of Medicine (WUSM), from August 2011 through December 2011. Fourteen floors, including 10 internal medicine and 4 cardiology medicine floors, were selected based upon a high frequency of severe hypoglycemic events noted in 2010. Six of the internal medicine floors were designated as intervention floors, and 8 were designated as control floors, including the 4 cardiology units. The study population consisted of patients receiving diabetic medications on study floors who had a BG <90 mg/dL during their hospital stay (Figure 1). The study was approved by the WUSM institutional review board and included a waiver of consent for individual patients.
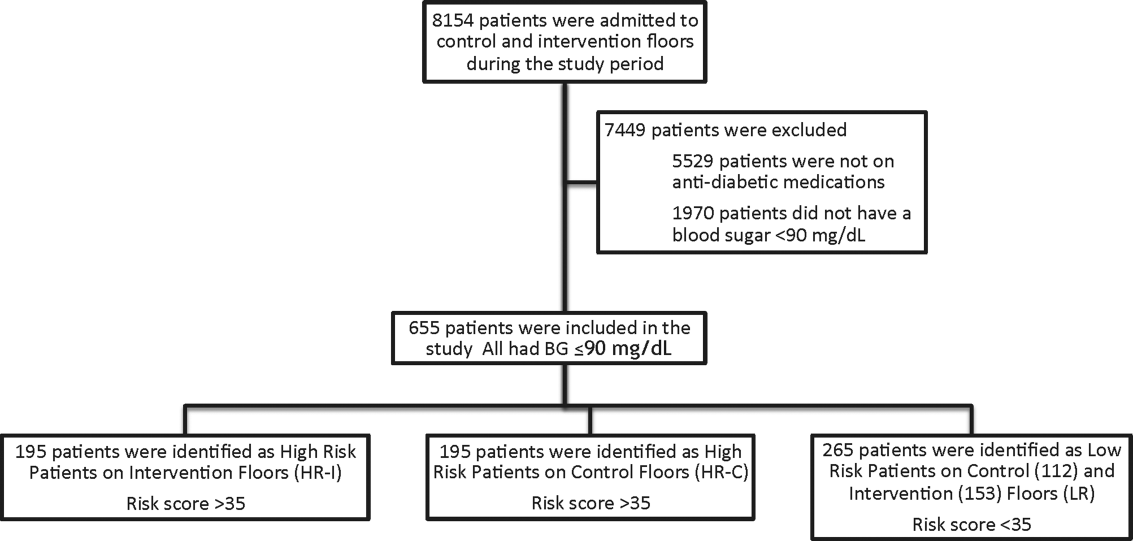
The pharmacy informatics system was programmed with the previously developed hypoglycemia alert to prospectively identify those patients at high risk of hypoglycemia based on real‐time patient information.[7] Patients were identified as high risk on study floors if insulin or an oral antihyperglycemic agent was prescribed and if their hypoglycemia informatics generated risk score was >35 within 24 hours of having a capillary or venous BG<90 mg/dL. The risk score of 35 corresponded to a 50% sensitivity for a subsequent BG <60 mg/dL and a 75% sensitivity for a BG <40 mg/dL. Patients who generated an alert once during their hospital stay were assigned to 1 of 3 categories based on their admission division and risk score: high‐risk intervention (HR‐I), high‐risk control (HR‐C), or low risk (LR). LR patients also had a BG <90 mg/dL during their stay, but a risk score of <35.
The electronic alert for HR‐I patients was sent by pager to division‐specific charge nurses. Fourteen charge nurses on intervention divisions were trained to assess the alert, interview the patient, identify an alternate dosing strategy, and collaborate with the patient's physicians. HR‐C patients were identified on control divisions based on the same criteria as intervention patients, but no alert was generated. Control patients' charts were reviewed and evaluated upon discharge by the research team‐certified diabetes nurse educator to determine whether the treating physician had identified the SH risk and had changed insulin orders.
Nurses and physicians caring for patients on study divisions provided informed consent to participate in the study. Nurses' satisfaction with the alert process and physician interaction was assessed with a collaboration scale that was completed after each alert (see Supporting Information, Appendix A, in the online version of this article).[8]
Alert Development Process
The alert equation algorithm was developed at Barnes‐Jewish Hospital after a retrospective analysis of hospital glucometric data, including capillary and venous BG measurements, and demographic and pharmacy data over a 6‐month time period.[9] The analysis identified factors that were independently associated with hypoglycemia and used these variables in a mathematical model to achieve a 50% sensitivity to predict a subsequent BG of <60 mg/dL and a 75% sensitivity to predict SH.[7] Table 1 outlines the variables in the model and provides the risk‐score equation used to generate an alert.
| Variable | Description of Variable |
|---|---|
| Body weight | Patients at a lower weight were at an increased risk. The variable had a linear response, and 3 levels were used to modify the risk equation: <69 kg, 7079 kg, and >80 kg. |
| Creatinine clearance | Patients with a lower creatinine clearance were at an increased risk. This variable had a linear response, and 2 levels were used to modify the risk equation: <48 mL/min or >48 mL/min. |
| Basal insulin dose | Increased risk was noted at a doses of basal insulin >0.25 U/kg. |
| Basal‐only dosing | Dosing of basal insulin without meal‐time insulin conferred increased risk. |
| Nonstandard insulin therapy | The use of 70/30 insulin was associated with increased risk. |
| Oral diabetic therapy | Use of sulfonylureas was associated with increased risk. |
| Risk score equation | (Value <60)=0.055+1.062 * (Basal <0.25 U/kg)+1.234 * (Basal 0.25 U/kg) & minus;0.294 * (Weight <6069 kg)0.540 * (Weight 7079 kg)0.786 * (Weight 80 kg) & minus;0.389 * (Creatinine Clearance <3847) 0.680 * (Creatinine Clearance 48) 0.239 * (Sliding Yes) 0.556*(Meal Yes)+0.951 * (Sliding and Meal)+0.336 * (Sulfonylurea Yes) Score=100 * (Exp (Value <60)/(1+Exp (Value <60)) |
The alert used a BG cutoff of 90 mg/dL in accordance with the American College of Endocrinology Hospital Guideline. Although current guidelines from the SHM recommend keeping BG values >100 mg/dL for patient safety, our analysis found that the cutoff of 90 mg/dL had better sensitivity and specificity than the <100 mg/dL guideline for the risk algorithm.[10, 11]
Nurse and Physician Training
Charge nurses received 5 hours of hyperglycemia management training in 3 sessions utilizing a structured curriculum. Session 1 included a pretest followed by diabetes management education. Session 2 was devoted to an interactive workshop utilizing case‐based scenarios of diabetes management problems and hypoglycemia prevention. The final session provided instructions on the electronic alert communication process. Nurses were empowered with tools for effective communication practices using the situation‐background‐assessment‐recommendation (SBAR) technique.[12]
Physicians, including hospitalists and medicine residents on intervention and control floors, took a pretest, received a 1‐hour lecture, and completed the same curriculum of case‐based scenarios in an online self‐directed learning module. Physicians did not receive SBAR training. Both nurses and physicians received pocket cards with insulin management guidelines developed by our research team to ensure that all clinicians had common prescribing practices.[13]
Outcomes
The primary outcome was the incidence of SH occurring in HR‐I versus HR‐C patients. Secondary outcomes included: episodes of SH in LR study patients, incidence of BG<60 mg/dL frequency of transfer to a higher level of care, incidence of severe hyperglycemia defined as BG >299 mg/dL, frequency that high‐risk patient's orders were changed to reduce hypoglycemia risk in response to the alert‐intervention process, LOS, mortality, and a nurse‐physician collaboration scale score.[14]
Statistical Analysis
Demographic and clinical metrics were compared between HR‐I and HR‐C patients to evaluate potential sources of bias. These included age, weight, serum creatinine, creatinine clearance (measured by Cockcroft‐Gault), hemoglobin A1c (HbA1c) if available, LOS, gender, admitting diagnosis, type of diabetes, and Charlson Comorbidity Index score. The alert risk‐score was also compared between intervention and control floors. Two‐tailed t tests assessed differences between the study groups on normally distributed variables, whereas Wilcoxon rank sum tests were used for non‐normally distributed variables, and 2 tests were used for categorical variables. Two‐tailed Fisher exact tests compared the prevalence of hypoglycemia thresholds between the study groups. 2 analysis was used to compare the proportion of patients who experienced a BG >299 mg/dL between intervention and controls and the proportion of orders changed in HR‐I versus HR‐C patients. Logistic regression was used to test the association of nurse collaboration score with the likelihood of orders being changed.
Based on previous research, we estimated a 48% rate of hypoglycemia <60 mg/dL in HR‐C patients on control floors.[7] We calculated a sample size of 195 subjects in each high‐risk group as the number needed for the intervention to produce a clinically meaningful reduction in hypoglycemia of 25% on the intervention floor compared to the control floors with 90% power.
RESULTS
Study Cohort and Patient Characteristics
One hundred ninety‐five patients who met criteria for high‐risk status were enrolled on HR‐I floors and HR‐C floors for a total of 390 high‐risk patients. During the same time period, 265 LR patients were identified on intervention (153 patients) and control (112 patients) floors. The HR‐I patients were similar to the HR‐C patients by baseline demographics, as shown in Table 2. HbA1c was not available on all patients, but the mean HbA1c in the HR‐I group was 7.93% versus 7.40% in the HR‐C group (P=0.048). The Charlson Comorbidity Index score was significantly different between the high‐risk groups (HR‐I: 6.48 vs HR‐C: 7.48, P=0.002), indicating that the HR‐C patients had more comorbidities.[15] There were significant differences in 2 of the 3 most common admitting diagnoses between groups, with more HR‐C patients admitted for circulatory system diseases (HR‐C: 22.3% vs HR‐I: 4.4%, P=0.001), and more HR‐I patients admitted for digestive system diseases (HR‐I: 13.7% vs HR‐C: 3.3%, P<0.001). The proportion of patients with preexisting type 2 diabetes did not differ by intervention status (HR‐I: 89.8% vs HR‐C: 92.0%, P=0.462).
| Demographic | HR‐I, Mean SD/Frequency (%), N=195 | HR‐C, Mean, SD/Frequency (%), N=195 | Low Risk, Mean, SD/Frequency (%), N=265 | P Value* |
|---|---|---|---|---|
| ||||
| Age, y | 60.2 (15.1) | 60.3 (16.9) | 61.0 (13.8) | 0.940 |
| Weight, kg | 84.9 (31.9) | 80.8 (26.6) | 93.6 (28.7) | 0.173 |
| Serum creatinine, mg/dL | 2.06 (2.56) | 2.03 (1.87) | 1.89 (2.17) | 0.910 |
| Creatinine clearance, mL/min | 50.6 (29.8) | 45.4 (27.1) | 55.5 (29.3) | 0.077 |
| Hemoglobin A1c, n (%) with data | 7.93 (2.46), n=130 (67%) | 7.40 (1.75), n=115 (59%) | 6.65 (2.05), n=152 (57%) | 0.048 |
| Risk score | 52 (11) | 54 (11) | 26 (6) | 0.111 |
| Length of stay, median, d | 5.83 | 5.88 | 5.79 | 0.664 |
| Male gender | 84 (43.1%) | 98 (50.3%) | 145 (54.7%) | 0.155 |
| Type 2 diabetes | 167 (89.8%) | 172 (92.0%) | 219 (95.6%) | 0.462 |
| Charlson Comorbidity Index score | 6.48 (3.06) | 7.48 (3.28) | 6.66 (3.24) | 0.002 |
| Admit diagnosis endocrine, nutritional, metabolic diseases, and immunity disorders (codes 240279) | 17 (9.3%) | 10 (5.4%) | 11 (4.3%) | 0.153 |
| Admit diagnosis disease of circulatory system (codes 390459) | 8 (4.4%) | 41 (22.3%) | 26 (10.1%) | <0.001 |
| Admit diagnosis disease of digestive system (codes 520579) | 25 (13.7%) | 6 (3.3%) | 27 (10.5%) | <0.001 |
| Admit diagnosis diseases of the genitourinary system (codes 580629) | 6 (3.3%) | 4 (2.2%) | 15 (5.8%) | 0.510 |
| Admit diagnosis reported only as signs, symptoms, or ill‐defined conditions (codes 780799) | 77 (42.3%) | 92 (50.0%) | 121 (46.9%) | 0.140 |
Study Outcomes
The rate of hypoglycemia was compared between 195 HR‐I and 195 HR‐C patients, and it should be noted that each patient could generate only 1 episode of hypoglycemia during an admission. As shown in Table 3, the incidence of a BG <60 mg/dL was significantly lower in the HR‐I patients versus the HR‐C patients (13.3% vs 26.7%, P=0.002) as was the incidence of a BG <40 mg/dL (3.1% HR‐I vs 9.7% HR‐C, P=0.012). This represents a decrease of 50% in moderate hypoglycemia (BG <60 mg/dL) and a decrease of 68% in SH (BG <40 mg/dL) between HR‐I and HR‐C patients. Severe hyperglycemia occurrences were not significantly different between intervention and control floors at 28% each.
| Alerted Patients Glucose Threshold | HR‐I (%), N=195 | HR‐C (%), N=195 | Low Risk (%), N=265 | P Value* |
|---|---|---|---|---|
| ||||
| With BG <40 mg/dL | 6 (3.1%) | 19 (9.7%) | 10 (3.8%) | 0.012 |
| With BG <60 mg/dL | 26 (13.3%) | 51 (26.7%) | 50 (18.9%) | 0.002 |
| With BG >299 mg/dL | 53 (28.0%) | 53 (27.9%) | 29 (11.9%) | 0.974 |
The sensitivity, specificity, and predictive values of the alert for BG thresholds of <40 mg/dL and <60 mg/dL are presented in Table 4. On control floors, the alert exhibited a modest sensitivity and high negative predictive value for BG <40 mg/dL. Sensitivity for a BG <40 mg/dL was 76% and 51.5% for BG <60 mg/dL. The alert was developed with a 50% sensitivity for a BG of <60 mg/dL, and the sensitivities calculated on control floors were consistent with the original modeling. The predictive value of an LR classification was 98.2% for not having a BG <40 mg/dL. The predictive value of a positive alert was 9.7% for BG <40 mg/dL.
| Variable | 40 mg/dL Threshold | 60 mg/dL Threshold |
|---|---|---|
| ||
| Sensitivity: probability of an alert given BG <40 or 60 mg/dL | 76.0% | 51.5% |
| Specificity: probability of no alert given BG >40 or 60 mg/dL | 64.6% | 66.0% |
| Positive predictive value | 9.7% | 26.7% |
| Negative predictive value (nonalerted patients identified as low risk) | 98.2% | 85.0% |
There was no significant difference in mortality (P=0.726), transfer to a higher level of care (P=0.296), or LOS between the 2 groups (HR‐I: 5.83 days vs HR‐C: 5.88 days, P=0.664). However, patients with a BG <40 mg/dL had an LOS of 12.2 days (N=45) versus 8.1 days for those without an SH event (N=610), which was statistically significant (P=0.005). There was no increase in the incidence of BG >299 mg/dL in the HR‐I versus HR‐C groups (P=0.53).
Nurse‐physician satisfaction with the alert process was evaluated using a collaboration scale completed after each alert.[8] Of the 195 hypoglycemia alerts, there were 167 (85.6%) nurse and 25 (12.8%) physician collaboration scales completed. Scores were similar among nurses (average 1.52) and physicians (average 1.72), reflecting positive experiences with collaboration. Orders were changed in 40.7% HR‐I patients in response to the collaboration, but in only 20.5% of HR‐C patients after the initial BG of <90 mg/dL occurred. A change in orders constituted a modification consistent with lowering the risk of hypoglycemia and included discontinuing an oral antidiabetic agent, lowering the dose of insulin, and rarely the addition of dextrose‐containing fluids. The most common change in orders was a reduction in the total dose of insulin. A difference in orders changed was partially explained by the collaboration score; a 1‐unit increase in the score correlated to an odds ratio of 2.10 that the orders would be changed (P=0.002).
DISCUSSION
Hospitals are accountable for safe and effective care of patients with hyperglycemia, which includes prevention of medication‐induced hypoglycemia. We have developed a predictive informatics hypoglycemia risk alert that, when tested in a real‐world situation, significantly reduced the rate of SH in hospitalized patients without increasing severe hyperglycemia. The alert algorithm correctly identified patients who were at high risk for hypoglycemia and allowed caretakers the opportunity to lower that risk. The positive predictive value of the alert was low but acceptable at 9.7%, owing to the overall low rate of hypoglycemia in the patient population.
The alert model tested involved 3 components for success: the automated alert, trained charge nurse responders, and an interaction between the nurse responder and the care provider. HR‐I patients were interviewed and assessed for problems associated with oral intake, dietary habits, medication compliance, and hypoglycemia at home prior to communicating with physicians. The extensive training and proficiency in patient assessment and SBAR communication process required by nurses was paramount in the success of the alert. However, the alert provided a definitive risk assessment that was actionable, versus more global instruction, which has not had the same impact in risk reduction. Based on feedback collected from nurses at the study end, they felt the alert process was within their scope of practice and was not unduly burdensome. They also found that the training in diabetes management and SBAR communication techniques, in addition to the alert system, were useful in protecting patients from medication harm.
Physicians for HR‐C patients missed many opportunities to effectively intervene and thereby reduce the likelihood of an SH event. Our assumption is that the clinicians did not ascertain the risk of SH, which was reflected by the fact that orders were changed in 40.7% of HR‐I patients versus only 20.5% in the HR‐C group. Having alerts go directly to nurses rather than physicians permitted inclusion of additional information, such as caloric intake and testing schedules, so that changes in orders would have greater context, and the importance of mild hypoglycemia would not be overlooked.[16] Glycemic control is challenging for providers in the inpatient setting, as there is little time to test and titrate doses of insulin to achieve control. Tight glycemic control has become the primary focus of diabetes management in the outpatient setting to reduce long‐term risks of microvascular complications.[17, 18] However, establishing glycemic targets in the inpatient setting has been difficult because the risk for hypoglycemia increases with tighter control.[19, 20] Inpatient hypoglycemia has been associated with increased mortality, particularly in critically ill patients.[21, 22] Many factors contribute to hypoglycemia including low creatinine clearance, low body weight, untested insulin doses, errors in insulin administration, unexpected dietary changes, changes in medications affecting BG levels, poor communication during times of patient transfer to different care teams, and poor coordination of BG testing with insulin administration at meal times. A multifaceted approach aimed at improving both clinician and nurse awareness, and providing real‐time risk assessment is clearly required to insure patient safety.[6, 13, 23, 24]
There are significant economic benefits to avoiding SH in the hospital given the adverse outcomes associated with HACs and the extra cost associated with these conditions. In hospitalized patients, hypoglycemia worsens outcomes leading to higher costs due to longer LOS (by 3 days), higher inpatient charges (38.9%), and higher risk of discharge to a skilled nursing facility.[1, 3, 25, 26] Conversely, improved glycemic control can reduce surgical site infections, perioperative morbidity, and hospital LOS.[27] The high prevalence of insulin use among inpatients, many of whom have high‐risk characteristics, creates a milieu for both hyper‐ and hypoglycemia. Other groups have described a drop in hypoglycemia rates related to the use of standardized diabetes order sets and nurse and physician education, but this is the first study that used informatics in a prospective manner to identify patients who are at high risk for developing hypoglycemia and then specifically targeted those patients.[28] The alert process was modeled after a similar alert developed in our institution for identifying medicine patients at risk for sepsis.[29] Given the paucity of data related to inpatient glycemia risk reduction, this study is particularly relevant for improving patient safety.
The major limitation of this study is that it was not randomized at the patient level. Patients were assigned to intervention and control groups based on their occupancy on specific hospital floors to avoid treatment bias. Bias was assessed due to this nonrandom assignment by comparing demographic and clinical factors of HR patients between intervention and control floors, and found significant differences in HbA1c and admitting diagnosis. As the control group had lower HbA1c values than the intervention group, and it is known from the Diabetes Control and Complications Trial and Action to Control Cardiovascular Risk in Diabetes trial that lower HbA1c increases the risk of hypoglycemia, our results may be biased by the level of glucose control on admission.[30, 31] Admitting diagnoses differed significantly between intervention and control patients as did the Charlson Comorbidity Index score; however, the hypoglycemia alert system does not include patient diagnoses or comorbidities, and as such provided equipoise with regard to risk reduction regardless of presenting illness. This study included trained nurses, which may be beyond the scope of every institution and thereby limit the effectiveness of the alert in reducing risk. However, as a result of this study, the alert was expanded to other acute care floors at our hospital as well as other hospitals in the Barnes‐Jewish Hospital system.
In summary, this study showed a 68% decrease in episodes of SH in a high‐risk patient cohort on diabetic medications using a hypoglycemia alert system. The results of this study demonstrate the validity of a systems‐based approach to reduce SH in high‐risk inpatients.
Disclosures
This work was funded by the Barnes‐Jewish Hospital Foundation The authors report no conflicts of interest.
- , , , , , . Hypoglycaemia is associated with increased length of stay and mortality in people with diabetes who are hospitalized. Diabet Med. 2012;29:e445–e448.
- , , , et al. Hypoglycemia as a predictor of mortality in hospitalized elderly patients. Arch Intern Med. 2003;163:1825–1829.
- , , , , , . Hypoglycemia and clinical outcomes in patients with diabetes hospitalized in the general ward. Diabetes Care. 2009;32:1153–1157.
- , , , , . Association of hypoglycemia and cardiac ischemia: a study based on continuous glucose monitoring. Diabetes Care. 2003;26:1485–1489.
- , , , et al. Diabetes‐related complications, glycemic control, and falls in older adults. Diabetes Care. 2008;31:391–396.
- , , , , . Inpatient insulin orders: are patients getting what is prescribed? J Hosp Med. 2011;9:526–529.
- , , , . Prediction and prevention of treatment‐related inpatient hypoglycemia. J Diabetes Sci Technol. 2012;6:302–309.
- , . Collaboration between nurses and physicians. Image J Nurs Sch. 1988;20:145–149.
- , , , et al. Glucometrics—assessing the quality of inpatient glucose management. Diabetes Technol Ther. 2005;8:560–569.
- ACE/ADA Task Force on Inpatient Diabetes. American College of Endocrinology and American Diabetes Association consensus statement on inpatient diabetes and glycemic control. Diabetes Care. 2006;29:1955–1962.
- , , , et al. American Association of Clinical Endocrinologists and American Diabetes Association consensus statement on inpatient glycemic control. Endocr Pract. 2009;15:353–369.
- . Role‐play using SBAR technique to improve observed communication skills in senior nursing students. J Nurs Educ. 2011;50:79–87.
- SHM Glycemic Control Task Force. Workbook for improvement: improving glycemic control, preventing hypoglycemia, and optimizing care of the inpatient with hyperglycemia and diabetes. Society of Hospital Medicine website, Glycemic Control Quality Improvement Resource Room. Available at: http://www.hospitalmedicine.org. Accessed on February 12, 2011.
- , . An internet service supporting quality assessment of inpatient glycemic control. J Diabetes Sci and Technol. 2008;2:402–408.
- , , , et al. Updating and validating the Charlson Comorbidity Index and score for risk adjustment in hospital discharge abstracts using data from 6 countries. Am J Epidemiol. 2011;173:676–682.
- , , . Glycemic management in medical and surgical patients in the non‐ICU setting. Curr Diab Rep. 2013;13:96–106.
- The Diabetes Control and Complications Trial Research Group. The effect of intensive treatment of diabetes on the development and progression of long‐term complications in insulin‐dependent diabetes mellitus. N Engl J Med. 1993;329:977–986.
- UK Prospective Diabetes Study Group. Intensive blood‐glucose control with sulphonylureas or insulin compared with conventional treatment and risk of complications in patients with type 2 diabetes. Lancet. 1998;352:837–853.
- , , . Hypoglycemia in diabetes. Diabetes Care. 2003;26:1902–1912.
- . Hypoglycemia: still the limiting factor in the glycemic management of diabetes. Endocr Pract. 2008;14:750–756.
- , , , et al.; for the NICE‐SUGAR Study Investigators. Hypoglycemia and risk of death in critically ill patients. N Engl J Med. 2012;367:1108–1118.
- , , , , , . Increased mortality of patients with diabetes reporting severe hypoglycemia. Diabetes Care. 2012;35:1897–1901.
- , , , et al. Risk factors for inpatient hypoglycemia during subcutaneous insulin therapy in non‐critically ill patients with type 2 diabetes. J Diabetes Sci Technol. 2012;6:1022–1029.
- , , . Minimizing hypoglycemia in the wake of a tight glycemic control protocol in hospitalized patients. J Nurs Care Qual. 2010;25:255–260.
- , , , . The economic and quality of life impact of hypoglycemia. Eur J Health Econ. 2005;6:197–202.
- , , , , , . Economic and clinical impact of inpatient diabetic hypoglycemia. Endocr Pract. 2009;15:302–312.
- , , , et al. Mild hypoglycemia is strongly associated with increased intensive care unit length of stay. Ann Intensive Care. 2011;49:1–49.
- , , , et al. Implementing and evaluating a multicomponent inpatient diabetes management program: putting research into practice. Jt Comm J Qual Patient Saf. 2012;38:195–206.
- , , , et al. Implementation of a real‐time computerized sepsis alert in nonintensive care unit patients. Crit Care Med. 2011;39:469–473.
- The Diabetes Control and Complications Trial Research Group. Epidemiology of severe hypoglycemia in the Diabetes Control and Complications Trial. Am J Med. 1991;90:450–459.
- , , , et al. The effects of baseline characteristics, glycemia treatment approach, and glycated hemoglobin concentration on the risk of severe hypoglycaemia: post hoc epidemiological analysis of the ACCORD study. BMJ. 2010;340:1–12.
Insulin therapy in the hospital setting can cause hypoglycemia, which may lead to increased mortality and length of stay (LOS).[1, 2, 3] Hypoglycemia is associated with cardiovascular, cerebrovascular, and patient fall events.[4, 5] The Centers for Medicare and Medicaid Services have designated both severe hypoglycemia (SH) with harm and diabetic ketoacidosis as hospital acquired conditions (HAC) or never events. The Society for Hospital Medicine (SHM) defines SH in the hospital as a blood glucose (BG) <40 mg/dL. Minimizing episodes of SH is important for patient health outcomes, patient safety, and for healthcare facilities' safety metrics.
Many factors contribute to SH including excessive insulin doses, medication errors, inappropriate timing of insulin doses with food intake, changes in nutritional status, impaired renal function, and changes in medications such as steroids.[6] As part of a multiyear project in patient safety, an inpatient hypoglycemia alert algorithm was developed based on a multivariate analysis of individual patient demographic, pharmacy, laboratory, and glucometric data. The algorithm was previously shown to have a 75% sensitivity to predict episodes of SH.[7] In this study, we tested whether a predictive real‐time informatics hypoglycemia alert based on the tested algorithm, along with trained nurses, would result in a decreased frequency of SH events compared to usual care. We hypothesized that this alert would result in a reduction of SH events in those patients at high risk for hypoglycemia.
METHODS
Study Design and Population
This prospective cohort‐intervention study involved inpatients admitted to Barnes‐Jewish Hospital in St. Louis, Missouri, the academic hospital of Washington University School of Medicine (WUSM), from August 2011 through December 2011. Fourteen floors, including 10 internal medicine and 4 cardiology medicine floors, were selected based upon a high frequency of severe hypoglycemic events noted in 2010. Six of the internal medicine floors were designated as intervention floors, and 8 were designated as control floors, including the 4 cardiology units. The study population consisted of patients receiving diabetic medications on study floors who had a BG <90 mg/dL during their hospital stay (Figure 1). The study was approved by the WUSM institutional review board and included a waiver of consent for individual patients.
The pharmacy informatics system was programmed with the previously developed hypoglycemia alert to prospectively identify those patients at high risk of hypoglycemia based on real‐time patient information.[7] Patients were identified as high risk on study floors if insulin or an oral antihyperglycemic agent was prescribed and if their hypoglycemia informatics generated risk score was >35 within 24 hours of having a capillary or venous BG<90 mg/dL. The risk score of 35 corresponded to a 50% sensitivity for a subsequent BG <60 mg/dL and a 75% sensitivity for a BG <40 mg/dL. Patients who generated an alert once during their hospital stay were assigned to 1 of 3 categories based on their admission division and risk score: high‐risk intervention (HR‐I), high‐risk control (HR‐C), or low risk (LR). LR patients also had a BG <90 mg/dL during their stay, but a risk score of <35.
The electronic alert for HR‐I patients was sent by pager to division‐specific charge nurses. Fourteen charge nurses on intervention divisions were trained to assess the alert, interview the patient, identify an alternate dosing strategy, and collaborate with the patient's physicians. HR‐C patients were identified on control divisions based on the same criteria as intervention patients, but no alert was generated. Control patients' charts were reviewed and evaluated upon discharge by the research team‐certified diabetes nurse educator to determine whether the treating physician had identified the SH risk and had changed insulin orders.
Nurses and physicians caring for patients on study divisions provided informed consent to participate in the study. Nurses' satisfaction with the alert process and physician interaction was assessed with a collaboration scale that was completed after each alert (see Supporting Information, Appendix A, in the online version of this article).[8]
Alert Development Process
The alert equation algorithm was developed at Barnes‐Jewish Hospital after a retrospective analysis of hospital glucometric data, including capillary and venous BG measurements, and demographic and pharmacy data over a 6‐month time period.[9] The analysis identified factors that were independently associated with hypoglycemia and used these variables in a mathematical model to achieve a 50% sensitivity to predict a subsequent BG of <60 mg/dL and a 75% sensitivity to predict SH.[7] Table 1 outlines the variables in the model and provides the risk‐score equation used to generate an alert.
| Variable | Description of Variable |
|---|---|
| Body weight | Patients at a lower weight were at an increased risk. The variable had a linear response, and 3 levels were used to modify the risk equation: <69 kg, 7079 kg, and >80 kg. |
| Creatinine clearance | Patients with a lower creatinine clearance were at an increased risk. This variable had a linear response, and 2 levels were used to modify the risk equation: <48 mL/min or >48 mL/min. |
| Basal insulin dose | Increased risk was noted at a doses of basal insulin >0.25 U/kg. |
| Basal‐only dosing | Dosing of basal insulin without meal‐time insulin conferred increased risk. |
| Nonstandard insulin therapy | The use of 70/30 insulin was associated with increased risk. |
| Oral diabetic therapy | Use of sulfonylureas was associated with increased risk. |
| Risk score equation | (Value <60)=0.055+1.062 * (Basal <0.25 U/kg)+1.234 * (Basal 0.25 U/kg) & minus;0.294 * (Weight <6069 kg)0.540 * (Weight 7079 kg)0.786 * (Weight 80 kg) & minus;0.389 * (Creatinine Clearance <3847) 0.680 * (Creatinine Clearance 48) 0.239 * (Sliding Yes) 0.556*(Meal Yes)+0.951 * (Sliding and Meal)+0.336 * (Sulfonylurea Yes) Score=100 * (Exp (Value <60)/(1+Exp (Value <60)) |
The alert used a BG cutoff of 90 mg/dL in accordance with the American College of Endocrinology Hospital Guideline. Although current guidelines from the SHM recommend keeping BG values >100 mg/dL for patient safety, our analysis found that the cutoff of 90 mg/dL had better sensitivity and specificity than the <100 mg/dL guideline for the risk algorithm.[10, 11]
Nurse and Physician Training
Charge nurses received 5 hours of hyperglycemia management training in 3 sessions utilizing a structured curriculum. Session 1 included a pretest followed by diabetes management education. Session 2 was devoted to an interactive workshop utilizing case‐based scenarios of diabetes management problems and hypoglycemia prevention. The final session provided instructions on the electronic alert communication process. Nurses were empowered with tools for effective communication practices using the situation‐background‐assessment‐recommendation (SBAR) technique.[12]
Physicians, including hospitalists and medicine residents on intervention and control floors, took a pretest, received a 1‐hour lecture, and completed the same curriculum of case‐based scenarios in an online self‐directed learning module. Physicians did not receive SBAR training. Both nurses and physicians received pocket cards with insulin management guidelines developed by our research team to ensure that all clinicians had common prescribing practices.[13]
Outcomes
The primary outcome was the incidence of SH occurring in HR‐I versus HR‐C patients. Secondary outcomes included: episodes of SH in LR study patients, incidence of BG<60 mg/dL frequency of transfer to a higher level of care, incidence of severe hyperglycemia defined as BG >299 mg/dL, frequency that high‐risk patient's orders were changed to reduce hypoglycemia risk in response to the alert‐intervention process, LOS, mortality, and a nurse‐physician collaboration scale score.[14]
Statistical Analysis
Demographic and clinical metrics were compared between HR‐I and HR‐C patients to evaluate potential sources of bias. These included age, weight, serum creatinine, creatinine clearance (measured by Cockcroft‐Gault), hemoglobin A1c (HbA1c) if available, LOS, gender, admitting diagnosis, type of diabetes, and Charlson Comorbidity Index score. The alert risk‐score was also compared between intervention and control floors. Two‐tailed t tests assessed differences between the study groups on normally distributed variables, whereas Wilcoxon rank sum tests were used for non‐normally distributed variables, and 2 tests were used for categorical variables. Two‐tailed Fisher exact tests compared the prevalence of hypoglycemia thresholds between the study groups. 2 analysis was used to compare the proportion of patients who experienced a BG >299 mg/dL between intervention and controls and the proportion of orders changed in HR‐I versus HR‐C patients. Logistic regression was used to test the association of nurse collaboration score with the likelihood of orders being changed.
Based on previous research, we estimated a 48% rate of hypoglycemia <60 mg/dL in HR‐C patients on control floors.[7] We calculated a sample size of 195 subjects in each high‐risk group as the number needed for the intervention to produce a clinically meaningful reduction in hypoglycemia of 25% on the intervention floor compared to the control floors with 90% power.
RESULTS
Study Cohort and Patient Characteristics
One hundred ninety‐five patients who met criteria for high‐risk status were enrolled on HR‐I floors and HR‐C floors for a total of 390 high‐risk patients. During the same time period, 265 LR patients were identified on intervention (153 patients) and control (112 patients) floors. The HR‐I patients were similar to the HR‐C patients by baseline demographics, as shown in Table 2. HbA1c was not available on all patients, but the mean HbA1c in the HR‐I group was 7.93% versus 7.40% in the HR‐C group (P=0.048). The Charlson Comorbidity Index score was significantly different between the high‐risk groups (HR‐I: 6.48 vs HR‐C: 7.48, P=0.002), indicating that the HR‐C patients had more comorbidities.[15] There were significant differences in 2 of the 3 most common admitting diagnoses between groups, with more HR‐C patients admitted for circulatory system diseases (HR‐C: 22.3% vs HR‐I: 4.4%, P=0.001), and more HR‐I patients admitted for digestive system diseases (HR‐I: 13.7% vs HR‐C: 3.3%, P<0.001). The proportion of patients with preexisting type 2 diabetes did not differ by intervention status (HR‐I: 89.8% vs HR‐C: 92.0%, P=0.462).
| Demographic | HR‐I, Mean SD/Frequency (%), N=195 | HR‐C, Mean, SD/Frequency (%), N=195 | Low Risk, Mean, SD/Frequency (%), N=265 | P Value* |
|---|---|---|---|---|
| ||||
| Age, y | 60.2 (15.1) | 60.3 (16.9) | 61.0 (13.8) | 0.940 |
| Weight, kg | 84.9 (31.9) | 80.8 (26.6) | 93.6 (28.7) | 0.173 |
| Serum creatinine, mg/dL | 2.06 (2.56) | 2.03 (1.87) | 1.89 (2.17) | 0.910 |
| Creatinine clearance, mL/min | 50.6 (29.8) | 45.4 (27.1) | 55.5 (29.3) | 0.077 |
| Hemoglobin A1c, n (%) with data | 7.93 (2.46), n=130 (67%) | 7.40 (1.75), n=115 (59%) | 6.65 (2.05), n=152 (57%) | 0.048 |
| Risk score | 52 (11) | 54 (11) | 26 (6) | 0.111 |
| Length of stay, median, d | 5.83 | 5.88 | 5.79 | 0.664 |
| Male gender | 84 (43.1%) | 98 (50.3%) | 145 (54.7%) | 0.155 |
| Type 2 diabetes | 167 (89.8%) | 172 (92.0%) | 219 (95.6%) | 0.462 |
| Charlson Comorbidity Index score | 6.48 (3.06) | 7.48 (3.28) | 6.66 (3.24) | 0.002 |
| Admit diagnosis endocrine, nutritional, metabolic diseases, and immunity disorders (codes 240279) | 17 (9.3%) | 10 (5.4%) | 11 (4.3%) | 0.153 |
| Admit diagnosis disease of circulatory system (codes 390459) | 8 (4.4%) | 41 (22.3%) | 26 (10.1%) | <0.001 |
| Admit diagnosis disease of digestive system (codes 520579) | 25 (13.7%) | 6 (3.3%) | 27 (10.5%) | <0.001 |
| Admit diagnosis diseases of the genitourinary system (codes 580629) | 6 (3.3%) | 4 (2.2%) | 15 (5.8%) | 0.510 |
| Admit diagnosis reported only as signs, symptoms, or ill‐defined conditions (codes 780799) | 77 (42.3%) | 92 (50.0%) | 121 (46.9%) | 0.140 |
Study Outcomes
The rate of hypoglycemia was compared between 195 HR‐I and 195 HR‐C patients, and it should be noted that each patient could generate only 1 episode of hypoglycemia during an admission. As shown in Table 3, the incidence of a BG <60 mg/dL was significantly lower in the HR‐I patients versus the HR‐C patients (13.3% vs 26.7%, P=0.002) as was the incidence of a BG <40 mg/dL (3.1% HR‐I vs 9.7% HR‐C, P=0.012). This represents a decrease of 50% in moderate hypoglycemia (BG <60 mg/dL) and a decrease of 68% in SH (BG <40 mg/dL) between HR‐I and HR‐C patients. Severe hyperglycemia occurrences were not significantly different between intervention and control floors at 28% each.
| Alerted Patients Glucose Threshold | HR‐I (%), N=195 | HR‐C (%), N=195 | Low Risk (%), N=265 | P Value* |
|---|---|---|---|---|
| ||||
| With BG <40 mg/dL | 6 (3.1%) | 19 (9.7%) | 10 (3.8%) | 0.012 |
| With BG <60 mg/dL | 26 (13.3%) | 51 (26.7%) | 50 (18.9%) | 0.002 |
| With BG >299 mg/dL | 53 (28.0%) | 53 (27.9%) | 29 (11.9%) | 0.974 |
The sensitivity, specificity, and predictive values of the alert for BG thresholds of <40 mg/dL and <60 mg/dL are presented in Table 4. On control floors, the alert exhibited a modest sensitivity and high negative predictive value for BG <40 mg/dL. Sensitivity for a BG <40 mg/dL was 76% and 51.5% for BG <60 mg/dL. The alert was developed with a 50% sensitivity for a BG of <60 mg/dL, and the sensitivities calculated on control floors were consistent with the original modeling. The predictive value of an LR classification was 98.2% for not having a BG <40 mg/dL. The predictive value of a positive alert was 9.7% for BG <40 mg/dL.
| Variable | 40 mg/dL Threshold | 60 mg/dL Threshold |
|---|---|---|
| ||
| Sensitivity: probability of an alert given BG <40 or 60 mg/dL | 76.0% | 51.5% |
| Specificity: probability of no alert given BG >40 or 60 mg/dL | 64.6% | 66.0% |
| Positive predictive value | 9.7% | 26.7% |
| Negative predictive value (nonalerted patients identified as low risk) | 98.2% | 85.0% |
There was no significant difference in mortality (P=0.726), transfer to a higher level of care (P=0.296), or LOS between the 2 groups (HR‐I: 5.83 days vs HR‐C: 5.88 days, P=0.664). However, patients with a BG <40 mg/dL had an LOS of 12.2 days (N=45) versus 8.1 days for those without an SH event (N=610), which was statistically significant (P=0.005). There was no increase in the incidence of BG >299 mg/dL in the HR‐I versus HR‐C groups (P=0.53).
Nurse‐physician satisfaction with the alert process was evaluated using a collaboration scale completed after each alert.[8] Of the 195 hypoglycemia alerts, there were 167 (85.6%) nurse and 25 (12.8%) physician collaboration scales completed. Scores were similar among nurses (average 1.52) and physicians (average 1.72), reflecting positive experiences with collaboration. Orders were changed in 40.7% HR‐I patients in response to the collaboration, but in only 20.5% of HR‐C patients after the initial BG of <90 mg/dL occurred. A change in orders constituted a modification consistent with lowering the risk of hypoglycemia and included discontinuing an oral antidiabetic agent, lowering the dose of insulin, and rarely the addition of dextrose‐containing fluids. The most common change in orders was a reduction in the total dose of insulin. A difference in orders changed was partially explained by the collaboration score; a 1‐unit increase in the score correlated to an odds ratio of 2.10 that the orders would be changed (P=0.002).
DISCUSSION
Hospitals are accountable for safe and effective care of patients with hyperglycemia, which includes prevention of medication‐induced hypoglycemia. We have developed a predictive informatics hypoglycemia risk alert that, when tested in a real‐world situation, significantly reduced the rate of SH in hospitalized patients without increasing severe hyperglycemia. The alert algorithm correctly identified patients who were at high risk for hypoglycemia and allowed caretakers the opportunity to lower that risk. The positive predictive value of the alert was low but acceptable at 9.7%, owing to the overall low rate of hypoglycemia in the patient population.
The alert model tested involved 3 components for success: the automated alert, trained charge nurse responders, and an interaction between the nurse responder and the care provider. HR‐I patients were interviewed and assessed for problems associated with oral intake, dietary habits, medication compliance, and hypoglycemia at home prior to communicating with physicians. The extensive training and proficiency in patient assessment and SBAR communication process required by nurses was paramount in the success of the alert. However, the alert provided a definitive risk assessment that was actionable, versus more global instruction, which has not had the same impact in risk reduction. Based on feedback collected from nurses at the study end, they felt the alert process was within their scope of practice and was not unduly burdensome. They also found that the training in diabetes management and SBAR communication techniques, in addition to the alert system, were useful in protecting patients from medication harm.
Physicians for HR‐C patients missed many opportunities to effectively intervene and thereby reduce the likelihood of an SH event. Our assumption is that the clinicians did not ascertain the risk of SH, which was reflected by the fact that orders were changed in 40.7% of HR‐I patients versus only 20.5% in the HR‐C group. Having alerts go directly to nurses rather than physicians permitted inclusion of additional information, such as caloric intake and testing schedules, so that changes in orders would have greater context, and the importance of mild hypoglycemia would not be overlooked.[16] Glycemic control is challenging for providers in the inpatient setting, as there is little time to test and titrate doses of insulin to achieve control. Tight glycemic control has become the primary focus of diabetes management in the outpatient setting to reduce long‐term risks of microvascular complications.[17, 18] However, establishing glycemic targets in the inpatient setting has been difficult because the risk for hypoglycemia increases with tighter control.[19, 20] Inpatient hypoglycemia has been associated with increased mortality, particularly in critically ill patients.[21, 22] Many factors contribute to hypoglycemia including low creatinine clearance, low body weight, untested insulin doses, errors in insulin administration, unexpected dietary changes, changes in medications affecting BG levels, poor communication during times of patient transfer to different care teams, and poor coordination of BG testing with insulin administration at meal times. A multifaceted approach aimed at improving both clinician and nurse awareness, and providing real‐time risk assessment is clearly required to insure patient safety.[6, 13, 23, 24]
There are significant economic benefits to avoiding SH in the hospital given the adverse outcomes associated with HACs and the extra cost associated with these conditions. In hospitalized patients, hypoglycemia worsens outcomes leading to higher costs due to longer LOS (by 3 days), higher inpatient charges (38.9%), and higher risk of discharge to a skilled nursing facility.[1, 3, 25, 26] Conversely, improved glycemic control can reduce surgical site infections, perioperative morbidity, and hospital LOS.[27] The high prevalence of insulin use among inpatients, many of whom have high‐risk characteristics, creates a milieu for both hyper‐ and hypoglycemia. Other groups have described a drop in hypoglycemia rates related to the use of standardized diabetes order sets and nurse and physician education, but this is the first study that used informatics in a prospective manner to identify patients who are at high risk for developing hypoglycemia and then specifically targeted those patients.[28] The alert process was modeled after a similar alert developed in our institution for identifying medicine patients at risk for sepsis.[29] Given the paucity of data related to inpatient glycemia risk reduction, this study is particularly relevant for improving patient safety.
The major limitation of this study is that it was not randomized at the patient level. Patients were assigned to intervention and control groups based on their occupancy on specific hospital floors to avoid treatment bias. Bias was assessed due to this nonrandom assignment by comparing demographic and clinical factors of HR patients between intervention and control floors, and found significant differences in HbA1c and admitting diagnosis. As the control group had lower HbA1c values than the intervention group, and it is known from the Diabetes Control and Complications Trial and Action to Control Cardiovascular Risk in Diabetes trial that lower HbA1c increases the risk of hypoglycemia, our results may be biased by the level of glucose control on admission.[30, 31] Admitting diagnoses differed significantly between intervention and control patients as did the Charlson Comorbidity Index score; however, the hypoglycemia alert system does not include patient diagnoses or comorbidities, and as such provided equipoise with regard to risk reduction regardless of presenting illness. This study included trained nurses, which may be beyond the scope of every institution and thereby limit the effectiveness of the alert in reducing risk. However, as a result of this study, the alert was expanded to other acute care floors at our hospital as well as other hospitals in the Barnes‐Jewish Hospital system.
In summary, this study showed a 68% decrease in episodes of SH in a high‐risk patient cohort on diabetic medications using a hypoglycemia alert system. The results of this study demonstrate the validity of a systems‐based approach to reduce SH in high‐risk inpatients.
Disclosures
This work was funded by the Barnes‐Jewish Hospital Foundation The authors report no conflicts of interest.
- , , , , , . Hypoglycaemia is associated with increased length of stay and mortality in people with diabetes who are hospitalized. Diabet Med. 2012;29:e445–e448.
- , , , et al. Hypoglycemia as a predictor of mortality in hospitalized elderly patients. Arch Intern Med. 2003;163:1825–1829.
- , , , , , . Hypoglycemia and clinical outcomes in patients with diabetes hospitalized in the general ward. Diabetes Care. 2009;32:1153–1157.
- , , , , . Association of hypoglycemia and cardiac ischemia: a study based on continuous glucose monitoring. Diabetes Care. 2003;26:1485–1489.
- , , , et al. Diabetes‐related complications, glycemic control, and falls in older adults. Diabetes Care. 2008;31:391–396.
- , , , , . Inpatient insulin orders: are patients getting what is prescribed? J Hosp Med. 2011;9:526–529.
- , , , . Prediction and prevention of treatment‐related inpatient hypoglycemia. J Diabetes Sci Technol. 2012;6:302–309.
- , . Collaboration between nurses and physicians. Image J Nurs Sch. 1988;20:145–149.
- , , , et al. Glucometrics—assessing the quality of inpatient glucose management. Diabetes Technol Ther. 2005;8:560–569.
- ACE/ADA Task Force on Inpatient Diabetes. American College of Endocrinology and American Diabetes Association consensus statement on inpatient diabetes and glycemic control. Diabetes Care. 2006;29:1955–1962.
- , , , et al. American Association of Clinical Endocrinologists and American Diabetes Association consensus statement on inpatient glycemic control. Endocr Pract. 2009;15:353–369.
- . Role‐play using SBAR technique to improve observed communication skills in senior nursing students. J Nurs Educ. 2011;50:79–87.
- SHM Glycemic Control Task Force. Workbook for improvement: improving glycemic control, preventing hypoglycemia, and optimizing care of the inpatient with hyperglycemia and diabetes. Society of Hospital Medicine website, Glycemic Control Quality Improvement Resource Room. Available at: http://www.hospitalmedicine.org. Accessed on February 12, 2011.
- , . An internet service supporting quality assessment of inpatient glycemic control. J Diabetes Sci and Technol. 2008;2:402–408.
- , , , et al. Updating and validating the Charlson Comorbidity Index and score for risk adjustment in hospital discharge abstracts using data from 6 countries. Am J Epidemiol. 2011;173:676–682.
- , , . Glycemic management in medical and surgical patients in the non‐ICU setting. Curr Diab Rep. 2013;13:96–106.
- The Diabetes Control and Complications Trial Research Group. The effect of intensive treatment of diabetes on the development and progression of long‐term complications in insulin‐dependent diabetes mellitus. N Engl J Med. 1993;329:977–986.
- UK Prospective Diabetes Study Group. Intensive blood‐glucose control with sulphonylureas or insulin compared with conventional treatment and risk of complications in patients with type 2 diabetes. Lancet. 1998;352:837–853.
- , , . Hypoglycemia in diabetes. Diabetes Care. 2003;26:1902–1912.
- . Hypoglycemia: still the limiting factor in the glycemic management of diabetes. Endocr Pract. 2008;14:750–756.
- , , , et al.; for the NICE‐SUGAR Study Investigators. Hypoglycemia and risk of death in critically ill patients. N Engl J Med. 2012;367:1108–1118.
- , , , , , . Increased mortality of patients with diabetes reporting severe hypoglycemia. Diabetes Care. 2012;35:1897–1901.
- , , , et al. Risk factors for inpatient hypoglycemia during subcutaneous insulin therapy in non‐critically ill patients with type 2 diabetes. J Diabetes Sci Technol. 2012;6:1022–1029.
- , , . Minimizing hypoglycemia in the wake of a tight glycemic control protocol in hospitalized patients. J Nurs Care Qual. 2010;25:255–260.
- , , , . The economic and quality of life impact of hypoglycemia. Eur J Health Econ. 2005;6:197–202.
- , , , , , . Economic and clinical impact of inpatient diabetic hypoglycemia. Endocr Pract. 2009;15:302–312.
- , , , et al. Mild hypoglycemia is strongly associated with increased intensive care unit length of stay. Ann Intensive Care. 2011;49:1–49.
- , , , et al. Implementing and evaluating a multicomponent inpatient diabetes management program: putting research into practice. Jt Comm J Qual Patient Saf. 2012;38:195–206.
- , , , et al. Implementation of a real‐time computerized sepsis alert in nonintensive care unit patients. Crit Care Med. 2011;39:469–473.
- The Diabetes Control and Complications Trial Research Group. Epidemiology of severe hypoglycemia in the Diabetes Control and Complications Trial. Am J Med. 1991;90:450–459.
- , , , et al. The effects of baseline characteristics, glycemia treatment approach, and glycated hemoglobin concentration on the risk of severe hypoglycaemia: post hoc epidemiological analysis of the ACCORD study. BMJ. 2010;340:1–12.
© 2014 Society of Hospital Medicine

Insulin Administration Errors
Diabetes care in the inpatient setting requires coordination between multiple service providers. Breakdowns in this process occur at all levels leading to potential serious harm.1 Error rates focusing on multiple areas related to diabetes care, including the inpatient provision of insulin, have been described as high as 19.5% in 14,000 patients surveyed in the United Kingdom.2 Missteps are important, as insulin prescribing errors are more commonly associated with patient harm.3 In the United States, medication errors related to provision of care to critically ill patients has been documented, but, to our knowledge, no such reports regarding general medical or surgical wards exist.4
Insulin errors can result from a wide range of possible reasons including: incorrect medication reconciliation, prescribing errors, dispensing errors, administration errors, suboptimal meal timing, or errors in communication for discharge plans regarding diabetes care. Examining each of these areas as a whole could be a daunting task. As such, we sought to examine 1 portion of insulin provision as an initial focus for performance improvement at our institution. Our purpose was to describe the rates of errors associated with insulin administration at our single academic medical center on general medicine and surgical wards.
Methods
Study patients for this observational, prospective snapshot were identified by electronic medical records in 4 consecutive weeks in April 2009 at Barnes‐Jewish Hospital (St Louis, MO), a 1200 bed academic medical center. This study was approved by the Washington University in St Louis School of Medicine Human Studies Committee, and the requirement for informed consent was waived.
On day 1 of each snapshot period, all patients on the identified wards were examined to determine if insulin was currently active as part of the inpatient medication orders. If active, this patient was enrolled into the evaluation data set. No patients were excluded if insulin was currently ordered. Four inpatient areas were selected to provide a representation of the non‐critically ill patient population at our institution. The 4 areas selected were: a cardiac care ward (typical census = 24), a general medicine ward (typical census = 24), an abdominal transplant ward (typical census = 18), and a general surgery ward (typical census = 22). Taken together, these areas represent about 20% of the total non‐critically ill patient population at our hospital. The transplant area was chosen because it represents a high‐risk population with medication (corticosteroid)‐induced diabetes. Nursing and physician care are typically exclusive in these areas, and very little crossover among these healthcare providers would have occurred among the units surveyed during the study period.
Each patient included on day 1 of each audit period was followed for a total of up to 7 days. Patients were only enrolled on day 1 of each audit period. Four survey periods were conducted, providing an evaluation of 28 days of insulin therapy in the studied units. Four periods were selected to pick up more patients on day 1 of each audit period. Electronic records of medication administration and evaluation of paper chart orders provided the information for insulin administration error rates. Additionally, physician notes regarding patients' histories and home insulin use were reviewed for background information for our patient population. Prospective daily assessments of insulin orders, doses charted, nursing notes, and blood glucose values were conducted for potential errors in insulin administration.
All definitions of insulin administration errors were defined prior to data collection. The investigators reviewed available literature involving insulin errors, and found no standardized definitions or previously published assessments at the time of inception of our study. As such, we examined our own clinical practice for areas of potential concern related to insulin administration. The following error categories were identified: transcription errors (eg, insulin glargine 10 units qpm written, but order transcribed and carried out as 20 units qpm); greater than 1 hour between obtained point‐of‐care blood glucose value and provision of correctional (sliding‐scale) insulin; insulin held without a physician order present in the medical records; missing documentation of insulin doses (glucose value of 150 mg/dL present, but no documented correctional dose corresponding to this value present in medical record); premeal and correctional insulin given at separate times; and no documentation of physician notification for hypoglycemia. Other reasons for potential insulin administration errors were collected if deemed pertinent by the individual auditors.
At the time of our survey, a standardized subcutaneous insulin administration order set was utilized in all of the surveyed units. As computerized physician order entry was not yet available at our institution, all orders were transcribed electronically from paper orders. This insulin order set has been in place for 5 years. Once initiated, all portions of the order set are initiated, including communication to nurses regarding glucose measuring times, requirement for documentation of hypoglycemia, and proposed glucose goals. A survey of insulin orders during the audit time revealed that >97% of all insulin orders were initiated from this standardized order set. These order sets encouraged the provision of physiological insulin (basal‐bolus) using insulin glargine and insulin aspart in eligible individuals. Although no systematic, standardized goal for glucose attainment was promoted, a fasting blood glucose of 90‐130 mg/dL and post‐prandial value of <180 mg/dL was encouraged. The order sets had a stated requirement of physician contact for all blood glucose values <70 mg/dL. Although lack of documentation of hypoglycemia may not be directly considered an error associated with administration of insulin, the research group decided to include this provision in the definition of administration errors, given the ability of this parameter to provide a sense of overall completeness of insulin orders and as a marker of collaborative practice in the management of inpatient hyperglycemia.
Nurses documented glucose values and responses in electronic medical administration records as a matter of routine. Point‐of‐care glucose values were obtained by either patient care technicians or nurses on each individual ward. As an academic medical institution, physicians were frequently paged by other members of the healthcare team.
Each auditor (E.N.D., A.L., L.L.W., K.A.H.) reviewed 1 consistent unit during the audit period. All data for insulin administration errors were tabulated, and descriptive rates of errors were used on a per‐patient or per‐stay basis
Results
A total of 116 patient‐audit periods were identified during the 28‐day study period (Table 1). Sixty‐five patients were on surgical services, and 51 were on medicine services, representing 378 inpatient days. Median length of stay was 3.5 days. Home insulin use was evident in 49% of the surveyed population. Patients' mean A1C (data available within 3 months prior to admission) was 8.1% (n = 41). Inpatient insulin regimens on day 1 included correctional insulin only (51.7% of cases). Regimens containing neutral protamine Hagedorn (NPH) or glargine also included correctional insulin in 95% of cases, and premeal insulin in 35%. Regimens including both premeal insulin and correctional insulin occurred in 25% of the patients. Diet status indicated that 83% of the population was taking an oral diet on day 1, and 13% were nil per os (nothing by mouth [NPO]).
| Characteristic | Result |
|---|---|
| |
| Mean age, years | 59 |
| Mean body mass index | 30.9 |
| Male | 58% |
| Reason for admission | |
| Diabetes‐related | 7 (6%) |
| Cardiovascular | 23 (19.8%) |
| Infection/sepsis | 12 (10.3%) |
| Transplant | 10 (8.6%) |
| Vascular surgery | 10 (8.6%) |
| Transplant complication | 8 (6.9%) |
| Other | 46 (39.6%) |
| History of diabetes | |
| DM1 | 7 (6%) |
| DM2 | 77 (67%) |
| Steroid‐induced | 8 (7%) |
| No history of diabetes | 24 (20%) |
| Most recent A1C (n = 41) (mean) | 8.1% |
| Home insulin use | 57 (49%) |
| Hospital NPH, day 1 | 14 (12.0%) |
| Hospital glargine, day 1 | 33 (28.4%) |
| Hospital correctional insulin only, day 1 | 60 (51.7%) |
| Day 1 diet | |
| Prudent diabetic | 58 (50%) |
| NPO | 15 (13%) |
| Other | 38 (32.7%) |
| Tube feeds | 3 (2.6%) |
| TPN | 2 (1.7%) |
A total of 199 administration errors occurred at a rate of 1.72 errors/patient‐period and 0.53 errors/patient day (Table 2). Missing documentation of doses (15.5% of all patients) and insulin being held without an order (25% of patients) were the most frequently occurring events. Errors classified as other were found in 13.1% of the defined events. These other errors consisted of not carrying out correctional dose insulin orders appropriately (eg, blood sugar value of 149 mg/dL should have resulted in a correctional dose of 2 units, but 3 units were documented as given instead), timing errors related to provision of mealtime insulin apart from documented provision of a meal, or not following the required documentation for insulin pumps.
| Category | No. of events (% Out of 199 Total Errors) |
|---|---|
| Transcription error | 15 (7.5) |
| Greater than 1 hr between blood sugar evaluation and insulin administration | 20 (10.1) |
| Insulin held without a physician order | 36 (18.1) |
| Missing documentation of insulin doses | 58 (29.1) |
| Premeal and correctional insulin given at separate time | 19 (9.5) |
| No documentation of physician notification of hypoglycemia | 25 (12.6) |
| Other | 26 (13.1) |
Forty‐two patients (36%) experienced no errors in insulin administration, 18 patients experienced 1 error, 21 patients had 2 errors, and 11 patients had 3 errors. The remainder of the patients (n = 23; 19.9%) had 4 or more errors during their observation period. Were similar across the units surveyed. Frequency of errors remained consistent regardless of reason for admission, history of diabetes or insulin use at home, or length of stay. Most errors occurred on days 1 and 2 of the hospital stay. Error rates and types were consistent across all units surveyed.
Discussion/Conclusion
We found that insulin administration errors were common in our inpatient snapshot of non‐critically ill patients. In our observational evaluation, 64% of patients had at least 1 error related to insulin administration. Errors related to missing documentation of scheduled doses, or doses held without a prescriber order, were the most common. Implications of missed or held doses could range from unclear approaches for dose adjustment due to missing information, incorrect titration due to incomplete information, or hypoglycemia and hyperglycemia.
This observed rate of error is much higher than the described error rate of 19.5% reported in the United Kingdom.2 This difference in error rates most likely reflects a difference in focus, as investigators in that national effort focused on prescriber error, aberrations in blood glucose values, and readmission rates. Our evaluation in assessing error rates regarding insulin administration supports the use of personnel keenly aware of the processes related to insulin administration, and provides insight into the importance of evaluating small portions of insulin provision (administration vs prescribing, etc) in assessing grounds for improvement in care. It is important to note that our findings may be exaggerated and are not entirely comparable to a study with a different scope and size.
Our snapshot tool and baseline evaluation is a simple method that could be undertaken at many institutions. As such, this methodology and error estimate serves as a gauge for future comparisons and areas for intervention. Limitations of our assessment include the small portion of patients audited during our evaluation versus using a snapshot of our entire hospital, utilizing nonstandardized criteria for determination of insulin errors, and the lack of correlation of clinical significance (aberrations in glucose values) with errors observed. Also, this single‐institution review may not be generalizable to all institutions. Additionally, we only examined errors related to administration of insulin. Other areas that would complete the picture, related to diabetic therapies and outcomes, would need to include prescribing errors or dispensing errors and relate these to glycemic outcomes. Assessment of these additional errors may have revealed more clinically important events that were not revealed in this small snapshot. Lastly, clinical endpoints such as intensive care unit (ICU) transfers, mortality, or readmissions were not assessed in this small study.
We are fortunate that many of these errors were apparently clinically silent, but in a subset of patients, the risk is real and life‐threatening. Risk occurs at both ends of the glucose spectrum, with the low end receiving the greatest attention. Severe hypoglycemia with harm and inpatient diabetic ketoacidosis have been qualified as newer events by Medicare. Hypoglycemia in the ICU population (<40 mg/dL) is an independent marker of mortality.5 Hypoglycemia (<50 mg/dL) has been associated with heart attacks, strokes, and death in the outpatient setting.6
The ability to safely control blood sugar in the hospital requires that medications are administered on time, and that communication occurs between the prescribing provider and the nursing staff providing care. Along with the case‐by‐case implications regarding the need for accurate administration of insulin for subsequent titration and determination of discharge prescriptions for patients with diabetes, there are many implications regarding the assessment of inpatient provision of insulin on determining institutional practices based on previous performance. If insulin administration is not accurately provided or documented, institutions will find it difficult to correctly make changes to insulin protocols for targeting future improvements. Our evaluation indicates an obvious need for quality improvement with 18.1% of the errors reflecting holding insulin without an order, and 12.6% of the errors showing no documentation for the physician being notified of hypoglycemia requiring treatment. The need to foster structured nurse‐physician communication will play a critical role in any process improvement. Communication is key for the optimal provision of insulin in the inpatient setting. Computerized order entry and bar‐code guided administration of doses of insulin may fix some types of the errors (transcription and missed documentation, respectively). That said, one of the largest impacts of this survey may reveal that these errors may not be fixed by technology, but may require more targeted and difficult interventions, such as continuing education and holding clinicians accountable. This study provides insight into the complicated issues regarding inpatient insulin administration and, due to its systematic approach, has given direction for process and system improvements.
- .Patient safety and inpatient glycemic control: translating concepts into action.Endocr Pract.2006;12:49–55.
- ,,,,.Safer administration of insulin: summary of a safety report from the National Patient Safety Agency.BMJ.341:883.
- ,,,,,.Medication administration errors in adult patients in the ICU.Intensive Care Med.2001;27(10):1592–1598.
- United States Pharmacopeia. MEDMARX 5th anniversary data report. A chartbook of 2003 findings and trends 1999–2003. Available at: http://www.usp.org/products/medMarx/index.html?USP_Print. Accessed December 1,2010.
- ,,, et al.Intensive insulin therapy in the medical ICU.N Engl J Med.2006;354:449–461.
- The ADVANCE Trial Collaborative Group.Intensive blood glucose control and vascular outcomes in patients with type 2 diabetes.N Engl J Med.2008;358:2560–2572.
Diabetes care in the inpatient setting requires coordination between multiple service providers. Breakdowns in this process occur at all levels leading to potential serious harm.1 Error rates focusing on multiple areas related to diabetes care, including the inpatient provision of insulin, have been described as high as 19.5% in 14,000 patients surveyed in the United Kingdom.2 Missteps are important, as insulin prescribing errors are more commonly associated with patient harm.3 In the United States, medication errors related to provision of care to critically ill patients has been documented, but, to our knowledge, no such reports regarding general medical or surgical wards exist.4
Insulin errors can result from a wide range of possible reasons including: incorrect medication reconciliation, prescribing errors, dispensing errors, administration errors, suboptimal meal timing, or errors in communication for discharge plans regarding diabetes care. Examining each of these areas as a whole could be a daunting task. As such, we sought to examine 1 portion of insulin provision as an initial focus for performance improvement at our institution. Our purpose was to describe the rates of errors associated with insulin administration at our single academic medical center on general medicine and surgical wards.
Methods
Study patients for this observational, prospective snapshot were identified by electronic medical records in 4 consecutive weeks in April 2009 at Barnes‐Jewish Hospital (St Louis, MO), a 1200 bed academic medical center. This study was approved by the Washington University in St Louis School of Medicine Human Studies Committee, and the requirement for informed consent was waived.
On day 1 of each snapshot period, all patients on the identified wards were examined to determine if insulin was currently active as part of the inpatient medication orders. If active, this patient was enrolled into the evaluation data set. No patients were excluded if insulin was currently ordered. Four inpatient areas were selected to provide a representation of the non‐critically ill patient population at our institution. The 4 areas selected were: a cardiac care ward (typical census = 24), a general medicine ward (typical census = 24), an abdominal transplant ward (typical census = 18), and a general surgery ward (typical census = 22). Taken together, these areas represent about 20% of the total non‐critically ill patient population at our hospital. The transplant area was chosen because it represents a high‐risk population with medication (corticosteroid)‐induced diabetes. Nursing and physician care are typically exclusive in these areas, and very little crossover among these healthcare providers would have occurred among the units surveyed during the study period.
Each patient included on day 1 of each audit period was followed for a total of up to 7 days. Patients were only enrolled on day 1 of each audit period. Four survey periods were conducted, providing an evaluation of 28 days of insulin therapy in the studied units. Four periods were selected to pick up more patients on day 1 of each audit period. Electronic records of medication administration and evaluation of paper chart orders provided the information for insulin administration error rates. Additionally, physician notes regarding patients' histories and home insulin use were reviewed for background information for our patient population. Prospective daily assessments of insulin orders, doses charted, nursing notes, and blood glucose values were conducted for potential errors in insulin administration.
All definitions of insulin administration errors were defined prior to data collection. The investigators reviewed available literature involving insulin errors, and found no standardized definitions or previously published assessments at the time of inception of our study. As such, we examined our own clinical practice for areas of potential concern related to insulin administration. The following error categories were identified: transcription errors (eg, insulin glargine 10 units qpm written, but order transcribed and carried out as 20 units qpm); greater than 1 hour between obtained point‐of‐care blood glucose value and provision of correctional (sliding‐scale) insulin; insulin held without a physician order present in the medical records; missing documentation of insulin doses (glucose value of 150 mg/dL present, but no documented correctional dose corresponding to this value present in medical record); premeal and correctional insulin given at separate times; and no documentation of physician notification for hypoglycemia. Other reasons for potential insulin administration errors were collected if deemed pertinent by the individual auditors.
At the time of our survey, a standardized subcutaneous insulin administration order set was utilized in all of the surveyed units. As computerized physician order entry was not yet available at our institution, all orders were transcribed electronically from paper orders. This insulin order set has been in place for 5 years. Once initiated, all portions of the order set are initiated, including communication to nurses regarding glucose measuring times, requirement for documentation of hypoglycemia, and proposed glucose goals. A survey of insulin orders during the audit time revealed that >97% of all insulin orders were initiated from this standardized order set. These order sets encouraged the provision of physiological insulin (basal‐bolus) using insulin glargine and insulin aspart in eligible individuals. Although no systematic, standardized goal for glucose attainment was promoted, a fasting blood glucose of 90‐130 mg/dL and post‐prandial value of <180 mg/dL was encouraged. The order sets had a stated requirement of physician contact for all blood glucose values <70 mg/dL. Although lack of documentation of hypoglycemia may not be directly considered an error associated with administration of insulin, the research group decided to include this provision in the definition of administration errors, given the ability of this parameter to provide a sense of overall completeness of insulin orders and as a marker of collaborative practice in the management of inpatient hyperglycemia.
Nurses documented glucose values and responses in electronic medical administration records as a matter of routine. Point‐of‐care glucose values were obtained by either patient care technicians or nurses on each individual ward. As an academic medical institution, physicians were frequently paged by other members of the healthcare team.
Each auditor (E.N.D., A.L., L.L.W., K.A.H.) reviewed 1 consistent unit during the audit period. All data for insulin administration errors were tabulated, and descriptive rates of errors were used on a per‐patient or per‐stay basis
Results
A total of 116 patient‐audit periods were identified during the 28‐day study period (Table 1). Sixty‐five patients were on surgical services, and 51 were on medicine services, representing 378 inpatient days. Median length of stay was 3.5 days. Home insulin use was evident in 49% of the surveyed population. Patients' mean A1C (data available within 3 months prior to admission) was 8.1% (n = 41). Inpatient insulin regimens on day 1 included correctional insulin only (51.7% of cases). Regimens containing neutral protamine Hagedorn (NPH) or glargine also included correctional insulin in 95% of cases, and premeal insulin in 35%. Regimens including both premeal insulin and correctional insulin occurred in 25% of the patients. Diet status indicated that 83% of the population was taking an oral diet on day 1, and 13% were nil per os (nothing by mouth [NPO]).
| Characteristic | Result |
|---|---|
| |
| Mean age, years | 59 |
| Mean body mass index | 30.9 |
| Male | 58% |
| Reason for admission | |
| Diabetes‐related | 7 (6%) |
| Cardiovascular | 23 (19.8%) |
| Infection/sepsis | 12 (10.3%) |
| Transplant | 10 (8.6%) |
| Vascular surgery | 10 (8.6%) |
| Transplant complication | 8 (6.9%) |
| Other | 46 (39.6%) |
| History of diabetes | |
| DM1 | 7 (6%) |
| DM2 | 77 (67%) |
| Steroid‐induced | 8 (7%) |
| No history of diabetes | 24 (20%) |
| Most recent A1C (n = 41) (mean) | 8.1% |
| Home insulin use | 57 (49%) |
| Hospital NPH, day 1 | 14 (12.0%) |
| Hospital glargine, day 1 | 33 (28.4%) |
| Hospital correctional insulin only, day 1 | 60 (51.7%) |
| Day 1 diet | |
| Prudent diabetic | 58 (50%) |
| NPO | 15 (13%) |
| Other | 38 (32.7%) |
| Tube feeds | 3 (2.6%) |
| TPN | 2 (1.7%) |
A total of 199 administration errors occurred at a rate of 1.72 errors/patient‐period and 0.53 errors/patient day (Table 2). Missing documentation of doses (15.5% of all patients) and insulin being held without an order (25% of patients) were the most frequently occurring events. Errors classified as other were found in 13.1% of the defined events. These other errors consisted of not carrying out correctional dose insulin orders appropriately (eg, blood sugar value of 149 mg/dL should have resulted in a correctional dose of 2 units, but 3 units were documented as given instead), timing errors related to provision of mealtime insulin apart from documented provision of a meal, or not following the required documentation for insulin pumps.
| Category | No. of events (% Out of 199 Total Errors) |
|---|---|
| Transcription error | 15 (7.5) |
| Greater than 1 hr between blood sugar evaluation and insulin administration | 20 (10.1) |
| Insulin held without a physician order | 36 (18.1) |
| Missing documentation of insulin doses | 58 (29.1) |
| Premeal and correctional insulin given at separate time | 19 (9.5) |
| No documentation of physician notification of hypoglycemia | 25 (12.6) |
| Other | 26 (13.1) |
Forty‐two patients (36%) experienced no errors in insulin administration, 18 patients experienced 1 error, 21 patients had 2 errors, and 11 patients had 3 errors. The remainder of the patients (n = 23; 19.9%) had 4 or more errors during their observation period. Were similar across the units surveyed. Frequency of errors remained consistent regardless of reason for admission, history of diabetes or insulin use at home, or length of stay. Most errors occurred on days 1 and 2 of the hospital stay. Error rates and types were consistent across all units surveyed.
Discussion/Conclusion
We found that insulin administration errors were common in our inpatient snapshot of non‐critically ill patients. In our observational evaluation, 64% of patients had at least 1 error related to insulin administration. Errors related to missing documentation of scheduled doses, or doses held without a prescriber order, were the most common. Implications of missed or held doses could range from unclear approaches for dose adjustment due to missing information, incorrect titration due to incomplete information, or hypoglycemia and hyperglycemia.
This observed rate of error is much higher than the described error rate of 19.5% reported in the United Kingdom.2 This difference in error rates most likely reflects a difference in focus, as investigators in that national effort focused on prescriber error, aberrations in blood glucose values, and readmission rates. Our evaluation in assessing error rates regarding insulin administration supports the use of personnel keenly aware of the processes related to insulin administration, and provides insight into the importance of evaluating small portions of insulin provision (administration vs prescribing, etc) in assessing grounds for improvement in care. It is important to note that our findings may be exaggerated and are not entirely comparable to a study with a different scope and size.
Our snapshot tool and baseline evaluation is a simple method that could be undertaken at many institutions. As such, this methodology and error estimate serves as a gauge for future comparisons and areas for intervention. Limitations of our assessment include the small portion of patients audited during our evaluation versus using a snapshot of our entire hospital, utilizing nonstandardized criteria for determination of insulin errors, and the lack of correlation of clinical significance (aberrations in glucose values) with errors observed. Also, this single‐institution review may not be generalizable to all institutions. Additionally, we only examined errors related to administration of insulin. Other areas that would complete the picture, related to diabetic therapies and outcomes, would need to include prescribing errors or dispensing errors and relate these to glycemic outcomes. Assessment of these additional errors may have revealed more clinically important events that were not revealed in this small snapshot. Lastly, clinical endpoints such as intensive care unit (ICU) transfers, mortality, or readmissions were not assessed in this small study.
We are fortunate that many of these errors were apparently clinically silent, but in a subset of patients, the risk is real and life‐threatening. Risk occurs at both ends of the glucose spectrum, with the low end receiving the greatest attention. Severe hypoglycemia with harm and inpatient diabetic ketoacidosis have been qualified as newer events by Medicare. Hypoglycemia in the ICU population (<40 mg/dL) is an independent marker of mortality.5 Hypoglycemia (<50 mg/dL) has been associated with heart attacks, strokes, and death in the outpatient setting.6
The ability to safely control blood sugar in the hospital requires that medications are administered on time, and that communication occurs between the prescribing provider and the nursing staff providing care. Along with the case‐by‐case implications regarding the need for accurate administration of insulin for subsequent titration and determination of discharge prescriptions for patients with diabetes, there are many implications regarding the assessment of inpatient provision of insulin on determining institutional practices based on previous performance. If insulin administration is not accurately provided or documented, institutions will find it difficult to correctly make changes to insulin protocols for targeting future improvements. Our evaluation indicates an obvious need for quality improvement with 18.1% of the errors reflecting holding insulin without an order, and 12.6% of the errors showing no documentation for the physician being notified of hypoglycemia requiring treatment. The need to foster structured nurse‐physician communication will play a critical role in any process improvement. Communication is key for the optimal provision of insulin in the inpatient setting. Computerized order entry and bar‐code guided administration of doses of insulin may fix some types of the errors (transcription and missed documentation, respectively). That said, one of the largest impacts of this survey may reveal that these errors may not be fixed by technology, but may require more targeted and difficult interventions, such as continuing education and holding clinicians accountable. This study provides insight into the complicated issues regarding inpatient insulin administration and, due to its systematic approach, has given direction for process and system improvements.
- .Patient safety and inpatient glycemic control: translating concepts into action.Endocr Pract.2006;12:49–55.
- ,,,,.Safer administration of insulin: summary of a safety report from the National Patient Safety Agency.BMJ.341:883.
- ,,,,,.Medication administration errors in adult patients in the ICU.Intensive Care Med.2001;27(10):1592–1598.
- United States Pharmacopeia. MEDMARX 5th anniversary data report. A chartbook of 2003 findings and trends 1999–2003. Available at: http://www.usp.org/products/medMarx/index.html?USP_Print. Accessed December 1,2010.
- ,,, et al.Intensive insulin therapy in the medical ICU.N Engl J Med.2006;354:449–461.
- The ADVANCE Trial Collaborative Group.Intensive blood glucose control and vascular outcomes in patients with type 2 diabetes.N Engl J Med.2008;358:2560–2572.