User login
Heart Failure and Hip Fracture Repair
As the population ages, hip fractures and heart failure increase in prevalence.1, 2 Heart failure prevalence is also increasing in hospitalized patients.3 Indeed, hospitalizations involving heart failure as an active issue tripled in the last 30 years.4 Heart failure has been associated with an increased risk for hip fracture,5, 6 and previous studies report a 6%20% prevalence of preoperative heart failure in hip fracture patients.710 While exacerbation of heart failure increases the mortality risk in patients admitted for hip fractures,8 the incidence of new heart failure, as well as the preoperative factors that predict postoperative heart failure in this patient population remain unclear.
American College of Cardiology/American Heart Association (ACC/AHA) perioperative guidelines identify orthopedic surgeries, including hip fracture repair, as intermediate risk procedures.11 Compared to other intermediate risk operations, however, postoperative outcomes following hip fracture repair differ significantly.1216 Overall mortality in hip fracture patients has been reported at 29% at one year,8 with the excess mortality from hip fracture alone at nearly 20%.10, 13 However, the exact factors that contribute to this excess mortality, particularly with regard to heart failure, remain unclear.
To examine the preoperative prevalence, subsequent incidence, and predictors of heart failure in patients undergoing hip fracture repair operations, this study used an established, population‐based database to compare the postoperative consequences in hip fracture repair patients with and without preexisting heart failure. We hypothesized that preoperative heart failure worsens postoperative outcomes in hip fracture patients.
METHODS
Case Ascertainment
Following approval by the Institutional Review Boards of Mayo Clinic and the Olmsted Medical Center, we used the Rochester Epidemiology Project (REP) to identify the patients for this study. The REP is a population‐based medical records linkage system that records all diagnoses, surgical procedures, laboratory data, and death information from hospital, emergency room, outpatient, and nursing home care in the community.17
All Olmsted County, Minnesota, residents who sustained a hip fracture and underwent surgical repair from 1988 through 2002 were evaluated. Patients with more than one hip fracture during the study period (96 occurrences) were censored from the data analysis at the time of the subsequent hip fracture and then included as new cases. The complete enumeration of hip fracture episodes managed in the three Olmsted County hospital facilities (Mayo Clinic's Saint Mary's and Rochester Methodist Hospitals, and the Olmsted Medical Center Hospital) occurred in three phases: First, all hospitalizations with the surgical procedure (International Statistical Classification of Diseases, 9th Revision [ICD‐9]) codes 79.15 (reduction, fracture, femur, closed with internal fixation), 79.25 (reduction, fracture, femur, open, without internal fixation), 79.35 (reduction, fracture, femur, open with internal fixation), 79.95 (operation, unspecified bone injury, femur), 80.05 (arthrotomy for removal of hip prosthesis), 80.15 (arthrotomy, other, hip), 80.95 (excision, hip joint), 81.21 (arthrodesis, hip), 81.40 (repair hip, not elsewhere classified), 81.51 (total hip replacement), 81.52 (partial hip replacement), and 81.53 (revision hip replacement) were identified. Second, through review of the original inpatient and outpatient medical records, we confirmed that a fracture was associated with the index hospitalization. Finally, radiology reports of each index hospitalization verified the presence and exact anatomical location of each fracture. Of those with fractures on admission x‐rays, only patients with a proximal femur (femoral neck or intertrochanteric) fracture as the primary indication for the surgery were included in the study. Surgical report or radiographic evidence of hip fracture was available for all patients. Secondary fractures due to a specific pathological lesion (eg, malignancy) or high‐energy trauma (by convention, motor vehicle accidents or falls from significant heights) were excluded. Only patients who had provided an authorization to review their medical records for research were ultimately included in the study cohort.18 Medical records were search manually, if indicated.
Criteria for Heart Failure and Death
Preoperative heart failure was based on clinical documentation of heart failure in a patient's medical record prior to the time of the hip fracture repair. Postoperative heart failure, including acute exacerbations, was defined according to Framingham criteria.19 Framingham criteria included clinical evidence of increased central venous pressure, pulmonary edema, an S3 gallop, radiographic pulmonary edema, and response to diuresis. Heart failure was not graded on clinical severity (ie, New York Heart Association classification). We did not distinguish between systolic and diastolic heart failure. Mortality was defined as death from any cause within the first year following hip fracture repair. Deaths were identified either through REP resources or the National Death Index.
Statistical Methods
Continuous variables are presented as mean standard deviation and categorical variables as number (percent). Two‐sample t tests or Wilcoxon rank sum tests were used to test for significant differences in continuous variables. Chi‐square or Fisher's exact tests were used for categorical variables. Rates of postoperative outcomes were calculated using the KaplanMeier method for the overall group and for those with and without preoperative heart failure. A landmark survival curve was used to evaluate postoperative mortality among patients who experienced heart failure in the first seven postoperative days versus those who did not. Patients who died or underwent another hip operation within the first seven postoperative days were excluded from this analysis. Univariate Cox proportional hazards models were used to evaluate the predictors of postoperative heart failure and mortality. Patients who died or experienced a second hip surgery within one year of their first were censored at that time. Any subsequent hip fracture repair was treated as a new case. To account for the inclusion of multiple hip fracture repairs for a given patient, the Cox proportional hazards model included a robust variance estimator. This provided an accurate calculation of the standard error in the presence of within‐subject correlation.20 Statistical tests were two‐sided, and P values were considered significant if less than 0.05. Statistical analyses were performed using SAS (version 9.1.3, SAS Institute, Cary, NC).
RESULTS
From among 1327 potential hip fracture repairs, we excluded 115 cases involving multiple injuries or operations (19), pathological fractures (20), in‐hospital fractures (3), or an operation >72 hours after the initial fracture (5). Three patients under 65 years of age were also excluded, as were cases with missing information (9) or cases managed nonoperatively (56). The final analysis included 1212 surgical cases in 1116 subjects. No subjects were lost to surveillance for 1 year following their hip fracture repair.
Table 1 summarizes the baseline characteristics of the study population. The overall prevalence of preoperative heart failure was 27.0% (327 of 1212). Those with preoperative heart failure were older, heavier, more likely male and white, and less likely to live independently preoperatively. They were also more likely to suffer from preexisting cardiovascular comorbidities.
| All (N = 1,212) | HF (N = 327) | No HF (N = 885) | P Value* | |
|---|---|---|---|---|
| ||||
| Demographics | ||||
| Mean age (years) (SD) | 84.2 (7.44) | 85.5 (6.54) | 83.7 (7.70) | 0.00101 |
| Male gender | 237 (19.6) | 76 (23.2) | 161 (18.2) | 0.04912 |
| Mean BMI (kg/m2) (SD) | 23.3 (4.97) | 24.1 (5.68) | 23.0 (4.65) | 0.01231 |
| White | 1,204 (99.3) | 322 (98.5) | 882 (99.7) | 0.03713 |
| Preoperative living situation | ||||
| Nursing facility | 468 (38.6) | 144 (44) | 324 (36.6) | 0.01842 |
| Home | 744 (61.4) | 183 (56) | 561 (63.4) | 0.05192 |
| Preoperative ambulatory status | ||||
| Dependent | 149 (12.3) | 50 (15.3) | 99 (11.2) | |
| Independent | 1,061 (87.7) | 276 (84.7) | 785 (88.8) | |
| Medical history | ||||
| Hypertension | 705 (58.2) | 226 (69.1) | 479 (54.1) | <0.00012 |
| Diabetes mellitus | 143 (11.8) | 63 (19.3) | 80 (9) | <0.00012 |
| Cerebrovascular disease | 331 (27.3) | 129 (39.4) | 202 (22.8) | <0.00012 |
| Peripheral vascular disease | 195 (16.1) | 80 (24.5) | 115 (13) | <0.00012 |
| Coronary artery disease | 464 (38.3) | 237 (72.5) | 227 (25.6) | <0.00012 |
| Atrial fibrillation/flutter | 254 (21) | 133 (40.7) | 121 (13.7) | <0.00012 |
| Complete heart block | 18 (1.5) | 9 (2.8) | 9 (1) | 0.03373 |
| Pacer at time of admission | 32 (2.6) | 16 (4.9) | 16 (1.8) | 0.00292 |
| Chronic obstructive pulmonary disease | 196 (16.2) | 78 (23.9) | 118 (13.3) | <0.00012 |
| Liver disease | 15 (1.2) | 7 (2.1) | 8 (0.9) | 0.13753 |
| Chronic renal insufficiency | 131 (10.8) | 61 (18.7) | 70 (7.9) | <0.00012 |
| Mean length of hospitalization (days) (SD) | 10.0 (7.57) | 11.1 (8.82) | 9.6 (7.01) | 0.00101 |
| Discharge disposition | 0.00192 | |||
| Home | 150 (12.4) | 26 (8.0) | 124 (14.0) | |
| Skilled nursing facility | 1,004 (82.9) | 278 (85.0) | 726 (82.1) | |
| Dead | 57 (4.7) | 23 (7.0) | 34 (3.9) | |
Table 1 also summarizes the main outcome characteristics of the study population. Those with preoperative heart failure had longer mean lengths of stay (LOS), were more often discharged to a skilled facility, and demonstrated higher inpatient mortality rates.
Table 2 summarizes the outcomes associated with preoperative heart failure. The overall rate of postoperative heart failure was 6.7% within 7 postoperative days and 21.3% within 1 postoperative year. Postoperative heart failure was significantly more common among those with preoperative heart failure (hazard ratio [HR], 3.0; 95% confidence interval [CI], 2.3 to 3.9; P < 0.001). Among those without preoperative heart failure, rates of postoperative incident heart failure were 4.8% at 7 days and 15.0% at 1 year. Compared to patients without preoperative heart failure, those with preoperative heart failure demonstrated higher one year mortality rates and higher rates of postoperative heart failure at 7 days and 1 year.
| Preoperative Heart Failure (Subjects) | |||||
|---|---|---|---|---|---|
| Outcome | All (N = 1212) | No (N = 885) | Yes (N = 327) | Risk ratio* (95% CI) | P Value |
| |||||
| Heart failure exacerbation within seven postoperative days | 6.7% (5.4, 8.3) | 4.8% (3.5, 6.5) | 12.1% (8.7, 16.2) | 2.72 (1.72, 4.31) | <0.0001 |
| One‐year postoperative heart failure exacerbation | 21.3% (18.8, 23.7) | 15.0% (12.5, 17.4) | 39.3% (33.3, 44.9) | 3.00 (2.32, 3.87) | <0.0001 |
| One‐year postoperative mortality | 24.5% (22.0, 26.9) | 19.8% (17.1, 22.4) | 37.2% (31.6, 42.3) | 2.11 (1.67, 2.67) | <0.0001 |
| One‐year postoperative mortality or heart failure exacerbation | 36.5% (33.7, 39.2) | 29.7% (26.6, 32.6) | 55.0% (49.3, 60.2) | 2.28 (1.88, 2.76) | <0.0001 |
Figure 1 displays the outcomes to 1 year of surveillance. Rates of postoperative heart failure and postoperative mortality were consistently higher among those with, versus without, preoperative heart failure. Figure 2 displays similar data stratified by gender. Postoperative heart failure rates did not differ significantly between genders (HR, 1.0; 95% CI, 0.8 to 1.4), but postoperative mortality rates were significantly higher among males than females (HR, 1.9; 95% CI, 1.5 to 2.5; P < 0.001).
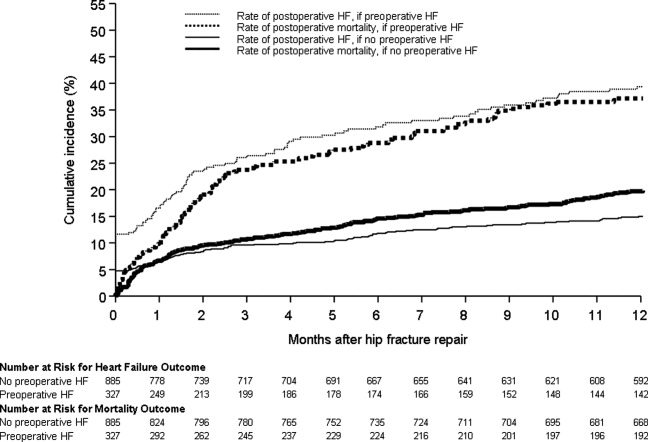
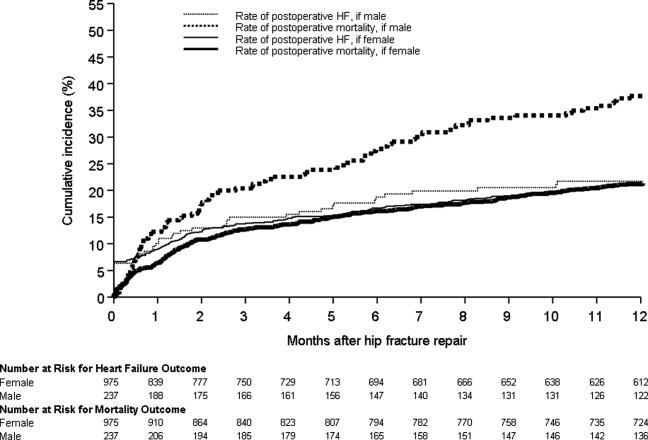
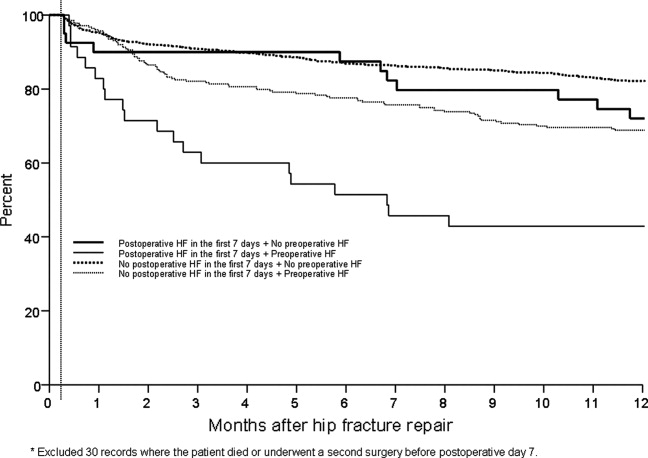
Figure 3 displays survival rates to 1 year based on the occurrence of incident or recurrent heart failure within the first 7 postoperative days. Survival rates were lowest among patients with recurrent heart failure in the first 7 postoperative days and highest among those with no preoperative or postoperative heart failure. Subjects with incident heart failure in the first postoperative week, and those with preoperative heart failure who did not suffer a recurrence, demonstrated intermediate survival rates (P < 0.001 for trend across all four groups).
DISCUSSION
This population‐based study found that heart failure represents a highly prevalent condition in elderly patients undergoing hip fracture repairs. It demonstrates that those with preoperative heart failure typically suffer from more cardiovascular comorbidities and carry a higher risk of postoperative heart failure and postoperative mortality.
While many studies have focused on the epidemiology of hip fractures,21 population‐based data on cardiac complications following hip fracture repair are significantly less common. The ACC/AHA preoperative cardiac evaluation guidelines classify orthopedic procedures, including hip fracture repair, as intermediate risk.11 Consequently, some may assume that all orthopedic patients will have a mortality rate less than 5%. Indeed, the 30‐day postoperative mortality rate published from our institution's Total Joint Registry was 0.6% following elective total hip arthroplasty.22 However, the present study demonstrates that current ACC/AHA preoperative cardiac evaluation guidelines may not apply to the population of frail patients undergoing hip fracture repair. Particularly among those who experience new heart failure within the first seven days following surgery, outcomes are substantially worse than the ACC/AHA perioperative guidelines may suggest.11
Preoperative heart failure has been associated with adverse risk for postoperative mortality after hip fracture.9, 10, 12 However, these studies did not report heart failure as a complication of hip fracture repair. A prospective cohort study of 2448 hip fracture patients at an academic hospital in Great Britain found a 5% rate of inpatient heart failure as a postoperative complication.23 The hazard ratio for one‐year mortality was 11.3 with postoperative heart failure.23 However, the British study did not distinguish heart failure from other cardiovascular diseases as a preoperative comorbidity or stratify the risk for postoperative mortality by preoperative heart failure status.23 Our findings add to previous literature by measuring heart failure as a specific complication of hip fracture repair and examining the association of preoperative heart failure with postoperative heart failure and mortality.
Length of stay after hip fracture repair varies in the literature, but previous work has not clearly associated heart failure with length of hospitalization in the setting of hip fracture repair.24, 25 Our study found a significantly higher mean length of stay among those with preoperative heart failure. This adds to previous work by delineating an association between heart failure and increased length of stay after hip fracture repair.
We found a higher rate of postoperative mortality among men compared to women. Rates of postoperative heart failure, however, were more similar (Figure 2). Previous studies have found a consistently higher mortality rate among men versus women after hip fracture.9, 23, 2529 Possible explanations for these findings include the overall increased burden of cardiovascular disease among men, lower treatment rates of osteoporosis in men,30 and increased susceptibility to other postoperative complications, such as infection.25
The findings of this study carry important clinical implications for the perioperative care of hip fracture patients with, or at risk for, heart failure. They suggest that current risk stratification guidelines classifying orthopedic operations as intermediate risk procedures do not reflect the high risk for morbidity that hip fracture patients face.11 The association of heart failure with adverse outcomes implies the need for heightened surveillance in the perioperative period, particularly with regard to volume status and medication reconciliation. Hip fracture patients and their families must be counseled about the ramifications of perioperative heart failure, including higher rates of postoperative heart failure, longer hospitalizations, and ultimate mortality.
This research carries several limitations and remains subject to biases inherent in retrospective cohort studies. The reported effects of heart failure on outcomes after hip fracture repair may be due to confounding from age, functional status, and other comorbidities. We attempted to minimize sampling bias through complete enumeration of hip fracture surgeries among Olmsted County residents. Completeness of follow‐up (100% at one year) was possible given the availability of documentation of all inpatient and outpatient medical care in the community.17 We used objectively defined outcomes to minimize measurement bias. Applicability to a more diverse population may be limited because >95% of the research population was from a single, predominantly white community. However, prior studies have documented that hip fracture incidence rates31 and socioeconomic factors17 in Olmsted County are similar to those for other white residents of the United States. Heart failure rates were determined clinically according to the Framingham criteria. However, the Framingham criteria may inappropriately diagnose individuals with heart failure32 and falsely elevate the prevalence of heart failure as a preoperative comorbidity or postoperative complication.
The statistical analysis included patients counted multiple times if they underwent subsequent hip fracture repair during the study period. Including these patients may inaccurately inflate event rates or contribute to incorrect estimates of standard error. However, we felt it was appropriate to include recurrent hip fracture repair cases in the analysis because they represent a clinically distinct patient from both a medical and functional perspective. We used a robust variance estimator in the Cox proportional hazards models to provide an accurate calculation of the standard error given the possibility for correlation within subjects.20 Finally, the proportion of these patients was low (94 of 1116 unique patients; 8.4%).
Future work must involve further risk stratification and therapeutic interventions in perioperative hip fracture patients. A more robust analysis of heart failure, with differentiation between systolic and diastolic dysfunction, may facilitate risk stratification. Assessment of compliance with standard preoperative heart failure medications and the impact of heightened clinical vigilance may enlighten means to improve postoperative outcomes. Studies on risk stratification and therapeutic interventions may then inform policy regarding length of stay and reimbursement in hip fracture patients.
CONCLUSION
In summary, our population‐based findings reveal that heart failure represents a prevalent and serious comorbidity in patients undergoing hip fracture repair. Clinicians caring for perioperative hip fracture patients must pay particular attention to risk for, and implications of, new or recurrent heart failure.
Acknowledgements
The authors thank Donna K. Lawson, LPN, Kathy Wolfert, and Cherie Dolliver for their assistance in data collection and management.
- .Epidemiology of hip fractures: Implications of the exponential increase with age.Bone.1996;18(3 suppl):121S–125S.
- ,,, et al.Trends in length of stay and short‐term outcomes among Medicare patients hospitalized for heart failure, 1993–2006.JAMA.2010;303(21):2141–2147.
- ,,,,.The expanding national burden of heart failure in the United States: The influence of heart failure in women.Am Heart J.2004;147(1):74–78.
- ,,,.Heart failure‐related hospitalization in the U.S., 1979 to 2004.J Am Coll Cardiol.2008;52(6):428–434.
- ,,,,.Heart failure is a risk factor for orthopedic fracture: A population‐based analysis of 16,294 patients.Circulation.2008;118(19):1946–1952.
- ,,, et al.Cardiovascular diseases and risk of hip fracture.JAMA.2009;302(15):1666–1673.
- ,,,.Effectiveness of hospitalist involvement in hip fracture management questioned.South Med J.2007;100(9):912–913.
- ,,, et al.Effects of a hospitalist care model on mortality of elderly patients with hip fractures.J Hosp Med.2007;2(4):219–225.
- ,,,.Excess mortality in men compared with women following a hip fracture. National analysis of comedications, comorbidity and survival.Age Ageing.2010;39(2):203–209.
- ,,.Increased mortality in patients with a hip fracture—Effect of pre‐morbid conditions and post‐fracture complications.Osteoporos Int.2007;18(12):1583–1593.
- ,,, et al.ACC/AHA 2007 guidelines on perioperative cardiovascular evaluation and care for noncardiac surgery: Executive summary: A report of the American College of Cardiology/American Heart Association Task Force on Practice Guidelines (Writing Committee to Revise the 2002 Guidelines on Perioperative Cardiovascular Evaluation for Noncardiac Surgery): Developed in collaboration with the American Society of Echocardiography, American Society of Nuclear Cardiology, Heart Rhythm Society, Society of Cardiovascular Anesthesiologists, Society for Cardiovascular Angiography and Interventions, Society for Vascular Medicine and Biology, and Society for Vascular Surgery.J Am Coll Cardiol.2007;50(17):1707–1732.
- ,,,,.Excess mortality following hip fracture: The role of underlying health status.Osteoporos Int.2007;18(11):1463–1472.
- .Time trends of mortality after first hip fractures.Osteoporos Int.2007;18(6):721–732.
- ,,, et al.Mortality and locomotion 6 months after hospitalization for hip fracture: Risk factors and risk‐adjusted hospital outcomes.JAMA.2001;285(21):2736–2742.
- ,,,.Factors associated with mortality after hip fracture.Osteoporos Int.2000;11(3):228–232.
- ,,,,,.Hip fractures among the elderly: Factors associated with in‐hospital mortality.Am J Epidemiol.1991;134(10):1128–1137.
- .History of the Rochester Epidemiology Project.Mayo Clin Proc.1996;71(3):266–274.
- .The threat to medical‐records research.N Engl J Med.1997;337(20):1466–1470.
- ,,,.The natural history of congestive heart failure: The Framingham Study.N Engl J Med.1971;285(26):1441–1446.
- ,.The robust inference for the Cox proportional hazards model.J Am Stat Assoc.1989;84(408):1074–1078.
- .Hip fracture epidemiological trends, outcomes, and risk factors, 1970–2009.Int J Gen Med.2010;3:1–17.
- ,,,,,.Frequency of myocardial infarction, pulmonary embolism, deep venous thrombosis, and death following primary hip or knee arthroplasty.Anesthesiology.2002;96(5):1140–1146.
- ,,,.Effect of comorbidities and postoperative complications on mortality after hip fracture in elderly people: Prospective observational cohort study.BMJ.2005;331(7529):1374–1376.
- ,,, et al.The aftermath of hip fracture: Discharge placement, functional status change, and mortality.Am J Epidemiol.2009;170(10):1290–1299.
- ,,,,,.Gender differences in mortality after hip fracture: The role of infection.J Bone Miner Res.2003;18(12):2231–2237.
- ,,,,.Mortality after all major types of osteoporotic fracture in men and women: An observational study.Lancet.1999;353(9156):878–882.
- ,,.Adjusted mortality after hip fracture: From the Cardiovascular Health Study.J Am Geriatr Soc.2006;54(12):1885–1891.
- ,,, et al.Meta‐analysis: Excess mortality after hip fracture among older women and men.Ann Intern Med.2010;152(6):380–390.
- ,,,.Predictors of hip fractures in elderly men.J Bone Miner Res.1995;10(12):1900–1907.
- ,,, et al.Population‐based fracture risk assessment and osteoporosis treatment disparities by race and gender.J Gen Intern Med.2009;24(8):956–962.
- ,,.Long‐term trends in hip fracture prevalence: The influence of hip fracture incidence and survival.Osteoporos Int.1998;8(1):68–74.
- ,,,,,.diagnostic accuracy of clinical criteria for identifying systolic and diastolic heart failure: Cross‐sectional study.J Eval Clin Pract.2009;15(1):55–61.
As the population ages, hip fractures and heart failure increase in prevalence.1, 2 Heart failure prevalence is also increasing in hospitalized patients.3 Indeed, hospitalizations involving heart failure as an active issue tripled in the last 30 years.4 Heart failure has been associated with an increased risk for hip fracture,5, 6 and previous studies report a 6%20% prevalence of preoperative heart failure in hip fracture patients.710 While exacerbation of heart failure increases the mortality risk in patients admitted for hip fractures,8 the incidence of new heart failure, as well as the preoperative factors that predict postoperative heart failure in this patient population remain unclear.
American College of Cardiology/American Heart Association (ACC/AHA) perioperative guidelines identify orthopedic surgeries, including hip fracture repair, as intermediate risk procedures.11 Compared to other intermediate risk operations, however, postoperative outcomes following hip fracture repair differ significantly.1216 Overall mortality in hip fracture patients has been reported at 29% at one year,8 with the excess mortality from hip fracture alone at nearly 20%.10, 13 However, the exact factors that contribute to this excess mortality, particularly with regard to heart failure, remain unclear.
To examine the preoperative prevalence, subsequent incidence, and predictors of heart failure in patients undergoing hip fracture repair operations, this study used an established, population‐based database to compare the postoperative consequences in hip fracture repair patients with and without preexisting heart failure. We hypothesized that preoperative heart failure worsens postoperative outcomes in hip fracture patients.
METHODS
Case Ascertainment
Following approval by the Institutional Review Boards of Mayo Clinic and the Olmsted Medical Center, we used the Rochester Epidemiology Project (REP) to identify the patients for this study. The REP is a population‐based medical records linkage system that records all diagnoses, surgical procedures, laboratory data, and death information from hospital, emergency room, outpatient, and nursing home care in the community.17
All Olmsted County, Minnesota, residents who sustained a hip fracture and underwent surgical repair from 1988 through 2002 were evaluated. Patients with more than one hip fracture during the study period (96 occurrences) were censored from the data analysis at the time of the subsequent hip fracture and then included as new cases. The complete enumeration of hip fracture episodes managed in the three Olmsted County hospital facilities (Mayo Clinic's Saint Mary's and Rochester Methodist Hospitals, and the Olmsted Medical Center Hospital) occurred in three phases: First, all hospitalizations with the surgical procedure (International Statistical Classification of Diseases, 9th Revision [ICD‐9]) codes 79.15 (reduction, fracture, femur, closed with internal fixation), 79.25 (reduction, fracture, femur, open, without internal fixation), 79.35 (reduction, fracture, femur, open with internal fixation), 79.95 (operation, unspecified bone injury, femur), 80.05 (arthrotomy for removal of hip prosthesis), 80.15 (arthrotomy, other, hip), 80.95 (excision, hip joint), 81.21 (arthrodesis, hip), 81.40 (repair hip, not elsewhere classified), 81.51 (total hip replacement), 81.52 (partial hip replacement), and 81.53 (revision hip replacement) were identified. Second, through review of the original inpatient and outpatient medical records, we confirmed that a fracture was associated with the index hospitalization. Finally, radiology reports of each index hospitalization verified the presence and exact anatomical location of each fracture. Of those with fractures on admission x‐rays, only patients with a proximal femur (femoral neck or intertrochanteric) fracture as the primary indication for the surgery were included in the study. Surgical report or radiographic evidence of hip fracture was available for all patients. Secondary fractures due to a specific pathological lesion (eg, malignancy) or high‐energy trauma (by convention, motor vehicle accidents or falls from significant heights) were excluded. Only patients who had provided an authorization to review their medical records for research were ultimately included in the study cohort.18 Medical records were search manually, if indicated.
Criteria for Heart Failure and Death
Preoperative heart failure was based on clinical documentation of heart failure in a patient's medical record prior to the time of the hip fracture repair. Postoperative heart failure, including acute exacerbations, was defined according to Framingham criteria.19 Framingham criteria included clinical evidence of increased central venous pressure, pulmonary edema, an S3 gallop, radiographic pulmonary edema, and response to diuresis. Heart failure was not graded on clinical severity (ie, New York Heart Association classification). We did not distinguish between systolic and diastolic heart failure. Mortality was defined as death from any cause within the first year following hip fracture repair. Deaths were identified either through REP resources or the National Death Index.
Statistical Methods
Continuous variables are presented as mean standard deviation and categorical variables as number (percent). Two‐sample t tests or Wilcoxon rank sum tests were used to test for significant differences in continuous variables. Chi‐square or Fisher's exact tests were used for categorical variables. Rates of postoperative outcomes were calculated using the KaplanMeier method for the overall group and for those with and without preoperative heart failure. A landmark survival curve was used to evaluate postoperative mortality among patients who experienced heart failure in the first seven postoperative days versus those who did not. Patients who died or underwent another hip operation within the first seven postoperative days were excluded from this analysis. Univariate Cox proportional hazards models were used to evaluate the predictors of postoperative heart failure and mortality. Patients who died or experienced a second hip surgery within one year of their first were censored at that time. Any subsequent hip fracture repair was treated as a new case. To account for the inclusion of multiple hip fracture repairs for a given patient, the Cox proportional hazards model included a robust variance estimator. This provided an accurate calculation of the standard error in the presence of within‐subject correlation.20 Statistical tests were two‐sided, and P values were considered significant if less than 0.05. Statistical analyses were performed using SAS (version 9.1.3, SAS Institute, Cary, NC).
RESULTS
From among 1327 potential hip fracture repairs, we excluded 115 cases involving multiple injuries or operations (19), pathological fractures (20), in‐hospital fractures (3), or an operation >72 hours after the initial fracture (5). Three patients under 65 years of age were also excluded, as were cases with missing information (9) or cases managed nonoperatively (56). The final analysis included 1212 surgical cases in 1116 subjects. No subjects were lost to surveillance for 1 year following their hip fracture repair.
Table 1 summarizes the baseline characteristics of the study population. The overall prevalence of preoperative heart failure was 27.0% (327 of 1212). Those with preoperative heart failure were older, heavier, more likely male and white, and less likely to live independently preoperatively. They were also more likely to suffer from preexisting cardiovascular comorbidities.
| All (N = 1,212) | HF (N = 327) | No HF (N = 885) | P Value* | |
|---|---|---|---|---|
| ||||
| Demographics | ||||
| Mean age (years) (SD) | 84.2 (7.44) | 85.5 (6.54) | 83.7 (7.70) | 0.00101 |
| Male gender | 237 (19.6) | 76 (23.2) | 161 (18.2) | 0.04912 |
| Mean BMI (kg/m2) (SD) | 23.3 (4.97) | 24.1 (5.68) | 23.0 (4.65) | 0.01231 |
| White | 1,204 (99.3) | 322 (98.5) | 882 (99.7) | 0.03713 |
| Preoperative living situation | ||||
| Nursing facility | 468 (38.6) | 144 (44) | 324 (36.6) | 0.01842 |
| Home | 744 (61.4) | 183 (56) | 561 (63.4) | 0.05192 |
| Preoperative ambulatory status | ||||
| Dependent | 149 (12.3) | 50 (15.3) | 99 (11.2) | |
| Independent | 1,061 (87.7) | 276 (84.7) | 785 (88.8) | |
| Medical history | ||||
| Hypertension | 705 (58.2) | 226 (69.1) | 479 (54.1) | <0.00012 |
| Diabetes mellitus | 143 (11.8) | 63 (19.3) | 80 (9) | <0.00012 |
| Cerebrovascular disease | 331 (27.3) | 129 (39.4) | 202 (22.8) | <0.00012 |
| Peripheral vascular disease | 195 (16.1) | 80 (24.5) | 115 (13) | <0.00012 |
| Coronary artery disease | 464 (38.3) | 237 (72.5) | 227 (25.6) | <0.00012 |
| Atrial fibrillation/flutter | 254 (21) | 133 (40.7) | 121 (13.7) | <0.00012 |
| Complete heart block | 18 (1.5) | 9 (2.8) | 9 (1) | 0.03373 |
| Pacer at time of admission | 32 (2.6) | 16 (4.9) | 16 (1.8) | 0.00292 |
| Chronic obstructive pulmonary disease | 196 (16.2) | 78 (23.9) | 118 (13.3) | <0.00012 |
| Liver disease | 15 (1.2) | 7 (2.1) | 8 (0.9) | 0.13753 |
| Chronic renal insufficiency | 131 (10.8) | 61 (18.7) | 70 (7.9) | <0.00012 |
| Mean length of hospitalization (days) (SD) | 10.0 (7.57) | 11.1 (8.82) | 9.6 (7.01) | 0.00101 |
| Discharge disposition | 0.00192 | |||
| Home | 150 (12.4) | 26 (8.0) | 124 (14.0) | |
| Skilled nursing facility | 1,004 (82.9) | 278 (85.0) | 726 (82.1) | |
| Dead | 57 (4.7) | 23 (7.0) | 34 (3.9) | |
Table 1 also summarizes the main outcome characteristics of the study population. Those with preoperative heart failure had longer mean lengths of stay (LOS), were more often discharged to a skilled facility, and demonstrated higher inpatient mortality rates.
Table 2 summarizes the outcomes associated with preoperative heart failure. The overall rate of postoperative heart failure was 6.7% within 7 postoperative days and 21.3% within 1 postoperative year. Postoperative heart failure was significantly more common among those with preoperative heart failure (hazard ratio [HR], 3.0; 95% confidence interval [CI], 2.3 to 3.9; P < 0.001). Among those without preoperative heart failure, rates of postoperative incident heart failure were 4.8% at 7 days and 15.0% at 1 year. Compared to patients without preoperative heart failure, those with preoperative heart failure demonstrated higher one year mortality rates and higher rates of postoperative heart failure at 7 days and 1 year.
| Preoperative Heart Failure (Subjects) | |||||
|---|---|---|---|---|---|
| Outcome | All (N = 1212) | No (N = 885) | Yes (N = 327) | Risk ratio* (95% CI) | P Value |
| |||||
| Heart failure exacerbation within seven postoperative days | 6.7% (5.4, 8.3) | 4.8% (3.5, 6.5) | 12.1% (8.7, 16.2) | 2.72 (1.72, 4.31) | <0.0001 |
| One‐year postoperative heart failure exacerbation | 21.3% (18.8, 23.7) | 15.0% (12.5, 17.4) | 39.3% (33.3, 44.9) | 3.00 (2.32, 3.87) | <0.0001 |
| One‐year postoperative mortality | 24.5% (22.0, 26.9) | 19.8% (17.1, 22.4) | 37.2% (31.6, 42.3) | 2.11 (1.67, 2.67) | <0.0001 |
| One‐year postoperative mortality or heart failure exacerbation | 36.5% (33.7, 39.2) | 29.7% (26.6, 32.6) | 55.0% (49.3, 60.2) | 2.28 (1.88, 2.76) | <0.0001 |
Figure 1 displays the outcomes to 1 year of surveillance. Rates of postoperative heart failure and postoperative mortality were consistently higher among those with, versus without, preoperative heart failure. Figure 2 displays similar data stratified by gender. Postoperative heart failure rates did not differ significantly between genders (HR, 1.0; 95% CI, 0.8 to 1.4), but postoperative mortality rates were significantly higher among males than females (HR, 1.9; 95% CI, 1.5 to 2.5; P < 0.001).
Figure 3 displays survival rates to 1 year based on the occurrence of incident or recurrent heart failure within the first 7 postoperative days. Survival rates were lowest among patients with recurrent heart failure in the first 7 postoperative days and highest among those with no preoperative or postoperative heart failure. Subjects with incident heart failure in the first postoperative week, and those with preoperative heart failure who did not suffer a recurrence, demonstrated intermediate survival rates (P < 0.001 for trend across all four groups).
DISCUSSION
This population‐based study found that heart failure represents a highly prevalent condition in elderly patients undergoing hip fracture repairs. It demonstrates that those with preoperative heart failure typically suffer from more cardiovascular comorbidities and carry a higher risk of postoperative heart failure and postoperative mortality.
While many studies have focused on the epidemiology of hip fractures,21 population‐based data on cardiac complications following hip fracture repair are significantly less common. The ACC/AHA preoperative cardiac evaluation guidelines classify orthopedic procedures, including hip fracture repair, as intermediate risk.11 Consequently, some may assume that all orthopedic patients will have a mortality rate less than 5%. Indeed, the 30‐day postoperative mortality rate published from our institution's Total Joint Registry was 0.6% following elective total hip arthroplasty.22 However, the present study demonstrates that current ACC/AHA preoperative cardiac evaluation guidelines may not apply to the population of frail patients undergoing hip fracture repair. Particularly among those who experience new heart failure within the first seven days following surgery, outcomes are substantially worse than the ACC/AHA perioperative guidelines may suggest.11
Preoperative heart failure has been associated with adverse risk for postoperative mortality after hip fracture.9, 10, 12 However, these studies did not report heart failure as a complication of hip fracture repair. A prospective cohort study of 2448 hip fracture patients at an academic hospital in Great Britain found a 5% rate of inpatient heart failure as a postoperative complication.23 The hazard ratio for one‐year mortality was 11.3 with postoperative heart failure.23 However, the British study did not distinguish heart failure from other cardiovascular diseases as a preoperative comorbidity or stratify the risk for postoperative mortality by preoperative heart failure status.23 Our findings add to previous literature by measuring heart failure as a specific complication of hip fracture repair and examining the association of preoperative heart failure with postoperative heart failure and mortality.
Length of stay after hip fracture repair varies in the literature, but previous work has not clearly associated heart failure with length of hospitalization in the setting of hip fracture repair.24, 25 Our study found a significantly higher mean length of stay among those with preoperative heart failure. This adds to previous work by delineating an association between heart failure and increased length of stay after hip fracture repair.
We found a higher rate of postoperative mortality among men compared to women. Rates of postoperative heart failure, however, were more similar (Figure 2). Previous studies have found a consistently higher mortality rate among men versus women after hip fracture.9, 23, 2529 Possible explanations for these findings include the overall increased burden of cardiovascular disease among men, lower treatment rates of osteoporosis in men,30 and increased susceptibility to other postoperative complications, such as infection.25
The findings of this study carry important clinical implications for the perioperative care of hip fracture patients with, or at risk for, heart failure. They suggest that current risk stratification guidelines classifying orthopedic operations as intermediate risk procedures do not reflect the high risk for morbidity that hip fracture patients face.11 The association of heart failure with adverse outcomes implies the need for heightened surveillance in the perioperative period, particularly with regard to volume status and medication reconciliation. Hip fracture patients and their families must be counseled about the ramifications of perioperative heart failure, including higher rates of postoperative heart failure, longer hospitalizations, and ultimate mortality.
This research carries several limitations and remains subject to biases inherent in retrospective cohort studies. The reported effects of heart failure on outcomes after hip fracture repair may be due to confounding from age, functional status, and other comorbidities. We attempted to minimize sampling bias through complete enumeration of hip fracture surgeries among Olmsted County residents. Completeness of follow‐up (100% at one year) was possible given the availability of documentation of all inpatient and outpatient medical care in the community.17 We used objectively defined outcomes to minimize measurement bias. Applicability to a more diverse population may be limited because >95% of the research population was from a single, predominantly white community. However, prior studies have documented that hip fracture incidence rates31 and socioeconomic factors17 in Olmsted County are similar to those for other white residents of the United States. Heart failure rates were determined clinically according to the Framingham criteria. However, the Framingham criteria may inappropriately diagnose individuals with heart failure32 and falsely elevate the prevalence of heart failure as a preoperative comorbidity or postoperative complication.
The statistical analysis included patients counted multiple times if they underwent subsequent hip fracture repair during the study period. Including these patients may inaccurately inflate event rates or contribute to incorrect estimates of standard error. However, we felt it was appropriate to include recurrent hip fracture repair cases in the analysis because they represent a clinically distinct patient from both a medical and functional perspective. We used a robust variance estimator in the Cox proportional hazards models to provide an accurate calculation of the standard error given the possibility for correlation within subjects.20 Finally, the proportion of these patients was low (94 of 1116 unique patients; 8.4%).
Future work must involve further risk stratification and therapeutic interventions in perioperative hip fracture patients. A more robust analysis of heart failure, with differentiation between systolic and diastolic dysfunction, may facilitate risk stratification. Assessment of compliance with standard preoperative heart failure medications and the impact of heightened clinical vigilance may enlighten means to improve postoperative outcomes. Studies on risk stratification and therapeutic interventions may then inform policy regarding length of stay and reimbursement in hip fracture patients.
CONCLUSION
In summary, our population‐based findings reveal that heart failure represents a prevalent and serious comorbidity in patients undergoing hip fracture repair. Clinicians caring for perioperative hip fracture patients must pay particular attention to risk for, and implications of, new or recurrent heart failure.
Acknowledgements
The authors thank Donna K. Lawson, LPN, Kathy Wolfert, and Cherie Dolliver for their assistance in data collection and management.
- .Epidemiology of hip fractures: Implications of the exponential increase with age.Bone.1996;18(3 suppl):121S–125S.
- ,,, et al.Trends in length of stay and short‐term outcomes among Medicare patients hospitalized for heart failure, 1993–2006.JAMA.2010;303(21):2141–2147.
- ,,,,.The expanding national burden of heart failure in the United States: The influence of heart failure in women.Am Heart J.2004;147(1):74–78.
- ,,,.Heart failure‐related hospitalization in the U.S., 1979 to 2004.J Am Coll Cardiol.2008;52(6):428–434.
- ,,,,.Heart failure is a risk factor for orthopedic fracture: A population‐based analysis of 16,294 patients.Circulation.2008;118(19):1946–1952.
- ,,, et al.Cardiovascular diseases and risk of hip fracture.JAMA.2009;302(15):1666–1673.
- ,,,.Effectiveness of hospitalist involvement in hip fracture management questioned.South Med J.2007;100(9):912–913.
- ,,, et al.Effects of a hospitalist care model on mortality of elderly patients with hip fractures.J Hosp Med.2007;2(4):219–225.
- ,,,.Excess mortality in men compared with women following a hip fracture. National analysis of comedications, comorbidity and survival.Age Ageing.2010;39(2):203–209.
- ,,.Increased mortality in patients with a hip fracture—Effect of pre‐morbid conditions and post‐fracture complications.Osteoporos Int.2007;18(12):1583–1593.
- ,,, et al.ACC/AHA 2007 guidelines on perioperative cardiovascular evaluation and care for noncardiac surgery: Executive summary: A report of the American College of Cardiology/American Heart Association Task Force on Practice Guidelines (Writing Committee to Revise the 2002 Guidelines on Perioperative Cardiovascular Evaluation for Noncardiac Surgery): Developed in collaboration with the American Society of Echocardiography, American Society of Nuclear Cardiology, Heart Rhythm Society, Society of Cardiovascular Anesthesiologists, Society for Cardiovascular Angiography and Interventions, Society for Vascular Medicine and Biology, and Society for Vascular Surgery.J Am Coll Cardiol.2007;50(17):1707–1732.
- ,,,,.Excess mortality following hip fracture: The role of underlying health status.Osteoporos Int.2007;18(11):1463–1472.
- .Time trends of mortality after first hip fractures.Osteoporos Int.2007;18(6):721–732.
- ,,, et al.Mortality and locomotion 6 months after hospitalization for hip fracture: Risk factors and risk‐adjusted hospital outcomes.JAMA.2001;285(21):2736–2742.
- ,,,.Factors associated with mortality after hip fracture.Osteoporos Int.2000;11(3):228–232.
- ,,,,,.Hip fractures among the elderly: Factors associated with in‐hospital mortality.Am J Epidemiol.1991;134(10):1128–1137.
- .History of the Rochester Epidemiology Project.Mayo Clin Proc.1996;71(3):266–274.
- .The threat to medical‐records research.N Engl J Med.1997;337(20):1466–1470.
- ,,,.The natural history of congestive heart failure: The Framingham Study.N Engl J Med.1971;285(26):1441–1446.
- ,.The robust inference for the Cox proportional hazards model.J Am Stat Assoc.1989;84(408):1074–1078.
- .Hip fracture epidemiological trends, outcomes, and risk factors, 1970–2009.Int J Gen Med.2010;3:1–17.
- ,,,,,.Frequency of myocardial infarction, pulmonary embolism, deep venous thrombosis, and death following primary hip or knee arthroplasty.Anesthesiology.2002;96(5):1140–1146.
- ,,,.Effect of comorbidities and postoperative complications on mortality after hip fracture in elderly people: Prospective observational cohort study.BMJ.2005;331(7529):1374–1376.
- ,,, et al.The aftermath of hip fracture: Discharge placement, functional status change, and mortality.Am J Epidemiol.2009;170(10):1290–1299.
- ,,,,,.Gender differences in mortality after hip fracture: The role of infection.J Bone Miner Res.2003;18(12):2231–2237.
- ,,,,.Mortality after all major types of osteoporotic fracture in men and women: An observational study.Lancet.1999;353(9156):878–882.
- ,,.Adjusted mortality after hip fracture: From the Cardiovascular Health Study.J Am Geriatr Soc.2006;54(12):1885–1891.
- ,,, et al.Meta‐analysis: Excess mortality after hip fracture among older women and men.Ann Intern Med.2010;152(6):380–390.
- ,,,.Predictors of hip fractures in elderly men.J Bone Miner Res.1995;10(12):1900–1907.
- ,,, et al.Population‐based fracture risk assessment and osteoporosis treatment disparities by race and gender.J Gen Intern Med.2009;24(8):956–962.
- ,,.Long‐term trends in hip fracture prevalence: The influence of hip fracture incidence and survival.Osteoporos Int.1998;8(1):68–74.
- ,,,,,.diagnostic accuracy of clinical criteria for identifying systolic and diastolic heart failure: Cross‐sectional study.J Eval Clin Pract.2009;15(1):55–61.
Copyright © 2011 Society of Hospital Medicine

BMI and Postoperative Complications
Public health concerns such as the aging population1 and the increasing prevalence of obesity2 are also important issues to hospitals. However, little attention has been given to the interface of obesity and the elderly, largely due to the dearth of studies that include elderly patients. An aging population leads to an increase in geriatric syndromes, such as osteoporosis3 and its most devastating complication, hip fracture.4 These frail, hip‐fracture patients pose management challenges to practicing geriatricians and hospitalists.5,6 Furthermore, although fracture risk is inversely correlated to body mass index (BMI),7 this relationship has yet to be fully examined in the postoperative hip‐fracture population. In other surgical settings, there is disagreement as to whether underweight or obese patients are at higher risk of developing medical complications,8‐11 but for orthopedic patients, data have been limited to elective orthopedic populations.12‐14 We previously demonstrated that underweight hip‐fracture patients are at higher risk of postoperative cardiac complications at 1 year,15 consistent with studies of cardiac risk indices determining long‐term events. Because of different pathophysiologic mechanisms, the purpose of this study was to ascertain the influence of BMI on inpatient postoperative noncardiac medical complications and to assess predictors of such complications following urgent hip fracture repair.
Patients and Methods
All Olmsted County, Minnesota, residents undergoing urgent hip repair due to fracture were identified using the Rochester Epidemiology Project, a medical‐record linkage system funded by the Federal government since 1966 to support disease‐related epidemiology studies.16 All patient medical care is indexed, and both inpatient and outpatient visits are captured and available for review, allowing for complete case ascertainment. Medical care in Olmsted County is primarily provided by Mayo Clinic with its affiliated hospitals (St. Mary's and Rochester Methodist) and the Olmsted Medical Center, in addition to a few individual providers. Over 95% of all Olmsted County hip fracture surgeries are ultimately managed at St. Mary's Hospital.
Following approval by the Institutional Review Board we used this unique data resource to identify all residents with an International Classification of Diseases, 9th edition (ICD‐9) diagnosis code of 820 to 829 for hip fracture (n = 1310). Both sexes were included, and all patients included in the study provided research authorization for use of their medical records for research purposes.17 We excluded patients who were managed conservatively (n = 56), had a pathological fracture (n = 20), had multiple injuries (n = 19), were operated on >72 hours after fracture (n = 5), were aged <65 years (n = 2), or were admitted for reasons other than a fracture and experienced an in‐hospital fracture (n = 3). We subsequently excluded patients with missing information (n = 10). World Health Organization (WHO) criteria were used for classifying BMI: underweight (BMI < 18.5); normal (BMI = 18.5‐24.9); overweight (BMI = 25.0‐29.9); and obese (BMI 30.0).18
All data were abstracted using standardized collection forms by trained nurse abstractors blinded to the study hypothesis. Patients' admission height and weight were documented; if unavailable, the nearest data within 2 months prior to surgery were recorded. Patients' preadmission residence, functional status, baseline comorbidities, admission medications, discharge destination, as well as whether patients had an intensive care unit stay or any major surgeries in the past 90 days were abstracted. In addition, American Society of Anesthesia (ASA) class, type of anesthesia, and length of stay were also obtained. Inpatient complications that had been identified by the treating physicians and documented in the medical record or identified on imaging studies were assessed from the time of hip fracture repair to the time of discharge using standardized clinical criteria (Table 1). For criteria that were based on either objective findings or clinical documentation/suspicion, the patient was considered to meet the criteria of having a complication if they fulfilled either one. We did not include any cardiac outcomes, including congestive heart failure, angina, myocardial infarction, or arrhythmias that had been previously reported.15 Noncardiac complications were classified broadly: respiratory (respiratory failure, respiratory depression, or pulmonary hypoxemia); neurologic (any cerebral event including hemorrhagic or ischemic stroke, transient ischemic attack, or delirium); gastrointestinal (ileus or gastrointestinal bleeding); vascular (pulmonary embolus, or deep vein thrombosis); infectious (pneumonia, sepsis, urinary tract, wound, or cellulitis); renal/metabolic (acute renal failure, dehydration, or electrolyte abnormalities); or other (fractures or falls).
| Definition | Symptom |
|---|---|
| |
| Gastrointestinal | |
| Ileus | Dilated loops of bowel on X‐ray; documented ileus with nausea, vomiting, no stool or inability to take oral intake |
| Gastrointestinal bleeding | Sudden appearance of frank blood on nasogastric lavage or by rectum AND a decrease in hemoglobin of 2 g/dL or greater with no other suspected source of ongoing blood loss |
| Infectious | |
| Pneumonia | New infiltrate on chest x‐ray plus 2 of the following 3 findings: temperature >38C, elevated white cell count, sputum pathogen that requires antibiotic treatment |
| Bacteremia/sepsis | Localized infection with positive blood culture for the same pathogen AND chills, rigors, fever, elevated white cell count AND intravenous antibiotic treatment |
| Urinary tract infection | Pyuria symptoms |
| Positive gram stain symptoms | |
| Wound | |
| Cellulitis | As documented in physician's note of a superficial skin infection |
| Neurologic | |
| Cerebral eventhypoxia, thrombosis or hemorrhage | New neurologic dysfunction (hemiplegia, hemianesthesia, hemianopia, aphasia, or unconsciousness) postoperatively |
| Transient ischemic attack | Any neurologic dysfunction resolving within a 24‐hour period |
| Delirium | Positive Confusion Assessment Method38 |
| Renal/metabolic | |
| Renal failure | A doubling of baseline value of creatinine; serum creatinine >3.0 mg/dL; acute need for dialysis |
| Dehydration | As documented in the physician's note |
| Electrolyte abnormalities | Any laboratory evidence of abnormal electrolytes compared to normal |
| Respiratory | |
| Respiratory failure | Need for intubation and ventilation >24 hours postoperatively; need for reintubation and ventilation after 1 hour postoperatively |
| Respiratory depression | Respiratory arrest; PaCO2 >60 mmHg that provider believed was associated with narcotics |
| Pulmonary hypoxemia | SaO2 <90% with or without supplemental oxygen; supplemental oxygen >24 hours |
| Vascular | |
| Deep vein thrombosis | Positive lower extremity venous Doppler |
| Pulmonary embolism | Acute onset dyspnea and tachycardia, increased central venous pressure AND (positive ventilation/perfusion scan OR positive computed tomography OR positive pulmonary angiogram) |
| Other | |
| Fractures | Any in‐hospital documented fracture of any bone |
| Falls | Patients descending to the ground from any position unintentionally |
Continuous data are presented as means standard deviation and categorical data as counts and percentages. In testing for differences in patient demographics, past medical history, and baseline clinical data among BMI groups, Kruskal‐Wallis tests were performed for continuous variables and Fisher's Exact or Cochran‐Mantel‐Haenszel tests were used for discrete variables. Bonferroni adjustments were performed where appropriate. The primary outcome was the risk of any noncardiac medical complication during the postoperative hospitalization, based on patients with complications. Incidence rates were calculated for the overall group as well as for each BMI category. BMI was evaluated categorically according to the WHO criteria, as a continuous variable dichotomized as a BMI 18.5 kg/m2 to 24.9 kg/m2 (normal) vs. all others, and above/below 25.0 kg/m2. The effect of BMI and other potential risk factors on the complication rate was evaluated using logistic regression. The effect of BMI category on the overall complication rate was adjusted for the a priori risk factors of age, sex, surgical year, and ASA class both univariately (Model 1) and multivariately (Model 2). In addition to these variables, we also evaluated other potential risk factors, including baseline demographic and baseline clinical variables that were significant (P < 0.05) univariately using a stepwise selection; first forcing in BMI as a categorical variable (Model 3), then repeating the stepwise selection process without forcing in BMI (Model 4). Using data from Lawrence et al.,19 we estimated that we would have 80% power to detect differences in rates of inpatient noncardiac complications equal to an odds ratio (OR) = 2.2 (normal vs. underweight), OR = 2.0 (normal vs. overweight), and OR = 2.4 (normal vs. obese). Finally, because of power considerations, as an exploratory analysis, we additionally identified predictors of inpatient complications within each BMI category using stepwise selection. All statistical tests were 2‐sided, and P values <0.05 were considered significant. All analyses were performed using SAS for UNIX (version 9.1.3; SAS Institute, Inc., Cary, NC).
Results
Between 1988 and 2002, 1195 urgent repairs for hip fracture met our inclusion/exclusion criteria. We subsequently excluded 15 repairs with missing BMI data, and, of the 7 patients with >1 repair, we included only their first fracture episode in our analysis. Two were subsequently excluded due to an administrative error. Ultimately, 1180 hip fracture repairs were included in the analysis cohort. There were 184 (15.6%) patients in the underweight group, 640 (54.2%) with normal BMI, 251 (21.3%) with a BMI 25.0 to 29.9 kg/m2, and 105 (8.9%) with a BMI 30 kg/m2. Baseline characteristics are otherwise shown in Table 2. Normal BMI patients were significantly older than the other groups, and underweight patients were less likely to be admitted from home. Past history of having a cardiovascular risk factor or a cardiovascular diagnosis appeared to increase with increasing BMI. Underweight patients were more likely to have chronic obstructive pulmonary disease (COPD) than patients with normal BMI (P = 0.03) or overweight patients (P = 0.009), but not more than obese patients (P = 0.21). There were no differences across BMI groups in ASA class, type of anesthesia, intensive care unit stay, or length of stay.
| Variable | Underweight (<18.5 kg/m2) n = 184 n (%) | Normal (18.5‐24.9 kg/m2) n = 640 n (%) | Overweight (25‐29.9 kg/m2) n = 251 n (%) | Obese (30 kg/m2) n = 105 n (%) | P Value* |
|---|---|---|---|---|---|
| |||||
| Age (years) | 84.8 8.0 | 85.0 7.2 | 83.1 7.3 | 80.7 7.4 | <0.001 |
| Female sex | 171 (92.9) | 525 (82) | 177 (70.5) | 76 (72.4) | <0.001 |
| Preadmission residence | |||||
| ALC/SNF | 79 (42.9) | 250 (39.1) | 83 (33.1) | 36 (34.3) | 0.024 |
| Home | 105 (57.1) | 390 (60.9) | 168 (66.9) | 69 (65.7) | |
| Functional status | |||||
| Dependent | 25 (13.6) | 80 (12.5) | 24 (9.6) | 7 (6.7) | 0.044 |
| Walking independently | 159 (86.4) | 560 (87.5) | 226 (90.4) | 97 (93.3) | |
| History of | |||||
| Hypertension | 84 (45.7) | 374 (58.4) | 159 (63.3) | 70 (66.7) | <0.001 |
| Diabetes | 9 (4.9) | 71 (11.1) | 30 (12) | 30 (28.6) | <0.001 |
| Cerebrovascular disease | 40 (21.7) | 175 (27.3) | 77 (30.7) | 33 (31.4) | 0.028 |
| Myocardial infarction | 44 (23.9) | 140 (21.9) | 61 (24.3) | 36 (34.3) | 0.106 |
| Congestive heart failure | 48 (26.1) | 150 (23.4) | 76 (30.3) | 44 (41.9) | 0.003 |
| Atrial fibrillation/flutter | 49 (26.6) | 118 (18.4) | 57 (22.7) | 26 (24.8) | 0.985 |
| Chronic renal insufficiency | 11 (6) | 64 (10) | 34 (13.5) | 20 (19) | <0.001 |
| Dementia | 63 (34.2) | 233 (36.4) | 74 (29.5) | 26 (24.8) | 0.031 |
| Obstructive sleep apnea | 2 (1.1) | 5 (0.8) | 5 (2.0) | 6 (5.7) | 0.005 |
| COPD | 41 (22.3) | 100 (15.6) | 32 (12.7) | 17 (16.2) | 0.032 |
| Asthma | 13 (7.1) | 47 (7.3) | 18 (7.2) | 12 (11.4) | 0.395 |
| COPD or asthma | 49 (26.6) | 133 (20.8) | 45 (17.9) | 23 (21.9) | 0.093 |
| Pulmonary embolism or deep vein thrombosis | 9 (4.9) | 21 (3.3) | 21 (8.4) | 17 (16.2) | <0.001 |
| Osteoporosis | 77 (41.8) | 253 (39.5) | 73 (29.1) | 31 (29.5) | <0.001 |
| Collagen vascular diseases | 10 (5.4) | 29 (4.5) | 9 (3.6) | 12 (11.4) | 0.34 |
| Cancer | 61 (33.2) | 169 (26.4) | 75 (29.9) | 32 (30.5) | 0.88 |
| Lymphoma | 2 (1.1) | 3 (0.5) | 2 (0.8) | 2 (1.9) | 0.25 |
| Leukemia | 2 (1.1) | 3 (0.5) | 1 (0.4) | 1 (1) | |
| Major surgery within 90 days | 3 (1.6) | 10 (1.6) | 8 (3.2) | 3 (2.9) | 0.366 |
| ASA class | |||||
| I or II | 19 (10.4) | 93 (14.5) | 46 (18.3) | 12 (11.4) | 0.144 |
| III, IV, or V | 164 (89.6) | 547 (85.5) | 205 (81.7) | 93 (88.6) | |
| Type of anesthesia | |||||
| General | 134 (72.8) | 477 (74.5) | 192 (76.5) | 84 (80) | |
| Other (spinal, epidural, local, combination) | 50 (27.2) | 163 (25.5) | 59 (23.5) | 21 (20) | 0.16 |
| Admission medications | |||||
| Insulin | 2 (1.1) | 18 (2.8) | 11 (4.4) | 17 (16.2) | <0.001 |
| Aspirin | 50 (27.2) | 197 (30.8) | 82 (32.7) | 37 (35.2) | 0.126 |
| Beta‐blockers | 18 (9.8) | 90 (14.1) | 50 (19.9) | 25 (23.8) | <0.001 |
| ACE/ARB | 32 (17.4) | 95 (14.8) | 55 (21.9) | 28 (26.7) | 0.009 |
| Calcium‐channel blocker | 26 (14.1) | 104 (16.3) | 39 (15.5) | 21 (20) | 0.38 |
| Intensive care unit stay | 63 (34.2) | 154 (24.1) | 61 (24.3) | 30 (28.6) | 0.16 |
| Length of stay, days | 10.3 (9.7) | 9.7 (6.8) | 10.2 (7.6) | 11.1 (8.6) | 0.10 |
| Discharge destination | |||||
| Home | 20 (10.9) | 65 (10.2) | 43 (17.1) | 19 (18.1) | |
| ALC/nursing home | 146 (79.8) | 547 (85.5) | 199 (79.3) | 83 (79) | <0.001 |
| In‐hospital death | 17 (9.3) | 28 (4.4) | 9 (3.6) | 3 (2.9) | |
There were 77 (41.8%) postoperative inpatient noncardiac complications in the underweight group, 234 (36.6%) in the normal BMI group, 90 (35.9%) in the overweight group, and 42 (40.0%) in the obese group (P = 0.49). Figure 1 demonstrates the main subcategory complication rates by BMI group, and Table 3 outlines the univariate unadjusted complication rates. Other than gastrointestinal complications being more prevalent as BMI increases (P = 0.005), there were no significant differences in crude complication rates across BMI categories (all P > 0.05) for the other complication subcategories. A multiple comparisons analysis did not demonstrate any differences between normal and any of the other BMI categories for ileus. Normal BMI patients were more likely to be discharged to a nursing facility than overweight or obese patients (85.5% vs. 79.3%, P = 0.03; and 85.5% vs. 79.0%, P = 0.03, respectively). The proportion of in‐hospital deaths among underweight patients was significantly higher than in any of the other groups (9.3% vs. 4.4%; P = 0.01), but mean length of stay was not significantly different.

| Overall Cohort n (%) | Underweight (<18.5 kg/m2) n = 184 n (%) | Normal (18.5‐24.9 kg/m2) n = 640 n (%) | Overweight (25‐29.9 kg/m2) n = 251 n (%) | Obese (30 kg/m2) n = 105 n (%) | P Value | |
|---|---|---|---|---|---|---|
| ||||||
| Gastrointestinal | ||||||
| Ileus | 38 (3.2) | 1 (0.5) | 21 (3.3) | 12 (4.8) | 4 (3.8) | 0.03 |
| Gastrointestinal bleeding | 21 (1.8) | 1 (0.5) | 11 (1.7) | 6 (2.4) | 3 (2.9) | 0.35 |
| Infectious | ||||||
| Pneumonia | 69 (5.8) | 12 (6.5) | 39 (6.1) | 14 (5.6) | 4 (3.8) | 0.51 |
| Bacteremia/sepsis | 8 (0.7) | 1 (0.5) | 2 (0.3) | 5 (2.0) | 0 (0) | 0.06 |
| Urinary tract infection | 84 (7.1) | 12 (6.5) | 47 (7.3) | 15 (6) | 10 (9.5) | 0.78 |
| Wound | ||||||
| Cellulitis | ||||||
| Neurological | ||||||
| Cerebral event‐hypoxia, thrombosis or hemorrhage | 15 (1.3) | 1 (0.5) | 6 (0.9) | 6 (2.4) | 2 (1.9) | 0.21 |
| Transient ischemic attack | ||||||
| Delirium | 199 (16.9) | 40 (21.7) | 106 (16.6) | 36 (14.3) | 17 (16.2) | 0.08 |
| Renal/metabolic | ||||||
| Renal failure | 19 (1.6) | 3 (1.6) | 9 (1.4) | 5 (2.0) | 2 (1.9) | 0.82 |
| Dehydration | ||||||
| Electrolyte abnormalities | ||||||
| Respiratory | ||||||
| Respiratory failure | 53 (4.5) | 10 (5.4) | 23 (3.6) | 15 (6.0) | 5 (4.8) | 0.61 |
| Respiratory depression | 23 (1.9) | 3 (1.6) | 11 (1.7) | 8 (3.2) | 1 (1.0) | 0.50 |
| Pulmonary hypoxemia | 157 (13.3) | 33 (17.9) | 78 (12.2) | 34 (13.5) | 12 (11.4) | 0.22 |
| Vascular | ||||||
| Deep vein thrombosis | 5 (0.4) | 0 (0) | 2 (0.3) | 3 (1.2) | 0 (0) | 0.24 |
| Pulmonary embolism | 16 (1.4) | 3 (1.6) | 7 (1.1) | 5 (2.0) | 1 (1.0) | 0.65 |
| Other | ||||||
| Fractures | 6 (0.5) | 1 (0.5) | 5 (0.8) | 0 (0) | 0 (0) | 0.57 |
| Falls | ||||||
Significant univariate predictors of the composite outcome of any noncardiac complication included: age (OR, 1.04 95% confidence interval [CI>], 1.02‐1.06; P < 0.001), age 75 years (OR, 2.25; 95% CI, 1.52‐3.33; P < 0.001), age 85 years (OR, 1.49; 95% CI, 1.17‐1.89; P < 0.001), male sex (OR, 1.41; 95% CI, 1.05‐1.90; P = 0.02), admission from home (OR, 0.77; 95% CI, 0.61‐0.98; P = 0.03), a history of cerebrovascular disease (OR, 1.41; 95% CI, 1.08‐1.83; P = 0.01), myocardial infarction (OR, 1.41; 95% CI, 1.07‐1.86; P = 0.02), angina (OR, 1.32; 95% CI, 1.03‐1.69; P = 0.03), congestive heart failure (OR, 1.45; 95% CI, 1.11‐1.89; P = 0.006), dementia (OR, 1.39; 95% CI, 1.08‐1.78; P = 0.01), peripheral vascular disease (OR, 1.47; 95% CI, 1.06‐2.03; P = 0.02), COPD/asthma (OR, 1.56; 95% CI, 1.18‐2.08; P = 0.002), osteoarthritis (OR, 1.29; 95% CI, 1.01‐1.65; P = 0.04), code status as Do Not Resuscitate (OR, 0.74; 95% CI, 0.58‐0.94; P = 0.015), or ASA class III‐V (OR, 2.24; 95% CI, 1.53‐3.29; P < 0.001). Results were no different after using the Charlson comorbidity index in place of ASA class (data not shown). No significant differences in overall noncardiac complications were observed when examining BMI as a continuous variable, as a categorical variable, as 25 kg/m2 vs. <25 kg/m2, or as 18.5 kg/m2 to 24.9 kg/m2 vs. all others. Examining renal, respiratory, peripheral vascular, or neurologic complications univariately within these aforementioned strata also did not demonstrate any significant differences among BMI categories (data not shown).
Multivariable analyses (Models 1‐4) are shown for any overall noncardiac inpatient medical complication in Table 4. BMI was not a significant predictor in any of our models, specifically in our main model that examined the effect of BMI adjusting for a priori variables (Model 2). However, older age, male sex, and ASA class were highly significant predictors of complications in all four models; however, surgical year was nonsignificant. Notably, after stepwise selection for other demographic and premorbid variables, a history of COPD or asthma was found to be an additional significant factor both in Model 3 (forcing BMI in the model) and Model 4 (without BMI in the model). Exploratory analysis of individual predictors of inpatient noncardiac complications within each BMI category demonstrated that, in underweight patients, admission use of ‐blockers was a significant predictor of having any medical complication (OR, 3.1; 95% CI, 1.1‐8.60; P = 0.03). In normal BMI patients, age 75 years (OR, 2.6; 95% CI, 1.4‐4.9; P = 0.003), ASA class III‐V (OR, 2.3; 95% CI, 1.3‐3.9; P = 0.003), and a history of cerebrovascular disease (OR, 1.5; 95%CI, 1.04‐2.1; P = 0.03) were predictors; and, in obese patients, only age (OR, 1.1; 95% CI, 1.00‐1.12; P = 0.05) was significant. There were no significant predictors of having a medical complication in the overweight group.
| Underweight <18.5 kg/m2 n = 184* n (%) | Normal 18.5‐24.9 kg/m2 n = 640* n (%) | Overweight 25‐29.9 kg/m2 n = 251* n (%) | Obese 30 kg/m2 n = 105* n (%) | Age | Male Sex | Surgical Year | ASA Score, III‐V vs. I/II | COPD/ Asthma | |
|---|---|---|---|---|---|---|---|---|---|
| |||||||||
| Model 1a | 1.25 (0.89‐1.74) | Referent | 0.97 (0.72‐1.31) | 1.16 (0.76‐1.76) | |||||
| Model 1b | 1.26 (0.90‐1.77) | Referent | 1.05 (0.77‐1.43) | 1.38 (0.90‐2.13) | 1.04 (1.02‐1.06) | ||||
| Model 1c | 1.30 (0.93‐1.83) | Referent | 0.93 (0.68‐1.26) | 1.12 (0.73‐1.71) | 1.47 (1.09‐1.98) | ||||
| Model 1d | 1.28 (0.91‐1.79) | Referent | 0.97 (0.71‐1.31) | 1.13 (0.74‐1.73) | 1.03 (1.00‐1.06) | ||||
| Model 1e | 1.23 (0.88‐1.72) | Referent | 1.00 (0.73‐1.36) | 1.13 (0.74‐1.73) | 2.22 (1.52‐3.24) | ||||
| Model 2 | 1.33 (0.95‐1.88) | Referent | 1.01 (0.74‐1.38) | 1.28 (0.82‐1.98) | 1.04 (1.02‐1.06) | 1.59 (1.17‐2.17) | 1.02 (0.99‐1.05) | 1.89 (1.28‐2.79) | |
| Model 3∥ | 1.30 (0.92‐1.84) | Referent | 1.04 (0.76‐1.42) | 1.30 (0.84‐2.02) | 1.05 (1.03‐1.06) | 1.52 (1.11‐2.07) | 1.02 (0.99‐1.05) | 1.77 (1.20‐2.62) | 1.58 (1.17‐2.12) |
| Model 4 | 1.05 (1.03‐1.06) | 1.49 (1.10‐2.02) | 1.84 (1.25‐2.71) | 1.58 (1.18‐2.12) | |||||
Discussion
Most research describing the association of BMI with postoperative outcomes has concentrated on cardiac surgery, general surgical procedures, and intensive care unit utilization.8‐11,20 In the orthopedic literature, an elevated BMI has been associated with a higher number of short‐term complications, but this was limited to elective knee arthroplasty and spine surgery populations.12,13,21 Conversely, no differences were observed in obese patients undergoing hip arthroplasties.14,22 To the best of our knowledge, this study may be the first to examine the impact of BMI on inpatient hospital outcomes following urgent hip fracture repair. Our results suggest the risk of developing a noncardiac medical complication is the same regardless of BMI.
Our overall complication rate was higher (38%) than previous reports by others.19,23‐26 Thus, Lawrence et al.,19 in their retrospective study of 20 facilities, demonstrated an overall complication rate of 17%, even though they also included postoperative cardiac complications. Although their study period overlapped our own (1982‐1993), they additionally included patients aged 60 to 65 years, a population known to have fewer comorbidities and fewer postoperative complications than the elderly hip‐fracture patients studied here. In addition, their population may have been healthier at baseline, in that a higher proportion lived at home (73%) and a lower percentage were ASA class III‐V (71%) than our cohort. These differences in baseline characteristics may explain the higher complication rates observed in our study.
Our findings did not suggest any relationship of BMI with noncardiac postoperative medical complications in any of the 4 methods we used to stratify BMI (continuous, categorical, normal vs. abnormal, and 25 kg/m2). Evidence is contradictory as to what the effect of BMI has on postoperative complications. An elevated BMI (30 kg/m2) has been shown to lead to increased sternal wound infection and saphenous vein harvest infection in a cardiac surgery population,27 but other studies10,28,29 have demonstrated the opposite effect. Among 6336 patients undergoing elective general surgery procedures, the incidence of complications were similar by body mass.30 A matched study design that included urgent and emergent surgeries also did not find any appreciable increased perioperative risk in noncardiac surgery.28 Whether this may be due to the elective nature of the surgeries in these studies, hence leading to selection bias, is unknown.
In geriatric patients, multiple baseline comorbid conditions often are reflected in a higher ASA class, which increases the risk of significant perioperative complications. Our multivariate modeling showed that a high ASA class strongly predicts morbidity and mortality following hip fracture repair, in line with other studies.19,31,32 Although the Charlson comorbidity index could alternatively been used, we elected to adjust for ASA class as it is more commonly used and is simple to use. Interestingly, surgical year did not significantly predict any complication, which can suggest that practice changes play a minimal impact on patient outcomes. However, we caution that because the individual event rates, particularly vascular, were low, we were unable to fully determine whether changes in practice management, such as improved thromboprophylaxis, would impact event rates over time. Finally, other predictors such as older age33 and a concomitant history of either COPD or asthma,34 are well‐accepted predictors of inpatient complications. Our attempt to examine specific predictors of complications in each BMI category revealed differing results, making interpretations difficult. Because of power considerations, this was meant solely as an exploratory analysis, and larger cohorts are needed to further ascertain whether predictors are different in these groups. Such a study may in fact identify perioperative issues that allow practitioners caring for this population to modify these factors.
One of the major limitations in our study was our inability to adjust for individual complications using multivariable models, such as deep vein thrombosis or delirium, within each BMI stratum, because of statistical power issues. Such a study would require large numbers of individual complications or events to allow for appropriate adjustments. The authors acknowledge that such individual complication rates may vary dramatically. We were aware of this potential problem, and therefore a priori ascertained a composite outcome of any noncardiac medical complication. However, our results do provide preliminary information regarding the impact of BMI on noncardiac medical complications. Further studies would be needed, though, to fully determine the effect of BMI on the number of cases with each complication.
Obesity (or BMI) is a known cardiovascular risk factor, and our previous study's aim was to determine cardiovascular events in a comparable manner to the way risk indices, such as the Goldman, Lee, or the AHA preoperative algorithm function. The surgical literature often presents noncardiac complications separately, allowing us to directly compare our own data to other published studies. We used 2 separate approaches, focusing on the inpatient stay (ascertaining noncardiac complications) and 1‐year cardiac outcomes (cardiac complications), as these are mediated by different mechanisms and factors. Furthermore, the intent of both studies was to dispel any concerns that an elevated BMI would in fact lead to an increased number of complications. Whether cardiac complications, though, would impact noncardiac complications, or vice‐versa, is unknown, and would require further investigation.
Although we relied on well‐established definitions for body mass, they have often been challenged, as they may underestimate adiposity in the elderly population due to age‐related reductions in lean mass.35,36 Studies have demonstrated a poor correlation between percent body fat and BMI in the >65 year age group,37 which could impact our results and outcomes by misclassifying patients. Yet, as an anthropometric measurement, BMI is easily obtainable and its variables are routinely documented in patients' medical records, as compared to other anthropometric measurements. Other means of estimating adiposity, such as densitometry or computed tomography (CT) scanning, are impractical, expensive, and not used clinically but routinely in research settings. The lack of standardization in obtaining height and weight, despite nurse‐initiated protocols for bed calibration, may have introduced a degree of measurement bias. Furthermore, the extent of lean mass lost and volume status changes lead to further challenges of using BMI in hospital settings. Whether other anthropometric measurements, including hip circumference, waist circumference, or waist‐hip ratio, should be used in this group of patients requires further examination. However, despite its shortcomings in elderly patients, BMI is still deemed an appropriate surrogate for obesity.
Our main strength was the use of the Rochester Epidemiology Project medical record linkage system to ascertain all patient data. This focuses on patients from a single geographically‐defined community minimizing referral biases often observed in studies originating from a tertiary care referral center. Previous disease‐related epidemiology studies using the Olmsted County population have demonstrated excellent external validity to the U.S. white population.16 We relied on the medical documentation of the treating clinician for many diagnoses in our data abstraction. Although we attempted to use standardized definitions, clinicians may have inadvertently forgotten to document subjective signs or symptoms that would assist in the categorization of these complications. Hence, added inpatient complications may have been overlooked, suggesting that our results may slightly underestimate the true incidence in this population. Additionally, certain complications may overlap categories, such as pneumonia and infections. We agree with Lawrence et al.19 that long periods of time are necessary to accumulate data of this kind in an effort to describe complication rates epidemiologically.
Despite no difference in outcomes among BMI categories, our results have striking implications for the hospitalized patient. Thus, underweight elderly patients, often considered frail with minimal functional reserve, are at no higher risk for developing inpatient medical complications than patients with higher BMIs. This is contrary to our study focusing on cardiac complications, where underweight patients were at higher risk.15 Conversely, obese patients, who have been demonstrated to be at higher risk of medical complications (particularly pulmonary), had no greater risk than patients with normal BMI. To the practicing geriatrician and hospitalist, this information provides important prognostication regarding additional perioperative measures that need to be implemented in these different groups. Based on our results, BMI does not play a particular role in noncardiac medical complications, dispelling any myths of the added burden of excess weight on surgical outcomes in this population. From a hospital perspective, this may be important since additional testing or preventative management in these patients may lead to additional resource use. However, in‐hospital deaths were higher in underweight patients than in patients with a normal BMI. Although we were underpowered to detect any differences in mortality between groups and could therefore not adjust for additional variables, it is unknown whether cardiac or noncardiac complications may be a stronger predictor of death in the underweight patient population. Further studies would be needed to better ascertain this relationship.
Conclusions
In elderly patients undergoing urgent hip fracture repair, BMI does not appear to lead to an excess rate of inpatient noncardiac complications. Our results are the first to demonstrate that BMI has no impact on morbidity in this patient population. Further research on the influence of body composition on inpatient complications in this population is needed to accurately allow for appropriate perioperative prophylaxis. Whether BMI impacts specific complications or in‐patient mortality in this population still requires investigation.
Acknowledgements
The authors thank Donna K. Lawson, LPN, Kathy Wolfert, and Cherie Dolliver, for their assistance in data collection and management.
- , .The effect of longevity on spending for acute and long‐term care.N Engl J Med.2000;342(19):1409–1415.
- , , , .Excess deaths associated with underweight, overweight, and obesity.JAMA.2005;293(15):1861–1867.
- .Adverse outcomes of osteoporotic fractures in the general population.J Bone Miner Res.2003;18(6):1139–1141.
- , , , , , .Incidence and economic burden of osteoporosis‐related fractures in the United States, 2005–2025.J Bone Miner Res.2007;22(3):465–475.
- , .Medical care of elderly patients with hip fractures.Mayo Clin Proc.2001;76(3):295–298.
- , , , et al.Effects of a hospitalist model on elderly patients with hip fracture.Arch Intern Med.2005;165(7):796–801.
- , , , et al.Body mass index as a predictor of fracture risk: a meta‐analysis.Osteoporos Int.2005;16(11):1330–1338.
- , , , , .Increased body mass index predicts increased blood loss during radical cystectomy.J Urol.2004;171(3):1077–1079.
- , , , .Laparoscopic colorectal surgery in obese and nonobese patients: do differences in body mass indices lead to different outcomes?Surg Endosc.2004;18(10):1452–1456.
- , , , , , .The relationship of body mass index to outcomes after percutaneous coronary intervention.J Interv Cardiol.2006;19(5):388–395.
- , , , , , .Is extreme obesity a risk factor for cardiac surgery? An analysis of patients with a BMI ≥40.Eur J Cardiothorac Surg.2006;29(4):434–440.
- , , , , , .Perioperative morbidity following total knee arthroplasty among obese patients.J Knee Surg.2002;15(2):77–83.
- , , , et al.Obesity and spine surgery: relation to perioperative complications.J Neurosurg Spine.2007;6(4):291–297.
- , , , .The influence of obesity on perioperative morbidity and mortality in revision total hip arthroplasty.Arch Orthop Trauma Surg.2000;120(5–6):267–271.
- , , , et al.Body mass index and risk of adverse cardiac events in elderly hip fracture patients: a population‐based study.J Am Geriatr Soc.2009;57(3):419–426.
- .History of the Rochester Epidemiology Project.Mayo Clin Proc.1996;71(3):266–274.
- .The threat to medical‐records research.N Engl J Med.1997;337(20):1466–170.
- .A Treatise on Man and the Development of His Faculties.Brussels:Musquardt;1871.
- , , , , .Medical complications and outcomes after hip fracture repair.Arch Intern Med.2002;162(18):2053–2057.
- , , .Effect of obesity on intensive care morbidity and mortality: a meta‐analysis.Crit Care Med.2008;36(1):151–158.
- , .Relationship of body mass index to early complications in knee replacement surgery.Arch Orthop Trauma Surg.2008;128(1):5–9.
- , , , , , .Obesity in total hip replacement.J Bone Joint Surg Br.2008;90(4):424–429.
- , , , et al.Use of an intramedullary hip‐screw compared with a compression hip‐screw with a plate for intertrochanteric femoral fractures. A prospective, randomized study of one hundred patients.J Bone Joint Surg Am.1998;80(5):618–630.
- .Blood transfusion requirements in intracapsular femoral neck fractures.Injury.1996;27(10):709–711.
- , , , .Risk prediction in operatively treated fractures of the hip.Clin Orthop Relat Res.1993(293):148–152.
- .Internal fixation or arthroplasty for displaced subcapital fractures in the elderly?Injury.1992;23(8):521–524.
- , , , et al.Impact of body mass index and albumin on morbidity and mortality after cardiac surgery.J Thorac Cardiovasc Surg.1999;118(5):866–873.
- , , , et al.Increased body mass index and peri‐operative risk in patients undergoing non‐cardiac surgery.Obes Surg.2004;14(2):275–281.
- , , , et al.Effects of body size on operative, intermediate, and long‐term outcomes after coronary artery bypass operation.Ann Thorac Surg.2001;71(2):521–530; discussion 530–531.
- , , , .Obesity in general elective surgery.Lancet.2003;361(9374):2032–2035.
- , , , et al.Effects of a hospitalist care model on mortality of elderly patients with hip fractures.J Hosp Med.2007;2(4):219–225.
- , , , .Morbidity and mortality after hip fracture: the impact of operative delay.Arch Orthop Trauma Surg.2004;124(5):334–340.
- , , , , .Outcome after hip fracture in individuals ninety years of age and older.J Orthop Trauma.2001;15(1):34–39.
- , , , et al.Development and initial validation of a risk score for predicting in‐hospital and 1‐year mortality in patients with hip fractures.J Bone Miner Res.2005;20(3):494–500.
- , , , , , .How useful is body mass index for comparison of body fatness across age, sex, and ethnic groups?Am J Epidemiol.1996;143(3):228–239.
- , , , , .Reassessment of body mass indices.Am J Clin Nutr.1990;52(3):405–408.
- , , , et al.Accuracy of body mass index in diagnosing obesity in the adult general population.Int J Obes (Lond).2008;32(6):959–966.
- , , , , , .Clarifying confusion: the confusion assessment method. A new method for detection of delirium.Ann Intern Med.1990;113(12):941–948.
Public health concerns such as the aging population1 and the increasing prevalence of obesity2 are also important issues to hospitals. However, little attention has been given to the interface of obesity and the elderly, largely due to the dearth of studies that include elderly patients. An aging population leads to an increase in geriatric syndromes, such as osteoporosis3 and its most devastating complication, hip fracture.4 These frail, hip‐fracture patients pose management challenges to practicing geriatricians and hospitalists.5,6 Furthermore, although fracture risk is inversely correlated to body mass index (BMI),7 this relationship has yet to be fully examined in the postoperative hip‐fracture population. In other surgical settings, there is disagreement as to whether underweight or obese patients are at higher risk of developing medical complications,8‐11 but for orthopedic patients, data have been limited to elective orthopedic populations.12‐14 We previously demonstrated that underweight hip‐fracture patients are at higher risk of postoperative cardiac complications at 1 year,15 consistent with studies of cardiac risk indices determining long‐term events. Because of different pathophysiologic mechanisms, the purpose of this study was to ascertain the influence of BMI on inpatient postoperative noncardiac medical complications and to assess predictors of such complications following urgent hip fracture repair.
Patients and Methods
All Olmsted County, Minnesota, residents undergoing urgent hip repair due to fracture were identified using the Rochester Epidemiology Project, a medical‐record linkage system funded by the Federal government since 1966 to support disease‐related epidemiology studies.16 All patient medical care is indexed, and both inpatient and outpatient visits are captured and available for review, allowing for complete case ascertainment. Medical care in Olmsted County is primarily provided by Mayo Clinic with its affiliated hospitals (St. Mary's and Rochester Methodist) and the Olmsted Medical Center, in addition to a few individual providers. Over 95% of all Olmsted County hip fracture surgeries are ultimately managed at St. Mary's Hospital.
Following approval by the Institutional Review Board we used this unique data resource to identify all residents with an International Classification of Diseases, 9th edition (ICD‐9) diagnosis code of 820 to 829 for hip fracture (n = 1310). Both sexes were included, and all patients included in the study provided research authorization for use of their medical records for research purposes.17 We excluded patients who were managed conservatively (n = 56), had a pathological fracture (n = 20), had multiple injuries (n = 19), were operated on >72 hours after fracture (n = 5), were aged <65 years (n = 2), or were admitted for reasons other than a fracture and experienced an in‐hospital fracture (n = 3). We subsequently excluded patients with missing information (n = 10). World Health Organization (WHO) criteria were used for classifying BMI: underweight (BMI < 18.5); normal (BMI = 18.5‐24.9); overweight (BMI = 25.0‐29.9); and obese (BMI 30.0).18
All data were abstracted using standardized collection forms by trained nurse abstractors blinded to the study hypothesis. Patients' admission height and weight were documented; if unavailable, the nearest data within 2 months prior to surgery were recorded. Patients' preadmission residence, functional status, baseline comorbidities, admission medications, discharge destination, as well as whether patients had an intensive care unit stay or any major surgeries in the past 90 days were abstracted. In addition, American Society of Anesthesia (ASA) class, type of anesthesia, and length of stay were also obtained. Inpatient complications that had been identified by the treating physicians and documented in the medical record or identified on imaging studies were assessed from the time of hip fracture repair to the time of discharge using standardized clinical criteria (Table 1). For criteria that were based on either objective findings or clinical documentation/suspicion, the patient was considered to meet the criteria of having a complication if they fulfilled either one. We did not include any cardiac outcomes, including congestive heart failure, angina, myocardial infarction, or arrhythmias that had been previously reported.15 Noncardiac complications were classified broadly: respiratory (respiratory failure, respiratory depression, or pulmonary hypoxemia); neurologic (any cerebral event including hemorrhagic or ischemic stroke, transient ischemic attack, or delirium); gastrointestinal (ileus or gastrointestinal bleeding); vascular (pulmonary embolus, or deep vein thrombosis); infectious (pneumonia, sepsis, urinary tract, wound, or cellulitis); renal/metabolic (acute renal failure, dehydration, or electrolyte abnormalities); or other (fractures or falls).
| Definition | Symptom |
|---|---|
| |
| Gastrointestinal | |
| Ileus | Dilated loops of bowel on X‐ray; documented ileus with nausea, vomiting, no stool or inability to take oral intake |
| Gastrointestinal bleeding | Sudden appearance of frank blood on nasogastric lavage or by rectum AND a decrease in hemoglobin of 2 g/dL or greater with no other suspected source of ongoing blood loss |
| Infectious | |
| Pneumonia | New infiltrate on chest x‐ray plus 2 of the following 3 findings: temperature >38C, elevated white cell count, sputum pathogen that requires antibiotic treatment |
| Bacteremia/sepsis | Localized infection with positive blood culture for the same pathogen AND chills, rigors, fever, elevated white cell count AND intravenous antibiotic treatment |
| Urinary tract infection | Pyuria symptoms |
| Positive gram stain symptoms | |
| Wound | |
| Cellulitis | As documented in physician's note of a superficial skin infection |
| Neurologic | |
| Cerebral eventhypoxia, thrombosis or hemorrhage | New neurologic dysfunction (hemiplegia, hemianesthesia, hemianopia, aphasia, or unconsciousness) postoperatively |
| Transient ischemic attack | Any neurologic dysfunction resolving within a 24‐hour period |
| Delirium | Positive Confusion Assessment Method38 |
| Renal/metabolic | |
| Renal failure | A doubling of baseline value of creatinine; serum creatinine >3.0 mg/dL; acute need for dialysis |
| Dehydration | As documented in the physician's note |
| Electrolyte abnormalities | Any laboratory evidence of abnormal electrolytes compared to normal |
| Respiratory | |
| Respiratory failure | Need for intubation and ventilation >24 hours postoperatively; need for reintubation and ventilation after 1 hour postoperatively |
| Respiratory depression | Respiratory arrest; PaCO2 >60 mmHg that provider believed was associated with narcotics |
| Pulmonary hypoxemia | SaO2 <90% with or without supplemental oxygen; supplemental oxygen >24 hours |
| Vascular | |
| Deep vein thrombosis | Positive lower extremity venous Doppler |
| Pulmonary embolism | Acute onset dyspnea and tachycardia, increased central venous pressure AND (positive ventilation/perfusion scan OR positive computed tomography OR positive pulmonary angiogram) |
| Other | |
| Fractures | Any in‐hospital documented fracture of any bone |
| Falls | Patients descending to the ground from any position unintentionally |
Continuous data are presented as means standard deviation and categorical data as counts and percentages. In testing for differences in patient demographics, past medical history, and baseline clinical data among BMI groups, Kruskal‐Wallis tests were performed for continuous variables and Fisher's Exact or Cochran‐Mantel‐Haenszel tests were used for discrete variables. Bonferroni adjustments were performed where appropriate. The primary outcome was the risk of any noncardiac medical complication during the postoperative hospitalization, based on patients with complications. Incidence rates were calculated for the overall group as well as for each BMI category. BMI was evaluated categorically according to the WHO criteria, as a continuous variable dichotomized as a BMI 18.5 kg/m2 to 24.9 kg/m2 (normal) vs. all others, and above/below 25.0 kg/m2. The effect of BMI and other potential risk factors on the complication rate was evaluated using logistic regression. The effect of BMI category on the overall complication rate was adjusted for the a priori risk factors of age, sex, surgical year, and ASA class both univariately (Model 1) and multivariately (Model 2). In addition to these variables, we also evaluated other potential risk factors, including baseline demographic and baseline clinical variables that were significant (P < 0.05) univariately using a stepwise selection; first forcing in BMI as a categorical variable (Model 3), then repeating the stepwise selection process without forcing in BMI (Model 4). Using data from Lawrence et al.,19 we estimated that we would have 80% power to detect differences in rates of inpatient noncardiac complications equal to an odds ratio (OR) = 2.2 (normal vs. underweight), OR = 2.0 (normal vs. overweight), and OR = 2.4 (normal vs. obese). Finally, because of power considerations, as an exploratory analysis, we additionally identified predictors of inpatient complications within each BMI category using stepwise selection. All statistical tests were 2‐sided, and P values <0.05 were considered significant. All analyses were performed using SAS for UNIX (version 9.1.3; SAS Institute, Inc., Cary, NC).
Results
Between 1988 and 2002, 1195 urgent repairs for hip fracture met our inclusion/exclusion criteria. We subsequently excluded 15 repairs with missing BMI data, and, of the 7 patients with >1 repair, we included only their first fracture episode in our analysis. Two were subsequently excluded due to an administrative error. Ultimately, 1180 hip fracture repairs were included in the analysis cohort. There were 184 (15.6%) patients in the underweight group, 640 (54.2%) with normal BMI, 251 (21.3%) with a BMI 25.0 to 29.9 kg/m2, and 105 (8.9%) with a BMI 30 kg/m2. Baseline characteristics are otherwise shown in Table 2. Normal BMI patients were significantly older than the other groups, and underweight patients were less likely to be admitted from home. Past history of having a cardiovascular risk factor or a cardiovascular diagnosis appeared to increase with increasing BMI. Underweight patients were more likely to have chronic obstructive pulmonary disease (COPD) than patients with normal BMI (P = 0.03) or overweight patients (P = 0.009), but not more than obese patients (P = 0.21). There were no differences across BMI groups in ASA class, type of anesthesia, intensive care unit stay, or length of stay.
| Variable | Underweight (<18.5 kg/m2) n = 184 n (%) | Normal (18.5‐24.9 kg/m2) n = 640 n (%) | Overweight (25‐29.9 kg/m2) n = 251 n (%) | Obese (30 kg/m2) n = 105 n (%) | P Value* |
|---|---|---|---|---|---|
| |||||
| Age (years) | 84.8 8.0 | 85.0 7.2 | 83.1 7.3 | 80.7 7.4 | <0.001 |
| Female sex | 171 (92.9) | 525 (82) | 177 (70.5) | 76 (72.4) | <0.001 |
| Preadmission residence | |||||
| ALC/SNF | 79 (42.9) | 250 (39.1) | 83 (33.1) | 36 (34.3) | 0.024 |
| Home | 105 (57.1) | 390 (60.9) | 168 (66.9) | 69 (65.7) | |
| Functional status | |||||
| Dependent | 25 (13.6) | 80 (12.5) | 24 (9.6) | 7 (6.7) | 0.044 |
| Walking independently | 159 (86.4) | 560 (87.5) | 226 (90.4) | 97 (93.3) | |
| History of | |||||
| Hypertension | 84 (45.7) | 374 (58.4) | 159 (63.3) | 70 (66.7) | <0.001 |
| Diabetes | 9 (4.9) | 71 (11.1) | 30 (12) | 30 (28.6) | <0.001 |
| Cerebrovascular disease | 40 (21.7) | 175 (27.3) | 77 (30.7) | 33 (31.4) | 0.028 |
| Myocardial infarction | 44 (23.9) | 140 (21.9) | 61 (24.3) | 36 (34.3) | 0.106 |
| Congestive heart failure | 48 (26.1) | 150 (23.4) | 76 (30.3) | 44 (41.9) | 0.003 |
| Atrial fibrillation/flutter | 49 (26.6) | 118 (18.4) | 57 (22.7) | 26 (24.8) | 0.985 |
| Chronic renal insufficiency | 11 (6) | 64 (10) | 34 (13.5) | 20 (19) | <0.001 |
| Dementia | 63 (34.2) | 233 (36.4) | 74 (29.5) | 26 (24.8) | 0.031 |
| Obstructive sleep apnea | 2 (1.1) | 5 (0.8) | 5 (2.0) | 6 (5.7) | 0.005 |
| COPD | 41 (22.3) | 100 (15.6) | 32 (12.7) | 17 (16.2) | 0.032 |
| Asthma | 13 (7.1) | 47 (7.3) | 18 (7.2) | 12 (11.4) | 0.395 |
| COPD or asthma | 49 (26.6) | 133 (20.8) | 45 (17.9) | 23 (21.9) | 0.093 |
| Pulmonary embolism or deep vein thrombosis | 9 (4.9) | 21 (3.3) | 21 (8.4) | 17 (16.2) | <0.001 |
| Osteoporosis | 77 (41.8) | 253 (39.5) | 73 (29.1) | 31 (29.5) | <0.001 |
| Collagen vascular diseases | 10 (5.4) | 29 (4.5) | 9 (3.6) | 12 (11.4) | 0.34 |
| Cancer | 61 (33.2) | 169 (26.4) | 75 (29.9) | 32 (30.5) | 0.88 |
| Lymphoma | 2 (1.1) | 3 (0.5) | 2 (0.8) | 2 (1.9) | 0.25 |
| Leukemia | 2 (1.1) | 3 (0.5) | 1 (0.4) | 1 (1) | |
| Major surgery within 90 days | 3 (1.6) | 10 (1.6) | 8 (3.2) | 3 (2.9) | 0.366 |
| ASA class | |||||
| I or II | 19 (10.4) | 93 (14.5) | 46 (18.3) | 12 (11.4) | 0.144 |
| III, IV, or V | 164 (89.6) | 547 (85.5) | 205 (81.7) | 93 (88.6) | |
| Type of anesthesia | |||||
| General | 134 (72.8) | 477 (74.5) | 192 (76.5) | 84 (80) | |
| Other (spinal, epidural, local, combination) | 50 (27.2) | 163 (25.5) | 59 (23.5) | 21 (20) | 0.16 |
| Admission medications | |||||
| Insulin | 2 (1.1) | 18 (2.8) | 11 (4.4) | 17 (16.2) | <0.001 |
| Aspirin | 50 (27.2) | 197 (30.8) | 82 (32.7) | 37 (35.2) | 0.126 |
| Beta‐blockers | 18 (9.8) | 90 (14.1) | 50 (19.9) | 25 (23.8) | <0.001 |
| ACE/ARB | 32 (17.4) | 95 (14.8) | 55 (21.9) | 28 (26.7) | 0.009 |
| Calcium‐channel blocker | 26 (14.1) | 104 (16.3) | 39 (15.5) | 21 (20) | 0.38 |
| Intensive care unit stay | 63 (34.2) | 154 (24.1) | 61 (24.3) | 30 (28.6) | 0.16 |
| Length of stay, days | 10.3 (9.7) | 9.7 (6.8) | 10.2 (7.6) | 11.1 (8.6) | 0.10 |
| Discharge destination | |||||
| Home | 20 (10.9) | 65 (10.2) | 43 (17.1) | 19 (18.1) | |
| ALC/nursing home | 146 (79.8) | 547 (85.5) | 199 (79.3) | 83 (79) | <0.001 |
| In‐hospital death | 17 (9.3) | 28 (4.4) | 9 (3.6) | 3 (2.9) | |
There were 77 (41.8%) postoperative inpatient noncardiac complications in the underweight group, 234 (36.6%) in the normal BMI group, 90 (35.9%) in the overweight group, and 42 (40.0%) in the obese group (P = 0.49). Figure 1 demonstrates the main subcategory complication rates by BMI group, and Table 3 outlines the univariate unadjusted complication rates. Other than gastrointestinal complications being more prevalent as BMI increases (P = 0.005), there were no significant differences in crude complication rates across BMI categories (all P > 0.05) for the other complication subcategories. A multiple comparisons analysis did not demonstrate any differences between normal and any of the other BMI categories for ileus. Normal BMI patients were more likely to be discharged to a nursing facility than overweight or obese patients (85.5% vs. 79.3%, P = 0.03; and 85.5% vs. 79.0%, P = 0.03, respectively). The proportion of in‐hospital deaths among underweight patients was significantly higher than in any of the other groups (9.3% vs. 4.4%; P = 0.01), but mean length of stay was not significantly different.
| Overall Cohort n (%) | Underweight (<18.5 kg/m2) n = 184 n (%) | Normal (18.5‐24.9 kg/m2) n = 640 n (%) | Overweight (25‐29.9 kg/m2) n = 251 n (%) | Obese (30 kg/m2) n = 105 n (%) | P Value | |
|---|---|---|---|---|---|---|
| ||||||
| Gastrointestinal | ||||||
| Ileus | 38 (3.2) | 1 (0.5) | 21 (3.3) | 12 (4.8) | 4 (3.8) | 0.03 |
| Gastrointestinal bleeding | 21 (1.8) | 1 (0.5) | 11 (1.7) | 6 (2.4) | 3 (2.9) | 0.35 |
| Infectious | ||||||
| Pneumonia | 69 (5.8) | 12 (6.5) | 39 (6.1) | 14 (5.6) | 4 (3.8) | 0.51 |
| Bacteremia/sepsis | 8 (0.7) | 1 (0.5) | 2 (0.3) | 5 (2.0) | 0 (0) | 0.06 |
| Urinary tract infection | 84 (7.1) | 12 (6.5) | 47 (7.3) | 15 (6) | 10 (9.5) | 0.78 |
| Wound | ||||||
| Cellulitis | ||||||
| Neurological | ||||||
| Cerebral event‐hypoxia, thrombosis or hemorrhage | 15 (1.3) | 1 (0.5) | 6 (0.9) | 6 (2.4) | 2 (1.9) | 0.21 |
| Transient ischemic attack | ||||||
| Delirium | 199 (16.9) | 40 (21.7) | 106 (16.6) | 36 (14.3) | 17 (16.2) | 0.08 |
| Renal/metabolic | ||||||
| Renal failure | 19 (1.6) | 3 (1.6) | 9 (1.4) | 5 (2.0) | 2 (1.9) | 0.82 |
| Dehydration | ||||||
| Electrolyte abnormalities | ||||||
| Respiratory | ||||||
| Respiratory failure | 53 (4.5) | 10 (5.4) | 23 (3.6) | 15 (6.0) | 5 (4.8) | 0.61 |
| Respiratory depression | 23 (1.9) | 3 (1.6) | 11 (1.7) | 8 (3.2) | 1 (1.0) | 0.50 |
| Pulmonary hypoxemia | 157 (13.3) | 33 (17.9) | 78 (12.2) | 34 (13.5) | 12 (11.4) | 0.22 |
| Vascular | ||||||
| Deep vein thrombosis | 5 (0.4) | 0 (0) | 2 (0.3) | 3 (1.2) | 0 (0) | 0.24 |
| Pulmonary embolism | 16 (1.4) | 3 (1.6) | 7 (1.1) | 5 (2.0) | 1 (1.0) | 0.65 |
| Other | ||||||
| Fractures | 6 (0.5) | 1 (0.5) | 5 (0.8) | 0 (0) | 0 (0) | 0.57 |
| Falls | ||||||
Significant univariate predictors of the composite outcome of any noncardiac complication included: age (OR, 1.04 95% confidence interval [CI>], 1.02‐1.06; P < 0.001), age 75 years (OR, 2.25; 95% CI, 1.52‐3.33; P < 0.001), age 85 years (OR, 1.49; 95% CI, 1.17‐1.89; P < 0.001), male sex (OR, 1.41; 95% CI, 1.05‐1.90; P = 0.02), admission from home (OR, 0.77; 95% CI, 0.61‐0.98; P = 0.03), a history of cerebrovascular disease (OR, 1.41; 95% CI, 1.08‐1.83; P = 0.01), myocardial infarction (OR, 1.41; 95% CI, 1.07‐1.86; P = 0.02), angina (OR, 1.32; 95% CI, 1.03‐1.69; P = 0.03), congestive heart failure (OR, 1.45; 95% CI, 1.11‐1.89; P = 0.006), dementia (OR, 1.39; 95% CI, 1.08‐1.78; P = 0.01), peripheral vascular disease (OR, 1.47; 95% CI, 1.06‐2.03; P = 0.02), COPD/asthma (OR, 1.56; 95% CI, 1.18‐2.08; P = 0.002), osteoarthritis (OR, 1.29; 95% CI, 1.01‐1.65; P = 0.04), code status as Do Not Resuscitate (OR, 0.74; 95% CI, 0.58‐0.94; P = 0.015), or ASA class III‐V (OR, 2.24; 95% CI, 1.53‐3.29; P < 0.001). Results were no different after using the Charlson comorbidity index in place of ASA class (data not shown). No significant differences in overall noncardiac complications were observed when examining BMI as a continuous variable, as a categorical variable, as 25 kg/m2 vs. <25 kg/m2, or as 18.5 kg/m2 to 24.9 kg/m2 vs. all others. Examining renal, respiratory, peripheral vascular, or neurologic complications univariately within these aforementioned strata also did not demonstrate any significant differences among BMI categories (data not shown).
Multivariable analyses (Models 1‐4) are shown for any overall noncardiac inpatient medical complication in Table 4. BMI was not a significant predictor in any of our models, specifically in our main model that examined the effect of BMI adjusting for a priori variables (Model 2). However, older age, male sex, and ASA class were highly significant predictors of complications in all four models; however, surgical year was nonsignificant. Notably, after stepwise selection for other demographic and premorbid variables, a history of COPD or asthma was found to be an additional significant factor both in Model 3 (forcing BMI in the model) and Model 4 (without BMI in the model). Exploratory analysis of individual predictors of inpatient noncardiac complications within each BMI category demonstrated that, in underweight patients, admission use of ‐blockers was a significant predictor of having any medical complication (OR, 3.1; 95% CI, 1.1‐8.60; P = 0.03). In normal BMI patients, age 75 years (OR, 2.6; 95% CI, 1.4‐4.9; P = 0.003), ASA class III‐V (OR, 2.3; 95% CI, 1.3‐3.9; P = 0.003), and a history of cerebrovascular disease (OR, 1.5; 95%CI, 1.04‐2.1; P = 0.03) were predictors; and, in obese patients, only age (OR, 1.1; 95% CI, 1.00‐1.12; P = 0.05) was significant. There were no significant predictors of having a medical complication in the overweight group.
| Underweight <18.5 kg/m2 n = 184* n (%) | Normal 18.5‐24.9 kg/m2 n = 640* n (%) | Overweight 25‐29.9 kg/m2 n = 251* n (%) | Obese 30 kg/m2 n = 105* n (%) | Age | Male Sex | Surgical Year | ASA Score, III‐V vs. I/II | COPD/ Asthma | |
|---|---|---|---|---|---|---|---|---|---|
| |||||||||
| Model 1a | 1.25 (0.89‐1.74) | Referent | 0.97 (0.72‐1.31) | 1.16 (0.76‐1.76) | |||||
| Model 1b | 1.26 (0.90‐1.77) | Referent | 1.05 (0.77‐1.43) | 1.38 (0.90‐2.13) | 1.04 (1.02‐1.06) | ||||
| Model 1c | 1.30 (0.93‐1.83) | Referent | 0.93 (0.68‐1.26) | 1.12 (0.73‐1.71) | 1.47 (1.09‐1.98) | ||||
| Model 1d | 1.28 (0.91‐1.79) | Referent | 0.97 (0.71‐1.31) | 1.13 (0.74‐1.73) | 1.03 (1.00‐1.06) | ||||
| Model 1e | 1.23 (0.88‐1.72) | Referent | 1.00 (0.73‐1.36) | 1.13 (0.74‐1.73) | 2.22 (1.52‐3.24) | ||||
| Model 2 | 1.33 (0.95‐1.88) | Referent | 1.01 (0.74‐1.38) | 1.28 (0.82‐1.98) | 1.04 (1.02‐1.06) | 1.59 (1.17‐2.17) | 1.02 (0.99‐1.05) | 1.89 (1.28‐2.79) | |
| Model 3∥ | 1.30 (0.92‐1.84) | Referent | 1.04 (0.76‐1.42) | 1.30 (0.84‐2.02) | 1.05 (1.03‐1.06) | 1.52 (1.11‐2.07) | 1.02 (0.99‐1.05) | 1.77 (1.20‐2.62) | 1.58 (1.17‐2.12) |
| Model 4 | 1.05 (1.03‐1.06) | 1.49 (1.10‐2.02) | 1.84 (1.25‐2.71) | 1.58 (1.18‐2.12) | |||||
Discussion
Most research describing the association of BMI with postoperative outcomes has concentrated on cardiac surgery, general surgical procedures, and intensive care unit utilization.8‐11,20 In the orthopedic literature, an elevated BMI has been associated with a higher number of short‐term complications, but this was limited to elective knee arthroplasty and spine surgery populations.12,13,21 Conversely, no differences were observed in obese patients undergoing hip arthroplasties.14,22 To the best of our knowledge, this study may be the first to examine the impact of BMI on inpatient hospital outcomes following urgent hip fracture repair. Our results suggest the risk of developing a noncardiac medical complication is the same regardless of BMI.
Our overall complication rate was higher (38%) than previous reports by others.19,23‐26 Thus, Lawrence et al.,19 in their retrospective study of 20 facilities, demonstrated an overall complication rate of 17%, even though they also included postoperative cardiac complications. Although their study period overlapped our own (1982‐1993), they additionally included patients aged 60 to 65 years, a population known to have fewer comorbidities and fewer postoperative complications than the elderly hip‐fracture patients studied here. In addition, their population may have been healthier at baseline, in that a higher proportion lived at home (73%) and a lower percentage were ASA class III‐V (71%) than our cohort. These differences in baseline characteristics may explain the higher complication rates observed in our study.
Our findings did not suggest any relationship of BMI with noncardiac postoperative medical complications in any of the 4 methods we used to stratify BMI (continuous, categorical, normal vs. abnormal, and 25 kg/m2). Evidence is contradictory as to what the effect of BMI has on postoperative complications. An elevated BMI (30 kg/m2) has been shown to lead to increased sternal wound infection and saphenous vein harvest infection in a cardiac surgery population,27 but other studies10,28,29 have demonstrated the opposite effect. Among 6336 patients undergoing elective general surgery procedures, the incidence of complications were similar by body mass.30 A matched study design that included urgent and emergent surgeries also did not find any appreciable increased perioperative risk in noncardiac surgery.28 Whether this may be due to the elective nature of the surgeries in these studies, hence leading to selection bias, is unknown.
In geriatric patients, multiple baseline comorbid conditions often are reflected in a higher ASA class, which increases the risk of significant perioperative complications. Our multivariate modeling showed that a high ASA class strongly predicts morbidity and mortality following hip fracture repair, in line with other studies.19,31,32 Although the Charlson comorbidity index could alternatively been used, we elected to adjust for ASA class as it is more commonly used and is simple to use. Interestingly, surgical year did not significantly predict any complication, which can suggest that practice changes play a minimal impact on patient outcomes. However, we caution that because the individual event rates, particularly vascular, were low, we were unable to fully determine whether changes in practice management, such as improved thromboprophylaxis, would impact event rates over time. Finally, other predictors such as older age33 and a concomitant history of either COPD or asthma,34 are well‐accepted predictors of inpatient complications. Our attempt to examine specific predictors of complications in each BMI category revealed differing results, making interpretations difficult. Because of power considerations, this was meant solely as an exploratory analysis, and larger cohorts are needed to further ascertain whether predictors are different in these groups. Such a study may in fact identify perioperative issues that allow practitioners caring for this population to modify these factors.
One of the major limitations in our study was our inability to adjust for individual complications using multivariable models, such as deep vein thrombosis or delirium, within each BMI stratum, because of statistical power issues. Such a study would require large numbers of individual complications or events to allow for appropriate adjustments. The authors acknowledge that such individual complication rates may vary dramatically. We were aware of this potential problem, and therefore a priori ascertained a composite outcome of any noncardiac medical complication. However, our results do provide preliminary information regarding the impact of BMI on noncardiac medical complications. Further studies would be needed, though, to fully determine the effect of BMI on the number of cases with each complication.
Obesity (or BMI) is a known cardiovascular risk factor, and our previous study's aim was to determine cardiovascular events in a comparable manner to the way risk indices, such as the Goldman, Lee, or the AHA preoperative algorithm function. The surgical literature often presents noncardiac complications separately, allowing us to directly compare our own data to other published studies. We used 2 separate approaches, focusing on the inpatient stay (ascertaining noncardiac complications) and 1‐year cardiac outcomes (cardiac complications), as these are mediated by different mechanisms and factors. Furthermore, the intent of both studies was to dispel any concerns that an elevated BMI would in fact lead to an increased number of complications. Whether cardiac complications, though, would impact noncardiac complications, or vice‐versa, is unknown, and would require further investigation.
Although we relied on well‐established definitions for body mass, they have often been challenged, as they may underestimate adiposity in the elderly population due to age‐related reductions in lean mass.35,36 Studies have demonstrated a poor correlation between percent body fat and BMI in the >65 year age group,37 which could impact our results and outcomes by misclassifying patients. Yet, as an anthropometric measurement, BMI is easily obtainable and its variables are routinely documented in patients' medical records, as compared to other anthropometric measurements. Other means of estimating adiposity, such as densitometry or computed tomography (CT) scanning, are impractical, expensive, and not used clinically but routinely in research settings. The lack of standardization in obtaining height and weight, despite nurse‐initiated protocols for bed calibration, may have introduced a degree of measurement bias. Furthermore, the extent of lean mass lost and volume status changes lead to further challenges of using BMI in hospital settings. Whether other anthropometric measurements, including hip circumference, waist circumference, or waist‐hip ratio, should be used in this group of patients requires further examination. However, despite its shortcomings in elderly patients, BMI is still deemed an appropriate surrogate for obesity.
Our main strength was the use of the Rochester Epidemiology Project medical record linkage system to ascertain all patient data. This focuses on patients from a single geographically‐defined community minimizing referral biases often observed in studies originating from a tertiary care referral center. Previous disease‐related epidemiology studies using the Olmsted County population have demonstrated excellent external validity to the U.S. white population.16 We relied on the medical documentation of the treating clinician for many diagnoses in our data abstraction. Although we attempted to use standardized definitions, clinicians may have inadvertently forgotten to document subjective signs or symptoms that would assist in the categorization of these complications. Hence, added inpatient complications may have been overlooked, suggesting that our results may slightly underestimate the true incidence in this population. Additionally, certain complications may overlap categories, such as pneumonia and infections. We agree with Lawrence et al.19 that long periods of time are necessary to accumulate data of this kind in an effort to describe complication rates epidemiologically.
Despite no difference in outcomes among BMI categories, our results have striking implications for the hospitalized patient. Thus, underweight elderly patients, often considered frail with minimal functional reserve, are at no higher risk for developing inpatient medical complications than patients with higher BMIs. This is contrary to our study focusing on cardiac complications, where underweight patients were at higher risk.15 Conversely, obese patients, who have been demonstrated to be at higher risk of medical complications (particularly pulmonary), had no greater risk than patients with normal BMI. To the practicing geriatrician and hospitalist, this information provides important prognostication regarding additional perioperative measures that need to be implemented in these different groups. Based on our results, BMI does not play a particular role in noncardiac medical complications, dispelling any myths of the added burden of excess weight on surgical outcomes in this population. From a hospital perspective, this may be important since additional testing or preventative management in these patients may lead to additional resource use. However, in‐hospital deaths were higher in underweight patients than in patients with a normal BMI. Although we were underpowered to detect any differences in mortality between groups and could therefore not adjust for additional variables, it is unknown whether cardiac or noncardiac complications may be a stronger predictor of death in the underweight patient population. Further studies would be needed to better ascertain this relationship.
Conclusions
In elderly patients undergoing urgent hip fracture repair, BMI does not appear to lead to an excess rate of inpatient noncardiac complications. Our results are the first to demonstrate that BMI has no impact on morbidity in this patient population. Further research on the influence of body composition on inpatient complications in this population is needed to accurately allow for appropriate perioperative prophylaxis. Whether BMI impacts specific complications or in‐patient mortality in this population still requires investigation.
Acknowledgements
The authors thank Donna K. Lawson, LPN, Kathy Wolfert, and Cherie Dolliver, for their assistance in data collection and management.
- , .The effect of longevity on spending for acute and long‐term care.N Engl J Med.2000;342(19):1409–1415.
- , , , .Excess deaths associated with underweight, overweight, and obesity.JAMA.2005;293(15):1861–1867.
- .Adverse outcomes of osteoporotic fractures in the general population.J Bone Miner Res.2003;18(6):1139–1141.
- , , , , , .Incidence and economic burden of osteoporosis‐related fractures in the United States, 2005–2025.J Bone Miner Res.2007;22(3):465–475.
- , .Medical care of elderly patients with hip fractures.Mayo Clin Proc.2001;76(3):295–298.
- , , , et al.Effects of a hospitalist model on elderly patients with hip fracture.Arch Intern Med.2005;165(7):796–801.
- , , , et al.Body mass index as a predictor of fracture risk: a meta‐analysis.Osteoporos Int.2005;16(11):1330–1338.
- , , , , .Increased body mass index predicts increased blood loss during radical cystectomy.J Urol.2004;171(3):1077–1079.
- , , , .Laparoscopic colorectal surgery in obese and nonobese patients: do differences in body mass indices lead to different outcomes?Surg Endosc.2004;18(10):1452–1456.
- , , , , , .The relationship of body mass index to outcomes after percutaneous coronary intervention.J Interv Cardiol.2006;19(5):388–395.
- , , , , , .Is extreme obesity a risk factor for cardiac surgery? An analysis of patients with a BMI ≥40.Eur J Cardiothorac Surg.2006;29(4):434–440.
- , , , , , .Perioperative morbidity following total knee arthroplasty among obese patients.J Knee Surg.2002;15(2):77–83.
- , , , et al.Obesity and spine surgery: relation to perioperative complications.J Neurosurg Spine.2007;6(4):291–297.
- , , , .The influence of obesity on perioperative morbidity and mortality in revision total hip arthroplasty.Arch Orthop Trauma Surg.2000;120(5–6):267–271.
- , , , et al.Body mass index and risk of adverse cardiac events in elderly hip fracture patients: a population‐based study.J Am Geriatr Soc.2009;57(3):419–426.
- .History of the Rochester Epidemiology Project.Mayo Clin Proc.1996;71(3):266–274.
- .The threat to medical‐records research.N Engl J Med.1997;337(20):1466–170.
- .A Treatise on Man and the Development of His Faculties.Brussels:Musquardt;1871.
- , , , , .Medical complications and outcomes after hip fracture repair.Arch Intern Med.2002;162(18):2053–2057.
- , , .Effect of obesity on intensive care morbidity and mortality: a meta‐analysis.Crit Care Med.2008;36(1):151–158.
- , .Relationship of body mass index to early complications in knee replacement surgery.Arch Orthop Trauma Surg.2008;128(1):5–9.
- , , , , , .Obesity in total hip replacement.J Bone Joint Surg Br.2008;90(4):424–429.
- , , , et al.Use of an intramedullary hip‐screw compared with a compression hip‐screw with a plate for intertrochanteric femoral fractures. A prospective, randomized study of one hundred patients.J Bone Joint Surg Am.1998;80(5):618–630.
- .Blood transfusion requirements in intracapsular femoral neck fractures.Injury.1996;27(10):709–711.
- , , , .Risk prediction in operatively treated fractures of the hip.Clin Orthop Relat Res.1993(293):148–152.
- .Internal fixation or arthroplasty for displaced subcapital fractures in the elderly?Injury.1992;23(8):521–524.
- , , , et al.Impact of body mass index and albumin on morbidity and mortality after cardiac surgery.J Thorac Cardiovasc Surg.1999;118(5):866–873.
- , , , et al.Increased body mass index and peri‐operative risk in patients undergoing non‐cardiac surgery.Obes Surg.2004;14(2):275–281.
- , , , et al.Effects of body size on operative, intermediate, and long‐term outcomes after coronary artery bypass operation.Ann Thorac Surg.2001;71(2):521–530; discussion 530–531.
- , , , .Obesity in general elective surgery.Lancet.2003;361(9374):2032–2035.
- , , , et al.Effects of a hospitalist care model on mortality of elderly patients with hip fractures.J Hosp Med.2007;2(4):219–225.
- , , , .Morbidity and mortality after hip fracture: the impact of operative delay.Arch Orthop Trauma Surg.2004;124(5):334–340.
- , , , , .Outcome after hip fracture in individuals ninety years of age and older.J Orthop Trauma.2001;15(1):34–39.
- , , , et al.Development and initial validation of a risk score for predicting in‐hospital and 1‐year mortality in patients with hip fractures.J Bone Miner Res.2005;20(3):494–500.
- , , , , , .How useful is body mass index for comparison of body fatness across age, sex, and ethnic groups?Am J Epidemiol.1996;143(3):228–239.
- , , , , .Reassessment of body mass indices.Am J Clin Nutr.1990;52(3):405–408.
- , , , et al.Accuracy of body mass index in diagnosing obesity in the adult general population.Int J Obes (Lond).2008;32(6):959–966.
- , , , , , .Clarifying confusion: the confusion assessment method. A new method for detection of delirium.Ann Intern Med.1990;113(12):941–948.
Copyright © 2009 Society of Hospital Medicine
Jeanne M. Huddleston, Division of Hospital Internal Medicine, Mayo Clinic, 200 First Street SW, Rochester, MN 55905
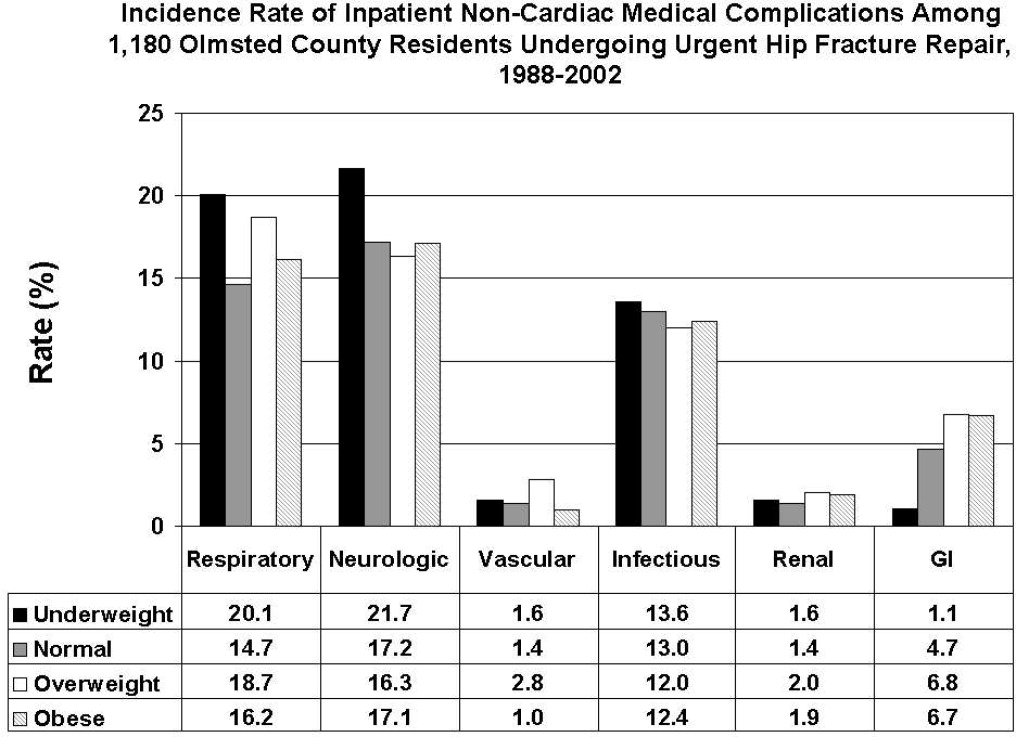
Ischemic Stroke After Hip Operation
In the United States, hip operations (internal fixation of fracture or total hip arthroplasty [THA]) are the most common noncardiac major surgical procedures performed in patients age 65 years and older (45.2 procedures per 100,000 persons per year).1 This number of procedures is projected to increase substantially in the coming decades.
Little is known about the clinical predictors of postoperative stroke in patients undergoing hip surgical procedures. Further, recent results of the Perioperative Ischemic Evaluation (POISE) trial have shown that measures taken to reduce cardiac complications postoperatively may adversely affect the risk of stroke.2 The POISE study showed decreases in myocardial infarction and coronary revascularization but accompanying increases in stroke and death with use of ‐blockers in patients undergoing noncardiac surgery.
Prevention of adverse events is one of the top priorities of the U.S. health care system today.35 Risk stratification and therapeutic optimization of underlying chronic diseases may be important in decreasing perioperative risk and improving postoperative outcomes.
Our objective was to determine the rate of postoperative ischemic stroke in all residents of Olmsted County, MN, who underwent hip operation between 1988 and 2002 and to identify clinical predictors of postoperative stroke.
Subjects and Methods
Olmsted County is one of the few places in the world where comprehensive population‐based studies of disease etiology and outcomes are feasible. This feasibility is due to the Rochester Epidemiology Project, a medical records linkage system that provides access to the records of all medical care in the community.1 All medical diagnoses made for a resident of Olmsted County are entered on a master sheet in the patient's medical record, which is then entered into a central computer index.
Hip operations were identified using the Surgical Information Recording System data warehouse, where detailed data are stored as International Classification of Diseases, 9th edition (ICD‐9) codes for all surgical procedures performed from January 1, 1988, forward. A total of 2028 THAs and hip fracture repairs (ICD‐9 codes 81.51, 81.52, 81.53, 79.15, and 79.25) performed between 1988 and 2002 in Olmsted County were identified. Of the hip procedures, 142 were excluded (Figure 1). The final analysis cohort contained 1886 hip operations1195 hip fracture repairs and 691 THAs.
The population‐based cohort was assembled and the data were abstracted from complete inpatient and outpatient records from admission for surgical treatment up to 1 year after surgery. Only those patients who had given prior authorization for research were included in the study cohort. The Mayo Clinic Institutional Review Board approved the study.
Case Ascertainment
We used several screening procedures to completely enumerate all postoperative strokes in our study population (Figure 1). The Mayo Clinic administrative database was used to identify all cases with relevant cerebrovascular disease (ICD‐9 codes 430.0‐437.9, 368.12, 781.4, and 784.3) within 1 year after hip operation. The Rochester Stroke Registry identified incident cases of ischemic stroke in Olmsted County from 1988 through 1994. The clinic's administrative database was also used to identify brain imaging studies (brain computed tomography, magnetic resonance imaging, or carotid ultrasonography) between the day of the procedure and 1 year postoperatively. A neurologist reviewed each image and the associated medical record identified during the screening process in detail for the constellation of signs and symptoms consistent with the diagnosis of stroke. Death certificates and autopsy reports were also reviewed to identify persons with the diagnosis of stroke. The outcome (stroke) was masked to the nurse abstractor who reviewed charts for predictors of postoperative stroke (eg, atrial fibrillation, coronary artery disease [CAD], history of stroke, medication use). The exposed or unexposed status of the patients to the predictors of stroke was masked to the physician (A.S.P.) who screened electronic medical records for the outcome measure (stroke).
Cerebral infarction or ischemic stroke was defined as the acute onset of a neurologic deficit that persisted for longer than 24 hours and corresponded to an arterial vascular territory of the cerebral hemispheres, brainstem, or cerebellum, with or without computed tomographic or magnetic resonance imaging documentation. Transient ischemic attack was defined as an episode of focal neurologic symptoms with abrupt onset and rapid resolution, lasting less than 24 hours, and due to altered circulation to a limited region of the brain.
Only patients with ischemic strokes clinically documented by a neurologist were included in the analysis.
Primary Outcomes
Outcomes were the cumulative probability of ischemic stroke and predictors of stroke in the first 12 months after surgical treatment of the hip.
Statistical Analysis
Continuous variables are presented as mean (standard deviation [SD]); categorical variables are presented as number and percentage. Two‐sample t tests or Wilcoxon rank sum tests were used to test for differences between THAs and hip fracture repairs in demographic characteristics, past medical history, and baseline clinical data composed of continuous variables; 2 or Fisher exact tests were used for categorical variables. No patient was lost to follow‐up during the 1 year after the initial surgery. However, the data of patients who died or had a second hip procedure within that period were censored.
The rate of ischemic stroke within 1 year after the incident hip procedure was calculated using the Kaplan‐Meier method. Second hip procedures within that period were counted as additional cases. Rates were calculated for the overall group, as well as for the univariate risk factors of operative procedure type, age, sex, past medical history of stroke, hypertension, atrial fibrillation, CAD, chronic obstructive pulmonary disease (COPD), diabetes mellitus, and chronic renal insufficiency. Use of ‐blockers, hydroxymethylglutaryl‐coenzyme A (HMG‐CoA) reductase inhibitors, or aspirin at hospital admission was also considered. Cox proportional hazards regression models were used to evaluate the risk of ischemic stroke for each of these univariate risk factors. Multivariable Cox proportional hazards models were constructed with adjustments for operative procedure type, age, sex, and comorbid conditions such as atrial fibrillation and hypertension. These covariates were added in a stepwise selection to identify factors significantly associated with the outcome. To account for patients who had a second hip procedure within 1 year of their first operation, we calculated all Cox proportional hazards regression results using the robust sandwich estimate of the covariance matrix. The proportional hazards assumption for all Cox models was evaluated with the methods proposed by Therneau and Grambsch;6 no violations of this assumption were identified. The rate of postoperative stroke after adjusting for the competing risk of death was calculated using the approach of Gooley et al.7 All statistical tests were 2‐sided, and a P value was considered significant if it was less than 0.05. Statistical analyses were performed using statistical software (SAS version 9.1.3; SAS Institute, Inc., Cary, NC).
Results
Among the patients with the 1886 hip procedures, 67 ischemic strokes were identified within 1 year after the index surgical procedure10 (1.4%) among the 691 THAs and 57 (4.8%) among the 1195 hip fracture repairs. Baseline characteristics are summarized in Table 1. Compared with the THA group, patients in the hip fracture repair group were more likely to be older and female. Additionally, such comorbid conditions as a history of stroke, diabetes mellitus, congestive heart failure, atrial fibrillation, or dementia were more prevalent in the hip fracture repair group.
| Characteristics | Surgical Procedure | Total (n = 1,886) | P Value* | |
|---|---|---|---|---|
| THA (n = 691) | Fracture Repair (n = 1,195) | |||
| ||||
| Age, years | 74.9 (6.59) | 84.2 (7.49) | 80.8 (8.46) | <0.001 |
| Sex, male | 258 (37.3) | 234 (19.6) | 492 (26.1) | <0.001 |
| Race, White | 690 (100) | 1,187 (99.3) | 1,877 (99.5) | 0.17 |
| BMI | 27.7 (5.36) | 23.3 (4.93) | 24.9 (5.52) | <0.001 |
| History | ||||
| Hypertension | 424 (61.4) | 695 (58.2) | 1,119 (59.3) | 0.17 |
| Diabetes | 57 (8.2) | 141 (11.8) | 198 (10.5) | 0.02 |
| Stroke | 50 (7.2) | 334 (27.9) | 384 (20.4) | <0.001 |
| CHF | 100 (14.5) | 321 (26.9) | 421 (22.3) | <0.001 |
| Atrial fibrillation | 72 (10.4) | 241 (20.2) | 313 (16.6) | <0.001 |
| Dementia | 16 (2.3) | 407 (34.1) | 423 (22.4) | <0.001 |
| ASA risk classification | <0.001 | |||
| 1 or 2 | 343 (49.6) | 172 (14.4) | 515 (27.3) | |
| 3, 4, or 5 | 348 (50.4) | 1,022 (85.6) | 1,370 (72.7) | |
| Medication on admission | ||||
| Aspirin | 168 (24.3) | 369 (30.9) | 537 (28.5) | 0.002 |
| ‐Blocker | 134 (19.4) | 184 (15.4) | 318 (16.9) | 0.03 |
| Insulin | 12 (1.7) | 48 (4) | 60 (3.2) | 0.007 |
| Length of stay, days | 7.3 (3.9) | 10.0 (7.61) | 9.0 (6.63) | <0.001 |
Univariate analyses assessing the rate and risk of postoperative ischemic stroke are shown in Table 2. The rate of stroke was significantly greater among hip fracture repairs than THAs 30 days postoperatively and 1 year postoperatively (1.5% vs. 0.6% and 5.5% vs. 1.5%, respectively; P < 0.001) (Figure 2). In our study we found an annual incidence rate of ischemic stroke of 4093 per 100,000 person‐years (95% confidence interval [CI], 3172‐5198 per 100,000 person‐years). Accounting for death as a competing risk for stroke had little impact on the rate of stroke overall or within the 2 surgical groups (results not shown). Univariate Cox proportional hazards models showed that neither sex nor history of hypertension, diabetes mellitus, COPD, chronic renal insufficiency, or CAD or use of HMG‐CoA reductase inhibitors or ‐blockers were significant predictors of ischemic stroke. However, other clinical risk factors, such as a history of atrial fibrillation (hazard ratio [HR], 2.16; P = 0.005), hip fracture repair vs. THA (HR, 3.80; P < 0.001), increased age (HR, 2.20; P = 0.017), aspirin use (HR, 1.8; P = 0.014), and history of previous stroke (HR, 4.18; P < 0.001), were significantly associated with an increased risk of stroke (Table 2).
| Variable | Number of Patients | Number of Events | Rate (%) | Hazard Ratio | P Value | |
|---|---|---|---|---|---|---|
| 30‐Day (95% CI) | 1‐Year (95% CI) | |||||
| ||||||
| Overall | 1886 | 67 | 1.2 (0.7‐1.7) | 3.9 (3‐4.8) | ||
| Type of operative procedure | ||||||
| THA | 691 | 10 | 0.6 (0.0‐1.1) | 1.5 (0.6‐2.4) | ||
| Hip fracture repair | 1195 | 57 | 1.5 (0.8‐2.2) | 5.5 (4.1‐6.9) | 3.80 (1.94‐7.44) | <0.001 |
| Age at operation, years | ||||||
| <75 | 528 | 11 | 1.0 (0.1‐1.8) | 2.1 (0.9‐3.3) | ||
| 75 | 1358 | 56 | 1.3 (0.7‐1.9) | 4.7 (3.5‐5.8) | 2.20 (1.15‐4.21) | 0.02 |
| Sex | ||||||
| Female | 1394 | 54 | 1.3 (0.7‐1.9) | 4.2 (3.1‐5.3) | ||
| Male | 492 | 13 | 0.8 (0.0‐1.7) | 2.9 (1.3‐4.4) | 0.69 (0.38‐1.27) | 0.24 |
| History of stroke | ||||||
| No | 1502 | 34 | 0.7 (0.3‐1.2) | 2.4 (1.6‐3.3) | ||
| Yes | 384 | 33 | 3.0 (1.2‐4.7) | 9.9 (6.6‐13) | 4.18 (2.59‐6.74) | <0.001 |
| History of hypertension | ||||||
| No | 767 | 23 | 0.8 (0.2‐1.4) | 3.4 (2.0‐4.7) | ||
| Yes | 1119 | 44 | 1.5 (0.7‐2.2) | 4.2 (3.0‐5.5) | 1.29 (0.78‐2.14) | 0.32 |
| History of atrial fibrillation | ||||||
| No | 1573 | 48 | 1.0 (0.5‐1.5) | 3.3 (2.4‐4.2) | ||
| Yes | 313 | 19 | 1.9 (0.4‐3.5) | 7.0 (3.9‐9.9) | 2.16 (1.27‐3.67) | 0.005 |
| History of CAD | ||||||
| No | 1224 | 40 | 1.1 (0.5‐1.6) | 3.5 (2.4‐4.5) | ||
| Yes | 662 | 27 | 1.4 (0.5‐2.3) | 4.7 (2.9‐6.4) | 1.34 (0.82‐2.19) | 0.24 |
| History of COPD | ||||||
| No | 1606 | 62 | 1.4 (0.8‐2.0) | 4.2 (3.1‐5.2) | ||
| Yes | 280 | 5 | 0 (0.0‐0.0) | 2.2 (0.3‐4.1) | 0.49 (0.20‐1.22) | 0.13 |
| History of diabetes mellitus | ||||||
| No | 1688 | 56 | 1.1 (0.6‐1.7) | 3.6 (2.7‐4.5) | ||
| Yes | 198 | 11 | 1.5 (0‐3.3) | 6.3 (2.6‐9.9) | 1.75 (0.92‐3.34) | 0.09 |
| History of renal insufficiency | ||||||
| No | 1718 | 58 | 1.0 (0.5‐1.5) | 3.7 (2.7‐4.6) | ||
| Yes | 168 | 9 | 3.0 (0.4‐5.5) | 5.8 (2‐9.5) | 1.77 (0.88‐3.57) | 0.11 |
| Aspirin use | ||||||
| No | 1349 | 39 | 0.7 (0.2‐1.1) | 3.2 (2.2‐4.2) | ||
| Yes | 537 | 28 | 2.5 (0.1‐3.8) | 5.7 (3.6‐7.7) | 1.86 (1.13‐3.06) | 0.01 |
| ‐Blocker use | ||||||
| No | 1568 | 52 | 1.1 (0.6‐1.6) | 3.6 (2.7‐4.6) | ||
| Yes | 318 | 15 | 1.6 (0.2‐3.0) | 5.1 (2.6‐7.6) | 1.42 (0.81‐2.52) | 0.22 |
| HMG‐CoA reductase inhibitor use | ||||||
| No | 1736 | 63 | 1.2 (0.7‐1.7) | 4.0 (3.0‐4.9) | ||
| Yes (statin/other lipid lowering drugs) | 148 | 4 | 1.4 (0‐3.2) | 2.8 (0.1‐5.4) | 0.70 (0.26‐1.94) | 0.50 |
Because age was associated with the type of surgical procedure (87% of hip fracture repair patients were 75 years or older compared with 45% of THA patients), the effect of hip fracture repair on ischemic stroke was adjusted for age. For similar reasons, sex was also examined as an adjusting factor. Adjustment for age and sex resulted in only a slight attenuation of the HR for hip fracture repair vs. THA, from 3.8 to 3.4. A further analysis also adjusted for history of hypertension and history of atrial fibrillation, both comorbidities commonly associated with ischemic stroke. After adjustment for age, sex, history of hypertension, and history of atrial fibrillation, the risk of ischemic stroke was still significantly greater in the hip fracture repair group than in the THA group (HR, 2.8; 95% CI, 1.4‐5.7; P = 0.005).
To determine the most important predictors of postoperative ischemic stroke, multivariable analysis was conducted with stepwise selection. Potential risk factors included the following: operative procedure type (hip fracture repair vs. THA), age, sex, and history of stroke, hypertension, atrial fibrillation, CAD, COPD, diabetes mellitus, and chronic renal insufficiency, as well as use of ‐blockers, HMG‐CoA reductase inhibitors, and aspirin on hospital admission. Among all these factors, history of stroke (HR, 3.27; P < 0.001) and hip fracture repair vs. THA (HR, 2.74; P = 0.004) were confirmed to be significant predictors of postoperative ischemic stroke; the other factors did not significantly affect the model (Figure 2).
Comment
Our findings contrast those of previous studies that focused on perioperative ischemic stroke rates for specific surgical procedures,2, 8, 9 but do seem concordant with published results for early event rates of cerebrovascular accident or transient ischemic attack (1%) following hip fracture.10 The data from our study suggest that perioperative stroke cumulative probability is relatively high for hip procedures at both 30 days (1.2%) and 1 year (3.9%) after the index surgical procedure compared with general procedures. Subjects with a history of stroke who were undergoing hip operation had a postoperative stroke risk of 3.0% at 30 days and 9.9% at 1 year.
The incidence of stroke was greater in the hip fracture repair group (1.5% at 30 days and 5.5% at 1 year) than in the elective THA group (0.6% at 30 days and 1.5% at 1 year). The increased 1‐year mortality for patients undergoing hip surgery compared with the general population is in part due to cerebrovascular disease,10 and, therefore, the 1‐year stroke incidence is important.
After adjustment for age, sex, and comorbidities (hypertension and atrial fibrillation), the risk of postoperative ischemic stroke was 2.71 times greater in the hip fracture repair group than in the THA group (P = 0.006). These data are important in counseling and caring for patients undergoing different types of hip procedures.
From 1985 through 1989, for the age group (75‐84 years old) that best fits the demographics of our cohort, both men and women had limited variation over time in annual incidence rates of stroke (2149‐1074 strokes per 100,000 population per year) for Olmsted County, MN.11 In our study we found an annual incidence rate of ischemic stroke of 4,093 per 100,000 person‐years (95% CI, 3172‐5198 per 100,000 person‐years). The lower limit of the 95% CI is higher than the rates reported for Olmsted County, suggesting that having hip surgery increases the 1‐year risk of ischemic stroke.
Previous studies have shown that the risk factor most consistently correlated to perioperative ischemic stroke is a history of stroke.9 In our study, history of stroke and type of hip fracture surgery were confirmed to be the strongest predictors of postoperative stroke. History of hypertension, atrial fibrillation, CAD, COPD, diabetes, or chronic renal insufficiency was not correlated to perioperative ischemic stroke.
Nonmodifiable risk factors, such as advanced age, serve as markers of stroke risk and help identify high‐risk populations that may require aggressive intervention. After age adjustment of hip fracture repair, age was no longer significantly associated with postoperative stroke.
Cerebrovascular disease appears to be a marker for CAD, and, therefore, patients with a history of stroke usually have a Revised Cardiac Risk Index that may suggest the use of ‐blockers. According to the recent results of the POISE trial, use of ‐blockers could lead to increased stroke incidence.2 Our results showed no significant correlation between stroke risk and ‐blocker use, but our study period was from 1988 to 2002, when titration of ‐blocker dose to heart rates of 55 to 60 beats per minute was not common practice.
Several studies have confirmed the value of aspirin in decreasing the rate of vascular outcomes after diagnosis of transient ischemic attack or stroke.12 In our study, aspirin use on hospital admission was found in the univariate analysis to be associated with an increased risk of stroke, but this finding was not confirmed after adjustments for age, sex, and comorbid conditions. Aspirin use on admission was not a significant predictor of postoperative stroke, most likely because aspirin use can be considered a marker of increased cardiovascular risk and we adjusted for these comorbid conditions.
The limitations of this study are inherent in its retrospective design. First, we identified all incident cases of stroke after hip operation by reviewing medical records and then abstracting data from those records. We may have missed some mild strokes if they were misclassified as peripheral vestibular neuropathy, migraine, or even seizure. Less likely is that we missed strokes within the first 30 days after the procedure because that is the period in which patients with hip operation are either hospitalized or sent for rehabilitation in skilled nursing facilities. It is known that institutionalization leads to better surveillance and more complete ascertainment of any medical event.
The event rate of postoperative stroke at 30 days after hip operation was low. Therefore, we did not have the statistical power to comment meaningfully on predictors of stroke at 30 days after the hip procedure. Any nonrespondent or volunteer bias was addressed by using data from the Rochester Epidemiology Project, which allowed us to identify all Olmsted County residents who underwent hip operation between 1988 and 2002. The diagnostic suspicion bias was also accounted for in our study design because different physicians provided care and outcome measurement.
Our results apply for the patients who underwent hip operation between 1988 and 2002. The noncardiac surgery guidelines have been revised between 1988 and 2002, and we did not perform a stratified analysis by index year. The next step in our study will be to extend our data collection to 2008 and look at time trends.
Conclusion
In this population‐based historical cohort study, patients undergoing hip operation had a 3.9% cumulative probability of ischemic stroke during the first postoperative year. History of stroke and type of hip procedure (ie, hip fracture repair) were the strongest predictors of this complication. Because history of stroke is such a strong predictor of postoperative stroke, the perioperative management of these patients should probably be tailored, with closely observed blood pressure management and antihypertensive medication adjustment, to avoid compromising cerebral perfusion. Also, to avoid postoperative hypercoagulability that increases the risk of stroke, these patients may need to begin receiving antiplatelets as soon as is surgically acceptable.1315
- .History of the Rochester Epidemiology Project.Mayo Clin Proc.1996;71(3):266–274.
- POISE Study Group;,,,,,, et al.Effects of extended‐release metoprolol succinate in patients undergoing non‐cardiac surgery (POISE trial): a randomised controlled trial.Lancet.2008;371(9627):1839–1847.
- ,,,,,, et al;American Heart Association Statistics Committee and Stroke Statistics Subcommittee. Heart disease and stroke statistics—2006 update: a report from the American Heart Association Statistics Committee and Stroke Statistics Subcommittee.Circulation.2006;113(6):e85–e151.
- Shojania KG, Duncan BW, McDonald KM, Wachter RM, Markowitz AJ, eds.Making health care safer: a critical analysis of patient safety practices. Evidence Report/Technology Assessment No.43.AHRQ publication no. 01‐E058.Rockville, MD:Agency for Healthcare Research and Quality (AHRQ),U.S. Department of Health and Human Services;2001.668 p.
- ,,.Deaths due to medical errors are exaggerated in Institute of Medicine report.JAMA.2000;284(1):93–95.
- ,.Modeling survival data: extending the Cox model.New York:Springer;2000.
- ,,,.Estimation of failure probabilities in the presence of competing risks: new representations of old estimators.Stat Med.1999;18(6):695–706.
- ,,.Postoperative cerebrovascular accidents in general surgery.Acta Anaesthesiol Scand.1988;32(8):698–701.
- ,,,,,, et al.Perioperative stroke risk in 173 consecutive patients with a past history of stroke.Arch Surg.1990;125(8):986–989.
- ,,,,.Medical complications and outcomes after hip fracture repair.Arch Intern Med.2002;162(18):2053–2057.
- ,,,,.Stroke incidence, prevalence, and survival: secular trends in Rochester, Minnesota, through 1989.Stroke.1996;27(3):373–380.
- CAST (Chinese Acute Stroke Trial) Collaborative Group.Randomised placebo‐controlled trial of early aspirin use in 20,000 patients with acute ischaemic stroke.Lancet.1997;349(9066):1641–1649.
- ,,.Coagulation activation and organ dysfunction following cardiac surgery.Chest.2005;128(1):229–236.
- ,,,,,.Intra‐ and postoperative fibrinolysis in patients undergoing cardiopulmonary bypass surgery.Haemostasis.1991;21(1):58–64.
- .Perioperative stroke.N Engl J Med.2007;356(7):706–713.
In the United States, hip operations (internal fixation of fracture or total hip arthroplasty [THA]) are the most common noncardiac major surgical procedures performed in patients age 65 years and older (45.2 procedures per 100,000 persons per year).1 This number of procedures is projected to increase substantially in the coming decades.
Little is known about the clinical predictors of postoperative stroke in patients undergoing hip surgical procedures. Further, recent results of the Perioperative Ischemic Evaluation (POISE) trial have shown that measures taken to reduce cardiac complications postoperatively may adversely affect the risk of stroke.2 The POISE study showed decreases in myocardial infarction and coronary revascularization but accompanying increases in stroke and death with use of ‐blockers in patients undergoing noncardiac surgery.
Prevention of adverse events is one of the top priorities of the U.S. health care system today.35 Risk stratification and therapeutic optimization of underlying chronic diseases may be important in decreasing perioperative risk and improving postoperative outcomes.
Our objective was to determine the rate of postoperative ischemic stroke in all residents of Olmsted County, MN, who underwent hip operation between 1988 and 2002 and to identify clinical predictors of postoperative stroke.
Subjects and Methods
Olmsted County is one of the few places in the world where comprehensive population‐based studies of disease etiology and outcomes are feasible. This feasibility is due to the Rochester Epidemiology Project, a medical records linkage system that provides access to the records of all medical care in the community.1 All medical diagnoses made for a resident of Olmsted County are entered on a master sheet in the patient's medical record, which is then entered into a central computer index.
Hip operations were identified using the Surgical Information Recording System data warehouse, where detailed data are stored as International Classification of Diseases, 9th edition (ICD‐9) codes for all surgical procedures performed from January 1, 1988, forward. A total of 2028 THAs and hip fracture repairs (ICD‐9 codes 81.51, 81.52, 81.53, 79.15, and 79.25) performed between 1988 and 2002 in Olmsted County were identified. Of the hip procedures, 142 were excluded (Figure 1). The final analysis cohort contained 1886 hip operations1195 hip fracture repairs and 691 THAs.
The population‐based cohort was assembled and the data were abstracted from complete inpatient and outpatient records from admission for surgical treatment up to 1 year after surgery. Only those patients who had given prior authorization for research were included in the study cohort. The Mayo Clinic Institutional Review Board approved the study.
Case Ascertainment
We used several screening procedures to completely enumerate all postoperative strokes in our study population (Figure 1). The Mayo Clinic administrative database was used to identify all cases with relevant cerebrovascular disease (ICD‐9 codes 430.0‐437.9, 368.12, 781.4, and 784.3) within 1 year after hip operation. The Rochester Stroke Registry identified incident cases of ischemic stroke in Olmsted County from 1988 through 1994. The clinic's administrative database was also used to identify brain imaging studies (brain computed tomography, magnetic resonance imaging, or carotid ultrasonography) between the day of the procedure and 1 year postoperatively. A neurologist reviewed each image and the associated medical record identified during the screening process in detail for the constellation of signs and symptoms consistent with the diagnosis of stroke. Death certificates and autopsy reports were also reviewed to identify persons with the diagnosis of stroke. The outcome (stroke) was masked to the nurse abstractor who reviewed charts for predictors of postoperative stroke (eg, atrial fibrillation, coronary artery disease [CAD], history of stroke, medication use). The exposed or unexposed status of the patients to the predictors of stroke was masked to the physician (A.S.P.) who screened electronic medical records for the outcome measure (stroke).
Cerebral infarction or ischemic stroke was defined as the acute onset of a neurologic deficit that persisted for longer than 24 hours and corresponded to an arterial vascular territory of the cerebral hemispheres, brainstem, or cerebellum, with or without computed tomographic or magnetic resonance imaging documentation. Transient ischemic attack was defined as an episode of focal neurologic symptoms with abrupt onset and rapid resolution, lasting less than 24 hours, and due to altered circulation to a limited region of the brain.
Only patients with ischemic strokes clinically documented by a neurologist were included in the analysis.
Primary Outcomes
Outcomes were the cumulative probability of ischemic stroke and predictors of stroke in the first 12 months after surgical treatment of the hip.
Statistical Analysis
Continuous variables are presented as mean (standard deviation [SD]); categorical variables are presented as number and percentage. Two‐sample t tests or Wilcoxon rank sum tests were used to test for differences between THAs and hip fracture repairs in demographic characteristics, past medical history, and baseline clinical data composed of continuous variables; 2 or Fisher exact tests were used for categorical variables. No patient was lost to follow‐up during the 1 year after the initial surgery. However, the data of patients who died or had a second hip procedure within that period were censored.
The rate of ischemic stroke within 1 year after the incident hip procedure was calculated using the Kaplan‐Meier method. Second hip procedures within that period were counted as additional cases. Rates were calculated for the overall group, as well as for the univariate risk factors of operative procedure type, age, sex, past medical history of stroke, hypertension, atrial fibrillation, CAD, chronic obstructive pulmonary disease (COPD), diabetes mellitus, and chronic renal insufficiency. Use of ‐blockers, hydroxymethylglutaryl‐coenzyme A (HMG‐CoA) reductase inhibitors, or aspirin at hospital admission was also considered. Cox proportional hazards regression models were used to evaluate the risk of ischemic stroke for each of these univariate risk factors. Multivariable Cox proportional hazards models were constructed with adjustments for operative procedure type, age, sex, and comorbid conditions such as atrial fibrillation and hypertension. These covariates were added in a stepwise selection to identify factors significantly associated with the outcome. To account for patients who had a second hip procedure within 1 year of their first operation, we calculated all Cox proportional hazards regression results using the robust sandwich estimate of the covariance matrix. The proportional hazards assumption for all Cox models was evaluated with the methods proposed by Therneau and Grambsch;6 no violations of this assumption were identified. The rate of postoperative stroke after adjusting for the competing risk of death was calculated using the approach of Gooley et al.7 All statistical tests were 2‐sided, and a P value was considered significant if it was less than 0.05. Statistical analyses were performed using statistical software (SAS version 9.1.3; SAS Institute, Inc., Cary, NC).
Results
Among the patients with the 1886 hip procedures, 67 ischemic strokes were identified within 1 year after the index surgical procedure10 (1.4%) among the 691 THAs and 57 (4.8%) among the 1195 hip fracture repairs. Baseline characteristics are summarized in Table 1. Compared with the THA group, patients in the hip fracture repair group were more likely to be older and female. Additionally, such comorbid conditions as a history of stroke, diabetes mellitus, congestive heart failure, atrial fibrillation, or dementia were more prevalent in the hip fracture repair group.
| Characteristics | Surgical Procedure | Total (n = 1,886) | P Value* | |
|---|---|---|---|---|
| THA (n = 691) | Fracture Repair (n = 1,195) | |||
| ||||
| Age, years | 74.9 (6.59) | 84.2 (7.49) | 80.8 (8.46) | <0.001 |
| Sex, male | 258 (37.3) | 234 (19.6) | 492 (26.1) | <0.001 |
| Race, White | 690 (100) | 1,187 (99.3) | 1,877 (99.5) | 0.17 |
| BMI | 27.7 (5.36) | 23.3 (4.93) | 24.9 (5.52) | <0.001 |
| History | ||||
| Hypertension | 424 (61.4) | 695 (58.2) | 1,119 (59.3) | 0.17 |
| Diabetes | 57 (8.2) | 141 (11.8) | 198 (10.5) | 0.02 |
| Stroke | 50 (7.2) | 334 (27.9) | 384 (20.4) | <0.001 |
| CHF | 100 (14.5) | 321 (26.9) | 421 (22.3) | <0.001 |
| Atrial fibrillation | 72 (10.4) | 241 (20.2) | 313 (16.6) | <0.001 |
| Dementia | 16 (2.3) | 407 (34.1) | 423 (22.4) | <0.001 |
| ASA risk classification | <0.001 | |||
| 1 or 2 | 343 (49.6) | 172 (14.4) | 515 (27.3) | |
| 3, 4, or 5 | 348 (50.4) | 1,022 (85.6) | 1,370 (72.7) | |
| Medication on admission | ||||
| Aspirin | 168 (24.3) | 369 (30.9) | 537 (28.5) | 0.002 |
| ‐Blocker | 134 (19.4) | 184 (15.4) | 318 (16.9) | 0.03 |
| Insulin | 12 (1.7) | 48 (4) | 60 (3.2) | 0.007 |
| Length of stay, days | 7.3 (3.9) | 10.0 (7.61) | 9.0 (6.63) | <0.001 |
Univariate analyses assessing the rate and risk of postoperative ischemic stroke are shown in Table 2. The rate of stroke was significantly greater among hip fracture repairs than THAs 30 days postoperatively and 1 year postoperatively (1.5% vs. 0.6% and 5.5% vs. 1.5%, respectively; P < 0.001) (Figure 2). In our study we found an annual incidence rate of ischemic stroke of 4093 per 100,000 person‐years (95% confidence interval [CI], 3172‐5198 per 100,000 person‐years). Accounting for death as a competing risk for stroke had little impact on the rate of stroke overall or within the 2 surgical groups (results not shown). Univariate Cox proportional hazards models showed that neither sex nor history of hypertension, diabetes mellitus, COPD, chronic renal insufficiency, or CAD or use of HMG‐CoA reductase inhibitors or ‐blockers were significant predictors of ischemic stroke. However, other clinical risk factors, such as a history of atrial fibrillation (hazard ratio [HR], 2.16; P = 0.005), hip fracture repair vs. THA (HR, 3.80; P < 0.001), increased age (HR, 2.20; P = 0.017), aspirin use (HR, 1.8; P = 0.014), and history of previous stroke (HR, 4.18; P < 0.001), were significantly associated with an increased risk of stroke (Table 2).
| Variable | Number of Patients | Number of Events | Rate (%) | Hazard Ratio | P Value | |
|---|---|---|---|---|---|---|
| 30‐Day (95% CI) | 1‐Year (95% CI) | |||||
| ||||||
| Overall | 1886 | 67 | 1.2 (0.7‐1.7) | 3.9 (3‐4.8) | ||
| Type of operative procedure | ||||||
| THA | 691 | 10 | 0.6 (0.0‐1.1) | 1.5 (0.6‐2.4) | ||
| Hip fracture repair | 1195 | 57 | 1.5 (0.8‐2.2) | 5.5 (4.1‐6.9) | 3.80 (1.94‐7.44) | <0.001 |
| Age at operation, years | ||||||
| <75 | 528 | 11 | 1.0 (0.1‐1.8) | 2.1 (0.9‐3.3) | ||
| 75 | 1358 | 56 | 1.3 (0.7‐1.9) | 4.7 (3.5‐5.8) | 2.20 (1.15‐4.21) | 0.02 |
| Sex | ||||||
| Female | 1394 | 54 | 1.3 (0.7‐1.9) | 4.2 (3.1‐5.3) | ||
| Male | 492 | 13 | 0.8 (0.0‐1.7) | 2.9 (1.3‐4.4) | 0.69 (0.38‐1.27) | 0.24 |
| History of stroke | ||||||
| No | 1502 | 34 | 0.7 (0.3‐1.2) | 2.4 (1.6‐3.3) | ||
| Yes | 384 | 33 | 3.0 (1.2‐4.7) | 9.9 (6.6‐13) | 4.18 (2.59‐6.74) | <0.001 |
| History of hypertension | ||||||
| No | 767 | 23 | 0.8 (0.2‐1.4) | 3.4 (2.0‐4.7) | ||
| Yes | 1119 | 44 | 1.5 (0.7‐2.2) | 4.2 (3.0‐5.5) | 1.29 (0.78‐2.14) | 0.32 |
| History of atrial fibrillation | ||||||
| No | 1573 | 48 | 1.0 (0.5‐1.5) | 3.3 (2.4‐4.2) | ||
| Yes | 313 | 19 | 1.9 (0.4‐3.5) | 7.0 (3.9‐9.9) | 2.16 (1.27‐3.67) | 0.005 |
| History of CAD | ||||||
| No | 1224 | 40 | 1.1 (0.5‐1.6) | 3.5 (2.4‐4.5) | ||
| Yes | 662 | 27 | 1.4 (0.5‐2.3) | 4.7 (2.9‐6.4) | 1.34 (0.82‐2.19) | 0.24 |
| History of COPD | ||||||
| No | 1606 | 62 | 1.4 (0.8‐2.0) | 4.2 (3.1‐5.2) | ||
| Yes | 280 | 5 | 0 (0.0‐0.0) | 2.2 (0.3‐4.1) | 0.49 (0.20‐1.22) | 0.13 |
| History of diabetes mellitus | ||||||
| No | 1688 | 56 | 1.1 (0.6‐1.7) | 3.6 (2.7‐4.5) | ||
| Yes | 198 | 11 | 1.5 (0‐3.3) | 6.3 (2.6‐9.9) | 1.75 (0.92‐3.34) | 0.09 |
| History of renal insufficiency | ||||||
| No | 1718 | 58 | 1.0 (0.5‐1.5) | 3.7 (2.7‐4.6) | ||
| Yes | 168 | 9 | 3.0 (0.4‐5.5) | 5.8 (2‐9.5) | 1.77 (0.88‐3.57) | 0.11 |
| Aspirin use | ||||||
| No | 1349 | 39 | 0.7 (0.2‐1.1) | 3.2 (2.2‐4.2) | ||
| Yes | 537 | 28 | 2.5 (0.1‐3.8) | 5.7 (3.6‐7.7) | 1.86 (1.13‐3.06) | 0.01 |
| ‐Blocker use | ||||||
| No | 1568 | 52 | 1.1 (0.6‐1.6) | 3.6 (2.7‐4.6) | ||
| Yes | 318 | 15 | 1.6 (0.2‐3.0) | 5.1 (2.6‐7.6) | 1.42 (0.81‐2.52) | 0.22 |
| HMG‐CoA reductase inhibitor use | ||||||
| No | 1736 | 63 | 1.2 (0.7‐1.7) | 4.0 (3.0‐4.9) | ||
| Yes (statin/other lipid lowering drugs) | 148 | 4 | 1.4 (0‐3.2) | 2.8 (0.1‐5.4) | 0.70 (0.26‐1.94) | 0.50 |
Because age was associated with the type of surgical procedure (87% of hip fracture repair patients were 75 years or older compared with 45% of THA patients), the effect of hip fracture repair on ischemic stroke was adjusted for age. For similar reasons, sex was also examined as an adjusting factor. Adjustment for age and sex resulted in only a slight attenuation of the HR for hip fracture repair vs. THA, from 3.8 to 3.4. A further analysis also adjusted for history of hypertension and history of atrial fibrillation, both comorbidities commonly associated with ischemic stroke. After adjustment for age, sex, history of hypertension, and history of atrial fibrillation, the risk of ischemic stroke was still significantly greater in the hip fracture repair group than in the THA group (HR, 2.8; 95% CI, 1.4‐5.7; P = 0.005).
To determine the most important predictors of postoperative ischemic stroke, multivariable analysis was conducted with stepwise selection. Potential risk factors included the following: operative procedure type (hip fracture repair vs. THA), age, sex, and history of stroke, hypertension, atrial fibrillation, CAD, COPD, diabetes mellitus, and chronic renal insufficiency, as well as use of ‐blockers, HMG‐CoA reductase inhibitors, and aspirin on hospital admission. Among all these factors, history of stroke (HR, 3.27; P < 0.001) and hip fracture repair vs. THA (HR, 2.74; P = 0.004) were confirmed to be significant predictors of postoperative ischemic stroke; the other factors did not significantly affect the model (Figure 2).
Comment
Our findings contrast those of previous studies that focused on perioperative ischemic stroke rates for specific surgical procedures,2, 8, 9 but do seem concordant with published results for early event rates of cerebrovascular accident or transient ischemic attack (1%) following hip fracture.10 The data from our study suggest that perioperative stroke cumulative probability is relatively high for hip procedures at both 30 days (1.2%) and 1 year (3.9%) after the index surgical procedure compared with general procedures. Subjects with a history of stroke who were undergoing hip operation had a postoperative stroke risk of 3.0% at 30 days and 9.9% at 1 year.
The incidence of stroke was greater in the hip fracture repair group (1.5% at 30 days and 5.5% at 1 year) than in the elective THA group (0.6% at 30 days and 1.5% at 1 year). The increased 1‐year mortality for patients undergoing hip surgery compared with the general population is in part due to cerebrovascular disease,10 and, therefore, the 1‐year stroke incidence is important.
After adjustment for age, sex, and comorbidities (hypertension and atrial fibrillation), the risk of postoperative ischemic stroke was 2.71 times greater in the hip fracture repair group than in the THA group (P = 0.006). These data are important in counseling and caring for patients undergoing different types of hip procedures.
From 1985 through 1989, for the age group (75‐84 years old) that best fits the demographics of our cohort, both men and women had limited variation over time in annual incidence rates of stroke (2149‐1074 strokes per 100,000 population per year) for Olmsted County, MN.11 In our study we found an annual incidence rate of ischemic stroke of 4,093 per 100,000 person‐years (95% CI, 3172‐5198 per 100,000 person‐years). The lower limit of the 95% CI is higher than the rates reported for Olmsted County, suggesting that having hip surgery increases the 1‐year risk of ischemic stroke.
Previous studies have shown that the risk factor most consistently correlated to perioperative ischemic stroke is a history of stroke.9 In our study, history of stroke and type of hip fracture surgery were confirmed to be the strongest predictors of postoperative stroke. History of hypertension, atrial fibrillation, CAD, COPD, diabetes, or chronic renal insufficiency was not correlated to perioperative ischemic stroke.
Nonmodifiable risk factors, such as advanced age, serve as markers of stroke risk and help identify high‐risk populations that may require aggressive intervention. After age adjustment of hip fracture repair, age was no longer significantly associated with postoperative stroke.
Cerebrovascular disease appears to be a marker for CAD, and, therefore, patients with a history of stroke usually have a Revised Cardiac Risk Index that may suggest the use of ‐blockers. According to the recent results of the POISE trial, use of ‐blockers could lead to increased stroke incidence.2 Our results showed no significant correlation between stroke risk and ‐blocker use, but our study period was from 1988 to 2002, when titration of ‐blocker dose to heart rates of 55 to 60 beats per minute was not common practice.
Several studies have confirmed the value of aspirin in decreasing the rate of vascular outcomes after diagnosis of transient ischemic attack or stroke.12 In our study, aspirin use on hospital admission was found in the univariate analysis to be associated with an increased risk of stroke, but this finding was not confirmed after adjustments for age, sex, and comorbid conditions. Aspirin use on admission was not a significant predictor of postoperative stroke, most likely because aspirin use can be considered a marker of increased cardiovascular risk and we adjusted for these comorbid conditions.
The limitations of this study are inherent in its retrospective design. First, we identified all incident cases of stroke after hip operation by reviewing medical records and then abstracting data from those records. We may have missed some mild strokes if they were misclassified as peripheral vestibular neuropathy, migraine, or even seizure. Less likely is that we missed strokes within the first 30 days after the procedure because that is the period in which patients with hip operation are either hospitalized or sent for rehabilitation in skilled nursing facilities. It is known that institutionalization leads to better surveillance and more complete ascertainment of any medical event.
The event rate of postoperative stroke at 30 days after hip operation was low. Therefore, we did not have the statistical power to comment meaningfully on predictors of stroke at 30 days after the hip procedure. Any nonrespondent or volunteer bias was addressed by using data from the Rochester Epidemiology Project, which allowed us to identify all Olmsted County residents who underwent hip operation between 1988 and 2002. The diagnostic suspicion bias was also accounted for in our study design because different physicians provided care and outcome measurement.
Our results apply for the patients who underwent hip operation between 1988 and 2002. The noncardiac surgery guidelines have been revised between 1988 and 2002, and we did not perform a stratified analysis by index year. The next step in our study will be to extend our data collection to 2008 and look at time trends.
Conclusion
In this population‐based historical cohort study, patients undergoing hip operation had a 3.9% cumulative probability of ischemic stroke during the first postoperative year. History of stroke and type of hip procedure (ie, hip fracture repair) were the strongest predictors of this complication. Because history of stroke is such a strong predictor of postoperative stroke, the perioperative management of these patients should probably be tailored, with closely observed blood pressure management and antihypertensive medication adjustment, to avoid compromising cerebral perfusion. Also, to avoid postoperative hypercoagulability that increases the risk of stroke, these patients may need to begin receiving antiplatelets as soon as is surgically acceptable.1315
- .History of the Rochester Epidemiology Project.Mayo Clin Proc.1996;71(3):266–274.
- POISE Study Group;,,,,,, et al.Effects of extended‐release metoprolol succinate in patients undergoing non‐cardiac surgery (POISE trial): a randomised controlled trial.Lancet.2008;371(9627):1839–1847.
- ,,,,,, et al;American Heart Association Statistics Committee and Stroke Statistics Subcommittee. Heart disease and stroke statistics—2006 update: a report from the American Heart Association Statistics Committee and Stroke Statistics Subcommittee.Circulation.2006;113(6):e85–e151.
- Shojania KG, Duncan BW, McDonald KM, Wachter RM, Markowitz AJ, eds.Making health care safer: a critical analysis of patient safety practices. Evidence Report/Technology Assessment No.43.AHRQ publication no. 01‐E058.Rockville, MD:Agency for Healthcare Research and Quality (AHRQ),U.S. Department of Health and Human Services;2001.668 p.
- ,,.Deaths due to medical errors are exaggerated in Institute of Medicine report.JAMA.2000;284(1):93–95.
- ,.Modeling survival data: extending the Cox model.New York:Springer;2000.
- ,,,.Estimation of failure probabilities in the presence of competing risks: new representations of old estimators.Stat Med.1999;18(6):695–706.
- ,,.Postoperative cerebrovascular accidents in general surgery.Acta Anaesthesiol Scand.1988;32(8):698–701.
- ,,,,,, et al.Perioperative stroke risk in 173 consecutive patients with a past history of stroke.Arch Surg.1990;125(8):986–989.
- ,,,,.Medical complications and outcomes after hip fracture repair.Arch Intern Med.2002;162(18):2053–2057.
- ,,,,.Stroke incidence, prevalence, and survival: secular trends in Rochester, Minnesota, through 1989.Stroke.1996;27(3):373–380.
- CAST (Chinese Acute Stroke Trial) Collaborative Group.Randomised placebo‐controlled trial of early aspirin use in 20,000 patients with acute ischaemic stroke.Lancet.1997;349(9066):1641–1649.
- ,,.Coagulation activation and organ dysfunction following cardiac surgery.Chest.2005;128(1):229–236.
- ,,,,,.Intra‐ and postoperative fibrinolysis in patients undergoing cardiopulmonary bypass surgery.Haemostasis.1991;21(1):58–64.
- .Perioperative stroke.N Engl J Med.2007;356(7):706–713.
Copyright © 2009 Society of Hospital Medicine

Hospitalists and Hip Fractures
Because the incidence of hip fracture increases dramatically with age and the elderly are the fastest‐growing portion of the United States population, the number of hip fractures is expected to triple by 2040.1 With the associated increase in postoperative morbidity and mortality, the costs will likely exceed $16‐$20 billion annually.15 Already by 2002, the number of patients with hip fractures exceeded 340,000 in this country, resulting in $8.6 billion in health care expenditures from in‐hospital and posthospital costs.68 This makes hip fracture a serious public health concern and triggers a need to devise an efficient means of caring for these patients. We previously reported that a hospitalist service can decrease time to surgery and shorten length of stay without affecting the number of inpatient deaths or 30‐day readmissions of patients undergoing hip fracture surgery.9 However, one concern with reducing length of stay and time to surgery in the high‐risk hip fracture patient population is the effect on long‐term mortality because the death rate following hip fracture repair may be as high as 43% after 1 year.10 To evaluate this important issue, we assessed mortality over a 1‐year period in the same cohort of patients previously described.9 We also identified predictors associated with mortality. We hypothesized that the expedited surgical treatment and decreased length of stay of a hospitalist‐managed group would not have an adverse effect on 1‐year mortality.
METHODS
Patient Selection
Following approval by the Mayo Clinic Institutional Review Board, we used the Mayo Clinic Surgical Index to identify patients admitted between July 1, 2000, and June 30, 2002, who matched International Classification of Diseases (9th Edition) hip fracture codes.11 These patients were cross‐referenced with those having a primary surgical indication of hip fracture. Patients transferred to our facility more than 72 hours after fracture were excluded from our study. Study patients provided authorization to use their medical records for the purposes of research.
A cohort of 466 patients was identified. For purposes of comparison, patients admitted between July 1, 2000, and June 30, 2001, were deemed to belong to the standard care service, and patients admitted between July 1, 2001, and June 30, 2002, were deemed part of the hospitalist service.
Intervention
Prior to July 2001, Mayo Clinic patients aged 65 and older having surgical repair of a hip fracture were triaged directly to a surgical orthopedic or general medical teaching service. Patients with multiple medical diagnoses were managed initially on a medical teaching service prior to transfer to the operating room. The primary team (medical or surgical) was responsible for the postoperative care of the patient and any orders or consultations required.
After July 1, 2001, these patients were admitted by the orthopedic surgery service and medically comanaged by a hospitalist service, which consisted of a hospitalist physician and 2 allied‐health practitioners. Twelve hospitalists and 12 allied health care professionals cared for patients during the study period. All preoperative and postoperative evaluations, inpatient management decisions, and coordination of outpatient care were performed by the hospitalists. This model of care is similar to one previously studied and published elsewhere.12 A census cap of 20 patients limited the number of patients managed by the hospitalist service. Any overflow of hip fracture patients was triaged directly to a non‐hospitalist‐based primary medical or surgical service as before. Thus, 23 hip fracture patients (10%) admitted after July 1, 2001, were not managed by the hospitalists but are included in this group for an intent‐to‐treat analysis.
Data Collection
Study nurses abstracted all data including admitting diagnoses, demographic features, type and mechanism of hip fracture, admission date and time, American Society of Anesthesia (ASA) class, comorbid medical conditions, medications, all clinical data, and readmission rates. Date of last follow‐up was confirmed using the Mayo Clinic medical record, whereas date and cause of death were obtained from death certificates obtained from state and national sources. Length of stay was defined as the number of days between admission and discharge. Time to surgery was defined in hours as the time from hospital admission to the start of the surgery. Finally, time from surgery to dismissal was defined as the number of days from the initiation of the surgical procedure to the time of dismissal. Thirty‐day readmission was defined as readmission to our hospital within 30 days of discharge date.
Statistical Considerations
Power
The power analysis was based on the end point of survival following surgical repair of hip fracture and primary comparison of patients in the standard care group with those in the hospitalist group. With 236 patients in the standard care group, 230 in the hospitalist group, and 274 observed deaths during the follow‐up period, there was 80% power to detect a hazard ratio of 1.4 or greater as being statistically significant (alpha = 0.05, beta = 0.2).
Analysis
The analysis focused on the end point of survival following surgical repair of hip fracture. In addition to the hospitalist versus standard care service, demographic, baseline clinical, and in‐hospital data were evaluated as potential predictors of survival. Survival rates were estimated using the method of Kaplan and Meier, and relative differences in survival were evaluated using the Cox proportional hazards regression models.13, 14 Potential predictors were analyzed both univariately and in a multivariable model. For the multivariable model, initial variable selection was accomplished using stepwise selection, backward elimination, and recursive partitioning.15 Each method yielded similar results. Bootstrap resampling was then used to confirm the variables selected for each model.16, 17 The threshold of statistical significance was set at P = .05 for all tests. All analyses were conducted in SAS version 8.2 (SAS Institute Inc., Cary, NC) and Splus version 6.2.1 (Insightful Corporation, Seattle, WA).
RESULTS
There were 236 patients with hip fractures (50.6%) admitted to the standard care service, and 230 patients (49.4%) admitted to the hospitalist service. As shown in Table 1, the baseline characteristics of the patients admitted to the 2 services did not differ significantly except that a greater proportion of patients with hypoxia were admitted to the hospitalist service (11.3% vs. 5.5%; P = .02). However, time to surgery, postsurgery stay, and overall length of hospitalization of the hospitalist‐treated patients were all significantly shorter.
| Patient characteristic | Standard care n = 236 | Hospitalist care n = 230 | P value | ||
|---|---|---|---|---|---|
| |||||
| Age (years) | 82 | 83 | .34 | ||
| Female sex | 171 | 72.5% | 163 | 70.9% | .70 |
| Comorbidity | |||||
| Coronary artery disease | 69 | 29.2% | 77 | 33.5% | .32 |
| Congestive heart failure | 41 | 17.4% | 49 | 21.3% | .28 |
| Chronic obstructive pulmonary disease | 36 | 15.3% | 38 | 16.5% | .71 |
| Cerebral vascular accident or transient ischemic attack | 36 | 15.3% | 50 | 21.7% | .07 |
| Dementia | 54 | 22.9% | 62 | 27.0% | .31 |
| Diabetes | 45 | 19.1% | 46 | 20.0% | .80 |
| Renal insufficiency | 17 | 7.2% | 17 | 7.4% | .94 |
| Residence at time of admission | .07 | ||||
| Home | 149 | 63.1% | 138 | 60.0% | |
| Assisted living | 32 | 13.6% | 42 | 18.3% | |
| Nursing home | 55 | 23.3% | 50 | 21.7% | |
| Ambulatory status at time of admission | .14 | ||||
| Independent | 114 | 48.3% | 89 | 38.7% | |
| Assistive device | 99 | 41.9% | 115 | 50.0% | |
| Personal help | 9 | 3.8% | 16 | 7.0% | |
| Transfer to bed or chair | 9 | 3.8% | 7 | 3.0% | |
| Nonambulatory | 5 | 2.1% | 3 | 1.3% | |
| Signs at time of admission | |||||
| Hypotension | 4 | 1.7% | 3 | 1.3% | > .99 |
| Hypoxia | 13 | 5.5% | 26 | 11.3% | .02 |
| Pulmonary edema | 37 | 15.7% | 29 | 12.6% | .34 |
| Tachycardia | 19 | 8.1% | 25 | 10.9% | .3 |
| Fracture type | .78 | ||||
| Femoral neck | 118 | 50.0% | 118 | 51.3% | |
| Intertrochanteric | 118 | 50.0% | 112 | 48.7% | |
| Mechanism of fracture | .82 | ||||
| Fall | 219 | 92.8% | 212 | 92.2% | |
| Trauma | 1 | 0.4% | 3 | 1.3% | |
| Pathologic | 7 | 3.0% | 6 | 2.6% | |
| Unknown | 9 | 3.8% | 7 | 3.0% | |
| ASA* class | .38 | ||||
| I or II | 33 | 14.0% | 23 | 10.0% | |
| III | 166 | 70.3% | 166 | 72.2% | |
| IV | 37 | 15.7% | 41 | 17.8% | |
| Location discharged to | .07 | ||||
| Home or assisted living | 24 | 10.5% | 13 | 5.9% | |
| Nursing home | 196 | 86.0% | 192 | 87.3% | |
| Another hospital or hospice | 8 | 3.5% | 15 | 6.8% | |
| Time to surgery (hours) | 38 | 25 | .001 | ||
| Time from surgery to discharge (days) | 9 | 7 | .04 | ||
| Length of stay | 10.6 | 8.4 | < .00 | ||
| Readmission rate | 25 | 10.6% | 20 | 8.7% | .49 |
Patients were followed for a median of 4.0 years (range 5 days to 5.6 years), and 192 patients were still alive at the end of follow‐up (April 2006). As illustrated in Figure 1, survival did not differ between the 2 treatment groups (P = .36). Overall survival at 1 year was 70.6% (95% confidence interval [CI]: 66.5%, 74.9%). Survival at 1 year in the standard care group was 70.6% (95% CI: 64.9%, 76.8%), whereas in the hospitalist group, it was 70.5% (95% CI: 64.8%, 76.7%). As delineated in Table 2, cardiovascular causes accounted for 34 deaths (25.6%), with 14 of these in the standard care group and 20 in the hospitalist group; 29 deaths (21.8%) had respiratory causes, 20 in the standard care group and 9 in the hospitalist group; and 17 (12.8%) were due to cancer, with 7 and 10 in the standard care and hospitalist groups, respectively. Unknown causes accounted for 21 cases, or 15.8% of total deaths.
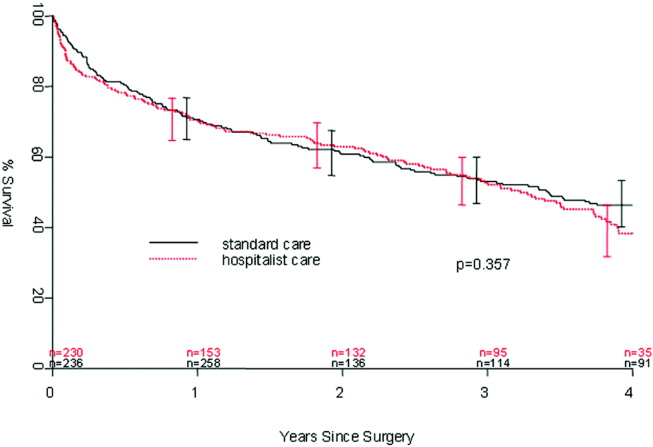
| Standard care | Hospitalist care | Total No. of deaths | % | |
|---|---|---|---|---|
| Cancer | 7 | 10 | 17 | 12.8% |
| Cardiovascular | 14 | 20 | 34 | 25.6% |
| Infectious | 5 | 4 | 9 | 6.8% |
| Neurological | 5 | 10 | 15 | 11.3% |
| Other | 0 | 2 | 2 | 1.5% |
| Renal | 4 | 2 | 6 | 4.5% |
| Respiratory | 20 | 9 | 29 | 21.8% |
| Unknown | 11 | 10 | 21 | 15.8% |
| Total | 66 | 67 | 133 | 100.0% |
In the univariate analysis, we found 29 variables that were significant predictors of survival (Table 3). A hospitalist model of care was not significantly associated with patient survival, despite the shorter length of stay (8.4 days vs. 10.6 days; P < .001) or expedited time to surgery (25 vs. 38 hours; P < .001), when compared with the standard care group, as previously reported by Phy et al.9 In the multivariable analysis (Table 4), however, the independent predictors of mortality were ASA class III or IV versus class II (hazard ratio [HR] 4.20; 95% CI: 2.21, 7.99), admission from a nursing home versus from home or assisted living (HR 2.24; 95% CI: 1.73, 2.90), and inpatient complications, which included patients requiring admission to the intensive care unit (ICU) and those who had a myocardial infarction or acute renal failure as an inpatient (HR 1.85; 95% CI: 1.45, 2.35). Even after adjusting for these factors, survival following hip fracture did not differ significantly between the hospitalist care patients and the standard care patients (HR 1.16; 95% CI: 0.91, 1.48).
| Variable | Hazard ratio (95% CI) | P value |
|---|---|---|
| ||
| Age on admission per 10 years | 1.41 (1.20, 1.65) | < .001 |
| ASA* II | 1.0 (referent) | |
| ASA* III | 5.27 (2.79, 9.96) | < .001 |
| ASA* IV | 11.7 (5.97, 22.9) | < .001 |
| History of chronic obstructive pulmonary disease | 1.82 (1.35, 2.43) | < .001 |
| History of renal insufficiency | 2.40 (1.62,3.55) | < .001 |
| History of stroke/transient ischemic attack | 1.46 (1.10, 1.95) | .01 |
| History of diabetes | 1.70 (1.29,2.25) | < .001 |
| History of congestive heart failure | 2.26 (1.73, 2.96) | < .001 |
| History of coronary artery disease | 1.53 (1.20, 1.97) | < .001 |
| History of dementia | 2.02 (1.57, 2.59) | < .001 |
| Admission from home | 1.0 (referent) | |
| Admission from assisted living | 1.47 (1.06, 2.04) | .02 |
| Admission from nursing home | 3.04 (2.33, 3.98) | < .001 |
| Independent | 1.0 (referent) | |
| Use of assistive device | 1.81 (1.39, 2.36) | < .001 |
| Personal help | 3.49 (2.16, 5.64) | < .001 |
| Nonambulatory | 3.96 (2.47, 6.35) | < .001 |
| Crackles on admission | 2.03 (1.50, 2.74) | < .001 |
| Hypoxia on admission | 1.56 (1.04, 2.32) | .03 |
| Hypotension on admission | 6.21 (2.72, 14.2) | < .001 |
| Tachycardia on admission | 1.66 (1.15, 2.41) | .007 |
| Coumadin on admission | 1.57 (1.13, 2.18) | .007 |
| Confusion/unconsciousness on admission | 2.23 (1.74, 2.87) | < .001 |
| Fever on admission | 1.98 (1.16, 3.40) | .01 |
| Tachypnea on admission | 1.95 (1.39, 2.72) | < .001 |
| Inpatient myocardial Infarction | 3.59 (2.35, 5.48) | < .001 |
| Inpatient atrial fibrillation | 2.00 (1.37, 2.92) | < .001 |
| Inpatient congestive heart failure | 2.62 (1.79, 3.84) | < .0001 |
| Inpatient delirium | 1.46 (1.13, 1.90) | < .005 |
| Inpatient lung infection | 2.52 (1.85, 3.42) | < .001 |
| Inpatient respiratory failure | 2.76 (1.64, 4.66) | < .001 |
| Inpatient mechanical ventilation | 2.56 (1.43, 4.57) | .002 |
| Inpatient renal failure | 3.60 (1.97, 6.61) | < .001 |
| Days from admission to surgery | 1.06 (1.005, 1.12) | .03 |
| Intensive care unit stay | 1.93 (1.51, 2.47) | < .001 |
| Variable | Hazard ratio (95% CI) | P value |
|---|---|---|
| ||
| Age on admission per 10 years | 1.17 (0.99, 1.38) | .07 |
| ASA* class III or IV | 4.20 (2.21, 7.99) | < .001 |
| ASA* class II | 1.0 (referent) | |
| Admission from nursing home | 2.24 (1.73, 2.90) | < .001 |
| Admission from home or assisted living | 1.0 (referent) | |
| Inpatient myocardial infarction, inpatient acute renal failure, or intensive care unit stay | 1.85 (1.45, 2.35) | < .001 |
| No inpatient myocardial infarction, no inpatient acute renal failure, and no intensive care unit stay | 1.0 (referent) | |
DISCUSSION
In our previous study, length of stay and time to surgery were significantly lower in a hospitalist care model.9 The present study shows that neither the reduced length of stay nor the shortened time to surgery of patients managed by the hospitalist group was associated with a difference in mortality compared with a standard care group, despite significantly improved efficiency and processes of care. Thus, our results refute initial concerns of increased mortality in a hospitalist model of care.
Delivery of perioperative medical care to hip fracture patients by hospitalists is associated with significant decreases in time to surgery and length of stay compared with standard care, with no differences in short‐term mortality.9, 18 Although there have been conflicting reports on the impact of length of stay and time to surgery on long‐term outcomes, our findings support previous results that decreased time to surgery was not associated with an observable effect on mortality.1923 A recent study by Orosz et al. that evaluated 1178 patients showed that earlier hip fracture surgery (performed less than 24 hours after admission) was not associated with reduced mortality, although it was associated with shorter length of stay.19 Our study also corroborates the results of an examination of 8383 hip fracture patients by Grimes et al., who found that time to surgery between 24 and 48 hours after admission had no effect on either 30‐day or long‐term mortality compared with that of those who underwent surgery between 48 and 72 hours, between 72 and 96 hours, or more than 96 hours after admission.20 However, both these results and our own are contrary to those of Gdalevich, whose study of 651 patients found that 1‐year mortality was 1.6‐fold higher for those whose hip fracture repair was postponed more than 48 hours.21 However, time to surgery in both the standard care and hospitalist model in our study was well below the 48‐hour cutoff, suggesting that operating anywhere within the normally accepted 48‐hour time frame may not influence long‐term mortality.
Because of the small number of events in both groups, we were unable to specifically compare whether a hospitalist model of care has any specific impact on long‐term cause of death. Although causes of death of patients with hip fracture were consistent with those of previous studies,10, 24 our death rate at 1 year, 29.4%, was higher than that seen among similar population groups at tertiary referral centers.19, 20, 2429 This is most likely a result of the cohort having a high proportion of nursing home patients (22%)19, 24, 26 transferred for evaluation to St. Mary's Hospital, which serves most of Olmsted County, Minnesota. This hospital also has some characteristics of a community‐based hospital, as it is where greater than 95% of all county patients receive care for surgical repair of hip fracture. Mortality rates are often higher at these types of hospitals.30 Previous studies using patients from Olmsted County indicate results can also be extrapolated to a large part of the U.S. population.31 In Pitto et al.'s study, the risk of death was 31% lower in those admitted from home than for those admitted from a nursing home.32 The latter patients normally have a higher number of comorbid conditions and tend to be less ambulatory than those in a community home‐dwelling setting. Our study also demonstrated that admission from a nursing home was a strong predictor of mortality for up to 1 year in the geriatric population. This may reflect the inherent decreased survival in this patient group, which is in agreement with the findings of other studies that showed inactivity and decreased ambulation prior to fracture were associated with increased mortality.3335
Multiple comorbidities, commonly seen in a geriatric population, translate into a higher ASA class and an increased risk of significant in‐hospital complications. Our study confirmed the findings of previous studies that a higher ASA class is a strong predictor of mortality,21, 26, 30, 3537 independent of decreased time to surgery.38 We also noted that significant in‐hospital complications, including renal failure, respiratory failure, and myocardial infarction, are documented predictors of mortality after hip fracture.27 Although mortality may vary depending on fracture type (femoral neck vs. intertrochanteric),3941 these differences were not observed in our study, in line with the results of previous published studies.37, 42 Controlling for age and comorbidities may be why an association was not found between fracture type and mortality. Finally, in a model containing comorbidity, ASA class, and nursing home residence prior to fracture, age was not a significant predictor of mortality.
Our study had a number of limitations. First, this was a retrospective cohort study based on chart review, so some data may have been subject to recording bias, and this might have differed between the serial models. Because of the retrospective nature of the study and referral of some of the patients from outside the community, our 1‐year follow‐up was not complete, but approached a respectable 93%. Other studies have described the benefits derived by a hospitalist practice only following the first year of its implementation, likely because of the hospitalist learning curve.43, 44 This may be why there was no difference in mortality between the standard care and hospitalist groups, as the latter was only in its first year of existence. Additional longitudinal study is required to find out if mortality differences emerge between the treatment groups. Furthermore, although in‐hospital care may influence short‐term outcomes, its effect on long‐term mortality has been unclear. Our data demonstrate that even though a hospitalist service can shorten length of stay and time to surgery, there were no appreciable intermediate differences in mortality at 1 year. Further prospective studies are needed to determine whether this medical‐surgical partnership in caring for these patients provides more favorable outcomes of reducing mortality and intercurrent complications.
Acknowledgements
We thank Donna K. Lawson for her assistance in data collection and management.
- ,,.The future of hip fractures in the United States. Numbers, costs, and potential effects of postmenopausal estrogen.Clin Orthop Relat Res1990 (252):163–166.
- ,,.Hip fractures in the elderly: a world‐wide projection.Osteoporos Int.1992;2:285–289.
- ,,,.The economic cost of hip fractures among elderly women. A one‐year, prospective, observational cohort study with matched‐pair analysis.Belgian Hip Fracture Study Group.J Bone Joint Surg Am.2001;83‐A:493–500.
- ,,.Estimating hip fracture morbidity, mortality and costs.J Am Geriatr Soc.2003;51:364–370.
- ,.The aging of America. Impact on health care costs.JAMA.1990;263:2335–2340.
- ,,,.Medical expenditures for the treatment of osteoporotic fractures in the United States in 1995: report from the National Osteoporosis Foundation.J Bone Miner Res.1997;12(1):24–35.
- US Department of Health and Human Services.Surveillance for selected public health indicators affecting older adults —United States.MMWR Morb Mortal Wkly Rep1999;48:33–34.
- ,.Epidemiology and outcomes of osteoporotic fractures.Lancet.2002;359:1761–1767.
- ,,, et al.Effects of a hospitalist model on elderly patients with hip fracture.Arch Intern Med.2005;165:796–801.
- ,,.Hip fractures in Finland and Great Britain—a comparison of patient characteristics and outcomes.Int Orthop.2001;25:349–354.
- WHO.International Classification of Disease, Ninth Revision (ICD‐9).Geneva, Switzerland:World Health Organization;1977.
- ,,, et al.Medical and surgical comanagement after elective hip and knee arthroplasty: a randomized, controlled trial.Ann Intern Med.2004;141(1):28–38.
- .Regression models and life‐tables (with discussion).J R Stat Soc Ser B.1972;34:187–220.
- ,.Nonparametric estimation from incomplete observations.J Am Statistical Assoc.1958;53:457–481.
- ,.An Introduction to Recursive Partitioning using the RPART Routines: Section of Biostatistics, Mayo Clinic;1997.
- .Computer Intensive Statistical Methods, Validation, Model Selection, and Bootstrap.London:Chapman and Hall;1994.
- ,.A bootstrap resampling procedure for model building: application to the Cox regression model.Stat Med.1992;11:2093–2109.
- ,,.Associations between the hospitalist model of care and quality‐of‐care‐related outcomes in patients undergoing hip fracture surgery.Mayo Clin Proc.2006;81(1):28–31.
- ,,, et al.Association of timing of surgery for hip fracture and patient outcomes.JAMA.2004;291:1738–1743.
- ,,,,.The effects of time‐to‐surgery on mortality and morbidity in patients following hip fracture.Am J Med.2002;112:702–709.
- ,,,.Morbidity and mortality after hip fracture: the impact of operative delay.Arch Orthop Trauma Surg.2004;124:334–340.
- ,,.Delay to surgery prolongs hospital stay in patients with fractures of the proximal femur.J Bone Joint Surg Br.2005;87:1123–1126.
- ,.The timing of surgery for proximal femoral fractures.J Bone Joint Surg Br.1992;74(2):203–205.
- ,,, et al.Hospital readmissions after hospital discharge for hip fracture: surgical and nonsurgical causes and effect on outcomes.J Am Geriatr Soc.2003;51:399–403.
- ,.Mortality after hip fractures.Acta Orthop Scand1979;50(2):161–167.
- ,,,,.Medical complications and outcomes after hip fracture repair.Arch Intern Med.2002;162:2053–2057.
- ,,, et al.Development and initial validation of a risk score for predicting in‐hospital and 1‐year mortality in patients with hip fractures.J Bone Miner Res.2005;20:494–500.
- ,,,,.Outcome after hip fracture in individuals ninety years of age and older.J Orthop Trauma.2001;15(1):34–39.
- ,,,.Hip fractures in the elderly: predictors of one year mortality.J Orthop Trauma.1997;11(3):162–165.
- ,,,.The effect of hospital type and surgical delay on mortality after surgery for hip fracture.J Bone Joint Surg Br.2005;87:361–366.
- .History of the Rochester Epidemiology Project.Mayo Clin Proc.1996;71:266–274.
- .The mortality and social prognosis of hip fractures. A prospective multifactorial study.Int Orthop.1994;18(2):109–113.
- ,.Functional outcome after hip fracture. A 1‐year prospective outcome study of 275 patients.Injury.2003;34:529–532.
- ,,.Rate of mortality for elderly patients after fracture of the hip in the 1980's.J Bone Joint Surg Am.1987;69:1335–1340.
- ,,,.Hip fractures in the elderly. Mortality, functional results and social readaptation.Int Surg.1989;74(3):191–194.
- ,,.Blood transfusion requirements in femoral neck fracture.Injury.2000;31(1):7–10.
- ,,.Mortality and causes of death after hip fractures in The Netherlands.Neth J Med.1992;41(1–2):4–10.
- ,,.Influence of preoperative medical status and delay to surgery on death following a hip fracture.ANZ J Surg.2002;72:405–407.
- ,,,Predictors of mortality and institutionalization after hip fracture: the New Haven EPESE cohort. Established Populations for Epidemiologic Studies of the Elderly.Am J Public Health.1994;84:1807–1812.
- ,,,.Mortality risk after hip fracture.J Orthop Trauma.2003;17(1):53–56.
- ,,.Thirty‐day mortality following hip arthroplasty for acute fracture.J Bone Joint Surg Am.2004;86‐A:1983–1988.
- ,,,,.Functional outcomes and mortality vary among different types of hip fractures: a function of patient characteristics.Clin Orthop Relat Res.2004:64–71.
- ,,,,,.Implementation of a voluntary hospitalist service at a community teaching hospital: improved clinical efficiency and patient outcomes.Ann Intern Med.2002;137:859–865.
- ,,, et al.Effects of physician experience on costs and outcomes on an academic general medicine service: results of a trial of hospitalists.Ann Intern Med.2002;137:866–874.
Because the incidence of hip fracture increases dramatically with age and the elderly are the fastest‐growing portion of the United States population, the number of hip fractures is expected to triple by 2040.1 With the associated increase in postoperative morbidity and mortality, the costs will likely exceed $16‐$20 billion annually.15 Already by 2002, the number of patients with hip fractures exceeded 340,000 in this country, resulting in $8.6 billion in health care expenditures from in‐hospital and posthospital costs.68 This makes hip fracture a serious public health concern and triggers a need to devise an efficient means of caring for these patients. We previously reported that a hospitalist service can decrease time to surgery and shorten length of stay without affecting the number of inpatient deaths or 30‐day readmissions of patients undergoing hip fracture surgery.9 However, one concern with reducing length of stay and time to surgery in the high‐risk hip fracture patient population is the effect on long‐term mortality because the death rate following hip fracture repair may be as high as 43% after 1 year.10 To evaluate this important issue, we assessed mortality over a 1‐year period in the same cohort of patients previously described.9 We also identified predictors associated with mortality. We hypothesized that the expedited surgical treatment and decreased length of stay of a hospitalist‐managed group would not have an adverse effect on 1‐year mortality.
METHODS
Patient Selection
Following approval by the Mayo Clinic Institutional Review Board, we used the Mayo Clinic Surgical Index to identify patients admitted between July 1, 2000, and June 30, 2002, who matched International Classification of Diseases (9th Edition) hip fracture codes.11 These patients were cross‐referenced with those having a primary surgical indication of hip fracture. Patients transferred to our facility more than 72 hours after fracture were excluded from our study. Study patients provided authorization to use their medical records for the purposes of research.
A cohort of 466 patients was identified. For purposes of comparison, patients admitted between July 1, 2000, and June 30, 2001, were deemed to belong to the standard care service, and patients admitted between July 1, 2001, and June 30, 2002, were deemed part of the hospitalist service.
Intervention
Prior to July 2001, Mayo Clinic patients aged 65 and older having surgical repair of a hip fracture were triaged directly to a surgical orthopedic or general medical teaching service. Patients with multiple medical diagnoses were managed initially on a medical teaching service prior to transfer to the operating room. The primary team (medical or surgical) was responsible for the postoperative care of the patient and any orders or consultations required.
After July 1, 2001, these patients were admitted by the orthopedic surgery service and medically comanaged by a hospitalist service, which consisted of a hospitalist physician and 2 allied‐health practitioners. Twelve hospitalists and 12 allied health care professionals cared for patients during the study period. All preoperative and postoperative evaluations, inpatient management decisions, and coordination of outpatient care were performed by the hospitalists. This model of care is similar to one previously studied and published elsewhere.12 A census cap of 20 patients limited the number of patients managed by the hospitalist service. Any overflow of hip fracture patients was triaged directly to a non‐hospitalist‐based primary medical or surgical service as before. Thus, 23 hip fracture patients (10%) admitted after July 1, 2001, were not managed by the hospitalists but are included in this group for an intent‐to‐treat analysis.
Data Collection
Study nurses abstracted all data including admitting diagnoses, demographic features, type and mechanism of hip fracture, admission date and time, American Society of Anesthesia (ASA) class, comorbid medical conditions, medications, all clinical data, and readmission rates. Date of last follow‐up was confirmed using the Mayo Clinic medical record, whereas date and cause of death were obtained from death certificates obtained from state and national sources. Length of stay was defined as the number of days between admission and discharge. Time to surgery was defined in hours as the time from hospital admission to the start of the surgery. Finally, time from surgery to dismissal was defined as the number of days from the initiation of the surgical procedure to the time of dismissal. Thirty‐day readmission was defined as readmission to our hospital within 30 days of discharge date.
Statistical Considerations
Power
The power analysis was based on the end point of survival following surgical repair of hip fracture and primary comparison of patients in the standard care group with those in the hospitalist group. With 236 patients in the standard care group, 230 in the hospitalist group, and 274 observed deaths during the follow‐up period, there was 80% power to detect a hazard ratio of 1.4 or greater as being statistically significant (alpha = 0.05, beta = 0.2).
Analysis
The analysis focused on the end point of survival following surgical repair of hip fracture. In addition to the hospitalist versus standard care service, demographic, baseline clinical, and in‐hospital data were evaluated as potential predictors of survival. Survival rates were estimated using the method of Kaplan and Meier, and relative differences in survival were evaluated using the Cox proportional hazards regression models.13, 14 Potential predictors were analyzed both univariately and in a multivariable model. For the multivariable model, initial variable selection was accomplished using stepwise selection, backward elimination, and recursive partitioning.15 Each method yielded similar results. Bootstrap resampling was then used to confirm the variables selected for each model.16, 17 The threshold of statistical significance was set at P = .05 for all tests. All analyses were conducted in SAS version 8.2 (SAS Institute Inc., Cary, NC) and Splus version 6.2.1 (Insightful Corporation, Seattle, WA).
RESULTS
There were 236 patients with hip fractures (50.6%) admitted to the standard care service, and 230 patients (49.4%) admitted to the hospitalist service. As shown in Table 1, the baseline characteristics of the patients admitted to the 2 services did not differ significantly except that a greater proportion of patients with hypoxia were admitted to the hospitalist service (11.3% vs. 5.5%; P = .02). However, time to surgery, postsurgery stay, and overall length of hospitalization of the hospitalist‐treated patients were all significantly shorter.
| Patient characteristic | Standard care n = 236 | Hospitalist care n = 230 | P value | ||
|---|---|---|---|---|---|
| |||||
| Age (years) | 82 | 83 | .34 | ||
| Female sex | 171 | 72.5% | 163 | 70.9% | .70 |
| Comorbidity | |||||
| Coronary artery disease | 69 | 29.2% | 77 | 33.5% | .32 |
| Congestive heart failure | 41 | 17.4% | 49 | 21.3% | .28 |
| Chronic obstructive pulmonary disease | 36 | 15.3% | 38 | 16.5% | .71 |
| Cerebral vascular accident or transient ischemic attack | 36 | 15.3% | 50 | 21.7% | .07 |
| Dementia | 54 | 22.9% | 62 | 27.0% | .31 |
| Diabetes | 45 | 19.1% | 46 | 20.0% | .80 |
| Renal insufficiency | 17 | 7.2% | 17 | 7.4% | .94 |
| Residence at time of admission | .07 | ||||
| Home | 149 | 63.1% | 138 | 60.0% | |
| Assisted living | 32 | 13.6% | 42 | 18.3% | |
| Nursing home | 55 | 23.3% | 50 | 21.7% | |
| Ambulatory status at time of admission | .14 | ||||
| Independent | 114 | 48.3% | 89 | 38.7% | |
| Assistive device | 99 | 41.9% | 115 | 50.0% | |
| Personal help | 9 | 3.8% | 16 | 7.0% | |
| Transfer to bed or chair | 9 | 3.8% | 7 | 3.0% | |
| Nonambulatory | 5 | 2.1% | 3 | 1.3% | |
| Signs at time of admission | |||||
| Hypotension | 4 | 1.7% | 3 | 1.3% | > .99 |
| Hypoxia | 13 | 5.5% | 26 | 11.3% | .02 |
| Pulmonary edema | 37 | 15.7% | 29 | 12.6% | .34 |
| Tachycardia | 19 | 8.1% | 25 | 10.9% | .3 |
| Fracture type | .78 | ||||
| Femoral neck | 118 | 50.0% | 118 | 51.3% | |
| Intertrochanteric | 118 | 50.0% | 112 | 48.7% | |
| Mechanism of fracture | .82 | ||||
| Fall | 219 | 92.8% | 212 | 92.2% | |
| Trauma | 1 | 0.4% | 3 | 1.3% | |
| Pathologic | 7 | 3.0% | 6 | 2.6% | |
| Unknown | 9 | 3.8% | 7 | 3.0% | |
| ASA* class | .38 | ||||
| I or II | 33 | 14.0% | 23 | 10.0% | |
| III | 166 | 70.3% | 166 | 72.2% | |
| IV | 37 | 15.7% | 41 | 17.8% | |
| Location discharged to | .07 | ||||
| Home or assisted living | 24 | 10.5% | 13 | 5.9% | |
| Nursing home | 196 | 86.0% | 192 | 87.3% | |
| Another hospital or hospice | 8 | 3.5% | 15 | 6.8% | |
| Time to surgery (hours) | 38 | 25 | .001 | ||
| Time from surgery to discharge (days) | 9 | 7 | .04 | ||
| Length of stay | 10.6 | 8.4 | < .00 | ||
| Readmission rate | 25 | 10.6% | 20 | 8.7% | .49 |
Patients were followed for a median of 4.0 years (range 5 days to 5.6 years), and 192 patients were still alive at the end of follow‐up (April 2006). As illustrated in Figure 1, survival did not differ between the 2 treatment groups (P = .36). Overall survival at 1 year was 70.6% (95% confidence interval [CI]: 66.5%, 74.9%). Survival at 1 year in the standard care group was 70.6% (95% CI: 64.9%, 76.8%), whereas in the hospitalist group, it was 70.5% (95% CI: 64.8%, 76.7%). As delineated in Table 2, cardiovascular causes accounted for 34 deaths (25.6%), with 14 of these in the standard care group and 20 in the hospitalist group; 29 deaths (21.8%) had respiratory causes, 20 in the standard care group and 9 in the hospitalist group; and 17 (12.8%) were due to cancer, with 7 and 10 in the standard care and hospitalist groups, respectively. Unknown causes accounted for 21 cases, or 15.8% of total deaths.
| Standard care | Hospitalist care | Total No. of deaths | % | |
|---|---|---|---|---|
| Cancer | 7 | 10 | 17 | 12.8% |
| Cardiovascular | 14 | 20 | 34 | 25.6% |
| Infectious | 5 | 4 | 9 | 6.8% |
| Neurological | 5 | 10 | 15 | 11.3% |
| Other | 0 | 2 | 2 | 1.5% |
| Renal | 4 | 2 | 6 | 4.5% |
| Respiratory | 20 | 9 | 29 | 21.8% |
| Unknown | 11 | 10 | 21 | 15.8% |
| Total | 66 | 67 | 133 | 100.0% |
In the univariate analysis, we found 29 variables that were significant predictors of survival (Table 3). A hospitalist model of care was not significantly associated with patient survival, despite the shorter length of stay (8.4 days vs. 10.6 days; P < .001) or expedited time to surgery (25 vs. 38 hours; P < .001), when compared with the standard care group, as previously reported by Phy et al.9 In the multivariable analysis (Table 4), however, the independent predictors of mortality were ASA class III or IV versus class II (hazard ratio [HR] 4.20; 95% CI: 2.21, 7.99), admission from a nursing home versus from home or assisted living (HR 2.24; 95% CI: 1.73, 2.90), and inpatient complications, which included patients requiring admission to the intensive care unit (ICU) and those who had a myocardial infarction or acute renal failure as an inpatient (HR 1.85; 95% CI: 1.45, 2.35). Even after adjusting for these factors, survival following hip fracture did not differ significantly between the hospitalist care patients and the standard care patients (HR 1.16; 95% CI: 0.91, 1.48).
| Variable | Hazard ratio (95% CI) | P value |
|---|---|---|
| ||
| Age on admission per 10 years | 1.41 (1.20, 1.65) | < .001 |
| ASA* II | 1.0 (referent) | |
| ASA* III | 5.27 (2.79, 9.96) | < .001 |
| ASA* IV | 11.7 (5.97, 22.9) | < .001 |
| History of chronic obstructive pulmonary disease | 1.82 (1.35, 2.43) | < .001 |
| History of renal insufficiency | 2.40 (1.62,3.55) | < .001 |
| History of stroke/transient ischemic attack | 1.46 (1.10, 1.95) | .01 |
| History of diabetes | 1.70 (1.29,2.25) | < .001 |
| History of congestive heart failure | 2.26 (1.73, 2.96) | < .001 |
| History of coronary artery disease | 1.53 (1.20, 1.97) | < .001 |
| History of dementia | 2.02 (1.57, 2.59) | < .001 |
| Admission from home | 1.0 (referent) | |
| Admission from assisted living | 1.47 (1.06, 2.04) | .02 |
| Admission from nursing home | 3.04 (2.33, 3.98) | < .001 |
| Independent | 1.0 (referent) | |
| Use of assistive device | 1.81 (1.39, 2.36) | < .001 |
| Personal help | 3.49 (2.16, 5.64) | < .001 |
| Nonambulatory | 3.96 (2.47, 6.35) | < .001 |
| Crackles on admission | 2.03 (1.50, 2.74) | < .001 |
| Hypoxia on admission | 1.56 (1.04, 2.32) | .03 |
| Hypotension on admission | 6.21 (2.72, 14.2) | < .001 |
| Tachycardia on admission | 1.66 (1.15, 2.41) | .007 |
| Coumadin on admission | 1.57 (1.13, 2.18) | .007 |
| Confusion/unconsciousness on admission | 2.23 (1.74, 2.87) | < .001 |
| Fever on admission | 1.98 (1.16, 3.40) | .01 |
| Tachypnea on admission | 1.95 (1.39, 2.72) | < .001 |
| Inpatient myocardial Infarction | 3.59 (2.35, 5.48) | < .001 |
| Inpatient atrial fibrillation | 2.00 (1.37, 2.92) | < .001 |
| Inpatient congestive heart failure | 2.62 (1.79, 3.84) | < .0001 |
| Inpatient delirium | 1.46 (1.13, 1.90) | < .005 |
| Inpatient lung infection | 2.52 (1.85, 3.42) | < .001 |
| Inpatient respiratory failure | 2.76 (1.64, 4.66) | < .001 |
| Inpatient mechanical ventilation | 2.56 (1.43, 4.57) | .002 |
| Inpatient renal failure | 3.60 (1.97, 6.61) | < .001 |
| Days from admission to surgery | 1.06 (1.005, 1.12) | .03 |
| Intensive care unit stay | 1.93 (1.51, 2.47) | < .001 |
| Variable | Hazard ratio (95% CI) | P value |
|---|---|---|
| ||
| Age on admission per 10 years | 1.17 (0.99, 1.38) | .07 |
| ASA* class III or IV | 4.20 (2.21, 7.99) | < .001 |
| ASA* class II | 1.0 (referent) | |
| Admission from nursing home | 2.24 (1.73, 2.90) | < .001 |
| Admission from home or assisted living | 1.0 (referent) | |
| Inpatient myocardial infarction, inpatient acute renal failure, or intensive care unit stay | 1.85 (1.45, 2.35) | < .001 |
| No inpatient myocardial infarction, no inpatient acute renal failure, and no intensive care unit stay | 1.0 (referent) | |
DISCUSSION
In our previous study, length of stay and time to surgery were significantly lower in a hospitalist care model.9 The present study shows that neither the reduced length of stay nor the shortened time to surgery of patients managed by the hospitalist group was associated with a difference in mortality compared with a standard care group, despite significantly improved efficiency and processes of care. Thus, our results refute initial concerns of increased mortality in a hospitalist model of care.
Delivery of perioperative medical care to hip fracture patients by hospitalists is associated with significant decreases in time to surgery and length of stay compared with standard care, with no differences in short‐term mortality.9, 18 Although there have been conflicting reports on the impact of length of stay and time to surgery on long‐term outcomes, our findings support previous results that decreased time to surgery was not associated with an observable effect on mortality.1923 A recent study by Orosz et al. that evaluated 1178 patients showed that earlier hip fracture surgery (performed less than 24 hours after admission) was not associated with reduced mortality, although it was associated with shorter length of stay.19 Our study also corroborates the results of an examination of 8383 hip fracture patients by Grimes et al., who found that time to surgery between 24 and 48 hours after admission had no effect on either 30‐day or long‐term mortality compared with that of those who underwent surgery between 48 and 72 hours, between 72 and 96 hours, or more than 96 hours after admission.20 However, both these results and our own are contrary to those of Gdalevich, whose study of 651 patients found that 1‐year mortality was 1.6‐fold higher for those whose hip fracture repair was postponed more than 48 hours.21 However, time to surgery in both the standard care and hospitalist model in our study was well below the 48‐hour cutoff, suggesting that operating anywhere within the normally accepted 48‐hour time frame may not influence long‐term mortality.
Because of the small number of events in both groups, we were unable to specifically compare whether a hospitalist model of care has any specific impact on long‐term cause of death. Although causes of death of patients with hip fracture were consistent with those of previous studies,10, 24 our death rate at 1 year, 29.4%, was higher than that seen among similar population groups at tertiary referral centers.19, 20, 2429 This is most likely a result of the cohort having a high proportion of nursing home patients (22%)19, 24, 26 transferred for evaluation to St. Mary's Hospital, which serves most of Olmsted County, Minnesota. This hospital also has some characteristics of a community‐based hospital, as it is where greater than 95% of all county patients receive care for surgical repair of hip fracture. Mortality rates are often higher at these types of hospitals.30 Previous studies using patients from Olmsted County indicate results can also be extrapolated to a large part of the U.S. population.31 In Pitto et al.'s study, the risk of death was 31% lower in those admitted from home than for those admitted from a nursing home.32 The latter patients normally have a higher number of comorbid conditions and tend to be less ambulatory than those in a community home‐dwelling setting. Our study also demonstrated that admission from a nursing home was a strong predictor of mortality for up to 1 year in the geriatric population. This may reflect the inherent decreased survival in this patient group, which is in agreement with the findings of other studies that showed inactivity and decreased ambulation prior to fracture were associated with increased mortality.3335
Multiple comorbidities, commonly seen in a geriatric population, translate into a higher ASA class and an increased risk of significant in‐hospital complications. Our study confirmed the findings of previous studies that a higher ASA class is a strong predictor of mortality,21, 26, 30, 3537 independent of decreased time to surgery.38 We also noted that significant in‐hospital complications, including renal failure, respiratory failure, and myocardial infarction, are documented predictors of mortality after hip fracture.27 Although mortality may vary depending on fracture type (femoral neck vs. intertrochanteric),3941 these differences were not observed in our study, in line with the results of previous published studies.37, 42 Controlling for age and comorbidities may be why an association was not found between fracture type and mortality. Finally, in a model containing comorbidity, ASA class, and nursing home residence prior to fracture, age was not a significant predictor of mortality.
Our study had a number of limitations. First, this was a retrospective cohort study based on chart review, so some data may have been subject to recording bias, and this might have differed between the serial models. Because of the retrospective nature of the study and referral of some of the patients from outside the community, our 1‐year follow‐up was not complete, but approached a respectable 93%. Other studies have described the benefits derived by a hospitalist practice only following the first year of its implementation, likely because of the hospitalist learning curve.43, 44 This may be why there was no difference in mortality between the standard care and hospitalist groups, as the latter was only in its first year of existence. Additional longitudinal study is required to find out if mortality differences emerge between the treatment groups. Furthermore, although in‐hospital care may influence short‐term outcomes, its effect on long‐term mortality has been unclear. Our data demonstrate that even though a hospitalist service can shorten length of stay and time to surgery, there were no appreciable intermediate differences in mortality at 1 year. Further prospective studies are needed to determine whether this medical‐surgical partnership in caring for these patients provides more favorable outcomes of reducing mortality and intercurrent complications.
Acknowledgements
We thank Donna K. Lawson for her assistance in data collection and management.
- ,,.The future of hip fractures in the United States. Numbers, costs, and potential effects of postmenopausal estrogen.Clin Orthop Relat Res1990 (252):163–166.
- ,,.Hip fractures in the elderly: a world‐wide projection.Osteoporos Int.1992;2:285–289.
- ,,,.The economic cost of hip fractures among elderly women. A one‐year, prospective, observational cohort study with matched‐pair analysis.Belgian Hip Fracture Study Group.J Bone Joint Surg Am.2001;83‐A:493–500.
- ,,.Estimating hip fracture morbidity, mortality and costs.J Am Geriatr Soc.2003;51:364–370.
- ,.The aging of America. Impact on health care costs.JAMA.1990;263:2335–2340.
- ,,,.Medical expenditures for the treatment of osteoporotic fractures in the United States in 1995: report from the National Osteoporosis Foundation.J Bone Miner Res.1997;12(1):24–35.
- US Department of Health and Human Services.Surveillance for selected public health indicators affecting older adults —United States.MMWR Morb Mortal Wkly Rep1999;48:33–34.
- ,.Epidemiology and outcomes of osteoporotic fractures.Lancet.2002;359:1761–1767.
- ,,, et al.Effects of a hospitalist model on elderly patients with hip fracture.Arch Intern Med.2005;165:796–801.
- ,,.Hip fractures in Finland and Great Britain—a comparison of patient characteristics and outcomes.Int Orthop.2001;25:349–354.
- WHO.International Classification of Disease, Ninth Revision (ICD‐9).Geneva, Switzerland:World Health Organization;1977.
- ,,, et al.Medical and surgical comanagement after elective hip and knee arthroplasty: a randomized, controlled trial.Ann Intern Med.2004;141(1):28–38.
- .Regression models and life‐tables (with discussion).J R Stat Soc Ser B.1972;34:187–220.
- ,.Nonparametric estimation from incomplete observations.J Am Statistical Assoc.1958;53:457–481.
- ,.An Introduction to Recursive Partitioning using the RPART Routines: Section of Biostatistics, Mayo Clinic;1997.
- .Computer Intensive Statistical Methods, Validation, Model Selection, and Bootstrap.London:Chapman and Hall;1994.
- ,.A bootstrap resampling procedure for model building: application to the Cox regression model.Stat Med.1992;11:2093–2109.
- ,,.Associations between the hospitalist model of care and quality‐of‐care‐related outcomes in patients undergoing hip fracture surgery.Mayo Clin Proc.2006;81(1):28–31.
- ,,, et al.Association of timing of surgery for hip fracture and patient outcomes.JAMA.2004;291:1738–1743.
- ,,,,.The effects of time‐to‐surgery on mortality and morbidity in patients following hip fracture.Am J Med.2002;112:702–709.
- ,,,.Morbidity and mortality after hip fracture: the impact of operative delay.Arch Orthop Trauma Surg.2004;124:334–340.
- ,,.Delay to surgery prolongs hospital stay in patients with fractures of the proximal femur.J Bone Joint Surg Br.2005;87:1123–1126.
- ,.The timing of surgery for proximal femoral fractures.J Bone Joint Surg Br.1992;74(2):203–205.
- ,,, et al.Hospital readmissions after hospital discharge for hip fracture: surgical and nonsurgical causes and effect on outcomes.J Am Geriatr Soc.2003;51:399–403.
- ,.Mortality after hip fractures.Acta Orthop Scand1979;50(2):161–167.
- ,,,,.Medical complications and outcomes after hip fracture repair.Arch Intern Med.2002;162:2053–2057.
- ,,, et al.Development and initial validation of a risk score for predicting in‐hospital and 1‐year mortality in patients with hip fractures.J Bone Miner Res.2005;20:494–500.
- ,,,,.Outcome after hip fracture in individuals ninety years of age and older.J Orthop Trauma.2001;15(1):34–39.
- ,,,.Hip fractures in the elderly: predictors of one year mortality.J Orthop Trauma.1997;11(3):162–165.
- ,,,.The effect of hospital type and surgical delay on mortality after surgery for hip fracture.J Bone Joint Surg Br.2005;87:361–366.
- .History of the Rochester Epidemiology Project.Mayo Clin Proc.1996;71:266–274.
- .The mortality and social prognosis of hip fractures. A prospective multifactorial study.Int Orthop.1994;18(2):109–113.
- ,.Functional outcome after hip fracture. A 1‐year prospective outcome study of 275 patients.Injury.2003;34:529–532.
- ,,.Rate of mortality for elderly patients after fracture of the hip in the 1980's.J Bone Joint Surg Am.1987;69:1335–1340.
- ,,,.Hip fractures in the elderly. Mortality, functional results and social readaptation.Int Surg.1989;74(3):191–194.
- ,,.Blood transfusion requirements in femoral neck fracture.Injury.2000;31(1):7–10.
- ,,.Mortality and causes of death after hip fractures in The Netherlands.Neth J Med.1992;41(1–2):4–10.
- ,,.Influence of preoperative medical status and delay to surgery on death following a hip fracture.ANZ J Surg.2002;72:405–407.
- ,,,Predictors of mortality and institutionalization after hip fracture: the New Haven EPESE cohort. Established Populations for Epidemiologic Studies of the Elderly.Am J Public Health.1994;84:1807–1812.
- ,,,.Mortality risk after hip fracture.J Orthop Trauma.2003;17(1):53–56.
- ,,.Thirty‐day mortality following hip arthroplasty for acute fracture.J Bone Joint Surg Am.2004;86‐A:1983–1988.
- ,,,,.Functional outcomes and mortality vary among different types of hip fractures: a function of patient characteristics.Clin Orthop Relat Res.2004:64–71.
- ,,,,,.Implementation of a voluntary hospitalist service at a community teaching hospital: improved clinical efficiency and patient outcomes.Ann Intern Med.2002;137:859–865.
- ,,, et al.Effects of physician experience on costs and outcomes on an academic general medicine service: results of a trial of hospitalists.Ann Intern Med.2002;137:866–874.
Copyright © 2007 Society of Hospital Medicine
