User login
Survey of Academic PHM Programs in the US
Pediatric hospital medicine (PHM) is a relatively new field that has been growing rapidly over the past 20 years.[1] The field has been increasingly recognized for its contributions to high‐quality patient care, patient safety, systems improvement, medical education, and research.[2, 3, 4, 5, 6, 7, 8, 9] However, there appears to be significant variation among programs, even in basic factors such as how clinical effort is defined, the extent of in‐house coverage provided, and the scope of clinical services provided, and there exists a paucity of data describing these variations.[8]
Most previously published work did not specifically focus on academic programs,[2, 3, 8, 9] and specifically targeted hospital leadership,[2] practicing hospitalists,[3] residents,[7] and pediatric residency or clerkship directors,[4, 7] rather than hospitalist directors.[9] Furthermore, previous work focused on specific aspects of PHM programs such as education,[4, 7] value,[2] work environment,[9] and clinical practice,[3] rather than a more comprehensive approach.
We conducted a survey of academic PHM programs to learn about the current state and variation among programs across multiple domains (organizational, administrative, and financial). We speculated that:
- Many institutions currently lacking an academic PHM program were planning on starting a program in the next 3 years.
- Variability exists in hospitalist workload among programs.
- In programs providing clinical coverage at more than 1 site, variability exists in the relationship between the main site and satellite site(s) in terms of decision making, scheduling, and reporting of performance.
METHODS
Sample
We used the online American Medical Association Fellowship and Residency Electronic Interactive Database (FREIDA) to identify all 198 accredited pediatric residency training programs in the United States. A total of 246 hospitals were affiliated with these programs, and all of these were targeted for the survey. In addition, academic PHM program leaders were targeted directly with email invitations through the American Academy of Pediatrics (AAP) Section on Hospital Medicine LISTSERV.
Survey Instrument
A 49‐question online survey on the administrative, organizational, and financial aspects of academic PHM programs was developed with the input of academic PHM hospital leaders from Cincinnati Children's Hospital Medical Center and St. Louis Children's Hospital. First, the survey questions were developed de novo by the researchers. Then, multiple hospitalist leaders from each institution took the survey and gave feedback on content and structure. Using this feedback, changes were made and then tested by the leaders taking the new version of the survey. This process was repeated for 3 cycles until consensus was reached by the researchers on the final version of the survey. The survey contained questions that asked if the program provided coverage at a single site or at multiple sites and utilized a combination of open‐ended and fixed‐choice questions. For some questions, more than 1 answer was permitted. For the purposes of this survey, we utilized the following definitions adapted from the Society of Hospital Medicine. A hospitalist was defined as a physician who specializes in the practice of hospital medicine.[10] An academic PHM program was defined as any hospitalist practice associated with a pediatric residency program.[11] A nocturnist was defined as a hospitalist who predominantly works a schedule providing night coverage.[12]
Survey Administration
SurveyMonkey, an online survey software, was used to administer the survey. In June 2011, letters were mailed to all 246 hospitals affiliated with an accredited pediatric residency program as described above. These were addressed to either the hospital medicine director (if identified using the institutions Web site) or pediatric residency director. The letter asked the recipient to either participate in the survey or forward the survey to the physician best able to answer the survey. The letters included a description of the study and a link to the online survey. Of note, there was no follow‐up on this process. We also distributed the direct link to the survey and a copy of the letter utilizing the AAP Section on Hospital Medicine LISTSERV. Two reminders were sent through the LISTSERV in the month after the initial request. All respondents were informed that they would receive the deidentified raw data as an incentive to participate in the survey. Respondents were defined as those answering the first question, Does your program have an academic hospitalist program?
Statistical Analysis
Completed survey responses were extracted to Microsoft Excel (Microsoft Corp., Redmond, WA) for data analysis. Basic statistics were utilized to determine response rates for each question. Data were stratified for program type (single site or at multiple sites). For some questions, data were further stratified for the main site of multiple‐site programs for comparison to single‐site programs. In a few instances, more than 1 physician from a particular program responded to the survey. For these, the most appropriate respondent (PHM director, residency director, senior hospitalist) was identified utilizing the programs' publicly available Web site; only that physician's answers were used in the analysis.
Human Subjects Protection
This study was determined to be exempt from review by the Cincinnati Children's Hospital Medical Center and Washington University in St. Louis institutional review boards. All potential responders received written information about the survey. Survey design allowed for anonymous responses with voluntary documentation of program name and responders' contact information. The willingness to respond was qualified as implied consent. Data were deidentified prior to analysis and prior to sharing with the survey participants.
RESULTS
Response Rates
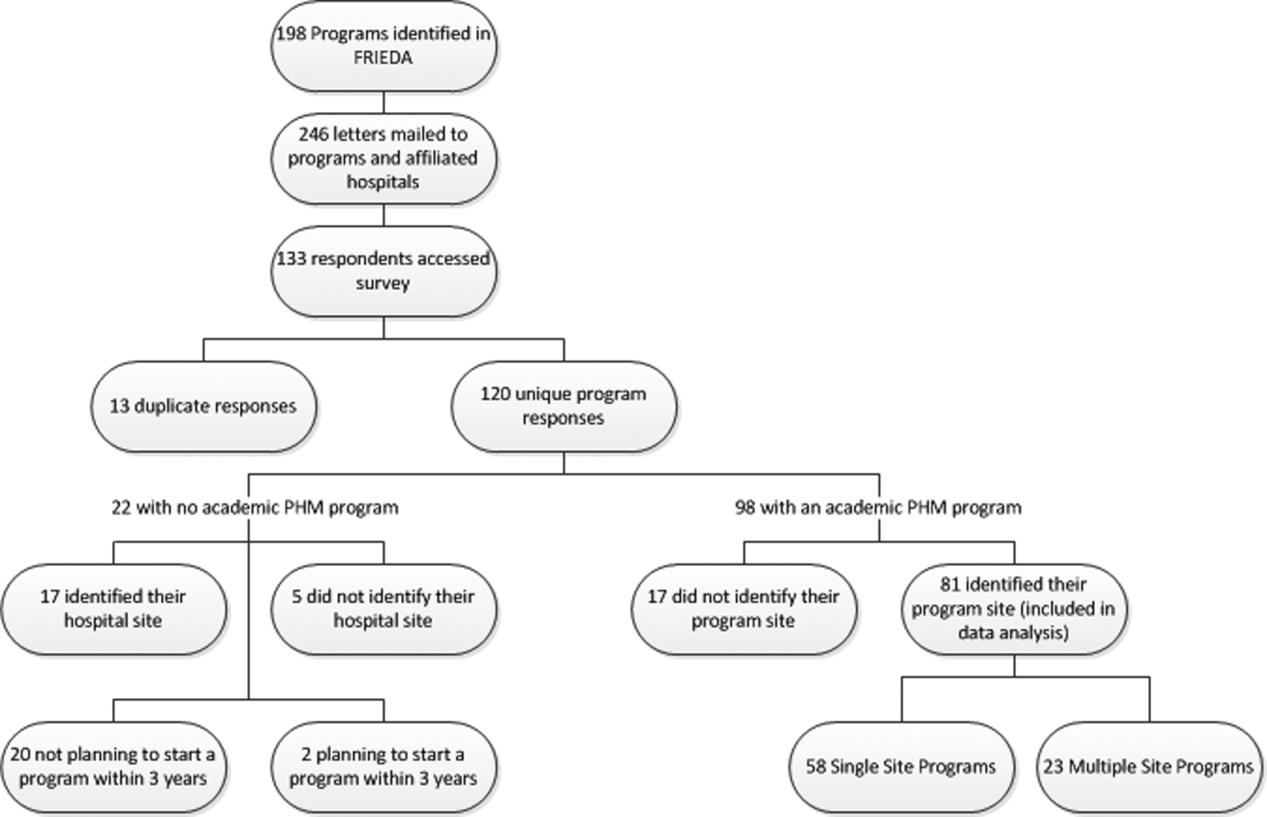
A total of 133 responses were received. Duplicate responses from the same program (13/133) were eliminated from the analysis. This yielded an overall response rate of 48.8% (120/246). A total of 81.7% (98/120) of institutions reported having an academic PHM program. Of the 18.3% (22/120) of institutions reporting not having a program, 9.1% (2/22) reported planning on starting a program in the next 3 years. Of the 98 respondents with an academic PHM program, 17 answered only the first survey question, Does your program have an academic hospitalist program? The remaining 81 completed surveys were left for further analysis. All of these respondents identified their program, and therefore we are certain that there were no duplicate responses in the analytic dataset. Of these, 23 (28%) indicated that their programs provided clinical care at multiple sites, and 58 (72%) indicated that their program provided care at a single site (Figure 1).

Administrative
Respondents reported wide variation for the definition of a 1.0 full‐time employee (FTE) hospitalist in their group. This included the units used (hours/year, weeks/year, shifts/year) as well as actual physician workload (Table 1). Weeks/year was the most common unit utilized by programs to define workload (66% of single‐site programs, 48% of multiple‐site programs), followed by hours/year (19%, 22%) and shifts/year (14%, 22%). The mean and median workload per FTE is represented (Table 1). The large ranges and the standard deviations from the mean indicate variability in workload per FTE (Table 1).
| Single‐Site Program | Multiple‐Site Programs | |||||||||
|---|---|---|---|---|---|---|---|---|---|---|
| % Programs | Mean | Median | SD | Range | % Programs | Mean | Median | SD | Range | |
| ||||||||||
| Weeks on service | 66 | 27.14 | 26 | 8.1 | 1246 | 48 | 27.2 | 24 | 9.6 | 1736 |
| Hours/year | 19 | 1886.25 | 1880 | 231.2 | 16002300 | 22 | 1767.33 | 1738 | 109.0 | 16641944 |
| Shifts/year* | 14 | 183 | 191 | 52.2 | 182240 | 22 | 191 | 184 | 38.3 | 155214 |
Scheduled in‐house hospitalist coverage also varied. Daytime coverage was defined as until 3 to 5 pm, evening coverage was defined a until 10 pm to midnight, and 24‐hour coverage was defined a 24/7. Programs reported plans to increase in‐house coverage with the implementation of the 2011 Accreditation Council for Graduate Medical Education (ACGME) resident work hours restrictions.[13] Among single‐site programs, there was a planned 50% increase in day/evening coverage (14% to 21%), with a planned decrease in day‐only coverage, and no change in 24/7 coverage (Table 2). Among the main sites of multiple‐site programs, there was a planned 50% increase in 24/7 in‐house coverage (35% to 52%), with a planned decrease in day‐only coverage, and no change in day/evening coverage (Table 3). Among the satellite sites of multiple‐site programs, there was a planned 9% increase in 24/7 coverage (41% to 50%), with a planned decrease in day‐only coverage, and no change in day/evening coverage (Table 2). Most programs reported that all hospitalists share night coverage (87% single site, 89% multiple sites) (Table 2). Multiple‐site programs were more likely than single‐site programs to use nocturnists, moonlighters, and incentives for those providing evening or night coverage (Table 2).
| Single Site (n=58) | Main Site of Multiple‐Site Programs (n=23) | |||
|---|---|---|---|---|
| Proportion | Response Rate | Proportion | Response Rate | |
| ||||
| Organizational | ||||
| Night shifts | .79 (46/58) | .83 (19/23) | ||
| All share nights | .87 (40/46) | .89 (17/19) | ||
| Nocturnists | .09 (4/46) | .26 (5/19) | ||
| Moonlighters | .04 (2/46) | .12 (2/19) | ||
| Night shift incentives | .74 (43/58) | .78 (18/23) | ||
| Financial | .12 (5/43) | .28 (5/18) | ||
| Time | .12 (5/43) | .22 (4/18) | ||
| No incentives | .79 (34/43) | .61 (11/18) | ||
| In‐house hospitalist coverage pre July 2011a | 1.0 (58/58) | 1.0 (23/23) | ||
| 24/7 | .29 (17/58) | .35 (8/23) | ||
| Day and evening | .14 (8/58) | .17 (4/23) | ||
| Day only | .57 (33/58) | .48 (11/23) | ||
| In‐house hospitalist coverage post July 2011a | 1.0 (58/58) | 1.0 (23/23) | ||
| 24/7 | .29 (17/58) | .52 (12/23) | ||
| Day and evening | .21 (12/58) | .17 (4/23) | ||
| Day only | .50 (29/58) | .30 (7/23) | ||
| Administrative | ||||
| Own division | .32 (18/57) | .98 (57/58) | .74 (17/23) | 1.0 (23/23) |
| Part of another division | .68 (39/57) | .26 (6/23) | ||
| Financial | ||||
| Revenues>expenses | .26 (14/53) | .91 (53/58) | .04 (1/23) | .04 (19/23) |
| Incentives supplement base salary | .45 (25/55) | .95 (55/58) | .48 (10/21) | .91 (21/23) |
| Metrics used to determine incentivesb | .47 (27/58) | .52 (12/23) | ||
| RVUs/MD | .85 (23/27) | .83 (10/12) | ||
| Costs/discharge | .19 (5/27) | .08 (1/12) | ||
| Financial reportingb | .81 (47/58) | .04 (19/23) | ||
| Charges | .64 (30/47) | .68 (13/19) | ||
| Collections | .66 (31/47) | .68 (13/19) | ||
| RVUs | .77 (36/47) | .47 (9/19) | ||
| Main Site (n=23) | Satellite Sites (n=51) | |||
|---|---|---|---|---|
| Proportion | Response Rate | Proportion | Response Rate | |
| In‐house hospitalist coverage pre July 2011 | 1.0 (23/23) | .80 (41/51) | ||
| 24/7 | .35 (8/23) | .41 (17/41) | ||
| Day and evening | .17 (4/23) | .10 (4/41) | ||
| Day only | .48 (11/23) | .49 (20/41) | ||
| In‐house hospitalist coverage post July 2011 | 1.0 (23/23) | |||
| 24/7 | .52 (12/23) | .50 (19/38) | .75 (38/51) | |
| Day and evening | .17 (4/23) | .11 (4/38) | ||
| Day only | .30 (7/23) | .39 (15/38) | ||
| Night shift coverage | .83 (19/23) | .78 (18/23) | ||
| All share nights | .89 (17/19) | .94 (17/18) | ||
| Nocturnists | .26 (5/19) | .22 (4/18) | ||
| Moonlighters | .12 (2/19) | .17 (3/18) | ||
The vast majority of multiple‐site programs reported that their different clinical sites are considered parts of a single hospitalist program (96%), and that there is a designated medical director for each site (83%). However, only 70% of multiple‐site programs report that decisions concerning physician coverage are made as a group, and only 65% report that scheduling is done centrally. In addition, there is variability in how quality, safety, and patient satisfaction is reported (group vs site). The majority of programs report sharing revenues and expenses among the sites (Table 4).
| Proportion | Response Rate | |
|---|---|---|
| Sites regularly collaborate on: | 1.0 (23/23) | |
| Quality improvement projects | .74 (17/23) | |
| Safety initiatives | .74 (17/23) | |
| Research | .48 (11/23) | |
| Have a designated hospitalist medical director for each site | .83 (19/23) | 1.0 (23/23) |
| Different sites considered parts of a single hospitalist program | .96 (22/23) | 1.0 (23/23) |
| Make decisions on program/coverage/hour changes as a group | .70 (16/23) | 1.0 (23/23) |
| Scheduling done centrally | .65 (15/23) | 1.0 (23/23) |
| Report or track the following as individual sites: | ||
| Quality measures | .43 (9/21) | .91 (21/23) |
| Safety measures | .48 (10/21) | .91 (21/23) |
| Patient satisfaction | .50 (10/20) | .87 (20/23) |
| Report or track the following as a group: | ||
| Quality measures | .33 (7/21) | .91 (21/23) |
| Safety measures | .33 (7/21) | .91 (21/23) |
| Patient satisfaction | .30 (6/20) | .87 (20/23) |
| Report or track the following as both individual sites and as a group: | ||
| Quality measures | .24 (5/21) | .91 (21/23) |
| Safety measures | .19 (4/21) | .91 (21/23) |
| Patient satisfaction | .25 (4/20) | .87 (20/23) |
| Sites share revenues and expenses | .67 (14/21) | .91 (21/23) |
Organizational
Of the single‐site programs that answered the question Is your hospital medicine program considered its own division or a section within another division? 32% reported that their programs were considered its own division, and 68% reported that they were a part of another division, predominately (62%) general pediatrics, but also a few (6% combined) within emergency medicine, critical care, physical medicine and rehabilitation, and infectious diseases. Of the multiple‐site programs, a majority of 74% programs were their own division, and 26% were part of another division (Table 2). Respondents reported that their satellite sites included pediatric units in small community hospitals, small pediatric hospitals, large nonpediatric hospitals with pediatric units, rehabilitation facilities, and Shriner orthopedic hospitals.
Financial
Of the single‐site programs that answered the question Do patient revenues produced by your hospitalist group cover all expenses? only 26% reported that revenues exceeded expenses. Of the multiple‐site programs responding to this question, only 4% reported that the main site of their programs had revenues greater than expenses (Table 2). Programs used a combination of metrics to report revenue, and relative value unit (RVU)/medical doctor (MD) is the most commonly used metric to determine incentive pay (Table 2).
DISCUSSION
Our study demonstrates that academic PHM programs are common, which is consistent with previous data.[4, 7, 9, 14] The data support our belief that more institutions are planning on starting PHM programs. However, there exist much variability in a variety of program factors.[2, 3, 8, 9, 14] The fact that up to 35% of categorical pediatric residents are considering a career as a hospitalist further highlights the need for better data on PHM programs.[7]
We demonstrated that variability existed in hospitalist workload at academic PHM programs. We found considerable variation in the workload per hospitalist (large ranges and standard deviations), as well as variability in how an FTE is defined (hours/year, weeks/year, shifts/year) (Table 1). In addition, survey respondents might have interpreted certain questions differently, and this might have led to increased variability in the data. For example, the question concerning the definition of an FTE was worded as A clinical FTE is defined as. Some of the reported variation in workload might be partially explained by hospitalists having additional nonclinical responsibilities within hospital medicine or another field, including protected time for quality improvement, medical education, research, or administrative activities. Furthermore, some hospitalists might have clinical responsibilities outside of hospital medicine. Given that most PHM programs lack a formal internal definition of what it means to be a hospitalist,[7] it is not surprising to find such variation between programs. The variability in the extent of in‐house coverage provided by academic PHM programs, as well as institutional plans for increased coverage with the 2011 residency work‐hours restrictions is also described, and is consistent with other recently published data.[14] This is likely to continue, as 70% of academic PHM programs reported an anticipated increase in coverage in the near future,[14] suggesting that academic hospitalists are being used to help fill gaps in coverage left by changes in resident staffing.
Our data describe the percentage of academic programs that have a distinct division of hospital medicine. The fact that multisite programs were more likely to report being a distinct division might reflect the increased complexities of providing care at more than 1 site, requiring a greater infrastructure. This might be important in institutional planning as well as academic and financial expectations of academic pediatric hospitalists.
We also demonstrated that programs with multiple sites differ as far as the degree of integration of the various sites, with variation reported in decision making, scheduling, and how quality, safety, and patient satisfaction are reported (Table 4). Whether or not increased integration between the various clinical sites of a multiple‐site program is associated with better performance and/or physician satisfaction are questions that need to be answered. However, academic PHM directors would likely agree that there are great challenges inherent in managing these programs. These challenges include professional integration (do hospitalists based at satellite sites feel that they are academically supported?), clinical work/expectations (fewer resources and fewer learners at satellite sites likely affects workload), and administrative issues (physician scheduling likely becomes more complex as the number of sites increases). As programs continue to grow and provide clinical services in multiple geographic sites, it will become more important to understand how the different sites are coordinated to identify and develop best practices.
Older studies have described that the majority of PHM programs (70%78%) reported that professional revenues do not cover expenses, unfortunately these results were not stratified for program type (academic vs community).[2, 9]
Our study describes that few academic PHM programs (26% of single site, 4% of multiple‐site programs) report revenues (defined in our survey as only the collections from professional billing) in excess of expenses. This is consistent with prior studies that have included both academic and community PHM programs.[2] Therefore, it appears to be common for PHM programs to require institutional funding to cover all program expenses, as collections from professional billing are not generally adequate for this purpose. We believe that this is a critical point for both hospitalists and administrators to understand. However, it is equally important that they be transparent about the importance and value of the nonrevenue‐generating work performed by PHM programs. It has been reported that the vast majority of pediatric hospitalists are highly involved in education, quality improvement work, practice guideline development, and other work that is vitally important to institutions.[3] Furthermore, although one might expect PHM leaders to believe that their programs add value beyond the professional revenue collected,[9] even hospital leadership has been reported to perceive that PHM programs add value in several ways, including increased patient satisfaction (94%), increased referring MD satisfaction (90%), decreased length of stay (81%), and decreased costs (62%).[2] Pediatric residency and clerkship directors report that pediatric hospitalists are more accessible than other faculty (84% vs 64%) and are associated with an increase in the practice of evidence‐based medicine (76% vs 61%).[4] Therefore, there is strong evidence supporting that pediatric hospitalist programs provide important value that is not evident on a balance sheet.
In addition, our data also indicate that programs currently use a variety of metrics in combination to report productivity, and there is no accepted gold standard for measuring the performance of a hospitalist or hospitalist program (Table 2). Given that hospitalists generally cannot control how many patients they see, and given the fact that hospitalists are strongly perceived to provide value to their institutions beyond generating clinical revenue, metrics such as RVUs and charges likely do not accurately represent actual productivity.[2] Furthermore, it is likely that the metrics currently used underestimate actual productivity as they are not designed to take into account confounding factors that might affect hospitalist productivity. For example, consider an academic hospitalist who has clinical responsibilities divided between direct patient care and supervisory patient care (such as a team with some combination of residents, medical students, and physician extenders). When providing direct patient care, the hospitalist is likely responsible or all of the tasks usually performed by residents, including writing all patient notes and prescriptions, all communication with families, nurses, specialists, and primary care providers; and discharge planning. Conversely, when providing supervisory care, it is likely that the tasks are divided among the team members, and the hospitalist has the additional responsibility for providing teaching. However, the hospitalist might be responsible for more complex and acute patients. These factors are not adequately measured by RVUs or professional billing. Furthermore, these metrics do not capture the differences in providing in‐house daytime versus evening/night coverage, and do not measure the work performed while being on call when outside of the hospital. It is important for PHM programs and leaders to develop a better representation of the value provided by hospitalists, and for institutional leaders to understand this value, because previous work has suggested that the majority of hospital leaders do not plan to phase out the subsidy of hospitalists over time, as they do not anticipate the program(s) will be able to covercosts.[2] Given the realities of decreasing reimbursement and healthcare reform, it is unlikely to become more common for PHM programs to generate enough professional revenue to cover expenses.
The main strength of this descriptive study is the comprehensive nature of the survey, including many previously unreported data. In addition, the data are consistent with previously published work, which validates the quality of the data.
This study has several limitations including a low response rate and the exclusion of some hospitals or programs because they provided insufficient data for analysis. However, a post hoc analysis demonstrated that the majority of the institutions reporting that they did not have an academic PHM program (18/22), and those that were excluded due to insufficient data (12/17) were either smaller residency programs (<60 residents) or hospitals that were not the main site of a residency program. Therefore, our data likely are a good representation of academic PHM programs at larger academic institutions. Another potential weakness is that, although PHM program directors and pediatric residency directors were targeted, the respondent might not have been the person with the best knowledge of the program, which could have produced inaccurate data, particularly in terms of finances. However, the general consistency of our findings with previous work, particularly the high percentage of institutions with academic PHM programs,[4, 7, 9, 14] the low percentage of programs with revenues greater than expenses,[2, 9] and the trend toward increased in‐house coverage associated with the 2011 ACGME work‐hour restrictions,[14] supports the validity of our other results. In addition, survey respondents might have interpreted certain questions differently, specifically the questions concerning the definition of an FTE, and this might have led to increased variability in the data.
CONCLUSIONS
Academic PHM programs exist in the vast majority of academic centers, and more institutions are planning on starting programs in the next few years. There appears to be variability in a number of program factors, including hospitalist workload, in‐house coverage, and whether the program is a separate division or a section within another academic division. Many programs are currently providing care at more than 1 site. Programs uncommonly reported that their revenues exceeded their expenses. These data are the most comprehensive data existing for academic PHM programs.
Acknowledgment
Disclosure: Nothing to report.
- . Pediatric hospital medicine: historical perspectives, inspired future. Curr Probl Pediatr Adolesc Health Care. 2012;42(5):107–112.
- , , . Assessing the value of pediatric hospitalist programs: the perspective of hospital leaders. Acad Pediatr. 2009;9(3):192–196.
- , . Pediatric hospitalists: training, current practice, and career goals. J Hosp Med. 2009;4(3):179–186.
- , , . Hospitalists' involvement in pediatrics training: perspectives from pediatric residency program and clerkship directors. Acad Med. 2009;84(11):1617–1621.
- , . Research in pediatric hospital medicine: how research will impact clinical care. Curr Probl Pediatr Adolesc Health Care. 2012;42(5):127–130.
- , . Pediatric hospitalists in medical education: current roles and future directions. Curr Probl Pediatr Adolesc Health Care. 2012;42(5):120–126.
- , , , , . Pediatric hospitalists' influences on education and career plans. J Hosp Med. 2012;7(4):282–286.
- , . Pediatric hospitalist systems versus traditional models of care: effect on quality and cost outcomes. J Hosp Med. 2012;7(4):350–357.
- , , , . Characteristics of the pediatric hospitalist workforce: its roles and work environment. Pediatrics. 2007;120(33):33–39.
- Society of Hospital Medicine. Definition of a hospitalist and hospital medicine. Available at: http://www.hospitalmedicine.org/AM/Template.cfm?Section=Hospitalist_Definition7(4):299–303.
Pediatric hospital medicine (PHM) is a relatively new field that has been growing rapidly over the past 20 years.[1] The field has been increasingly recognized for its contributions to high‐quality patient care, patient safety, systems improvement, medical education, and research.[2, 3, 4, 5, 6, 7, 8, 9] However, there appears to be significant variation among programs, even in basic factors such as how clinical effort is defined, the extent of in‐house coverage provided, and the scope of clinical services provided, and there exists a paucity of data describing these variations.[8]
Most previously published work did not specifically focus on academic programs,[2, 3, 8, 9] and specifically targeted hospital leadership,[2] practicing hospitalists,[3] residents,[7] and pediatric residency or clerkship directors,[4, 7] rather than hospitalist directors.[9] Furthermore, previous work focused on specific aspects of PHM programs such as education,[4, 7] value,[2] work environment,[9] and clinical practice,[3] rather than a more comprehensive approach.
We conducted a survey of academic PHM programs to learn about the current state and variation among programs across multiple domains (organizational, administrative, and financial). We speculated that:
- Many institutions currently lacking an academic PHM program were planning on starting a program in the next 3 years.
- Variability exists in hospitalist workload among programs.
- In programs providing clinical coverage at more than 1 site, variability exists in the relationship between the main site and satellite site(s) in terms of decision making, scheduling, and reporting of performance.
METHODS
Sample
We used the online American Medical Association Fellowship and Residency Electronic Interactive Database (FREIDA) to identify all 198 accredited pediatric residency training programs in the United States. A total of 246 hospitals were affiliated with these programs, and all of these were targeted for the survey. In addition, academic PHM program leaders were targeted directly with email invitations through the American Academy of Pediatrics (AAP) Section on Hospital Medicine LISTSERV.
Survey Instrument
A 49‐question online survey on the administrative, organizational, and financial aspects of academic PHM programs was developed with the input of academic PHM hospital leaders from Cincinnati Children's Hospital Medical Center and St. Louis Children's Hospital. First, the survey questions were developed de novo by the researchers. Then, multiple hospitalist leaders from each institution took the survey and gave feedback on content and structure. Using this feedback, changes were made and then tested by the leaders taking the new version of the survey. This process was repeated for 3 cycles until consensus was reached by the researchers on the final version of the survey. The survey contained questions that asked if the program provided coverage at a single site or at multiple sites and utilized a combination of open‐ended and fixed‐choice questions. For some questions, more than 1 answer was permitted. For the purposes of this survey, we utilized the following definitions adapted from the Society of Hospital Medicine. A hospitalist was defined as a physician who specializes in the practice of hospital medicine.[10] An academic PHM program was defined as any hospitalist practice associated with a pediatric residency program.[11] A nocturnist was defined as a hospitalist who predominantly works a schedule providing night coverage.[12]
Survey Administration
SurveyMonkey, an online survey software, was used to administer the survey. In June 2011, letters were mailed to all 246 hospitals affiliated with an accredited pediatric residency program as described above. These were addressed to either the hospital medicine director (if identified using the institutions Web site) or pediatric residency director. The letter asked the recipient to either participate in the survey or forward the survey to the physician best able to answer the survey. The letters included a description of the study and a link to the online survey. Of note, there was no follow‐up on this process. We also distributed the direct link to the survey and a copy of the letter utilizing the AAP Section on Hospital Medicine LISTSERV. Two reminders were sent through the LISTSERV in the month after the initial request. All respondents were informed that they would receive the deidentified raw data as an incentive to participate in the survey. Respondents were defined as those answering the first question, Does your program have an academic hospitalist program?
Statistical Analysis
Completed survey responses were extracted to Microsoft Excel (Microsoft Corp., Redmond, WA) for data analysis. Basic statistics were utilized to determine response rates for each question. Data were stratified for program type (single site or at multiple sites). For some questions, data were further stratified for the main site of multiple‐site programs for comparison to single‐site programs. In a few instances, more than 1 physician from a particular program responded to the survey. For these, the most appropriate respondent (PHM director, residency director, senior hospitalist) was identified utilizing the programs' publicly available Web site; only that physician's answers were used in the analysis.
Human Subjects Protection
This study was determined to be exempt from review by the Cincinnati Children's Hospital Medical Center and Washington University in St. Louis institutional review boards. All potential responders received written information about the survey. Survey design allowed for anonymous responses with voluntary documentation of program name and responders' contact information. The willingness to respond was qualified as implied consent. Data were deidentified prior to analysis and prior to sharing with the survey participants.
RESULTS
Response Rates
A total of 133 responses were received. Duplicate responses from the same program (13/133) were eliminated from the analysis. This yielded an overall response rate of 48.8% (120/246). A total of 81.7% (98/120) of institutions reported having an academic PHM program. Of the 18.3% (22/120) of institutions reporting not having a program, 9.1% (2/22) reported planning on starting a program in the next 3 years. Of the 98 respondents with an academic PHM program, 17 answered only the first survey question, Does your program have an academic hospitalist program? The remaining 81 completed surveys were left for further analysis. All of these respondents identified their program, and therefore we are certain that there were no duplicate responses in the analytic dataset. Of these, 23 (28%) indicated that their programs provided clinical care at multiple sites, and 58 (72%) indicated that their program provided care at a single site (Figure 1).
Administrative
Respondents reported wide variation for the definition of a 1.0 full‐time employee (FTE) hospitalist in their group. This included the units used (hours/year, weeks/year, shifts/year) as well as actual physician workload (Table 1). Weeks/year was the most common unit utilized by programs to define workload (66% of single‐site programs, 48% of multiple‐site programs), followed by hours/year (19%, 22%) and shifts/year (14%, 22%). The mean and median workload per FTE is represented (Table 1). The large ranges and the standard deviations from the mean indicate variability in workload per FTE (Table 1).
| Single‐Site Program | Multiple‐Site Programs | |||||||||
|---|---|---|---|---|---|---|---|---|---|---|
| % Programs | Mean | Median | SD | Range | % Programs | Mean | Median | SD | Range | |
| ||||||||||
| Weeks on service | 66 | 27.14 | 26 | 8.1 | 1246 | 48 | 27.2 | 24 | 9.6 | 1736 |
| Hours/year | 19 | 1886.25 | 1880 | 231.2 | 16002300 | 22 | 1767.33 | 1738 | 109.0 | 16641944 |
| Shifts/year* | 14 | 183 | 191 | 52.2 | 182240 | 22 | 191 | 184 | 38.3 | 155214 |
Scheduled in‐house hospitalist coverage also varied. Daytime coverage was defined as until 3 to 5 pm, evening coverage was defined a until 10 pm to midnight, and 24‐hour coverage was defined a 24/7. Programs reported plans to increase in‐house coverage with the implementation of the 2011 Accreditation Council for Graduate Medical Education (ACGME) resident work hours restrictions.[13] Among single‐site programs, there was a planned 50% increase in day/evening coverage (14% to 21%), with a planned decrease in day‐only coverage, and no change in 24/7 coverage (Table 2). Among the main sites of multiple‐site programs, there was a planned 50% increase in 24/7 in‐house coverage (35% to 52%), with a planned decrease in day‐only coverage, and no change in day/evening coverage (Table 3). Among the satellite sites of multiple‐site programs, there was a planned 9% increase in 24/7 coverage (41% to 50%), with a planned decrease in day‐only coverage, and no change in day/evening coverage (Table 2). Most programs reported that all hospitalists share night coverage (87% single site, 89% multiple sites) (Table 2). Multiple‐site programs were more likely than single‐site programs to use nocturnists, moonlighters, and incentives for those providing evening or night coverage (Table 2).
| Single Site (n=58) | Main Site of Multiple‐Site Programs (n=23) | |||
|---|---|---|---|---|
| Proportion | Response Rate | Proportion | Response Rate | |
| ||||
| Organizational | ||||
| Night shifts | .79 (46/58) | .83 (19/23) | ||
| All share nights | .87 (40/46) | .89 (17/19) | ||
| Nocturnists | .09 (4/46) | .26 (5/19) | ||
| Moonlighters | .04 (2/46) | .12 (2/19) | ||
| Night shift incentives | .74 (43/58) | .78 (18/23) | ||
| Financial | .12 (5/43) | .28 (5/18) | ||
| Time | .12 (5/43) | .22 (4/18) | ||
| No incentives | .79 (34/43) | .61 (11/18) | ||
| In‐house hospitalist coverage pre July 2011a | 1.0 (58/58) | 1.0 (23/23) | ||
| 24/7 | .29 (17/58) | .35 (8/23) | ||
| Day and evening | .14 (8/58) | .17 (4/23) | ||
| Day only | .57 (33/58) | .48 (11/23) | ||
| In‐house hospitalist coverage post July 2011a | 1.0 (58/58) | 1.0 (23/23) | ||
| 24/7 | .29 (17/58) | .52 (12/23) | ||
| Day and evening | .21 (12/58) | .17 (4/23) | ||
| Day only | .50 (29/58) | .30 (7/23) | ||
| Administrative | ||||
| Own division | .32 (18/57) | .98 (57/58) | .74 (17/23) | 1.0 (23/23) |
| Part of another division | .68 (39/57) | .26 (6/23) | ||
| Financial | ||||
| Revenues>expenses | .26 (14/53) | .91 (53/58) | .04 (1/23) | .04 (19/23) |
| Incentives supplement base salary | .45 (25/55) | .95 (55/58) | .48 (10/21) | .91 (21/23) |
| Metrics used to determine incentivesb | .47 (27/58) | .52 (12/23) | ||
| RVUs/MD | .85 (23/27) | .83 (10/12) | ||
| Costs/discharge | .19 (5/27) | .08 (1/12) | ||
| Financial reportingb | .81 (47/58) | .04 (19/23) | ||
| Charges | .64 (30/47) | .68 (13/19) | ||
| Collections | .66 (31/47) | .68 (13/19) | ||
| RVUs | .77 (36/47) | .47 (9/19) | ||
| Main Site (n=23) | Satellite Sites (n=51) | |||
|---|---|---|---|---|
| Proportion | Response Rate | Proportion | Response Rate | |
| In‐house hospitalist coverage pre July 2011 | 1.0 (23/23) | .80 (41/51) | ||
| 24/7 | .35 (8/23) | .41 (17/41) | ||
| Day and evening | .17 (4/23) | .10 (4/41) | ||
| Day only | .48 (11/23) | .49 (20/41) | ||
| In‐house hospitalist coverage post July 2011 | 1.0 (23/23) | |||
| 24/7 | .52 (12/23) | .50 (19/38) | .75 (38/51) | |
| Day and evening | .17 (4/23) | .11 (4/38) | ||
| Day only | .30 (7/23) | .39 (15/38) | ||
| Night shift coverage | .83 (19/23) | .78 (18/23) | ||
| All share nights | .89 (17/19) | .94 (17/18) | ||
| Nocturnists | .26 (5/19) | .22 (4/18) | ||
| Moonlighters | .12 (2/19) | .17 (3/18) | ||
The vast majority of multiple‐site programs reported that their different clinical sites are considered parts of a single hospitalist program (96%), and that there is a designated medical director for each site (83%). However, only 70% of multiple‐site programs report that decisions concerning physician coverage are made as a group, and only 65% report that scheduling is done centrally. In addition, there is variability in how quality, safety, and patient satisfaction is reported (group vs site). The majority of programs report sharing revenues and expenses among the sites (Table 4).
| Proportion | Response Rate | |
|---|---|---|
| Sites regularly collaborate on: | 1.0 (23/23) | |
| Quality improvement projects | .74 (17/23) | |
| Safety initiatives | .74 (17/23) | |
| Research | .48 (11/23) | |
| Have a designated hospitalist medical director for each site | .83 (19/23) | 1.0 (23/23) |
| Different sites considered parts of a single hospitalist program | .96 (22/23) | 1.0 (23/23) |
| Make decisions on program/coverage/hour changes as a group | .70 (16/23) | 1.0 (23/23) |
| Scheduling done centrally | .65 (15/23) | 1.0 (23/23) |
| Report or track the following as individual sites: | ||
| Quality measures | .43 (9/21) | .91 (21/23) |
| Safety measures | .48 (10/21) | .91 (21/23) |
| Patient satisfaction | .50 (10/20) | .87 (20/23) |
| Report or track the following as a group: | ||
| Quality measures | .33 (7/21) | .91 (21/23) |
| Safety measures | .33 (7/21) | .91 (21/23) |
| Patient satisfaction | .30 (6/20) | .87 (20/23) |
| Report or track the following as both individual sites and as a group: | ||
| Quality measures | .24 (5/21) | .91 (21/23) |
| Safety measures | .19 (4/21) | .91 (21/23) |
| Patient satisfaction | .25 (4/20) | .87 (20/23) |
| Sites share revenues and expenses | .67 (14/21) | .91 (21/23) |
Organizational
Of the single‐site programs that answered the question Is your hospital medicine program considered its own division or a section within another division? 32% reported that their programs were considered its own division, and 68% reported that they were a part of another division, predominately (62%) general pediatrics, but also a few (6% combined) within emergency medicine, critical care, physical medicine and rehabilitation, and infectious diseases. Of the multiple‐site programs, a majority of 74% programs were their own division, and 26% were part of another division (Table 2). Respondents reported that their satellite sites included pediatric units in small community hospitals, small pediatric hospitals, large nonpediatric hospitals with pediatric units, rehabilitation facilities, and Shriner orthopedic hospitals.
Financial
Of the single‐site programs that answered the question Do patient revenues produced by your hospitalist group cover all expenses? only 26% reported that revenues exceeded expenses. Of the multiple‐site programs responding to this question, only 4% reported that the main site of their programs had revenues greater than expenses (Table 2). Programs used a combination of metrics to report revenue, and relative value unit (RVU)/medical doctor (MD) is the most commonly used metric to determine incentive pay (Table 2).
DISCUSSION
Our study demonstrates that academic PHM programs are common, which is consistent with previous data.[4, 7, 9, 14] The data support our belief that more institutions are planning on starting PHM programs. However, there exist much variability in a variety of program factors.[2, 3, 8, 9, 14] The fact that up to 35% of categorical pediatric residents are considering a career as a hospitalist further highlights the need for better data on PHM programs.[7]
We demonstrated that variability existed in hospitalist workload at academic PHM programs. We found considerable variation in the workload per hospitalist (large ranges and standard deviations), as well as variability in how an FTE is defined (hours/year, weeks/year, shifts/year) (Table 1). In addition, survey respondents might have interpreted certain questions differently, and this might have led to increased variability in the data. For example, the question concerning the definition of an FTE was worded as A clinical FTE is defined as. Some of the reported variation in workload might be partially explained by hospitalists having additional nonclinical responsibilities within hospital medicine or another field, including protected time for quality improvement, medical education, research, or administrative activities. Furthermore, some hospitalists might have clinical responsibilities outside of hospital medicine. Given that most PHM programs lack a formal internal definition of what it means to be a hospitalist,[7] it is not surprising to find such variation between programs. The variability in the extent of in‐house coverage provided by academic PHM programs, as well as institutional plans for increased coverage with the 2011 residency work‐hours restrictions is also described, and is consistent with other recently published data.[14] This is likely to continue, as 70% of academic PHM programs reported an anticipated increase in coverage in the near future,[14] suggesting that academic hospitalists are being used to help fill gaps in coverage left by changes in resident staffing.
Our data describe the percentage of academic programs that have a distinct division of hospital medicine. The fact that multisite programs were more likely to report being a distinct division might reflect the increased complexities of providing care at more than 1 site, requiring a greater infrastructure. This might be important in institutional planning as well as academic and financial expectations of academic pediatric hospitalists.
We also demonstrated that programs with multiple sites differ as far as the degree of integration of the various sites, with variation reported in decision making, scheduling, and how quality, safety, and patient satisfaction are reported (Table 4). Whether or not increased integration between the various clinical sites of a multiple‐site program is associated with better performance and/or physician satisfaction are questions that need to be answered. However, academic PHM directors would likely agree that there are great challenges inherent in managing these programs. These challenges include professional integration (do hospitalists based at satellite sites feel that they are academically supported?), clinical work/expectations (fewer resources and fewer learners at satellite sites likely affects workload), and administrative issues (physician scheduling likely becomes more complex as the number of sites increases). As programs continue to grow and provide clinical services in multiple geographic sites, it will become more important to understand how the different sites are coordinated to identify and develop best practices.
Older studies have described that the majority of PHM programs (70%78%) reported that professional revenues do not cover expenses, unfortunately these results were not stratified for program type (academic vs community).[2, 9]
Our study describes that few academic PHM programs (26% of single site, 4% of multiple‐site programs) report revenues (defined in our survey as only the collections from professional billing) in excess of expenses. This is consistent with prior studies that have included both academic and community PHM programs.[2] Therefore, it appears to be common for PHM programs to require institutional funding to cover all program expenses, as collections from professional billing are not generally adequate for this purpose. We believe that this is a critical point for both hospitalists and administrators to understand. However, it is equally important that they be transparent about the importance and value of the nonrevenue‐generating work performed by PHM programs. It has been reported that the vast majority of pediatric hospitalists are highly involved in education, quality improvement work, practice guideline development, and other work that is vitally important to institutions.[3] Furthermore, although one might expect PHM leaders to believe that their programs add value beyond the professional revenue collected,[9] even hospital leadership has been reported to perceive that PHM programs add value in several ways, including increased patient satisfaction (94%), increased referring MD satisfaction (90%), decreased length of stay (81%), and decreased costs (62%).[2] Pediatric residency and clerkship directors report that pediatric hospitalists are more accessible than other faculty (84% vs 64%) and are associated with an increase in the practice of evidence‐based medicine (76% vs 61%).[4] Therefore, there is strong evidence supporting that pediatric hospitalist programs provide important value that is not evident on a balance sheet.
In addition, our data also indicate that programs currently use a variety of metrics in combination to report productivity, and there is no accepted gold standard for measuring the performance of a hospitalist or hospitalist program (Table 2). Given that hospitalists generally cannot control how many patients they see, and given the fact that hospitalists are strongly perceived to provide value to their institutions beyond generating clinical revenue, metrics such as RVUs and charges likely do not accurately represent actual productivity.[2] Furthermore, it is likely that the metrics currently used underestimate actual productivity as they are not designed to take into account confounding factors that might affect hospitalist productivity. For example, consider an academic hospitalist who has clinical responsibilities divided between direct patient care and supervisory patient care (such as a team with some combination of residents, medical students, and physician extenders). When providing direct patient care, the hospitalist is likely responsible or all of the tasks usually performed by residents, including writing all patient notes and prescriptions, all communication with families, nurses, specialists, and primary care providers; and discharge planning. Conversely, when providing supervisory care, it is likely that the tasks are divided among the team members, and the hospitalist has the additional responsibility for providing teaching. However, the hospitalist might be responsible for more complex and acute patients. These factors are not adequately measured by RVUs or professional billing. Furthermore, these metrics do not capture the differences in providing in‐house daytime versus evening/night coverage, and do not measure the work performed while being on call when outside of the hospital. It is important for PHM programs and leaders to develop a better representation of the value provided by hospitalists, and for institutional leaders to understand this value, because previous work has suggested that the majority of hospital leaders do not plan to phase out the subsidy of hospitalists over time, as they do not anticipate the program(s) will be able to covercosts.[2] Given the realities of decreasing reimbursement and healthcare reform, it is unlikely to become more common for PHM programs to generate enough professional revenue to cover expenses.
The main strength of this descriptive study is the comprehensive nature of the survey, including many previously unreported data. In addition, the data are consistent with previously published work, which validates the quality of the data.
This study has several limitations including a low response rate and the exclusion of some hospitals or programs because they provided insufficient data for analysis. However, a post hoc analysis demonstrated that the majority of the institutions reporting that they did not have an academic PHM program (18/22), and those that were excluded due to insufficient data (12/17) were either smaller residency programs (<60 residents) or hospitals that were not the main site of a residency program. Therefore, our data likely are a good representation of academic PHM programs at larger academic institutions. Another potential weakness is that, although PHM program directors and pediatric residency directors were targeted, the respondent might not have been the person with the best knowledge of the program, which could have produced inaccurate data, particularly in terms of finances. However, the general consistency of our findings with previous work, particularly the high percentage of institutions with academic PHM programs,[4, 7, 9, 14] the low percentage of programs with revenues greater than expenses,[2, 9] and the trend toward increased in‐house coverage associated with the 2011 ACGME work‐hour restrictions,[14] supports the validity of our other results. In addition, survey respondents might have interpreted certain questions differently, specifically the questions concerning the definition of an FTE, and this might have led to increased variability in the data.
CONCLUSIONS
Academic PHM programs exist in the vast majority of academic centers, and more institutions are planning on starting programs in the next few years. There appears to be variability in a number of program factors, including hospitalist workload, in‐house coverage, and whether the program is a separate division or a section within another academic division. Many programs are currently providing care at more than 1 site. Programs uncommonly reported that their revenues exceeded their expenses. These data are the most comprehensive data existing for academic PHM programs.
Acknowledgment
Disclosure: Nothing to report.
- . Pediatric hospital medicine: historical perspectives, inspired future. Curr Probl Pediatr Adolesc Health Care. 2012;42(5):107–112.
- , , . Assessing the value of pediatric hospitalist programs: the perspective of hospital leaders. Acad Pediatr. 2009;9(3):192–196.
- , . Pediatric hospitalists: training, current practice, and career goals. J Hosp Med. 2009;4(3):179–186.
- , , . Hospitalists' involvement in pediatrics training: perspectives from pediatric residency program and clerkship directors. Acad Med. 2009;84(11):1617–1621.
- , . Research in pediatric hospital medicine: how research will impact clinical care. Curr Probl Pediatr Adolesc Health Care. 2012;42(5):127–130.
- , . Pediatric hospitalists in medical education: current roles and future directions. Curr Probl Pediatr Adolesc Health Care. 2012;42(5):120–126.
- , , , , . Pediatric hospitalists' influences on education and career plans. J Hosp Med. 2012;7(4):282–286.
- , . Pediatric hospitalist systems versus traditional models of care: effect on quality and cost outcomes. J Hosp Med. 2012;7(4):350–357.
- , , , . Characteristics of the pediatric hospitalist workforce: its roles and work environment. Pediatrics. 2007;120(33):33–39.
- Society of Hospital Medicine. Definition of a hospitalist and hospital medicine. Available at: http://www.hospitalmedicine.org/AM/Template.cfm?Section=Hospitalist_Definition7(4):299–303.
Copyright © 2013 Society of Hospital Medicine