User login
Resource Utilization and Satisfaction
The patient experience has become increasingly important to healthcare in the United States. It is now a metric used commonly to determine physician compensation and accounts for nearly 30% of the Centers for Medicare and Medicaid Services' (CMS) Value‐Based Purchasing (VBP) reimbursement for fiscal years 2015 and 2016.[1, 2]
In April 2015, CMS added a 5‐star patient experience score to its Hospital Compare website in an attempt to address the Affordable Care Act's call for transparent and easily understandable public reporting.[3] A hospital's principal score is the Summary Star Rating, which is based on responses to the Hospital Consumer Assessment of Healthcare Providers and Systems (HCAHPS) survey. The formulas used to calculate Summary Star Ratings have been reported by CMS.[4]
Studies published over the past decade suggest that gender, age, education level, length of hospital stay, travel distance, and other factors may influence patient satisfaction.[5, 6, 7, 8] One study utilizing a national dataset suggested that higher patient satisfaction was associated with greater inpatient healthcare utilization and higher healthcare expenditures.[9] It is therefore possible that emphasizing patient experience scores could adversely impact healthcare resource utilization. However, positive patient experience may also be an important independent dimension of quality for patients and correlate with improved clinical outcomes.[10]
We know of no literature describing patient factors associated with the Summary Star Rating. Given that this rating is now used as a standard metric by which patient experience can be compared across more than 3,500 hospitals,[11] data describing the association between patient‐level factors and the Summary Star Rating may provide hospitals with an opportunity to target improvement efforts. We aimed to determine the degree to which resource utilization is associated with a satisfaction score based on the Summary Star Rating methodology.
METHODS
The study was conducted at the University of Rochester Medical Center (URMC), an 830‐bed tertiary care center in upstate New York. This was a retrospective review of all HCAHPS surveys returned to URMC over a 27‐month period from January 1, 2012 to April 1, 2014. URMC follows the standard CMS process for determining which patients receive surveys as follows. During the study timeframe, HCAHPS surveys were mailed to patients 18 years of age and older who had an inpatient stay spanning at least 1 midnight. Surveys were mailed within 5 days of discharge, and were generally returned within 6 weeks. URMC did not utilize telephone or email surveys during the study period. Surveys were not sent to patients who (1) were transferred to another facility, (2) were discharged to hospice, (3) died during the hospitalization, (4) received psychiatric or rehabilitative services during the hospitalization, (5) had an international address, and/or (6) were prisoners.
The survey vendor (Press Ganey, South Bend, IN) for URMC provided raw data for returned surveys with patient answers to questions. Administrative and billing databases were used to add demographic and clinical data for the corresponding hospitalization to the dataset. These data included age, gender, payer status (public, private, self, charity), length of stay, number of attendings who saw the patient (based on encounters documented in the electronic medical record (EMR)), all discharge International Classification of Diseases, 9th Revision (ICD‐9) diagnoses for the hospitalization, total charges for the hospitalization, and intensive care unit (ICU) utilization as evidenced by a documented encounter with a member of the Division of Critical Care/Pulmonary Medicine.
CMS analyzes surveys within 1 of 3 clinical service categories (medical, surgical, or obstetrics/gynecology) based on the discharging service. To parallel this approach, each returned survey was placed into 1 of these categories based on the clinical service of the discharging physician. Patients placed in the obstetrics/gynecology category (n = 1317, 13%) will be analyzed in a future analysis given inherent differences in patient characteristics that require evaluation of other variables.
Approximations of CMS Summary Star Rating
The HCAHPS survey is a multiple‐choice questionnaire that includes several domains of patient satisfaction. Respondents are asked to rate areas of satisfaction with their hospital experience on a Likert scale. CMS uses a weighted average of Likert responses to a subset of HCAHPS questions to calculate a hospital's raw score in 11 domains, as well as an overall raw summary score. CMS then adjusts each raw score for differences between hospitals (eg, clustering, improvement over time, method of survey) to determine a hospital's star rating in each domain and an overall Summary Star Rating (the Summary Star Rating is the primary factor by which consumers can compare hospitals).[4] Because our data were from a single hospital system, the between‐hospital scoring adjustments utilized by CMS were not applicable. Instead, we calculated the raw scores exactly as CMS does prior to the adjustments. Thus, our scores reflect the scores that CMS would have given URMC during the study period prior to standardized adjustments; we refer to this as the raw satisfaction rating (RSR). We calculated an RSR for every eligible survey. The RSR was calculated as a continuous variable from 0 (lowest) to 1 (highest). Detailed explanation of our RSR calculation is available in the Supporting Information in the online version of this article.
Statistical Analysis
All analyses were performed in aggregate and by service (medical vs surgical). Categorical variables were summarized using frequencies with percentages. Comparisons across levels of categorical variables were performed with the 2 test. We report bivariate associations between the independent variables and RSRs in the top decile using unadjusted odds ratios (ORs) with 95% confidence intervals (CIs). Similarly, multivariable logistic regression was used for adjusted analyses. For the variables of severity of illness and resource intensity, the group with the lowest illness severity and lowest resource use served as the reference groups. We modeled patients without an ICU encounter and with an ICU encounter separately.
Charges, number of unique attendings encountered, and lengths of stay were highly correlated, and likely various measures of the same underlying construct of resource intensity, and therefore could not be entered into our models simultaneously. We combined these into a resource intensity score using factor analysis with a varimax rotation, and extracted factor scores for a single factor (supported by a scree plot). We then placed patients into 4 groups based on the distribution of the factor scores: low (<25th percentile), moderate (25th50th percentile), major (50th75th percentile), and extreme (>75th percentile).
We used the Charlson‐Deyo comorbidity score as our disease severity index.[12] The index uses ICD‐9 diagnoses with points assigned for the impact of each diagnosis on morbidity and the points summed to an overall score. This provides a measure of disease severity for a patient based on the number of diagnoses and relative mortality of the individual diagnoses. Scores were categorized as 0 (representing no major illness burden), 1 to 3, 4 to 6, and >6.
All statistical analyses were performed using SAS version 9.4 (SAS Institute, Cary, NC), and P values <0.05 were considered statistically significant. This study was approved by the institutional review board at the University of Rochester Medical Center.
RESULTS
Our initial search identified 10,007 returned surveys (29% of eligible patients returned surveys during the study period). Of these, 5059 (51%) were categorized as medical, 3630 (36%) as surgical, and 1317 (13%) as obstetrics/gynecology. One survey did not have the service of the discharging physician recorded and was excluded. Cohort demographics and relationship to RSRs in the top decile for the 8689 medical and surgical patients can be found in Table 1. The most common discharge diagnosis‐related groups (DRGs) for medical patients were 247, percutaneous cardiovascular procedure with drug‐eluding stent without major complications or comorbidities (MCC) (3.8%); 871, septicemia or severe sepsis without mechanical ventilation >96 hours with MCC (2.7%); and 392, esophagitis, gastroenteritis, and miscellaneous digestive disorders with MCC (2.3%). The most common DRGs for surgical patients were 460, spinal fusion except cervical without MCC (3.5%); 328, stomach, esophageal and duodenal procedure without complication or comorbidities or MCC (3.3%); and 491, back and neck procedure excluding spinal fusion without complication or comorbidities or MCC (3.1%).
| Overall | Medical | Surgical | ||||||||||
|---|---|---|---|---|---|---|---|---|---|---|---|---|
| Total | <90th | Top Decile | P | Total | <90th | Top Decile | P | Total | <90th | Top Decile | P | |
| ||||||||||||
| Overall | 8,689 | 7,789 (90) | 900 (10) | 5,059 | 4,646 (92) | 413 (8) | 3,630 | 3,143 (87) | 487 (13) | |||
| Age, y | ||||||||||||
| <30 | 419 (5) | 371 (89) | 48 (12) | <0.001 | 218 (4) | 208 (95) | 10 (5) | <0.001 | 201 (6) | 163 (81) | 38 (19) | <0.001 |
| 3049 | 1,029 (12) | 902 (88) | 127 (12) | 533 (11) | 482 (90) | 51 (10) | 496 (14) | 420 (85) | 76 (15) | |||
| 5069 | 3,911 (45) | 3,450 (88) | 461 (12) | 2,136 (42) | 1,930 (90) | 206 (10) | 1,775 (49) | 1,520 (86) | 255 (14) | |||
| >69 | 3,330 (38) | 3,066 (92) | 264 (8) | 2,172 (43) | 2,026 (93) | 146 (7) | 1,158 (32) | 1,040 (90) | 118 (10) | |||
| Gender | ||||||||||||
| Male | 4,640 (53) | 4,142 (89) | 498 (11) | 0.220 | 2,596 (51) | 2,379 (92) | 217 (8) | 0.602 | 2,044 (56) | 1,763 (86) | 281 (14) | 0.506 |
| Female | 4,049 (47) | 3,647 (90) | 402 (10) | 2,463 (49) | 2,267 (92) | 196 (8) | 1,586 (44) | 1,380 (87) | 206 (13) | |||
| ICU encounter | ||||||||||||
| No | 7,122 (82) | 6,441 (90) | 681 (10) | <0.001 | 4,547 (90) | 4,193 (92) | 354 (8) | <0.001 | 2,575 (71) | 2,248 (87) | 327 (13) | 0.048 |
| Yes | 1,567 (18) | 1,348 (86) | 219 (14) | 512 (10) | 453 (89) | 59 (12) | 1,055 (29) | 895 (85) | 160 (15) | |||
| Payer | ||||||||||||
| Public | 5,564 (64) | 5,036 (91) | 528 (10) | <0.001 | 3,424 (68) | 3,161 (92) | 263 (8) | 0.163 | 2,140 (59) | 1,875 (88) | 265 (12) | 0.148 |
| Private | 3,064 (35) | 2,702 (88) | 362 (12) | 1,603 (32) | 1,458 (91) | 145 (9) | 1,461 (40) | 1,244 (85) | 217 (15) | |||
| Charity | 45 (1) | 37 (82) | 8 (18) | 25 (1) | 21 (84) | 4 (16) | 20 (1) | 16 (80) | 4 (20) | |||
| Self | 16 (0) | 14 (88) | 2 (13) | 7 (0) | 6 (86) | 1 (14) | 9 (0) | 8 (89) | 1 (11) | |||
| Length of stay, d | ||||||||||||
| <3 | 3,156 (36) | 2,930 (93) | 226 (7) | <0.001 | 1,961 (39) | 1,865 (95) | 96 (5) | <0.001 | 1,195 (33) | 1,065 (89) | 130 (11) | <0.001 |
| 36 | 3,330 (38) | 2,959 (89) | 371 (11) | 1,867 (37) | 1,702 (91) | 165 (9) | 1,463 (40) | 1,257 (86) | 206 (14) | |||
| >6 | 2,203 (25) | 1,900 (86) | 303 (14) | 1,231 (24) | 1,079 (88) | 152 (12) | 972 (27) | 821 (85) | 151 (16) | |||
| No. of attendings | ||||||||||||
| <4 | 3,959 (46) | 3,615 (91) | 344 (9) | <0.001 | 2,307 (46) | 2,160 (94) | 147 (6) | <0.001 | 1,652 (46) | 1,455 (88) | 197 (12) | 0.052 |
| 46 | 3,067 (35) | 2,711 (88) | 356 (12) | 1,836 (36) | 1,663 (91) | 173 (9) | 1,231 (34) | 1,048 (85) | 183 (15) | |||
| >6 | 1,663 (19) | 1,463 (88) | 200 (12) | 916 (18) | 823 (90) | 93 (10) | 747 (21) | 640 (86) | 107 (14) | |||
| Severity index* | ||||||||||||
| 0 (lowest) | 2,812 (32) | 2,505 (89) | 307 (11) | 0.272 | 1,273 (25) | 1,185 (93) | 88 (7) | 0.045 | 1,539 (42) | 1,320 (86) | 219 (14) | 0.261 |
| 13 | 4,253 (49) | 3,827 (90) | 426 (10) | 2,604 (52) | 2,395 (92) | 209 (8) | 1,649 (45) | 1,432 (87) | 217 (13) | |||
| 46 | 1163 (13) | 1,052 (91) | 111 (10) | 849 (17) | 770 (91) | 79 (9) | 314 (9) | 282 (90) | 32 (10) | |||
| >6 (highest) | 461 (5) | 405 (88) | 56 (12) | 333 (7) | 296 (89) | 37 (11) | 128 (4) | 109 (85) | 19 (15) | |||
| Charges, | ||||||||||||
| Low | 1,820 (21) | 1,707 (94) | 113 (6) | <0.001 | 1,426 (28) | 1,357 (95) | 69 (5) | <0.001 | 394 (11) | 350 (89) | 44 (11) | 0.007 |
| Medium | 5,094 (59) | 4,581 (90) | 513 (10) | 2,807 (56) | 2,582 (92) | 225 (8) | 2,287 (63) | 1,999 (87) | 288 (13) | |||
| High | 1,775 (20) | 1,501 (85) | 274 (15) | 826 (16) | 707 (86) | 119 (14) | 949 (26) | 794 (84) | 155 (16) | |||
Unadjusted analysis of medical and surgical patients identified significant associations of several variables with a top decile RSR (Table 2). Patients with longer lengths of stay (OR: 2.07, 95% CI: 1.72‐2.48), more attendings (OR: 1.44, 95% CI: 1.19‐1.73), and higher hospital charges (OR: 2.76, 95% CI: 2.19‐3.47) were more likely to report an RSR in the top decile. Patients without an ICU encounter (OR: 0.65, 95% CI: 0.55‐0.77) and on a medical service (OR: 0.57, 95% CI: 0.5‐ 0.66) were less likely to report an RSR in the top decile. Several associations were identified in only the medical or surgical cohorts. In the medical cohort, patients with the highest illness severity index (OR: 1.68, 95% CI: 1.12‐ 2.52) and with 7 different attending physicians (OR: 1.66, 95% CI: 1.27‐2.18) were more likely to report RSRs in the top decile. In the surgical cohort, patients <30 years of age (OR: 2.05, 95% CI 1.38‐3.07) were more likely to report an RSR in the top decile than patients >69 years of age. Insurance payer category and gender were not significantly associated with top decile RSRs.
| Overall | Medical | Surgical | ||||
|---|---|---|---|---|---|---|
| Odds Ratio (95% CI) | P | Odds Ratio (95% CI) | P | Odds Ratio (95% CI) | P | |
| ||||||
| Age, y | ||||||
| <30 | 1.5 (1.082.08) | 0.014 | 0.67 (0.351.29) | 0.227 | 2.05 (1.383.07) | <0.001 |
| 3049 | 1.64 (1.312.05) | <.001 | 1.47 (1.052.05) | 0.024 | 1.59 (1.172.17) | 0.003 |
| 5069 | 1.55 (1.321.82) | <.001 | 1.48 (1.191.85) | 0.001 | 1.48 (1.171.86) | 0.001 |
| >69 | Ref | Ref | Ref | |||
| Gender | ||||||
| Male | 1.09 (0.951.25) | 0.220 | 1.06 (0.861.29) | 0.602 | 1.07 (0.881.3) | 0.506 |
| Female | Ref | Ref | Ref | |||
| ICU encounter | ||||||
| No | 0.65 (0.550.77) | <0.001 | 0.65 (0.480.87) | 0.004 | 0.81 (0.661) | 0.048 |
| Yes | Ref | Ref | Ref | |||
| Payer | ||||||
| Public | 0.73 (0.173.24) | 0.683 | 0.5 (0.064.16) | 0.521 | 1.13 (0.149.08) | 0.908 |
| Private | 0.94 (0.214.14) | 0.933 | 0.6 (0.074.99) | 0.634 | 1.4 (0.1711.21) | 0.754 |
| Charity | 1.51 (0.298.02) | 0.626 | 1.14 (0.1112.25) | 0.912 | 2 (0.1920.97) | 0.563 |
| Self | Ref | Ref | Ref | |||
| Length of stay, d | ||||||
| <3 | Ref | Ref | Ref | |||
| 36 | 1.63 (1.371.93) | <0.001 | 1.88 (1.452.44) | <0.001 | 1.34 (1.061.7) | 0.014 |
| >6 | 2.07 (1.722.48) | <0.001 | 2.74 (2.13.57) | <0.001 | 1.51 (1.171.94) | 0.001 |
| No. of attendings | ||||||
| <4 | Ref | Ref | Ref | |||
| 46 | 1.38 (1.181.61) | <0.001 | 1.53 (1.221.92) | <0.001 | 1.29 (1.041.6) | 0.021 |
| >6 | 1.44 (1.191.73) | <0.001 | 1.66 (1.272.18) | <0.001 | 1.23 (0.961.59) | 0.102 |
| Severity index* | ||||||
| 0 (lowest) | Ref | Ref | Ref | |||
| 13 | 0.91 (0.781.06) | 0.224 | 1.18 (0.911.52) | 0.221 | 0.91 (0.751.12) | 0.380 |
| 46 | 0.86 (0.681.08) | 0.200 | 1.38 (1.011.9) | 0.046 | 0.68 (0.461.01) | 0.058 |
| >6 (highest) | 1.13 (0.831.53) | 0.436 | 1.68 (1.122.52) | 0.012 | 1.05 (0.631.75) | 0.849 |
| Charges | ||||||
| Low | Ref | Ref | Ref | |||
| Medium | 1.69 (1.372.09) | <0.001 | 1.71 (1.32.26) | <0.001 | 1.15 (0.821.61) | 0.428 |
| High | 2.76 (2.193.47) | <0.001 | 3.31 (2.434.51) | <0.001 | 1.55 (1.092.22) | 0.016 |
| Service | ||||||
| Medical | 0.57 (0.50.66) | <0.001 | ||||
| Surgical | Ref | |||||
Multivariable modeling (Table 3) for all patients without an ICU encounter suggested that (1) patients aged <30 years, 30 to 49 years, and 50 to 69 years were more likely to report top decile RSRs when compared to patients 70 years and older (OR: 1.61, 95% CI: 1.09‐2.36; OR: 1.44, 95% CI: 1.08‐1.93; and OR: 1.39, 95% CI: 1.13‐1.71, respectively) and (2), when compared to patients with extreme resource intensity scores, patients with higher resource intensity scores were more likely to report top decile RSRs (moderate [OR: 1.42, 95% CI: 1.11‐1.83], major [OR: 1.56, 95% CI: 1.22‐2.01], and extreme [OR: 2.29, 95% CI: 1.8‐2.92]. These results were relatively consistent within medical and surgical subgroups (Table 3).
| Overall | Medical | Surgical | ||||
|---|---|---|---|---|---|---|
| Odds Ratio (95% CI) | P | Odds Ratio (95% CI) | P | Odds Ratio (95% CI) | P | |
| ||||||
| Age, y | ||||||
| <30 | 1.61 (1.092.36) | 0.016 | 0.82 (0.41.7) | 0.596 | 2.31 (1.393.82) | 0.001 |
| 3049 | 1.44 (1.081.93) | 0.014 | 1.55 (1.032.32) | 0.034 | 1.41 (0.912.17) | 0.120 |
| 5069 | 1.39 (1.131.71) | 0.002 | 1.44 (1.11.88) | 0.008 | 1.39 (11.93) | 0.049 |
| >69 | Ref | Ref | Ref | |||
| Sex | ||||||
| Male | 1 (0.851.17) | 0.964 | 1 (0.81.25) | 0.975 | 0.99 (0.791.26) | 0.965 |
| Female | Ref | Ref | Ref | |||
| Payer | ||||||
| Public | 0.62 (0.142.8) | 0.531 | 0.42 (0.053.67) | 0.432 | 1.03 (0.128.59) | 0.978 |
| Private | 0.67 (0.153.02) | 0.599 | 0.42 (0.053.67) | 0.434 | 1.17 (0.149.69) | 0.884 |
| Charity | 1.54 (0.288.41) | 0.620 | 1 (0.0911.13) | 0.999 | 2.56 (0.2328.25) | 0.444 |
| Self | Ref | Ref | Ref | |||
| Severity index | ||||||
| 0 (lowest) | Ref | Ref | Ref | |||
| 13 | 1.07 (0.891.29) | 0.485 | 1.18 (0.881.58) | 0.267 | 1 (0.781.29) | 0.986 |
| 46 | 1.14 (0.861.51) | 0.377 | 1.42 (0.992.04) | 0.056 | 0.6 (0.331.1) | 0.100 |
| >6 (highest) | 1.31 (0.911.9) | 0.150 | 1.47 (0.932.33) | 0.097 | 1.1 (0.542.21) | 0.795 |
| Resource intensity score | ||||||
| Low | Ref | Ref | Ref | |||
| Moderate | 1.42 (1.111.83) | 0.006 | 1.6 (1.112.3) | 0.011 | 0.94 (0.661.34) | 0.722 |
| Major | 1.56 (1.222.01) | 0.001 | 1.69 (1.182.43) | 0.004 | 1.28 (0.911.8) | 0.151 |
| Extreme | 2.29 (1.82.92) | <0.001 | 2.72 (1.943.82) | <0.001 | 1.63 (1.172.26) | 0.004 |
| Service | ||||||
| Medical | 0.59 (0.50.69) | <0.001 | ||||
| Surgical | Ref | |||||
In those with at least 1 ICU attending encounter (see Supporting Table 1 in the online version of this article), no variables demonstrated significant association with top decile RSRs in the overall group or in the medical subgroup. For surgical patients with at least 1 ICU attending encounter (see Supporting Table 1 in the online version of this article), patients aged 30 to 49 and 50 to 69 years were more likely to provide top decile RSRs (OR: 1.93, 95% CI: 1.08‐3.46 and OR: 1.65, 95% CI 1.07‐2.53, respectively). Resource intensity was not significantly associated with top decile RSRs.
DISCUSSION
Our analysis suggests that, for patients on the general care floors, resource utilization is associated with the RSR and, therefore, potentially the CMS Summary Star Rating. Adjusting for severity of illness, patients with higher resource utilization were more likely to report top decile RSRs.
Prior data regarding utilization and satisfaction are mixed. In a 2‐year, prospective, national examination, patients in the highest quartile of patient satisfaction had increased healthcare and prescription drug expenditures as well as increased rates of hospitalization when compared with patients in the lowest quartile of patient satisfaction.[9] However, a recent national study of surgical administrative databases suggested hospitals with high patient satisfaction provided more efficient care.[13]
One reason for the conflicting data may be that large, national evaluations are unable to control for between‐hospital confounders (ie, hospital quality of care). By capturing all eligible returned surveys at 1 institution, our design allowed us to collect granular data. We found that in 1 hospital setting, patient population, facilities, and food services, patients receiving more clinical resources generally assigned higher ratings than patients receiving less.
It is possible that utilization is a proxy for serious illness, and that patients with serious illness receive more attention during hospitalization and are more satisfied when discharged in a good state of health. However, we did adjust for severity of illness in our model using the Charlson‐Deyo index and we suggest that, other factors being equal, hospitals with higher per‐patient expenditures may be assigned higher Summary Star Ratings.
CMS has recently implemented a number of metrics designed to decrease healthcare costs by improving quality, safety, and efficiency. Concurrently, CMS has also prioritized patient experience. The Summary Star Rating was created to provide healthcare consumers with an easy way to compare the patient experience between hospitals[4]; however, our data suggest that this metric may be at odds with inpatient cost savings and efficiency metrics.
Per‐patient spending becomes particularly salient when considering that in fiscal year 2016, CMS' hospital VBP reimbursement will include 2 metrics: an efficiency outcome measure labeled Medicare spending per beneficiary, and a patient experience outcome measure based on HCAHPS survey dimensions.[2] Together, these 2 metrics will comprise nearly half of the total VBP performance score used to determine reimbursement. Although our data suggest that these 2 VBP metrics may be correlated, it should be noted that we measured inpatient hospital charges, whereas the CMS efficiency outcome measure includes costs for episode of care spanning 3 days prior to hospitalization to 30 days after hospitalization.
Patient expectations likely play a role in satisfaction.[14, 15, 16] In an outpatient setting, physician fulfillment of patient requests has been associated with positive patient evaluations of care.[17] However, patients appear to value education, shared decision making, and provider empathy more than testing and intervention.[14, 18, 19, 20, 21, 22, 23] Perhaps, in the absence of the former attributes, patients use additional resource expenditure as a proxy.
It is not clear that higher resource expenditure improves outcomes. A landmark study of nearly 1 million Medicare enrollees by Fisher et al. suggests that, although Medicare patients in higher‐spending regions receive more care than those in lower‐spending regions, this does not result in better health outcomes, specifically with regard to mortality.[24, 25] Patients who live in areas of high hospital capacity use the hospital more frequently than do patients in areas of low hospital capacity, but this does not appear to result in improved mortality rates.[26] In fact, physicians in areas of high healthcare capacity report more difficulty maintaining high‐quality patient relationships and feel less able to provide high‐quality care than physicians in lower‐capacity areas.[27]
We hypothesize the cause of the association between resource utilization and patient satisfaction could be that patients (1) perceive that a doctor who allows them to stay longer in the hospital or who performs additional testing cares more about their well‐being and (2) that these patients feel more strongly that their concerns are being heard and addressed by their physicians. A systematic review of primary care patients identified many studies that found a positive association between meeting patient expectations and satisfaction with care, but also suggested that although patients frequently expect information, physicians misperceive this as an expectation of specific action.[28] A separate systematic review found that patient education in the form of decision aides can help patients develop more reasonable expectations and reduce utilization of certain discretionary procedures such as elective surgeries and prostate‐specific antigen testing.[29]
We did not specifically address clinical outcomes in our analysis because the clinical outcomes on which CMS currently adjusts VBP reimbursement focus on 30‐day mortality for specific diagnoses, nosocomial infections, and iatrogenic events.[30] Our data include only returned surveys from living patients, and it is likely that 30‐day mortality was similar throughout all subsets of patients. Additionally, the nosocomial and iatrogenic outcome measures used by CMS are sufficiently rare on the general floors and are unlikely to have significantly influenced our results.[31]
Our study has several strengths. Nearly all medical and surgical patient surveys returned during the study period were included, and therefore our calculations are likely to accurately reflect the Summary Star Rating that would have been assigned for the period. Second, the large sample size helps attenuate potential differences in commonly used outcome metrics. Third, by adjusting for a variety of demographic and clinical variables, we were able to decrease the likelihood of unidentified confounders.
Notably, we identified 38 (0.4%) surveys returned for patients under 18 years of age at admission. These surveys were included in our analysis because, to the best of our knowledge, they would have existed in the pool of surveys CMS could have used to assign a Summary Star Rating.
Our study also has limitations. First, geographically diverse data are needed to ensure generalizability. Second, we used the Charlson‐Deyo Comorbidity Index to describe the degree of illness for each patient. This index represents a patient's total illness burden but may not describe the relative severity of the patient's current illness relative to another patient. Third, we selected variables we felt were most likely to be associated with patient experience, but unidentified confounding remains possible. Fourth, attendings caring for ICU patients fall within the Division of Critical Care/Pulmonary Medicine. Therefore, we may have inadvertently placed patients into the ICU cohort who received a pulmonary/critical care consult on the general floors. Fifth, our data describe associations only for patients who returned surveys. Although there may be inherent biases in patients who return surveys, HCAHPS survey responses are used by CMS to determine a hospital's overall satisfaction score.
CONCLUSION
For patients who return HCAHPS surveys, resource utilization may be positively associated with a hospital's Summary Star Rating. These data suggest that hospitals with higher per‐patient expenditures may receive higher Summary Star Ratings, which could result in hospitals with higher per‐patient resource utilization appearing more attractive to healthcare consumers. Future studies should attempt to confirm our findings at other institutions and to determine causative factors.
Acknowledgements
The authors thank Jason Machan, PhD (Department of Orthopedics and Surgery, Warren Alpert Medical School, Brown University, Providence, Rhode Island) for his help with study design, and Ms. Brenda Foster (data analyst, University of Rochester Medical Center, Rochester, NY) for her help with data collection.
Disclosures: Nothing to report.
- , , . Redesigning physician compensation and improving ED performance. Healthc Financ Manage. 2011;65(6):114–117.
- QualityNet. Available at: https://www.qualitynet.org/dcs/ContentServer?c=Page97(13):1041–1048.
- , , , . Factors determining inpatient satisfaction with care. Soc Sci Med. 2002;54(4):493–504.
- , , , , . Patient satisfaction revisited: a multilevel approach. Soc Sci Med. 2009;69(1):68–75.
- , , , et al. Predictors of patient satisfaction with hospital health care. BMC Health Serv Res. 2006;6:102.
- , , , . The cost of satisfaction: a national study of patient satisfaction, health care utilization, expenditures, and mortality. Arch Intern Med. 2012;172(5):405–411.
- , , , , . Relationship between patient satisfaction with inpatient care and hospital readmission within 30 days. Am J Manag Care. 2011;17(1):41–48.
- Becker's Infection Control and Clinical Quality. Star Ratings go live on Hospital Compare: how many hospitals got 5 stars? Available at: http://www.beckershospitalreview.com/quality/star‐ratings‐go‐live‐on‐hospital‐compare‐how‐many‐hospitals‐got‐5‐stars.html. Published April 16, 2015. Accessed October 5, 2015.
- , , . Adapting a clinical comorbidity index for use with ICD‐9‐CM administrative databases. J Clin Epidemiol. 1992;45(6):613–619.
- , , . Patient satisfaction and quality of surgical care in US hospitals. Ann Surg. 2015;261(1):2–8.
- , , , , . Should health care providers be accountable for patients' care experiences? J Gen Intern Med. 2015;30(2):253–256.
- , , , , . Unmet expectations for care and the patient‐physician relationship. J Gen Intern Med. 2002;17(11):817–824.
- , , , et al. Do unmet expectations for specific tests, referrals, and new medications reduce patients' satisfaction? J Gen Intern Med. 2004;19(11):1080–1087.
- , , , , , . Request fulfillment in office practice: antecedents and relationship to outcomes. Med Care. 2002;40(1):38–51.
- , , , et al. Factors associated with patient satisfaction with care among dermatological outpatients. Br J Dermatol. 2001;145(4):617–623.
- , , , . Patient expectations of emergency department care: phase II—a cross‐sectional survey. CJEM. 2006;8(3):148–157.
- , , , , . Patients' perspectives on ideal physician behaviors. Mayo Clin Proc. 2006;81(3):338–344.
- , . What do people want from their health care? A qualitative study. J Participat Med. 2015;18:e10.
- , , . Evaluations of care by adults following a denial of an advertisement‐related prescription drug request: the role of expectations, symptom severity, and physician communication style. Soc Sci Med. 2006;62(4):888–899.
- , , , , , . Getting to “no”: strategies primary care physicians use to deny patient requests. Arch Intern Med. 2010;170(4):381–388.
- , , , , , . The implications of regional variations in Medicare spending. Part 1: the content, quality, and accessibility of care. Ann Intern Med. 2003;138(4):273–287.
- , , , , , . The implications of regional variations in Medicare spending. Part 2: health outcomes and satisfaction with care. Ann Intern Med. 2003;138(4):288–298.
- , , , et al. Associations among hospital capacity, utilization, and mortality of US Medicare beneficiaries, controlling for sociodemographic factors. Health Serv Res. 2000;34(6):1351–1362.
- , , , . Regional variations in health care intensity and physician perceptions of quality of care. Ann Intern Med. 2006;144(9):641–649.
- , , . Visit‐specific expectations and patient‐centered outcomes: a literature review. Arch Fam Med. 2000;9(10):1148–1155.
- , , , et al. Decision aids for people facing health treatment or screening decisions. Cochrane Database Syst Rev. 2014;1:CD001431.
- Centers for Medicare and Medicaid Services. Hospital Compare. Outcome domain. Available at: https://www.medicare.gov/hospitalcompare/data/outcome‐domain.html. Accessed October 5, 2015.
- Centers for Disease Control and Prevention. 2013 national and state healthcare‐associated infections progress report. Available at: www.cdc.gov/hai/progress‐report/index.html. Accessed October 5, 2015.
The patient experience has become increasingly important to healthcare in the United States. It is now a metric used commonly to determine physician compensation and accounts for nearly 30% of the Centers for Medicare and Medicaid Services' (CMS) Value‐Based Purchasing (VBP) reimbursement for fiscal years 2015 and 2016.[1, 2]
In April 2015, CMS added a 5‐star patient experience score to its Hospital Compare website in an attempt to address the Affordable Care Act's call for transparent and easily understandable public reporting.[3] A hospital's principal score is the Summary Star Rating, which is based on responses to the Hospital Consumer Assessment of Healthcare Providers and Systems (HCAHPS) survey. The formulas used to calculate Summary Star Ratings have been reported by CMS.[4]
Studies published over the past decade suggest that gender, age, education level, length of hospital stay, travel distance, and other factors may influence patient satisfaction.[5, 6, 7, 8] One study utilizing a national dataset suggested that higher patient satisfaction was associated with greater inpatient healthcare utilization and higher healthcare expenditures.[9] It is therefore possible that emphasizing patient experience scores could adversely impact healthcare resource utilization. However, positive patient experience may also be an important independent dimension of quality for patients and correlate with improved clinical outcomes.[10]
We know of no literature describing patient factors associated with the Summary Star Rating. Given that this rating is now used as a standard metric by which patient experience can be compared across more than 3,500 hospitals,[11] data describing the association between patient‐level factors and the Summary Star Rating may provide hospitals with an opportunity to target improvement efforts. We aimed to determine the degree to which resource utilization is associated with a satisfaction score based on the Summary Star Rating methodology.
METHODS
The study was conducted at the University of Rochester Medical Center (URMC), an 830‐bed tertiary care center in upstate New York. This was a retrospective review of all HCAHPS surveys returned to URMC over a 27‐month period from January 1, 2012 to April 1, 2014. URMC follows the standard CMS process for determining which patients receive surveys as follows. During the study timeframe, HCAHPS surveys were mailed to patients 18 years of age and older who had an inpatient stay spanning at least 1 midnight. Surveys were mailed within 5 days of discharge, and were generally returned within 6 weeks. URMC did not utilize telephone or email surveys during the study period. Surveys were not sent to patients who (1) were transferred to another facility, (2) were discharged to hospice, (3) died during the hospitalization, (4) received psychiatric or rehabilitative services during the hospitalization, (5) had an international address, and/or (6) were prisoners.
The survey vendor (Press Ganey, South Bend, IN) for URMC provided raw data for returned surveys with patient answers to questions. Administrative and billing databases were used to add demographic and clinical data for the corresponding hospitalization to the dataset. These data included age, gender, payer status (public, private, self, charity), length of stay, number of attendings who saw the patient (based on encounters documented in the electronic medical record (EMR)), all discharge International Classification of Diseases, 9th Revision (ICD‐9) diagnoses for the hospitalization, total charges for the hospitalization, and intensive care unit (ICU) utilization as evidenced by a documented encounter with a member of the Division of Critical Care/Pulmonary Medicine.
CMS analyzes surveys within 1 of 3 clinical service categories (medical, surgical, or obstetrics/gynecology) based on the discharging service. To parallel this approach, each returned survey was placed into 1 of these categories based on the clinical service of the discharging physician. Patients placed in the obstetrics/gynecology category (n = 1317, 13%) will be analyzed in a future analysis given inherent differences in patient characteristics that require evaluation of other variables.
Approximations of CMS Summary Star Rating
The HCAHPS survey is a multiple‐choice questionnaire that includes several domains of patient satisfaction. Respondents are asked to rate areas of satisfaction with their hospital experience on a Likert scale. CMS uses a weighted average of Likert responses to a subset of HCAHPS questions to calculate a hospital's raw score in 11 domains, as well as an overall raw summary score. CMS then adjusts each raw score for differences between hospitals (eg, clustering, improvement over time, method of survey) to determine a hospital's star rating in each domain and an overall Summary Star Rating (the Summary Star Rating is the primary factor by which consumers can compare hospitals).[4] Because our data were from a single hospital system, the between‐hospital scoring adjustments utilized by CMS were not applicable. Instead, we calculated the raw scores exactly as CMS does prior to the adjustments. Thus, our scores reflect the scores that CMS would have given URMC during the study period prior to standardized adjustments; we refer to this as the raw satisfaction rating (RSR). We calculated an RSR for every eligible survey. The RSR was calculated as a continuous variable from 0 (lowest) to 1 (highest). Detailed explanation of our RSR calculation is available in the Supporting Information in the online version of this article.
Statistical Analysis
All analyses were performed in aggregate and by service (medical vs surgical). Categorical variables were summarized using frequencies with percentages. Comparisons across levels of categorical variables were performed with the 2 test. We report bivariate associations between the independent variables and RSRs in the top decile using unadjusted odds ratios (ORs) with 95% confidence intervals (CIs). Similarly, multivariable logistic regression was used for adjusted analyses. For the variables of severity of illness and resource intensity, the group with the lowest illness severity and lowest resource use served as the reference groups. We modeled patients without an ICU encounter and with an ICU encounter separately.
Charges, number of unique attendings encountered, and lengths of stay were highly correlated, and likely various measures of the same underlying construct of resource intensity, and therefore could not be entered into our models simultaneously. We combined these into a resource intensity score using factor analysis with a varimax rotation, and extracted factor scores for a single factor (supported by a scree plot). We then placed patients into 4 groups based on the distribution of the factor scores: low (<25th percentile), moderate (25th50th percentile), major (50th75th percentile), and extreme (>75th percentile).
We used the Charlson‐Deyo comorbidity score as our disease severity index.[12] The index uses ICD‐9 diagnoses with points assigned for the impact of each diagnosis on morbidity and the points summed to an overall score. This provides a measure of disease severity for a patient based on the number of diagnoses and relative mortality of the individual diagnoses. Scores were categorized as 0 (representing no major illness burden), 1 to 3, 4 to 6, and >6.
All statistical analyses were performed using SAS version 9.4 (SAS Institute, Cary, NC), and P values <0.05 were considered statistically significant. This study was approved by the institutional review board at the University of Rochester Medical Center.
RESULTS
Our initial search identified 10,007 returned surveys (29% of eligible patients returned surveys during the study period). Of these, 5059 (51%) were categorized as medical, 3630 (36%) as surgical, and 1317 (13%) as obstetrics/gynecology. One survey did not have the service of the discharging physician recorded and was excluded. Cohort demographics and relationship to RSRs in the top decile for the 8689 medical and surgical patients can be found in Table 1. The most common discharge diagnosis‐related groups (DRGs) for medical patients were 247, percutaneous cardiovascular procedure with drug‐eluding stent without major complications or comorbidities (MCC) (3.8%); 871, septicemia or severe sepsis without mechanical ventilation >96 hours with MCC (2.7%); and 392, esophagitis, gastroenteritis, and miscellaneous digestive disorders with MCC (2.3%). The most common DRGs for surgical patients were 460, spinal fusion except cervical without MCC (3.5%); 328, stomach, esophageal and duodenal procedure without complication or comorbidities or MCC (3.3%); and 491, back and neck procedure excluding spinal fusion without complication or comorbidities or MCC (3.1%).
| Overall | Medical | Surgical | ||||||||||
|---|---|---|---|---|---|---|---|---|---|---|---|---|
| Total | <90th | Top Decile | P | Total | <90th | Top Decile | P | Total | <90th | Top Decile | P | |
| ||||||||||||
| Overall | 8,689 | 7,789 (90) | 900 (10) | 5,059 | 4,646 (92) | 413 (8) | 3,630 | 3,143 (87) | 487 (13) | |||
| Age, y | ||||||||||||
| <30 | 419 (5) | 371 (89) | 48 (12) | <0.001 | 218 (4) | 208 (95) | 10 (5) | <0.001 | 201 (6) | 163 (81) | 38 (19) | <0.001 |
| 3049 | 1,029 (12) | 902 (88) | 127 (12) | 533 (11) | 482 (90) | 51 (10) | 496 (14) | 420 (85) | 76 (15) | |||
| 5069 | 3,911 (45) | 3,450 (88) | 461 (12) | 2,136 (42) | 1,930 (90) | 206 (10) | 1,775 (49) | 1,520 (86) | 255 (14) | |||
| >69 | 3,330 (38) | 3,066 (92) | 264 (8) | 2,172 (43) | 2,026 (93) | 146 (7) | 1,158 (32) | 1,040 (90) | 118 (10) | |||
| Gender | ||||||||||||
| Male | 4,640 (53) | 4,142 (89) | 498 (11) | 0.220 | 2,596 (51) | 2,379 (92) | 217 (8) | 0.602 | 2,044 (56) | 1,763 (86) | 281 (14) | 0.506 |
| Female | 4,049 (47) | 3,647 (90) | 402 (10) | 2,463 (49) | 2,267 (92) | 196 (8) | 1,586 (44) | 1,380 (87) | 206 (13) | |||
| ICU encounter | ||||||||||||
| No | 7,122 (82) | 6,441 (90) | 681 (10) | <0.001 | 4,547 (90) | 4,193 (92) | 354 (8) | <0.001 | 2,575 (71) | 2,248 (87) | 327 (13) | 0.048 |
| Yes | 1,567 (18) | 1,348 (86) | 219 (14) | 512 (10) | 453 (89) | 59 (12) | 1,055 (29) | 895 (85) | 160 (15) | |||
| Payer | ||||||||||||
| Public | 5,564 (64) | 5,036 (91) | 528 (10) | <0.001 | 3,424 (68) | 3,161 (92) | 263 (8) | 0.163 | 2,140 (59) | 1,875 (88) | 265 (12) | 0.148 |
| Private | 3,064 (35) | 2,702 (88) | 362 (12) | 1,603 (32) | 1,458 (91) | 145 (9) | 1,461 (40) | 1,244 (85) | 217 (15) | |||
| Charity | 45 (1) | 37 (82) | 8 (18) | 25 (1) | 21 (84) | 4 (16) | 20 (1) | 16 (80) | 4 (20) | |||
| Self | 16 (0) | 14 (88) | 2 (13) | 7 (0) | 6 (86) | 1 (14) | 9 (0) | 8 (89) | 1 (11) | |||
| Length of stay, d | ||||||||||||
| <3 | 3,156 (36) | 2,930 (93) | 226 (7) | <0.001 | 1,961 (39) | 1,865 (95) | 96 (5) | <0.001 | 1,195 (33) | 1,065 (89) | 130 (11) | <0.001 |
| 36 | 3,330 (38) | 2,959 (89) | 371 (11) | 1,867 (37) | 1,702 (91) | 165 (9) | 1,463 (40) | 1,257 (86) | 206 (14) | |||
| >6 | 2,203 (25) | 1,900 (86) | 303 (14) | 1,231 (24) | 1,079 (88) | 152 (12) | 972 (27) | 821 (85) | 151 (16) | |||
| No. of attendings | ||||||||||||
| <4 | 3,959 (46) | 3,615 (91) | 344 (9) | <0.001 | 2,307 (46) | 2,160 (94) | 147 (6) | <0.001 | 1,652 (46) | 1,455 (88) | 197 (12) | 0.052 |
| 46 | 3,067 (35) | 2,711 (88) | 356 (12) | 1,836 (36) | 1,663 (91) | 173 (9) | 1,231 (34) | 1,048 (85) | 183 (15) | |||
| >6 | 1,663 (19) | 1,463 (88) | 200 (12) | 916 (18) | 823 (90) | 93 (10) | 747 (21) | 640 (86) | 107 (14) | |||
| Severity index* | ||||||||||||
| 0 (lowest) | 2,812 (32) | 2,505 (89) | 307 (11) | 0.272 | 1,273 (25) | 1,185 (93) | 88 (7) | 0.045 | 1,539 (42) | 1,320 (86) | 219 (14) | 0.261 |
| 13 | 4,253 (49) | 3,827 (90) | 426 (10) | 2,604 (52) | 2,395 (92) | 209 (8) | 1,649 (45) | 1,432 (87) | 217 (13) | |||
| 46 | 1163 (13) | 1,052 (91) | 111 (10) | 849 (17) | 770 (91) | 79 (9) | 314 (9) | 282 (90) | 32 (10) | |||
| >6 (highest) | 461 (5) | 405 (88) | 56 (12) | 333 (7) | 296 (89) | 37 (11) | 128 (4) | 109 (85) | 19 (15) | |||
| Charges, | ||||||||||||
| Low | 1,820 (21) | 1,707 (94) | 113 (6) | <0.001 | 1,426 (28) | 1,357 (95) | 69 (5) | <0.001 | 394 (11) | 350 (89) | 44 (11) | 0.007 |
| Medium | 5,094 (59) | 4,581 (90) | 513 (10) | 2,807 (56) | 2,582 (92) | 225 (8) | 2,287 (63) | 1,999 (87) | 288 (13) | |||
| High | 1,775 (20) | 1,501 (85) | 274 (15) | 826 (16) | 707 (86) | 119 (14) | 949 (26) | 794 (84) | 155 (16) | |||
Unadjusted analysis of medical and surgical patients identified significant associations of several variables with a top decile RSR (Table 2). Patients with longer lengths of stay (OR: 2.07, 95% CI: 1.72‐2.48), more attendings (OR: 1.44, 95% CI: 1.19‐1.73), and higher hospital charges (OR: 2.76, 95% CI: 2.19‐3.47) were more likely to report an RSR in the top decile. Patients without an ICU encounter (OR: 0.65, 95% CI: 0.55‐0.77) and on a medical service (OR: 0.57, 95% CI: 0.5‐ 0.66) were less likely to report an RSR in the top decile. Several associations were identified in only the medical or surgical cohorts. In the medical cohort, patients with the highest illness severity index (OR: 1.68, 95% CI: 1.12‐ 2.52) and with 7 different attending physicians (OR: 1.66, 95% CI: 1.27‐2.18) were more likely to report RSRs in the top decile. In the surgical cohort, patients <30 years of age (OR: 2.05, 95% CI 1.38‐3.07) were more likely to report an RSR in the top decile than patients >69 years of age. Insurance payer category and gender were not significantly associated with top decile RSRs.
| Overall | Medical | Surgical | ||||
|---|---|---|---|---|---|---|
| Odds Ratio (95% CI) | P | Odds Ratio (95% CI) | P | Odds Ratio (95% CI) | P | |
| ||||||
| Age, y | ||||||
| <30 | 1.5 (1.082.08) | 0.014 | 0.67 (0.351.29) | 0.227 | 2.05 (1.383.07) | <0.001 |
| 3049 | 1.64 (1.312.05) | <.001 | 1.47 (1.052.05) | 0.024 | 1.59 (1.172.17) | 0.003 |
| 5069 | 1.55 (1.321.82) | <.001 | 1.48 (1.191.85) | 0.001 | 1.48 (1.171.86) | 0.001 |
| >69 | Ref | Ref | Ref | |||
| Gender | ||||||
| Male | 1.09 (0.951.25) | 0.220 | 1.06 (0.861.29) | 0.602 | 1.07 (0.881.3) | 0.506 |
| Female | Ref | Ref | Ref | |||
| ICU encounter | ||||||
| No | 0.65 (0.550.77) | <0.001 | 0.65 (0.480.87) | 0.004 | 0.81 (0.661) | 0.048 |
| Yes | Ref | Ref | Ref | |||
| Payer | ||||||
| Public | 0.73 (0.173.24) | 0.683 | 0.5 (0.064.16) | 0.521 | 1.13 (0.149.08) | 0.908 |
| Private | 0.94 (0.214.14) | 0.933 | 0.6 (0.074.99) | 0.634 | 1.4 (0.1711.21) | 0.754 |
| Charity | 1.51 (0.298.02) | 0.626 | 1.14 (0.1112.25) | 0.912 | 2 (0.1920.97) | 0.563 |
| Self | Ref | Ref | Ref | |||
| Length of stay, d | ||||||
| <3 | Ref | Ref | Ref | |||
| 36 | 1.63 (1.371.93) | <0.001 | 1.88 (1.452.44) | <0.001 | 1.34 (1.061.7) | 0.014 |
| >6 | 2.07 (1.722.48) | <0.001 | 2.74 (2.13.57) | <0.001 | 1.51 (1.171.94) | 0.001 |
| No. of attendings | ||||||
| <4 | Ref | Ref | Ref | |||
| 46 | 1.38 (1.181.61) | <0.001 | 1.53 (1.221.92) | <0.001 | 1.29 (1.041.6) | 0.021 |
| >6 | 1.44 (1.191.73) | <0.001 | 1.66 (1.272.18) | <0.001 | 1.23 (0.961.59) | 0.102 |
| Severity index* | ||||||
| 0 (lowest) | Ref | Ref | Ref | |||
| 13 | 0.91 (0.781.06) | 0.224 | 1.18 (0.911.52) | 0.221 | 0.91 (0.751.12) | 0.380 |
| 46 | 0.86 (0.681.08) | 0.200 | 1.38 (1.011.9) | 0.046 | 0.68 (0.461.01) | 0.058 |
| >6 (highest) | 1.13 (0.831.53) | 0.436 | 1.68 (1.122.52) | 0.012 | 1.05 (0.631.75) | 0.849 |
| Charges | ||||||
| Low | Ref | Ref | Ref | |||
| Medium | 1.69 (1.372.09) | <0.001 | 1.71 (1.32.26) | <0.001 | 1.15 (0.821.61) | 0.428 |
| High | 2.76 (2.193.47) | <0.001 | 3.31 (2.434.51) | <0.001 | 1.55 (1.092.22) | 0.016 |
| Service | ||||||
| Medical | 0.57 (0.50.66) | <0.001 | ||||
| Surgical | Ref | |||||
Multivariable modeling (Table 3) for all patients without an ICU encounter suggested that (1) patients aged <30 years, 30 to 49 years, and 50 to 69 years were more likely to report top decile RSRs when compared to patients 70 years and older (OR: 1.61, 95% CI: 1.09‐2.36; OR: 1.44, 95% CI: 1.08‐1.93; and OR: 1.39, 95% CI: 1.13‐1.71, respectively) and (2), when compared to patients with extreme resource intensity scores, patients with higher resource intensity scores were more likely to report top decile RSRs (moderate [OR: 1.42, 95% CI: 1.11‐1.83], major [OR: 1.56, 95% CI: 1.22‐2.01], and extreme [OR: 2.29, 95% CI: 1.8‐2.92]. These results were relatively consistent within medical and surgical subgroups (Table 3).
| Overall | Medical | Surgical | ||||
|---|---|---|---|---|---|---|
| Odds Ratio (95% CI) | P | Odds Ratio (95% CI) | P | Odds Ratio (95% CI) | P | |
| ||||||
| Age, y | ||||||
| <30 | 1.61 (1.092.36) | 0.016 | 0.82 (0.41.7) | 0.596 | 2.31 (1.393.82) | 0.001 |
| 3049 | 1.44 (1.081.93) | 0.014 | 1.55 (1.032.32) | 0.034 | 1.41 (0.912.17) | 0.120 |
| 5069 | 1.39 (1.131.71) | 0.002 | 1.44 (1.11.88) | 0.008 | 1.39 (11.93) | 0.049 |
| >69 | Ref | Ref | Ref | |||
| Sex | ||||||
| Male | 1 (0.851.17) | 0.964 | 1 (0.81.25) | 0.975 | 0.99 (0.791.26) | 0.965 |
| Female | Ref | Ref | Ref | |||
| Payer | ||||||
| Public | 0.62 (0.142.8) | 0.531 | 0.42 (0.053.67) | 0.432 | 1.03 (0.128.59) | 0.978 |
| Private | 0.67 (0.153.02) | 0.599 | 0.42 (0.053.67) | 0.434 | 1.17 (0.149.69) | 0.884 |
| Charity | 1.54 (0.288.41) | 0.620 | 1 (0.0911.13) | 0.999 | 2.56 (0.2328.25) | 0.444 |
| Self | Ref | Ref | Ref | |||
| Severity index | ||||||
| 0 (lowest) | Ref | Ref | Ref | |||
| 13 | 1.07 (0.891.29) | 0.485 | 1.18 (0.881.58) | 0.267 | 1 (0.781.29) | 0.986 |
| 46 | 1.14 (0.861.51) | 0.377 | 1.42 (0.992.04) | 0.056 | 0.6 (0.331.1) | 0.100 |
| >6 (highest) | 1.31 (0.911.9) | 0.150 | 1.47 (0.932.33) | 0.097 | 1.1 (0.542.21) | 0.795 |
| Resource intensity score | ||||||
| Low | Ref | Ref | Ref | |||
| Moderate | 1.42 (1.111.83) | 0.006 | 1.6 (1.112.3) | 0.011 | 0.94 (0.661.34) | 0.722 |
| Major | 1.56 (1.222.01) | 0.001 | 1.69 (1.182.43) | 0.004 | 1.28 (0.911.8) | 0.151 |
| Extreme | 2.29 (1.82.92) | <0.001 | 2.72 (1.943.82) | <0.001 | 1.63 (1.172.26) | 0.004 |
| Service | ||||||
| Medical | 0.59 (0.50.69) | <0.001 | ||||
| Surgical | Ref | |||||
In those with at least 1 ICU attending encounter (see Supporting Table 1 in the online version of this article), no variables demonstrated significant association with top decile RSRs in the overall group or in the medical subgroup. For surgical patients with at least 1 ICU attending encounter (see Supporting Table 1 in the online version of this article), patients aged 30 to 49 and 50 to 69 years were more likely to provide top decile RSRs (OR: 1.93, 95% CI: 1.08‐3.46 and OR: 1.65, 95% CI 1.07‐2.53, respectively). Resource intensity was not significantly associated with top decile RSRs.
DISCUSSION
Our analysis suggests that, for patients on the general care floors, resource utilization is associated with the RSR and, therefore, potentially the CMS Summary Star Rating. Adjusting for severity of illness, patients with higher resource utilization were more likely to report top decile RSRs.
Prior data regarding utilization and satisfaction are mixed. In a 2‐year, prospective, national examination, patients in the highest quartile of patient satisfaction had increased healthcare and prescription drug expenditures as well as increased rates of hospitalization when compared with patients in the lowest quartile of patient satisfaction.[9] However, a recent national study of surgical administrative databases suggested hospitals with high patient satisfaction provided more efficient care.[13]
One reason for the conflicting data may be that large, national evaluations are unable to control for between‐hospital confounders (ie, hospital quality of care). By capturing all eligible returned surveys at 1 institution, our design allowed us to collect granular data. We found that in 1 hospital setting, patient population, facilities, and food services, patients receiving more clinical resources generally assigned higher ratings than patients receiving less.
It is possible that utilization is a proxy for serious illness, and that patients with serious illness receive more attention during hospitalization and are more satisfied when discharged in a good state of health. However, we did adjust for severity of illness in our model using the Charlson‐Deyo index and we suggest that, other factors being equal, hospitals with higher per‐patient expenditures may be assigned higher Summary Star Ratings.
CMS has recently implemented a number of metrics designed to decrease healthcare costs by improving quality, safety, and efficiency. Concurrently, CMS has also prioritized patient experience. The Summary Star Rating was created to provide healthcare consumers with an easy way to compare the patient experience between hospitals[4]; however, our data suggest that this metric may be at odds with inpatient cost savings and efficiency metrics.
Per‐patient spending becomes particularly salient when considering that in fiscal year 2016, CMS' hospital VBP reimbursement will include 2 metrics: an efficiency outcome measure labeled Medicare spending per beneficiary, and a patient experience outcome measure based on HCAHPS survey dimensions.[2] Together, these 2 metrics will comprise nearly half of the total VBP performance score used to determine reimbursement. Although our data suggest that these 2 VBP metrics may be correlated, it should be noted that we measured inpatient hospital charges, whereas the CMS efficiency outcome measure includes costs for episode of care spanning 3 days prior to hospitalization to 30 days after hospitalization.
Patient expectations likely play a role in satisfaction.[14, 15, 16] In an outpatient setting, physician fulfillment of patient requests has been associated with positive patient evaluations of care.[17] However, patients appear to value education, shared decision making, and provider empathy more than testing and intervention.[14, 18, 19, 20, 21, 22, 23] Perhaps, in the absence of the former attributes, patients use additional resource expenditure as a proxy.
It is not clear that higher resource expenditure improves outcomes. A landmark study of nearly 1 million Medicare enrollees by Fisher et al. suggests that, although Medicare patients in higher‐spending regions receive more care than those in lower‐spending regions, this does not result in better health outcomes, specifically with regard to mortality.[24, 25] Patients who live in areas of high hospital capacity use the hospital more frequently than do patients in areas of low hospital capacity, but this does not appear to result in improved mortality rates.[26] In fact, physicians in areas of high healthcare capacity report more difficulty maintaining high‐quality patient relationships and feel less able to provide high‐quality care than physicians in lower‐capacity areas.[27]
We hypothesize the cause of the association between resource utilization and patient satisfaction could be that patients (1) perceive that a doctor who allows them to stay longer in the hospital or who performs additional testing cares more about their well‐being and (2) that these patients feel more strongly that their concerns are being heard and addressed by their physicians. A systematic review of primary care patients identified many studies that found a positive association between meeting patient expectations and satisfaction with care, but also suggested that although patients frequently expect information, physicians misperceive this as an expectation of specific action.[28] A separate systematic review found that patient education in the form of decision aides can help patients develop more reasonable expectations and reduce utilization of certain discretionary procedures such as elective surgeries and prostate‐specific antigen testing.[29]
We did not specifically address clinical outcomes in our analysis because the clinical outcomes on which CMS currently adjusts VBP reimbursement focus on 30‐day mortality for specific diagnoses, nosocomial infections, and iatrogenic events.[30] Our data include only returned surveys from living patients, and it is likely that 30‐day mortality was similar throughout all subsets of patients. Additionally, the nosocomial and iatrogenic outcome measures used by CMS are sufficiently rare on the general floors and are unlikely to have significantly influenced our results.[31]
Our study has several strengths. Nearly all medical and surgical patient surveys returned during the study period were included, and therefore our calculations are likely to accurately reflect the Summary Star Rating that would have been assigned for the period. Second, the large sample size helps attenuate potential differences in commonly used outcome metrics. Third, by adjusting for a variety of demographic and clinical variables, we were able to decrease the likelihood of unidentified confounders.
Notably, we identified 38 (0.4%) surveys returned for patients under 18 years of age at admission. These surveys were included in our analysis because, to the best of our knowledge, they would have existed in the pool of surveys CMS could have used to assign a Summary Star Rating.
Our study also has limitations. First, geographically diverse data are needed to ensure generalizability. Second, we used the Charlson‐Deyo Comorbidity Index to describe the degree of illness for each patient. This index represents a patient's total illness burden but may not describe the relative severity of the patient's current illness relative to another patient. Third, we selected variables we felt were most likely to be associated with patient experience, but unidentified confounding remains possible. Fourth, attendings caring for ICU patients fall within the Division of Critical Care/Pulmonary Medicine. Therefore, we may have inadvertently placed patients into the ICU cohort who received a pulmonary/critical care consult on the general floors. Fifth, our data describe associations only for patients who returned surveys. Although there may be inherent biases in patients who return surveys, HCAHPS survey responses are used by CMS to determine a hospital's overall satisfaction score.
CONCLUSION
For patients who return HCAHPS surveys, resource utilization may be positively associated with a hospital's Summary Star Rating. These data suggest that hospitals with higher per‐patient expenditures may receive higher Summary Star Ratings, which could result in hospitals with higher per‐patient resource utilization appearing more attractive to healthcare consumers. Future studies should attempt to confirm our findings at other institutions and to determine causative factors.
Acknowledgements
The authors thank Jason Machan, PhD (Department of Orthopedics and Surgery, Warren Alpert Medical School, Brown University, Providence, Rhode Island) for his help with study design, and Ms. Brenda Foster (data analyst, University of Rochester Medical Center, Rochester, NY) for her help with data collection.
Disclosures: Nothing to report.
- , , . Redesigning physician compensation and improving ED performance. Healthc Financ Manage. 2011;65(6):114–117.
- QualityNet. Available at: https://www.qualitynet.org/dcs/ContentServer?c=Page97(13):1041–1048.
- , , , . Factors determining inpatient satisfaction with care. Soc Sci Med. 2002;54(4):493–504.
- , , , , . Patient satisfaction revisited: a multilevel approach. Soc Sci Med. 2009;69(1):68–75.
- , , , et al. Predictors of patient satisfaction with hospital health care. BMC Health Serv Res. 2006;6:102.
- , , , . The cost of satisfaction: a national study of patient satisfaction, health care utilization, expenditures, and mortality. Arch Intern Med. 2012;172(5):405–411.
- , , , , . Relationship between patient satisfaction with inpatient care and hospital readmission within 30 days. Am J Manag Care. 2011;17(1):41–48.
- Becker's Infection Control and Clinical Quality. Star Ratings go live on Hospital Compare: how many hospitals got 5 stars? Available at: http://www.beckershospitalreview.com/quality/star‐ratings‐go‐live‐on‐hospital‐compare‐how‐many‐hospitals‐got‐5‐stars.html. Published April 16, 2015. Accessed October 5, 2015.
- , , . Adapting a clinical comorbidity index for use with ICD‐9‐CM administrative databases. J Clin Epidemiol. 1992;45(6):613–619.
- , , . Patient satisfaction and quality of surgical care in US hospitals. Ann Surg. 2015;261(1):2–8.
- , , , , . Should health care providers be accountable for patients' care experiences? J Gen Intern Med. 2015;30(2):253–256.
- , , , , . Unmet expectations for care and the patient‐physician relationship. J Gen Intern Med. 2002;17(11):817–824.
- , , , et al. Do unmet expectations for specific tests, referrals, and new medications reduce patients' satisfaction? J Gen Intern Med. 2004;19(11):1080–1087.
- , , , , , . Request fulfillment in office practice: antecedents and relationship to outcomes. Med Care. 2002;40(1):38–51.
- , , , et al. Factors associated with patient satisfaction with care among dermatological outpatients. Br J Dermatol. 2001;145(4):617–623.
- , , , . Patient expectations of emergency department care: phase II—a cross‐sectional survey. CJEM. 2006;8(3):148–157.
- , , , , . Patients' perspectives on ideal physician behaviors. Mayo Clin Proc. 2006;81(3):338–344.
- , . What do people want from their health care? A qualitative study. J Participat Med. 2015;18:e10.
- , , . Evaluations of care by adults following a denial of an advertisement‐related prescription drug request: the role of expectations, symptom severity, and physician communication style. Soc Sci Med. 2006;62(4):888–899.
- , , , , , . Getting to “no”: strategies primary care physicians use to deny patient requests. Arch Intern Med. 2010;170(4):381–388.
- , , , , , . The implications of regional variations in Medicare spending. Part 1: the content, quality, and accessibility of care. Ann Intern Med. 2003;138(4):273–287.
- , , , , , . The implications of regional variations in Medicare spending. Part 2: health outcomes and satisfaction with care. Ann Intern Med. 2003;138(4):288–298.
- , , , et al. Associations among hospital capacity, utilization, and mortality of US Medicare beneficiaries, controlling for sociodemographic factors. Health Serv Res. 2000;34(6):1351–1362.
- , , , . Regional variations in health care intensity and physician perceptions of quality of care. Ann Intern Med. 2006;144(9):641–649.
- , , . Visit‐specific expectations and patient‐centered outcomes: a literature review. Arch Fam Med. 2000;9(10):1148–1155.
- , , , et al. Decision aids for people facing health treatment or screening decisions. Cochrane Database Syst Rev. 2014;1:CD001431.
- Centers for Medicare and Medicaid Services. Hospital Compare. Outcome domain. Available at: https://www.medicare.gov/hospitalcompare/data/outcome‐domain.html. Accessed October 5, 2015.
- Centers for Disease Control and Prevention. 2013 national and state healthcare‐associated infections progress report. Available at: www.cdc.gov/hai/progress‐report/index.html. Accessed October 5, 2015.
Choosing Wisely in Pediatric Medicine
Overuse in medicine is a significant and under‐recognized problem. Don Berwick estimated that waste accounts for at least 20% of healthcare expenditures in the United States, with overtreatment as one of the largest categories.[1] A commentary by Schroeder et al. challenged pediatricians to incorporate this knowledge into our own patient safety and quality movement.[2] Recently published data suggest that we are far from achieving the patient safety goals set forth in the Institute of Medicine's landmark To Err is Human[3] report, despite more than a decade of national, local, and regional efforts.[4] One way to reduce waste and improve patient safety is to eliminate practices of unproven benefit. Therapies or tests that may initially seem promising are often proven to be not only unhelpful but actually harmful. The recommendation of the US Preventive Services Task Force against routine screening for prostate specific antigen is an example of how a common test initially thought of as lifesaving actually increases harm.[5]
The American Board of Internal Medicine Foundation (ABIM‐F) recently announced the Choosing Wisely campaign. Through this campaign the Foundation encourages physicians, patients and other healthcare stakeholders to think and talk about medical tests and procedures that may be unnecessary.[6] The primary output of this challenge is the development of a list of 5 tests and or therapies that physicians and patients should question. The ABIM‐F approached different medical societies to develop these lists within their own specialties. The Society of Hospital Medicine (SHM) joined the Choosing Wisely campaign in April 2012, and agreed to develop a list of 5 therapies and tests for adult hospital medicine and pediatric hospital medicine. Here we present the contribution of the pediatric workgroup detailing the methodology and process for developing the list, as well as summarizing the evidence supporting each recommendation.
METHODS
In the spring of 2012, the pediatric committee of the SHM convened a workgroup of pediatric hospitalists to develop a top 5 list for the field. This workgroup was composed of experienced pediatric hospitalists representing diverse geographic locations of the United States and a mix of academic and nonacademic practice settings. The group, consisting of 4 women and 9 men, began by proposing candidate recommendations after discussion with colleagues at their different practice sites. The group was charged to maintain a focus on overuse practices that had a strong basis in evidence, were frequently encountered at their practice sites, and achieved significant consensus among their colleagues. Figure 1 shows the process map describing the method for the development of the pediatric recommendations. All workgroup participants were queried as to conflict of interest relevant to this work and none were identified.
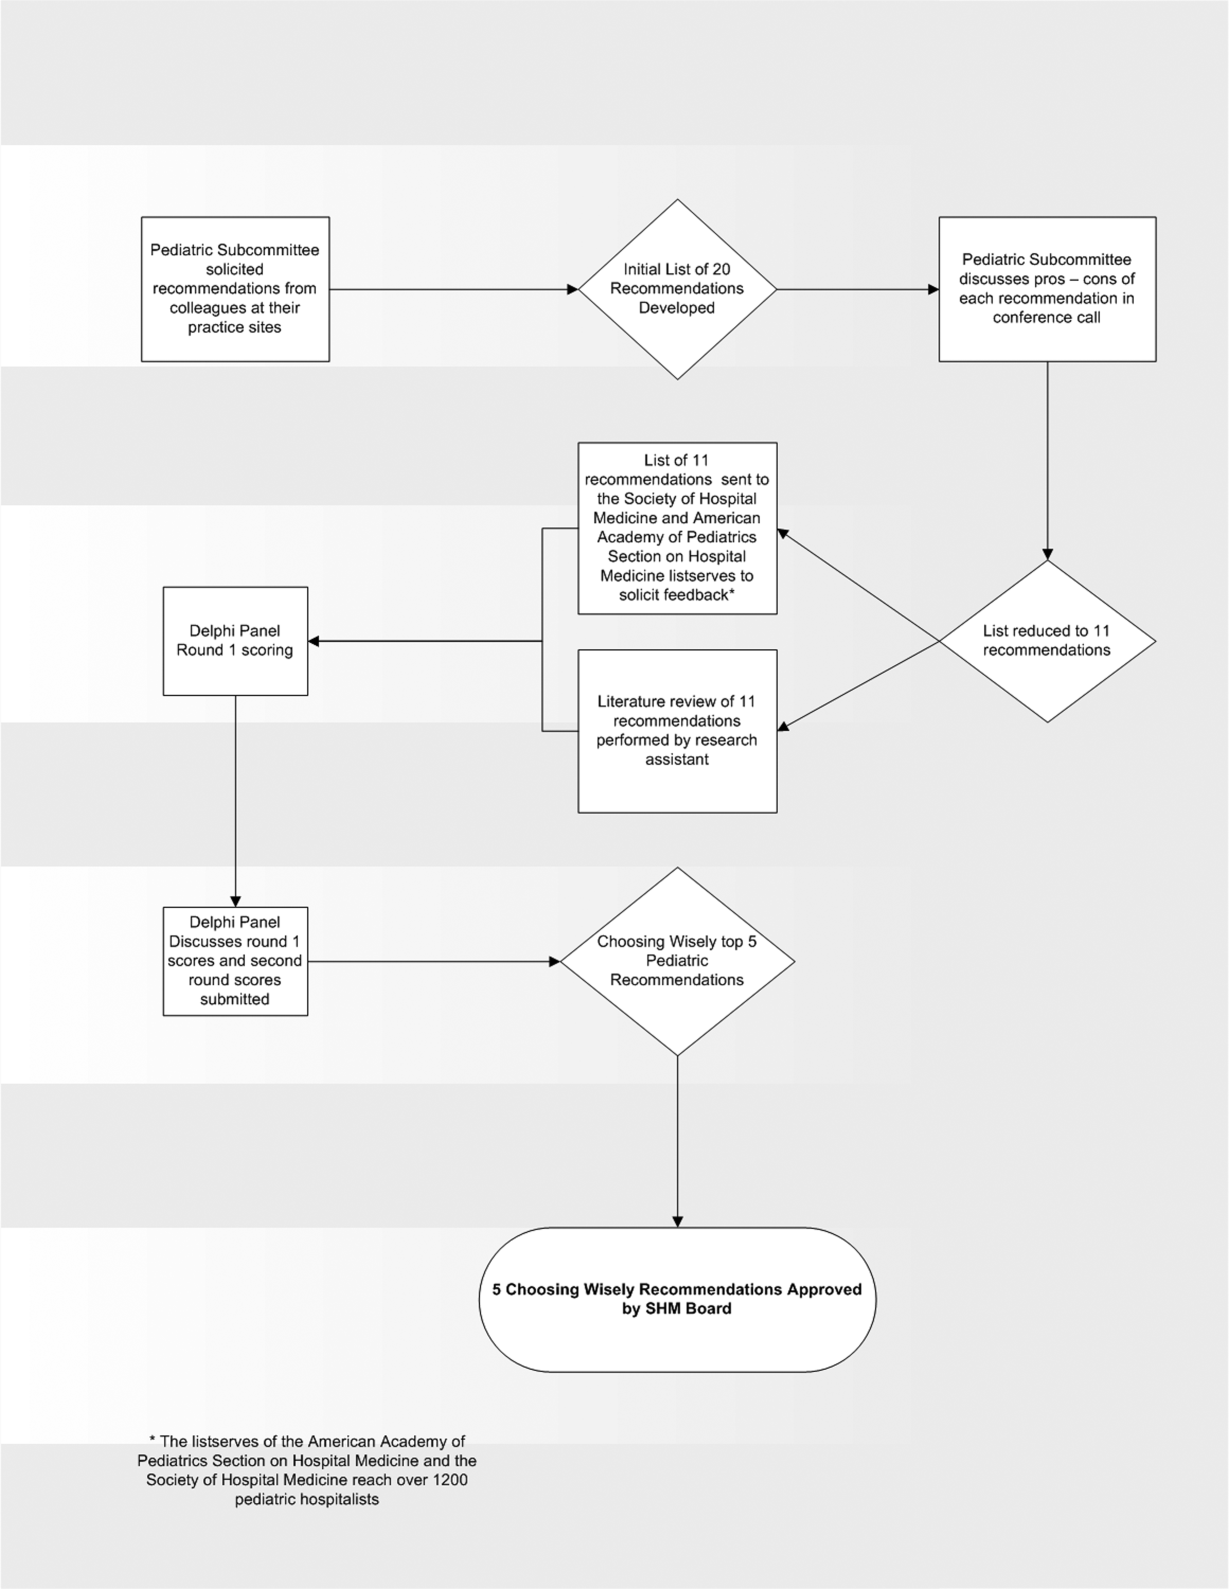
Literature Review
After the generation of the initial top 20 list, 2 reviewers conducted independent literature searches in PubMed, MEDLINE, and the Cochrane Library on the proposed topics. The reviewers also conducted generic Internet searches. Key search terms included pediatric asthma, bronchiolitis, chest radiograph, systemic corticosteroids, gastroesophageal reflux disease (GERD), infant, child, acid suppression therapy, continuous pulse oximetry, pneumonia, gastroenteritis, viral testing, blood culture, and soft tissue infections. To ensure that the reviewers included all studies relevant to the searches, they utilized broad terms. The search included all literature published through 2012, and nonEnglish language publications were included in the search. Studies selected and included in the review were based upon common criteria including whether the article discussed an evaluation of efficacy and/or utility of treatment, included a pediatric population in the guidelines or study, reviewed the harm associated with the administration of a particular test or treatment, and explored the cost associated with the test or treatment.
The Delphi Panel
Members of the workgroup formed a Delphi panel except for 1 member (R.Q.) who served as the nonvoting moderator. The members of the Delphi panel considered the results of the literature search for each recommendation along with the collated feedback from hospitalist listserves as described in Figure 1. Each panel member received a voting instrument with the candidate tests and treatments for the first round of Delphi voting. The panel utilized a modified Delphi method or the RAND Corporation (RAND)/University of California at Los Angeles (UCLA) appropriateness method as described in previous publications of quality indicator development in pediatrics.[7] Each panelist scored the candidate tests and treatments and forwarded the scores to the moderator. Subsequently, all the members of the Delphi panel met through a conference call to carry out the second round of voting. The deidentified collated results of the first round of Delphi voting were made available and discussed during the call. The moderator collated the final results, and the final 5 recommendations were those that had the highest score after the second round of Delphi voting.
Volume and Costs
During deliberations, the committee took into account the prevalence and cost rankings of our most common pediatric inpatient diagnoses. This was done using the Agency for Healthcare Research and Quality's (AHRQ) Healthcare Utilization Project (HCUP), specifically, the Kids' Inpatient Database (KID). HCUP includes the largest collection of longitudinal hospital care data in the United States, encompassing all‐payer discharge‐level information. We excluded normal newborn hospitalizations, and looked at the top 10 acute inpatient diagnoses in terms of both volume and aggregate costs.
RESULTS
The initial list of 20 candidate tests and treatments as well as the refined list of 11 recommendations can be found as electronic supplements to this publication (see Supporting Table 1 and Supporting Table 2 in the online version of this article). The format and language of the list of 11 recommendations were chosen to mesh with that typically used in the ABIM‐F Choosing Wisely campaign. During the Delphi panel, there was strong group consensus about combining items 1 and 2 (chest radiographs in asthma and bronchiolitis) into a single recommendation.
| Do not order chest radiographs in children with asthma or bronchiolitis. |
| Do not use bronchodilators in children with bronchiolitis. |
| Do not use systemic corticosteroids in children under 2 years of age with a lower respiratory tract infection. |
| Do not treat gastroesophageal reflux in infants routinely with acid suppression therapy. |
| Do not use continuous pulse oximetry routinely in children with acute respiratory illness unless they are on supplemental oxygen. |
The top 5 recommendations based on the result of the second round of Delphi scoring are shown in Table 1 and described below along with a detailed evidence summary.
Do not order chest radiographs in children with asthma or bronchiolitis.
The National Heart and Lung Institute's guidelines for the management of asthma, published in 1987, recommend against routinely obtaining chest radiographs in patients with asthma or asthma exacerbations.[8] Supporting this recommendation are several studies that show a low overall yield when obtaining chest radiographs for wheezing patients.[9, 10, 11] Most relevant, studies that evaluated the clinical utility of radiographs in patients with asthma have demonstrated that they influence clinical management in less than 2% of cases.[12] A quality improvement project aimed at decreasing the rate of chest radiographs obtained in patients with asthma demonstrated that close to 60% of patients admitted to the hospital had chest radiographs performed, and that significant overall reductions can be achieved (45.3%28.9%, P=0.0005) without impacting clinical outcomes negatively.[13]
Similarly, the Subcommittee on Diagnosis and Management of Bronchiolitis of the American Academy of Pediatrics recommends against routinely obtaining radiographs during the evaluation for bronchiolitis.[14] Studies assessing the utility of chest x‐rays in these children demonstrate an even lower incidence of abnormalities (0.75%) and indicate that, despite this low incidence, physicians are more likely to treat with antibiotics when radiographs are obtained.[15] There is also evidence that chest radiographs in patients with bronchiolitis are not useful in predicting severity of illness.[16] Furthermore, cost‐effective analyses have demonstrated that omitting chest radiographs in bronchiolitis is actually cost‐effective, without compromising diagnostic accuracy.[17] In a recently published national benchmarking inpatient collaborative, Ralston et al. demonstrated that the majority of patients admitted to the hospital with bronchiolitis have chest radiographs performed at a rate of 64% (interquartile range [IQR], 54%81%).[18]
In both bronchiolitis and asthma, the elimination of unnecessary radiographs has the potential to decrease costs, reduce radiation exposure, and minimize the overuse of antibiotics that often occurs secondary to false positive results.
Do not use bronchodilators in children with bronchiolitis.
Ralston showed that 70% (IQR, 59%83%) of admitted bronchiolitis patients received bronchodilators with an average of 7.9 doses per patient (IQR, 4.69.8). National guidelines for bronchiolitis suggest a very limited role of bronchodilators in patients with bronchiolitis.[14] The first meta‐analyses of studies related to the question of ‐agonist efficacy in bronchiolitis were published in the late 1990s, revealing minimal or no treatment effects.[19, 20] Since then, further research has solidified these findings, and fairly definitive statements can be made based on a recent comprehensive meta‐analysis.[21] The pooled data do not show any effect on hospitalization rates, hospital length of stay, or other inpatient outcomes in bronchiolitis. They do show a small change in clinical scores documented in the outpatient setting, though these scores have not correlated with any detectable difference in outcomes. Routine use of ‐agonists in the inpatient setting has no proven benefit, and given the large amount of consistent data, there is no compelling reason for further study of this therapy in the inpatient setting.
Epinephrine, a combined ‐ and ‐agonist, has been extensively evaluated in bronchiolitis as well. Like albuterol, epinephrine has been reported to have no effect on hospital length of stay in bronchiolitis.[22] The issue of admission rates after epinephrine is complicated by 1 very large study that combined epinephrine with dexamethasone and reported a decreased admission rate, though only at 7 days after therapy; however, this effect was nullified after adjustment for multiple comparisons.[23] When the end point is improvement of respiratory scores, epinephrine may perform better than albuterol in studies where they are directly compared; however, there is no evidence that repeated usage of epinephrine has any impact on any clinical outcome for inpatients.[24, 25]
Do not use systemic corticosteroids in children under 2 years of age with a lower respiratory tract infection
In their summary of evidence, the Subcommittee on Diagnosis and Management of Bronchiolitis of the American Academy of Pediatrics recommends against routinely using systemic corticosteroids for infants with bronchiolitis.[14] The previously reference bronchiolitis benchmarking study demonstrated that admitted patients received steroids at a rate of 21% (IQR, 14%26%). The poor efficacy of corticosteroids in children with bronchiolitis under 2 years of age is well demonstrated in the literature. A large, blinded, randomized, controlled study compared systemic oral corticosteroids to placebo in hospitalized children 10 months to 6 years of age with viral wheezing.[26] This study showed no benefit of corticosteroids over placebo in length of stay or parental report of symptoms 1 week later. In the study, a subanalysis of children with eczema and family history of asthma also demonstrated no benefit of systemic corticosteroids. Large systematic reviews further argue that there is no effect of corticosteroids on the likelihood of admission or length of stay in infants with bronchiolitis.[27, 28] One 4‐armed prospective study of children 6 weeks to 12 months of age found no efficacy of dexamethasone over placebo.[23] There was modest benefit of dexamethasone in conjunction with racemic epinephrine; however, this benefit disappeared after adjustment for multiple comparisons. Three smaller studies showing benefit of systemic corticosteroids, however, were highly problematic. They have included older children, were retrospective, or demonstrated inconsistent results.[29, 30] A smaller study showed benefit for children over 2 years of age, but none for children under 2 years of age.[31] Premature infants are at increased risk of asthma, which typically responds well to corticosteroids as these children get older. However, a retrospective study of premature infants under 2 years of age with bronchiolitis demonstrated no association between corticosteroid use and length of stay, even in the subset of premature infants responding to albuterol.[32]
Systemic corticosteroid use in children is not harmless. Children under 2 years of age are especially vulnerable to the decreased growth velocity seen as a side effect of systemic corticosteroids.[33] Corticosteroids may also negatively impact the course of infectious illness. For instance, in children hospitalized with pneumonia but not receiving ‐agonists (ie, patients who are unlikely to have asthma), length of stay is prolonged and readmission is higher in those who receive corticosteroids.[34]
Do not treat gastroesophageal reflux in infants routinely with acid suppression therapy.
From 2000 to 2005, the incidence of infants diagnosed with gastroeshopaheal reflux (GER) tripled (3.4%12.3%), and the use of proton pump inhibitors (PPIs) doubled (31.5%62.6%).[35] Patients diagnosed with GER and treated with antireflux medication incurred 1.8 times higher healthcare costs in 1 study compared to healthy controls.[36] Though common, the use of acid suppressive medications in infants lacks evidence for efficacy in the majority of the clinical scenarios in which they are prescribed.[37, 38] PPIs have failed to outperform placebo for typical infant reflux, which is generally developmental and not pathologic.[39, 40] Furthermore, prompted by findings in adults, multiple pediatric investigators have now catalogued the potential risks associated with acid blockade in children in multiple clinical settings. Specifically, increased risk of pneumonia has been documented in inpatients and outpatients, and increased risk of necrotizing enterocolitis and other serious infections have been documented in intensive care unit settings.[41] In the absence of data supporting efficacy and given the emerging data on risk, empiric acid suppression in infants with reflux is wasteful and potentially harmful.
Do not use continuous pulse oximetry routinely in children with acute respiratory illness unless they are on supplemental oxygen.
Pulse oximetry use has become widespread in the management of infants with bronchiolitis and likely accounts for the dramatic increase in bronchiolitis hospitalization rates in recent years.[14, 42, 43, 44, 45, 46, 47] Despite this increase in hospitalization rate, there was no change in mortality from bronchiolitis between 1979 and 1997.[48] The continuous monitoring of oxygen saturations in hospitalized infants with bronchiolitis may lead to overdiagnosis of hypoxemia and subsequent oxygen use that is of no apparent benefit to the child. Schroeder et al. demonstrated that 26% of a sample of infants hospitalized with bronchiolitis had a prolonged length of stay because of a perceived need for oxygen based on pulse oximetry readings.[43] Unger and Cunningham showed that the need for oxygen was the final determinant of length of stay in 58% of cases, and Cunningham and Murray suggested that using an oxygen saturation cutoff of 94% instead of 90% might increase the length of stay by 22 hours.[44, 49]
It has been previously shown that hypoxia is normative in infants. Healthy infants experience multiple episodes of SpO2 90% while sleeping.[50] This finding strengthens the notion that detection of low saturations in infants convalescing from bronchiolitis may simply reflect overdiagnosis. Among children with chronic severe asthma, who presumably have experienced episodes of hypoxia throughout childhood, there is no difference in school performance compared to healthy controls.[51]
The practice parameter on bronchiolitis from the American Academy of Pediatrics states: as the child's clinical course improves, continuous measurement of SpO2 is not routinely needed, which is a recommendation based on expert consensus.[14] There is at least one ongoing randomized trial comparing the use of continuous versus intermittent pulse oximetry in hospitalized infants with bronchiolitis who are weaned off oxygen (
DISCUSSION
Berwick and Hackbarth define overtreatment as: waste that comes from subjecting patients to care that, according to sound science and the patients' own preferences, cannot possibly help themcare rooted in outmoded habits, supply‐driven behaviors, and ignoring science.[1] With this project, we tried to capture common clinical sources of waste in the inpatient pediatric setting. This is an inherently difficult project because of the absence of solid evidence to inform every decision point in medicine. Although there is always room for improvement in our evidence base, our group intentionally gravitated to areas where the evidence was robust.
The primary strength of this work is the use of the RAND/UCLA appropriateness method or modified Delphi method. Several publications have validated this methodology as a sound strategy to assess quality indicators and issues related to overuse.[7, 53] To our knowledge, we are the first group to report the use of this methodology to develop a list such as the list reported here.
There were some challenges inherent to this project that can be considered limitations of the work. One perceived limitation of our list is the heavy concentration on respiratory diagnoses, especially bronchiolitis and asthma. We do not feel this is a genuine limitation, as the recommendations were partly driven by volume and costs as assessed by the KID database. Among the top 10 acute inpatient diagnoses in pediatrics, respiratory diagnoses are the most common, including bronchiolitis, pneumonia, and asthma. Pneumonia or bronchiolitis has been the most common medical diagnosis in inpatient pediatrics for the past decade, and both are always in the top 10 for costs as well.[54] Thus, the impact of decreasing overuse for these conditions will be highly significant from a simple volume standpoint.
The primary limitation of this work is the lack of implementation strategies. Although the Choosing Wisely campaign has plans for dissemination of the lists, compliance with the recommendations may be suboptimal. Although the development process followed an accepted methodology, shortcomings include the lack of wide, local, multidisciplinary (including parents or caretakers) consultation. Other barriers to compliance with these recommendations exist. Despite evidence that bronchiolitis is a benign self‐limited disease that does not respond to bronchodilators and steroids, the drive to identify and correct all abnormalities, such as wheezing or low oxygen saturation in a nontoxic infant with bronchiolitis, seems to trump the obligation to do no harm in daily practice.[55] This behavior may result from pressure by patients, families, nurses, or peers and is deeply embedded in our medical culture, where action is preferred to inaction without full knowledge or consideration of risks. Doctors and nurses have become attached to the pulse oximeter, believing somehow that the number displayed is less subjective and holds more predictive value than careful evaluation of the patient's respiratory status. Other pressures, such as direct to consumer marketing have made acid reflux a household term that is easily treated with over‐the‐counter medications. Considerations of the care continuum will also serve as barriers. Chest x‐rays, for example, are frequently obtained prior to admission to the hospital before the hospitalist is involved.
To overcome these limitations, the study of individual and organizational adoption of innovation might be relevant. Though it is complex and often more descriptive than proscriptive, a few salient features have emerged. Champions and opinion leaders make a difference, local culture is dominant, social networking is important, simple innovations that can be trialed on a small scale are adaptable by the user and have observable benefits, are more likely to be adopted.[56] Fortunately, the top 5 list meets many of these criteria, but also faces the daunting challenges of inertia, lack of financial incentive, inability to break with old habits, and fear of lawsuits and perceived patient/parent dissatisfaction. Ongoing evaluation, feedback, and audit will be necessary to detect and sustain change.
CONCLUSION
We have identified 5 tests or therapies overused in inpatient general pediatrics. One goal of the Choosing Wisely campaign is to begin to change social norms related to physician behavior. We hope by asking clinicians to consider doing less for common conditions in inpatient pediatrics, that they will increasingly consider the known and unanticipated risks of any medical interventions they choose to use. Finally, we would like to encourage all pediatricians to embrace the idea of good stewardship and join us in prioritizing and addressing waste and overuse as important patient safety issues as well as threats to the sustainability of our healthcare system.
Acknowledgments
The authors thank Drs. Doug Carlson, James O'Callaghan, and Karen Smith from the Society of Hospital Medicine's Pediatric and Quality and Safety Committees for their support of this effort.
Disclosure: Nothing to report.
- , . Eliminating waste in US health care. JAMA. 2012;307:1513–1516.
- , , . Safely doing less: a missing component of the patient safety dialogue. Pediatrics. 2011;128:e1596–e1597.
- , , . To Err Is Human: Building a Safer Health System. Washington, DC: National Academy Press; 2000.
- , , , , , . Temporal trends in rates of patient harm resulting from medical care. N Engl J Med. 2010;363:2124–2134.
- . Screening for prostate cancer: U.S. Preventive Services Task Force recommendation statement. Ann Intern Med. 2012;157:120–134.
- , . Choosing wisely: helping physicians and patients make smart decisions about their care. JAMA. 2012;307:1801–1802.
- , , , et al. The quality of ambulatory care delivered to children in the United States. N Engl J Med. 2007;357:1515–1523.
- National Asthma Education and Prevention Program. Expert panel report 3 (EPR‐3): guidelines for the diagnosis and management of asthma—summary report 2007. J Allergy Clin Immunol. 2007;120:S94–S138.
- , . The chest x‐ray and childhood acute asthma. Aust Clin Rev. 1993;13:153–156.
- , , , . Clinical factors associated with focal infiltrates in wheezing infants and toddlers. Clin Pediatr (Phila). 2000;39:387–393.
- , , , . Chest radiographs in the pediatric emergency department for children < or = 18 months of age with wheezing. Clin Pediatr (Phila). 1999;38:395–399.
- , , , , , . Clinical predictors of pneumonia among children with wheezing. Pediatrics. 2009;124:e29–e36.
- , . Reduce the rads: a quality assurance project on reducing unnecessary chest X‐rays in children with asthma. J Paediatr Child Health. 2005;41:107–111.
- American Academy of Pediatrics Subcommittee on Diagnosis and Management of Bronchiolitis. Diagnosis and management of bronchiolitis. Pediatrics. 2006;118:1774–1793.
- , , , et al. Evaluation of the utility of radiography in acute bronchiolitis. J Pediatr. 2007;150:429–433.
- , , , et al. Incidence and predisposing factors for severe disease in previously healthy term infants experiencing their first episode of bronchiolitis. Acta Paediatr. 2011;100:e17–e23.
- , , , et al. A cost effectiveness analysis of omitting radiography in diagnosis of acute bronchiolitis. Pediatr Pulmonol. 2009;44:122–127.
- , , , et al. Decreasing unnecessary utilization in acute bronchiolitis care: results from the value in inpatient pediatrics network. J Hosp Med. 2013;8:25–30.
- , , , . Efficacy of bronchodilator therapy in bronchiolitis. A meta‐analysis. Arch Pediatr Adolesc Med. 1996;150:1166–1172.
- , . Efficacy of beta2‐agonists in bronchiolitis: a reappraisal and meta‐analysis. Pediatrics. 1997;100:233–239.
- , . Bronchodilators for bronchiolitis. Cochrane Database Syst Rev. 2010;(12):CD001266.
- , , , et al. Epinephrine for bronchiolitis. Cochrane Database Syst Rev. 2011;(6):CD003123.
- , , , et al. Epinephrine and dexamethasone in children with bronchiolitis. N Engl J Med. 2009;360:2079–2089.
- , , , et al. A multicenter, randomized, double‐blind, controlled trial of nebulized epinephrine in infants with acute bronchiolitis. N Engl J Med. 2003;349:27–35.
- , , , . A randomized, controlled trial of the effectiveness of nebulized therapy with epinephrine compared with albuterol and saline in infants hospitalized for acute viral bronchiolitis. J Pediatr. 2002;141:818–824.
- , , , et al. Oral prednisolone for preschool children with acute virus‐induced wheezing. N Engl J Med. 2009;360:329–338.
- , , , et al. Glucocorticoids for acute viral bronchiolitis in infants and young children. Cochrane Database Syst Rev. 2010;(10):CD004878.
- , , , , . Systemic corticosteroids in infant bronchiolitis: a meta‐analysis. Pediatrics. 2000;105:E44.
- , , , . Controlled trial of oral prednisone in the emergency department treatment of children with acute asthma. Pediatrics. 1993;92:513–518.
- , , . Methylprednisolone therapy for acute asthma in infants and toddlers: a controlled clinical trial. Pediatrics. 1990;86:350–356.
- , , , , . Effect of a single oral dose of prednisolone in acute childhood asthma. Lancet. 1987;1:879–882.
- , , , , . The clinical management of preterm infants with bronchiolitis. Hosp Pediatr. 2013;3:244–250.
- , . Glucocorticoids and growth in asthmatic children. Pediatr Allergy Immunol. 1995;6:145–154.
- , , , , , . Adjunct corticosteroids in children hospitalized with community‐acquired pneumonia. Pediatrics. 2011;127:e255–e263.
- , , , , , . Pediatric gastroesophageal reflux disease and acid‐related conditions: trends in incidence of diagnosis and acid suppression therapy. J Med Econ. 2009;12:348–355.
- , , , , , . Healthcare costs of GERD and acid‐related conditions in pediatric patients, with comparison between histamine‐2 receptor antagonists and proton pump inhibitors. Curr Med Res Opin. 2009;25:2703–2709.
- , , , . Are we overprescribing antireflux medications for infants with regurgitation? Pediatrics. 2007;120:946–949.
- , , , , . Proton pump inhibitor utilization patterns in infants. J Pediatr Gastroenterol Nutr. 2007;45:421–427.
- , , , , , . Efficacy of proton‐pump inhibitors in children with gastroesophageal reflux disease: a systematic review. Pediatrics. 2011;127:925–935.
- . Effectiveness and safety of proton pump inhibitors in infantile gastroesophageal reflux disease. Ann Pharmacother. 2010;44:572–576.
- . Are there risks associated with empric acid suppression treatment of infants and children suspected of having gastroesophageal reflux disease? Hosp Pediatr. 2013;3:16–23.
- , , , . Bronchiolitis management preferences and the influence of pulse oximetry and respiratory rate on the decision to admit. Pediatrics. 2003;111:e45–e51.
- , , , . Impact of pulse oximetry and oxygen therapy on length of stay in bronchiolitis hospitalizations. Arch Pediatr Adolesc Med. 2004;158:527–530.
- , . Effect of oxygen supplementation on length of stay for infants hospitalized with acute viral bronchiolitis. Pediatrics. 2008;121:470–475.
- . Oxygen therapy for bronchiolitis. Pediatrics. 2007;120:686–687; author reply 687–688.
- , , , , , . Bronchiolitis‐associated hospitalizations among US children, 1980–1996. JAMA. 1999;282:1440–1446.
- , . Bronchiolitis: recent evidence on diagnosis and management. Pediatrics. 2010;125:342–349.
- , , , , . Bronchiolitis‐associated mortality and estimates of respiratory syncytial virus‐associated deaths among US children, 1979–1997. J Infect Dis. 2001;183:16–22.
- , . Observational study of two oxygen saturation targets for discharge in bronchiolitis. Arch Dis Child. 2012;97:361–363.
- , , , et al. Longitudinal assessment of hemoglobin oxygen saturation in preterm and term infants in the first six months of life. J Pediatr. 2011;159:377–383.e1.
- , . The impact of severe asthma on schoolchildren. J Asthma. 1999;36:409–417.
- , . Multi‐center, randomized trial of pulse oximetry monitoring strategies for children hospitalized for bronchiolitis. Abstract presented at: ID Week 2012; October 2012; San Diego, CA.
- , , , . The appropriateness method has acceptable reliability and validity for assessing overuse and underuse of surgical procedures. J Clin Epidemiol. 2012;65:1133–1143.
- Agency for Healthcare Research and Quality. HCUPnet. Kids inpatient database 2009. Available at: http://hcupnet.ahrq.gov. Accessed November 6, 2012.
- , , . Too little? Too much? Primary care physicians' views on US health care: a brief report. Arch Intern Med. 2011;171:1582–1585.
- . How to implement change in clinical practice. Paediatr Respir Rev. 2003;4:340–346.
Overuse in medicine is a significant and under‐recognized problem. Don Berwick estimated that waste accounts for at least 20% of healthcare expenditures in the United States, with overtreatment as one of the largest categories.[1] A commentary by Schroeder et al. challenged pediatricians to incorporate this knowledge into our own patient safety and quality movement.[2] Recently published data suggest that we are far from achieving the patient safety goals set forth in the Institute of Medicine's landmark To Err is Human[3] report, despite more than a decade of national, local, and regional efforts.[4] One way to reduce waste and improve patient safety is to eliminate practices of unproven benefit. Therapies or tests that may initially seem promising are often proven to be not only unhelpful but actually harmful. The recommendation of the US Preventive Services Task Force against routine screening for prostate specific antigen is an example of how a common test initially thought of as lifesaving actually increases harm.[5]
The American Board of Internal Medicine Foundation (ABIM‐F) recently announced the Choosing Wisely campaign. Through this campaign the Foundation encourages physicians, patients and other healthcare stakeholders to think and talk about medical tests and procedures that may be unnecessary.[6] The primary output of this challenge is the development of a list of 5 tests and or therapies that physicians and patients should question. The ABIM‐F approached different medical societies to develop these lists within their own specialties. The Society of Hospital Medicine (SHM) joined the Choosing Wisely campaign in April 2012, and agreed to develop a list of 5 therapies and tests for adult hospital medicine and pediatric hospital medicine. Here we present the contribution of the pediatric workgroup detailing the methodology and process for developing the list, as well as summarizing the evidence supporting each recommendation.
METHODS
In the spring of 2012, the pediatric committee of the SHM convened a workgroup of pediatric hospitalists to develop a top 5 list for the field. This workgroup was composed of experienced pediatric hospitalists representing diverse geographic locations of the United States and a mix of academic and nonacademic practice settings. The group, consisting of 4 women and 9 men, began by proposing candidate recommendations after discussion with colleagues at their different practice sites. The group was charged to maintain a focus on overuse practices that had a strong basis in evidence, were frequently encountered at their practice sites, and achieved significant consensus among their colleagues. Figure 1 shows the process map describing the method for the development of the pediatric recommendations. All workgroup participants were queried as to conflict of interest relevant to this work and none were identified.
Literature Review
After the generation of the initial top 20 list, 2 reviewers conducted independent literature searches in PubMed, MEDLINE, and the Cochrane Library on the proposed topics. The reviewers also conducted generic Internet searches. Key search terms included pediatric asthma, bronchiolitis, chest radiograph, systemic corticosteroids, gastroesophageal reflux disease (GERD), infant, child, acid suppression therapy, continuous pulse oximetry, pneumonia, gastroenteritis, viral testing, blood culture, and soft tissue infections. To ensure that the reviewers included all studies relevant to the searches, they utilized broad terms. The search included all literature published through 2012, and nonEnglish language publications were included in the search. Studies selected and included in the review were based upon common criteria including whether the article discussed an evaluation of efficacy and/or utility of treatment, included a pediatric population in the guidelines or study, reviewed the harm associated with the administration of a particular test or treatment, and explored the cost associated with the test or treatment.
The Delphi Panel
Members of the workgroup formed a Delphi panel except for 1 member (R.Q.) who served as the nonvoting moderator. The members of the Delphi panel considered the results of the literature search for each recommendation along with the collated feedback from hospitalist listserves as described in Figure 1. Each panel member received a voting instrument with the candidate tests and treatments for the first round of Delphi voting. The panel utilized a modified Delphi method or the RAND Corporation (RAND)/University of California at Los Angeles (UCLA) appropriateness method as described in previous publications of quality indicator development in pediatrics.[7] Each panelist scored the candidate tests and treatments and forwarded the scores to the moderator. Subsequently, all the members of the Delphi panel met through a conference call to carry out the second round of voting. The deidentified collated results of the first round of Delphi voting were made available and discussed during the call. The moderator collated the final results, and the final 5 recommendations were those that had the highest score after the second round of Delphi voting.
Volume and Costs
During deliberations, the committee took into account the prevalence and cost rankings of our most common pediatric inpatient diagnoses. This was done using the Agency for Healthcare Research and Quality's (AHRQ) Healthcare Utilization Project (HCUP), specifically, the Kids' Inpatient Database (KID). HCUP includes the largest collection of longitudinal hospital care data in the United States, encompassing all‐payer discharge‐level information. We excluded normal newborn hospitalizations, and looked at the top 10 acute inpatient diagnoses in terms of both volume and aggregate costs.
RESULTS
The initial list of 20 candidate tests and treatments as well as the refined list of 11 recommendations can be found as electronic supplements to this publication (see Supporting Table 1 and Supporting Table 2 in the online version of this article). The format and language of the list of 11 recommendations were chosen to mesh with that typically used in the ABIM‐F Choosing Wisely campaign. During the Delphi panel, there was strong group consensus about combining items 1 and 2 (chest radiographs in asthma and bronchiolitis) into a single recommendation.
| Do not order chest radiographs in children with asthma or bronchiolitis. |
| Do not use bronchodilators in children with bronchiolitis. |
| Do not use systemic corticosteroids in children under 2 years of age with a lower respiratory tract infection. |
| Do not treat gastroesophageal reflux in infants routinely with acid suppression therapy. |
| Do not use continuous pulse oximetry routinely in children with acute respiratory illness unless they are on supplemental oxygen. |
The top 5 recommendations based on the result of the second round of Delphi scoring are shown in Table 1 and described below along with a detailed evidence summary.
Do not order chest radiographs in children with asthma or bronchiolitis.
The National Heart and Lung Institute's guidelines for the management of asthma, published in 1987, recommend against routinely obtaining chest radiographs in patients with asthma or asthma exacerbations.[8] Supporting this recommendation are several studies that show a low overall yield when obtaining chest radiographs for wheezing patients.[9, 10, 11] Most relevant, studies that evaluated the clinical utility of radiographs in patients with asthma have demonstrated that they influence clinical management in less than 2% of cases.[12] A quality improvement project aimed at decreasing the rate of chest radiographs obtained in patients with asthma demonstrated that close to 60% of patients admitted to the hospital had chest radiographs performed, and that significant overall reductions can be achieved (45.3%28.9%, P=0.0005) without impacting clinical outcomes negatively.[13]
Similarly, the Subcommittee on Diagnosis and Management of Bronchiolitis of the American Academy of Pediatrics recommends against routinely obtaining radiographs during the evaluation for bronchiolitis.[14] Studies assessing the utility of chest x‐rays in these children demonstrate an even lower incidence of abnormalities (0.75%) and indicate that, despite this low incidence, physicians are more likely to treat with antibiotics when radiographs are obtained.[15] There is also evidence that chest radiographs in patients with bronchiolitis are not useful in predicting severity of illness.[16] Furthermore, cost‐effective analyses have demonstrated that omitting chest radiographs in bronchiolitis is actually cost‐effective, without compromising diagnostic accuracy.[17] In a recently published national benchmarking inpatient collaborative, Ralston et al. demonstrated that the majority of patients admitted to the hospital with bronchiolitis have chest radiographs performed at a rate of 64% (interquartile range [IQR], 54%81%).[18]
In both bronchiolitis and asthma, the elimination of unnecessary radiographs has the potential to decrease costs, reduce radiation exposure, and minimize the overuse of antibiotics that often occurs secondary to false positive results.
Do not use bronchodilators in children with bronchiolitis.
Ralston showed that 70% (IQR, 59%83%) of admitted bronchiolitis patients received bronchodilators with an average of 7.9 doses per patient (IQR, 4.69.8). National guidelines for bronchiolitis suggest a very limited role of bronchodilators in patients with bronchiolitis.[14] The first meta‐analyses of studies related to the question of ‐agonist efficacy in bronchiolitis were published in the late 1990s, revealing minimal or no treatment effects.[19, 20] Since then, further research has solidified these findings, and fairly definitive statements can be made based on a recent comprehensive meta‐analysis.[21] The pooled data do not show any effect on hospitalization rates, hospital length of stay, or other inpatient outcomes in bronchiolitis. They do show a small change in clinical scores documented in the outpatient setting, though these scores have not correlated with any detectable difference in outcomes. Routine use of ‐agonists in the inpatient setting has no proven benefit, and given the large amount of consistent data, there is no compelling reason for further study of this therapy in the inpatient setting.
Epinephrine, a combined ‐ and ‐agonist, has been extensively evaluated in bronchiolitis as well. Like albuterol, epinephrine has been reported to have no effect on hospital length of stay in bronchiolitis.[22] The issue of admission rates after epinephrine is complicated by 1 very large study that combined epinephrine with dexamethasone and reported a decreased admission rate, though only at 7 days after therapy; however, this effect was nullified after adjustment for multiple comparisons.[23] When the end point is improvement of respiratory scores, epinephrine may perform better than albuterol in studies where they are directly compared; however, there is no evidence that repeated usage of epinephrine has any impact on any clinical outcome for inpatients.[24, 25]
Do not use systemic corticosteroids in children under 2 years of age with a lower respiratory tract infection
In their summary of evidence, the Subcommittee on Diagnosis and Management of Bronchiolitis of the American Academy of Pediatrics recommends against routinely using systemic corticosteroids for infants with bronchiolitis.[14] The previously reference bronchiolitis benchmarking study demonstrated that admitted patients received steroids at a rate of 21% (IQR, 14%26%). The poor efficacy of corticosteroids in children with bronchiolitis under 2 years of age is well demonstrated in the literature. A large, blinded, randomized, controlled study compared systemic oral corticosteroids to placebo in hospitalized children 10 months to 6 years of age with viral wheezing.[26] This study showed no benefit of corticosteroids over placebo in length of stay or parental report of symptoms 1 week later. In the study, a subanalysis of children with eczema and family history of asthma also demonstrated no benefit of systemic corticosteroids. Large systematic reviews further argue that there is no effect of corticosteroids on the likelihood of admission or length of stay in infants with bronchiolitis.[27, 28] One 4‐armed prospective study of children 6 weeks to 12 months of age found no efficacy of dexamethasone over placebo.[23] There was modest benefit of dexamethasone in conjunction with racemic epinephrine; however, this benefit disappeared after adjustment for multiple comparisons. Three smaller studies showing benefit of systemic corticosteroids, however, were highly problematic. They have included older children, were retrospective, or demonstrated inconsistent results.[29, 30] A smaller study showed benefit for children over 2 years of age, but none for children under 2 years of age.[31] Premature infants are at increased risk of asthma, which typically responds well to corticosteroids as these children get older. However, a retrospective study of premature infants under 2 years of age with bronchiolitis demonstrated no association between corticosteroid use and length of stay, even in the subset of premature infants responding to albuterol.[32]
Systemic corticosteroid use in children is not harmless. Children under 2 years of age are especially vulnerable to the decreased growth velocity seen as a side effect of systemic corticosteroids.[33] Corticosteroids may also negatively impact the course of infectious illness. For instance, in children hospitalized with pneumonia but not receiving ‐agonists (ie, patients who are unlikely to have asthma), length of stay is prolonged and readmission is higher in those who receive corticosteroids.[34]
Do not treat gastroesophageal reflux in infants routinely with acid suppression therapy.
From 2000 to 2005, the incidence of infants diagnosed with gastroeshopaheal reflux (GER) tripled (3.4%12.3%), and the use of proton pump inhibitors (PPIs) doubled (31.5%62.6%).[35] Patients diagnosed with GER and treated with antireflux medication incurred 1.8 times higher healthcare costs in 1 study compared to healthy controls.[36] Though common, the use of acid suppressive medications in infants lacks evidence for efficacy in the majority of the clinical scenarios in which they are prescribed.[37, 38] PPIs have failed to outperform placebo for typical infant reflux, which is generally developmental and not pathologic.[39, 40] Furthermore, prompted by findings in adults, multiple pediatric investigators have now catalogued the potential risks associated with acid blockade in children in multiple clinical settings. Specifically, increased risk of pneumonia has been documented in inpatients and outpatients, and increased risk of necrotizing enterocolitis and other serious infections have been documented in intensive care unit settings.[41] In the absence of data supporting efficacy and given the emerging data on risk, empiric acid suppression in infants with reflux is wasteful and potentially harmful.
Do not use continuous pulse oximetry routinely in children with acute respiratory illness unless they are on supplemental oxygen.
Pulse oximetry use has become widespread in the management of infants with bronchiolitis and likely accounts for the dramatic increase in bronchiolitis hospitalization rates in recent years.[14, 42, 43, 44, 45, 46, 47] Despite this increase in hospitalization rate, there was no change in mortality from bronchiolitis between 1979 and 1997.[48] The continuous monitoring of oxygen saturations in hospitalized infants with bronchiolitis may lead to overdiagnosis of hypoxemia and subsequent oxygen use that is of no apparent benefit to the child. Schroeder et al. demonstrated that 26% of a sample of infants hospitalized with bronchiolitis had a prolonged length of stay because of a perceived need for oxygen based on pulse oximetry readings.[43] Unger and Cunningham showed that the need for oxygen was the final determinant of length of stay in 58% of cases, and Cunningham and Murray suggested that using an oxygen saturation cutoff of 94% instead of 90% might increase the length of stay by 22 hours.[44, 49]
It has been previously shown that hypoxia is normative in infants. Healthy infants experience multiple episodes of SpO2 90% while sleeping.[50] This finding strengthens the notion that detection of low saturations in infants convalescing from bronchiolitis may simply reflect overdiagnosis. Among children with chronic severe asthma, who presumably have experienced episodes of hypoxia throughout childhood, there is no difference in school performance compared to healthy controls.[51]
The practice parameter on bronchiolitis from the American Academy of Pediatrics states: as the child's clinical course improves, continuous measurement of SpO2 is not routinely needed, which is a recommendation based on expert consensus.[14] There is at least one ongoing randomized trial comparing the use of continuous versus intermittent pulse oximetry in hospitalized infants with bronchiolitis who are weaned off oxygen (
DISCUSSION
Berwick and Hackbarth define overtreatment as: waste that comes from subjecting patients to care that, according to sound science and the patients' own preferences, cannot possibly help themcare rooted in outmoded habits, supply‐driven behaviors, and ignoring science.[1] With this project, we tried to capture common clinical sources of waste in the inpatient pediatric setting. This is an inherently difficult project because of the absence of solid evidence to inform every decision point in medicine. Although there is always room for improvement in our evidence base, our group intentionally gravitated to areas where the evidence was robust.
The primary strength of this work is the use of the RAND/UCLA appropriateness method or modified Delphi method. Several publications have validated this methodology as a sound strategy to assess quality indicators and issues related to overuse.[7, 53] To our knowledge, we are the first group to report the use of this methodology to develop a list such as the list reported here.
There were some challenges inherent to this project that can be considered limitations of the work. One perceived limitation of our list is the heavy concentration on respiratory diagnoses, especially bronchiolitis and asthma. We do not feel this is a genuine limitation, as the recommendations were partly driven by volume and costs as assessed by the KID database. Among the top 10 acute inpatient diagnoses in pediatrics, respiratory diagnoses are the most common, including bronchiolitis, pneumonia, and asthma. Pneumonia or bronchiolitis has been the most common medical diagnosis in inpatient pediatrics for the past decade, and both are always in the top 10 for costs as well.[54] Thus, the impact of decreasing overuse for these conditions will be highly significant from a simple volume standpoint.
The primary limitation of this work is the lack of implementation strategies. Although the Choosing Wisely campaign has plans for dissemination of the lists, compliance with the recommendations may be suboptimal. Although the development process followed an accepted methodology, shortcomings include the lack of wide, local, multidisciplinary (including parents or caretakers) consultation. Other barriers to compliance with these recommendations exist. Despite evidence that bronchiolitis is a benign self‐limited disease that does not respond to bronchodilators and steroids, the drive to identify and correct all abnormalities, such as wheezing or low oxygen saturation in a nontoxic infant with bronchiolitis, seems to trump the obligation to do no harm in daily practice.[55] This behavior may result from pressure by patients, families, nurses, or peers and is deeply embedded in our medical culture, where action is preferred to inaction without full knowledge or consideration of risks. Doctors and nurses have become attached to the pulse oximeter, believing somehow that the number displayed is less subjective and holds more predictive value than careful evaluation of the patient's respiratory status. Other pressures, such as direct to consumer marketing have made acid reflux a household term that is easily treated with over‐the‐counter medications. Considerations of the care continuum will also serve as barriers. Chest x‐rays, for example, are frequently obtained prior to admission to the hospital before the hospitalist is involved.
To overcome these limitations, the study of individual and organizational adoption of innovation might be relevant. Though it is complex and often more descriptive than proscriptive, a few salient features have emerged. Champions and opinion leaders make a difference, local culture is dominant, social networking is important, simple innovations that can be trialed on a small scale are adaptable by the user and have observable benefits, are more likely to be adopted.[56] Fortunately, the top 5 list meets many of these criteria, but also faces the daunting challenges of inertia, lack of financial incentive, inability to break with old habits, and fear of lawsuits and perceived patient/parent dissatisfaction. Ongoing evaluation, feedback, and audit will be necessary to detect and sustain change.
CONCLUSION
We have identified 5 tests or therapies overused in inpatient general pediatrics. One goal of the Choosing Wisely campaign is to begin to change social norms related to physician behavior. We hope by asking clinicians to consider doing less for common conditions in inpatient pediatrics, that they will increasingly consider the known and unanticipated risks of any medical interventions they choose to use. Finally, we would like to encourage all pediatricians to embrace the idea of good stewardship and join us in prioritizing and addressing waste and overuse as important patient safety issues as well as threats to the sustainability of our healthcare system.
Acknowledgments
The authors thank Drs. Doug Carlson, James O'Callaghan, and Karen Smith from the Society of Hospital Medicine's Pediatric and Quality and Safety Committees for their support of this effort.
Disclosure: Nothing to report.
- , . Eliminating waste in US health care. JAMA. 2012;307:1513–1516.
- , , . Safely doing less: a missing component of the patient safety dialogue. Pediatrics. 2011;128:e1596–e1597.
- , , . To Err Is Human: Building a Safer Health System. Washington, DC: National Academy Press; 2000.
- , , , , , . Temporal trends in rates of patient harm resulting from medical care. N Engl J Med. 2010;363:2124–2134.
- . Screening for prostate cancer: U.S. Preventive Services Task Force recommendation statement. Ann Intern Med. 2012;157:120–134.
- , . Choosing wisely: helping physicians and patients make smart decisions about their care. JAMA. 2012;307:1801–1802.
- , , , et al. The quality of ambulatory care delivered to children in the United States. N Engl J Med. 2007;357:1515–1523.
- National Asthma Education and Prevention Program. Expert panel report 3 (EPR‐3): guidelines for the diagnosis and management of asthma—summary report 2007. J Allergy Clin Immunol. 2007;120:S94–S138.
- , . The chest x‐ray and childhood acute asthma. Aust Clin Rev. 1993;13:153–156.
- , , , . Clinical factors associated with focal infiltrates in wheezing infants and toddlers. Clin Pediatr (Phila). 2000;39:387–393.
- , , , . Chest radiographs in the pediatric emergency department for children < or = 18 months of age with wheezing. Clin Pediatr (Phila). 1999;38:395–399.
- , , , , , . Clinical predictors of pneumonia among children with wheezing. Pediatrics. 2009;124:e29–e36.
- , . Reduce the rads: a quality assurance project on reducing unnecessary chest X‐rays in children with asthma. J Paediatr Child Health. 2005;41:107–111.
- American Academy of Pediatrics Subcommittee on Diagnosis and Management of Bronchiolitis. Diagnosis and management of bronchiolitis. Pediatrics. 2006;118:1774–1793.
- , , , et al. Evaluation of the utility of radiography in acute bronchiolitis. J Pediatr. 2007;150:429–433.
- , , , et al. Incidence and predisposing factors for severe disease in previously healthy term infants experiencing their first episode of bronchiolitis. Acta Paediatr. 2011;100:e17–e23.
- , , , et al. A cost effectiveness analysis of omitting radiography in diagnosis of acute bronchiolitis. Pediatr Pulmonol. 2009;44:122–127.
- , , , et al. Decreasing unnecessary utilization in acute bronchiolitis care: results from the value in inpatient pediatrics network. J Hosp Med. 2013;8:25–30.
- , , , . Efficacy of bronchodilator therapy in bronchiolitis. A meta‐analysis. Arch Pediatr Adolesc Med. 1996;150:1166–1172.
- , . Efficacy of beta2‐agonists in bronchiolitis: a reappraisal and meta‐analysis. Pediatrics. 1997;100:233–239.
- , . Bronchodilators for bronchiolitis. Cochrane Database Syst Rev. 2010;(12):CD001266.
- , , , et al. Epinephrine for bronchiolitis. Cochrane Database Syst Rev. 2011;(6):CD003123.
- , , , et al. Epinephrine and dexamethasone in children with bronchiolitis. N Engl J Med. 2009;360:2079–2089.
- , , , et al. A multicenter, randomized, double‐blind, controlled trial of nebulized epinephrine in infants with acute bronchiolitis. N Engl J Med. 2003;349:27–35.
- , , , . A randomized, controlled trial of the effectiveness of nebulized therapy with epinephrine compared with albuterol and saline in infants hospitalized for acute viral bronchiolitis. J Pediatr. 2002;141:818–824.
- , , , et al. Oral prednisolone for preschool children with acute virus‐induced wheezing. N Engl J Med. 2009;360:329–338.
- , , , et al. Glucocorticoids for acute viral bronchiolitis in infants and young children. Cochrane Database Syst Rev. 2010;(10):CD004878.
- , , , , . Systemic corticosteroids in infant bronchiolitis: a meta‐analysis. Pediatrics. 2000;105:E44.
- , , , . Controlled trial of oral prednisone in the emergency department treatment of children with acute asthma. Pediatrics. 1993;92:513–518.
- , , . Methylprednisolone therapy for acute asthma in infants and toddlers: a controlled clinical trial. Pediatrics. 1990;86:350–356.
- , , , , . Effect of a single oral dose of prednisolone in acute childhood asthma. Lancet. 1987;1:879–882.
- , , , , . The clinical management of preterm infants with bronchiolitis. Hosp Pediatr. 2013;3:244–250.
- , . Glucocorticoids and growth in asthmatic children. Pediatr Allergy Immunol. 1995;6:145–154.
- , , , , , . Adjunct corticosteroids in children hospitalized with community‐acquired pneumonia. Pediatrics. 2011;127:e255–e263.
- , , , , , . Pediatric gastroesophageal reflux disease and acid‐related conditions: trends in incidence of diagnosis and acid suppression therapy. J Med Econ. 2009;12:348–355.
- , , , , , . Healthcare costs of GERD and acid‐related conditions in pediatric patients, with comparison between histamine‐2 receptor antagonists and proton pump inhibitors. Curr Med Res Opin. 2009;25:2703–2709.
- , , , . Are we overprescribing antireflux medications for infants with regurgitation? Pediatrics. 2007;120:946–949.
- , , , , . Proton pump inhibitor utilization patterns in infants. J Pediatr Gastroenterol Nutr. 2007;45:421–427.
- , , , , , . Efficacy of proton‐pump inhibitors in children with gastroesophageal reflux disease: a systematic review. Pediatrics. 2011;127:925–935.
- . Effectiveness and safety of proton pump inhibitors in infantile gastroesophageal reflux disease. Ann Pharmacother. 2010;44:572–576.
- . Are there risks associated with empric acid suppression treatment of infants and children suspected of having gastroesophageal reflux disease? Hosp Pediatr. 2013;3:16–23.
- , , , . Bronchiolitis management preferences and the influence of pulse oximetry and respiratory rate on the decision to admit. Pediatrics. 2003;111:e45–e51.
- , , , . Impact of pulse oximetry and oxygen therapy on length of stay in bronchiolitis hospitalizations. Arch Pediatr Adolesc Med. 2004;158:527–530.
- , . Effect of oxygen supplementation on length of stay for infants hospitalized with acute viral bronchiolitis. Pediatrics. 2008;121:470–475.
- . Oxygen therapy for bronchiolitis. Pediatrics. 2007;120:686–687; author reply 687–688.
- , , , , , . Bronchiolitis‐associated hospitalizations among US children, 1980–1996. JAMA. 1999;282:1440–1446.
- , . Bronchiolitis: recent evidence on diagnosis and management. Pediatrics. 2010;125:342–349.
- , , , , . Bronchiolitis‐associated mortality and estimates of respiratory syncytial virus‐associated deaths among US children, 1979–1997. J Infect Dis. 2001;183:16–22.
- , . Observational study of two oxygen saturation targets for discharge in bronchiolitis. Arch Dis Child. 2012;97:361–363.
- , , , et al. Longitudinal assessment of hemoglobin oxygen saturation in preterm and term infants in the first six months of life. J Pediatr. 2011;159:377–383.e1.
- , . The impact of severe asthma on schoolchildren. J Asthma. 1999;36:409–417.
- , . Multi‐center, randomized trial of pulse oximetry monitoring strategies for children hospitalized for bronchiolitis. Abstract presented at: ID Week 2012; October 2012; San Diego, CA.
- , , , . The appropriateness method has acceptable reliability and validity for assessing overuse and underuse of surgical procedures. J Clin Epidemiol. 2012;65:1133–1143.
- Agency for Healthcare Research and Quality. HCUPnet. Kids inpatient database 2009. Available at: http://hcupnet.ahrq.gov. Accessed November 6, 2012.
- , , . Too little? Too much? Primary care physicians' views on US health care: a brief report. Arch Intern Med. 2011;171:1582–1585.
- . How to implement change in clinical practice. Paediatr Respir Rev. 2003;4:340–346.
Copyright © 2013 Society of Hospital Medicine
