User login
Accuracy of Hospitalist‐Performed HCUE
Hand‐carried ultrasound echocardiography (HCUE) can help noncardiologists answer well‐defined questions at patients' bedsides in less than 10 minutes.1, 2 Indeed, intensivists3 and emergency department physicians4 already use HCUE to make rapid, point‐of‐care assessments. Since cardiovascular diagnoses are common among general medicine inpatients, HCUE may become an important skill for hospitalists to learn.5
However, uncertainty exists about the duration of HCUE training for hospitalists. In 2002, experts from the American Society of Echocardiography (ASE) published recommendations on training requirements for HCUE.6 With limited data on the safety or performance of HCUE training programs, which had just begun to emerge, the ASE borrowed from the proven training recommendations for standard echocardiography (SE). They recommended that all HCUE trainees, cardiologist and noncardiologist alike, complete level 1 SE training: 75 personally‐performed and 150 personally‐interpreted echocardiographic examinations. Since then, however, several HCUE training programs designed for noncardiologists have emerged.2, 5, 710 These alternative programs suggest that the ASE's recommended duration of training may be too long, particularly for focused HCUE that is limited to a few relatively simple assessments. It is important not to overshoot the requirements of HCUE training, because doing so may discourage groups of noncardiologists, like hospitalists, who may derive great benefits from HCUE.11
To address this uncertainty for hospitalists, we first developed a brief HCUE training program to assess 6 important cardiac abnormalities. We then studied the diagnostic accuracy of HCUE by hospitalists as a test of these 6 cardiac abnormalities assessed by SE.
Patients and Methods
Setting and Subjects
This prospective cohort study was performed at Stroger Hospital of Cook County, a 500‐bed public teaching hospital in Chicago, IL, from March through May of 2007. The cohort was adult inpatients who were referred for SE on weekdays from 3 distinct patient care units (Figure 1). We used 2 sampling modes to balance practical constraints (short‐stay unit [SSU] patients were more localized and, therefore, easier to study) with clinical diversity. We consecutively sampled patients from our SSU, where adults with provisional cardiovascular diagnoses are admitted if they might be eligible for discharge with in 3 days.12 But we used random number tables with a daily unique starting point to randomly sample patients from the general medical wards and the coronary care unit (CCU). Patients were excluded if repositioning them for HCUE was potentially harmful. The study was approved by our hospital's institutional review board, and we obtained written informed consent from all enrolled patients.

SE Protocol
As part of enrolled patients' routine clinical care, SE images were acquired and interpreted in the usual fashion in our hospital's echocardiography laboratory, which performs SE on over 7,000 patients per year. Echocardiographic technicians acquired images with a General Electric Vivid 7 cardiac ultrasound machine (General Electric, Milwaukee, WI) equipped with a GE M4S 1.8 to 3.4 MHz cardiac transducer (General Electric). Technicians followed the standard adult transthoracic echocardiography scanning protocol to acquire 40 to 100 images on every patient using all available echocardiographic modalities: 2‐dimensional, M‐mode, color Doppler, continuous‐wave Doppler, pulse‐wave Doppler, and tissue Doppler.13 Blinded to HCUE results, attending physician cardiologist echocardiographers then interpreted archived images using computer software (Centricity System; General Electric) to generate final reports that were entered into patients' medical records. This software ensured that final reports were standardized, because echocardiographers' final qualitative assessments were limited to short lists of standard options; for example, in reporting left atrium (LA) size, echocardiographers chose from only 5 standard options: normal, mildly dilated, moderately dilated, severely dilated, and not interpretable. Investigators, who were also blinded to HCUE results, later abstracted SE results from these standardized report forms in patients' medical records. All echocardiographers fulfilled ASE training guidelines to independently interpret SE: a minimum of 150 personally‐performed and 300 personally‐interpreted echocardiographic examinations (training level 2).14
HCUE Training
Based on the recommendations of our cardiologist investigator (B.M.), we developed a training program for 1 hospitalist to become an HCUE instructor. Our instructor trainee (C.C.) was board‐eligible in internal medicine but had no previous formal training in cardiology or echocardiography. We a priori established that her training would continue until our cardiologist investigator determined that she was ready to train other hospitalists; this determination occurred after 5 weeks. She learned image acquisition by performing focused SE on 30 patients under the direct supervision of an echocardiographic technician. She also performed focused HCUE on 65 inpatients without direct supervision but with ongoing access to consult the technician to review archived images and troubleshoot difficulties with acquisition. She learned image interpretation by reading relevant chapters from a SE textbook15 and by participating in daily didactic sessions in which attending cardiologist echocardiographers train cardiology fellows in SE interpretation.
This hospitalist then served as the HCUE instructor for 8 other attending physician hospitalists who were board‐certified internists with no previous formal training in cardiology or echocardiography. The training program was limited to acquisition and interpretation of 2‐dimensional grayscale and color Doppler images for the 6 cardiac assessments under study (Table 1). The instructor marshaled pairs of hospitalists through the 3 components of the training program, which lasted a total of 27 hours.
|
| Six cardiac assessments learned using 2‐dimensional gray scale and color Doppler imaging |
| Left ventricular systolic dysfunction |
| Mitral valve regurgitation |
| Left atrium enlargement |
| Left ventricular hypertrophy |
| Pericardial effusion |
| Inferior vena cava diameter |
| Lecture (2 hours)* |
| Basic principles of echocardiography |
| HCUE scanning protocol and helpful techniques to optimize image quality |
| Hands‐on training with instructor |
| Orientation to machine and demonstration of scanning protocol (1 hour) |
| Sessions 1 through 3: HCUE performed on 1 patient per hour (6 patients in 6 hours) |
| Sessions 4 through 10: HCUE performed on 2 patients per hour (28 patients in 14 hours) |
| Feedback sessions on image quality and interpretation with cardiologist |
| After hands‐on training session 3 (2 hours) |
| After hands‐on training session 10 (2 hours) |
First, hospitalists attended a 2‐hour lecture on the basic principles of HCUE. Slides from this lecture and additional images of normal and abnormal findings were provided to each hospitalist on a digital video disc. Second, each hospitalist underwent 20 hours of hands‐on training in 2‐hour sessions scheduled over 2 weeks. Willing inpatients from our hospital's emergency department were used as volunteers for these hand‐on training sessions. During these sessions the instructor provided practical suggestions to optimize image quality, such as transducer location and patient positioning. In the first 3 sessions, the minimum pace was 1 patient per hour; thereafter, the pace was increased to 1 patient per half‐hour. We chose 20 hours of hands‐on training and these minimum paces because they allowed each hospitalist to attain a cumulative experience of no less than 30 patientsan amount that heralds a flattening of the HCUE learning curve among medical trainees.9 Third, each pair of hospitalists received feedback from a cardiologist investigator (B.M.) who critiqued the quality and interpretation of images acquired by hospitalists during hands‐on training sessions. Since image quality varies by patient,16 hospitalists' images were compared side‐by‐side to images recorded by the instructor on the same patients. The cardiologist also critiqued hospitalists' interpretations of both their own images and additional sets of archived images from patients with abnormal findings.
HCUE Protocol
After completing the training program and blinded to the results of SE, the 8 hospitalists performed HCUE on enrolled patients within hours of SE. We limited the time interval between tests to minimize the effect that changes in physiologic variables, such as blood pressure and intravascular volume, have on the reliability of serial echocardiographic measurements.16 Hospitalists performed HCUE with a MicroMaxx 3.4 hand‐carried ultrasound machine equipped with a cardiology software package and a 1 to 5 MHz P17 cardiac transducer (Sonosite, Inc., Bothell, WA); simultaneous electrocardiographic recording, though available, was not used. While patients laid on their own standard hospital beds or on a standard hospital gurney in a room adjacent to the SE waiting room, hospitalists positioned them without assistance from nursing staff and recorded 7 best‐quality images per patient. Patients were first positioned in a partial (3045 degrees) left lateral decubitus position to record 4 grayscale images of the short‐axis and long‐axis parasternal and 2‐chamber and 4‐chamber apical views; 2 color Doppler images of the mitral inflow were also recorded from the long‐axis parasternal and the 4‐chamber apical views. Patients were then positioned supine to record 1 grayscale image of the inferior vena cava (IVC) from the transhepatic view. Hospitalists did not perform a history or physical exam on enrolled patients, nor did they review patients' medical records.
Immediately following the HCUE, hospitalists replayed the recorded images as often as needed and entered final interpretations on data collection forms. Linear measurements were made manually with a caliper held directly to the hand‐carried ultrasound monitor. These measurements were then translated into qualitative assessments based on standard values used by our hospital's echocardiographers (Table 2).17 When a hospitalist could not confidently assess a cardiac abnormality, the final HCUE assessment was recorded as indeterminate. Hospitalists also recorded the time to perform each HCUE, which included the time to record 7 best‐quality images, to interpret the findings, and to fill out the data collection form.
| Hand‐Carried Ultrasound Echocardiography Results | |||||
|---|---|---|---|---|---|
| Cardiac Abnormality by Standard Echocardiography | Hand‐Carried Ultrasound Echocardiography Operator's Method of Assessment | Positive | Negative | ||
| |||||
| Left ventricle systolic dysfunction, mild or greater | Grade degree of abnormal wall movement and thickening during systole | Severe | Mild or moderate | Normal | Vigorous |
| Mitral valve regurgitation, severe | Classify regurgitant jet as central or eccentric, then measure as percentage of left atrium area | ||||
| Central jet | 20% | <20% | |||
| Eccentric jet | 20% | indeterminate 20% | |||
| Left atrium enlargement, moderate or severe | Measure left atrium in 3 dimensions at end diastole, then use the most abnormal dimension | Extreme | Borderline | ||
| Anteroposterior or mediolateral (cm) | 5.1 | 4.55.0 | 4.4 | ||
| Superior‐inferior (cm) | 7.1 | 6.17.0 | 6.0 | ||
| Left ventricle hypertrophy, moderate or severe | Measure thickest dimension of posterior or septal wall at end diastole | Extreme: 1.4 cm | Borderline: 1.21.3 cm | 1.1 cm | |
| Pericardial effusion, medium or large | Measure largest dimension in any view at end diastole | 1 cm | <1 cm | ||
| Inferior vena cava dilatation | Measure largest respirophasic diameter within 2 cm of right atrium | 2.1 cm | Normal: 1 to 2 cm | Contracted: 0.9 cm | |
Data Analysis
We based our sample size calculations on earlier reports of HCUE by noncardiologist trainees for assessment of left ventricular (LV) systolic function.7, 10 From these reports, we estimated a negative likelihood ratio of 0.3. In addition, we expected about a quarter of our patients to have LV systolic dysfunction (B.M., personal communication). Therefore, to achieve 95% confidence intervals (CIs) around the point estimate of a negative likelihood ratio that excluded 0.50, our upper bound for a clinically meaningful result, we needed a sample size of approximately 300 patients.18
We defined threshold levels of ordinal severity for the 6 cardiac abnormalities under study based on their clinical pertinence to hospitalists (Table 2). Here, we reasoned that abnormalities at or above these levels would likely lead to important changes in hospitalists' management of inpatients; abnormalities below these levels rarely represent cardiac disease that is worthy of an immediate change in management. Since even mild degrees of LV dysfunction have important diagnostic and therapeutic implications for most general medicine inpatients, particularly those presenting with heart failure,19 we set our threshold for LV dysfunction at mild or greater. In contrast, since neither mild nor moderate mitral regurgitation (MR) has immediate implications for medical or surgical therapy even if symptoms or LV dysfunction are present,20 we set our threshold for MR at severe. Similarly, though mild LA enlargement21 and mild LV hypertrophy22 have clear prognostic implications for patients' chronic medical conditions, we reasoned that only moderate or severe versions likely reflect underlying abnormalities that affect hospitalists' point‐of‐care decision‐making. Since cardiac tamponade is rarely both subclinical23 and due to a small pericardial effusion,24 we set our threshold for pericardial effusion size at moderate or large. Finally, we set our threshold IVC diameter, a marker of central venous volume status,25 at dilated, because volume overload is an important consideration in hospitalized cardiac patients.
Using these thresholds, investigators dichotomized echocardiographers' SE readings as normal or abnormal for each of the 6 cardiac abnormalities under study to serve as the reference standards. Hospitalists' HCUE results were then compared to the reference standards in 2 different ways. We first analyzed HCUE results as dichotomous values to calculate conventional sensitivity, specificity, and positive and negative likelihood ratios. Here we considered indeterminate HCUE results positive in a clinically conservative tradeoff that neither ignores indeterminate results nor risks falsely classifying them as negative.26 We then analyzed hospitalists' HCUE results as ordinal values for receiver operating characteristic (ROC) curve analysis. Here we considered an indeterminate result as 1 possible test result.27
To examine interobserver variability of HCUE, we first chose from the 6 possible assessments only those with a mean number of abnormal patients per hospitalist greater than 5. We reasoned that variability among assessments with lower prevalence would be predictably wide and inconclusive. We then expressed variability as standard deviations (SDs) around mean sensitivity and specificity for the 8 hospitalists.
The CIs for likelihood ratios were constructed using the likelihood‐based approach to binomial proportions of Koopman.28 The areas under ROC curves were computed using the trapezoidal rule, and the CIs for these areas were constructed using the algorithm described by DeLong et al.29 All analyses were conducted with Stata Statistical Software, Release 10 (StataCorp, College Station, TX).
Results
During the 3 month study period, 654 patients were referred for SE from the 3 participating patient care units (Figure 1). Among these, 65 patients were ineligible because their SE was performed on the weekend and 178 other patients were not randomized from the general medical wards and CCU. From the remaining eligible patients, 322 underwent HCUE and 314 (98% of 322) underwent both SE and HCUE. Individual SE assessments were not interpretable (and therefore excluded) due to poor image quality for LA enlargement in 1 patient and IVC dilatation in 30 patients. Eighty‐three percent of patients who underwent SE (260/314) were referred to assess LV function (Table 3). The prevalence of the 6 clinically pertinent cardiac abnormalities under study ranged from 1% for moderate or large pericardial effusion to 25% for LV systolic dysfunction. Overall, 40% of patients had at least 1 out of 6 cardiac abnormalities.
| Characteristic | |
|---|---|
| |
| Age, year SD (25th to 75th percentiles) | 56 13 (48 to 64) |
| Women | 146 (47) |
| Chronic obstructive pulmonary disease | 47 (15) |
| Body mass index | |
| 24.9 or less: underweight or normal | 74 (24) |
| 25 to 29.9: overweight | 94 (30) |
| 30 to 34.9: mild obesity | 75 (24) |
| 35 or greater: moderate or severe obesity | 71 (23) |
| Patient care unit | |
| Short‐stay unit | 175 (56) |
| General medical wards | 89 (28) |
| Cardiac care unit | 50 (16) |
| Indication for standard echocardiography* | |
| Left ventricular function | 260 (83) |
| Valvular function | 56 (18) |
| Wall motion abnormality | 29 (9) |
| Valvular vegetations | 22 (7) |
| Any structural heart disease | 20 (6) |
| Right ventricular function | 18 (6) |
| Other | 38 (12) |
| Standard echocardiography findings | |
| Left ventricular systolic dysfunction mild | 80 (25) |
| Inferior vena cava dilated | 45 (14) |
| Left ventricular wall thickness moderate | 33 (11) |
| Left atrium enlargement moderate | 19 (6) |
| Mitral valve regurgitation severe | 11 (4) |
| Pericardial effusion moderate | 3 (1) |
| At least 1 of the above findings | 127 (40) |
| Time difference between HCUE and standard echocardiogram, median hours (25th to 75th percentiles) | 2.8 (1.4 to 5.1) |
| Time to complete HCUE, median minutes (25th to 75th percentiles) | 28 (20 to 35) |
Each hospitalist performed a similar total number of HCUE examinations (range, 3447). The median time difference between performance of SE and HCUE was 2.8 hours (25th75th percentiles, 1.45.1). Despite the high prevalence of chronic obstructive pulmonary disease and obesity, hospitalists considered HCUE assessments indeterminate in only 2% to 6% of the 6 assessments made for each patient (Table 4). Among the 38 patients (12% of 322) with any indeterminate HCUE assessment, 24 patients had only 1 out of 6 possible. Hospitalists completed HCUE in a median time of 28 minutes (25th‐75th percentiles, 2035), which included the time to record 7 best‐quality moving images and to fill out the research data collection form.
| n (%)* | |
|---|---|
| |
| Number of indeterminate findings per patient | |
| 0 | 284 (88) |
| 1 | 24 (7) |
| 2 | 4 (1) |
| 3 or more | 10 (3) |
| Indeterminate findings by cardiac assessment | |
| Mitral valve regurgitation | 18 (6) |
| Inferior vena cava diameter | 16 (5) |
| Left ventricular hypertrophy | 15 (5) |
| Pericardial effusion | 9 (3) |
| Left atrium size | 5 (2) |
| Left ventricle systolic function | 5 (2) |
When HCUE results were analyzed as dichotomous values, positive likelihood ratios ranged from 2.5 to 21, and negative likelihood ratios ranged from 0 to 0.4 (Table 5). Positive and negative likelihood ratios were both sufficiency high and low to respectively increase and decrease by 5‐fold the prior odds of 3 out of 6 cardiac abnormalities: LV systolic dysfunction, moderate or severe MR regurgitation, and moderate or large pericardial effusion. Considering HCUE results as ordinal values for ROC analysis yielded additional diagnostic information (Figure 2). For example, the likelihood ratio of 1.0 (95% CI, 0.42.0) for borderline positive moderate or severe LA enlargement increased to 29 (range, 1362) for extreme positive results. Areas under the ROC curves were 0.9 for 4 out of 6 cardiac abnormalities.
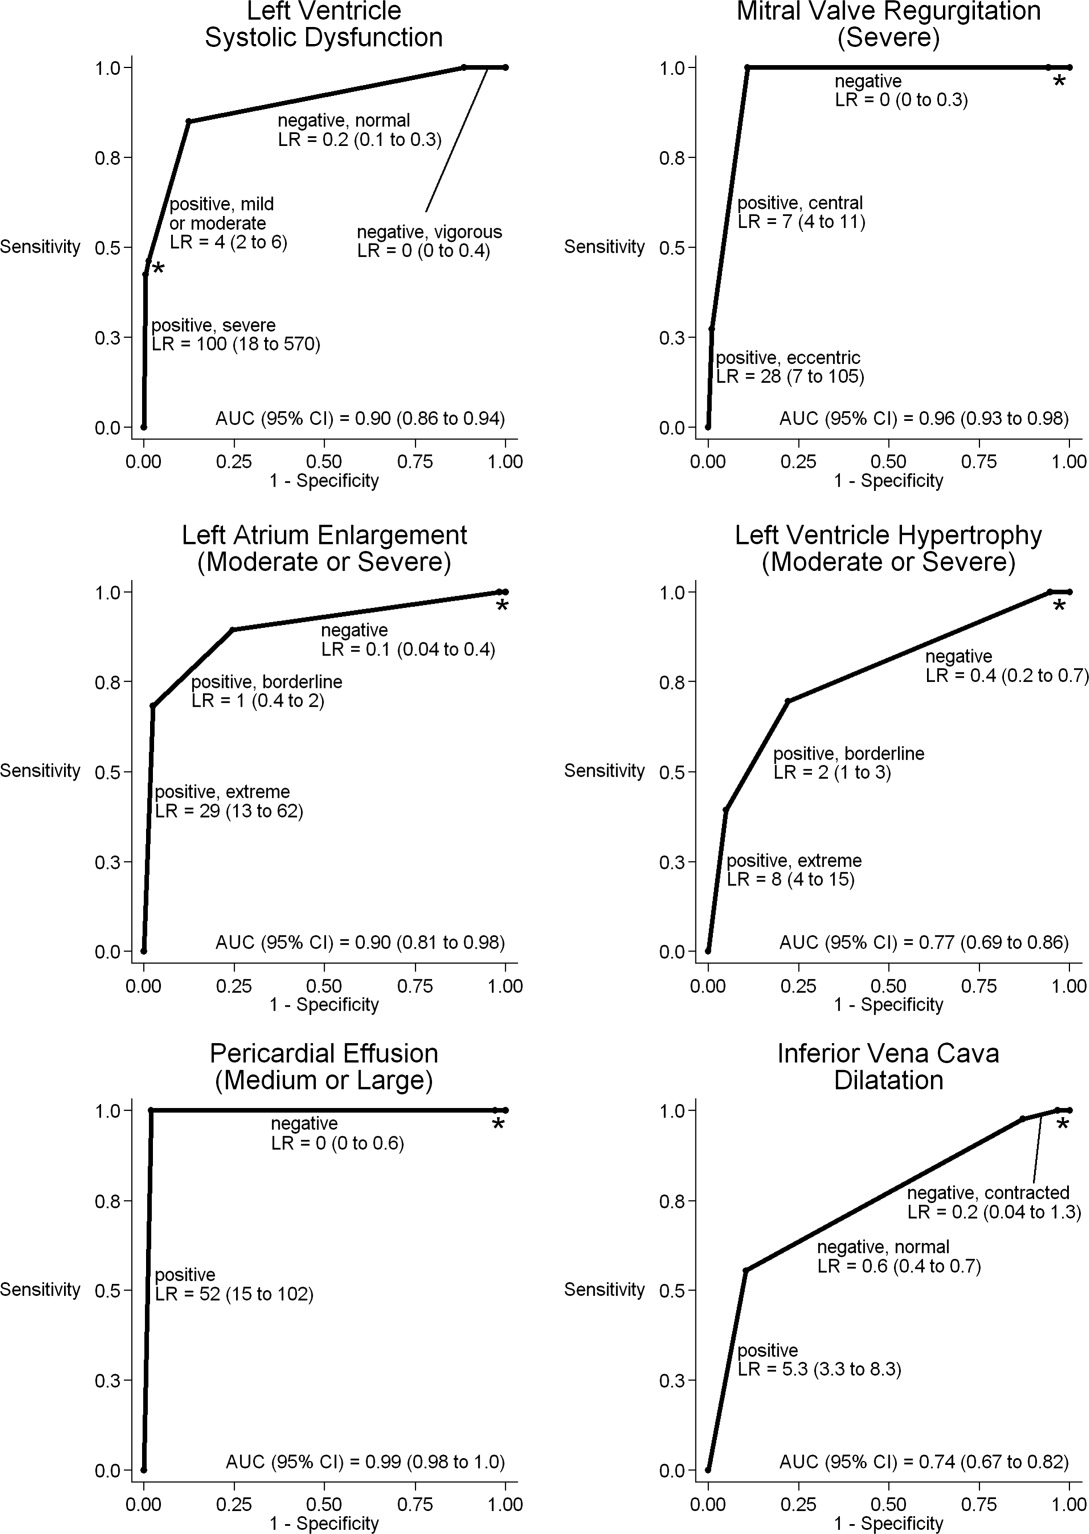
| Clinically Pertinent Cardiac Abnormality by Standard Echocardiography | Prevalence n/total n | Sensitivity* % (95% CI) | Specificity* % (95% CI) | LRpositive*, (95% CI) | LRnegative*, (95% CI) |
|---|---|---|---|---|---|
| |||||
| Left ventricular systolic dysfunction | 80/314 | 85 (7592) | 88 (8392) | 6.9 (4.99.8) | 0.2 (0.10.3) |
| Mitral valve regurgitation, severe | 11/314 | 100 (72100) | 83 (7987) | 5.9 (3.97.4) | 0 (00.3) |
| Left atrium enlargement, moderate or severe | 19/313 | 90 (6799) | 74 (6879) | 3.4 (2.54.3) | 0.1 (0.040.4) |
| Left ventricular hypertrophy, moderate or severe | 33/314 | 70 (5184) | 73 (6778) | 2.5 (1.83.3) | 0.4 (0.20.7) |
| Pericardial effusion, moderate or large | 3/314 | 100 (29100) | 95 (9297) | 21 (6.731) | 0 (00.6) |
| Inferior vena cava, dilated | 45/284 | 56 (4070) | 86 (8190) | 4.0 (2.66.0) | 0.5 (0.40.7) |
LV systolic dysfunction and IVC dilatation were both prevalent enough to meet our criterion to examine interobserver variability; the mean number of abnormal patients per hospitalist was 10 patients for LV systolic dysfunction and 6 patients for IVC dilatation. For LV systolic dysfunction, SDs around mean sensitivity (84%) and specificity (87%) were 12% and 6%, respectively. For IVC dilatation, SDs around mean sensitivity (58%) and specificity (86%) were 24% and 7%, respectively.
Discussion
We found that, after a 27‐hour training program, hospitalists performed HCUE with moderate to excellent diagnostic accuracy for 6 important cardiac abnormalities. For example, hospitalists' assessments of LV systolic function yielded positive and negative likelihood ratios of 6.9 (95% CI, 4.99.8) and 0.2 (95% CI, 0.10.3), respectively. At the bedsides of patients with acute heart failure, therefore, hospitalists could use HCUE to lower or raise the 50:50 chance of LV systolic dysfunction30 to 15% or 85%, respectively. Whether or not these posttest likelihoods are extreme enough to cross important thresholds will depend on the clinical context. Yet these findings demonstrate how HCUE has the potential to provide hospitalists with valuable point‐of‐care data that are otherwise unavailableeither because routine clinical assessments are unreliable31 or because echocardiographic services are not immediately accessible.1
In fact, recent data from the Joint Commission on Accreditation of Healthcare Organizations shows how inaccessible SE may be. Approximately one‐quarter of hospitals in the United States send home about 10% of patients with acute heart failure without echocardiographic assessment of LV systolic function before, during, or immediately after hospitalization.32 In doing so, these hospitals leave unmet the 2002 National Quality Improvement Goal of universal assessment of LV systolic function for all heart failure patients. Hospitalists could close this quality gap with routine, 10‐minute HCUE assessments in all patients admitted with acute heart failure. (Our research HCUE protocol required a median time of 28 minutes, but this included time to assess 5 other cardiac abnormalities and collect data for research purposes). Until the clinical consequences of introducing hospitalist‐performed HCUE are studied, potential benefits like this are tentative. But our findings suggest that training hospitalists to accurately perform HCUE can be successfully accomplished in just 27 hours.
Other studies of HCUE training programs for noncardiologists have also challenged the opinion that learning to perform HCUE requires more than 100 hours of training.2, 711 Yet only 1 prior study has examined an HCUE training program for hospitalists.5 In this study by Martin et al.,5 hospitalists completed 5 supervised HCUE examinations and 6 hours of interpretation training before investigators scored their image acquisition and interpretation skills from 30 unsupervised HCUE examinations. To estimate their final skill levels at the completion of all 35 examinations by accounting for an initially steep learning curve, investigators then adjusted these scores with regression models. Despite these upward adjustments, hospitalists' image acquisition and interpretation scores were low in comparison to echocardiographic technicians and cardiology fellows. Besides these adjusted measurements of hospitalists' skills, however, Martin et al.5 unfortunately did not also report standard measures of diagnostic accuracy, like those proposed by the Standards for Reporting of Diagnostic Accuracy (STARD) initiative.33 Therefore, direct comparisons to the present study are difficult. Nevertheless, their findings suggest that a training program limited to 5 supervised HCUE examinations may be inadequate for hospitalists. In fact, the same group's earlier study of medical trainees suggested a minimum of 30 supervised HCUE examinations.9 We chose to design our hospitalist training program based on this minimum, though they surprisingly did not.5 As others continue to refine the components of hospitalist HCUE training programs, such as the optimal number of supervised examinations, our program could serve as a reasonable comparative example: more rigorous than the program designed by Martin et al.5 but more feasible than ASE level 1 training.
The number and complexity of assessments taught in HCUE training programs will determine their duration. With ongoing advancements in HCUE technology, there is a growing list of potential assessments to choose from. Although HCUE training programs ought to include assessments with proven clinical applications, there are no trials of HCUE‐directed care to inform such decisions. In their absence, therefore, we chose 6 assessments based on the following 3 criteria. First, our assessments were otherwise not reliably available from routine clinical data, such as the physical examination. Second, our assessments were straightforward: easy to learn and simple to perform. Here, we based our reasoning on an expectation that the value of HCUE lies not in highly complex, state‐of‐the‐art assessmentswhich are best left to echocardiographers equipped with SEbut in simple, routine assessments made with highly portable machines that grant noncardiologists newfound access to point‐of‐care data.34 Third, our assessments were clinically pertinent and, where appropriate, defined by cut‐points at levels of severity that often lead to changes in management. We suspect that setting high cut‐points has the salutary effects of making assessments easier to learn and more accurate, because distinguishing mild abnormalities is likely the most challenging aspect of echocardiographic interpretation.35 Whether or not our choices of assessments, and their cut‐points, are optimal has yet to be determined by future research designed to study how they affect patient outcomes. Given our hospitalists' performance in the present study, these assessments seem worthy of such future research.
Our study had several limitations. We studied physicians and patients from only 1 hospital; similar studies performed in different settings, particularly among patients with different proportions and manifestations of disease, may find different results. Nevertheless, our sampling method of prospectively enrolling consecutive patients strengthens our findings. Some echocardiographic measurement methods used by our hospitalists differed in subtle ways from echocardiography guideline recommendations.35 We chose our methods (Table 2) for 2 reasons. First, whenever possible, we chose methods of interpretation that coincided with our local cardiologists'. Second, we chose simplicity over precision. For example, the biplane method of disks, or modified Simpson's rule, is the preferred volumetric method of calculating LA size.35 This method requires tracing the contours of the LA in 2 planes and then dividing the LA volume into stacked oval disks for calculation. We chose instead to train our hospitalists in a simpler method based on 2 linear measurements. Any loss of precision, however, was balanced by a large gain in simplicity. Regardless, minor variations in LA size are not likely to affect hospitalists' bedside evaluations. Finally, we did not validate the results of our reference standard (SE) by documenting interobserver reliability. Yet, because SE is generally accurate for the 6 cardiac abnormalities under study, the effect of this bias should be small.
These limitations can be addressed best by controlled trials of HCUE‐directed care. These trials will determine the clinical impact of hospitalist‐performed HCUE and, in turn, inform our design of HCUE training programs. As the current study shows, training hospitalists to participate in such trials is feasible: like other groups of noncardiologists, hospitalists can accurately perform HCUE after a brief training program. Whether or not hospitalists should perform HCUE requires further study.
Acknowledgements
The authors thank Sonosite, Inc., Bothell, WA, for loaning us 2 MicroMaxx machines throughout the study period. They also thank the staff of the Internal Medicine Research Mentoring Program at Rush Medical College for their technical support and the staff of the Division of Neurology at Stroger Hospital for granting them access to a procedure room.
- .The physical examination of the future: echocardiography as part of the assessment.ACC Curr J Rev.1998;7:79–81.
- ,,.The hand‐carried echocardiographic device as an aid to the physical examination.Echocardiography.2003;20:477–485.
- ,.Bedside ultrasonography in the ICU: Part 2.Chest.2005;128:1766–1781.
- ,.Practical Guide to Emergency Ultrasound.1st ed.Philadelphia, PA:Lippincott Williams 2006.
- ,,,,,.Hospitalist performance of cardiac hand‐carried ultrasound after focused training.Am J Med.2007;120:1000–1004.
- ,,, et al.Hand‐carried cardiac ultrasound (HCU) device: recommendations regarding new technology. A report from the echocardiography task force on new technology of the Nomenclature and Standards Committee of the American Society of Echocardiography.J Am Soc Echocardiogr.2002;15:369–373.
- ,,,,,.The use of small personal ultrasound devices with internists without formal training in echocardiography.Eur J Echocardiogr.2003;4:141–147.
- ,,, et al.Feasibility of point‐of‐care echocardiography by internal medicine house staff.Am Heart J.2004;147:476–481.
- ,,,,,.The rate at which residents learn to use hand‐held echocardiography at the bedside.Am J Med.2005;118:1010–1018.
- ,,, et al.Comparison of effectiveness of hand‐carried ultrasound to bedside cardiovascular physical examination.Am J Cardiol.2005;96:1002–1006.
- ,,.Can hand‐carried ultrasound devices be extended for use by the noncardiology medical community?Echocardiography.2003;20:471–476.
- ,,, et al.A hospitalist‐run short stay unit: features that predict patients' length‐of‐stay and eventual admission to traditional inpatient services.J Hosp Med.2009;4:276–284.
- .Adult echocardiography scanning protocol. In: Templin BB, ed.Ultrasound Scanning: Principles and Protocols.2nd ed.Philadelphia, PA:Saunders;1999:426.
- ,,, et al.ACCF 2008 Recommendations for training in adult cardiovascular medicine core cardiology training (COCATS 3) (revision of the 2002 COCATS training statement).J Am Coll Cardiol.2008;51:333–414.
- ,,.The Echo Manual.2nd ed.Philadelphia, PA:Lippincott Williams 1999.
- ,,, et al.Echocardiography in serial evaluation of left ventricular systolic and diastolic function: importance of image acquisition, quantitation, and physiologic variability in clinical and investigational applications.J Am Soc Echocardiogr.1991;4:203–214.
- .Textbook of Clinical Echocardiography.3rd ed.Philadelphia, PA:Elsevier Saunders;2004.
- ,,.Likelihood ratios with confidence: sample size estimation for diagnostic test studies.J Clin Epidemiol.1991;44:763–770.
- ,,, et al.ACC/AHA 2005 guideline update for the diagnosis and management of chronic heart failure in the adult: a report of the American College of Cardiology/American Heart Association Task Force on Practice Guidelines.Circulation.2005;112;154–235.
- ,,, et al.ACC/AHA 2006 guidelines for the management of patients with valvular heart disease: a report of the American College of Cardiology/American Heart Association Task Force on Practice Guidelines.Circulation.2006;114:e84–e231.
- ,,, et al.Left atrial size: physiologic determinants and clinical applications.J Am Coll Cardiol.2006;47:2357–2363.
- ,,,,.Prognostic implications of echocardiographically determined left ventricular mass in the Framingham Heart Study.N Engl J Med.1990;322:1561–1566.
- ,,,.Does this patient with a pericardial effusion have cardiac tamponade?JAMA.2007;297:1810–1818.
- .Acute cardiac tamponade.N Engl J Med.2003;349:685–690.
- ,,,,,.Evaluation of size and dynamics of the inferior vena cava as an index of right‐sided cardiac function.Am J Cardiol.1984;53:579–585.
- ,,.The influence of uninterpretability on the assessment of diagnostic tests.J Chronic Dis.1986;39:575–584.
- ,,.Relations between effectiveness of a diagnostic test, prevalence of the disease, and percentages of uninterpretable results. An example in the diagnosis of jaundice.Med Decis Making.1982;2:285–297.
- .Confidence intervals for the ratio of two binomial proportions.Biometrics.1984;40:513–517.
- ,,.Comparing the areas under two or more correlated receiver operating curves: a nonparametric approach.Biometrics.1988;44:837–845.
- ,,, et al.Systolic blood pressure at admission, clinical characteristics, and outcomes in patients hospitalized with acute heart failure.JAMA.2006;296:2217–2226.
- ,,, et al.Utility of history, physical examination, electrocardiogram, and chest radiograph for differentiating normal from decreased systolic function in patients with heart failure.Am J Med.2002;112:437–445.
- Joint Commission on Accreditation of Healthcare Organizations. Health Care Quality Data Download Website. Available at: http://www.healthcarequalitydata.org. Accessed December2008.
- ,,, et al.Towards complete and accurate reporting of studies of diagnostic accuracy: the STARD initiative.Clin Chem.2003;49:1–6.
- ,,.Will disruptive innovations cure health care?Harv Bus Rev.2000;78:102–112.
- ,,, et al.Recommendations for chamber quantification: a report from the American Society of Echocardiography's Guidelines and Standards Committee and the Chamber Quantification Writing Group, developed in conjunction with the European Association of Echocardiography, a branch of the European Society of Cardiology.J Am Soc Echocardiogr.2005;18:1440–1463.
Hand‐carried ultrasound echocardiography (HCUE) can help noncardiologists answer well‐defined questions at patients' bedsides in less than 10 minutes.1, 2 Indeed, intensivists3 and emergency department physicians4 already use HCUE to make rapid, point‐of‐care assessments. Since cardiovascular diagnoses are common among general medicine inpatients, HCUE may become an important skill for hospitalists to learn.5
However, uncertainty exists about the duration of HCUE training for hospitalists. In 2002, experts from the American Society of Echocardiography (ASE) published recommendations on training requirements for HCUE.6 With limited data on the safety or performance of HCUE training programs, which had just begun to emerge, the ASE borrowed from the proven training recommendations for standard echocardiography (SE). They recommended that all HCUE trainees, cardiologist and noncardiologist alike, complete level 1 SE training: 75 personally‐performed and 150 personally‐interpreted echocardiographic examinations. Since then, however, several HCUE training programs designed for noncardiologists have emerged.2, 5, 710 These alternative programs suggest that the ASE's recommended duration of training may be too long, particularly for focused HCUE that is limited to a few relatively simple assessments. It is important not to overshoot the requirements of HCUE training, because doing so may discourage groups of noncardiologists, like hospitalists, who may derive great benefits from HCUE.11
To address this uncertainty for hospitalists, we first developed a brief HCUE training program to assess 6 important cardiac abnormalities. We then studied the diagnostic accuracy of HCUE by hospitalists as a test of these 6 cardiac abnormalities assessed by SE.
Patients and Methods
Setting and Subjects
This prospective cohort study was performed at Stroger Hospital of Cook County, a 500‐bed public teaching hospital in Chicago, IL, from March through May of 2007. The cohort was adult inpatients who were referred for SE on weekdays from 3 distinct patient care units (Figure 1). We used 2 sampling modes to balance practical constraints (short‐stay unit [SSU] patients were more localized and, therefore, easier to study) with clinical diversity. We consecutively sampled patients from our SSU, where adults with provisional cardiovascular diagnoses are admitted if they might be eligible for discharge with in 3 days.12 But we used random number tables with a daily unique starting point to randomly sample patients from the general medical wards and the coronary care unit (CCU). Patients were excluded if repositioning them for HCUE was potentially harmful. The study was approved by our hospital's institutional review board, and we obtained written informed consent from all enrolled patients.
SE Protocol
As part of enrolled patients' routine clinical care, SE images were acquired and interpreted in the usual fashion in our hospital's echocardiography laboratory, which performs SE on over 7,000 patients per year. Echocardiographic technicians acquired images with a General Electric Vivid 7 cardiac ultrasound machine (General Electric, Milwaukee, WI) equipped with a GE M4S 1.8 to 3.4 MHz cardiac transducer (General Electric). Technicians followed the standard adult transthoracic echocardiography scanning protocol to acquire 40 to 100 images on every patient using all available echocardiographic modalities: 2‐dimensional, M‐mode, color Doppler, continuous‐wave Doppler, pulse‐wave Doppler, and tissue Doppler.13 Blinded to HCUE results, attending physician cardiologist echocardiographers then interpreted archived images using computer software (Centricity System; General Electric) to generate final reports that were entered into patients' medical records. This software ensured that final reports were standardized, because echocardiographers' final qualitative assessments were limited to short lists of standard options; for example, in reporting left atrium (LA) size, echocardiographers chose from only 5 standard options: normal, mildly dilated, moderately dilated, severely dilated, and not interpretable. Investigators, who were also blinded to HCUE results, later abstracted SE results from these standardized report forms in patients' medical records. All echocardiographers fulfilled ASE training guidelines to independently interpret SE: a minimum of 150 personally‐performed and 300 personally‐interpreted echocardiographic examinations (training level 2).14
HCUE Training
Based on the recommendations of our cardiologist investigator (B.M.), we developed a training program for 1 hospitalist to become an HCUE instructor. Our instructor trainee (C.C.) was board‐eligible in internal medicine but had no previous formal training in cardiology or echocardiography. We a priori established that her training would continue until our cardiologist investigator determined that she was ready to train other hospitalists; this determination occurred after 5 weeks. She learned image acquisition by performing focused SE on 30 patients under the direct supervision of an echocardiographic technician. She also performed focused HCUE on 65 inpatients without direct supervision but with ongoing access to consult the technician to review archived images and troubleshoot difficulties with acquisition. She learned image interpretation by reading relevant chapters from a SE textbook15 and by participating in daily didactic sessions in which attending cardiologist echocardiographers train cardiology fellows in SE interpretation.
This hospitalist then served as the HCUE instructor for 8 other attending physician hospitalists who were board‐certified internists with no previous formal training in cardiology or echocardiography. The training program was limited to acquisition and interpretation of 2‐dimensional grayscale and color Doppler images for the 6 cardiac assessments under study (Table 1). The instructor marshaled pairs of hospitalists through the 3 components of the training program, which lasted a total of 27 hours.
|
| Six cardiac assessments learned using 2‐dimensional gray scale and color Doppler imaging |
| Left ventricular systolic dysfunction |
| Mitral valve regurgitation |
| Left atrium enlargement |
| Left ventricular hypertrophy |
| Pericardial effusion |
| Inferior vena cava diameter |
| Lecture (2 hours)* |
| Basic principles of echocardiography |
| HCUE scanning protocol and helpful techniques to optimize image quality |
| Hands‐on training with instructor |
| Orientation to machine and demonstration of scanning protocol (1 hour) |
| Sessions 1 through 3: HCUE performed on 1 patient per hour (6 patients in 6 hours) |
| Sessions 4 through 10: HCUE performed on 2 patients per hour (28 patients in 14 hours) |
| Feedback sessions on image quality and interpretation with cardiologist |
| After hands‐on training session 3 (2 hours) |
| After hands‐on training session 10 (2 hours) |
First, hospitalists attended a 2‐hour lecture on the basic principles of HCUE. Slides from this lecture and additional images of normal and abnormal findings were provided to each hospitalist on a digital video disc. Second, each hospitalist underwent 20 hours of hands‐on training in 2‐hour sessions scheduled over 2 weeks. Willing inpatients from our hospital's emergency department were used as volunteers for these hand‐on training sessions. During these sessions the instructor provided practical suggestions to optimize image quality, such as transducer location and patient positioning. In the first 3 sessions, the minimum pace was 1 patient per hour; thereafter, the pace was increased to 1 patient per half‐hour. We chose 20 hours of hands‐on training and these minimum paces because they allowed each hospitalist to attain a cumulative experience of no less than 30 patientsan amount that heralds a flattening of the HCUE learning curve among medical trainees.9 Third, each pair of hospitalists received feedback from a cardiologist investigator (B.M.) who critiqued the quality and interpretation of images acquired by hospitalists during hands‐on training sessions. Since image quality varies by patient,16 hospitalists' images were compared side‐by‐side to images recorded by the instructor on the same patients. The cardiologist also critiqued hospitalists' interpretations of both their own images and additional sets of archived images from patients with abnormal findings.
HCUE Protocol
After completing the training program and blinded to the results of SE, the 8 hospitalists performed HCUE on enrolled patients within hours of SE. We limited the time interval between tests to minimize the effect that changes in physiologic variables, such as blood pressure and intravascular volume, have on the reliability of serial echocardiographic measurements.16 Hospitalists performed HCUE with a MicroMaxx 3.4 hand‐carried ultrasound machine equipped with a cardiology software package and a 1 to 5 MHz P17 cardiac transducer (Sonosite, Inc., Bothell, WA); simultaneous electrocardiographic recording, though available, was not used. While patients laid on their own standard hospital beds or on a standard hospital gurney in a room adjacent to the SE waiting room, hospitalists positioned them without assistance from nursing staff and recorded 7 best‐quality images per patient. Patients were first positioned in a partial (3045 degrees) left lateral decubitus position to record 4 grayscale images of the short‐axis and long‐axis parasternal and 2‐chamber and 4‐chamber apical views; 2 color Doppler images of the mitral inflow were also recorded from the long‐axis parasternal and the 4‐chamber apical views. Patients were then positioned supine to record 1 grayscale image of the inferior vena cava (IVC) from the transhepatic view. Hospitalists did not perform a history or physical exam on enrolled patients, nor did they review patients' medical records.
Immediately following the HCUE, hospitalists replayed the recorded images as often as needed and entered final interpretations on data collection forms. Linear measurements were made manually with a caliper held directly to the hand‐carried ultrasound monitor. These measurements were then translated into qualitative assessments based on standard values used by our hospital's echocardiographers (Table 2).17 When a hospitalist could not confidently assess a cardiac abnormality, the final HCUE assessment was recorded as indeterminate. Hospitalists also recorded the time to perform each HCUE, which included the time to record 7 best‐quality images, to interpret the findings, and to fill out the data collection form.
| Hand‐Carried Ultrasound Echocardiography Results | |||||
|---|---|---|---|---|---|
| Cardiac Abnormality by Standard Echocardiography | Hand‐Carried Ultrasound Echocardiography Operator's Method of Assessment | Positive | Negative | ||
| |||||
| Left ventricle systolic dysfunction, mild or greater | Grade degree of abnormal wall movement and thickening during systole | Severe | Mild or moderate | Normal | Vigorous |
| Mitral valve regurgitation, severe | Classify regurgitant jet as central or eccentric, then measure as percentage of left atrium area | ||||
| Central jet | 20% | <20% | |||
| Eccentric jet | 20% | indeterminate 20% | |||
| Left atrium enlargement, moderate or severe | Measure left atrium in 3 dimensions at end diastole, then use the most abnormal dimension | Extreme | Borderline | ||
| Anteroposterior or mediolateral (cm) | 5.1 | 4.55.0 | 4.4 | ||
| Superior‐inferior (cm) | 7.1 | 6.17.0 | 6.0 | ||
| Left ventricle hypertrophy, moderate or severe | Measure thickest dimension of posterior or septal wall at end diastole | Extreme: 1.4 cm | Borderline: 1.21.3 cm | 1.1 cm | |
| Pericardial effusion, medium or large | Measure largest dimension in any view at end diastole | 1 cm | <1 cm | ||
| Inferior vena cava dilatation | Measure largest respirophasic diameter within 2 cm of right atrium | 2.1 cm | Normal: 1 to 2 cm | Contracted: 0.9 cm | |
Data Analysis
We based our sample size calculations on earlier reports of HCUE by noncardiologist trainees for assessment of left ventricular (LV) systolic function.7, 10 From these reports, we estimated a negative likelihood ratio of 0.3. In addition, we expected about a quarter of our patients to have LV systolic dysfunction (B.M., personal communication). Therefore, to achieve 95% confidence intervals (CIs) around the point estimate of a negative likelihood ratio that excluded 0.50, our upper bound for a clinically meaningful result, we needed a sample size of approximately 300 patients.18
We defined threshold levels of ordinal severity for the 6 cardiac abnormalities under study based on their clinical pertinence to hospitalists (Table 2). Here, we reasoned that abnormalities at or above these levels would likely lead to important changes in hospitalists' management of inpatients; abnormalities below these levels rarely represent cardiac disease that is worthy of an immediate change in management. Since even mild degrees of LV dysfunction have important diagnostic and therapeutic implications for most general medicine inpatients, particularly those presenting with heart failure,19 we set our threshold for LV dysfunction at mild or greater. In contrast, since neither mild nor moderate mitral regurgitation (MR) has immediate implications for medical or surgical therapy even if symptoms or LV dysfunction are present,20 we set our threshold for MR at severe. Similarly, though mild LA enlargement21 and mild LV hypertrophy22 have clear prognostic implications for patients' chronic medical conditions, we reasoned that only moderate or severe versions likely reflect underlying abnormalities that affect hospitalists' point‐of‐care decision‐making. Since cardiac tamponade is rarely both subclinical23 and due to a small pericardial effusion,24 we set our threshold for pericardial effusion size at moderate or large. Finally, we set our threshold IVC diameter, a marker of central venous volume status,25 at dilated, because volume overload is an important consideration in hospitalized cardiac patients.
Using these thresholds, investigators dichotomized echocardiographers' SE readings as normal or abnormal for each of the 6 cardiac abnormalities under study to serve as the reference standards. Hospitalists' HCUE results were then compared to the reference standards in 2 different ways. We first analyzed HCUE results as dichotomous values to calculate conventional sensitivity, specificity, and positive and negative likelihood ratios. Here we considered indeterminate HCUE results positive in a clinically conservative tradeoff that neither ignores indeterminate results nor risks falsely classifying them as negative.26 We then analyzed hospitalists' HCUE results as ordinal values for receiver operating characteristic (ROC) curve analysis. Here we considered an indeterminate result as 1 possible test result.27
To examine interobserver variability of HCUE, we first chose from the 6 possible assessments only those with a mean number of abnormal patients per hospitalist greater than 5. We reasoned that variability among assessments with lower prevalence would be predictably wide and inconclusive. We then expressed variability as standard deviations (SDs) around mean sensitivity and specificity for the 8 hospitalists.
The CIs for likelihood ratios were constructed using the likelihood‐based approach to binomial proportions of Koopman.28 The areas under ROC curves were computed using the trapezoidal rule, and the CIs for these areas were constructed using the algorithm described by DeLong et al.29 All analyses were conducted with Stata Statistical Software, Release 10 (StataCorp, College Station, TX).
Results
During the 3 month study period, 654 patients were referred for SE from the 3 participating patient care units (Figure 1). Among these, 65 patients were ineligible because their SE was performed on the weekend and 178 other patients were not randomized from the general medical wards and CCU. From the remaining eligible patients, 322 underwent HCUE and 314 (98% of 322) underwent both SE and HCUE. Individual SE assessments were not interpretable (and therefore excluded) due to poor image quality for LA enlargement in 1 patient and IVC dilatation in 30 patients. Eighty‐three percent of patients who underwent SE (260/314) were referred to assess LV function (Table 3). The prevalence of the 6 clinically pertinent cardiac abnormalities under study ranged from 1% for moderate or large pericardial effusion to 25% for LV systolic dysfunction. Overall, 40% of patients had at least 1 out of 6 cardiac abnormalities.
| Characteristic | |
|---|---|
| |
| Age, year SD (25th to 75th percentiles) | 56 13 (48 to 64) |
| Women | 146 (47) |
| Chronic obstructive pulmonary disease | 47 (15) |
| Body mass index | |
| 24.9 or less: underweight or normal | 74 (24) |
| 25 to 29.9: overweight | 94 (30) |
| 30 to 34.9: mild obesity | 75 (24) |
| 35 or greater: moderate or severe obesity | 71 (23) |
| Patient care unit | |
| Short‐stay unit | 175 (56) |
| General medical wards | 89 (28) |
| Cardiac care unit | 50 (16) |
| Indication for standard echocardiography* | |
| Left ventricular function | 260 (83) |
| Valvular function | 56 (18) |
| Wall motion abnormality | 29 (9) |
| Valvular vegetations | 22 (7) |
| Any structural heart disease | 20 (6) |
| Right ventricular function | 18 (6) |
| Other | 38 (12) |
| Standard echocardiography findings | |
| Left ventricular systolic dysfunction mild | 80 (25) |
| Inferior vena cava dilated | 45 (14) |
| Left ventricular wall thickness moderate | 33 (11) |
| Left atrium enlargement moderate | 19 (6) |
| Mitral valve regurgitation severe | 11 (4) |
| Pericardial effusion moderate | 3 (1) |
| At least 1 of the above findings | 127 (40) |
| Time difference between HCUE and standard echocardiogram, median hours (25th to 75th percentiles) | 2.8 (1.4 to 5.1) |
| Time to complete HCUE, median minutes (25th to 75th percentiles) | 28 (20 to 35) |
Each hospitalist performed a similar total number of HCUE examinations (range, 3447). The median time difference between performance of SE and HCUE was 2.8 hours (25th75th percentiles, 1.45.1). Despite the high prevalence of chronic obstructive pulmonary disease and obesity, hospitalists considered HCUE assessments indeterminate in only 2% to 6% of the 6 assessments made for each patient (Table 4). Among the 38 patients (12% of 322) with any indeterminate HCUE assessment, 24 patients had only 1 out of 6 possible. Hospitalists completed HCUE in a median time of 28 minutes (25th‐75th percentiles, 2035), which included the time to record 7 best‐quality moving images and to fill out the research data collection form.
| n (%)* | |
|---|---|
| |
| Number of indeterminate findings per patient | |
| 0 | 284 (88) |
| 1 | 24 (7) |
| 2 | 4 (1) |
| 3 or more | 10 (3) |
| Indeterminate findings by cardiac assessment | |
| Mitral valve regurgitation | 18 (6) |
| Inferior vena cava diameter | 16 (5) |
| Left ventricular hypertrophy | 15 (5) |
| Pericardial effusion | 9 (3) |
| Left atrium size | 5 (2) |
| Left ventricle systolic function | 5 (2) |
When HCUE results were analyzed as dichotomous values, positive likelihood ratios ranged from 2.5 to 21, and negative likelihood ratios ranged from 0 to 0.4 (Table 5). Positive and negative likelihood ratios were both sufficiency high and low to respectively increase and decrease by 5‐fold the prior odds of 3 out of 6 cardiac abnormalities: LV systolic dysfunction, moderate or severe MR regurgitation, and moderate or large pericardial effusion. Considering HCUE results as ordinal values for ROC analysis yielded additional diagnostic information (Figure 2). For example, the likelihood ratio of 1.0 (95% CI, 0.42.0) for borderline positive moderate or severe LA enlargement increased to 29 (range, 1362) for extreme positive results. Areas under the ROC curves were 0.9 for 4 out of 6 cardiac abnormalities.
| Clinically Pertinent Cardiac Abnormality by Standard Echocardiography | Prevalence n/total n | Sensitivity* % (95% CI) | Specificity* % (95% CI) | LRpositive*, (95% CI) | LRnegative*, (95% CI) |
|---|---|---|---|---|---|
| |||||
| Left ventricular systolic dysfunction | 80/314 | 85 (7592) | 88 (8392) | 6.9 (4.99.8) | 0.2 (0.10.3) |
| Mitral valve regurgitation, severe | 11/314 | 100 (72100) | 83 (7987) | 5.9 (3.97.4) | 0 (00.3) |
| Left atrium enlargement, moderate or severe | 19/313 | 90 (6799) | 74 (6879) | 3.4 (2.54.3) | 0.1 (0.040.4) |
| Left ventricular hypertrophy, moderate or severe | 33/314 | 70 (5184) | 73 (6778) | 2.5 (1.83.3) | 0.4 (0.20.7) |
| Pericardial effusion, moderate or large | 3/314 | 100 (29100) | 95 (9297) | 21 (6.731) | 0 (00.6) |
| Inferior vena cava, dilated | 45/284 | 56 (4070) | 86 (8190) | 4.0 (2.66.0) | 0.5 (0.40.7) |
LV systolic dysfunction and IVC dilatation were both prevalent enough to meet our criterion to examine interobserver variability; the mean number of abnormal patients per hospitalist was 10 patients for LV systolic dysfunction and 6 patients for IVC dilatation. For LV systolic dysfunction, SDs around mean sensitivity (84%) and specificity (87%) were 12% and 6%, respectively. For IVC dilatation, SDs around mean sensitivity (58%) and specificity (86%) were 24% and 7%, respectively.
Discussion
We found that, after a 27‐hour training program, hospitalists performed HCUE with moderate to excellent diagnostic accuracy for 6 important cardiac abnormalities. For example, hospitalists' assessments of LV systolic function yielded positive and negative likelihood ratios of 6.9 (95% CI, 4.99.8) and 0.2 (95% CI, 0.10.3), respectively. At the bedsides of patients with acute heart failure, therefore, hospitalists could use HCUE to lower or raise the 50:50 chance of LV systolic dysfunction30 to 15% or 85%, respectively. Whether or not these posttest likelihoods are extreme enough to cross important thresholds will depend on the clinical context. Yet these findings demonstrate how HCUE has the potential to provide hospitalists with valuable point‐of‐care data that are otherwise unavailableeither because routine clinical assessments are unreliable31 or because echocardiographic services are not immediately accessible.1
In fact, recent data from the Joint Commission on Accreditation of Healthcare Organizations shows how inaccessible SE may be. Approximately one‐quarter of hospitals in the United States send home about 10% of patients with acute heart failure without echocardiographic assessment of LV systolic function before, during, or immediately after hospitalization.32 In doing so, these hospitals leave unmet the 2002 National Quality Improvement Goal of universal assessment of LV systolic function for all heart failure patients. Hospitalists could close this quality gap with routine, 10‐minute HCUE assessments in all patients admitted with acute heart failure. (Our research HCUE protocol required a median time of 28 minutes, but this included time to assess 5 other cardiac abnormalities and collect data for research purposes). Until the clinical consequences of introducing hospitalist‐performed HCUE are studied, potential benefits like this are tentative. But our findings suggest that training hospitalists to accurately perform HCUE can be successfully accomplished in just 27 hours.
Other studies of HCUE training programs for noncardiologists have also challenged the opinion that learning to perform HCUE requires more than 100 hours of training.2, 711 Yet only 1 prior study has examined an HCUE training program for hospitalists.5 In this study by Martin et al.,5 hospitalists completed 5 supervised HCUE examinations and 6 hours of interpretation training before investigators scored their image acquisition and interpretation skills from 30 unsupervised HCUE examinations. To estimate their final skill levels at the completion of all 35 examinations by accounting for an initially steep learning curve, investigators then adjusted these scores with regression models. Despite these upward adjustments, hospitalists' image acquisition and interpretation scores were low in comparison to echocardiographic technicians and cardiology fellows. Besides these adjusted measurements of hospitalists' skills, however, Martin et al.5 unfortunately did not also report standard measures of diagnostic accuracy, like those proposed by the Standards for Reporting of Diagnostic Accuracy (STARD) initiative.33 Therefore, direct comparisons to the present study are difficult. Nevertheless, their findings suggest that a training program limited to 5 supervised HCUE examinations may be inadequate for hospitalists. In fact, the same group's earlier study of medical trainees suggested a minimum of 30 supervised HCUE examinations.9 We chose to design our hospitalist training program based on this minimum, though they surprisingly did not.5 As others continue to refine the components of hospitalist HCUE training programs, such as the optimal number of supervised examinations, our program could serve as a reasonable comparative example: more rigorous than the program designed by Martin et al.5 but more feasible than ASE level 1 training.
The number and complexity of assessments taught in HCUE training programs will determine their duration. With ongoing advancements in HCUE technology, there is a growing list of potential assessments to choose from. Although HCUE training programs ought to include assessments with proven clinical applications, there are no trials of HCUE‐directed care to inform such decisions. In their absence, therefore, we chose 6 assessments based on the following 3 criteria. First, our assessments were otherwise not reliably available from routine clinical data, such as the physical examination. Second, our assessments were straightforward: easy to learn and simple to perform. Here, we based our reasoning on an expectation that the value of HCUE lies not in highly complex, state‐of‐the‐art assessmentswhich are best left to echocardiographers equipped with SEbut in simple, routine assessments made with highly portable machines that grant noncardiologists newfound access to point‐of‐care data.34 Third, our assessments were clinically pertinent and, where appropriate, defined by cut‐points at levels of severity that often lead to changes in management. We suspect that setting high cut‐points has the salutary effects of making assessments easier to learn and more accurate, because distinguishing mild abnormalities is likely the most challenging aspect of echocardiographic interpretation.35 Whether or not our choices of assessments, and their cut‐points, are optimal has yet to be determined by future research designed to study how they affect patient outcomes. Given our hospitalists' performance in the present study, these assessments seem worthy of such future research.
Our study had several limitations. We studied physicians and patients from only 1 hospital; similar studies performed in different settings, particularly among patients with different proportions and manifestations of disease, may find different results. Nevertheless, our sampling method of prospectively enrolling consecutive patients strengthens our findings. Some echocardiographic measurement methods used by our hospitalists differed in subtle ways from echocardiography guideline recommendations.35 We chose our methods (Table 2) for 2 reasons. First, whenever possible, we chose methods of interpretation that coincided with our local cardiologists'. Second, we chose simplicity over precision. For example, the biplane method of disks, or modified Simpson's rule, is the preferred volumetric method of calculating LA size.35 This method requires tracing the contours of the LA in 2 planes and then dividing the LA volume into stacked oval disks for calculation. We chose instead to train our hospitalists in a simpler method based on 2 linear measurements. Any loss of precision, however, was balanced by a large gain in simplicity. Regardless, minor variations in LA size are not likely to affect hospitalists' bedside evaluations. Finally, we did not validate the results of our reference standard (SE) by documenting interobserver reliability. Yet, because SE is generally accurate for the 6 cardiac abnormalities under study, the effect of this bias should be small.
These limitations can be addressed best by controlled trials of HCUE‐directed care. These trials will determine the clinical impact of hospitalist‐performed HCUE and, in turn, inform our design of HCUE training programs. As the current study shows, training hospitalists to participate in such trials is feasible: like other groups of noncardiologists, hospitalists can accurately perform HCUE after a brief training program. Whether or not hospitalists should perform HCUE requires further study.
Acknowledgements
The authors thank Sonosite, Inc., Bothell, WA, for loaning us 2 MicroMaxx machines throughout the study period. They also thank the staff of the Internal Medicine Research Mentoring Program at Rush Medical College for their technical support and the staff of the Division of Neurology at Stroger Hospital for granting them access to a procedure room.
- .The physical examination of the future: echocardiography as part of the assessment.ACC Curr J Rev.1998;7:79–81.
- ,,.The hand‐carried echocardiographic device as an aid to the physical examination.Echocardiography.2003;20:477–485.
- ,.Bedside ultrasonography in the ICU: Part 2.Chest.2005;128:1766–1781.
- ,.Practical Guide to Emergency Ultrasound.1st ed.Philadelphia, PA:Lippincott Williams 2006.
- ,,,,,.Hospitalist performance of cardiac hand‐carried ultrasound after focused training.Am J Med.2007;120:1000–1004.
- ,,, et al.Hand‐carried cardiac ultrasound (HCU) device: recommendations regarding new technology. A report from the echocardiography task force on new technology of the Nomenclature and Standards Committee of the American Society of Echocardiography.J Am Soc Echocardiogr.2002;15:369–373.
- ,,,,,.The use of small personal ultrasound devices with internists without formal training in echocardiography.Eur J Echocardiogr.2003;4:141–147.
- ,,, et al.Feasibility of point‐of‐care echocardiography by internal medicine house staff.Am Heart J.2004;147:476–481.
- ,,,,,.The rate at which residents learn to use hand‐held echocardiography at the bedside.Am J Med.2005;118:1010–1018.
- ,,, et al.Comparison of effectiveness of hand‐carried ultrasound to bedside cardiovascular physical examination.Am J Cardiol.2005;96:1002–1006.
- ,,.Can hand‐carried ultrasound devices be extended for use by the noncardiology medical community?Echocardiography.2003;20:471–476.
- ,,, et al.A hospitalist‐run short stay unit: features that predict patients' length‐of‐stay and eventual admission to traditional inpatient services.J Hosp Med.2009;4:276–284.
- .Adult echocardiography scanning protocol. In: Templin BB, ed.Ultrasound Scanning: Principles and Protocols.2nd ed.Philadelphia, PA:Saunders;1999:426.
- ,,, et al.ACCF 2008 Recommendations for training in adult cardiovascular medicine core cardiology training (COCATS 3) (revision of the 2002 COCATS training statement).J Am Coll Cardiol.2008;51:333–414.
- ,,.The Echo Manual.2nd ed.Philadelphia, PA:Lippincott Williams 1999.
- ,,, et al.Echocardiography in serial evaluation of left ventricular systolic and diastolic function: importance of image acquisition, quantitation, and physiologic variability in clinical and investigational applications.J Am Soc Echocardiogr.1991;4:203–214.
- .Textbook of Clinical Echocardiography.3rd ed.Philadelphia, PA:Elsevier Saunders;2004.
- ,,.Likelihood ratios with confidence: sample size estimation for diagnostic test studies.J Clin Epidemiol.1991;44:763–770.
- ,,, et al.ACC/AHA 2005 guideline update for the diagnosis and management of chronic heart failure in the adult: a report of the American College of Cardiology/American Heart Association Task Force on Practice Guidelines.Circulation.2005;112;154–235.
- ,,, et al.ACC/AHA 2006 guidelines for the management of patients with valvular heart disease: a report of the American College of Cardiology/American Heart Association Task Force on Practice Guidelines.Circulation.2006;114:e84–e231.
- ,,, et al.Left atrial size: physiologic determinants and clinical applications.J Am Coll Cardiol.2006;47:2357–2363.
- ,,,,.Prognostic implications of echocardiographically determined left ventricular mass in the Framingham Heart Study.N Engl J Med.1990;322:1561–1566.
- ,,,.Does this patient with a pericardial effusion have cardiac tamponade?JAMA.2007;297:1810–1818.
- .Acute cardiac tamponade.N Engl J Med.2003;349:685–690.
- ,,,,,.Evaluation of size and dynamics of the inferior vena cava as an index of right‐sided cardiac function.Am J Cardiol.1984;53:579–585.
- ,,.The influence of uninterpretability on the assessment of diagnostic tests.J Chronic Dis.1986;39:575–584.
- ,,.Relations between effectiveness of a diagnostic test, prevalence of the disease, and percentages of uninterpretable results. An example in the diagnosis of jaundice.Med Decis Making.1982;2:285–297.
- .Confidence intervals for the ratio of two binomial proportions.Biometrics.1984;40:513–517.
- ,,.Comparing the areas under two or more correlated receiver operating curves: a nonparametric approach.Biometrics.1988;44:837–845.
- ,,, et al.Systolic blood pressure at admission, clinical characteristics, and outcomes in patients hospitalized with acute heart failure.JAMA.2006;296:2217–2226.
- ,,, et al.Utility of history, physical examination, electrocardiogram, and chest radiograph for differentiating normal from decreased systolic function in patients with heart failure.Am J Med.2002;112:437–445.
- Joint Commission on Accreditation of Healthcare Organizations. Health Care Quality Data Download Website. Available at: http://www.healthcarequalitydata.org. Accessed December2008.
- ,,, et al.Towards complete and accurate reporting of studies of diagnostic accuracy: the STARD initiative.Clin Chem.2003;49:1–6.
- ,,.Will disruptive innovations cure health care?Harv Bus Rev.2000;78:102–112.
- ,,, et al.Recommendations for chamber quantification: a report from the American Society of Echocardiography's Guidelines and Standards Committee and the Chamber Quantification Writing Group, developed in conjunction with the European Association of Echocardiography, a branch of the European Society of Cardiology.J Am Soc Echocardiogr.2005;18:1440–1463.
Copyright © 2009 Society of Hospital Medicine
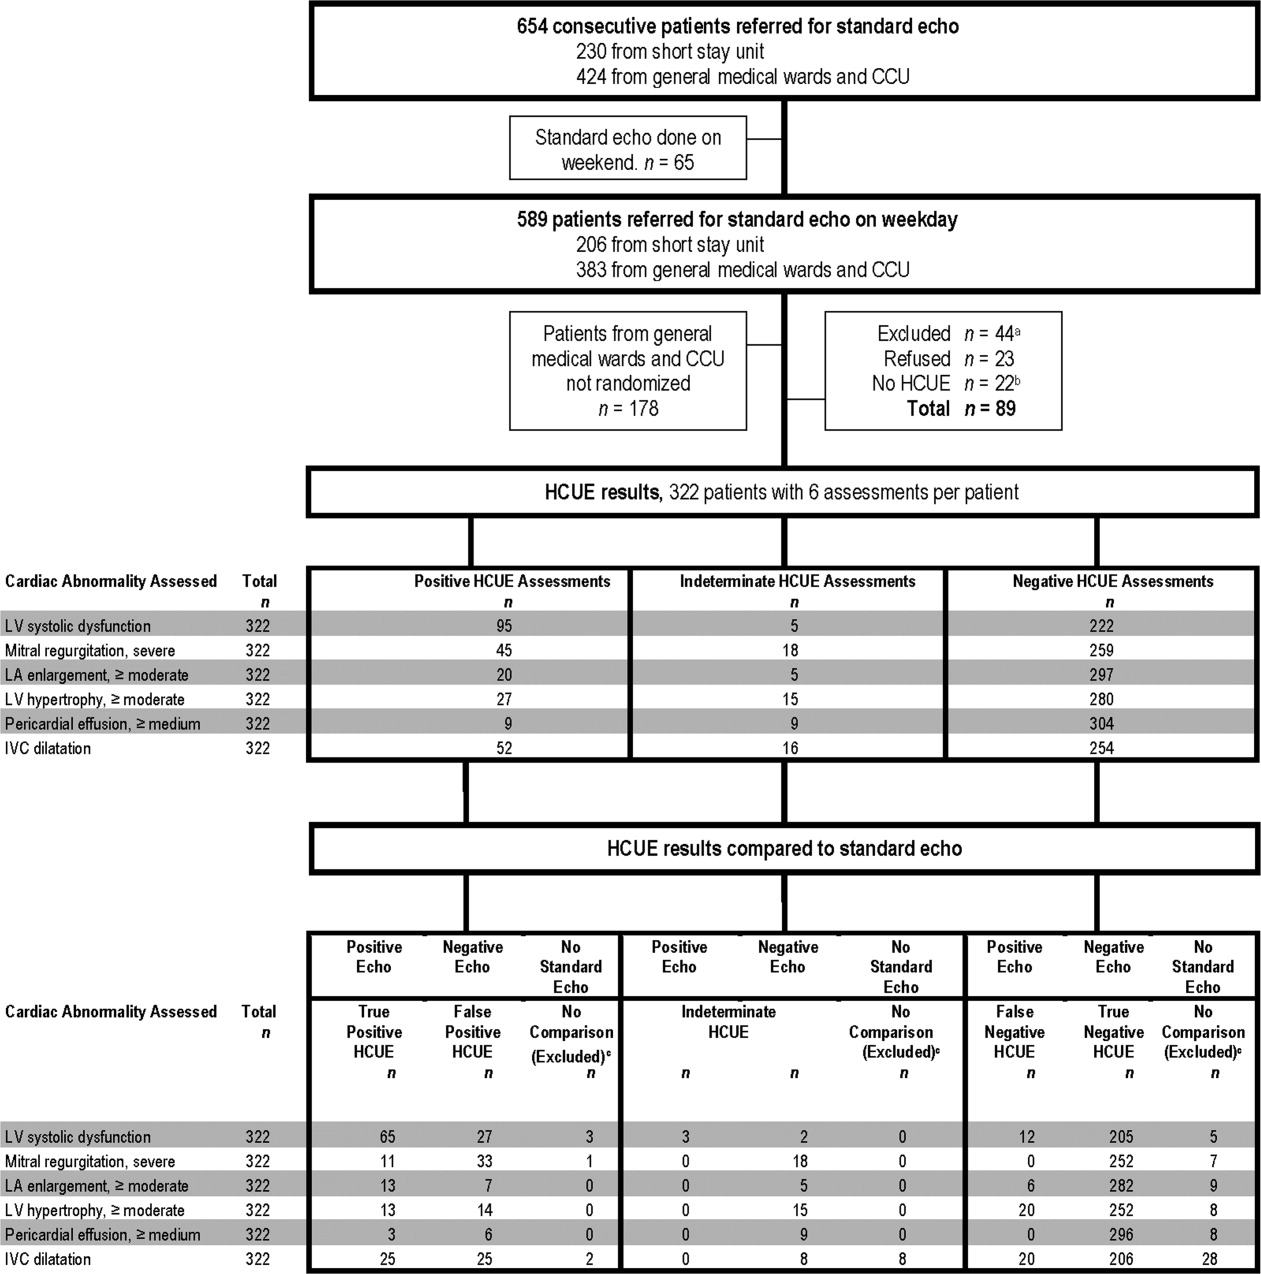
Hospitalist‐Run Short‐Stay Unit
Short‐stay units (SSUs) are common alternatives to traditional inpatient services.1 When defined broadly to include observation units for low‐risk chest pain patients, SSUs exist in one‐third of hospitals in the United States.2 Amidst growing demands for inpatient services, SSUs have recently developed beyond observation medicine to provide more complex inpatient services in locations commonly adjacent to emergency departments (EDs).1 Hospitalists are well‐positioned to staff these emerging SSUs because of their expertise in managing complex inpatient services.3
Despite this, we found only 3 reports of hospitalist‐run SSUs designed for general medical inpatients (2 from Spain and 1 from Canada).46 Whereas these early reports introduce hospitalist‐run SSUs, they provide limited data to make firm conclusions about their usefulness or appropriate design. For example, none of these reports assessed patients' characteristics upon admission. Nor did they provide details about the services that the SSUs provided. Yet evaluation of both types of patient‐level datadescriptions of patients' needs upon admission and how these needs are met during their staysdetermine whether or not hospitalist‐run SSUs meet their potential to efficiently care for backlogs of patients who otherwise await admission to traditional inpatient services.
In order to further explore these issues, we first sought to characterize our SSU patients upon admission and record what services they received during their stays. To help interpret our results, we then investigated associations between these characteristics and measures of successfully caring for patients in our SSU.
Patients and Methods
Design and Setting
In this prospective cohort study, we included all patients admitted to the hospitalist‐run SSU of Cook County Hospital, a 500‐bed public teaching hospital in Chicago, Illinois, from January through April of 2006. Our 14‐bed SSU opened in 2002 to reduce overcrowding on the traditional inpatient wards by admitting adult patients who require inpatient care but might be eligible for discharge within 3 days. The unit is geographically part of the ED but is staffed by resident physicians and a rotating group of hospitalist attending physicians from the Department of Medicine. At least 1 attending and resident physician are available throughout the day, including weekend days and holidays; evenings are covered by a resident who presents overnight admissions to an attending physician the following morning.
ED physicians admit general medical patients to the SSU 24 hours per day, 7 days per week. Though admissions do not require prior approval from SSU physicians, the Departments of Medicine and Emergency Medicine have collaboratively promoted 5 suggested admission‐location guidelines to admitting ED physicians (Figure 1). For candidate SSU patients, these 5 guidelines are not intended to be restrictive but to provide a framework for the complex decision‐making process that our ED physicians encounter, particularly during periods of extreme overcrowding.7 First, patients should have an anticipated stay shorter than 72 hours. Second, patients should not have an eventual need for admission to traditional inpatient services such as the general medicine wards or intensive care units; this guideline is intended to improve patient safety by reducing unnecessary handoffs between physicians.8 Third, patients with provisional cardiovascular diagnoses should be preferentially admitted to the SSU over the general medical wards; this guideline is intended to improve hospital‐wide efficiency because our SSU is equipped with continuous telemetry monitors, an exercise treadmill testing (ETT) laboratory, and other reserved cardiac tests (see Admission Characteristics and Services Received section, below). Fourth, patients' risk should be no higher than intermediate level. Admitting ED physicians are encouraged to use posted risk estimators for patients with provisional diagnoses of possible acute coronary syndrome (ACS), decompensated heart failure, asthma exacerbation, and out‐of‐control diabetes. Finally, patients should not need advanced ancillary services; these include bedside procedures (eg, central venous catheter insertions), time‐intensive nursing (eg, regular dressing changes), and complex social‐services (eg, long‐term care facility placements).
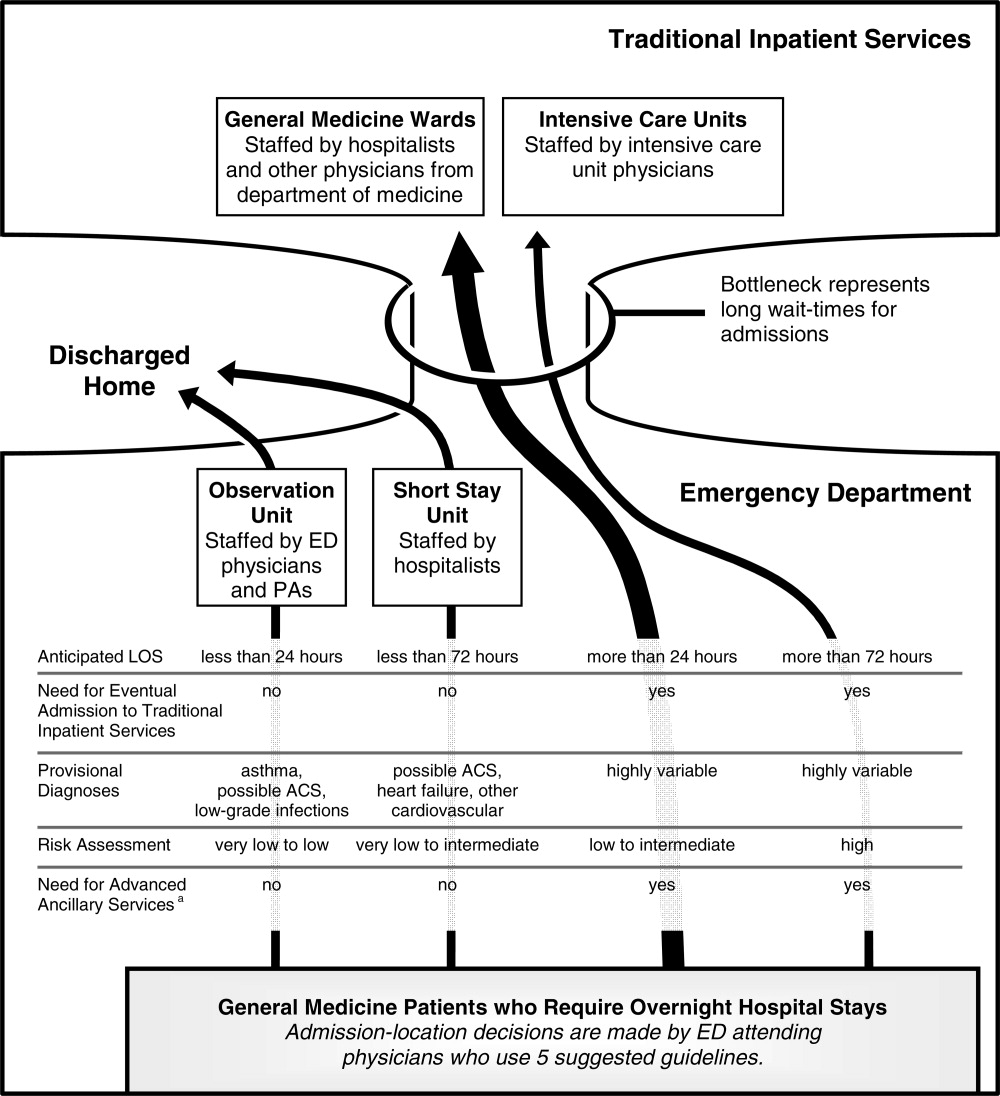
Subjects
The study subjects were all patients admitted to the SSU during the 4‐month study period. Patients were excluded from the entire study if they refused verbal consent to participate. All patients who consented were included in the description of patient admission characteristics. Thirteen patients who prematurely left the SSU against medical advice, however, were neither included in the descriptions of services received nor in the analyses of predictors of successful SSU stays. We excluded these patients because they needed services that they did not receiveincluding these patients in our analysis would tend to overestimate the efficiency of our SSU by shortening the length‐of‐stay (LOS) without adding diagnostic tests or treatments.
Data Collection
After receiving approval from the institutional review board, attending physician investigators conducted an interview, physical examination, and review of medical records for each enrolled patient within 12 hours of admission to the SSU. When ED attending physicians' provisional primary diagnoses included possible ACS or decompensated heart failure, which we knew from earlier pilot data were our 2 most common provisional diagnoses, investigators gathered patient data to be applied in validated models of risk after the study period (Figure 2).9, 10 Some of the clinical predictors required for these models are based on patients' findings on presentation to the ED. For example, Goldman's risk model for major cardiac events uses patients' initial systolic blood pressures on presentation to the ED.9 In such cases, investigators gathered needed data from electronic and paper charts generated in the ED. Upon discharge from the SSU, investigators reviewed patients' medical records a second time. All data were entered by investigators and instantly committed into an online database.
Admission Characteristics and Services Received
Patients were grouped according to the provisional diagnoses of ED attending physicians upon admission to the SSU (Figure 2). We chose to group patients by the provisional diagnoses of EDnot SSUattending physicians to better understand how ED physicians, the physicians who make the admission‐location decisions in our hospital, were using the SSU. Patients were first grouped as having possible ACS or heart failure, because patients with these provisional diagnoses were preferentially admitted to the SSU (Figure 1). When neither diagnosis was listed, patients were grouped according to ED attending physicians' first‐listed diagnoses. At the end of the study period, relevant risk models were applied to patients with possible ACS or heart failure and stratified as very low, low, intermediate, or high risk.9, 10 Patients with both possible ACS and heart failure were grouped according to the diagnosis with the highest corresponding risk assessment; if both risk assessments were the same, then the first‐listed diagnosis was used. Though developed to predict different clinical outcomes during different time periods, risk strata from the corresponding risk models were pooled across both diagnoses to develop a risk summary.
Upon discharge, investigators recorded which advanced diagnostic tests, specialty consultations, and acute care treatments patients received while in the SSU. Diagnostic tests were considered advanced if they were not routinely performed within 2 hours of being ordered. Advanced diagnostic tests were grouped into 2 types by their accessibility to ordering SSU physicians. Open access tests included echocardiograms and ETTs, which were reserved for SSU patients 6 days per week. Though the availability of open access tests was not unlimited, ordering physicians' needs for them rarely exceeded the immediate supply. On the other hand, limited access tests included both cardiac stress imaging studies, which were reserved for SSU patients on a very limited basis 4 or 5 days per week, and other tests that were not reserved for SSU patients, such as endoscopy, magnetic resonance imaging, or ultrasonography. Ordering physicians' needs for limited access tests often exceeded their immediate supply; in such cases, SSU patients were placed without priority into queues that included patients from the entire hospital.
Investigators recorded when patients received advanced diagnostic tests that were ordered by specialists. These tests, however, were not included in analyses of how services received by SSU patients affected SSU success, because SSU attending physicians were only indirectly involved in whether or not patients received these tests. Treatments were considered acute care treatments if they were commonly administered only in acute care settings, such as heparin for unstable angina or intravenous furosemide for pulmonary edema.
SSU Success
The SSU was designed to care for patients during brief stays and without eventual admission to traditional inpatient services. Therefore, we used patients' LOS and whether or not patients were admitted to traditional inpatient services as measures of SSU success. LOS was calculated from the time patients arrived in the SSU until the time they left. Therefore, neither time spent in the ED before admission to the SSU nor time spent on traditional inpatient services (if needed) contributed to our definition of LOS. Individual SSU patients were considered successfully cared for in the SSU if their LOS was less than 72 hours and they were discharged directly home from the SSU. We explored associations between these outcomes and provisional diagnoses, risk assessments, and services received.
Data Analysis
LOS data were right‐skewed; therefore, we used the Mann‐Whitney test for comparisons between 2 groups and the Kruskal‐Wallis test for comparisons among 3 or more groups. To test for trends of median LOS among ordered groupings, we used the method of Cuzick.11 We used Pearson's chi‐square test to compare proportions of patients grouped into categories and the chi‐square test for trends with equal scoring to test for trends among ordered groupings.
We performed multiple logistic regression to explore which variables were associated with SSU success. The following 5 demographic variables from Table 1 were insignificant in all single‐variable and multiple‐variable regression models that we tested and were, therefore, removed from further analyses to create more parsimonious models: gender, language, ethnicity, race, and whether or not patients had a primary care provider. Our multiple logistic regression models were fitted by maximum likelihood methods. In all of these models, odds ratios (ORs) were adjusted for patient characteristics that included age (in years), insulin‐requiring diabetes mellitus (yes or no), SSU attending physician, day of the week of SSU admission (weekday or weekend), and hospitalization during the preceding year. Confidence intervals (CIs) for predicted probabilities were computed using the delta method. All analyses were conducted with Stata Statistical Software, Release 9 (StataCorp, College Station, TX).
| |
| Mean age, years (SD) (25th‐75th percentiles) | 58 (12) (49‐66) |
| Men | 389 (52) |
| Lacking a primary care provider | 256 (34) |
| Non‐English speaking | 217 (29) |
| Ethnicity is Hispanic or Latino | 105 (14) |
| Race is Black or African‐American | 480 (64) |
| Hospitalized within the preceding year | 322 (43) |
| Insulin‐requiring diabetes mellitus | 83 (11) |
| Previous coronary artery revascularization | 89 (12) |
| Provisional diagnosis* | |
| Possible acute coronary syndrome | 427 (57) |
| Heart failure | 214 (29) |
| Other cardiovascular | 62 (8) |
| Noncardiovascular | 48 (6) |
Results
Subjects
During the 4‐month study period, 755 patients were admitted to the SSU. Among these patients, 4 were excluded from our study because they refused verbal consent. In the remaining study sample of 751 patients, all were included in the descriptions of patients' admission characteristics (Table 1), but 13 patients who left prematurely were excluded in both the descriptions of services received (Table 2) and the analyses of SSU success (Tables 3 and 4).
| Service received | Possible ACS n = 418 (%) | Heart Failure n = 211 (%) | Other Cardiovascular n = 61 (%) | Noncardiovascular n = 48 (%) | Total n = 738 (%) |
|---|---|---|---|---|---|
| |||||
| Open access test* | 37 | 59 | 56 | 13 | 43 |
| Resting | |||||
| Echocardiography | 29 | 59 | 56 | 13 | 39 |
| ETT | 12 | 0 | 5 | 0 | 7 |
| Limited access test | 24 | 8 | 10 | 8 | 17 |
| Stress imaging | 21 | 5 | 7 | 2 | 14 |
| Acute care treatment | 22 | 78 | 5 | 60 | 39 |
| Specialty consultation∥ | 24 | 12 | 20 | 8 | 19 |
| Any above service | 68 | 93 | 67 | 69 | 75 |
| Provisional Diagnosis and Services Received | n | Median LOS [hours (IQR)] | Stay Longer than 72 Hours (%) | Admission to Traditional Inpatient Service (%) | Stay Longer than 72 Hours or Admission to Traditional Inpatient Service (%) |
|---|---|---|---|---|---|
| |||||
| All patients | 738 | 42 (22‐63) | 15 | 9* | 21 |
| Possible ACS | 418 | 37 (20‐57) | 13 | 10 | 20 |
| Heart failure | 211 | 47 (34‐69) | 21 | 9 | 27 |
| Other CV | 61 | 40 (21‐49) | 10 | 5 | 11 |
| Non‐CV | 48 | 40 (22‐60) | 10 | 2 | 13 |
| P value | <0.001 | 0.04 | 0.18 | 0.01 | |
| Open access test | |||||
| Yes | 320 | 46 (31‐67) | 17 | 9 | 23 |
| No | 418 | 33 (20‐52) | 13 | 9 | 20 |
| P value | <0.001 | 0.15 | 0.87 | 0.43 | |
| Limited access test | |||||
| Yes | 128 | 51 (42‐82) | 31 | 6 | 33 |
| No | 610 | 38 (21‐55) | 12 | 10 | 19 |
| P value | <0.001 | <0.001 | 0.24 | <0.001 | |
| Acute care treatment | |||||
| Yes | 287 | 46 (34‐69) | 21 | 12 | 29 |
| No | 451 | 32 (20‐50) | 11 | 7 | 16 |
| P value | <0.001 | <0.001 | 0.01 | <0.001 | |
| Specialty consultation | |||||
| Yes | 141 | 63 (40‐92) | 38 | 28 | 52 |
| No | 597 | 38 (21‐50) | 10 | 5 | 14 |
| P value | <0.001 | <0.001 | <0.001 | <0.001 | |
| Any above service | |||||
| Yes | 554 | 46 (29‐68) | 19 | 10 | 26 |
| No | 184∥ | 22 (16‐32) | 2 | 5 | 7 |
| P value | <0.001 | <0.001 | 0.03 | <0.001 | |
| Stay Longer than 72 Hours | Admission to Traditional Inpatient Service | Either Outcome | ||||
|---|---|---|---|---|---|---|
| OR* | P value | OR* | P value | OR* | P value | |
| ||||||
| Heart failure | 2.3 | 0.01 | 1.1 | 0.77 | 1.9 | 0.02 |
| Service received | ||||||
| Open access test | 1.5 | 0.10 | 1.0 | 0.89 | 1.2 | 0.32 |
| Limited access test | 5.1 | <0.001 | 0.4 | 0.03 | 2.5 | <0.001 |
| Acute care treatment | 1.7 | 0.07 | 1.4 | 0.31 | 1.6 | 0.05 |
| Specialty consultation | 6.1 | <0.001 | 13.1 | <0.001 | 8.1 | <0.001 |
Admission Characteristics and Services Received
A narrow range of provisional diagnoses were listed by ED attending physicians and 641 patients (85% of 751) were grouped as having possible ACS or heart failure (Figure 2). Patients with these diagnoses were later risk‐stratified and, when pooled across risk strata, only 14 patients (2% of 641) exceeded the suggested admission‐location criterion for the SSU of lower than high risk. Despite the array and frequency of diagnostic and treatment services that patients received, SSU physicians worked mostly independently, requesting specialty consultations for only 19% of patients (141/738; Table 2).
SSU Success
The median LOS for all patients was 42 hours (interquartile range [IRQ] 22‐63) and 156 patients (21% of 738) had unsuccessful SSU stays (Table 3). The most common reason for an unsuccessful stay was a stay longer than 72 hours (71% of 156). Among the 66 patients who required admission to traditional inpatient services, nearly one‐half (48%) were admitted expressly to receive treatments not available in the SSU after having a specialty consult.
Patients' provisional diagnoses were associated with unsuccessful stays in bivariate analyses (Table 3). In addition, when patients were grouped into 3 risk stratums (very‐low, low, and intermediate‐and‐high), unsuccessful stays increased with increasing risk. For example, in patients with possible ACS, the proportion of unsuccessful stays increased from 17% of 306 very‐low risk patients to 27% of 55 intermediate‐and‐high risk patients (P value for trend = 0.012. Similarly, in patients with heart failure, the proportion of unsuccessful stays increased from 25% of 181 very‐low risk patients to 100% of 3 intermediate‐and‐high risk patients (P value for trend = 0.004).
However, in multiple variable models that simultaneously included patients' characteristics upon admission with services received during their SSU stay, only the provisional diagnosis of heart failure was associated with unsuccessful stays (OR, 1.9; 95% CI, 1.12‐3.18); risk assessments for possible ACS (P = 0.29) and heart failure (P = 0.32) were unimportant predictors of unsuccessful stays (Table 4). On the other hand, whether or not patients received diagnostic tests, acute care treatments, or specialty consultations were important predictors. In particular, patients who received specialty consultations were much more likely to require admission to traditional inpatient services than those patients who did not (OR, 13.1; 95% CI, 6.9‐24.9) and had a 52% chance of having an unsuccessful stay (95% CI, 42‐61%; Figure 3). In addition, the accessibility of a diagnostic test was inversely proportional to the chance of having a long stay; patients who received an open access test had a 12% chance of a long stay (95% CI, 8‐16%) whereas those who received a limited access test had a 29% chance of a long stay (95% CI, 20‐39%). Receiving acute care treatments was also a significant, though less important, predictor of an unsuccessful stay (Table 4).
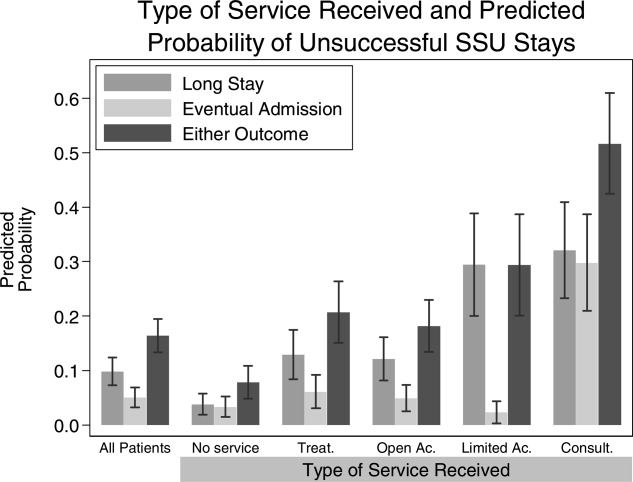
Discussion
We found that the types of services received by patients during their SSU stays were stronger predictors of long stays and eventual admissions to traditional inpatient services than patients' characteristics upon admission to the SSU. This suggests that SSUs should be focused toward matching patients' anticipated needs with readily accessible services. For example, in our SSU, which cares for over 2,250 patients annually, more than 1,200 patients will receive diagnostic tests in a given year. Among these patients, those who receive a limited access test will be more than twice as likely to have long stays than those who receive an open access test (Figure 3). Though our conclusions may not be applicable to other settings, this study is the most comprehensive description of patients admitted to a hospitalist‐run SSU. In addition, our study is the first to demonstrate that diagnostic and consultative services are the most important predictors of successful stays in SSUs. This promotes the practical strategy that hospitalists who staff SSUs should focus administratively toward gaining access to these services.
Very few of our SSU patients did not fulfill the suggested requirements of our admission location guidelines. For example, only 2% of 691 patients with either possible ACS or heart failure were high risk (Figure 2). Despite this, 21% of our patients had stays longer than 72 hours or were admitted to traditional inpatient services. The paradoxically high proportion of unsuccessful stays among mostly very‐low and low risk patients simply reflects how the clinical risk models that we used were not designed to predict unsuccessful stays. Moreover, as our multiple variable models suggest, improvements in the selection process of candidate SSU patients are more likely to come from an ability to incorporate assessments of what services patients will receive rather than from assessments of their clinical risk (Table 4). Therefore, the immediate plans of the accepting SSU physicians, the physicians who will determine what services patients eventually receive, should be incorporated in the admission‐location decision process.
Three of our findings highlight how input from accepting SSU physiciansconveyed to ED physicians before their final admission‐location decisions are mademay improve the SSU patient selection process. First, 23% of our patients were discharged home after brief stays with no advanced tests, specialty consultations, or acute care treatments (Table 3). Though some of these patients may have required inpatient services other than the ones we recorded, most were admitted with very‐low risk possible ACS; if they required overnight stays at all, many of them may have been better cared for in the ED observation unit (Figure 1). Second, 74% of the patients who required admission to traditional inpatient services were admitted for services not readily available to patients in the SSU (Table 3). Among these patients, nearly one‐third (21/66) received no advanced diagnostic tests in the SSU. This suggests that these patients should have been admitted directly to the general medical wards; doing so may have improved efficiency and quality of care by reducing unnecessary handoffs between physicians. Both types of patientsthose with minimal inpatient needs and those with more needs than the SSU can providehighlight how incorporating accepting SSU physicians' plans may improve the SSU patient selection process. After all, those best equipped to determine if the SSU will meet (or exceed) the needs of candidate patients are the SSU physicians themselves.
Third, we found that whether or not SSU physicians required assistance from specialists was the strongest predictor of unsuccessful stays: when an accepting physician determined that a patient should receive a specialty consultation, that patient's chance of having an unsuccessful stay was over 50% (Figure 3). Our study was not designed to determine how specialty consultations were associated with unsuccessful stays. We did not, for example, record whether or not hospitalists changed their diagnostic, treatment, or admission plans because of specialists' recommendations.12 Therefore, we cannot conclude that specialty consultations actually caused long stays or traditional admissions. Nevertheless, when our SSU physicians did not manage patients independent of specialty consultations, we observed a high likelihood of unsuccessful stays. Because accepting SSU physicians are the ones who will determine whether or not they need assistance from specialists, weighing their immediate plans for specialty consultations into the admission‐location decision process may improve the efficiency of SSUs. Others have recognized the importance of specialty consultations in SSUs by directly incorporating specialists as coattending physicians.13
Our study had several limitations. First, we studied mostly patients with cardiovascular diagnoses. Predictors of success in SSUs that admit patients with different diagnostic profiles may be different. In particular, SSUs that admit patients with a wide array of diagnoses may find that matching patients' needs with readily accessible services is impractical, because these needs may be too wide‐ranging. Second, our study design was observational. However, other than seasonal variations in admission patterns, there was little room for selection bias because we enrolled all consecutive admissions over the 4‐month study period, which gives us more confidence in our results. Third, our study did not record whether or not ED physicians knowingly overrode the suggested admission‐location guidelines because of limited bed availability. Yet, if shortages of beds on traditional inpatient services were driving patients who were otherwise candidates for the general medical wards in to the SSU, then we would have expected higher‐risk patients and greater needs for limited access tests. Finally, our descriptions of patients' needs were based on what diagnostic, consultative, and treatment services patients actually received; yet these needs did not include diagnostic tests that were ordered but never performed. However, any missed needs would bias our results toward no association with unsuccessful stays, because unsuccessful stays would generally increase while patients await needed services.
Future research could address these limitations through an experimental trial of traditional admissions versus admission to a hospitalist‐run SSU. And, because hospitals are complex systems of health care delivery where changes in one patient care unit often affect others in unanticipated ways,14 the impact of SSUs on other patient care units that are closely connected to SSUs, such as EDs and the general medical wards (Figure 1), should be simultaneously observed. For example, though our findings suggest that the accessibility of diagnostic tests should parallel ordering SSU physicians' needs for those tests, making all diagnostic tests open to SSU physicians may result in shortsightedly lengthening the stays of patients in other care units. Future research should also observe the decision‐making process of both the physicians who make admission‐location decisions (ED physicians) and those who determine the eventual plans for patients in the SSU (hospitalists). Accepting physicians from other patient care units have found improved outcomes of efficiency when they were involved in the complex process of deciding where to admit patients.15, 16 After an initial evaluation of a candidate SSU patient in the ED, a hospitalist who staffs both the general medical wards and the SSU would be uniquely well‐positioned to help an ED physician decide where a patient's needs would be best met. Although ED physicians will rightly be concerned that consulting SSU hospitalists may slow patient flow, hands‐on consultations of candidate SSU patients, who have a narrow range of diagnoses and low‐risk profiles, would likely be brief. In addition, because many SSUs are conveniently adjacent to EDs, the burden of communication may be minor.1 To address these questions, hospitalists who staff SSUs must continue the observed trend of working collaboratively with ED physicians.15, 17, 18
Acknowledgements
The authors thank Arthur T. Evans and Brendan M. Reilly for their insightful review of the manuscript. The authors also thank Zhaotai Cui for his assistance with statistical programming.
- ,,.A paradigm shift in the nature of care provision in emergency departments.Emerg Med J.2004;21:681–684.
- ,,.Acute coronary syndromes. In: Marx J, Hockberger R, Walls R, eds.Rosen's emergency medicine. Concepts and clinical practice.6th ed.Edinburgh:Mosby Elsevier;2006:1154–1199.
- .Taking charge of observation units for better patient flow.Todays Hospitalist Mag.2007;5(7):16–20.
- ,,, et al.Unidad de corta estancia dependiente de Medicina Interna.An Med Interna.1999;16:504–510.
- ,,,,.Factors that predict unplanned hospital readmission of patients discharged from a short stay medical unit.An Med Interna.2002;19:221–225.
- ,,, et al.Program description: a hospitalist‐run, medical short‐stay unit in a teaching hospital.CMAJ.2000;163(11):1477–1480.
- ,,,.Triage of patients with chest pain in the emergency department: a comparative study of physicians' decisions.Am J Med.2002;112:95–103.
- ,,.Gaps in the continuity of care and progress on patient safety.BMJ.2000;320:791–794.
- ,,, et al.Prediction of the need for intensive care in patients who come to emergency departments with acute chest pain.N Engl J Med.1996;334:1498–1504.
- ,,, et al.Risk stratification for in‐hospital mortality in acutely decompensated heart failure.JAMA.2005;293:572–580.
- .A Wilcoxon‐type test for trend.Stat Med.1985;4:87–90.
- ,,,,,.Diagnostic test restraint and the specialty consultation.J Gen Intern Med.1990;5:95–103.
- ,,, et al.A cooperative care model: cardiologists and hospitalists reduce length of stay in a chest pain observation unit.Crit Pathw Cardiol.2005;4:55–58.
- ,.Average length of stay, delayed discharge, and hospital congestion.BMJ.2002;325:610–611.
- .An internist in the emergency department: the IM facilitator program.HMO Pract.1991;10:42–43.
- ,,, et al.A “closed” medical intensive care unit (MICU) improves resource utilization when compared with an “open” MICU.Am J Respir Crit Care Med.1998;157:1468–1473.
- .Hospitalists' new role in the ED: “clog busters.”Todays Hospitalist Mag.2005;3(8):15–18.
- .Kindred spirits: ED doctors, hospitalists forge a critical collaboration.Hospitalist.2007;11(7):1,16–20.
Short‐stay units (SSUs) are common alternatives to traditional inpatient services.1 When defined broadly to include observation units for low‐risk chest pain patients, SSUs exist in one‐third of hospitals in the United States.2 Amidst growing demands for inpatient services, SSUs have recently developed beyond observation medicine to provide more complex inpatient services in locations commonly adjacent to emergency departments (EDs).1 Hospitalists are well‐positioned to staff these emerging SSUs because of their expertise in managing complex inpatient services.3
Despite this, we found only 3 reports of hospitalist‐run SSUs designed for general medical inpatients (2 from Spain and 1 from Canada).46 Whereas these early reports introduce hospitalist‐run SSUs, they provide limited data to make firm conclusions about their usefulness or appropriate design. For example, none of these reports assessed patients' characteristics upon admission. Nor did they provide details about the services that the SSUs provided. Yet evaluation of both types of patient‐level datadescriptions of patients' needs upon admission and how these needs are met during their staysdetermine whether or not hospitalist‐run SSUs meet their potential to efficiently care for backlogs of patients who otherwise await admission to traditional inpatient services.
In order to further explore these issues, we first sought to characterize our SSU patients upon admission and record what services they received during their stays. To help interpret our results, we then investigated associations between these characteristics and measures of successfully caring for patients in our SSU.
Patients and Methods
Design and Setting
In this prospective cohort study, we included all patients admitted to the hospitalist‐run SSU of Cook County Hospital, a 500‐bed public teaching hospital in Chicago, Illinois, from January through April of 2006. Our 14‐bed SSU opened in 2002 to reduce overcrowding on the traditional inpatient wards by admitting adult patients who require inpatient care but might be eligible for discharge within 3 days. The unit is geographically part of the ED but is staffed by resident physicians and a rotating group of hospitalist attending physicians from the Department of Medicine. At least 1 attending and resident physician are available throughout the day, including weekend days and holidays; evenings are covered by a resident who presents overnight admissions to an attending physician the following morning.
ED physicians admit general medical patients to the SSU 24 hours per day, 7 days per week. Though admissions do not require prior approval from SSU physicians, the Departments of Medicine and Emergency Medicine have collaboratively promoted 5 suggested admission‐location guidelines to admitting ED physicians (Figure 1). For candidate SSU patients, these 5 guidelines are not intended to be restrictive but to provide a framework for the complex decision‐making process that our ED physicians encounter, particularly during periods of extreme overcrowding.7 First, patients should have an anticipated stay shorter than 72 hours. Second, patients should not have an eventual need for admission to traditional inpatient services such as the general medicine wards or intensive care units; this guideline is intended to improve patient safety by reducing unnecessary handoffs between physicians.8 Third, patients with provisional cardiovascular diagnoses should be preferentially admitted to the SSU over the general medical wards; this guideline is intended to improve hospital‐wide efficiency because our SSU is equipped with continuous telemetry monitors, an exercise treadmill testing (ETT) laboratory, and other reserved cardiac tests (see Admission Characteristics and Services Received section, below). Fourth, patients' risk should be no higher than intermediate level. Admitting ED physicians are encouraged to use posted risk estimators for patients with provisional diagnoses of possible acute coronary syndrome (ACS), decompensated heart failure, asthma exacerbation, and out‐of‐control diabetes. Finally, patients should not need advanced ancillary services; these include bedside procedures (eg, central venous catheter insertions), time‐intensive nursing (eg, regular dressing changes), and complex social‐services (eg, long‐term care facility placements).
Subjects
The study subjects were all patients admitted to the SSU during the 4‐month study period. Patients were excluded from the entire study if they refused verbal consent to participate. All patients who consented were included in the description of patient admission characteristics. Thirteen patients who prematurely left the SSU against medical advice, however, were neither included in the descriptions of services received nor in the analyses of predictors of successful SSU stays. We excluded these patients because they needed services that they did not receiveincluding these patients in our analysis would tend to overestimate the efficiency of our SSU by shortening the length‐of‐stay (LOS) without adding diagnostic tests or treatments.
Data Collection
After receiving approval from the institutional review board, attending physician investigators conducted an interview, physical examination, and review of medical records for each enrolled patient within 12 hours of admission to the SSU. When ED attending physicians' provisional primary diagnoses included possible ACS or decompensated heart failure, which we knew from earlier pilot data were our 2 most common provisional diagnoses, investigators gathered patient data to be applied in validated models of risk after the study period (Figure 2).9, 10 Some of the clinical predictors required for these models are based on patients' findings on presentation to the ED. For example, Goldman's risk model for major cardiac events uses patients' initial systolic blood pressures on presentation to the ED.9 In such cases, investigators gathered needed data from electronic and paper charts generated in the ED. Upon discharge from the SSU, investigators reviewed patients' medical records a second time. All data were entered by investigators and instantly committed into an online database.
Admission Characteristics and Services Received
Patients were grouped according to the provisional diagnoses of ED attending physicians upon admission to the SSU (Figure 2). We chose to group patients by the provisional diagnoses of EDnot SSUattending physicians to better understand how ED physicians, the physicians who make the admission‐location decisions in our hospital, were using the SSU. Patients were first grouped as having possible ACS or heart failure, because patients with these provisional diagnoses were preferentially admitted to the SSU (Figure 1). When neither diagnosis was listed, patients were grouped according to ED attending physicians' first‐listed diagnoses. At the end of the study period, relevant risk models were applied to patients with possible ACS or heart failure and stratified as very low, low, intermediate, or high risk.9, 10 Patients with both possible ACS and heart failure were grouped according to the diagnosis with the highest corresponding risk assessment; if both risk assessments were the same, then the first‐listed diagnosis was used. Though developed to predict different clinical outcomes during different time periods, risk strata from the corresponding risk models were pooled across both diagnoses to develop a risk summary.
Upon discharge, investigators recorded which advanced diagnostic tests, specialty consultations, and acute care treatments patients received while in the SSU. Diagnostic tests were considered advanced if they were not routinely performed within 2 hours of being ordered. Advanced diagnostic tests were grouped into 2 types by their accessibility to ordering SSU physicians. Open access tests included echocardiograms and ETTs, which were reserved for SSU patients 6 days per week. Though the availability of open access tests was not unlimited, ordering physicians' needs for them rarely exceeded the immediate supply. On the other hand, limited access tests included both cardiac stress imaging studies, which were reserved for SSU patients on a very limited basis 4 or 5 days per week, and other tests that were not reserved for SSU patients, such as endoscopy, magnetic resonance imaging, or ultrasonography. Ordering physicians' needs for limited access tests often exceeded their immediate supply; in such cases, SSU patients were placed without priority into queues that included patients from the entire hospital.
Investigators recorded when patients received advanced diagnostic tests that were ordered by specialists. These tests, however, were not included in analyses of how services received by SSU patients affected SSU success, because SSU attending physicians were only indirectly involved in whether or not patients received these tests. Treatments were considered acute care treatments if they were commonly administered only in acute care settings, such as heparin for unstable angina or intravenous furosemide for pulmonary edema.
SSU Success
The SSU was designed to care for patients during brief stays and without eventual admission to traditional inpatient services. Therefore, we used patients' LOS and whether or not patients were admitted to traditional inpatient services as measures of SSU success. LOS was calculated from the time patients arrived in the SSU until the time they left. Therefore, neither time spent in the ED before admission to the SSU nor time spent on traditional inpatient services (if needed) contributed to our definition of LOS. Individual SSU patients were considered successfully cared for in the SSU if their LOS was less than 72 hours and they were discharged directly home from the SSU. We explored associations between these outcomes and provisional diagnoses, risk assessments, and services received.
Data Analysis
LOS data were right‐skewed; therefore, we used the Mann‐Whitney test for comparisons between 2 groups and the Kruskal‐Wallis test for comparisons among 3 or more groups. To test for trends of median LOS among ordered groupings, we used the method of Cuzick.11 We used Pearson's chi‐square test to compare proportions of patients grouped into categories and the chi‐square test for trends with equal scoring to test for trends among ordered groupings.
We performed multiple logistic regression to explore which variables were associated with SSU success. The following 5 demographic variables from Table 1 were insignificant in all single‐variable and multiple‐variable regression models that we tested and were, therefore, removed from further analyses to create more parsimonious models: gender, language, ethnicity, race, and whether or not patients had a primary care provider. Our multiple logistic regression models were fitted by maximum likelihood methods. In all of these models, odds ratios (ORs) were adjusted for patient characteristics that included age (in years), insulin‐requiring diabetes mellitus (yes or no), SSU attending physician, day of the week of SSU admission (weekday or weekend), and hospitalization during the preceding year. Confidence intervals (CIs) for predicted probabilities were computed using the delta method. All analyses were conducted with Stata Statistical Software, Release 9 (StataCorp, College Station, TX).
| |
| Mean age, years (SD) (25th‐75th percentiles) | 58 (12) (49‐66) |
| Men | 389 (52) |
| Lacking a primary care provider | 256 (34) |
| Non‐English speaking | 217 (29) |
| Ethnicity is Hispanic or Latino | 105 (14) |
| Race is Black or African‐American | 480 (64) |
| Hospitalized within the preceding year | 322 (43) |
| Insulin‐requiring diabetes mellitus | 83 (11) |
| Previous coronary artery revascularization | 89 (12) |
| Provisional diagnosis* | |
| Possible acute coronary syndrome | 427 (57) |
| Heart failure | 214 (29) |
| Other cardiovascular | 62 (8) |
| Noncardiovascular | 48 (6) |
Results
Subjects
During the 4‐month study period, 755 patients were admitted to the SSU. Among these patients, 4 were excluded from our study because they refused verbal consent. In the remaining study sample of 751 patients, all were included in the descriptions of patients' admission characteristics (Table 1), but 13 patients who left prematurely were excluded in both the descriptions of services received (Table 2) and the analyses of SSU success (Tables 3 and 4).
| Service received | Possible ACS n = 418 (%) | Heart Failure n = 211 (%) | Other Cardiovascular n = 61 (%) | Noncardiovascular n = 48 (%) | Total n = 738 (%) |
|---|---|---|---|---|---|
| |||||
| Open access test* | 37 | 59 | 56 | 13 | 43 |
| Resting | |||||
| Echocardiography | 29 | 59 | 56 | 13 | 39 |
| ETT | 12 | 0 | 5 | 0 | 7 |
| Limited access test | 24 | 8 | 10 | 8 | 17 |
| Stress imaging | 21 | 5 | 7 | 2 | 14 |
| Acute care treatment | 22 | 78 | 5 | 60 | 39 |
| Specialty consultation∥ | 24 | 12 | 20 | 8 | 19 |
| Any above service | 68 | 93 | 67 | 69 | 75 |
| Provisional Diagnosis and Services Received | n | Median LOS [hours (IQR)] | Stay Longer than 72 Hours (%) | Admission to Traditional Inpatient Service (%) | Stay Longer than 72 Hours or Admission to Traditional Inpatient Service (%) |
|---|---|---|---|---|---|
| |||||
| All patients | 738 | 42 (22‐63) | 15 | 9* | 21 |
| Possible ACS | 418 | 37 (20‐57) | 13 | 10 | 20 |
| Heart failure | 211 | 47 (34‐69) | 21 | 9 | 27 |
| Other CV | 61 | 40 (21‐49) | 10 | 5 | 11 |
| Non‐CV | 48 | 40 (22‐60) | 10 | 2 | 13 |
| P value | <0.001 | 0.04 | 0.18 | 0.01 | |
| Open access test | |||||
| Yes | 320 | 46 (31‐67) | 17 | 9 | 23 |
| No | 418 | 33 (20‐52) | 13 | 9 | 20 |
| P value | <0.001 | 0.15 | 0.87 | 0.43 | |
| Limited access test | |||||
| Yes | 128 | 51 (42‐82) | 31 | 6 | 33 |
| No | 610 | 38 (21‐55) | 12 | 10 | 19 |
| P value | <0.001 | <0.001 | 0.24 | <0.001 | |
| Acute care treatment | |||||
| Yes | 287 | 46 (34‐69) | 21 | 12 | 29 |
| No | 451 | 32 (20‐50) | 11 | 7 | 16 |
| P value | <0.001 | <0.001 | 0.01 | <0.001 | |
| Specialty consultation | |||||
| Yes | 141 | 63 (40‐92) | 38 | 28 | 52 |
| No | 597 | 38 (21‐50) | 10 | 5 | 14 |
| P value | <0.001 | <0.001 | <0.001 | <0.001 | |
| Any above service | |||||
| Yes | 554 | 46 (29‐68) | 19 | 10 | 26 |
| No | 184∥ | 22 (16‐32) | 2 | 5 | 7 |
| P value | <0.001 | <0.001 | 0.03 | <0.001 | |
| Stay Longer than 72 Hours | Admission to Traditional Inpatient Service | Either Outcome | ||||
|---|---|---|---|---|---|---|
| OR* | P value | OR* | P value | OR* | P value | |
| ||||||
| Heart failure | 2.3 | 0.01 | 1.1 | 0.77 | 1.9 | 0.02 |
| Service received | ||||||
| Open access test | 1.5 | 0.10 | 1.0 | 0.89 | 1.2 | 0.32 |
| Limited access test | 5.1 | <0.001 | 0.4 | 0.03 | 2.5 | <0.001 |
| Acute care treatment | 1.7 | 0.07 | 1.4 | 0.31 | 1.6 | 0.05 |
| Specialty consultation | 6.1 | <0.001 | 13.1 | <0.001 | 8.1 | <0.001 |
Admission Characteristics and Services Received
A narrow range of provisional diagnoses were listed by ED attending physicians and 641 patients (85% of 751) were grouped as having possible ACS or heart failure (Figure 2). Patients with these diagnoses were later risk‐stratified and, when pooled across risk strata, only 14 patients (2% of 641) exceeded the suggested admission‐location criterion for the SSU of lower than high risk. Despite the array and frequency of diagnostic and treatment services that patients received, SSU physicians worked mostly independently, requesting specialty consultations for only 19% of patients (141/738; Table 2).
SSU Success
The median LOS for all patients was 42 hours (interquartile range [IRQ] 22‐63) and 156 patients (21% of 738) had unsuccessful SSU stays (Table 3). The most common reason for an unsuccessful stay was a stay longer than 72 hours (71% of 156). Among the 66 patients who required admission to traditional inpatient services, nearly one‐half (48%) were admitted expressly to receive treatments not available in the SSU after having a specialty consult.
Patients' provisional diagnoses were associated with unsuccessful stays in bivariate analyses (Table 3). In addition, when patients were grouped into 3 risk stratums (very‐low, low, and intermediate‐and‐high), unsuccessful stays increased with increasing risk. For example, in patients with possible ACS, the proportion of unsuccessful stays increased from 17% of 306 very‐low risk patients to 27% of 55 intermediate‐and‐high risk patients (P value for trend = 0.012. Similarly, in patients with heart failure, the proportion of unsuccessful stays increased from 25% of 181 very‐low risk patients to 100% of 3 intermediate‐and‐high risk patients (P value for trend = 0.004).
However, in multiple variable models that simultaneously included patients' characteristics upon admission with services received during their SSU stay, only the provisional diagnosis of heart failure was associated with unsuccessful stays (OR, 1.9; 95% CI, 1.12‐3.18); risk assessments for possible ACS (P = 0.29) and heart failure (P = 0.32) were unimportant predictors of unsuccessful stays (Table 4). On the other hand, whether or not patients received diagnostic tests, acute care treatments, or specialty consultations were important predictors. In particular, patients who received specialty consultations were much more likely to require admission to traditional inpatient services than those patients who did not (OR, 13.1; 95% CI, 6.9‐24.9) and had a 52% chance of having an unsuccessful stay (95% CI, 42‐61%; Figure 3). In addition, the accessibility of a diagnostic test was inversely proportional to the chance of having a long stay; patients who received an open access test had a 12% chance of a long stay (95% CI, 8‐16%) whereas those who received a limited access test had a 29% chance of a long stay (95% CI, 20‐39%). Receiving acute care treatments was also a significant, though less important, predictor of an unsuccessful stay (Table 4).
Discussion
We found that the types of services received by patients during their SSU stays were stronger predictors of long stays and eventual admissions to traditional inpatient services than patients' characteristics upon admission to the SSU. This suggests that SSUs should be focused toward matching patients' anticipated needs with readily accessible services. For example, in our SSU, which cares for over 2,250 patients annually, more than 1,200 patients will receive diagnostic tests in a given year. Among these patients, those who receive a limited access test will be more than twice as likely to have long stays than those who receive an open access test (Figure 3). Though our conclusions may not be applicable to other settings, this study is the most comprehensive description of patients admitted to a hospitalist‐run SSU. In addition, our study is the first to demonstrate that diagnostic and consultative services are the most important predictors of successful stays in SSUs. This promotes the practical strategy that hospitalists who staff SSUs should focus administratively toward gaining access to these services.
Very few of our SSU patients did not fulfill the suggested requirements of our admission location guidelines. For example, only 2% of 691 patients with either possible ACS or heart failure were high risk (Figure 2). Despite this, 21% of our patients had stays longer than 72 hours or were admitted to traditional inpatient services. The paradoxically high proportion of unsuccessful stays among mostly very‐low and low risk patients simply reflects how the clinical risk models that we used were not designed to predict unsuccessful stays. Moreover, as our multiple variable models suggest, improvements in the selection process of candidate SSU patients are more likely to come from an ability to incorporate assessments of what services patients will receive rather than from assessments of their clinical risk (Table 4). Therefore, the immediate plans of the accepting SSU physicians, the physicians who will determine what services patients eventually receive, should be incorporated in the admission‐location decision process.
Three of our findings highlight how input from accepting SSU physiciansconveyed to ED physicians before their final admission‐location decisions are mademay improve the SSU patient selection process. First, 23% of our patients were discharged home after brief stays with no advanced tests, specialty consultations, or acute care treatments (Table 3). Though some of these patients may have required inpatient services other than the ones we recorded, most were admitted with very‐low risk possible ACS; if they required overnight stays at all, many of them may have been better cared for in the ED observation unit (Figure 1). Second, 74% of the patients who required admission to traditional inpatient services were admitted for services not readily available to patients in the SSU (Table 3). Among these patients, nearly one‐third (21/66) received no advanced diagnostic tests in the SSU. This suggests that these patients should have been admitted directly to the general medical wards; doing so may have improved efficiency and quality of care by reducing unnecessary handoffs between physicians. Both types of patientsthose with minimal inpatient needs and those with more needs than the SSU can providehighlight how incorporating accepting SSU physicians' plans may improve the SSU patient selection process. After all, those best equipped to determine if the SSU will meet (or exceed) the needs of candidate patients are the SSU physicians themselves.
Third, we found that whether or not SSU physicians required assistance from specialists was the strongest predictor of unsuccessful stays: when an accepting physician determined that a patient should receive a specialty consultation, that patient's chance of having an unsuccessful stay was over 50% (Figure 3). Our study was not designed to determine how specialty consultations were associated with unsuccessful stays. We did not, for example, record whether or not hospitalists changed their diagnostic, treatment, or admission plans because of specialists' recommendations.12 Therefore, we cannot conclude that specialty consultations actually caused long stays or traditional admissions. Nevertheless, when our SSU physicians did not manage patients independent of specialty consultations, we observed a high likelihood of unsuccessful stays. Because accepting SSU physicians are the ones who will determine whether or not they need assistance from specialists, weighing their immediate plans for specialty consultations into the admission‐location decision process may improve the efficiency of SSUs. Others have recognized the importance of specialty consultations in SSUs by directly incorporating specialists as coattending physicians.13
Our study had several limitations. First, we studied mostly patients with cardiovascular diagnoses. Predictors of success in SSUs that admit patients with different diagnostic profiles may be different. In particular, SSUs that admit patients with a wide array of diagnoses may find that matching patients' needs with readily accessible services is impractical, because these needs may be too wide‐ranging. Second, our study design was observational. However, other than seasonal variations in admission patterns, there was little room for selection bias because we enrolled all consecutive admissions over the 4‐month study period, which gives us more confidence in our results. Third, our study did not record whether or not ED physicians knowingly overrode the suggested admission‐location guidelines because of limited bed availability. Yet, if shortages of beds on traditional inpatient services were driving patients who were otherwise candidates for the general medical wards in to the SSU, then we would have expected higher‐risk patients and greater needs for limited access tests. Finally, our descriptions of patients' needs were based on what diagnostic, consultative, and treatment services patients actually received; yet these needs did not include diagnostic tests that were ordered but never performed. However, any missed needs would bias our results toward no association with unsuccessful stays, because unsuccessful stays would generally increase while patients await needed services.
Future research could address these limitations through an experimental trial of traditional admissions versus admission to a hospitalist‐run SSU. And, because hospitals are complex systems of health care delivery where changes in one patient care unit often affect others in unanticipated ways,14 the impact of SSUs on other patient care units that are closely connected to SSUs, such as EDs and the general medical wards (Figure 1), should be simultaneously observed. For example, though our findings suggest that the accessibility of diagnostic tests should parallel ordering SSU physicians' needs for those tests, making all diagnostic tests open to SSU physicians may result in shortsightedly lengthening the stays of patients in other care units. Future research should also observe the decision‐making process of both the physicians who make admission‐location decisions (ED physicians) and those who determine the eventual plans for patients in the SSU (hospitalists). Accepting physicians from other patient care units have found improved outcomes of efficiency when they were involved in the complex process of deciding where to admit patients.15, 16 After an initial evaluation of a candidate SSU patient in the ED, a hospitalist who staffs both the general medical wards and the SSU would be uniquely well‐positioned to help an ED physician decide where a patient's needs would be best met. Although ED physicians will rightly be concerned that consulting SSU hospitalists may slow patient flow, hands‐on consultations of candidate SSU patients, who have a narrow range of diagnoses and low‐risk profiles, would likely be brief. In addition, because many SSUs are conveniently adjacent to EDs, the burden of communication may be minor.1 To address these questions, hospitalists who staff SSUs must continue the observed trend of working collaboratively with ED physicians.15, 17, 18
Acknowledgements
The authors thank Arthur T. Evans and Brendan M. Reilly for their insightful review of the manuscript. The authors also thank Zhaotai Cui for his assistance with statistical programming.
- ,,.A paradigm shift in the nature of care provision in emergency departments.Emerg Med J.2004;21:681–684.
- ,,.Acute coronary syndromes. In: Marx J, Hockberger R, Walls R, eds.Rosen's emergency medicine. Concepts and clinical practice.6th ed.Edinburgh:Mosby Elsevier;2006:1154–1199.
- .Taking charge of observation units for better patient flow.Todays Hospitalist Mag.2007;5(7):16–20.
- ,,, et al.Unidad de corta estancia dependiente de Medicina Interna.An Med Interna.1999;16:504–510.
- ,,,,.Factors that predict unplanned hospital readmission of patients discharged from a short stay medical unit.An Med Interna.2002;19:221–225.
- ,,, et al.Program description: a hospitalist‐run, medical short‐stay unit in a teaching hospital.CMAJ.2000;163(11):1477–1480.
- ,,,.Triage of patients with chest pain in the emergency department: a comparative study of physicians' decisions.Am J Med.2002;112:95–103.
- ,,.Gaps in the continuity of care and progress on patient safety.BMJ.2000;320:791–794.
- ,,, et al.Prediction of the need for intensive care in patients who come to emergency departments with acute chest pain.N Engl J Med.1996;334:1498–1504.
- ,,, et al.Risk stratification for in‐hospital mortality in acutely decompensated heart failure.JAMA.2005;293:572–580.
- .A Wilcoxon‐type test for trend.Stat Med.1985;4:87–90.
- ,,,,,.Diagnostic test restraint and the specialty consultation.J Gen Intern Med.1990;5:95–103.
- ,,, et al.A cooperative care model: cardiologists and hospitalists reduce length of stay in a chest pain observation unit.Crit Pathw Cardiol.2005;4:55–58.
- ,.Average length of stay, delayed discharge, and hospital congestion.BMJ.2002;325:610–611.
- .An internist in the emergency department: the IM facilitator program.HMO Pract.1991;10:42–43.
- ,,, et al.A “closed” medical intensive care unit (MICU) improves resource utilization when compared with an “open” MICU.Am J Respir Crit Care Med.1998;157:1468–1473.
- .Hospitalists' new role in the ED: “clog busters.”Todays Hospitalist Mag.2005;3(8):15–18.
- .Kindred spirits: ED doctors, hospitalists forge a critical collaboration.Hospitalist.2007;11(7):1,16–20.
Copyright © 2009 Society of Hospital Medicine

Impact of a Bedside Procedure Service
Inpatient bedside procedures are a major source of preventable adverse events in hospitals.1, 2 Unfortunately, many future inpatient physicians may lack the training3 and confidence4 to correct this problem. One proposed model for improving the teaching, performance, and evaluation of bedside procedures is a procedure service that is staffed by faculty who are experts at inpatient procedures.5 In a recent survey of internal medicine residents from our hospital, 86% (30 of 35) believed that expert supervision would improve central venous catheterization technique (Trick WE, personal communication).
Primary considerations in the development of a procedure service are the baseline demand for bedside procedures and whether a procedure service may affect this demand. Though variations in population‐based rates of some hospital procedures have been described,6, 7 there is little written on the demand for procedures performed at the bedsides of inpatients. Concomitant increases in demand and availability of other technologies810 suggest that improving the availability of bedside procedures may lead to an increase in their demand, regardless of whether such an increase benefits patients.11
Therefore, we sought to determine the impact of a bedside procedure service on the baseline number of paracenteses, thoracenteses, lumbar punctures (LPs), and central venous catheterizations (CVCs) performed on general medicine inpatients at our teaching hospital. In addition, we examined whether this service leads to more successful and safe procedure attempts.
METHODS
Design and Setting
In this prospective cohort study, the cohort was all patients admitted to the general medicine service at Cook County Hospital, a 500‐bed public teaching hospital in Chicago, Illinois, in January and February of 2006. The general medicine inpatient service is divided into 3 firms (A, B, and C), each with 4 separate teams of physicians and students. Admissions from the emergency department or other services in the hospital, such as intensive care units (which are closed and therefore staffed by separate teams of physicians), are distributed in sequence to on‐call teams from each firm. During the study period, the availability of a bedside procedure service varied by firm. Throughout the first 4 weeks, the service was available to only 1 of 3 firms (firm A). Then, during weeks 5 through 8, the service crossed over to the other 2 firms (firms B and C) and was unavailable to the original firm. Firm assignments for residents assigned to the inpatient service for all 8 weeks did not change. Of the 16 residents assigned to firm A during the first 4 weeks, when the procedure service was available, 3 remained on the wards during the second 4 weeks, when the procedure service was not available.
We chose to collect data on 4 bedside procedures: paracentesis, thoracentesis, LP, and CVC. Similar to those at other teaching hospitals, our residents informally acquire the skills to perform these procedures while assisting and being assisted by more experienced senior residents in a see one, do one, teach one apprenticeship model of learning.4 To improve the training and performance of these bedside procedures, the Department of Medicine piloted a bedside procedure service to teach procedural skills and assist residents during these procedures. Use of the service, though voluntary, was actively encouraged at residents' monthly orientation meetings and regular conferences.
One attending inpatient physician (J.A.) staffed the bedside procedure service, which was available during normal work hours on weekdays. Requests for procedures were made by general medicine residents through an online database and, after approval by the procedure service attending physician, were performed under his direct supervision. A hand‐carried ultrasound (MicroMaxx, Sonosite, Inc., Bothell, WA) that generates a 2‐dimensional gray‐scale image was used to both confirm the presence and location of fluid prior to paracentesis and thoracentesis and provide real‐time guidance during central venous catheterization. When the bedside procedure service was unavailable, residents performed bedside procedures in the usual fashion, typically without direct attending physician supervision. But if requested, an on‐call chief medical resident with access to a hand‐carried ultrasound device used by the intensive care unit was available for assistance at any time.
Subjects
The study subjects were all patients admitted to the general medical service during the 8‐week pilot period. Patients were excluded if they had been discharged before arrival on the medical wards or if they were under the care of the general medicine service for less than 6 hours before discharge or transfer to another service. We chose 6 hours because we reasoned that such brief admissions were not potential candidates for invasive bedside procedures.
Data Collection
Each morning an investigator contacted the senior residents who had admitted patients during the previous 24‐hour shift and confirmed that newly admitted patients were under the care of the general medicine service for more than 6 hours. To examine how the number of attempts may have been affected by procedures done in the emergency room or intensive care units before admission to the general medicine service, investigators also asked admitting residents whether a bedside procedure had been attempted in the 72 hours before admission. Every general medicine service resident was asked to fill out a brief data collection form after an attempt to perform any procedure on the general medical wards. In addition, chief residents asked each member of the general medicine service at mandatory sign‐out rounds at the end of each weekday whether any procedures had been attempted, and on weekend days investigators contacted senior residents from each general medicine service team.
We report on this quality assurance study, which was conducted during a pilot phase. This report has been reviewed and judged exempt by our institutional review board.
Primary OutcomeNumber of Procedure Attempts
For all bedside procedures attempted by residents on the general medical wards, investigators determined whether the residents were members of firms that were offered the bedside procedure service and, if so, whether the procedure service attending directly supervised the procedure attempt. Multiple procedure attempts of the same type were counted for an individual patient if (1) the procedure attempts did not occur during the same admissions and (2) neither the physicians attempting the procedure nor the primary indications for it were the same. Therefore, neither attempts performed after initially unsuccessful ones nor repeated procedures, such as large‐volume therapeutic paracentesis and thoracentesis, were counted twice. We reasoned that when these criteria were met, procedure attempts could be considered independently.
Secondary Outcomes
Investigators asked residents who attempted procedures to indicate whether (1) the indication for the procedure was solely diagnostic or was, at least in part, therapeutic; (2) the procedure was successful; and (3) there were any immediate major periprocedural complications. A procedure was considered to have been successfully performed if it fulfilled 2 criteria: it had to be completed during a single continuous attempt, even if multiple sites or procedure kits were used; and it had to fulfill the indication for it being done. For example, if the indication for thoracentesis was therapeutic, this procedure would be considered successful if it yielded a large enough volume of fluid to alleviate the patient's symptoms, but if the indication was diagnostic, then thoracentesis would be considered successful if it yielded enough fluid for laboratory processing. Residents were asked to report any periprocedural complications that they considered major; 2 illustrative examples were provided: a pneumothorax and severe bleeding.
Data Analyses
On the basis of earlier pilot data, we estimated that 8%10% of all admissions to the general medicine service underwent at least 1 procedure (paracentesis, thoracentesis, lumbar puncture, or central vein catheterization). We planned for a sample size of 1900 admissions, which would have 80% power to detect a clinically meaningful 50% relative increase in the mean number of bedside procedures with a double‐sided alpha error of 0.05. We used permutation tests to compare the mean number of procedures attempted between firms and bootstrap simulation to construct 95% confidence intervals for those means and the differences between and ratios of them. Fisher's exact test was used to compare proportions of successfully performed procedures and preadmission procedure attempts. All analyses were conducted with Stata Statistical Software, Release 9 (StataCorp, LP, College Station, TX).
RESULTS
Subjects
During this 8‐week pilot study, there were 2157 admissions to the general medicine service. Among these admissions, 216 were excluded from our study because the patients did not arrive on the medical wards or were not under the care of the general medicine service for at least 6 hours before discharge or before being transferred to another service. Of the remaining 1941 admissions, 935 were to firms with the bedside procedure service available, and 1006 were to firms without the service available (Fig. 1)
Primary OutcomeNumber of Procedure Attempts
Overall, 122 patients underwent 145 procedure attempts that met our criteria for independence. The mean number of procedure attempts in firms offered the bedside procedure service was 48% higher (90 versus 61 per 1000 admissions; RR 1.48, 95% CI 1.062.10; P = .030; Fig. 1). When procedures attempted on weekends and holidays were excluded, the relative increase in procedure attempts in firms offered the bedside procedure service was even higher (70 versus 43 per 1000 admissions; RR 1.63, 95% CI 1.092.49; P = .023; Fig. 1). When grouped according to whether procedure attempts occurred before or after crossover of the procedure service, the mean number of procedure attempts in firms was higher when the service was offered: firm A dropped from 84 to 70 per 1000 admissions (P = .58) after losing the service, whereas firms B and C increased from 57 to 94 per 1000 admissions (P = .025) on gaining the service. There were 40 procedure attempts performed on patients within 72 hours before admission, but there was no difference between firms in the proportions of these preadmission procedures (P = .43).
Secondary Outcomes
Table 1 shows how of each type of procedure contributed to the overall difference. Attempts of CVC and therapeutic paracentesis and thoracentesis accounted for 86% of the overall increase in procedure attempts for admissions to firms offered the bedside procedure service, whereas only 14% of this increase was a result of diagnostic procedures. There were no differences in the proportions of successfully performed procedures, whether grouped by firm (P = 1.0) or by direct supervision from the procedure service attending (P = .64; Table 2). There were 3 self‐reported major periprocedural complications; all were related to excessive bleeding from CVC attempts. Two occurred without direct supervision from the bedside procedure service attending, one hemomediastinum from an internal jugular CVC attempt and one groin hematoma from a femoral CVC attempt. The third, a groin hematoma from a femoral CVC attempt, occurred during direct supervision from the bedside procedure service attending.
| Bedside procedure and indication | Firms with bedside procedure service 935 admissions | Firms with usual care 1006 admissions | Absolute rate difference (proportion of overall difference)* |
|---|---|---|---|
| Total for entire study (total for weekend days and holidays) | |||
| |||
| Total | 90 (19) | 61 (18) | 29 (100%) |
| Thoracentesis | 30 (10) | 18 (7) | 12 (41%) |
| Diagnosis | 9 (5) | 6 (2) | 3 (9%) |
| Treatment | 21 (4) | 12 (5) | 9 (32%) |
| Paracentesis | 32 (5) | 25 (6) | 7 (25%) |
| Diagnosis | 9 (1) | 11 (3) | 2 (8%) |
| Treatment | 24 (4) | 14 (3) | 10 (33%) |
| Central venous catheterization | 17 (3) | 11 (4) | 6 (21%) |
| Lumbar puncture | 11 (1) | 7 (1) | 4 (13%) |
| Diagnosis | 10 (1) | 6 (1) | 4 (13%) |
| Treatment | 1 (0) | 1 (0) | 0 (0%) |
| Admission to firm with | P value of difference in proportions | ||||||
|---|---|---|---|---|---|---|---|
| Procedure service available | Usual care | ||||||
| Total attempts (n) | Successful | Total attempts (n) | Successful | ||||
| n | % | n | % | ||||
| |||||||
| Central venous catheterization | 16 | 13 | 81 | 11 | 9 | 82 | 1.00 |
| Paracentesis, thoracentesis, or lumbar puncture | 68 | 54 | 79 | 50 | 40 | 80 | 1.00 |
| Total | 84 | 67 | 80 | 61 | 49 | 80 | 1.00 |
| Procedure service attending | Pvalue of difference in proportions | ||||||
| Directly supervised | Did not directly supervise | ||||||
| Total attempts (n) | Successful | Total attempts (n) | Successful | ||||
| n | % | n | % | ||||
| Central venous catheterization | 10 | 10 | 100 | 17 | 12 | 71 | 0.28 |
| Paracentesis, thoracentesis, or lumbar puncture | 40 | 33 | 83 | 78 | 61 | 78 | 0.12 |
| Total | 50 | 43 | 86 | 95 | 73 | 77 | 0.64 |
DISCUSSION
We found that the mean number of bedside procedures increased by 48% (95% CI, 6% to 110%) from 61 to 90 per 1000 general medicine admissions when firms were offered a bedside procedure service. This suggests that a procedure service may lead to an increase in the number of procedures performed. For example, in our hospital, where 12,500 patients are admitted annually to the general medical service, 365 additional procedures per year (95% CI, 45840) may be performed if a procedure service is available. Despite this potential increase in demand, we were unable to demonstrate a parallel increase in bedside procedure success, even when the procedure service attending was directly supervising residents (Table 2). Though our conclusions may not be applicable to other settings, this study is, to our knowledge, the first to describe the demand for bedside procedures performed on general medicine inpatients at an urban teaching hospital and the first to demonstrate that this demand increases with the availability of a procedure service.
Because 86% of the observed increase in procedure attempts was due to therapeutic indications (Table 1), most of the observed difference may be due to undertreatment in the usual care cohort, overtreatment in the bedside procedure service cohort, or a combination of both. However, our study was not designed to determine if patients were undertreated because we did not review the appropriateness of physicians' decisions to not attempt procedures. And even though the bedside procedure service attending physician prospectively confirmed the appropriateness of each procedure attempt in that cohort, we did not examine what physicians' baseline treatment thresholds were or if they were lowered by the availability of the bedside procedure service.11 In other words, we cannot claim that the observed increase in procedure attempts was indicated based on patients' clinical factors. Nevertheless, the observed increase supports the important idea that discrete physician‐level decisions, in this case, whether to perform a bedside procedure, may be affected by broader system‐wide adoptions of new technologies like our bedside procedure service.12 Other nonclinical factors not observed in our study, such as fee‐for‐service compensation and variable physician‐level diagnostic and therapeutic thresholds, may also affect the rate of bedside procedures.
Our study had several limitations. We studied only one group of patients at one hospital: admissions to physicians in different settings may have different rates of bedside procedures. Our study design was observational. However, the predetermined sequential allocation of admissions and the varied assignments of the bedside procedure service during the study period should have limited selection bias. Our identification of procedure attempts, particularly in the usual care group, relied on resident physicians' self‐reports, and we cannot exclude a reporting bias. However, we believe that the daily interactions between investigators and residents from each team on the general medicine service limited the number of procedure attempts that went unrecorded. Finally, though sufficiently powered to determine our primary outcome, our study was underpowered to confirm statistical differences between firms in proportions of successfully performed procedures. For example, approximately 400 additional procedures (or more than 5000 additional admissions) would have been needed to sufficiently power the observed 9% increase in successful attempts that we observed with direct supervision by the procedure service attending (77% versus 86%; P = .64; Table 2). Our current sample size may be adequate in future research if success rates diverge as the experience of the procedure service attending increases. Though expert in performing bedside procedures, he had limited experience teaching them, particularly with the use of a hand‐carried ultrasound device. Just as there is a learning curve to gain the experience to successfully perform procedures,13 so may there be a learning curve to successfully teach procedures.14
Future research could address these limitations by more closely observing the decision‐making processes of physicians who order bedside procedures for general medicine inpatients in various settings. Our findings suggest that although patients' clinical circumstances are likely the most important consideration, nonclinical factors may also affect physicians' decisions.12 Like other multifaceted decision‐making processes of physicians,15 the complexity of this decision is important to examine because, as our pilot data suggest, a procedure service may not lead to more successful procedure attempts or reductions in the number of major complications. Although the cumulative expertise of our service or the innovative methods of training of other institutions may improve the performance of bedside procedures,5, 13 physicians' decisions about whether to order them will remain paramount, because any improvement in procedural competence will do little to reduce the relative danger of unnecessary procedures16 or the missed benefit of procedures left undone. Physicians of inpatients17, 18 should refine the indications for and anticipated benefits from these commonly performed invasive procedures.
- ,,, et al.The nature of adverse events in hospitalized patients: Results of the Harvard Medical Practice Study II.N Engl J Med.1991;324:377–384.
- ,,, et al.Cost of medical injuries in Utah and Colorado.Inquiry.36;255–264.
- ,,,.Procedural Skills Training in Internal Medicine Residencies: A Survey of Program Directors.Ann Intern Med1989;111:932–38.
- ,,, et al.Beyond the comfort zone: residents assess their comfort performing inpatient medicine procedures.Am J Med.2006;119:71.e17–.e24.
- ,,, et al.Creation of an innovative inpatient medical procedure service and a method to evaluate house staff competency.J Gen Intern Med.2004;19:510–513.
- ,,, et al.Variation in the use of cardiac procedures after acute myocardial infarction.N Engl J Med.1995;333:573–578.
- ,,.Frequency and morbidity of inpatient procedures: report of a pilot study from two teaching hospitals.Arch Intern Med.1978;138:1809–1811.
- ,.The impact of diagnostic testing on therapeutic interventions.JAMA.1996;275:1189–1191.
- ,,, et al.Does increased access to primary care reduce hospital readmissions?N Engl J Med.1996;334:1441–1447.
- ,,, et al.Coronary artery bypass graft surgery in Ontario and New York State: which rate is right?Ann Intern Med.1997;126:13–19.
- ,.Avoiding the unintended consequences of growth in medical care. How might more be worse?JAMA.1999;281:446–453.
- ,,.Professional uncertainty and the problem of supplier‐induced demand.Soc Sci Med.1982;811–824.
- ,,,.A curricular initiative for internal medicine residents to enhance proficiency in internal jugular central venous line placement.Mayo Clin Proc.2005;80:212–218.
- ,,, et al.Confidence of Academic General Internists and Family Physicians to Teach Ambulatory Procedures.J Gen Intern Med.2000;15:353–360.
- ,,, et al.The impact of evidence on physicians' inpatient treatment decisions.J Gen Intern Med.2004;19:402–409.
- .Medical care—is more always better?N Engl J Med.2003;349:1665–1667.
- ,.Point/counterpoint: should hospital medicine become a distinct specialty?Hospitalist.2005;9(1):15–19.
- ,,,,.The core competencies in hospital medicine: a framework for curriculum development by the Society of Hospital Medicine.J Hospital Med.2006;1:S1–S95.
Inpatient bedside procedures are a major source of preventable adverse events in hospitals.1, 2 Unfortunately, many future inpatient physicians may lack the training3 and confidence4 to correct this problem. One proposed model for improving the teaching, performance, and evaluation of bedside procedures is a procedure service that is staffed by faculty who are experts at inpatient procedures.5 In a recent survey of internal medicine residents from our hospital, 86% (30 of 35) believed that expert supervision would improve central venous catheterization technique (Trick WE, personal communication).
Primary considerations in the development of a procedure service are the baseline demand for bedside procedures and whether a procedure service may affect this demand. Though variations in population‐based rates of some hospital procedures have been described,6, 7 there is little written on the demand for procedures performed at the bedsides of inpatients. Concomitant increases in demand and availability of other technologies810 suggest that improving the availability of bedside procedures may lead to an increase in their demand, regardless of whether such an increase benefits patients.11
Therefore, we sought to determine the impact of a bedside procedure service on the baseline number of paracenteses, thoracenteses, lumbar punctures (LPs), and central venous catheterizations (CVCs) performed on general medicine inpatients at our teaching hospital. In addition, we examined whether this service leads to more successful and safe procedure attempts.
METHODS
Design and Setting
In this prospective cohort study, the cohort was all patients admitted to the general medicine service at Cook County Hospital, a 500‐bed public teaching hospital in Chicago, Illinois, in January and February of 2006. The general medicine inpatient service is divided into 3 firms (A, B, and C), each with 4 separate teams of physicians and students. Admissions from the emergency department or other services in the hospital, such as intensive care units (which are closed and therefore staffed by separate teams of physicians), are distributed in sequence to on‐call teams from each firm. During the study period, the availability of a bedside procedure service varied by firm. Throughout the first 4 weeks, the service was available to only 1 of 3 firms (firm A). Then, during weeks 5 through 8, the service crossed over to the other 2 firms (firms B and C) and was unavailable to the original firm. Firm assignments for residents assigned to the inpatient service for all 8 weeks did not change. Of the 16 residents assigned to firm A during the first 4 weeks, when the procedure service was available, 3 remained on the wards during the second 4 weeks, when the procedure service was not available.
We chose to collect data on 4 bedside procedures: paracentesis, thoracentesis, LP, and CVC. Similar to those at other teaching hospitals, our residents informally acquire the skills to perform these procedures while assisting and being assisted by more experienced senior residents in a see one, do one, teach one apprenticeship model of learning.4 To improve the training and performance of these bedside procedures, the Department of Medicine piloted a bedside procedure service to teach procedural skills and assist residents during these procedures. Use of the service, though voluntary, was actively encouraged at residents' monthly orientation meetings and regular conferences.
One attending inpatient physician (J.A.) staffed the bedside procedure service, which was available during normal work hours on weekdays. Requests for procedures were made by general medicine residents through an online database and, after approval by the procedure service attending physician, were performed under his direct supervision. A hand‐carried ultrasound (MicroMaxx, Sonosite, Inc., Bothell, WA) that generates a 2‐dimensional gray‐scale image was used to both confirm the presence and location of fluid prior to paracentesis and thoracentesis and provide real‐time guidance during central venous catheterization. When the bedside procedure service was unavailable, residents performed bedside procedures in the usual fashion, typically without direct attending physician supervision. But if requested, an on‐call chief medical resident with access to a hand‐carried ultrasound device used by the intensive care unit was available for assistance at any time.
Subjects
The study subjects were all patients admitted to the general medical service during the 8‐week pilot period. Patients were excluded if they had been discharged before arrival on the medical wards or if they were under the care of the general medicine service for less than 6 hours before discharge or transfer to another service. We chose 6 hours because we reasoned that such brief admissions were not potential candidates for invasive bedside procedures.
Data Collection
Each morning an investigator contacted the senior residents who had admitted patients during the previous 24‐hour shift and confirmed that newly admitted patients were under the care of the general medicine service for more than 6 hours. To examine how the number of attempts may have been affected by procedures done in the emergency room or intensive care units before admission to the general medicine service, investigators also asked admitting residents whether a bedside procedure had been attempted in the 72 hours before admission. Every general medicine service resident was asked to fill out a brief data collection form after an attempt to perform any procedure on the general medical wards. In addition, chief residents asked each member of the general medicine service at mandatory sign‐out rounds at the end of each weekday whether any procedures had been attempted, and on weekend days investigators contacted senior residents from each general medicine service team.
We report on this quality assurance study, which was conducted during a pilot phase. This report has been reviewed and judged exempt by our institutional review board.
Primary OutcomeNumber of Procedure Attempts
For all bedside procedures attempted by residents on the general medical wards, investigators determined whether the residents were members of firms that were offered the bedside procedure service and, if so, whether the procedure service attending directly supervised the procedure attempt. Multiple procedure attempts of the same type were counted for an individual patient if (1) the procedure attempts did not occur during the same admissions and (2) neither the physicians attempting the procedure nor the primary indications for it were the same. Therefore, neither attempts performed after initially unsuccessful ones nor repeated procedures, such as large‐volume therapeutic paracentesis and thoracentesis, were counted twice. We reasoned that when these criteria were met, procedure attempts could be considered independently.
Secondary Outcomes
Investigators asked residents who attempted procedures to indicate whether (1) the indication for the procedure was solely diagnostic or was, at least in part, therapeutic; (2) the procedure was successful; and (3) there were any immediate major periprocedural complications. A procedure was considered to have been successfully performed if it fulfilled 2 criteria: it had to be completed during a single continuous attempt, even if multiple sites or procedure kits were used; and it had to fulfill the indication for it being done. For example, if the indication for thoracentesis was therapeutic, this procedure would be considered successful if it yielded a large enough volume of fluid to alleviate the patient's symptoms, but if the indication was diagnostic, then thoracentesis would be considered successful if it yielded enough fluid for laboratory processing. Residents were asked to report any periprocedural complications that they considered major; 2 illustrative examples were provided: a pneumothorax and severe bleeding.
Data Analyses
On the basis of earlier pilot data, we estimated that 8%10% of all admissions to the general medicine service underwent at least 1 procedure (paracentesis, thoracentesis, lumbar puncture, or central vein catheterization). We planned for a sample size of 1900 admissions, which would have 80% power to detect a clinically meaningful 50% relative increase in the mean number of bedside procedures with a double‐sided alpha error of 0.05. We used permutation tests to compare the mean number of procedures attempted between firms and bootstrap simulation to construct 95% confidence intervals for those means and the differences between and ratios of them. Fisher's exact test was used to compare proportions of successfully performed procedures and preadmission procedure attempts. All analyses were conducted with Stata Statistical Software, Release 9 (StataCorp, LP, College Station, TX).
RESULTS
Subjects
During this 8‐week pilot study, there were 2157 admissions to the general medicine service. Among these admissions, 216 were excluded from our study because the patients did not arrive on the medical wards or were not under the care of the general medicine service for at least 6 hours before discharge or before being transferred to another service. Of the remaining 1941 admissions, 935 were to firms with the bedside procedure service available, and 1006 were to firms without the service available (Fig. 1)
Primary OutcomeNumber of Procedure Attempts
Overall, 122 patients underwent 145 procedure attempts that met our criteria for independence. The mean number of procedure attempts in firms offered the bedside procedure service was 48% higher (90 versus 61 per 1000 admissions; RR 1.48, 95% CI 1.062.10; P = .030; Fig. 1). When procedures attempted on weekends and holidays were excluded, the relative increase in procedure attempts in firms offered the bedside procedure service was even higher (70 versus 43 per 1000 admissions; RR 1.63, 95% CI 1.092.49; P = .023; Fig. 1). When grouped according to whether procedure attempts occurred before or after crossover of the procedure service, the mean number of procedure attempts in firms was higher when the service was offered: firm A dropped from 84 to 70 per 1000 admissions (P = .58) after losing the service, whereas firms B and C increased from 57 to 94 per 1000 admissions (P = .025) on gaining the service. There were 40 procedure attempts performed on patients within 72 hours before admission, but there was no difference between firms in the proportions of these preadmission procedures (P = .43).
Secondary Outcomes
Table 1 shows how of each type of procedure contributed to the overall difference. Attempts of CVC and therapeutic paracentesis and thoracentesis accounted for 86% of the overall increase in procedure attempts for admissions to firms offered the bedside procedure service, whereas only 14% of this increase was a result of diagnostic procedures. There were no differences in the proportions of successfully performed procedures, whether grouped by firm (P = 1.0) or by direct supervision from the procedure service attending (P = .64; Table 2). There were 3 self‐reported major periprocedural complications; all were related to excessive bleeding from CVC attempts. Two occurred without direct supervision from the bedside procedure service attending, one hemomediastinum from an internal jugular CVC attempt and one groin hematoma from a femoral CVC attempt. The third, a groin hematoma from a femoral CVC attempt, occurred during direct supervision from the bedside procedure service attending.
| Bedside procedure and indication | Firms with bedside procedure service 935 admissions | Firms with usual care 1006 admissions | Absolute rate difference (proportion of overall difference)* |
|---|---|---|---|
| Total for entire study (total for weekend days and holidays) | |||
| |||
| Total | 90 (19) | 61 (18) | 29 (100%) |
| Thoracentesis | 30 (10) | 18 (7) | 12 (41%) |
| Diagnosis | 9 (5) | 6 (2) | 3 (9%) |
| Treatment | 21 (4) | 12 (5) | 9 (32%) |
| Paracentesis | 32 (5) | 25 (6) | 7 (25%) |
| Diagnosis | 9 (1) | 11 (3) | 2 (8%) |
| Treatment | 24 (4) | 14 (3) | 10 (33%) |
| Central venous catheterization | 17 (3) | 11 (4) | 6 (21%) |
| Lumbar puncture | 11 (1) | 7 (1) | 4 (13%) |
| Diagnosis | 10 (1) | 6 (1) | 4 (13%) |
| Treatment | 1 (0) | 1 (0) | 0 (0%) |
| Admission to firm with | P value of difference in proportions | ||||||
|---|---|---|---|---|---|---|---|
| Procedure service available | Usual care | ||||||
| Total attempts (n) | Successful | Total attempts (n) | Successful | ||||
| n | % | n | % | ||||
| |||||||
| Central venous catheterization | 16 | 13 | 81 | 11 | 9 | 82 | 1.00 |
| Paracentesis, thoracentesis, or lumbar puncture | 68 | 54 | 79 | 50 | 40 | 80 | 1.00 |
| Total | 84 | 67 | 80 | 61 | 49 | 80 | 1.00 |
| Procedure service attending | Pvalue of difference in proportions | ||||||
| Directly supervised | Did not directly supervise | ||||||
| Total attempts (n) | Successful | Total attempts (n) | Successful | ||||
| n | % | n | % | ||||
| Central venous catheterization | 10 | 10 | 100 | 17 | 12 | 71 | 0.28 |
| Paracentesis, thoracentesis, or lumbar puncture | 40 | 33 | 83 | 78 | 61 | 78 | 0.12 |
| Total | 50 | 43 | 86 | 95 | 73 | 77 | 0.64 |
DISCUSSION
We found that the mean number of bedside procedures increased by 48% (95% CI, 6% to 110%) from 61 to 90 per 1000 general medicine admissions when firms were offered a bedside procedure service. This suggests that a procedure service may lead to an increase in the number of procedures performed. For example, in our hospital, where 12,500 patients are admitted annually to the general medical service, 365 additional procedures per year (95% CI, 45840) may be performed if a procedure service is available. Despite this potential increase in demand, we were unable to demonstrate a parallel increase in bedside procedure success, even when the procedure service attending was directly supervising residents (Table 2). Though our conclusions may not be applicable to other settings, this study is, to our knowledge, the first to describe the demand for bedside procedures performed on general medicine inpatients at an urban teaching hospital and the first to demonstrate that this demand increases with the availability of a procedure service.
Because 86% of the observed increase in procedure attempts was due to therapeutic indications (Table 1), most of the observed difference may be due to undertreatment in the usual care cohort, overtreatment in the bedside procedure service cohort, or a combination of both. However, our study was not designed to determine if patients were undertreated because we did not review the appropriateness of physicians' decisions to not attempt procedures. And even though the bedside procedure service attending physician prospectively confirmed the appropriateness of each procedure attempt in that cohort, we did not examine what physicians' baseline treatment thresholds were or if they were lowered by the availability of the bedside procedure service.11 In other words, we cannot claim that the observed increase in procedure attempts was indicated based on patients' clinical factors. Nevertheless, the observed increase supports the important idea that discrete physician‐level decisions, in this case, whether to perform a bedside procedure, may be affected by broader system‐wide adoptions of new technologies like our bedside procedure service.12 Other nonclinical factors not observed in our study, such as fee‐for‐service compensation and variable physician‐level diagnostic and therapeutic thresholds, may also affect the rate of bedside procedures.
Our study had several limitations. We studied only one group of patients at one hospital: admissions to physicians in different settings may have different rates of bedside procedures. Our study design was observational. However, the predetermined sequential allocation of admissions and the varied assignments of the bedside procedure service during the study period should have limited selection bias. Our identification of procedure attempts, particularly in the usual care group, relied on resident physicians' self‐reports, and we cannot exclude a reporting bias. However, we believe that the daily interactions between investigators and residents from each team on the general medicine service limited the number of procedure attempts that went unrecorded. Finally, though sufficiently powered to determine our primary outcome, our study was underpowered to confirm statistical differences between firms in proportions of successfully performed procedures. For example, approximately 400 additional procedures (or more than 5000 additional admissions) would have been needed to sufficiently power the observed 9% increase in successful attempts that we observed with direct supervision by the procedure service attending (77% versus 86%; P = .64; Table 2). Our current sample size may be adequate in future research if success rates diverge as the experience of the procedure service attending increases. Though expert in performing bedside procedures, he had limited experience teaching them, particularly with the use of a hand‐carried ultrasound device. Just as there is a learning curve to gain the experience to successfully perform procedures,13 so may there be a learning curve to successfully teach procedures.14
Future research could address these limitations by more closely observing the decision‐making processes of physicians who order bedside procedures for general medicine inpatients in various settings. Our findings suggest that although patients' clinical circumstances are likely the most important consideration, nonclinical factors may also affect physicians' decisions.12 Like other multifaceted decision‐making processes of physicians,15 the complexity of this decision is important to examine because, as our pilot data suggest, a procedure service may not lead to more successful procedure attempts or reductions in the number of major complications. Although the cumulative expertise of our service or the innovative methods of training of other institutions may improve the performance of bedside procedures,5, 13 physicians' decisions about whether to order them will remain paramount, because any improvement in procedural competence will do little to reduce the relative danger of unnecessary procedures16 or the missed benefit of procedures left undone. Physicians of inpatients17, 18 should refine the indications for and anticipated benefits from these commonly performed invasive procedures.
- ,,, et al.The nature of adverse events in hospitalized patients: Results of the Harvard Medical Practice Study II.N Engl J Med.1991;324:377–384.
- ,,, et al.Cost of medical injuries in Utah and Colorado.Inquiry.36;255–264.
- ,,,.Procedural Skills Training in Internal Medicine Residencies: A Survey of Program Directors.Ann Intern Med1989;111:932–38.
- ,,, et al.Beyond the comfort zone: residents assess their comfort performing inpatient medicine procedures.Am J Med.2006;119:71.e17–.e24.
- ,,, et al.Creation of an innovative inpatient medical procedure service and a method to evaluate house staff competency.J Gen Intern Med.2004;19:510–513.
- ,,, et al.Variation in the use of cardiac procedures after acute myocardial infarction.N Engl J Med.1995;333:573–578.
- ,,.Frequency and morbidity of inpatient procedures: report of a pilot study from two teaching hospitals.Arch Intern Med.1978;138:1809–1811.
- ,.The impact of diagnostic testing on therapeutic interventions.JAMA.1996;275:1189–1191.
- ,,, et al.Does increased access to primary care reduce hospital readmissions?N Engl J Med.1996;334:1441–1447.
- ,,, et al.Coronary artery bypass graft surgery in Ontario and New York State: which rate is right?Ann Intern Med.1997;126:13–19.
- ,.Avoiding the unintended consequences of growth in medical care. How might more be worse?JAMA.1999;281:446–453.
- ,,.Professional uncertainty and the problem of supplier‐induced demand.Soc Sci Med.1982;811–824.
- ,,,.A curricular initiative for internal medicine residents to enhance proficiency in internal jugular central venous line placement.Mayo Clin Proc.2005;80:212–218.
- ,,, et al.Confidence of Academic General Internists and Family Physicians to Teach Ambulatory Procedures.J Gen Intern Med.2000;15:353–360.
- ,,, et al.The impact of evidence on physicians' inpatient treatment decisions.J Gen Intern Med.2004;19:402–409.
- .Medical care—is more always better?N Engl J Med.2003;349:1665–1667.
- ,.Point/counterpoint: should hospital medicine become a distinct specialty?Hospitalist.2005;9(1):15–19.
- ,,,,.The core competencies in hospital medicine: a framework for curriculum development by the Society of Hospital Medicine.J Hospital Med.2006;1:S1–S95.
Copyright © 2007 Society of Hospital Medicine
