User login
Electronic Order Volume as a Meaningful Component in Estimating Patient Complexity and Resident Physician Workload
Resident physician workload has traditionally been measured by patient census.1,2 However, census and other volume-based metrics such as daily admissions may not accurately reflect workload due to variation in patient complexity. Relative value units (RVUs) are another commonly used marker of workload, but the validity of this metric relies on accurate coding, usually done by the attending physician, and is less directly related to resident physician workload. Because much of hospital-based medicine is mediated through the electronic health record (EHR), which can capture differences in patient complexity,3 electronic records could be harnessed to more comprehensively describe residents’ work. Current government estimates indicate that several hundred companies offer certified EHRs, thanks in large part to the Health Information Technology for Economic and Clinical Health (HITECH) Act of 2009, which aimed to promote adoption and meaningful use of health information technology.4, 5 These systems can collect important data about the usage and operating patterns of physicians, which may provide an insight into workload.6-8
Accurately measuring workload is important because of the direct link that has been drawn between physician workload and quality metrics. In a study of attending hospitalists, higher workload, as measured by patient census and RVUs, was associated with longer lengths of stay and higher costs of hospitalization.9 Another study among medical residents found that as daily admissions increased, length of stay, cost, and inpatient mortality appeared to rise.10 Although these studies used only volume-based workload metrics, the implication that high workload may negatively impact patient care hints at a possible trade-off between the two that should inform discussions of physician productivity.
In the current study, we examine whether data obtained from the EHR, particularly electronic order volume, could provide valuable information, in addition to patient volume, about resident physician workload. We first tested the feasibility and validity of using electronic order volume as an important component of clinical workload by examining the relationship between electronic order volume and well-established factors that are likely to increase the workload of residents, including patient level of care and severity of illness. Then, using order volume as a marker for workload, we sought to describe whether higher order volumes were associated with two discharge-related quality metrics, completion of a high-quality after-visit summary and timely discharge summary, postulating that quality metrics may suffer when residents are busier.
METHODS
Study Design and Setting
We performed a single-center retrospective cohort study of patients admitted to the internal medicine service at the University of California, San Francisco (UCSF) Medical Center between May 1, 2015 and July 31, 2016. UCSF is a 600-bed academic medical center, and the inpatient internal medicine teaching service manages an average daily census of 80-90 patients. Medicine teams care for patients on the general acute-care wards, the step-down units (for patients with higher acuity of care), and also patients in the intensive care unit (ICU). ICU patients are comanaged by general medicine teams and intensive care teams; internal medicine teams enter all electronic orders for ICU patients, except for orders for respiratory care or sedating medications. The inpatient internal medicine teaching service comprises eight teams each supervised by an attending physician, a senior resident (in the second or third year of residency training), two interns, and a third- and/or fourth-year medical student. Residents place all clinical orders and complete all clinical documentation through the EHR (Epic Systems, Verona, Wisconsin).11 Typically, the bulk of the orders and documentation, including discharge documentation, is performed by interns; however, the degree of senior resident involvement in these tasks is variable and team-dependent. In addition to the eight resident teams, there are also four attending hospitalist-only internal medicine teams, who manage a service of ~30-40 patients.
Study Population
Our study population comprised all hospitalized adults admitted to the eight resident-run teams on the internal medicine teaching service. Patients cared for by hospitalist-only teams were not included in this analysis. Because the focus of our study was on hospitalizations, individual patients may have been included multiple times over the course of the study. Hospitalizations were excluded if they did not have complete Medicare Severity-Diagnosis Related Group (MS-DRG) data,12 since this was used as our severity of illness marker. This occurred either because patients were not discharged by the end of the study period or because they had a length of stay of less than one day, because this metric was not assigned to these short-stay (observation) patients.
Data Collection
All electronic orders placed during the study period were obtained by extracting data from Epic’s Clarity database. Our EHR allows for the use of order sets; each order in these sets was counted individually, so that an order set with several orders would not be identified as one order. We identified the time and date that the order was placed, the ordering physician, the identity of the patient for which the order was placed, and the location of the patient when the order was placed, to determine the level of care (ICU, step-down, or general medicine unit). To track the composite volume of orders placed by resident teams, we matched each ordering physician to his or her corresponding resident team using our physician scheduling database, Amion (Spiral Software). We obtained team census by tabulating the total number of patients that a single resident team placed orders on over the course of a given calendar day. From billing data, we identified the MS-DRG weight that was assigned at the end of each hospitalization. Finally, we collected data on adherence to two discharge-related quality metrics to determine whether increased order volume was associated with decreased rates of adherence to these metrics. Using departmental patient-level quality improvement data, we determined whether each metric was met on discharge at the patient level. We also extracted patient-level demographic data, including age, sex, and insurance status, from this departmental quality improvement database.
Discharge Quality Outcome Metrics
We hypothesized that as the total daily electronic orders of a resident team increased, the rate of completion of two discharge-related quality metrics would decline due to the greater time constraints placed on the teams. The first metric we used was the completion of a high-quality after-visit summary (AVS), which has been described by the Centers for Medicare and Medicaid Services as part of its Meaningful Use Initiative.13 It was selected by the residents in our program as a particularly high-priority quality metric. Our institution specifically defines a “high-quality” AVS as including the following three components: a principal hospital problem, patient instructions, and follow-up information. The second discharge-related quality metric was the completion of a timely discharge summary, another measure recognized as a critical component in high-quality care.14 To be considered timely, the discharge summary had to be filed no later than 24 hours after the discharge order was entered into the EHR. This metric was more recently tracked by the internal medicine department and was not selected by the residents as a high-priority metric.
Statistical Analysis
To examine how the order volume per day changed throughout each sequential day of hospital admission, mean orders per hospital day with 95% CIs were plotted. We performed an aggregate analysis of all orders placed for each patient per day across three different levels of care (ICU, step-down, and general medicine). For each day of the study period, we summed all orders for all patients according to their location and divided by the number of total patients in each location to identify the average number of orders written for an ICU, step-down, and general medicine patient that day. We then calculated the mean daily orders for an ICU, step-down, and general medicine patient over the entire study period. We used ANOVA to test for statistically significant differences between the mean daily orders between these locations.
To examine the relationship between severity of illness and order volume, we performed an unadjusted patient-level analysis of orders per patient in the first three days of each hospitalization and stratified the data by the MS-DRG payment weight, which we divided into four quartiles. For each quartile, we calculated the mean number of orders placed in the first three days of admission and used ANOVA to test for statistically significant differences. We restricted the orders to the first three days of hospitalization instead of calculating mean orders per day of hospitalization because we postulated that the majority of orders were entered in these first few days and that with increasing length of stay (which we expected to occur with higher MS-DRG weight), the order volume becomes highly variable, which would tend to skew the mean orders per day.
We used multivariable logistic regression to determine whether the volume of electronic orders on the day of a given patient’s discharge, and also on the day before a given patient’s discharge, was a significant predictor of receiving a high-quality AVS. We adjusted for team census on the day of discharge, MS-DRG weight, age, sex, and insurance status. We then conducted a separate analysis of the association between electronic order volume and likelihood of completing a timely discharge summary among patients where discharge summary data were available. Logistic regression for each case was performed independently, so that team orders on the day prior to a patient’s discharge were not included in the model for the relationship between team orders on the day of a patient’s discharge and the discharge-related quality metric of interest, and vice versa, since including both in the model would be potentially disruptive given that orders on the day before and day of a patient’s discharge are likely correlated.
We also performed a subanalysis in which we restricted orders to only those placed during the daytime hours (7
IRB Approval
The study was approved by the UCSF Institutional Review Board and was granted a waiver of informed consent.
RESULTS
Population
We identified 7,296 eligible hospitalizations during the study period. After removing hospitalizations according to our exclusion criteria (Figure 1), there were 5,032 hospitalizations that were used in the analysis for which a total of 929,153 orders were written. The vast majority of patients received at least one order per day; fewer than 1% of encounter-days had zero associated orders. The top 10 discharge diagnoses identified in the cohort are listed in Appendix Table 1. A breakdown of orders by order type, across the entire cohort, is displayed in Appendix Table 2. The mean number of orders per patient per day of hospitalization is plotted in the Appendix Figure, which indicates that the number of orders is highest on the day of admission, decreases significantly after the first few days, and becomes increasingly variable with longer lengths of stay.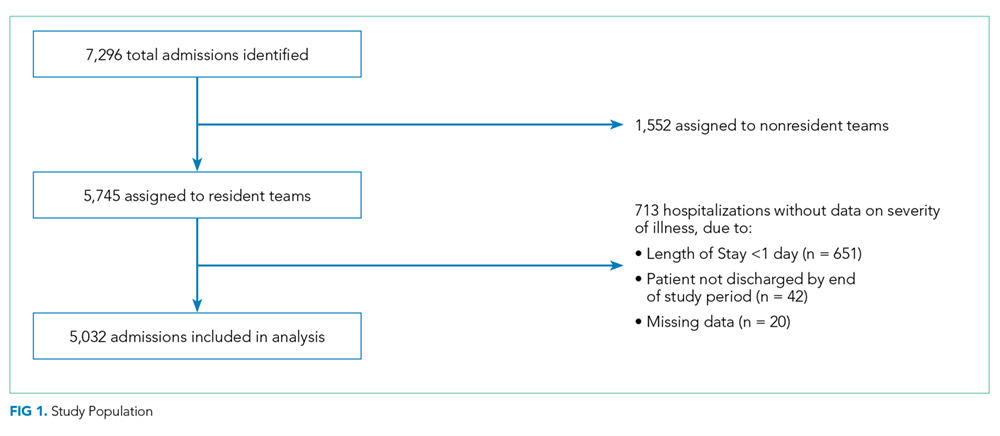
Patient Level of Care and Severity of Illness Metrics
Patients at a higher level of care had, on average, more orders entered per day. The mean order frequency was 40 orders per day for an ICU patient (standard deviation [SD] 13, range 13-134), 24 for a step-down patient (SD 6, range 11-48), and 19 for a general medicine unit patient (SD 3, range 10-31). The difference in mean daily orders was statistically significant (P < .001, Figure 2a).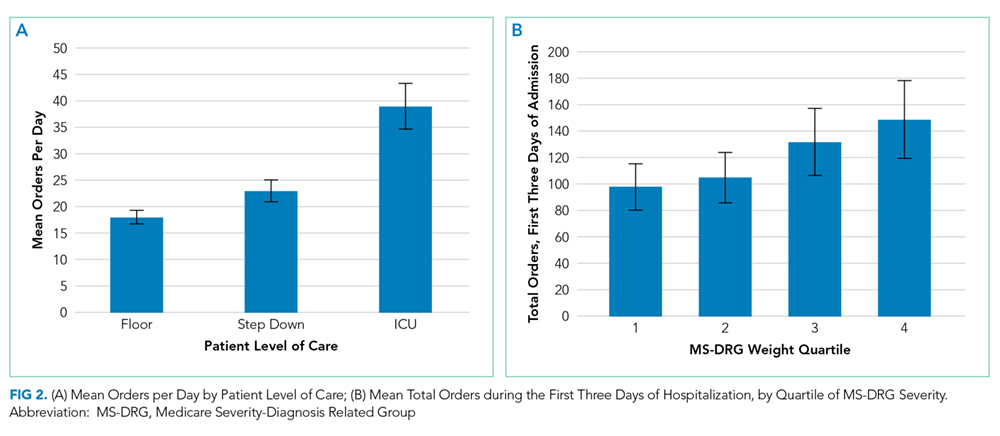
Orders also correlated with increasing severity of illness. Patients in the lowest quartile of MS-DRG weight received, on average, 98 orders in the first three days of hospitalization (SD 35, range 2-349), those in the second quartile received 105 orders (SD 38, range 10-380), those in the third quartile received 132 orders (SD 51, range 17-436), and those in the fourth and highest quartile received 149 orders (SD 59, range 32-482). Comparisons between each of these severity of illness categories were significant (P < .001, Figure 2b).
Discharge-Related Quality Metrics
The median number of orders per internal medicine team per day was 343 (IQR 261- 446). Of the 5,032 total discharged patients, 3,657 (73%) received a high-quality AVS on discharge. After controlling for team census, severity of illness, and demographic factors, there was no statistically significant association between total orders on the day of discharge and odds of receiving a high-quality AVS (OR 1.01; 95% CI 0.96-1.06), or between team orders placed the day prior to discharge and odds of receiving a high-quality AVS (OR 0.99; 95% CI 0.95-1.04; Table 1). When we restricted our analysis to orders placed during daytime hours (7 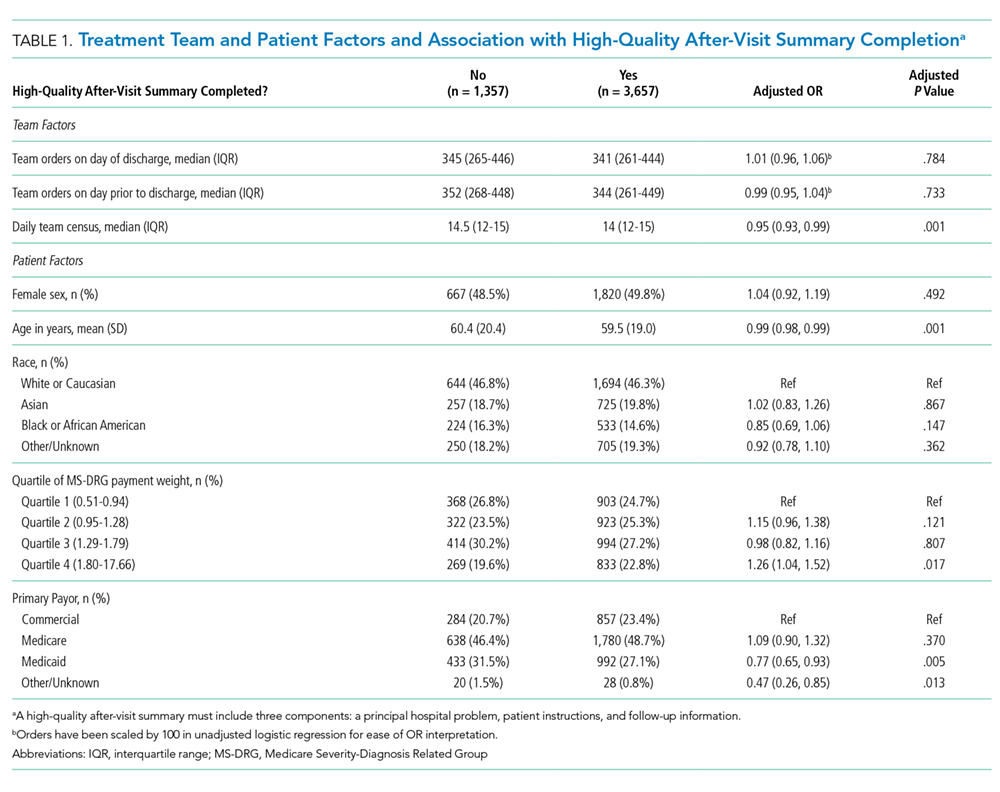
There were 3,835 patients for whom data on timing of discharge summary were available. Of these, 3,455 (91.2%) had a discharge summary completed within 24 hours. After controlling for team census, severity of illness, and demographic factors, there was no statistically significant association between total orders placed by the team on a patient’s day of discharge and odds of receiving a timely discharge summary (OR 0.96; 95% CI 0.88-1.05). However, patients were 12% less likely to receive a timely discharge summary for every 100 extra orders the team placed on the day prior to discharge (OR 0.88, 95% CI 0.82-0.95). Patients who received a timely discharge summary were cared for by teams who placed a median of 345 orders the day prior to their discharge, whereas those that did not receive a timely discharge summary were cared for by teams who placed a significantly higher number of orders (375) on the day prior to discharge (Table 2). When we restricted our analysis to only daytime orders, there were no significant changes in the findings (OR 1.00; 95% CI 0.88-1.14 for orders on the day of discharge; OR 0.84; 95% CI 0.75-0.95 for orders on the day prior to discharge).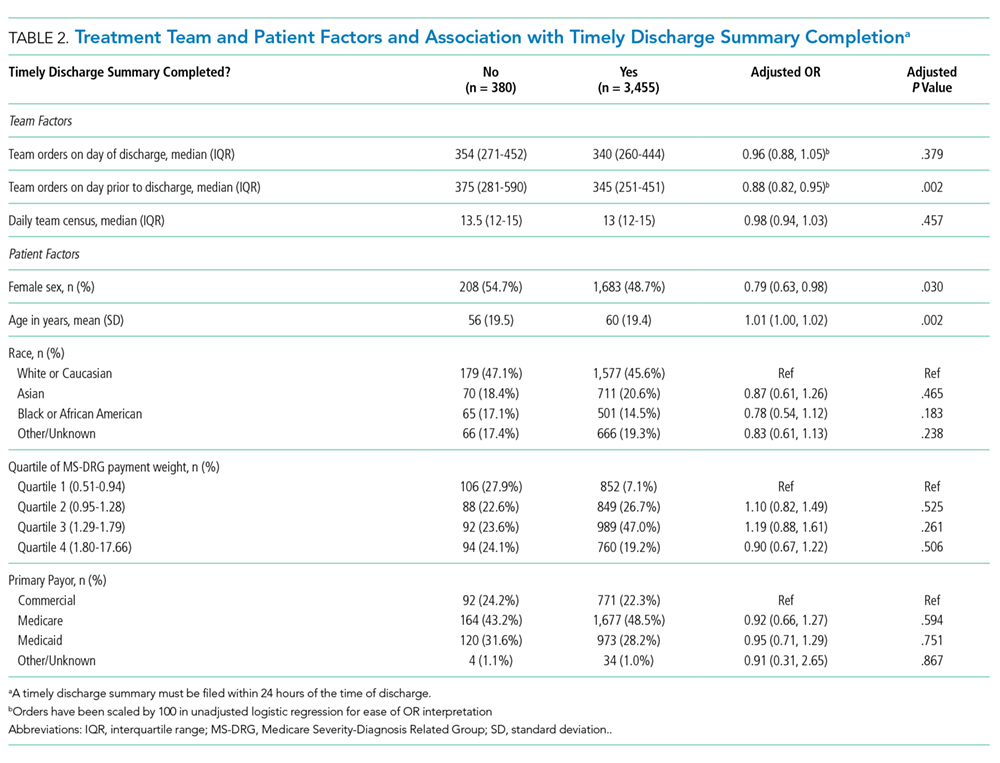
DISCUSSION
We found that electronic order volume may be a marker for patient complexity, which encompasses both level of care and severity of illness, and could be a marker of resident physician workload that harnesses readily available data from an EHR. Recent time-motion studies of internal medicine residents indicate that the majority of trainees’ time is spent on computers, engaged in indirect patient care activities such as reading electronic charts, entering electronic orders, and writing computerized notes.15-18 Capturing these tasks through metrics such as electronic order volume, as we did in this study, can provide valuable insights into resident physician workflow.
We found that ICU patients received more than twice as many orders per day than did general acute care-level patients. Furthermore, we found that patients whose hospitalizations fell into the highest MS-DRG weight quartile received approximately 50% more orders during the first three days of admission compared to that of patients whose hospitalizations fell into the lowest quartile. This strong association indicates that electronic order volume could provide meaningful additional information, in concert with other factors such as census, to describe resident physician workload.
We did not find that our workload measure was significantly associated with high-quality AVS completion. There are several possible explanations for this finding. First, adherence to this quality metric may be independent of workload, possibly because it is highly prioritized by residents at our institution. Second, adherence may only be impacted at levels of workload greater than what was experienced by the residents in our study. Finally, electronic order volume may not encompass enough of total workload to be reliably representative of resident work. However, the tight correlation between electronic order volume with severity of illness and level of care, in conjunction with the finding that patients were less likely to receive a timely discharge summary when workload was high on the day prior to a patient’s discharge, suggests that electronic order volume does indeed encompass a meaningful component of workload, and that with higher workload, adherence to some quality metrics may decline. We found that patients who received a timely discharge summary were discharged by teams who entered 30 fewer orders on the day before discharge compared with patients who did not receive a timely discharge summary. In addition to being statistically significant, it is also likely that this difference is clinically significant, although a determination of clinical significance is outside the scope of this study. Further exploration into the relationship between order volume and other quality metrics that are perhaps more sensitive to workload would be interesting.
The primary strength of our study is in how it demonstrates that EHRs can be harnessed to provide additional insights into clinical workload in a quantifiable and automated manner. Although there are a wide range of EHRs currently in use across the country, the capability to track electronic orders is common and could therefore be used broadly across institutions, with tailoring and standardization specific to each site. This technique is similar to that used by prior investigators who characterized the workload of pediatric residents by orders entered and notes written in the electronic medical record.19 However, our study is unique, in that we explored the relationship between electronic order volume and patient-level severity metrics as well as discharge-related quality metrics.
Our study is limited by several factors. When conceptualizing resident workload, several other elements that contribute to a sense of “busyness” may be independent of electronic orders and were not measured in our study.20 These include communication factors (such as language discordance, discussion with consulting services, and difficult end-of-life discussions), environmental factors (such as geographic localization), resident physician team factors (such as competing clinical or educational responsibilities), timing (in terms of day of week as well as time of year, since residents in July likely feel “busier” than residents in May), and ultimate discharge destination for patients (those going to a skilled nursing facility may require discharge documentation more urgently). Additionally, we chose to focus on the workload of resident teams, as represented by team orders, as opposed to individual work, which may be more directly correlated to our outcomes of interest, completion of a high-quality AVS, and timely discharge summary, which are usually performed by individuals.
Furthermore, we did not measure the relationship between our objective measure of workload and clinical endpoints. Instead, we chose to focus on process measures because they are less likely to be confounded by clinical factors independent of physician workload.21 Future studies should also consider obtaining direct resident-level measures of “busyness” or burnout, or other resident-centered endpoints, such as whether residents left the hospital at times consistent with duty hour regulations or whether they were able to attend educational conferences.
These limitations pose opportunities for further efforts to more comprehensively characterize clinical workload. Additional research is needed to understand and quantify the impact of patient, physician, and environmental factors that are not reflected by electronic order volume. Furthermore, an exploration of other electronic surrogates for clinical workload, such as paging volume and other EHR-derived data points, could also prove valuable in further describing the clinical workload. Future studies should also examine whether there is a relationship between these novel markers of workload and further outcomes, including both process measures and clinical endpoints.
CONCLUSIONS
Electronic order volume may provide valuable additional information for estimating the workload of resident physicians caring for hospitalized patients. Further investigation to determine whether the statistically significant differences identified in this study are clinically significant, how the technique used in this work may be applied to different EHRs, an examination of other EHR-derived metrics that may represent workload, and an exploration of additional patient-centered outcomes may be warranted.
Disclosures
Rajkomar reports personal fees from Google LLC, outside the submitted work. Dr. Khanna reports that during the conduct of the study, his salary, and the development of CareWeb (a communication platform that includes a smartphone-based paging application in use in several inpatient clinical units at University of California, San Francisco [UCSF] Medical Center) were supported by funding from the Center for Digital Health Innovation at UCSF. The CareWeb software has been licensed by Voalte.
Disclaimer
The views expressed in the submitted article are of the authors and not an official position of the institution.
1. Lurie JD, Wachter RM. Hospitalist staffing requirements. Eff Clin Pract. 1999;2(3):126-30. PubMed
2. Wachter RM. Hospitalist workload: The search for the magic number. JAMA Intern Med. 2014;174(5):794-795. doi: 10.1001/jamainternmed.2014.18. PubMed
3. Adler-Milstein J, DesRoches CM, Kralovec P, et al. Electronic health record adoption in US hospitals: progress continues, but challenges persist. Health Aff (Millwood). 2015;34(12):2174-2180. doi: 10.1377/hlthaff.2015.0992. PubMed
4. The Office of the National Coordinator for Health Information Technology, Health IT Dashboard. [cited 2018 April 4]. https://dashboard.healthit.gov/quickstats/quickstats.php Accessed June 28, 2018.
5. Index for Excerpts from the American Recovery and Reinvestment Act of 2009. Health Information Technology (HITECH) Act 2009. p. 112-164.
6. van der Sijs H, Aarts J, Vulto A, Berg M. Overriding of drug safety alerts in computerized physician order entry. J Am Med Inform Assoc. 2006;13(2):138-147. doi: 10.1197/jamia.M1809. PubMed
7. Ancker JS, Kern LM1, Edwards A, et al. How is the electronic health record being used? Use of EHR data to assess physician-level variability in technology use. J Am Med Inform Assoc. 2014;21(6):1001-1008. doi: 10.1136/amiajnl-2013-002627. PubMed
8. Hendey GW, Barth BE, Soliz T. Overnight and postcall errors in medication orders. Acad Emerg Med. 2005;12(7):629-634. doi: 10.1197/j.aem.2005.02.009. PubMed
9. Elliott DJ, Young RS2, Brice J3, Aguiar R4, Kolm P. Effect of hospitalist workload on the quality and efficiency of care. JAMA Intern Med. 2014;174(5):786-793. doi: 10.1001/jamainternmed.2014.300. PubMed
10. Ong M, Bostrom A, Vidyarthi A, McCulloch C, Auerbach A. House staff team workload and organization effects on patient outcomes in an academic general internal medicine inpatient service. Arch Intern Med. 2007;167(1):47-52. doi: 10.1001/archinte.167.1.47. PubMed
11. Epic Systems. [cited 2017 March 28]; Available from: http://www.epic.com/. Accessed June 28, 2018.
12. MS-DRG Classifications and software. https://www.cms.gov/Medicare/Medicare-Fee-for-Service-Payment/AcuteInpatientPPS/MS-DRG-Classifications-and-Software.html. Accessed June 28, 2018.
13. Hummel J, Evans P. Providing Clinical Summaries to Patients after Each Office Visit: A Technical Guide. [cited 2017 March 27]. https://www.healthit.gov/sites/default/files/measure-tools/avs-tech-guide.pdf. Accessed June 28, 2018.
14. Haycock M, Stuttaford L, Ruscombe-King O, Barker Z, Callaghan K, Davis T. Improving the percentage of electronic discharge summaries completed within 24 hours of discharge. BMJ Qual Improv Rep. 2014;3(1) pii: u205963.w2604. doi: 10.1136/bmjquality.u205963.w2604. PubMed
15. Block L, Habicht R, Wu AW, et al. In the wake of the 2003 and 2011 duty hours regulations, how do internal medicine interns spend their time? J Gen Intern Med. 2013;28(8):1042-1047. doi: 10.1007/s11606-013-2376-6. PubMed
16. Wenger N, Méan M, Castioni J, Marques-Vidal P, Waeber G, Garnier A. Allocation of internal medicine resident time in a Swiss hospital: a time and motion study of day and evening shifts. Ann Intern Med. 2017;166(8):579-586. doi: 10.7326/M16-2238. PubMed
17. Mamykina L, Vawdrey DK, Hripcsak G. How do residents spend their shift time? A time and motion study with a particular focus on the use of computers. Acad Med. 2016;91(6):827-832. doi: 10.1097/ACM.0000000000001148. PubMed
18. Fletcher KE, Visotcky AM, Slagle JM, Tarima S, Weinger MB, Schapira MM. The composition of intern work while on call. J Gen Intern Med. 2012;27(11):1432-1437. doi: 10.1007/s11606-012-2120-7. PubMed
19. Was A, Blankenburg R, Park KT. Pediatric resident workload intensity and variability. Pediatrics 2016;138(1):e20154371. doi: 10.1542/peds.2015-4371. PubMed
20. Michtalik HJ, Pronovost PJ, Marsteller JA, Spetz J, Brotman DJ. Developing a model for attending physician workload and outcomes. JAMA Intern Med. 2013;173(11):1026-1028. doi: 10.1001/jamainternmed.2013.405. PubMed
21. Mant J. Process versus outcome indicators in the assessment of quality of health care. Int J Qual Health Care. 2001;13(6):475-480. doi: 10.1093/intqhc/13.6.475. PubMed
Resident physician workload has traditionally been measured by patient census.1,2 However, census and other volume-based metrics such as daily admissions may not accurately reflect workload due to variation in patient complexity. Relative value units (RVUs) are another commonly used marker of workload, but the validity of this metric relies on accurate coding, usually done by the attending physician, and is less directly related to resident physician workload. Because much of hospital-based medicine is mediated through the electronic health record (EHR), which can capture differences in patient complexity,3 electronic records could be harnessed to more comprehensively describe residents’ work. Current government estimates indicate that several hundred companies offer certified EHRs, thanks in large part to the Health Information Technology for Economic and Clinical Health (HITECH) Act of 2009, which aimed to promote adoption and meaningful use of health information technology.4, 5 These systems can collect important data about the usage and operating patterns of physicians, which may provide an insight into workload.6-8
Accurately measuring workload is important because of the direct link that has been drawn between physician workload and quality metrics. In a study of attending hospitalists, higher workload, as measured by patient census and RVUs, was associated with longer lengths of stay and higher costs of hospitalization.9 Another study among medical residents found that as daily admissions increased, length of stay, cost, and inpatient mortality appeared to rise.10 Although these studies used only volume-based workload metrics, the implication that high workload may negatively impact patient care hints at a possible trade-off between the two that should inform discussions of physician productivity.
In the current study, we examine whether data obtained from the EHR, particularly electronic order volume, could provide valuable information, in addition to patient volume, about resident physician workload. We first tested the feasibility and validity of using electronic order volume as an important component of clinical workload by examining the relationship between electronic order volume and well-established factors that are likely to increase the workload of residents, including patient level of care and severity of illness. Then, using order volume as a marker for workload, we sought to describe whether higher order volumes were associated with two discharge-related quality metrics, completion of a high-quality after-visit summary and timely discharge summary, postulating that quality metrics may suffer when residents are busier.
METHODS
Study Design and Setting
We performed a single-center retrospective cohort study of patients admitted to the internal medicine service at the University of California, San Francisco (UCSF) Medical Center between May 1, 2015 and July 31, 2016. UCSF is a 600-bed academic medical center, and the inpatient internal medicine teaching service manages an average daily census of 80-90 patients. Medicine teams care for patients on the general acute-care wards, the step-down units (for patients with higher acuity of care), and also patients in the intensive care unit (ICU). ICU patients are comanaged by general medicine teams and intensive care teams; internal medicine teams enter all electronic orders for ICU patients, except for orders for respiratory care or sedating medications. The inpatient internal medicine teaching service comprises eight teams each supervised by an attending physician, a senior resident (in the second or third year of residency training), two interns, and a third- and/or fourth-year medical student. Residents place all clinical orders and complete all clinical documentation through the EHR (Epic Systems, Verona, Wisconsin).11 Typically, the bulk of the orders and documentation, including discharge documentation, is performed by interns; however, the degree of senior resident involvement in these tasks is variable and team-dependent. In addition to the eight resident teams, there are also four attending hospitalist-only internal medicine teams, who manage a service of ~30-40 patients.
Study Population
Our study population comprised all hospitalized adults admitted to the eight resident-run teams on the internal medicine teaching service. Patients cared for by hospitalist-only teams were not included in this analysis. Because the focus of our study was on hospitalizations, individual patients may have been included multiple times over the course of the study. Hospitalizations were excluded if they did not have complete Medicare Severity-Diagnosis Related Group (MS-DRG) data,12 since this was used as our severity of illness marker. This occurred either because patients were not discharged by the end of the study period or because they had a length of stay of less than one day, because this metric was not assigned to these short-stay (observation) patients.
Data Collection
All electronic orders placed during the study period were obtained by extracting data from Epic’s Clarity database. Our EHR allows for the use of order sets; each order in these sets was counted individually, so that an order set with several orders would not be identified as one order. We identified the time and date that the order was placed, the ordering physician, the identity of the patient for which the order was placed, and the location of the patient when the order was placed, to determine the level of care (ICU, step-down, or general medicine unit). To track the composite volume of orders placed by resident teams, we matched each ordering physician to his or her corresponding resident team using our physician scheduling database, Amion (Spiral Software). We obtained team census by tabulating the total number of patients that a single resident team placed orders on over the course of a given calendar day. From billing data, we identified the MS-DRG weight that was assigned at the end of each hospitalization. Finally, we collected data on adherence to two discharge-related quality metrics to determine whether increased order volume was associated with decreased rates of adherence to these metrics. Using departmental patient-level quality improvement data, we determined whether each metric was met on discharge at the patient level. We also extracted patient-level demographic data, including age, sex, and insurance status, from this departmental quality improvement database.
Discharge Quality Outcome Metrics
We hypothesized that as the total daily electronic orders of a resident team increased, the rate of completion of two discharge-related quality metrics would decline due to the greater time constraints placed on the teams. The first metric we used was the completion of a high-quality after-visit summary (AVS), which has been described by the Centers for Medicare and Medicaid Services as part of its Meaningful Use Initiative.13 It was selected by the residents in our program as a particularly high-priority quality metric. Our institution specifically defines a “high-quality” AVS as including the following three components: a principal hospital problem, patient instructions, and follow-up information. The second discharge-related quality metric was the completion of a timely discharge summary, another measure recognized as a critical component in high-quality care.14 To be considered timely, the discharge summary had to be filed no later than 24 hours after the discharge order was entered into the EHR. This metric was more recently tracked by the internal medicine department and was not selected by the residents as a high-priority metric.
Statistical Analysis
To examine how the order volume per day changed throughout each sequential day of hospital admission, mean orders per hospital day with 95% CIs were plotted. We performed an aggregate analysis of all orders placed for each patient per day across three different levels of care (ICU, step-down, and general medicine). For each day of the study period, we summed all orders for all patients according to their location and divided by the number of total patients in each location to identify the average number of orders written for an ICU, step-down, and general medicine patient that day. We then calculated the mean daily orders for an ICU, step-down, and general medicine patient over the entire study period. We used ANOVA to test for statistically significant differences between the mean daily orders between these locations.
To examine the relationship between severity of illness and order volume, we performed an unadjusted patient-level analysis of orders per patient in the first three days of each hospitalization and stratified the data by the MS-DRG payment weight, which we divided into four quartiles. For each quartile, we calculated the mean number of orders placed in the first three days of admission and used ANOVA to test for statistically significant differences. We restricted the orders to the first three days of hospitalization instead of calculating mean orders per day of hospitalization because we postulated that the majority of orders were entered in these first few days and that with increasing length of stay (which we expected to occur with higher MS-DRG weight), the order volume becomes highly variable, which would tend to skew the mean orders per day.
We used multivariable logistic regression to determine whether the volume of electronic orders on the day of a given patient’s discharge, and also on the day before a given patient’s discharge, was a significant predictor of receiving a high-quality AVS. We adjusted for team census on the day of discharge, MS-DRG weight, age, sex, and insurance status. We then conducted a separate analysis of the association between electronic order volume and likelihood of completing a timely discharge summary among patients where discharge summary data were available. Logistic regression for each case was performed independently, so that team orders on the day prior to a patient’s discharge were not included in the model for the relationship between team orders on the day of a patient’s discharge and the discharge-related quality metric of interest, and vice versa, since including both in the model would be potentially disruptive given that orders on the day before and day of a patient’s discharge are likely correlated.
We also performed a subanalysis in which we restricted orders to only those placed during the daytime hours (7
IRB Approval
The study was approved by the UCSF Institutional Review Board and was granted a waiver of informed consent.
RESULTS
Population
We identified 7,296 eligible hospitalizations during the study period. After removing hospitalizations according to our exclusion criteria (Figure 1), there were 5,032 hospitalizations that were used in the analysis for which a total of 929,153 orders were written. The vast majority of patients received at least one order per day; fewer than 1% of encounter-days had zero associated orders. The top 10 discharge diagnoses identified in the cohort are listed in Appendix Table 1. A breakdown of orders by order type, across the entire cohort, is displayed in Appendix Table 2. The mean number of orders per patient per day of hospitalization is plotted in the Appendix Figure, which indicates that the number of orders is highest on the day of admission, decreases significantly after the first few days, and becomes increasingly variable with longer lengths of stay.
Patient Level of Care and Severity of Illness Metrics
Patients at a higher level of care had, on average, more orders entered per day. The mean order frequency was 40 orders per day for an ICU patient (standard deviation [SD] 13, range 13-134), 24 for a step-down patient (SD 6, range 11-48), and 19 for a general medicine unit patient (SD 3, range 10-31). The difference in mean daily orders was statistically significant (P < .001, Figure 2a).
Orders also correlated with increasing severity of illness. Patients in the lowest quartile of MS-DRG weight received, on average, 98 orders in the first three days of hospitalization (SD 35, range 2-349), those in the second quartile received 105 orders (SD 38, range 10-380), those in the third quartile received 132 orders (SD 51, range 17-436), and those in the fourth and highest quartile received 149 orders (SD 59, range 32-482). Comparisons between each of these severity of illness categories were significant (P < .001, Figure 2b).
Discharge-Related Quality Metrics
The median number of orders per internal medicine team per day was 343 (IQR 261- 446). Of the 5,032 total discharged patients, 3,657 (73%) received a high-quality AVS on discharge. After controlling for team census, severity of illness, and demographic factors, there was no statistically significant association between total orders on the day of discharge and odds of receiving a high-quality AVS (OR 1.01; 95% CI 0.96-1.06), or between team orders placed the day prior to discharge and odds of receiving a high-quality AVS (OR 0.99; 95% CI 0.95-1.04; Table 1). When we restricted our analysis to orders placed during daytime hours (7
There were 3,835 patients for whom data on timing of discharge summary were available. Of these, 3,455 (91.2%) had a discharge summary completed within 24 hours. After controlling for team census, severity of illness, and demographic factors, there was no statistically significant association between total orders placed by the team on a patient’s day of discharge and odds of receiving a timely discharge summary (OR 0.96; 95% CI 0.88-1.05). However, patients were 12% less likely to receive a timely discharge summary for every 100 extra orders the team placed on the day prior to discharge (OR 0.88, 95% CI 0.82-0.95). Patients who received a timely discharge summary were cared for by teams who placed a median of 345 orders the day prior to their discharge, whereas those that did not receive a timely discharge summary were cared for by teams who placed a significantly higher number of orders (375) on the day prior to discharge (Table 2). When we restricted our analysis to only daytime orders, there were no significant changes in the findings (OR 1.00; 95% CI 0.88-1.14 for orders on the day of discharge; OR 0.84; 95% CI 0.75-0.95 for orders on the day prior to discharge).
DISCUSSION
We found that electronic order volume may be a marker for patient complexity, which encompasses both level of care and severity of illness, and could be a marker of resident physician workload that harnesses readily available data from an EHR. Recent time-motion studies of internal medicine residents indicate that the majority of trainees’ time is spent on computers, engaged in indirect patient care activities such as reading electronic charts, entering electronic orders, and writing computerized notes.15-18 Capturing these tasks through metrics such as electronic order volume, as we did in this study, can provide valuable insights into resident physician workflow.
We found that ICU patients received more than twice as many orders per day than did general acute care-level patients. Furthermore, we found that patients whose hospitalizations fell into the highest MS-DRG weight quartile received approximately 50% more orders during the first three days of admission compared to that of patients whose hospitalizations fell into the lowest quartile. This strong association indicates that electronic order volume could provide meaningful additional information, in concert with other factors such as census, to describe resident physician workload.
We did not find that our workload measure was significantly associated with high-quality AVS completion. There are several possible explanations for this finding. First, adherence to this quality metric may be independent of workload, possibly because it is highly prioritized by residents at our institution. Second, adherence may only be impacted at levels of workload greater than what was experienced by the residents in our study. Finally, electronic order volume may not encompass enough of total workload to be reliably representative of resident work. However, the tight correlation between electronic order volume with severity of illness and level of care, in conjunction with the finding that patients were less likely to receive a timely discharge summary when workload was high on the day prior to a patient’s discharge, suggests that electronic order volume does indeed encompass a meaningful component of workload, and that with higher workload, adherence to some quality metrics may decline. We found that patients who received a timely discharge summary were discharged by teams who entered 30 fewer orders on the day before discharge compared with patients who did not receive a timely discharge summary. In addition to being statistically significant, it is also likely that this difference is clinically significant, although a determination of clinical significance is outside the scope of this study. Further exploration into the relationship between order volume and other quality metrics that are perhaps more sensitive to workload would be interesting.
The primary strength of our study is in how it demonstrates that EHRs can be harnessed to provide additional insights into clinical workload in a quantifiable and automated manner. Although there are a wide range of EHRs currently in use across the country, the capability to track electronic orders is common and could therefore be used broadly across institutions, with tailoring and standardization specific to each site. This technique is similar to that used by prior investigators who characterized the workload of pediatric residents by orders entered and notes written in the electronic medical record.19 However, our study is unique, in that we explored the relationship between electronic order volume and patient-level severity metrics as well as discharge-related quality metrics.
Our study is limited by several factors. When conceptualizing resident workload, several other elements that contribute to a sense of “busyness” may be independent of electronic orders and were not measured in our study.20 These include communication factors (such as language discordance, discussion with consulting services, and difficult end-of-life discussions), environmental factors (such as geographic localization), resident physician team factors (such as competing clinical or educational responsibilities), timing (in terms of day of week as well as time of year, since residents in July likely feel “busier” than residents in May), and ultimate discharge destination for patients (those going to a skilled nursing facility may require discharge documentation more urgently). Additionally, we chose to focus on the workload of resident teams, as represented by team orders, as opposed to individual work, which may be more directly correlated to our outcomes of interest, completion of a high-quality AVS, and timely discharge summary, which are usually performed by individuals.
Furthermore, we did not measure the relationship between our objective measure of workload and clinical endpoints. Instead, we chose to focus on process measures because they are less likely to be confounded by clinical factors independent of physician workload.21 Future studies should also consider obtaining direct resident-level measures of “busyness” or burnout, or other resident-centered endpoints, such as whether residents left the hospital at times consistent with duty hour regulations or whether they were able to attend educational conferences.
These limitations pose opportunities for further efforts to more comprehensively characterize clinical workload. Additional research is needed to understand and quantify the impact of patient, physician, and environmental factors that are not reflected by electronic order volume. Furthermore, an exploration of other electronic surrogates for clinical workload, such as paging volume and other EHR-derived data points, could also prove valuable in further describing the clinical workload. Future studies should also examine whether there is a relationship between these novel markers of workload and further outcomes, including both process measures and clinical endpoints.
CONCLUSIONS
Electronic order volume may provide valuable additional information for estimating the workload of resident physicians caring for hospitalized patients. Further investigation to determine whether the statistically significant differences identified in this study are clinically significant, how the technique used in this work may be applied to different EHRs, an examination of other EHR-derived metrics that may represent workload, and an exploration of additional patient-centered outcomes may be warranted.
Disclosures
Rajkomar reports personal fees from Google LLC, outside the submitted work. Dr. Khanna reports that during the conduct of the study, his salary, and the development of CareWeb (a communication platform that includes a smartphone-based paging application in use in several inpatient clinical units at University of California, San Francisco [UCSF] Medical Center) were supported by funding from the Center for Digital Health Innovation at UCSF. The CareWeb software has been licensed by Voalte.
Disclaimer
The views expressed in the submitted article are of the authors and not an official position of the institution.
1. Lurie JD, Wachter RM. Hospitalist staffing requirements. Eff Clin Pract. 1999;2(3):126-30. PubMed
2. Wachter RM. Hospitalist workload: The search for the magic number. JAMA Intern Med. 2014;174(5):794-795. doi: 10.1001/jamainternmed.2014.18. PubMed
3. Adler-Milstein J, DesRoches CM, Kralovec P, et al. Electronic health record adoption in US hospitals: progress continues, but challenges persist. Health Aff (Millwood). 2015;34(12):2174-2180. doi: 10.1377/hlthaff.2015.0992. PubMed
4. The Office of the National Coordinator for Health Information Technology, Health IT Dashboard. [cited 2018 April 4]. https://dashboard.healthit.gov/quickstats/quickstats.php Accessed June 28, 2018.
5. Index for Excerpts from the American Recovery and Reinvestment Act of 2009. Health Information Technology (HITECH) Act 2009. p. 112-164.
6. van der Sijs H, Aarts J, Vulto A, Berg M. Overriding of drug safety alerts in computerized physician order entry. J Am Med Inform Assoc. 2006;13(2):138-147. doi: 10.1197/jamia.M1809. PubMed
7. Ancker JS, Kern LM1, Edwards A, et al. How is the electronic health record being used? Use of EHR data to assess physician-level variability in technology use. J Am Med Inform Assoc. 2014;21(6):1001-1008. doi: 10.1136/amiajnl-2013-002627. PubMed
8. Hendey GW, Barth BE, Soliz T. Overnight and postcall errors in medication orders. Acad Emerg Med. 2005;12(7):629-634. doi: 10.1197/j.aem.2005.02.009. PubMed
9. Elliott DJ, Young RS2, Brice J3, Aguiar R4, Kolm P. Effect of hospitalist workload on the quality and efficiency of care. JAMA Intern Med. 2014;174(5):786-793. doi: 10.1001/jamainternmed.2014.300. PubMed
10. Ong M, Bostrom A, Vidyarthi A, McCulloch C, Auerbach A. House staff team workload and organization effects on patient outcomes in an academic general internal medicine inpatient service. Arch Intern Med. 2007;167(1):47-52. doi: 10.1001/archinte.167.1.47. PubMed
11. Epic Systems. [cited 2017 March 28]; Available from: http://www.epic.com/. Accessed June 28, 2018.
12. MS-DRG Classifications and software. https://www.cms.gov/Medicare/Medicare-Fee-for-Service-Payment/AcuteInpatientPPS/MS-DRG-Classifications-and-Software.html. Accessed June 28, 2018.
13. Hummel J, Evans P. Providing Clinical Summaries to Patients after Each Office Visit: A Technical Guide. [cited 2017 March 27]. https://www.healthit.gov/sites/default/files/measure-tools/avs-tech-guide.pdf. Accessed June 28, 2018.
14. Haycock M, Stuttaford L, Ruscombe-King O, Barker Z, Callaghan K, Davis T. Improving the percentage of electronic discharge summaries completed within 24 hours of discharge. BMJ Qual Improv Rep. 2014;3(1) pii: u205963.w2604. doi: 10.1136/bmjquality.u205963.w2604. PubMed
15. Block L, Habicht R, Wu AW, et al. In the wake of the 2003 and 2011 duty hours regulations, how do internal medicine interns spend their time? J Gen Intern Med. 2013;28(8):1042-1047. doi: 10.1007/s11606-013-2376-6. PubMed
16. Wenger N, Méan M, Castioni J, Marques-Vidal P, Waeber G, Garnier A. Allocation of internal medicine resident time in a Swiss hospital: a time and motion study of day and evening shifts. Ann Intern Med. 2017;166(8):579-586. doi: 10.7326/M16-2238. PubMed
17. Mamykina L, Vawdrey DK, Hripcsak G. How do residents spend their shift time? A time and motion study with a particular focus on the use of computers. Acad Med. 2016;91(6):827-832. doi: 10.1097/ACM.0000000000001148. PubMed
18. Fletcher KE, Visotcky AM, Slagle JM, Tarima S, Weinger MB, Schapira MM. The composition of intern work while on call. J Gen Intern Med. 2012;27(11):1432-1437. doi: 10.1007/s11606-012-2120-7. PubMed
19. Was A, Blankenburg R, Park KT. Pediatric resident workload intensity and variability. Pediatrics 2016;138(1):e20154371. doi: 10.1542/peds.2015-4371. PubMed
20. Michtalik HJ, Pronovost PJ, Marsteller JA, Spetz J, Brotman DJ. Developing a model for attending physician workload and outcomes. JAMA Intern Med. 2013;173(11):1026-1028. doi: 10.1001/jamainternmed.2013.405. PubMed
21. Mant J. Process versus outcome indicators in the assessment of quality of health care. Int J Qual Health Care. 2001;13(6):475-480. doi: 10.1093/intqhc/13.6.475. PubMed
Caring Wisely: A Program to Support Frontline Clinicians and Staff in Improving Healthcare Delivery and Reducing Costs
© 2017 Society of Hospital Medicine
Strategies are needed to empower frontline clinicians to work with organizational leadership to reduce healthcare costs and improve high-value care. Caring Wisely® is a program developed by the University of California, San Francisco’s (UCSF) Center for Healthcare Value (CHV), aimed at engaging frontline clinicians and staff, connecting them with implementation experts, and supporting the development of targeted interventions to improve value. Financial savings from the program more than cover program costs. Caring Wisely® provides an institutional model for implementing robust interventions to address areas of low-value care.
Launched in 2013, the annual Caring Wisely® program consists of 3 stages for identifying projects that meet the following criteria:
- Potential to measurably reduce UCSF Health’s costs of care without transferring costs to patients, insurers, or other providers
- Plan for ensuring that health outcomes are maintained or improved
- Envision disseminating the intervention within and beyond UCSF
- Demonstrate commitment and engagement of clinical leadership and frontline staff.
The first stage is the Ideas Contest, a UCSF Health-wide call (to learn more about UCSF Health: https://www.ucsf.edu/sites/default/files/052516_About_UCSF.pdf) to identify areas that may be targeted to reduce unnecessary services, inefficiencies, and healthcare costs. We use a crowdsourcing platform—Open Proposals—to solicit the best ideas from frontline clinicians and staff.1 Open Proposals is a secure, web-based platform for transparent and collaborative proposal development that displays threads of comments, responses, and revisions, and allows submissions to be “liked.” Open Proposals is managed by the UCSF Clinical and Translational Science Institute, funded by the National Center for Advancing Translational Sciences (Grant Number UL1 TR000004) at the National Institutes of Health. Using institutional e-mail lists for faculty, staff and residents, as well as described at monthly managers and directors meetings, the Ideas Contest is announced each year by the Chief Medical Officer and the CHV leadership. The Caring Wisely® Executive Steering Committee, which consists of CHV and senior UCSF Health system leaders, selects the top 5-10 ideas based on the above criteria. Each winning idea receives a $100 gift certificate for a popular restaurant in San Francisco, and the list of winners is announced to the entire UCSF community.
The second stage is the Request for Proposals. The Caring Wisely® program solicits proposals that outline implementation plans to target specific areas identified through the Ideas Contest. Finalists from the Ideas Contest are encouraged to submit proposals that address the problem they identified, but anyone affiliated with UCSF Health may submit a proposal on a winning idea. There is an approximately 4-week open submission period during which applicants submit brief 2-page proposals on the Open Proposal platform. This is followed by a period of optimization that leverages the social media aspect of the Open Proposals platform in which the UCSF Health community asks clarifying questions, make suggestions, and modifications can be made to the proposals. All submissions receive written feedback from at least one Steering Committee member. In addition, the Caring Wisely® Director directly invites relevant UCSF colleagues, administrators, or program leaders to comment on proposals and make suggestions for improvement. Plans for assessing financial and health care delivery impacts are developed in collaboration with the UCSF Health Finance department. UCSF Health managers and leaders who are stakeholders in project proposal areas are consulted to provide input and finalize proposal plans, including the identification of existing personnel who can support and drive the project forward. Proposers use this feedback to revise their applications throughout this stage.
The third stage is Project Implementation. The Caring Wisely® Executive Steering Committee selects up to 3 winners from the submitted proposals. Using the program criteria above, each project is scored independently, discussed in committee, and rescored to identify the top proposals. Each selected project receives a maximum budget of $50,000 that can be used for project materials, activities, and salary support for project leaders or staff. In addition to funding, each project team receives input from the implementation science team to co-develop and implement the intervention with a goal of creating a first-test-of-change within 3-6 months. A key feature of Caring Wisely® is the partnership between project teams and the Caring Wisely® implementation team, which includes a director, program manager, data analysts, and implementation scientists (Table 1).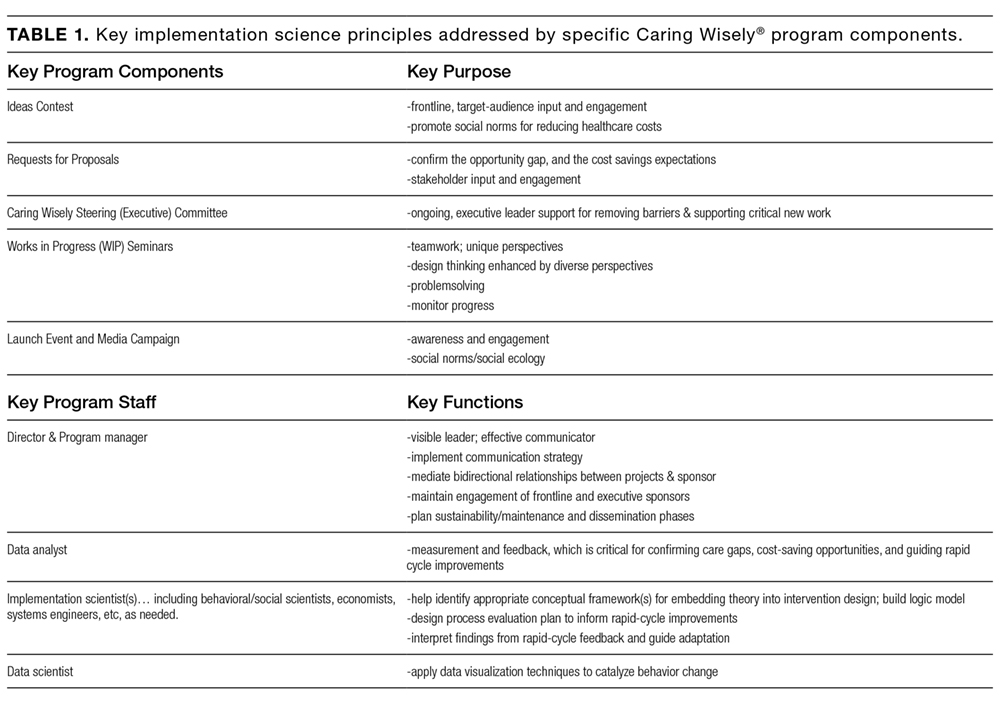
The $150,000 administrative budget for the Caring Wisely® program provides 20% support of the medical director, 50% support of a program manager/analyst, and 10% support of an implementation scientist. Approximately 5% support is donated from additional senior implementation scientists and various UCSF Health experts based on project needs. To make most efficient use of the Caring Wisely® program staff time with the project teams, there is a weekly 60-90 minute works-in-progress session attended by all 3 teams with a rotating schedule for lead presenter during the first 6 months; these meetings occur every 2-3 weeks during the second 6 months. Caring Wisely® program staff and the implementation scientist are also available for 1:1 meetings as needed. The Caring Wisely® Executive Steering Committee is not paid and meets for 90 minutes quarterly. Custom reports and modifications of the electronic health record are provided by the UCSF Health clinical informatics department as part of their operating budget.
The collaboration between the project teams and the implementation science team is guided by the Consolidated Framework for Implementation Research (CFIR)2 and PRECEDE-PROCEED model—a logic model and evaluation tool that is based on a composite of individual behavior change theory and social ecology.3 Table 2 illustrates how we weave PRECEDE-PROCEED and Plan-Do-Study-Act frameworks into project design and strategy. Each funded team is required to submit an end-of-year progress report.
Cost and cost savings estimates were based on administrative financial data obtained through the assistance of the Decision Support Services unit of the Finance Department of UCSF Health. All costs reflect direct institutional costs, rather than charges. For some projects, costs are directly available through computerized dashboards that provide year-to-year comparisons of specific costs of materials, supplies, and services (eg, blood transfusion reduction, surgical supplies project, OR efficiency program). This same dashboard also allows calculation of CMI-adjusted direct costs of hospital care by service line, as used in the perioperative pathways program evaluation. In other cases, the Decision Support Services and/or Caring Wisely® program manager created custom cost reports based on the key performance indicator (eg, nebulizer therapy costs consist of medication costs plus respiratory therapist time; CT scan utilization for suspected pulmonary embolus in emergency department; and antimicrobial utilization for suspected neonatal sepsis).
Ongoing monitoring and sustainability of Caring Wisely® projects is supported by the Caring Wisely® program leaders. Monitoring of ongoing cost savings is based on automated service-line level dashboards related to cost, utilization, and quality outcomes with quarterly updates provided to the Caring Wisely® Steering Committee. Depending on the project or program, appropriate UCSF Health senior leaders determine the level of support within their departments that is required to sustain the program(s). Ongoing monitoring of each program is also included in the strategic deployment visibility room with regular rounding by senior health system executives.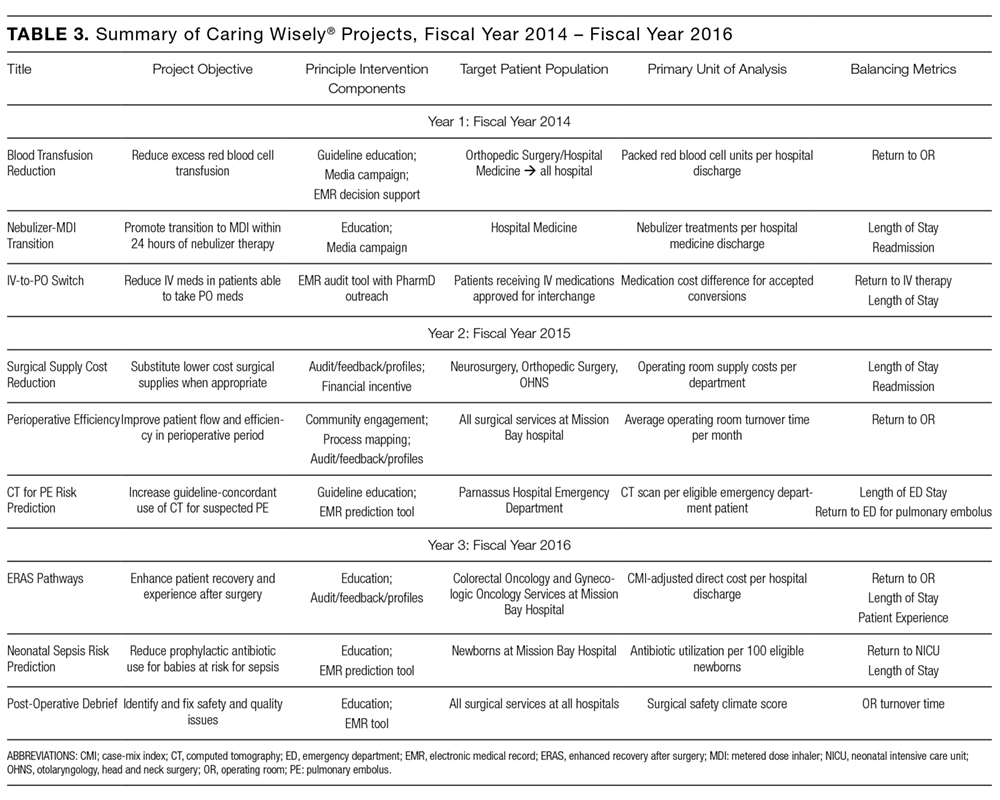
Since 2013, there have been 3 complete Caring Wisely® cycles. The Ideas Contest generated more than 75 ideas in each of the past 3 cycles, ranging from eliminating redundant laboratory or radiological studies to reducing linen and food waste. We received between 13-20 full proposals in each of the request for proposal stages, and 9 projects have been implemented, 3 in each year. Funded projects have been led by a variety of individuals including physicians, nurses, pharmacists, administrators and residents, and topics have ranged from reducing overutilization of tests, supplies and treatments, to improving patient throughput during the perioperative period (Table 3). Estimated cumulative savings to date from Caring Wisely® projects has exceeded $4 million, based on the four projects shown in Table 4. The IV-to-PO switch program and the neonatal sepsis risk prediction project (Table 3) have been successful in reducing unnecessary utilization, but cost and savings estimates are not yet finalized. Three funded projects were equivocal in cost savings but were successful in their primary aims: (1) increasing the appropriateness of CT scan ordering for suspected pulmonary embolus; (2) shortening operating room turnover times; and (3) implementing a postoperative debrief program for the systematic documentation of safety events, waste, and inefficiencies related to surgery.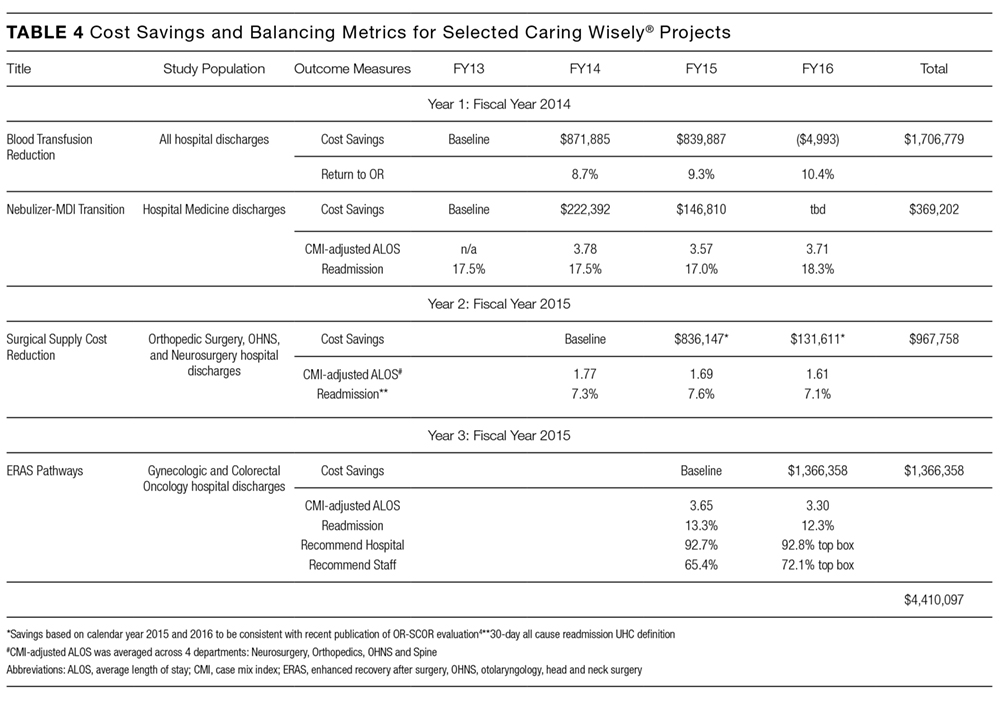
We developed an innovative program that reduces hospital costs through crowdsourcing of ideas from frontline clinicians and staff, and by connecting these ideas to project and implementation science teams. At a time when healthcare costs have reached unsustainable levels, the Caring Wisely® program provides a process for healthcare personnel to make a positive impact on healthcare costs in areas under their direct control. Through the Open Proposals platform, we have tapped a growing desire among frontline providers to reduce medical waste.
A key criterion for the Caring Wisely® program is to propose changes that reduce cost without adversely affect healthcare quality or outcomes. While this is an important consideration in selecting projects, there is limited power to detect many of the most clinically relevant outcomes. We find this acceptable because many of the sponsored Caring Wisely® project goals were to increase compliance with evidence-based practice guidelines and reduce harms associated with unnecessary treatments (eg, blood transfusion, nebulizer therapy, CT scan, antimicrobial therapy). Selected balancing metrics for each project are reported by established quality and safety programs at UCSF Health, but we acknowledge that many factors that can affect these clinical outcomes are not related to the cost-reduction intervention and are not possible to control outside of a clinical research study. Therefore, any response to changes in these outcome and balancing measures requires further analysis beyond the Caring Wisely® project alone.
We believe one of the key factors in the success of the Caring Wisely® program is the application of implementation science principles to the intervention design strategies (Table 1). These principles included stakeholder engagement, behavior change theory, market (target audience) segmentation, and process measurement and feedback. Because we are conducting this program in an academic health center, resident and fellow education and engagement are also critical to success. In each project, we utilize the PRECEDE model as a guide to ensure that each intervention design includes complementary elements of effective behavior change, intended to increase awareness and motivation to change, to make change “easy,” and to reinforce change(Table 2).3
The Caring Wisely® program—itself a multifaceted intervention—embodies the same PRECEDE dimensions we apply to each specific project. The Ideas Contest serves as a tool for increasing awareness, attitudes, and motivation across the clinical enterprise for reducing healthcare costs. The support provided to the project teams by the Caring Wisely® program is an enabling factor that makes it “easier” for frontline teams to design and implement interventions with a greater likelihood of achieving early success. Timely measurement and feedback of results to the hospital leadership and broadcasting to the larger community reinforces the support of the program at both the leadership and frontline levels.
Collaboration between project teams and the Caring Wisely® program also provides frontline clinicians and staff with practical experience and lessons that they can apply to future improvement work. Project teams learn implementation science principles such as constructing a pragmatic theoretical framework to guide implementation design using CFIR model.2 Incorporating multiple, rapid-cycle tests of change allows teams to modify and adapt final interventions as they learn how the target audience and environment responds to specific intervention components. Access to real-time, actionable data and a data analyst is essential to rapid cycle adaptation that allows teams to focus on specific units or providers. We also find that cross-fertilization between project teams working in different areas helps to share resources and minimize duplication of efforts from the clinical and staff champions. Partnering with UCSF Health system leaders at every phase of project development—from proposal selection, development, and final evaluation of results—enhances sustainable transition of successful projects into clinical operations.
The costs and coordination for the first cycle of Caring Wisely® were supported by the UCSF Center for Healthcare Value. Upon completion of the evaluation of the first cycle, UCSF Health agreed to fund the program going forward, with the expectation that Caring Wisely would continue to achieve direct cost-savings for the organization. The Caring Wisely team provides a final report each year detailing the impact of each project on utilization and associated costs. Currently, program costs are approximately $150,000 for the Caring Wisely program leaders, staff, and other resources, and $50,000 for each of 3 projects for a total program cost of $300,000 per year. Projects included in the first three cycles have already saved more than $4 million, representing a strong return on investment. This program could be a model for other academic health centers to engage frontline clinicians and staff in addressing healthcare costs, and lends itself to being scaled-up into a multi-system collaborative.
LIST OF ABBREVIATIONS
UCSF—University of California, San Francisco; PRECEDE—Predisposing, Reinforcing, and Enabling Constructs in Educational Diagnosis and Evaluation; PROCEED—Policy, Regulatory and Organizational Constructs in Educational and Environmental Development
Acknowledgments
Other participants in blood transfusion reduction project (D. Johnson, K. Curcione); IV-to-PO Switch (C. Tsourounis, A. Pollock); Surgical Supply Cost Reduction (C. Zygourakis); Perioperative Efficiency (L. Hampson); CT for PE Risk Prediction (E. Weber); ERAS Pathways (L. Chen); Neonatal Sepsis Risk Prediction (T. Newman); Post-Operative Debrief (S. Imershein). Caring Wisely Executive Steering Committee (J. Adler, S. Antrum, A Auerbach, J. Bennan, M. Blum, C. Ritchie, C. Tsourounis). This Center for Healthcare Value is funded in part by a grant from the Grove Foundation. We appreciate additional review and comments to the manuscript provided by George Sawaya and Adams Dudley.
Disclosures
Christopher Moriates has accepted royalties from McGraw-Hill for textbook, Understanding Value-Based Healthcare. Alvin Rajkomar has received fees as a research adviser from Google, Inc.
1. Kahlon M, Yuan L, Gologorskaya O, Johnston SC. Crowdsourcing the CTSA innovation mission. Clin Transl Sci. 2014;7:89-92. PubMed
2. Damschroder LJ, Aron DC, Keith RE, Kirsh SR, Alexander JA, Lowery JC. Fostering implementation of health services research findings into practice: a consolidated framework for advancing implementation science. Implement Sci. 2009;4:50. PubMed
3. Green LW and Kreuter. Health Program Planning: An Educational and Ecological Approach. 4th Ed. McGraw-Hill. New York, NY. 2005.
4. Zygourakis CC, Valencia V, Moriates C et al. Association between surgeon scorecard use and operating room costs. JAMA Surg. 2016 Dec 7. doi: 10.1001/jamasurg.2016.4674. [Epub ahead of print] PubMed
© 2017 Society of Hospital Medicine
Strategies are needed to empower frontline clinicians to work with organizational leadership to reduce healthcare costs and improve high-value care. Caring Wisely® is a program developed by the University of California, San Francisco’s (UCSF) Center for Healthcare Value (CHV), aimed at engaging frontline clinicians and staff, connecting them with implementation experts, and supporting the development of targeted interventions to improve value. Financial savings from the program more than cover program costs. Caring Wisely® provides an institutional model for implementing robust interventions to address areas of low-value care.
Launched in 2013, the annual Caring Wisely® program consists of 3 stages for identifying projects that meet the following criteria:
- Potential to measurably reduce UCSF Health’s costs of care without transferring costs to patients, insurers, or other providers
- Plan for ensuring that health outcomes are maintained or improved
- Envision disseminating the intervention within and beyond UCSF
- Demonstrate commitment and engagement of clinical leadership and frontline staff.
The first stage is the Ideas Contest, a UCSF Health-wide call (to learn more about UCSF Health: https://www.ucsf.edu/sites/default/files/052516_About_UCSF.pdf) to identify areas that may be targeted to reduce unnecessary services, inefficiencies, and healthcare costs. We use a crowdsourcing platform—Open Proposals—to solicit the best ideas from frontline clinicians and staff.1 Open Proposals is a secure, web-based platform for transparent and collaborative proposal development that displays threads of comments, responses, and revisions, and allows submissions to be “liked.” Open Proposals is managed by the UCSF Clinical and Translational Science Institute, funded by the National Center for Advancing Translational Sciences (Grant Number UL1 TR000004) at the National Institutes of Health. Using institutional e-mail lists for faculty, staff and residents, as well as described at monthly managers and directors meetings, the Ideas Contest is announced each year by the Chief Medical Officer and the CHV leadership. The Caring Wisely® Executive Steering Committee, which consists of CHV and senior UCSF Health system leaders, selects the top 5-10 ideas based on the above criteria. Each winning idea receives a $100 gift certificate for a popular restaurant in San Francisco, and the list of winners is announced to the entire UCSF community.
The second stage is the Request for Proposals. The Caring Wisely® program solicits proposals that outline implementation plans to target specific areas identified through the Ideas Contest. Finalists from the Ideas Contest are encouraged to submit proposals that address the problem they identified, but anyone affiliated with UCSF Health may submit a proposal on a winning idea. There is an approximately 4-week open submission period during which applicants submit brief 2-page proposals on the Open Proposal platform. This is followed by a period of optimization that leverages the social media aspect of the Open Proposals platform in which the UCSF Health community asks clarifying questions, make suggestions, and modifications can be made to the proposals. All submissions receive written feedback from at least one Steering Committee member. In addition, the Caring Wisely® Director directly invites relevant UCSF colleagues, administrators, or program leaders to comment on proposals and make suggestions for improvement. Plans for assessing financial and health care delivery impacts are developed in collaboration with the UCSF Health Finance department. UCSF Health managers and leaders who are stakeholders in project proposal areas are consulted to provide input and finalize proposal plans, including the identification of existing personnel who can support and drive the project forward. Proposers use this feedback to revise their applications throughout this stage.
The third stage is Project Implementation. The Caring Wisely® Executive Steering Committee selects up to 3 winners from the submitted proposals. Using the program criteria above, each project is scored independently, discussed in committee, and rescored to identify the top proposals. Each selected project receives a maximum budget of $50,000 that can be used for project materials, activities, and salary support for project leaders or staff. In addition to funding, each project team receives input from the implementation science team to co-develop and implement the intervention with a goal of creating a first-test-of-change within 3-6 months. A key feature of Caring Wisely® is the partnership between project teams and the Caring Wisely® implementation team, which includes a director, program manager, data analysts, and implementation scientists (Table 1).
The $150,000 administrative budget for the Caring Wisely® program provides 20% support of the medical director, 50% support of a program manager/analyst, and 10% support of an implementation scientist. Approximately 5% support is donated from additional senior implementation scientists and various UCSF Health experts based on project needs. To make most efficient use of the Caring Wisely® program staff time with the project teams, there is a weekly 60-90 minute works-in-progress session attended by all 3 teams with a rotating schedule for lead presenter during the first 6 months; these meetings occur every 2-3 weeks during the second 6 months. Caring Wisely® program staff and the implementation scientist are also available for 1:1 meetings as needed. The Caring Wisely® Executive Steering Committee is not paid and meets for 90 minutes quarterly. Custom reports and modifications of the electronic health record are provided by the UCSF Health clinical informatics department as part of their operating budget.
The collaboration between the project teams and the implementation science team is guided by the Consolidated Framework for Implementation Research (CFIR)2 and PRECEDE-PROCEED model—a logic model and evaluation tool that is based on a composite of individual behavior change theory and social ecology.3 Table 2 illustrates how we weave PRECEDE-PROCEED and Plan-Do-Study-Act frameworks into project design and strategy. Each funded team is required to submit an end-of-year progress report.
Cost and cost savings estimates were based on administrative financial data obtained through the assistance of the Decision Support Services unit of the Finance Department of UCSF Health. All costs reflect direct institutional costs, rather than charges. For some projects, costs are directly available through computerized dashboards that provide year-to-year comparisons of specific costs of materials, supplies, and services (eg, blood transfusion reduction, surgical supplies project, OR efficiency program). This same dashboard also allows calculation of CMI-adjusted direct costs of hospital care by service line, as used in the perioperative pathways program evaluation. In other cases, the Decision Support Services and/or Caring Wisely® program manager created custom cost reports based on the key performance indicator (eg, nebulizer therapy costs consist of medication costs plus respiratory therapist time; CT scan utilization for suspected pulmonary embolus in emergency department; and antimicrobial utilization for suspected neonatal sepsis).
Ongoing monitoring and sustainability of Caring Wisely® projects is supported by the Caring Wisely® program leaders. Monitoring of ongoing cost savings is based on automated service-line level dashboards related to cost, utilization, and quality outcomes with quarterly updates provided to the Caring Wisely® Steering Committee. Depending on the project or program, appropriate UCSF Health senior leaders determine the level of support within their departments that is required to sustain the program(s). Ongoing monitoring of each program is also included in the strategic deployment visibility room with regular rounding by senior health system executives.
Since 2013, there have been 3 complete Caring Wisely® cycles. The Ideas Contest generated more than 75 ideas in each of the past 3 cycles, ranging from eliminating redundant laboratory or radiological studies to reducing linen and food waste. We received between 13-20 full proposals in each of the request for proposal stages, and 9 projects have been implemented, 3 in each year. Funded projects have been led by a variety of individuals including physicians, nurses, pharmacists, administrators and residents, and topics have ranged from reducing overutilization of tests, supplies and treatments, to improving patient throughput during the perioperative period (Table 3). Estimated cumulative savings to date from Caring Wisely® projects has exceeded $4 million, based on the four projects shown in Table 4. The IV-to-PO switch program and the neonatal sepsis risk prediction project (Table 3) have been successful in reducing unnecessary utilization, but cost and savings estimates are not yet finalized. Three funded projects were equivocal in cost savings but were successful in their primary aims: (1) increasing the appropriateness of CT scan ordering for suspected pulmonary embolus; (2) shortening operating room turnover times; and (3) implementing a postoperative debrief program for the systematic documentation of safety events, waste, and inefficiencies related to surgery.
We developed an innovative program that reduces hospital costs through crowdsourcing of ideas from frontline clinicians and staff, and by connecting these ideas to project and implementation science teams. At a time when healthcare costs have reached unsustainable levels, the Caring Wisely® program provides a process for healthcare personnel to make a positive impact on healthcare costs in areas under their direct control. Through the Open Proposals platform, we have tapped a growing desire among frontline providers to reduce medical waste.
A key criterion for the Caring Wisely® program is to propose changes that reduce cost without adversely affect healthcare quality or outcomes. While this is an important consideration in selecting projects, there is limited power to detect many of the most clinically relevant outcomes. We find this acceptable because many of the sponsored Caring Wisely® project goals were to increase compliance with evidence-based practice guidelines and reduce harms associated with unnecessary treatments (eg, blood transfusion, nebulizer therapy, CT scan, antimicrobial therapy). Selected balancing metrics for each project are reported by established quality and safety programs at UCSF Health, but we acknowledge that many factors that can affect these clinical outcomes are not related to the cost-reduction intervention and are not possible to control outside of a clinical research study. Therefore, any response to changes in these outcome and balancing measures requires further analysis beyond the Caring Wisely® project alone.
We believe one of the key factors in the success of the Caring Wisely® program is the application of implementation science principles to the intervention design strategies (Table 1). These principles included stakeholder engagement, behavior change theory, market (target audience) segmentation, and process measurement and feedback. Because we are conducting this program in an academic health center, resident and fellow education and engagement are also critical to success. In each project, we utilize the PRECEDE model as a guide to ensure that each intervention design includes complementary elements of effective behavior change, intended to increase awareness and motivation to change, to make change “easy,” and to reinforce change(Table 2).3
The Caring Wisely® program—itself a multifaceted intervention—embodies the same PRECEDE dimensions we apply to each specific project. The Ideas Contest serves as a tool for increasing awareness, attitudes, and motivation across the clinical enterprise for reducing healthcare costs. The support provided to the project teams by the Caring Wisely® program is an enabling factor that makes it “easier” for frontline teams to design and implement interventions with a greater likelihood of achieving early success. Timely measurement and feedback of results to the hospital leadership and broadcasting to the larger community reinforces the support of the program at both the leadership and frontline levels.
Collaboration between project teams and the Caring Wisely® program also provides frontline clinicians and staff with practical experience and lessons that they can apply to future improvement work. Project teams learn implementation science principles such as constructing a pragmatic theoretical framework to guide implementation design using CFIR model.2 Incorporating multiple, rapid-cycle tests of change allows teams to modify and adapt final interventions as they learn how the target audience and environment responds to specific intervention components. Access to real-time, actionable data and a data analyst is essential to rapid cycle adaptation that allows teams to focus on specific units or providers. We also find that cross-fertilization between project teams working in different areas helps to share resources and minimize duplication of efforts from the clinical and staff champions. Partnering with UCSF Health system leaders at every phase of project development—from proposal selection, development, and final evaluation of results—enhances sustainable transition of successful projects into clinical operations.
The costs and coordination for the first cycle of Caring Wisely® were supported by the UCSF Center for Healthcare Value. Upon completion of the evaluation of the first cycle, UCSF Health agreed to fund the program going forward, with the expectation that Caring Wisely would continue to achieve direct cost-savings for the organization. The Caring Wisely team provides a final report each year detailing the impact of each project on utilization and associated costs. Currently, program costs are approximately $150,000 for the Caring Wisely program leaders, staff, and other resources, and $50,000 for each of 3 projects for a total program cost of $300,000 per year. Projects included in the first three cycles have already saved more than $4 million, representing a strong return on investment. This program could be a model for other academic health centers to engage frontline clinicians and staff in addressing healthcare costs, and lends itself to being scaled-up into a multi-system collaborative.
LIST OF ABBREVIATIONS
UCSF—University of California, San Francisco; PRECEDE—Predisposing, Reinforcing, and Enabling Constructs in Educational Diagnosis and Evaluation; PROCEED—Policy, Regulatory and Organizational Constructs in Educational and Environmental Development
Acknowledgments
Other participants in blood transfusion reduction project (D. Johnson, K. Curcione); IV-to-PO Switch (C. Tsourounis, A. Pollock); Surgical Supply Cost Reduction (C. Zygourakis); Perioperative Efficiency (L. Hampson); CT for PE Risk Prediction (E. Weber); ERAS Pathways (L. Chen); Neonatal Sepsis Risk Prediction (T. Newman); Post-Operative Debrief (S. Imershein). Caring Wisely Executive Steering Committee (J. Adler, S. Antrum, A Auerbach, J. Bennan, M. Blum, C. Ritchie, C. Tsourounis). This Center for Healthcare Value is funded in part by a grant from the Grove Foundation. We appreciate additional review and comments to the manuscript provided by George Sawaya and Adams Dudley.
Disclosures
Christopher Moriates has accepted royalties from McGraw-Hill for textbook, Understanding Value-Based Healthcare. Alvin Rajkomar has received fees as a research adviser from Google, Inc.
1. Kahlon M, Yuan L, Gologorskaya O, Johnston SC. Crowdsourcing the CTSA innovation mission. Clin Transl Sci. 2014;7:89-92. PubMed
2. Damschroder LJ, Aron DC, Keith RE, Kirsh SR, Alexander JA, Lowery JC. Fostering implementation of health services research findings into practice: a consolidated framework for advancing implementation science. Implement Sci. 2009;4:50. PubMed
3. Green LW and Kreuter. Health Program Planning: An Educational and Ecological Approach. 4th Ed. McGraw-Hill. New York, NY. 2005.
4. Zygourakis CC, Valencia V, Moriates C et al. Association between surgeon scorecard use and operating room costs. JAMA Surg. 2016 Dec 7. doi: 10.1001/jamasurg.2016.4674. [Epub ahead of print] PubMed
Standardized attending rounds to improve the patient experience: A pragmatic cluster randomized controlled trial
Patient experience has recently received heightened attention given evidence supporting an association between patient experience and quality of care,1 and the coupling of patient satisfaction to reimbursement rates for Medicare patients.2 Patient experience is often assessed through surveys of patient satisfaction, which correlates with patient perceptions of nurse and physician communication.3 Teaching hospitals introduce variables that may impact communication, including the involvement of multiple levels of care providers and competing patient care vs. educational priorities. Patients admitted to teaching services express decreased satisfaction with coordination and overall care compared with patients on nonteaching services.4
Clinical supervision of trainees on teaching services is primarily achieved through attending rounds (AR), where patients’ clinical presentations and management are discussed with an attending physician. Poor communication during AR may negatively affect the patient experience through inefficient care coordination among the inter-professional care team or through implementation of interventions without patients’ knowledge or input.5-11 Although patient engagement in rounds has been associated with higher patient satisfaction with rounds,12-19 AR and case presentations often occur at a distance from the patient’s bedside.20,21 Furthermore, AR vary in the time allotted per patient and the extent of participation of nurses and other allied health professionals. Standardized bedside rounding processes have been shown to improve efficiency, decrease daily resident work hours,22 and improve nurse-physician teamwork.23
Despite these benefits, recent prospective studies of bedside AR interventions have not improved patient satisfaction with rounds. One involved the implementation of interprofessional patient-centered bedside rounds on a nonteaching service,24 while the other evaluated the impact of integrating athletic principles into multidisciplinary work rounds.25 Work at our institution had sought to develop AR practice recommendations to foster an optimal patient experience, while maintaining provider workflow efficiency, facilitating interdisciplinary communication, and advancing trainee education.26 Using these AR recommendations, we conducted a prospective randomized controlled trial to evaluate the impact of implementing a standardized bedside AR model on patient satisfaction with rounds. We also assessed attending physician and trainee satisfaction with rounds, and perceived and actual AR duration.
METHODS
Setting and Participants
This trial was conducted on the internal medicine teaching service of the University of California San Francisco Medical Center from September 3, 2013 to November 27, 2013. The service is comprised of 8 teams, with a total average daily census of 80 to 90 patients. Teams are comprised of an attending physician, a senior resident (in the second or third year of residency training), 2 interns, and a third- and/or fourth-year medical student.
This trial, which was approved by the University of California, San Francisco Committee on Human Research (UCSF CHR) and was registered with ClinicalTrials.gov (NCT01931553), was classified under Quality Improvement and did not require informed consent of patients or providers.
Intervention Description
We conducted a cluster randomized trial to evaluate the impact of a bundled set of 5 AR practice recommendations, adapted from published work,26 on patient experience, as well as on attending and trainee satisfaction: 1) huddling to establish the rounding schedule and priorities; 2) conducting bedside rounds; 3) integrating bedside nurses; 4) completing real-time order entry using bedside computers; 5) updating the whiteboard in each patient’s room with care plan information.
At the beginning of each month, study investigators (Nader Najafi and Bradley Monash) led a 1.5-hour workshop to train attending physicians and trainees allocated to the intervention arm on the recommended AR practices. Participants also received informational handouts to be referenced during AR. Attending physicians and trainees randomized to the control arm continued usual rounding practices. Control teams were notified that there would be observers on rounds but were not informed of the study aims.
Randomization and Team Assignments
The medicine service was divided into 2 arms, each comprised of 4 teams. Using a coin flip, Cluster 1 (Teams A, B, C and D) was randomized to the intervention, and Cluster 2 (Teams E, F, G and H) was randomized to the control. This design was pragmatically chosen to ensure that 1 team from each arm would admit patients daily. Allocation concealment of attending physicians and trainees was not possible given the nature of the intervention. Patients were blinded to study arm allocation.
MEASURES AND OUTCOMES
Adherence to Practice Recommendations
Thirty premedical students served as volunteer AR auditors. Each auditor received orientation and training in data collection techniques during a single 2-hour workshop. The auditors, blinded to study arm allocation, independently observed morning AR during weekdays and recorded the completion of the following elements as a dichotomous (yes/no) outcome: pre-rounds huddle, participation of nurse in AR, real-time order entry, and whiteboard use. They recorded the duration of AR per day for each team (minutes) and the rounding model for each patient rounding encounter during AR (bedside, hallway, or card flip).23 Bedside rounds were defined as presentation and discussion of the patient care plan in the presence of the patient. Hallway rounds were defined as presentation and discussion of the patient care plan partially outside the patient’s room and partially in the presence of the patient. Card-flip rounds were defined as presentation and discussion of the patient care plan entirely outside of the patient’s room without the team seeing the patient together. Two auditors simultaneously observed a random subset of patient-rounding encounters to evaluate inter-rater reliability, and the concordance between auditor observations was good (Pearson correlation = 0.66).27
Patient-Related Outcomes
The primary outcome was patient satisfaction with AR, assessed using a survey adapted from published work.12,14,28,29 Patients were approached to complete the questionnaire after they had experienced at least 1 AR. Patients were excluded if they were non-English-speaking, unavailable (eg, off the unit for testing or treatment), in isolation, or had impaired mental status. For patients admitted multiple times during the study period, only the first questionnaire was used. Survey questions included patient involvement in decision-making, quality of communication between patient and medicine team, and the perception that the medicine team cared about the patient. Patients were asked to state their level of agreement with each item on a 5-point Likert scale. We obtained data on patient demographics from administrative datasets.
Healthcare Provider Outcomes
Attending physicians and trainees on service for at least 7 consecutive days were sent an electronic survey, adapted from published work.25,30 Questions assessed satisfaction with AR, perceived value of bedside rounds, and extent of patient and nursing involvement.Level of agreement with each item was captured on a continuous scale; 0 = strongly disagree to 100 = strongly agree, or from 0 (far too little) to 100 (far too much), with 50 equating to “about right.” Attending physicians and trainees were also asked to estimate the average duration of AR (in minutes).
Statistical Analyses
Analyses were blinded to study arm allocation and followed intention-to-treat principles. One attending physician crossed over from intervention to control arm; patient surveys associated with this attending (n = 4) were excluded to avoid contamination. No trainees crossed over.
Demographic and clinical characteristics of patients who completed the survey are reported (Appendix). To compare patient satisfaction scores, we used a random-effects regression model to account for correlation among responses within teams within randomized clusters, defining teams by attending physician. As this correlation was negligible and not statistically significant, we did not adjust ordinary linear regression models for clustering. Given observed differences in patient characteristics, we adjusted for a number of covariates (eg, age, gender, insurance payer, race, marital status, trial group arm).
We conducted simple linear regression for attending and trainee satisfaction comparisons between arms, adjusting only for trainee type (eg, resident, intern, and medical student).
We compared the frequency with which intervention and control teams adhered to the 5 recommended AR practices using chi-square tests. We used independent Student’s t tests to compare total duration of AR by teams within each arm, as well as mean time spent per patient.
This trial had a fixed number of arms (n = 2), each of fixed size (n = 600), based on the average monthly inpatient census on the medicine service. This fixed sample size, with 80% power and α = 0.05, will be able to detect a 0.16 difference in patient satisfaction scores between groups.
All analyses were conducted using SAS® v 9.4 (SAS Institute, Inc., Cary, NC).
RESULTS
We observed 241 AR involving 1855 patient rounding encounters in the intervention arm and 264 AR involving 1903 patient rounding encounters in the control arm (response rates shown in Figure 1). 

Patient Satisfaction and Clinical Outcomes
Five hundred ninety-five patients were allocated to the intervention arm and 605 were allocated to the control arm (Figure 1). Mean age, gender, race, marital status, primary language, and insurance provider did not differ between intervention and control arms (Table 1). 
Patients in the intervention arm reported significantly higher satisfaction with AR and felt more cared for by their medicine team (Table 2). 
Actual and Perceived Duration of Attending Rounds
The intervention shortened the total duration of AR by 8 minutes on average (143 vs. 151 minutes, P = 0.052) and the time spent per patient by 4 minutes on average (19 vs. 23 minutes, P < 0.001). Despite this, trainees in the intervention arm perceived AR to last longer (mean estimated time: 167 min vs. 152 min, P < 0.001).
Healthcare Provider Outcomes
We observed 79 attending physicians and trainees in the intervention arm and 78 in the control arm, with survey response rates shown in Figure 1. Attending physicians in the intervention and the control arms reported high levels of satisfaction with the quality of AR (Table 2). Attending physicians in the intervention arm were more likely to report an appropriate level of patient involvement and nurse involvement.
Although trainees in the intervention and control arms reported high levels of satisfaction with the quality of AR, trainees in the intervention arm reported lower satisfaction with AR compared with control arm trainees (Table 2). Trainees in the intervention arm reported that AR involved less autonomy, efficiency, and teaching. Trainees in the intervention arm also scored patient involvement more towards the “far too much” end of the scale compared with “about right” in the control arm. However, trainees in the intervention arm perceived nurse involvement closer to “about right,” as opposed to “far too little” in the control arm.
CONCLUSION/DISCUSSION
Training internal medicine teams to adhere to 5 recommended AR practices increased patient satisfaction with AR and the perception that patients were more cared for by their medicine team. Despite the intervention potentially shortening the duration of AR, attending physicians and trainees perceived AR to last longer, and trainee satisfaction with AR decreased.
Teams in the intervention arm adhered to all recommended rounding practices at higher rates than the control teams. Although intervention teams rounded at the bedside 53% of the time, they were encouraged to bedside round only on patients who desired to participate in rounds, were not altered, and for whom the clinical discussion was not too sensitive to occur at the bedside. Of the recommended rounding behaviors, the lowest adherence was seen with whiteboard use.
A major component of the intervention was to move the clinical presentation to the patient’s bedside. Most patients prefer being included in rounds and partaking in trainee education.12-19,28,29,31-33 Patients may also perceive that more time is spent with them during bedside case presentations,14,28 and exposure to providers conferring on their care may enhance patient confidence in the care being delivered.12 Although a recent study of patient-centered bedside rounding on a nonteaching service did not result in increased patient satisfaction,24 teaching services may offer more opportunities for improvement in care coordination and communication.4
Other aspects of the intervention may have contributed to increased patient satisfaction with AR. The pre-rounds huddle may have helped teams prioritize which patients required more time or would benefit most from bedside rounds. The involvement of nurses in AR may have bolstered communication and team dynamics, enhancing the patient’s perception of interprofessional collaboration. Real-time order entry might have led to more efficient implementation of the care plan, and whiteboard use may have helped to keep patients abreast of the care plan.
Patients in the intervention arm felt more cared for by their medicine teams but did not report improvements in communication or in shared decision-making. Prior work highlights that limited patient engagement, activation, and shared decision-making may occur during AR.24,34 Patient-physician communication during AR is challenged by time pressures and competing priorities, including the “need” for trainees to demonstrate their medical knowledge and clinical skills. Efforts that encourage bedside rounding should include communication training with respect to patient engagement and shared decision-making.
Attending physicians reported positive attitudes toward bedside rounding, consistent with prior studies.13,21,31 However, trainees in the intervention arm expressed decreased satisfaction with AR, estimating that AR took longer and reporting too much patient involvement. Prior studies reflect similar bedside-rounding concerns, including perceived workflow inefficiencies, infringement on teaching opportunities, and time constraints.12,20,35 Trainees are under intense time pressures to complete their work, attend educational conferences, and leave the hospital to attend afternoon clinic or to comply with duty-hour restrictions. Trainees value succinctness,12,35,36 so the perception that intervention AR lasted longer likely contributed to trainee dissatisfaction.
Reduced trainee satisfaction with intervention AR may have also stemmed from the perception of decreased autonomy and less teaching, both valued by trainees.20,35,36 The intervention itself reduced trainee autonomy because usual practice at our hospital involves residents deciding where and how to round. Attending physician presence at the bedside during rounds may have further infringed on trainee autonomy if the patient looked to the attending for answers, or if the attending was seen as the AR leader. Attending physicians may mitigate the risk of compromising trainee autonomy by allowing the trainee to speak first, ensuring the trainee is positioned closer to, and at eye level with, the patient, and redirecting patient questions to the trainee as appropriate. Optimizing trainee experience with bedside AR requires preparation and training of attending physicians, who may feel inadequately prepared to lead bedside rounds and conduct bedside teaching.37 Faculty must learn how to preserve team efficiency, create a safe, nonpunitive bedside environment that fosters the trainee-patient relationship, and ensure rounds remain educational.36,38,39
The intervention reduced the average time spent on AR and time spent per patient. Studies examining the relationship between bedside rounding and duration of rounds have yielded mixed results: some have demonstrated no effect of bedside rounds on rounding time,28,40 while others report longer rounding times.37 The pre-rounds huddle and real-time order writing may have enhanced workflow efficiency.
Our study has several limitations. These results reflect the experience of a single large academic medical center and may not be generalizable to other settings. Although overall patient response to the survey was low and may not be representative of the entire patient population, response rates in the intervention and control arms were equivalent. Non-English speaking patients may have preferences that were not reflected in our survey results, and we did not otherwise quantify individual reasons for survey noncompletion. The presence of auditors on AR may have introduced observer bias. There may have been crossover effect; however, observed prevalence of individual practices remained low in the control arm. The 1.5-hour workshop may have inadequately equipped trainees with the complex skills required to lead and participate in bedside rounding, and more training, experience, and feedback may have yielded different results. For instance, residents with more exposure to bedside rounding express greater appreciation of its role in education and patient care.20 While adherence to some of the recommended practices remained low, we did not employ a full range of change-management techniques. Instead, we opted for a “low intensity” intervention (eg, single workshop, handouts) that relied on voluntary adoption by medicine teams and that we hoped other institutions could reproduce. Finally, we did not assess the relative impact of individual rounding behaviors on the measured outcomes.
In conclusion, training medicine teams to adhere to a standardized bedside AR model increased patient satisfaction with rounds. Concomitant trainee dissatisfaction may require further experience and training of attending physicians and trainees to ensure successful adoption.
Acknowledgements
We would like to thank all patients, providers, and trainees who participated in this study. We would also like to acknowledge the following volunteer auditors who observed teams daily: Arianna Abundo, Elahhe Afkhamnejad, Yolanda Banuelos, Laila Fozoun, Soe Yupar Khin, Tam Thien Le, Wing Sum Li, Yaqiao Li, Mengyao Liu, Tzyy-Harn Lo, Shynh-Herng Lo, David Lowe, Danoush Paborji, Sa Nan Park, Urmila Powale, Redha Fouad Qabazard, Monique Quiroz, John-Luke Marcelo Rivera, Manfred Roy Luna Salvador, Tobias Gowen Squier-Roper, Flora Yan Ting, Francesca Natasha T. Tizon, Emily Claire Trautner, Stephen Weiner, Alice Wilson, Kimberly Woo, Bingling J Wu, Johnny Wu, Brenda Yee. Statistical expertise was provided by Joan Hilton from the UCSF Clinical and Translational Science Institute (CTSI), which is supported by the National Center for Advancing Translational Sciences, National Institutes of Health, through UCSF-CTSI Grant Number UL1 TR000004. Its contents are solely the responsibility of the authors and do not necessarily represent the official views of the NIH. Thanks also to Oralia Schatzman, Andrea Mazzini, and Erika Huie for their administrative support, and John Hillman for data-related support. Special thanks to Kirsten Kangelaris and Andrew Auerbach for their valuable feedback throughout, and to Maria Novelero and Robert Wachter for their divisional support of this project.
Disclosure
The authors report no financial conflicts of interest.
1. Doyle C, Lennox L, Bell D. A systematic review of evidence on the links between patient experience and clinical safety and effectiveness. BMJ Open. 2013;3(1):1-18. PubMed
2. Hospital Consumer Assessment of Healthcare Providers and Systems (HCAHPS) Fact Sheet. August 2013. Centers for Medicare and Medicaid Services (CMS). Baltimore, MD.http://www.hcahpsonline.org/files/August_2013_HCAHPS_Fact_Sheet3.pdf. Accessed December 1, 2015.
3. Boulding W, Glickman SW, Manary MP, Schulman KA, Staelin R. Relationship between patient satisfaction with inpatient care and hospital readmission within 30 days. Am J Manag Care. 2011;17:41-48. PubMed
4. Wray CM, Flores A, Padula WV, Prochaska MT, Meltzer DO, Arora VM. Measuring patient experiences on hospitalist and teaching services: Patient responses to a 30-day postdischarge questionnaire. J Hosp Med. 2016;11(2):99-104. PubMed
5. Bharwani AM, Harris GC, Southwick FS. Perspective: A business school view of medical interprofessional rounds: transforming rounding groups into rounding teams. Acad Med. 2012;87(12):1768-1771. PubMed
6. Chand DV. Observational study using the tools of lean six sigma to improve the efficiency of the resident rounding process. J Grad Med Educ. 2011;3(2):144-150. PubMed
7. Stickrath C, Noble M, Prochazka A, et al. Attending rounds in the current era: what is and is not happening. JAMA Intern Med. 2013;173(12):1084-1089. PubMed
8. Weber H, Stöckli M, Nübling M, Langewitz WA. Communication during ward rounds in internal medicine. An analysis of patient-nurse-physician interactions using RIAS. Patient Educ Couns. 2007;67(3):343-348. PubMed
9. McMahon GT, Katz JT, Thorndike ME, Levy BD, Loscalzo J. Evaluation of a redesign initiative in an internal-medicine residency. N Engl J Med. 2010;362(14):1304-1311. PubMed
10. Amoss J. Attending rounds: where do we go from here?: comment on “Attending rounds in the current era”. JAMA Intern Med. 2013;173(12):1089-1090. PubMed
11. Curley C, McEachern JE, Speroff T. A firm trial of interdisciplinary rounds on the inpatient medical wards: an intervention designed using continuous quality improvement. Med Care. 1998;36(suppl 8):AS4-A12. PubMed
12. Wang-Cheng RM, Barnas GP, Sigmann P, Riendl PA, Young MJ. Bedside case presentations: why patients like them but learners don’t. J Gen Intern Med. 1989;4(4):284-287. PubMed
13. Chauke, HL, Pattinson RC. Ward rounds—bedside or conference room? S Afr Med J. 2006;96(5):398-400. PubMed
14. Lehmann LS, Brancati FL, Chen MC, Roter D, Dobs AS. The effect of bedside case presentations on patients’ perceptions of their medical care. N Engl J Med. 1997;336(16):336, 1150-1155. PubMed
15. Simons RJ, Baily RG, Zelis R, Zwillich CW. The physiologic and psychological effects of the bedside presentation. N Engl J Med. 1989;321(18):1273-1275. PubMed
16. Wise TN, Feldheim D, Mann LS, Boyle E, Rustgi VK. Patients’ reactions to house staff work rounds. Psychosomatics. 1985;26(8):669-672. PubMed
17. Linfors EW, Neelon FA. Sounding Boards. The case of bedside rounds. N Engl J Med. 1980;303(21):1230-1233. PubMed
18. Nair BR, Coughlan JL, Hensley MJ. Student and patient perspectives on bedside teaching. Med Educ. 1997;31(5):341-346. PubMed
19. Romano J. Patients’ attitudes and behavior in ward round teaching. JAMA. 1941;117(9):664-667.
20. Gonzalo JD, Masters PA, Simons RJ, Chuang CH. Attending rounds and bedside case presentations: medical student and medicine resident experiences and attitudes. Teach Learn Med. 2009;21(2):105-110. PubMed
21. Shoeb M, Khanna R, Fang M, et al. Internal medicine rounding practices and the Accreditation Council for Graduate Medical Education core competencies. J Hosp Med. 2014;9(4):239-243. PubMed
22. Calderon AS, Blackmore CC, Williams BL, et al. Transforming ward rounds through rounding-in-flow. J Grad Med Educ. 2014;6(4):750-755. PubMed
23. Henkin S, Chon TY, Christopherson ML, Halvorsen AJ, Worden LM, Ratelle JT. Improving nurse-physician teamwork through interprofessional bedside rounding. J Multidiscip Healthc. 2016;9:201-205. PubMed
24. O’Leary KJ, Killarney A, Hansen LO, et al. Effect of patient-centred bedside rounds on hospitalised patients’ decision control, activation and satisfaction with care. BMJ Qual Saf. 2016;25:921-928. PubMed
25. Southwick F, Lewis M, Treloar D, et al. Applying athletic principles to medical rounds to improve teaching and patient care. Acad Med. 2014;89(7):1018-1023. PubMed
26. Najafi N, Monash B, Mourad M, et al. Improving attending rounds: Qualitative reflections from multidisciplinary providers. Hosp Pract (1995). 2015;43(3):186-190. PubMed
27. Altman DG. Practical Statistics For Medical Research. Boca Raton, FL: Chapman & Hall/CRC; 2006.
28. Gonzalo JD, Chuang CH, Huang G, Smith C. The return of bedside rounds: an educational intervention. J Gen Intern Med. 2010;25(8):792-798. PubMed
29. Fletcher KE, Rankey DS, Stern DT. Bedside interactions from the other side of the bedrail. J Gen Intern Med. 2005;20(1):58-61. PubMed
30. Gatorounds: Applying Championship Athletic Principles to Healthcare. University of Florida Health. http://gatorounds.med.ufl.edu/surveys/. Accessed March 1, 2013.
31. Gonzalo JD, Heist BS, Duffy BL, et al. The value of bedside rounds: a multicenter qualitative study. Teach Learn Med. 2013;25(4):326-333. PubMed
32. Rogers HD, Carline JD, Paauw DS. Examination room presentations in general internal medicine clinic: patients’ and students’ perceptions. Acad Med. 2003;78(9):945-949. PubMed
33. Fletcher KE, Furney SL, Stern DT. Patients speak: what’s really important about bedside interactions with physician teams. Teach Learn Med. 2007;19(2):120-127. PubMed
34. Satterfield JM, Bereknyei S, Hilton JF, et al. The prevalence of social and behavioral topics and related educational opportunities during attending rounds. Acad Med. 2014; 89(11):1548-1557. PubMed
35. Kroenke K, Simmons JO, Copley JB, Smith C. Attending rounds: a survey of physician attitudes. J Gen Intern Med. 1990;5(3):229-233. PubMed
36. Castiglioni A, Shewchuk RM, Willett LL, Heudebert GR, Centor RM. A pilot study using nominal group technique to assess residents’ perceptions of successful attending rounds. J Gen Intern Med. 2008;23(7):1060-1065. PubMed
37. Crumlish CM, Yialamas MA, McMahon GT. Quantification of bedside teaching by an academic hospitalist group. J Hosp Med. 2009;4(5):304-307. PubMed
38. Gonzalo JD, Wolpaw DR, Lehman E, Chuang CH. Patient-centered interprofessional collaborative care: factors associated with bedside interprofessional rounds. J Gen Intern Med. 2014;29(7):1040-1047. PubMed
39. Roy B, Castiglioni A, Kraemer RR, et al. Using cognitive mapping to define key domains for successful attending rounds. J Gen Intern Med. 2012;27(11):1492-1498. PubMed
40. Bhansali P, Birch S, Campbell JK, et al. A time-motion study of inpatient rounds using a family-centered rounds model. Hosp Pediatr. 2013;3(1):31-38. PubMed
Patient experience has recently received heightened attention given evidence supporting an association between patient experience and quality of care,1 and the coupling of patient satisfaction to reimbursement rates for Medicare patients.2 Patient experience is often assessed through surveys of patient satisfaction, which correlates with patient perceptions of nurse and physician communication.3 Teaching hospitals introduce variables that may impact communication, including the involvement of multiple levels of care providers and competing patient care vs. educational priorities. Patients admitted to teaching services express decreased satisfaction with coordination and overall care compared with patients on nonteaching services.4
Clinical supervision of trainees on teaching services is primarily achieved through attending rounds (AR), where patients’ clinical presentations and management are discussed with an attending physician. Poor communication during AR may negatively affect the patient experience through inefficient care coordination among the inter-professional care team or through implementation of interventions without patients’ knowledge or input.5-11 Although patient engagement in rounds has been associated with higher patient satisfaction with rounds,12-19 AR and case presentations often occur at a distance from the patient’s bedside.20,21 Furthermore, AR vary in the time allotted per patient and the extent of participation of nurses and other allied health professionals. Standardized bedside rounding processes have been shown to improve efficiency, decrease daily resident work hours,22 and improve nurse-physician teamwork.23
Despite these benefits, recent prospective studies of bedside AR interventions have not improved patient satisfaction with rounds. One involved the implementation of interprofessional patient-centered bedside rounds on a nonteaching service,24 while the other evaluated the impact of integrating athletic principles into multidisciplinary work rounds.25 Work at our institution had sought to develop AR practice recommendations to foster an optimal patient experience, while maintaining provider workflow efficiency, facilitating interdisciplinary communication, and advancing trainee education.26 Using these AR recommendations, we conducted a prospective randomized controlled trial to evaluate the impact of implementing a standardized bedside AR model on patient satisfaction with rounds. We also assessed attending physician and trainee satisfaction with rounds, and perceived and actual AR duration.
METHODS
Setting and Participants
This trial was conducted on the internal medicine teaching service of the University of California San Francisco Medical Center from September 3, 2013 to November 27, 2013. The service is comprised of 8 teams, with a total average daily census of 80 to 90 patients. Teams are comprised of an attending physician, a senior resident (in the second or third year of residency training), 2 interns, and a third- and/or fourth-year medical student.
This trial, which was approved by the University of California, San Francisco Committee on Human Research (UCSF CHR) and was registered with ClinicalTrials.gov (NCT01931553), was classified under Quality Improvement and did not require informed consent of patients or providers.
Intervention Description
We conducted a cluster randomized trial to evaluate the impact of a bundled set of 5 AR practice recommendations, adapted from published work,26 on patient experience, as well as on attending and trainee satisfaction: 1) huddling to establish the rounding schedule and priorities; 2) conducting bedside rounds; 3) integrating bedside nurses; 4) completing real-time order entry using bedside computers; 5) updating the whiteboard in each patient’s room with care plan information.
At the beginning of each month, study investigators (Nader Najafi and Bradley Monash) led a 1.5-hour workshop to train attending physicians and trainees allocated to the intervention arm on the recommended AR practices. Participants also received informational handouts to be referenced during AR. Attending physicians and trainees randomized to the control arm continued usual rounding practices. Control teams were notified that there would be observers on rounds but were not informed of the study aims.
Randomization and Team Assignments
The medicine service was divided into 2 arms, each comprised of 4 teams. Using a coin flip, Cluster 1 (Teams A, B, C and D) was randomized to the intervention, and Cluster 2 (Teams E, F, G and H) was randomized to the control. This design was pragmatically chosen to ensure that 1 team from each arm would admit patients daily. Allocation concealment of attending physicians and trainees was not possible given the nature of the intervention. Patients were blinded to study arm allocation.
MEASURES AND OUTCOMES
Adherence to Practice Recommendations
Thirty premedical students served as volunteer AR auditors. Each auditor received orientation and training in data collection techniques during a single 2-hour workshop. The auditors, blinded to study arm allocation, independently observed morning AR during weekdays and recorded the completion of the following elements as a dichotomous (yes/no) outcome: pre-rounds huddle, participation of nurse in AR, real-time order entry, and whiteboard use. They recorded the duration of AR per day for each team (minutes) and the rounding model for each patient rounding encounter during AR (bedside, hallway, or card flip).23 Bedside rounds were defined as presentation and discussion of the patient care plan in the presence of the patient. Hallway rounds were defined as presentation and discussion of the patient care plan partially outside the patient’s room and partially in the presence of the patient. Card-flip rounds were defined as presentation and discussion of the patient care plan entirely outside of the patient’s room without the team seeing the patient together. Two auditors simultaneously observed a random subset of patient-rounding encounters to evaluate inter-rater reliability, and the concordance between auditor observations was good (Pearson correlation = 0.66).27
Patient-Related Outcomes
The primary outcome was patient satisfaction with AR, assessed using a survey adapted from published work.12,14,28,29 Patients were approached to complete the questionnaire after they had experienced at least 1 AR. Patients were excluded if they were non-English-speaking, unavailable (eg, off the unit for testing or treatment), in isolation, or had impaired mental status. For patients admitted multiple times during the study period, only the first questionnaire was used. Survey questions included patient involvement in decision-making, quality of communication between patient and medicine team, and the perception that the medicine team cared about the patient. Patients were asked to state their level of agreement with each item on a 5-point Likert scale. We obtained data on patient demographics from administrative datasets.
Healthcare Provider Outcomes
Attending physicians and trainees on service for at least 7 consecutive days were sent an electronic survey, adapted from published work.25,30 Questions assessed satisfaction with AR, perceived value of bedside rounds, and extent of patient and nursing involvement.Level of agreement with each item was captured on a continuous scale; 0 = strongly disagree to 100 = strongly agree, or from 0 (far too little) to 100 (far too much), with 50 equating to “about right.” Attending physicians and trainees were also asked to estimate the average duration of AR (in minutes).
Statistical Analyses
Analyses were blinded to study arm allocation and followed intention-to-treat principles. One attending physician crossed over from intervention to control arm; patient surveys associated with this attending (n = 4) were excluded to avoid contamination. No trainees crossed over.
Demographic and clinical characteristics of patients who completed the survey are reported (Appendix). To compare patient satisfaction scores, we used a random-effects regression model to account for correlation among responses within teams within randomized clusters, defining teams by attending physician. As this correlation was negligible and not statistically significant, we did not adjust ordinary linear regression models for clustering. Given observed differences in patient characteristics, we adjusted for a number of covariates (eg, age, gender, insurance payer, race, marital status, trial group arm).
We conducted simple linear regression for attending and trainee satisfaction comparisons between arms, adjusting only for trainee type (eg, resident, intern, and medical student).
We compared the frequency with which intervention and control teams adhered to the 5 recommended AR practices using chi-square tests. We used independent Student’s t tests to compare total duration of AR by teams within each arm, as well as mean time spent per patient.
This trial had a fixed number of arms (n = 2), each of fixed size (n = 600), based on the average monthly inpatient census on the medicine service. This fixed sample size, with 80% power and α = 0.05, will be able to detect a 0.16 difference in patient satisfaction scores between groups.
All analyses were conducted using SAS® v 9.4 (SAS Institute, Inc., Cary, NC).
RESULTS
We observed 241 AR involving 1855 patient rounding encounters in the intervention arm and 264 AR involving 1903 patient rounding encounters in the control arm (response rates shown in Figure 1).
Patient Satisfaction and Clinical Outcomes
Five hundred ninety-five patients were allocated to the intervention arm and 605 were allocated to the control arm (Figure 1). Mean age, gender, race, marital status, primary language, and insurance provider did not differ between intervention and control arms (Table 1).
Patients in the intervention arm reported significantly higher satisfaction with AR and felt more cared for by their medicine team (Table 2).
Actual and Perceived Duration of Attending Rounds
The intervention shortened the total duration of AR by 8 minutes on average (143 vs. 151 minutes, P = 0.052) and the time spent per patient by 4 minutes on average (19 vs. 23 minutes, P < 0.001). Despite this, trainees in the intervention arm perceived AR to last longer (mean estimated time: 167 min vs. 152 min, P < 0.001).
Healthcare Provider Outcomes
We observed 79 attending physicians and trainees in the intervention arm and 78 in the control arm, with survey response rates shown in Figure 1. Attending physicians in the intervention and the control arms reported high levels of satisfaction with the quality of AR (Table 2). Attending physicians in the intervention arm were more likely to report an appropriate level of patient involvement and nurse involvement.
Although trainees in the intervention and control arms reported high levels of satisfaction with the quality of AR, trainees in the intervention arm reported lower satisfaction with AR compared with control arm trainees (Table 2). Trainees in the intervention arm reported that AR involved less autonomy, efficiency, and teaching. Trainees in the intervention arm also scored patient involvement more towards the “far too much” end of the scale compared with “about right” in the control arm. However, trainees in the intervention arm perceived nurse involvement closer to “about right,” as opposed to “far too little” in the control arm.
CONCLUSION/DISCUSSION
Training internal medicine teams to adhere to 5 recommended AR practices increased patient satisfaction with AR and the perception that patients were more cared for by their medicine team. Despite the intervention potentially shortening the duration of AR, attending physicians and trainees perceived AR to last longer, and trainee satisfaction with AR decreased.
Teams in the intervention arm adhered to all recommended rounding practices at higher rates than the control teams. Although intervention teams rounded at the bedside 53% of the time, they were encouraged to bedside round only on patients who desired to participate in rounds, were not altered, and for whom the clinical discussion was not too sensitive to occur at the bedside. Of the recommended rounding behaviors, the lowest adherence was seen with whiteboard use.
A major component of the intervention was to move the clinical presentation to the patient’s bedside. Most patients prefer being included in rounds and partaking in trainee education.12-19,28,29,31-33 Patients may also perceive that more time is spent with them during bedside case presentations,14,28 and exposure to providers conferring on their care may enhance patient confidence in the care being delivered.12 Although a recent study of patient-centered bedside rounding on a nonteaching service did not result in increased patient satisfaction,24 teaching services may offer more opportunities for improvement in care coordination and communication.4
Other aspects of the intervention may have contributed to increased patient satisfaction with AR. The pre-rounds huddle may have helped teams prioritize which patients required more time or would benefit most from bedside rounds. The involvement of nurses in AR may have bolstered communication and team dynamics, enhancing the patient’s perception of interprofessional collaboration. Real-time order entry might have led to more efficient implementation of the care plan, and whiteboard use may have helped to keep patients abreast of the care plan.
Patients in the intervention arm felt more cared for by their medicine teams but did not report improvements in communication or in shared decision-making. Prior work highlights that limited patient engagement, activation, and shared decision-making may occur during AR.24,34 Patient-physician communication during AR is challenged by time pressures and competing priorities, including the “need” for trainees to demonstrate their medical knowledge and clinical skills. Efforts that encourage bedside rounding should include communication training with respect to patient engagement and shared decision-making.
Attending physicians reported positive attitudes toward bedside rounding, consistent with prior studies.13,21,31 However, trainees in the intervention arm expressed decreased satisfaction with AR, estimating that AR took longer and reporting too much patient involvement. Prior studies reflect similar bedside-rounding concerns, including perceived workflow inefficiencies, infringement on teaching opportunities, and time constraints.12,20,35 Trainees are under intense time pressures to complete their work, attend educational conferences, and leave the hospital to attend afternoon clinic or to comply with duty-hour restrictions. Trainees value succinctness,12,35,36 so the perception that intervention AR lasted longer likely contributed to trainee dissatisfaction.
Reduced trainee satisfaction with intervention AR may have also stemmed from the perception of decreased autonomy and less teaching, both valued by trainees.20,35,36 The intervention itself reduced trainee autonomy because usual practice at our hospital involves residents deciding where and how to round. Attending physician presence at the bedside during rounds may have further infringed on trainee autonomy if the patient looked to the attending for answers, or if the attending was seen as the AR leader. Attending physicians may mitigate the risk of compromising trainee autonomy by allowing the trainee to speak first, ensuring the trainee is positioned closer to, and at eye level with, the patient, and redirecting patient questions to the trainee as appropriate. Optimizing trainee experience with bedside AR requires preparation and training of attending physicians, who may feel inadequately prepared to lead bedside rounds and conduct bedside teaching.37 Faculty must learn how to preserve team efficiency, create a safe, nonpunitive bedside environment that fosters the trainee-patient relationship, and ensure rounds remain educational.36,38,39
The intervention reduced the average time spent on AR and time spent per patient. Studies examining the relationship between bedside rounding and duration of rounds have yielded mixed results: some have demonstrated no effect of bedside rounds on rounding time,28,40 while others report longer rounding times.37 The pre-rounds huddle and real-time order writing may have enhanced workflow efficiency.
Our study has several limitations. These results reflect the experience of a single large academic medical center and may not be generalizable to other settings. Although overall patient response to the survey was low and may not be representative of the entire patient population, response rates in the intervention and control arms were equivalent. Non-English speaking patients may have preferences that were not reflected in our survey results, and we did not otherwise quantify individual reasons for survey noncompletion. The presence of auditors on AR may have introduced observer bias. There may have been crossover effect; however, observed prevalence of individual practices remained low in the control arm. The 1.5-hour workshop may have inadequately equipped trainees with the complex skills required to lead and participate in bedside rounding, and more training, experience, and feedback may have yielded different results. For instance, residents with more exposure to bedside rounding express greater appreciation of its role in education and patient care.20 While adherence to some of the recommended practices remained low, we did not employ a full range of change-management techniques. Instead, we opted for a “low intensity” intervention (eg, single workshop, handouts) that relied on voluntary adoption by medicine teams and that we hoped other institutions could reproduce. Finally, we did not assess the relative impact of individual rounding behaviors on the measured outcomes.
In conclusion, training medicine teams to adhere to a standardized bedside AR model increased patient satisfaction with rounds. Concomitant trainee dissatisfaction may require further experience and training of attending physicians and trainees to ensure successful adoption.
Acknowledgements
We would like to thank all patients, providers, and trainees who participated in this study. We would also like to acknowledge the following volunteer auditors who observed teams daily: Arianna Abundo, Elahhe Afkhamnejad, Yolanda Banuelos, Laila Fozoun, Soe Yupar Khin, Tam Thien Le, Wing Sum Li, Yaqiao Li, Mengyao Liu, Tzyy-Harn Lo, Shynh-Herng Lo, David Lowe, Danoush Paborji, Sa Nan Park, Urmila Powale, Redha Fouad Qabazard, Monique Quiroz, John-Luke Marcelo Rivera, Manfred Roy Luna Salvador, Tobias Gowen Squier-Roper, Flora Yan Ting, Francesca Natasha T. Tizon, Emily Claire Trautner, Stephen Weiner, Alice Wilson, Kimberly Woo, Bingling J Wu, Johnny Wu, Brenda Yee. Statistical expertise was provided by Joan Hilton from the UCSF Clinical and Translational Science Institute (CTSI), which is supported by the National Center for Advancing Translational Sciences, National Institutes of Health, through UCSF-CTSI Grant Number UL1 TR000004. Its contents are solely the responsibility of the authors and do not necessarily represent the official views of the NIH. Thanks also to Oralia Schatzman, Andrea Mazzini, and Erika Huie for their administrative support, and John Hillman for data-related support. Special thanks to Kirsten Kangelaris and Andrew Auerbach for their valuable feedback throughout, and to Maria Novelero and Robert Wachter for their divisional support of this project.
Disclosure
The authors report no financial conflicts of interest.
1. Doyle C, Lennox L, Bell D. A systematic review of evidence on the links between patient experience and clinical safety and effectiveness. BMJ Open. 2013;3(1):1-18. PubMed
2. Hospital Consumer Assessment of Healthcare Providers and Systems (HCAHPS) Fact Sheet. August 2013. Centers for Medicare and Medicaid Services (CMS). Baltimore, MD.http://www.hcahpsonline.org/files/August_2013_HCAHPS_Fact_Sheet3.pdf. Accessed December 1, 2015.
3. Boulding W, Glickman SW, Manary MP, Schulman KA, Staelin R. Relationship between patient satisfaction with inpatient care and hospital readmission within 30 days. Am J Manag Care. 2011;17:41-48. PubMed
4. Wray CM, Flores A, Padula WV, Prochaska MT, Meltzer DO, Arora VM. Measuring patient experiences on hospitalist and teaching services: Patient responses to a 30-day postdischarge questionnaire. J Hosp Med. 2016;11(2):99-104. PubMed
5. Bharwani AM, Harris GC, Southwick FS. Perspective: A business school view of medical interprofessional rounds: transforming rounding groups into rounding teams. Acad Med. 2012;87(12):1768-1771. PubMed
6. Chand DV. Observational study using the tools of lean six sigma to improve the efficiency of the resident rounding process. J Grad Med Educ. 2011;3(2):144-150. PubMed
7. Stickrath C, Noble M, Prochazka A, et al. Attending rounds in the current era: what is and is not happening. JAMA Intern Med. 2013;173(12):1084-1089. PubMed
8. Weber H, Stöckli M, Nübling M, Langewitz WA. Communication during ward rounds in internal medicine. An analysis of patient-nurse-physician interactions using RIAS. Patient Educ Couns. 2007;67(3):343-348. PubMed
9. McMahon GT, Katz JT, Thorndike ME, Levy BD, Loscalzo J. Evaluation of a redesign initiative in an internal-medicine residency. N Engl J Med. 2010;362(14):1304-1311. PubMed
10. Amoss J. Attending rounds: where do we go from here?: comment on “Attending rounds in the current era”. JAMA Intern Med. 2013;173(12):1089-1090. PubMed
11. Curley C, McEachern JE, Speroff T. A firm trial of interdisciplinary rounds on the inpatient medical wards: an intervention designed using continuous quality improvement. Med Care. 1998;36(suppl 8):AS4-A12. PubMed
12. Wang-Cheng RM, Barnas GP, Sigmann P, Riendl PA, Young MJ. Bedside case presentations: why patients like them but learners don’t. J Gen Intern Med. 1989;4(4):284-287. PubMed
13. Chauke, HL, Pattinson RC. Ward rounds—bedside or conference room? S Afr Med J. 2006;96(5):398-400. PubMed
14. Lehmann LS, Brancati FL, Chen MC, Roter D, Dobs AS. The effect of bedside case presentations on patients’ perceptions of their medical care. N Engl J Med. 1997;336(16):336, 1150-1155. PubMed
15. Simons RJ, Baily RG, Zelis R, Zwillich CW. The physiologic and psychological effects of the bedside presentation. N Engl J Med. 1989;321(18):1273-1275. PubMed
16. Wise TN, Feldheim D, Mann LS, Boyle E, Rustgi VK. Patients’ reactions to house staff work rounds. Psychosomatics. 1985;26(8):669-672. PubMed
17. Linfors EW, Neelon FA. Sounding Boards. The case of bedside rounds. N Engl J Med. 1980;303(21):1230-1233. PubMed
18. Nair BR, Coughlan JL, Hensley MJ. Student and patient perspectives on bedside teaching. Med Educ. 1997;31(5):341-346. PubMed
19. Romano J. Patients’ attitudes and behavior in ward round teaching. JAMA. 1941;117(9):664-667.
20. Gonzalo JD, Masters PA, Simons RJ, Chuang CH. Attending rounds and bedside case presentations: medical student and medicine resident experiences and attitudes. Teach Learn Med. 2009;21(2):105-110. PubMed
21. Shoeb M, Khanna R, Fang M, et al. Internal medicine rounding practices and the Accreditation Council for Graduate Medical Education core competencies. J Hosp Med. 2014;9(4):239-243. PubMed
22. Calderon AS, Blackmore CC, Williams BL, et al. Transforming ward rounds through rounding-in-flow. J Grad Med Educ. 2014;6(4):750-755. PubMed
23. Henkin S, Chon TY, Christopherson ML, Halvorsen AJ, Worden LM, Ratelle JT. Improving nurse-physician teamwork through interprofessional bedside rounding. J Multidiscip Healthc. 2016;9:201-205. PubMed
24. O’Leary KJ, Killarney A, Hansen LO, et al. Effect of patient-centred bedside rounds on hospitalised patients’ decision control, activation and satisfaction with care. BMJ Qual Saf. 2016;25:921-928. PubMed
25. Southwick F, Lewis M, Treloar D, et al. Applying athletic principles to medical rounds to improve teaching and patient care. Acad Med. 2014;89(7):1018-1023. PubMed
26. Najafi N, Monash B, Mourad M, et al. Improving attending rounds: Qualitative reflections from multidisciplinary providers. Hosp Pract (1995). 2015;43(3):186-190. PubMed
27. Altman DG. Practical Statistics For Medical Research. Boca Raton, FL: Chapman & Hall/CRC; 2006.
28. Gonzalo JD, Chuang CH, Huang G, Smith C. The return of bedside rounds: an educational intervention. J Gen Intern Med. 2010;25(8):792-798. PubMed
29. Fletcher KE, Rankey DS, Stern DT. Bedside interactions from the other side of the bedrail. J Gen Intern Med. 2005;20(1):58-61. PubMed
30. Gatorounds: Applying Championship Athletic Principles to Healthcare. University of Florida Health. http://gatorounds.med.ufl.edu/surveys/. Accessed March 1, 2013.
31. Gonzalo JD, Heist BS, Duffy BL, et al. The value of bedside rounds: a multicenter qualitative study. Teach Learn Med. 2013;25(4):326-333. PubMed
32. Rogers HD, Carline JD, Paauw DS. Examination room presentations in general internal medicine clinic: patients’ and students’ perceptions. Acad Med. 2003;78(9):945-949. PubMed
33. Fletcher KE, Furney SL, Stern DT. Patients speak: what’s really important about bedside interactions with physician teams. Teach Learn Med. 2007;19(2):120-127. PubMed
34. Satterfield JM, Bereknyei S, Hilton JF, et al. The prevalence of social and behavioral topics and related educational opportunities during attending rounds. Acad Med. 2014; 89(11):1548-1557. PubMed
35. Kroenke K, Simmons JO, Copley JB, Smith C. Attending rounds: a survey of physician attitudes. J Gen Intern Med. 1990;5(3):229-233. PubMed
36. Castiglioni A, Shewchuk RM, Willett LL, Heudebert GR, Centor RM. A pilot study using nominal group technique to assess residents’ perceptions of successful attending rounds. J Gen Intern Med. 2008;23(7):1060-1065. PubMed
37. Crumlish CM, Yialamas MA, McMahon GT. Quantification of bedside teaching by an academic hospitalist group. J Hosp Med. 2009;4(5):304-307. PubMed
38. Gonzalo JD, Wolpaw DR, Lehman E, Chuang CH. Patient-centered interprofessional collaborative care: factors associated with bedside interprofessional rounds. J Gen Intern Med. 2014;29(7):1040-1047. PubMed
39. Roy B, Castiglioni A, Kraemer RR, et al. Using cognitive mapping to define key domains for successful attending rounds. J Gen Intern Med. 2012;27(11):1492-1498. PubMed
40. Bhansali P, Birch S, Campbell JK, et al. A time-motion study of inpatient rounds using a family-centered rounds model. Hosp Pediatr. 2013;3(1):31-38. PubMed
© 2017 Society of Hospital Medicine
Association Between DCBN and LOS
Slow hospital throughputthe process whereby a patient is admitted, placed in a room, and eventually dischargedcan worsen outcomes if admitted patients are boarded in emergency rooms or postanesthesia units.[1] One potential method to improve throughput is to discharge patients earlier in the day,[2] freeing up available beds and conceivably reducing hospital length of stay (LOS).
To quantify throughput, hospitals are beginning to measure the proportion of patients discharged before noon (DCBN). One study, looking at discharges on a single medical floor in an urban academic medical center, suggested that increasing the percentage of patients discharged by noon decreased observed‐to‐expected LOS in hospitalized medicine patients,[3] and a follow‐up study demonstrated that it was associated with admissions from the emergency department occurring earlier in the day.[4] However, these studies did not adjust for changes in case mix index (CMI) and other patient‐level characteristics that may also have affected these outcomes. Concerns persist that more efforts to discharge patients by noon could inadvertently increase LOS if staff chose to keep patients overnight for an early discharge the following day.
We undertook a retrospective analysis of data from patients discharged from a large academic medical center where an institution‐wide emphasis was placed on discharging more patients by noon. Using these data, we examined the association between discharges before noon and LOS in medical and surgical inpatients.
METHODS
Site and Subjects
Our study was based at the University of California, San Francisco (UCSF) Medical Center, a 400‐bed academic hospital located in San Francisco, California. We examined adult medical and surgical discharges from July 2012 through April 2015. Patients who stayed less than 24 hours or more than 20 days were excluded. Discharges from the hospital medicine service and the following surgical services were included in the analysis: cardiac surgery, colorectal surgery, cardiothoracic surgery, general surgery, gynecologic oncology, gynecology, neurosurgery, orthopedics, otolaryngology, head and neck surgery, plastic surgery, thoracic surgery, urology, and vascular surgery. No exclusions were made based on patient status (eg, observation vs inpatient). UCSF's institutional review board approved our study.
During the time of our study, discharges before noon time became an institutional priority. To this end, rates of DCBN were tracked using retrospective data, and various units undertook efforts such as informal afternoon meetings to prompt planning for the next morning's discharges. These efforts did not differentially affect medical or surgical units or emergent or nonemergent admissions, and no financial incentives or other changes in workflow were in place to increase DCBN rates.
Data Sources
We used the cost accounting system at UCSF (Enterprise Performance System Inc. [EPSI], Chicago, IL) to collect demographic information about each patient, including age, sex, primary race, and primary ethnicity. This system was also used to collect characteristics of each hospitalization including LOS (calculated from admission date time and discharge date time), hospital service at discharge, the discharge attending, discharge disposition of the patient, and the CMI, a marker of the severity of illness of the patient during that hospitalization. EPSI was also used to collect data on the admission type of all patients, either emergent, urgent, or routine, and the insurance status of the patient during that hospitalization.
Data on time of discharge were entered by the discharging nurse or unit assistant to reflect the time the patient left the hospital. Using these data, we defined a before‐noon discharge as one taking place between 8:00 am and 12:00 pm.
Statistical Analysis
Wilcoxon rank sum test and 2 statistics were used to compare baseline characteristics of hospitalizations of patients discharged before and after noon.
We used generalized linear models to assess the association of a discharge before noon on the LOS with gamma models. We accounted for clustering of discharge attendings using generalized estimating equations with exchangeable working correlation and robust standard errors. After the initial unadjusted analyses, covariates were included in the adjusted analysis if they were associated with an LOS at P < 0.05 or reasons of face validity. These variables are shown in Table 1. Because an effort to increase the discharges before noon was started in the 2014 academic year, we added an interaction term between the date of discharge and whether a discharge occurred before noon. The interaction term was included by dividing the study period into time periods corresponding to sequential 6‐month intervals. A new variable was defined by a categorical variable that indicated in which of these time periods a discharge occurred.
| Discharged Before Noon | Discharged After Noon | P Value | |
|---|---|---|---|
| |||
| Median LOS (IQR) | 3.4 (2.25.9) | 3.7 (2.36.3) | <0.0005 |
| Median CMI (IQR) | 1.8 (1.12.4) | 1.7 (1.12.5) | 0.006 |
| Service type, N (%) | |||
| Hospital medicine | 1,919 (29.6) | 11,290 (35.4) | |
| Surgical services | 4,565 (70.4) | 20,591 (64.6) | <0.0005 |
| Discharged before noon, N (%) | 6,484 (16.9) | 31,881 (83.1) | |
| Discharged on weekend, N (%) | |||
| Yes | 1,543 (23.8) | 7,411 (23.3) | |
| No | 4,941 (76.2) | 24,470 (76.8) | 0.34 |
| Discharge disposition, N (%) | |||
| Home with home health | 748 (11.5) | 5,774 (18.1) | |
| Home without home health | 3,997 (61.6) | 17,862 (56.0) | |
| SNF | 837 (12.9) | 3,082 (9.7) | |
| Other | 902 (13.9) | 5,163 (16.2) | <0.0005 |
| 6‐month interval, N (%) | |||
| JulyDecember 2012 | 993 (15.3) | 5,596 (17.6) | |
| JanuaryJune 2013 | 980 (15.1) | 5,721 (17.9) | |
| JulyDecember 2013 | 1,088 (16.8) | 5,690 (17.9) | |
| JanuaryJune 2014 | 1,288 (19.9) | 5,441 (17.1) | |
| JulyDecember 2014 | 1,275 (19.7) | 5,656 (17.7) | |
| JanuaryApril 2015 | 860 (13.3) | 3,777 (11.9) | <0.0005 |
| Age category, N (%) | |||
| 1864 years | 4,177 (64.4) | 20,044 (62.9) | |
| 65+ years | 2,307 (35.6) | 11,837 (37.1) | 0.02 |
| Male, N (%) | 3,274 (50.5) | 15,596 (48.9) | |
| Female, N (%) | 3,210 (49.5) | 16,284 (51.1) | 0.06 |
| Race, N (%) | |||
| White or Caucasian | 4,133 (63.7) | 18,798 (59.0) | |
| African American | 518 (8.0) | 3,020 (9.5) | |
| Asian | 703 (10.8) | 4,052 (12.7) | |
| Other | 1,130 (17.4) | 6,011 (18.9) | <0.0005 |
| Ethnicity, N (%) | |||
| Hispanic or Latino | 691 (10.7) | 3,713 (11.7) | |
| Not Hispanic or Latino | 5,597 (86.3) | 27,209 (85.4) | |
| Unknown/declined | 196 (3.0) | 959 (3.0) | 0.07 |
| Admission type, N (%) | |||
| Elective | 3,494 (53.9) | 13,881 (43.5) | |
| Emergency | 2,047 (31.6) | 12,145 (38.1) | |
| Urgent | 889 (13.7) | 5,459 (17.1) | |
| Other | 54 (0.8) | 396 (1.2) | <0.0005 |
| Payor class, N (%) | |||
| Medicare | 2,648 (40.8) | 13,808 (43.3) | |
| Medi‐Cal | 1,060 (16.4) | 5,913 (18.6) | |
| Commercial | 2,633 (40.6) | 11,242 (35.3) | |
| Other | 143 (2.2) | 918 (2.9) | <0.0005 |
We conducted a sensitivity analysis using propensity scores. The propensity score was based on demographic and clinical variables (as listed in Table 1) that exhibited P < 0.2 in bivariate analysis between the variable and being discharged before noon. We then used the propensity score as a covariate in a generalized linear model of the LOS with a gamma distribution and with generalized estimating equations as described above.
Finally, we performed prespecified secondary subset analyses of patients admitted emergently and nonemergently.
Statistical modeling and analysis was completed using Stata version 13 (StataCorp, College Station, TX).
RESULTS
Patient Demographics and Discharge Before Noon
Our study population comprised 27,983 patients for a total of 38,365 hospitalizations with a median LOS of 3.7 days. We observed 6484 discharges before noon (16.9%) and 31,881 discharges after noon (83.1%). The characteristics of the hospitalizations are shown in Table 1.
Patients who were discharged before noon tended to be younger, white, and discharged with a disposition to home without home health. The median CMI was slightly higher in discharges before noon (1.81, P = 0.006), and elective admissions were more likely than emergent to be discharged before noon (53.9% vs 31.6%, P < 0.0005).
Multivariable Analysis
A discharge before noon was associated with a 4.3% increase in LOS (adjusted odds ratio [OR]: 1.043, 95% confidence interval [CI]: 1.003‐1.086), adjusting for CMI, the service type, discharge on the weekend, discharge disposition, age, sex, ethnicity, race, urgency of admission, payor class, and a full interaction with the date of discharge (in 6‐month intervals). In preplanned subset analyses, the association between longer LOS and DCBN was more pronounced in patients admitted emergently (adjusted OR: 1.14, 95% CI: 1.033‐1.249) and less pronounced for patients not admitted emergently (adjusted OR: 1.03, 95% CI: 0.988‐1.074), although the latter did not meet statistical significance. In patients admitted emergently, this corresponds to approximately a 12‐hour increase in LOS. The interaction term of discharge date and DCBN was significant in the model. In further subset analyses, the association between longer LOS and DCBN was more pronounced in medicine patients (adjusted OR: 1.116, 95% CI: 1.014‐1.228) than in surgical patients (adjusted OR: 1.030, 95% CI: 0.989‐1.074), although the relationship in surgical patients did not meet statistical significance.
We also undertook sensitivity analyses utilizing propensity scores as a covariate in our base multivariable models. Results from these analyses did not differ from the base models and are not presented here. Results also did not differ when comparing discharges before and after the initiation of an attending only service.
DISCUSSION AND CONCLUSION
In our retrospective study of patients discharged from an academic medical center, discharge before noon was associated with a longer LOS, with the effect more pronounced in patients admitted emergently in the hospital. Our results suggest that efforts to discharge patients earlier in the day may have varying degrees of success depending on patient characteristics. Conceivably, elective admissions recover according to predictable plans, allowing for discharges earlier in the day. In contrast, patients discharged from emergent hospitalizations may have ongoing evolution of their care plan, making plans for discharging before noon more challenging.
Our results differ from a previous study,[3] which suggested that increasing the proportion of before‐noon discharges was associated with a fall in observed‐to‐expected LOS. However, observational studies of DCBN are challenging, because the association between early discharge and LOS is potentially bidirectional. One interpretation, for example, is that patients were kept longer in order to be discharged by noon the following day, which for the subgroups of patients admitted emergently corresponded to a roughly 12‐hour increase in LOS. However, it is also plausible that patients who stayed longer also had more time to plan for an early discharge. In either scenario, the ability of managers to utilize LOS as a key metric of throughput efforts may be flawed, and suggests that alternatives (eg, number of patients waiting for beds off unit) may be a more reasonable measure of throughput. Our results have several limitations. As in any observational study, our results are vulnerable to biases from unmeasured covariates that confound the analysis. We caution that a causal relationship between a discharge before noon and LOS cannot be determined from the nature of the study. Our results are also limited in that we were unable to adjust for day‐to‐day hospital capacity and other variables that affect LOS including caregiver and transportation availability, bed capacity at receiving care facilities, and patient consent to discharge. Finally, as a single‐site study, our findings may not be applicable to nonacademic settings.
In conclusion, our observational study discerned an association between discharging patients before noon and longer LOS. We believe our findings suggest a rationale for alternate approaches to measuring an early discharge program's effectiveness, namely, that the evaluation of the success of an early discharge initiative should consider multiple evaluation metrics including the effect on emergency department wait times, intensive care unit or postanesthesia transitions, and on patient reported experiences of care transitions.
Disclosures
Andrew Auerbach, MD, is supported by a K24 grant from the National Heart, Lung, and Blood Institute: K24HL098372. The authors report no conflicts of interest.
- , , , et al. The effect of emergency department crowding on clinically oriented outcomes. Acad Emerg Med. 2009;16(1):1–10.
- Centers for Medicare 2013.
- , , , et al. Discharge before noon: an achievable hospital goal. J Hosp Med. 2014;9(4):210–214.
- , , , et al. Discharge before noon: effect on throughput and sustainability. J Hosp Med. 2015;10(10):664–669.
Slow hospital throughputthe process whereby a patient is admitted, placed in a room, and eventually dischargedcan worsen outcomes if admitted patients are boarded in emergency rooms or postanesthesia units.[1] One potential method to improve throughput is to discharge patients earlier in the day,[2] freeing up available beds and conceivably reducing hospital length of stay (LOS).
To quantify throughput, hospitals are beginning to measure the proportion of patients discharged before noon (DCBN). One study, looking at discharges on a single medical floor in an urban academic medical center, suggested that increasing the percentage of patients discharged by noon decreased observed‐to‐expected LOS in hospitalized medicine patients,[3] and a follow‐up study demonstrated that it was associated with admissions from the emergency department occurring earlier in the day.[4] However, these studies did not adjust for changes in case mix index (CMI) and other patient‐level characteristics that may also have affected these outcomes. Concerns persist that more efforts to discharge patients by noon could inadvertently increase LOS if staff chose to keep patients overnight for an early discharge the following day.
We undertook a retrospective analysis of data from patients discharged from a large academic medical center where an institution‐wide emphasis was placed on discharging more patients by noon. Using these data, we examined the association between discharges before noon and LOS in medical and surgical inpatients.
METHODS
Site and Subjects
Our study was based at the University of California, San Francisco (UCSF) Medical Center, a 400‐bed academic hospital located in San Francisco, California. We examined adult medical and surgical discharges from July 2012 through April 2015. Patients who stayed less than 24 hours or more than 20 days were excluded. Discharges from the hospital medicine service and the following surgical services were included in the analysis: cardiac surgery, colorectal surgery, cardiothoracic surgery, general surgery, gynecologic oncology, gynecology, neurosurgery, orthopedics, otolaryngology, head and neck surgery, plastic surgery, thoracic surgery, urology, and vascular surgery. No exclusions were made based on patient status (eg, observation vs inpatient). UCSF's institutional review board approved our study.
During the time of our study, discharges before noon time became an institutional priority. To this end, rates of DCBN were tracked using retrospective data, and various units undertook efforts such as informal afternoon meetings to prompt planning for the next morning's discharges. These efforts did not differentially affect medical or surgical units or emergent or nonemergent admissions, and no financial incentives or other changes in workflow were in place to increase DCBN rates.
Data Sources
We used the cost accounting system at UCSF (Enterprise Performance System Inc. [EPSI], Chicago, IL) to collect demographic information about each patient, including age, sex, primary race, and primary ethnicity. This system was also used to collect characteristics of each hospitalization including LOS (calculated from admission date time and discharge date time), hospital service at discharge, the discharge attending, discharge disposition of the patient, and the CMI, a marker of the severity of illness of the patient during that hospitalization. EPSI was also used to collect data on the admission type of all patients, either emergent, urgent, or routine, and the insurance status of the patient during that hospitalization.
Data on time of discharge were entered by the discharging nurse or unit assistant to reflect the time the patient left the hospital. Using these data, we defined a before‐noon discharge as one taking place between 8:00 am and 12:00 pm.
Statistical Analysis
Wilcoxon rank sum test and 2 statistics were used to compare baseline characteristics of hospitalizations of patients discharged before and after noon.
We used generalized linear models to assess the association of a discharge before noon on the LOS with gamma models. We accounted for clustering of discharge attendings using generalized estimating equations with exchangeable working correlation and robust standard errors. After the initial unadjusted analyses, covariates were included in the adjusted analysis if they were associated with an LOS at P < 0.05 or reasons of face validity. These variables are shown in Table 1. Because an effort to increase the discharges before noon was started in the 2014 academic year, we added an interaction term between the date of discharge and whether a discharge occurred before noon. The interaction term was included by dividing the study period into time periods corresponding to sequential 6‐month intervals. A new variable was defined by a categorical variable that indicated in which of these time periods a discharge occurred.
| Discharged Before Noon | Discharged After Noon | P Value | |
|---|---|---|---|
| |||
| Median LOS (IQR) | 3.4 (2.25.9) | 3.7 (2.36.3) | <0.0005 |
| Median CMI (IQR) | 1.8 (1.12.4) | 1.7 (1.12.5) | 0.006 |
| Service type, N (%) | |||
| Hospital medicine | 1,919 (29.6) | 11,290 (35.4) | |
| Surgical services | 4,565 (70.4) | 20,591 (64.6) | <0.0005 |
| Discharged before noon, N (%) | 6,484 (16.9) | 31,881 (83.1) | |
| Discharged on weekend, N (%) | |||
| Yes | 1,543 (23.8) | 7,411 (23.3) | |
| No | 4,941 (76.2) | 24,470 (76.8) | 0.34 |
| Discharge disposition, N (%) | |||
| Home with home health | 748 (11.5) | 5,774 (18.1) | |
| Home without home health | 3,997 (61.6) | 17,862 (56.0) | |
| SNF | 837 (12.9) | 3,082 (9.7) | |
| Other | 902 (13.9) | 5,163 (16.2) | <0.0005 |
| 6‐month interval, N (%) | |||
| JulyDecember 2012 | 993 (15.3) | 5,596 (17.6) | |
| JanuaryJune 2013 | 980 (15.1) | 5,721 (17.9) | |
| JulyDecember 2013 | 1,088 (16.8) | 5,690 (17.9) | |
| JanuaryJune 2014 | 1,288 (19.9) | 5,441 (17.1) | |
| JulyDecember 2014 | 1,275 (19.7) | 5,656 (17.7) | |
| JanuaryApril 2015 | 860 (13.3) | 3,777 (11.9) | <0.0005 |
| Age category, N (%) | |||
| 1864 years | 4,177 (64.4) | 20,044 (62.9) | |
| 65+ years | 2,307 (35.6) | 11,837 (37.1) | 0.02 |
| Male, N (%) | 3,274 (50.5) | 15,596 (48.9) | |
| Female, N (%) | 3,210 (49.5) | 16,284 (51.1) | 0.06 |
| Race, N (%) | |||
| White or Caucasian | 4,133 (63.7) | 18,798 (59.0) | |
| African American | 518 (8.0) | 3,020 (9.5) | |
| Asian | 703 (10.8) | 4,052 (12.7) | |
| Other | 1,130 (17.4) | 6,011 (18.9) | <0.0005 |
| Ethnicity, N (%) | |||
| Hispanic or Latino | 691 (10.7) | 3,713 (11.7) | |
| Not Hispanic or Latino | 5,597 (86.3) | 27,209 (85.4) | |
| Unknown/declined | 196 (3.0) | 959 (3.0) | 0.07 |
| Admission type, N (%) | |||
| Elective | 3,494 (53.9) | 13,881 (43.5) | |
| Emergency | 2,047 (31.6) | 12,145 (38.1) | |
| Urgent | 889 (13.7) | 5,459 (17.1) | |
| Other | 54 (0.8) | 396 (1.2) | <0.0005 |
| Payor class, N (%) | |||
| Medicare | 2,648 (40.8) | 13,808 (43.3) | |
| Medi‐Cal | 1,060 (16.4) | 5,913 (18.6) | |
| Commercial | 2,633 (40.6) | 11,242 (35.3) | |
| Other | 143 (2.2) | 918 (2.9) | <0.0005 |
We conducted a sensitivity analysis using propensity scores. The propensity score was based on demographic and clinical variables (as listed in Table 1) that exhibited P < 0.2 in bivariate analysis between the variable and being discharged before noon. We then used the propensity score as a covariate in a generalized linear model of the LOS with a gamma distribution and with generalized estimating equations as described above.
Finally, we performed prespecified secondary subset analyses of patients admitted emergently and nonemergently.
Statistical modeling and analysis was completed using Stata version 13 (StataCorp, College Station, TX).
RESULTS
Patient Demographics and Discharge Before Noon
Our study population comprised 27,983 patients for a total of 38,365 hospitalizations with a median LOS of 3.7 days. We observed 6484 discharges before noon (16.9%) and 31,881 discharges after noon (83.1%). The characteristics of the hospitalizations are shown in Table 1.
Patients who were discharged before noon tended to be younger, white, and discharged with a disposition to home without home health. The median CMI was slightly higher in discharges before noon (1.81, P = 0.006), and elective admissions were more likely than emergent to be discharged before noon (53.9% vs 31.6%, P < 0.0005).
Multivariable Analysis
A discharge before noon was associated with a 4.3% increase in LOS (adjusted odds ratio [OR]: 1.043, 95% confidence interval [CI]: 1.003‐1.086), adjusting for CMI, the service type, discharge on the weekend, discharge disposition, age, sex, ethnicity, race, urgency of admission, payor class, and a full interaction with the date of discharge (in 6‐month intervals). In preplanned subset analyses, the association between longer LOS and DCBN was more pronounced in patients admitted emergently (adjusted OR: 1.14, 95% CI: 1.033‐1.249) and less pronounced for patients not admitted emergently (adjusted OR: 1.03, 95% CI: 0.988‐1.074), although the latter did not meet statistical significance. In patients admitted emergently, this corresponds to approximately a 12‐hour increase in LOS. The interaction term of discharge date and DCBN was significant in the model. In further subset analyses, the association between longer LOS and DCBN was more pronounced in medicine patients (adjusted OR: 1.116, 95% CI: 1.014‐1.228) than in surgical patients (adjusted OR: 1.030, 95% CI: 0.989‐1.074), although the relationship in surgical patients did not meet statistical significance.
We also undertook sensitivity analyses utilizing propensity scores as a covariate in our base multivariable models. Results from these analyses did not differ from the base models and are not presented here. Results also did not differ when comparing discharges before and after the initiation of an attending only service.
DISCUSSION AND CONCLUSION
In our retrospective study of patients discharged from an academic medical center, discharge before noon was associated with a longer LOS, with the effect more pronounced in patients admitted emergently in the hospital. Our results suggest that efforts to discharge patients earlier in the day may have varying degrees of success depending on patient characteristics. Conceivably, elective admissions recover according to predictable plans, allowing for discharges earlier in the day. In contrast, patients discharged from emergent hospitalizations may have ongoing evolution of their care plan, making plans for discharging before noon more challenging.
Our results differ from a previous study,[3] which suggested that increasing the proportion of before‐noon discharges was associated with a fall in observed‐to‐expected LOS. However, observational studies of DCBN are challenging, because the association between early discharge and LOS is potentially bidirectional. One interpretation, for example, is that patients were kept longer in order to be discharged by noon the following day, which for the subgroups of patients admitted emergently corresponded to a roughly 12‐hour increase in LOS. However, it is also plausible that patients who stayed longer also had more time to plan for an early discharge. In either scenario, the ability of managers to utilize LOS as a key metric of throughput efforts may be flawed, and suggests that alternatives (eg, number of patients waiting for beds off unit) may be a more reasonable measure of throughput. Our results have several limitations. As in any observational study, our results are vulnerable to biases from unmeasured covariates that confound the analysis. We caution that a causal relationship between a discharge before noon and LOS cannot be determined from the nature of the study. Our results are also limited in that we were unable to adjust for day‐to‐day hospital capacity and other variables that affect LOS including caregiver and transportation availability, bed capacity at receiving care facilities, and patient consent to discharge. Finally, as a single‐site study, our findings may not be applicable to nonacademic settings.
In conclusion, our observational study discerned an association between discharging patients before noon and longer LOS. We believe our findings suggest a rationale for alternate approaches to measuring an early discharge program's effectiveness, namely, that the evaluation of the success of an early discharge initiative should consider multiple evaluation metrics including the effect on emergency department wait times, intensive care unit or postanesthesia transitions, and on patient reported experiences of care transitions.
Disclosures
Andrew Auerbach, MD, is supported by a K24 grant from the National Heart, Lung, and Blood Institute: K24HL098372. The authors report no conflicts of interest.
- , , , et al. The effect of emergency department crowding on clinically oriented outcomes. Acad Emerg Med. 2009;16(1):1–10.
- Centers for Medicare 2013.
- , , , et al. Discharge before noon: an achievable hospital goal. J Hosp Med. 2014;9(4):210–214.
- , , , et al. Discharge before noon: effect on throughput and sustainability. J Hosp Med. 2015;10(10):664–669.
© 2015 Society of Hospital Medicine