User login
Achievable Benchmarks of Care for Pediatric Readmissions
Hospital readmission rates are a common metric for defining, evaluating, and benchmarking quality of care. The Centers for Medicare and Medicaid Services (CMS) publicly report hospital readmission rates for common adult conditions and reduces payments to hospitals with excessive readmissions.1 Recently, the focus on pediatric readmission rates has increased and the National Quality Forum (NQF) has endorsed at least two pediatric readmission-specific quality indicators which could be used by public and private payers in pay-for-performance programs aimed at institutions caring for children.2 While preventability of readmissions and their value as a marker of quality remains debated, their acceptance by the NQF and CMS has led public and private payers to propose readmission-related penalties for hospitals caring for children. 3-5
All-cause 30-day same-hospital readmission rates for pediatric conditions are half of the adult readmission rates, around 6% in most studies, compared to 12% in adults.6,7 The lower rates of pediatric readmissions makes it difficult to only use mean readmission rates to stratify hospitals into high- or low-performers and set target goals for improvement.8 While adult readmissions have been studied in depth, there are no consistent measures used to benchmark pediatric readmissions across hospital types.
Given the emphasis placed on readmissions, it is essential to understand patterns in pediatric readmission rates to determine optimal and achievable targets for improvement. Achievable Benchmarks of Care (ABCs) are one approach to understanding readmission rates and have an advantage over using mean or medians in performance improvement as they can stratify performance for conditions with low readmission rates and low volumes.9 When creating benchmarks, it is important that hospitals performance is evaluated among peer hospitals with similar patient populations, not just a cumulative average from all hospital types which may punish hospitals with a more complex patient case mix.10 The goal of this study was to calculate the readmission rates and the ABCs for common pediatric diagnoses by hospital type to identify priority conditions for quality improvement efforts using a previously published methodology.11-13
METHODS
Data Source
We conducted a retrospective analysis of patients less than 18 years of age in the Healthcare Utilization Project 2014 Nationwide Readmissions Database (NRD). The NRD includes public hospitals; academic medical centers; and specialty hospitals in obstetrics and gynecology, otolaryngology, orthopedics, and cancer; and pediatric, public, and academic medical hospitals. Excluded are long-term care facilities such as rehabilitation, long-term acute care, psychiatric, alcoholism, and chemical dependency hospitals. The readmissions data contains information from hospitals grouped by region, population census, and teaching status.14 Three hospital type classifications used in this study were metropolitan teaching hospitals, metropolitan nonteaching hospitals, and nonmetropolitan hospitals. These three hospital type classifications follow the reporting format in the NRD.
Study Population
Patients less than 18 years old were included if they were discharged from January 1, 2014 through November 30, 2014 and had a readmission to the index hospital within 30 days. We limited inclusion to discharges through November 30 so we could identify patients with a 30-day readmission as patient identifiers do not link across years in the NRD.
Exposure
We included 30-day, all-cause, same-hospital readmissions to the index acute care hospital, excluding labor and delivery, normal newborn care, chemotherapy, transfers, and mortalities. Intrahospital discharge and admissions within the same hospital system were not defined as a readmission, but rather as a “same-day event.”15 For example, institutions with inpatient mental health facilities, medical unit discharges and admission to the mental health unit were not identified as a readmission in this dataset.
Outcome
For each hospital type, we measured same-hospital, all-cause, 30-day readmission rates and achievable benchmark of care for the 17 most commonly readmitted pediatric discharge diagnoses. To identify the target readmission diagnoses and all-cause, 30-day readmissions based on their index hospitalizations, All-Patient Refined Diagnosis-Related Groups (APR-DRG), version 25 (3M Health Information Systems, Salt Lake City, Utah) were ordered by frequency for each hospital type. The 20 most common APR-DRGs were the same across all hospital types. The authors then evaluated these 20 APR-DRGs for clinical consistency of included diagnoses identified by the International Classification of Diseases, Ninth Revision, Clinical Modification (ICD-9-CM) codes within each APR-DRG. Three diagnosis-related groups were excluded from the analysis (major hematologic/immunologic disease except for sickle cell, other anemia and disorders of blood and blood forming organs, and other digestive system diagnoses) due to the heterogeneity of the diagnoses identified by the ICD-9-CM codes within each APR-DRG. We refer to each APR-DRG as a “diagnosis” throughout the article.
Analysis
The demographic characteristics of the patients seen at the three hospital types were summarized using frequencies and percentages. Reports were generated for patient age, gender, payer source, patient residence, median household income, patient complexity, and discharge disposition. Patient complexity was defined using complex chronic condition (CCC) and the number of chronic conditions (CCI).16,17 As previously defined in the literature, a complex chronic condition is “any medical condition that can be reasonably expected to last at least 12 months (unless death intervenes) and to involve either several different organ systems or one organ system severely enough to require specialty pediatric care and probably some period of hospitalization in a tertiary care center.”16 Whereas, the Agency for Healthcare Research and Quality’s Chronic Condition Indicator (CCI) defines single, non-CCCs (eg, allergic rhinitis).17
For each diagnosis, we calculated the mean readmission rate for hospitals in each hospital type category. We then calculated an ABC for each diagnosis in each hospital type using a four-step process.13,18 First, to control for hospitals with small sample sizes, we adjusted all readmission rates using an adjusted performance fraction ([numerator+1]/[denominator +2]), where the numerator is the number of all-cause 30-day readmissions and the denominator is the number of discharges for the selected diagnosis. Then the hospitals were ordered from lowest (best performing) to highest (worst performing) using the adjusted readmission rate. Third, the number of discharges from the best performing hospital to the worst performing hospital was summed until at least 10% of the total discharges had been accounted for. Finally, we computed the ABC as the average of these best performing hospitals. We only report ABCs for which at least three hospitals were included as best performers in the calculation.13
To evaluate hospital performance on ABCs for each diagnosis, we identified the percent of hospitals in each setting that were outliers. We defined an outlier as any hospital whose 95% confidence interval for their readmission rate for a given diagnosis did not contain the ABC for their hospital type. All the statistical analyses were performed using SAS version 9.3 (SAS Institute, Inc, Cary, North Carolina).
This project was reviewed by the Cincinnati Children’s Hospital Medical Center Institutional Review Board and determined to be nonhuman subjects research.
RESULTS
Hospital-Type Demographics
The 690,949 discharges from 1,664 hospitals were categorized into 525 metropolitan teaching (550,039 discharges, 79.6% of discharges), 552 metropolitan nonteaching (97,207 discharges, 14% of discharges), and 587 nonmetropolitan hospitals (43,703 discharges, 6.3% of discharges; Table 1). There were significant differences in the patient composition among the three hospital settings. Nonmetropolitan hospitals had a larger percentage of younger patients (aged 0-4 years, P < .001), prominence of first and second quartile median household income, and fewer medically complex patients (48.3% No CCC/No CCI versus 25.5% metropolitan teaching and 33.7% nonteaching, P < .001). Disposition home was over 96% in all three hospital types; however, the metropolitan teaching had a greater percentage of patients discharged to home health versus metropolitan nonteaching and nonmetropolitan hospitals (2.3% versus 0.5%; P < .001).
Readmission Rates
The 17 most common diagnoses based on the number of all-cause 30-day same-hospital readmissions, were categorized into two surgical, seven acute/infectious, four chronic, and four mental health diagnoses (Table 2). Readmission rates varied based on diagnosis and hospital type (Table 2). Overall, mean readmission rates were low, especially in acute respiratory tract related diseases. For chronic diseases, asthma readmissions were consistently low in all three hospital types, whereas sickle cell disease had the highest readmission rate in all three hospital types.
Achievable Benchmarks of Care by Hospital Type
The diagnoses for which ABC could be calculated across all three hospital types included appendectomy and four acute conditions (bronchiolitis, pneumonia, nonbacterial gastroenteritis, and kidney/urinary tract infections). For these conditions, metropolitan teaching hospitals had a more significant percentage of outlier hospitals compared to metropolitan nonteaching and nonmetropolitan hospitals. The percent of outlier hospitals varied by diagnosis and hospital type (Figure).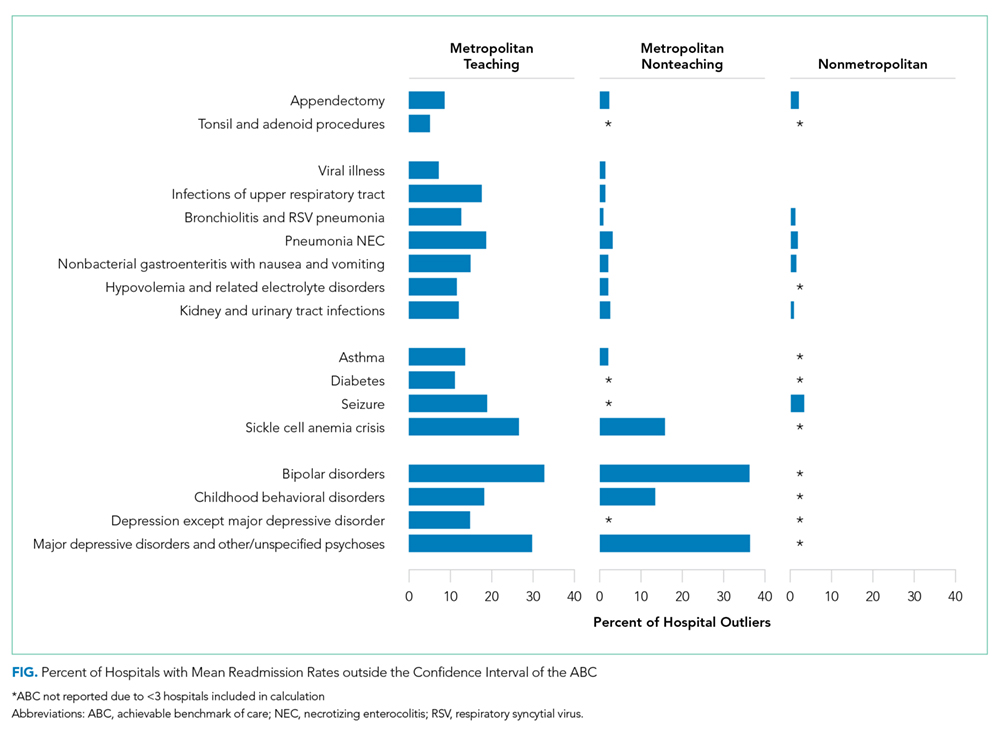
Metropolitan Teaching
The readmission ABC was calculated for all 17 diagnoses (Table 2). The ABC ranged from 0.4% in acute kidney and urinary tract infection to 7.0% in sickle cell anemia crisis. Bipolar disorder, major depressive disorders and other psychoses, and sickle cell disease (SCD) had the highest percent of outlier hospitals whose mean readmission rates confidence interval did not contain the ABC; tonsil and adenoid procedures and viral illness had the lowest.1
Metropolitan Nonteaching
The ABC was calculated for 13 of the 17 diagnoses because ABCs were not calculated when there were fewer than three best practicing hospitals. This was the case for tonsil and adenoid procedures, diabetes, seizures, and depression except for major depressive disorder (Table 2). Seven of the 13 diagnoses had an ABC of 0.0%: viral illness, infections of the upper respiratory tract, bronchiolitis, gastroenteritis, hypovolemia and electrolyte disorders, asthma, and childhood behavioral disorders. Like the findings at the metropolitan teaching hospitals, ABCs were lowest for surgical and acute conditions while bipolar disorder, major depressive disorders and other psychoses, and SCD had the highest percent of outlier hospitals with readmission rates beyond the 95% confidence interval of their hospital type’s ABC.
Nonmetropolitan
There was a sufficient number of best practicing hospitals to calculate the ABC for six of the 17 diagnoses (Table 2). For conditions where readmission ABCs could be calculated, they were low: 0.0% for appendectomy, bronchiolitis, gastroenteritis, and seizure; 0.3% for pneumonia; and 1.3% in kidney and urinary tract disorders. None of the conditions with the highest ABCs in other hospital settings (bipolar disease, sickle cell anemia crisis, and major depressive disorders and other psychoses) could be calculated in this setting. Seizure-related readmissions exhibited the most outlier hospitals yet were less than 5%.1
DISCUSSION
Among a nationally representative sample of different hospital types that deliver care to children, we report the mean readmission rates and ABCs for 30-day all-cause, same-hospital readmissions for the most commonly readmitted pediatric diagnoses based on hospital type. Previous studies have shown patient variables such as race, ethnicity, and insurance type influencing readmission rates.19,20 However, hospital type has also been associated with a higher risk of readmission due to the varying complexity of patients at different hospital types.21,22 Our analyses provide hospital-type specific national estimates of pediatric readmission ABCs for medical and surgical conditions, many less than 1%. While commonly encountered pediatric conditions like asthma and bronchiolitis had low mean readmission rates and ABCs across all hospital types, the mean rates and ABCs for SCD and mental health disorders were much higher with more hospitals performing far from the ABCs.
Diagnoses with a larger percentage of outlier hospitals may represent a national opportunity to improve care for children. Conditions such as SCD and mental illnesses have the highest percentage of hospitals whose readmission rates fall outside of the ABCs in both metropolitan teaching and metropolitan nonteaching hospitals. Hospital performance on SCD and mental health disorders may not reflect deficits in hospital quality or poor adherence to evidence-based best practices, but rather the complex interplay of factors on various levels from government policy and insurance plans, to patient and family resources, to access and availability of medical and mental health specific care. Most importantly, these diseases may represent a significant opportunity for quality improvementin hospitals across the United States.
Sickle cell disease is predominantly a disease among African-Americans, a demographic risk factor for decreased access to care and limited patient and family resources.23-26 In previous studies evaluating the disparity in readmission rates for Black children with asthma, socioeconomic variables explained 53% of the observed disparity and readmission rates were inversely related to the childhood opportunity index of the patient’s census tract and positively related with geographic social risk.27,28 Likewise, with SCD affecting a specific demographic and being a chronic disease, best practice policies need to account for the child’s medical needs and include the patient and family resources to ensure access to care and enhanced case management for chronic disease if we aim to improve performance among the outlier hospitals.
Similarly, barriers to care for children with mental illnesses in the United States need attention.29,30 While there is a paucity of data on the prevalence of mental health disorders in children, one national report estimates that one in 10 American adolescents have depression.29,31 The American Academy of Pediatrics has developed a policy statement on mental health competencies and a mental health tool-kit for primary care pediatricians; however, no such guidelines or policy statements exist for hospitalized patients with acute or chronic psychiatric conditions.32,33 Moreover, hospitals are increasingly facing “boarding” of children with acute psychiatric illness in inpatient units and emergency departments.34 The American Medical Association and the American College of Emergency Physicians have expressed concerns regarding the boarding of children with acute psychiatric illness because nonpsychiatric hospitals do not have adequate resources to evaluate, manage, and place these children who deserve appropriate facilities for further management. Coordinated case management and “bundled” discharge planning in other chronic illnesses have shown benefit in cost reduction and readmission.35-37 Evidence-based practices around pediatric readmissions in other diagnoses should be explored as possible interventions in these conditions.38
There are several limitations to this study. Our data is limited to one calendar year; therefore, admissions in January do not account for potential readmissions from December of the previous year, as patient identifiers do not link across years in the NRD. We also limited our evaluation to the conventional 30-day readmission window, but recent publications may indicate that readmission windows with different timelines could be a more accurate reflection of medically preventable readmissions versus a reflection of social determinants of health leading to readmissions.24 Newborn index admissions were not an allowable index admission; therefore, we may be underreporting readmissions in the neonatal age group. We also chose to include all-cause readmissions, a conventional method to evaluate readmission within an institution, but which may not reflect the quality of care delivered in the index admission. For example, an asthmatic discharged after an acute exacerbation readmitted for dehydration secondary to gastroenteritis may not reflect a lack of quality in asthma inpatient care. Readmissions were limited to the same hospital; therefore, this study cannot account for readmissions at other institutions, which may cause us to underestimate readmission rates. However, end-users of our findings most likely have access only to their own institution’s data. The inclusion of observation status admissions in the database varies from state to state; therefore, this percent of admissions in the database is unknown.
The use of the ABC methodology has some inherent limitations. One hospital with a significant volume diagnosis and low readmission rate within a hospital type may prohibit the reporting of an ABC if less than three hospitals composed the total of the ‘best performing’ hospitals. This was a significant limitation leading to the exclusion of many ABCs in nonmetropolitan institutions. The limitation of calculating and reporting an ABC then prohibits the calculation of outlier hospitals within a hospital type for a given diagnosis. However, when the ABCs are not available, we do provide the mean readmission rate for the diagnosis within the hospital type. While the hospital groupings by population and teaching status for ABCs provide meaningful comparisons for within each hospital setting, it should be noted that there may be vast differences among hospitals within each type (eg, tertiary children’s hospitals compared to teaching hospitals with a pediatric floor in the metropolitan teaching hospital category).39,40
As healthcare moves from a fee-for-service model to a population-health centered, value-based model, reduction in readmission rates will be more than a quality measure and will have potential financial implications.41 In the Medicare fee-for-service patients, the Hospital Readmission Reduction Program (HRRP) penalize hospitals with excess readmissions for acute myocardial infarction, heart failure, and pneumonia. The hospitals subject to penalties in the HRRP had greater reduction in readmission rates in the targeted, and even nontargeted conditions, compared with hospitals not subject to penalties.42 Similarly, we believe that our data on low readmission rates and ABCs for conditions such as asthma, bronchiolitis, and appendicitis could represent decades of quality improvement work for the most common pediatric conditions among hospitalized children. Sickle cell disease and mental health problems remain as outliers and merit further attention. To move to a true population-health model, hospitals will need to explore outlier conditions including evaluating patient-level readmission patterns across institutions. This moves readmission from a hospital quality measure to a patient-centric quality measure, and perhaps will provide value to the patient and the healthcare system alike.
CONCLUSIONS
The readmission ABCs for the most commonly readmitted pediatric diagnoses are low, regardless of the hospital setting. The highest pediatric readmission rates in SCD, bipolar disorders, and major depressive disorder were lower than the most common adult readmission diagnoses. However, mental health conditions and SCD remain as outliers for pediatric readmissions, burden hospital systems, and perhaps warrant national-level attention. The ABCs stratified by hospital type in this study facilitate comparisons and identify opportunities for population-level interventions to meaningfully improve patient care.
Disclosures
The authors have nothing to disclose.
1. Medicare. 30-day death and readmission measures data. https://www.medicare.gov/hospitalcompare/Data/30-day-measures.html. Accessed October 24, 2017.
2. National Quality Forum. Performance Measures; 2016 https://www.quality fourm.org/Measuring_Performance/Endorsed_Performance_Measures_Maintenance.aspx. Accessed October 24, 2017.
3. Auger KA, Simon TD, Cooperberg D, et al. Summary of STARNet: seamless transitions and (re)admissions network. Pediatrics. 2015;135(1):164-175. https://doi.org/10.1542/peds.2014-1887.
4. Toomey SL, Peltz A, Loren S, et al. Potentially preventable 30-day hospital readmissions at a children’s hospital. Pediatrics. 2016;138(2):e20154182-e20154182. https://doi.org/10.1542/peds.2015-4182.
5. Halfon P, Eggli Y, Prêtre-Rohrbach I, et al. Validation of the potentially avoidable hospital readmission rate as a routine indicator of the quality of hospital care. Med Care. 2006;44(11):972-981. https://doi.org/10.1097/01.mlr.0000228002.43688.c2.
6. Gay JC, Agrawal R, Auger KA, et al. Rates and impact of potentially preventable readmissions at children’s hospitals. J Pediatr. 2015;166(3):613-619. https://doi.org/10.1016/j.jpeds.2014.10.052.
7. Berry JG, Gay JC, Joynt Maddox KJ, et al. Age trends in 30 day hospital readmissions: US national retrospective analysis. BMJ. 2018;360:k497. https://doi.org/10.1136/bmj.k497.
8. Bardach NS, Vittinghoff E, Asteria-Penaloza R, et al. Measuring hospital quality using pediatric readmission and revisit rates. Pediatrics. 2013;132(3):429-436. https://doi.org/10.1542/peds.2012-3527d.
9. Berry JG, Toomey SL, Zaslavsky AM, et al. Pediatric readmission prevalence and variability across hospitals. JAMA. 2013;309(4):372-380. https://doi.org/10.1001/jama.2012.188351.
10. Gohil SK, Datta R, Cao C, et al. Impact of hospital population case-mix, including poverty, on hospital all-cause and infection-related 30-day readmission rates. Clin Infect Dis. 2015;61(8):1235-1243. https://doi.org/10.1093/cid/civ539.
11. Parikh K, Hall M, Mittal V, et al. Establishing benchmarks for the hospitalized care of children with asthma, bronchiolitis, and pneumonia. Pediatrics. 2014;134(3):555-562. https://doi.org/10.1542/peds.2014-1052.
12. Reyes M, Paulus E, Hronek C, et al. Choosing wisely campaign: report card and achievable benchmarks of care for children’s hospitals. Hosp Pediatr. 2017;7(11):633-641. https://doi.org/10.1542/hpeds.2017-0029.
13. Kiefe CI, Weissman NW, Allison JJ, et al. Identifying achievable benchmarks of care: concepts and methodology. Int J Qual Health Care. 1998;10(5):443-447. https://doi.org/10.1093/intqhc/10.5.443.
14. Agency for Healthcare Research and Quality. Nationwide Readmissions Database Availability of Data Elements. . https://www.hcup-us.ahrq.gov/partner/MOARef/HCUPdata_elements.pdf. Accessed 2018 Jun 6
15. Healthcare Cost and Utilization Project. HCUP NRD description of data elements. Agency Healthc Res Qual. https://www.hcup-us.ahrq.gov/db/vars/samedayevent/nrdnote.jsp. Accessed 2018 Jun 6; 2015.
16. Feudtner C, Feinstein JA, Zhong W, Hall M, Dai D. Pediatric complex chronic conditions classification system version 2: updated for ICD-10 and complex medical technology dependence and transplantation. BMC Pediatr. 2014;14:199. https://doi.org/10.1186/1471-2431-14-199.
17. Agency for Healthcare Research and Quality. HCUP chronic condition indicator. Healthc Cost Util Proj. https://www.hcup-us.ahrq.gov/toolssoftware/chronic/chronic.jsp. Accessed 2016 Apr 26; 2009.
18. Weissman NW, Allison JJ, Kiefe CI, et al. Achievable benchmarks of care: the ABCs of benchmarking. J Eval Clin Pract. 1999;5(3):269-281. https://doi.org/10.1046/j.1365-2753.1999.00203.x.
19. Joynt KE, Orav EJ, Jha AK. Thirty-day readmission rates for medicare beneficiaries by race and site of care. JAMA. 2011;305(7):675-681. https://doi.org/10.1001/jama.2011.123.
20. Kenyon CC, Melvin PR, Chiang VW, et al. Rehospitalization for childhood asthma: timing, variation, and opportunities for intervention. J Pediatr. 2014;164(2):300-305. https://doi.org/10.1016/j.jpeds.2013.10.003.
21. Sobota A, Graham DA, Neufeld EJ, Heeney MM. Thirty-day readmission rates following hospitalization for pediatric sickle cell crisis at freestanding children’s hospitals: risk factors and hospital variation. Pediatr Blood Cancer. 2012;58(1):61-65. https://doi.org/10.1002/pbc.23221.
22. Berry JG, Hall DE, Kuo DZ, et al. Hospital utilization and characteristics of patients experiencing recurrent readmissions within children’s hospitals. JAMA. 2011;305(7):682-690. https://doi.org/10.1001/jama.2011.122.
23. Ginde AA, Espinola JA, Camargo CA. Improved overall trends but persistent racial disparities in emergency department visits for acute asthma, 1993-2005. J Allergy Clin Immunol. 2008;122(2):313-318. https://doi.org/10.1016/j.jaci.2008.04.024.
24. Parikh K, Berry J, Hall M, et al. Racial and ethnic differences in pediatric readmissions for common chronic conditions. J Pediatr. 2017;186. https://doi.org/10.1016/j.jpeds.2017.03.046.
25. Chen BK, Hibbert J, Cheng X, Bennett K. Travel distance and sociodemographic correlates of potentially avoidable emergency department visits in California, 2006-2010: an observational study. Int J Equity Health. 2015;14(1):30. https://doi.org/10.1186/s12939-015-0158-y.
26. Ray KN, Chari AV, Engberg J, et al. Disparities in time spent seeking medical care in the United States. JAMA Intern Med. 2015;175(12):175(12):1983-1986. https://doi.org/10.1001/jamainternmed.2015.4468.
27. Beck AF, Huang B, Wheeler K, et al. The child opportunity index and disparities in pediatric asthma hospitalizations across one Ohio metropolitan area. J Pediatr. 2011-2013;190:200-206. https://doi.org/10.1016/j.jpeds.2017.08.007.
28. Beck AF, Simmons JM, Huang B, Kahn RS. Geomedicine: area-based socioeconomic measures for assessing the risk of hospital reutilization among children admitted for asthma. Am J Public Health. 2012;102(12):2308-2314. https://doi.org/10.2105/AJPH.2012.300806.
29. Avenevoli S, Swendsen J, He JP, Burstein M, Merikangas KR. Major depression in the national comorbidity survey-adolescent supplement: prevalence, correlates, and treatment. J Am Acad Child Adolesc Psychiatry. 2015;54(1):37-44.e2. https://doi.org/10.1016/j.jaac.2014.10.010.
30. Feng JY, Toomey SL, Zaslavsky AM, Nakamura MM, Schuster MA. Readmission after pediatric mental health admissions. Pediatrics. 2017;140(6):e20171571. https://doi.org/10.1542/peds.2017-1571.
31. Merikangas KR, He JP, Burstein M, et al. Lifetime prevalence of mental disorders in U.S. adolescents: results from the National comorbidity Survey Replication-Adolescent Supplement (NCS-A). J Am Acad Child Adolesc Psychiatry. 2010;49(10):980-989. https://doi.org/10.1016/j.jaac.2010.05.017.
32. Cheung AH, Zuckerbrot RA, Jensen PS, et al. Guidelines for adolescent depression in primary care (GLAD-PC): Part II. Treatment and ongoing management. Pediatrics. 2018;141(3):e20174082. https://doi.org/10.1542/peds.2017-4082.
33. Zuckerbrot RA, Cheung A, Jensen PS, et al. Guidelines for adolescent depression in primary care (GLAD-PC): Part I. Practice preparation, identification, assessment, and initial management. Pediatrics. 2018;141(3):e20174081. https://doi.org/10.1542/peds.2017-4081.
34. Dolan MA, Fein JA, Committee on Pediatric Emergency Medicine. Pediatric and adolescent mental health emergencies in the emergency Medical Services system. Pediatrics. 2011;127(5):e1356-e1366. https://doi.org/10.1542/peds.2011-0522.
35. Collaborative Healthcare Strategies. Hospital Guide to Reducing Medicaid Readmissions. Rockville, MD: 2014. https://www.ahrq.gov/sites/default/files/publications/files/medreadmissions.pdf. Accessed 2017 Oct 11.
36. Hilbert K, Payne R, Wooton S. Children’s Hospitals’ Solutions for Patient Safety. Readmissions Bundle Tools. Cincinnati, OH; 2014.
37. Nuckols TK, Keeler E, Morton S, et al. Economic evaluation of quality improvement interventions designed to prevent hospital readmission: a systematic review and meta-analysis. JAMA Intern Med. 2017;177(7):975-985. https://doi.org/10.1001/jamainternmed.2017.1136.
38. Berry JG, Blaine K, Rogers J, et al. A framework of pediatric hospital discharge care informed by legislation, research, and practice. JAMA Pediatr. 2014;168(10):955-962. https://doi.org/10.1001/jamapediatrics.2014.891.
39. Chen HF, Carlson E, Popoola T, Suzuki S. The impact of rurality on 30-day preventable readmission, illness severity, and risk of mortality for heart failure Medicare home health beneficiaries. J Rural Health. 2016;32(2):176-187. https://doi.org/10.1111/jrh.12142.
40. Khan A, Nakamura MM, Zaslavsky AM, et al. Same-hospital readmission rates as a measure of pediatric quality of care. JAMA Pediatr. 2015;169(10):905-912. https://doi.org/10.1001/jamapediatrics.2015.1129.
41. Share DA, Campbell DA, Birkmeyer N, et al. How a regional collaborative of hospitals and physicians in Michigan cut costs and improved the quality of care. Health Aff. 2011;30(4):636-645. https://doi.org/10.1377/hlthaff.2010.0526.
42. Desai NR, Ross JS, Kwon JY, et al. Association between hospital penalty status under the hospital readmission reduction program and readmission rates for target and nontarget conditions. JAMA. 2016;316(24):2647-2656. https://doi.org/10.1001/jama.2016.18533.
Hospital readmission rates are a common metric for defining, evaluating, and benchmarking quality of care. The Centers for Medicare and Medicaid Services (CMS) publicly report hospital readmission rates for common adult conditions and reduces payments to hospitals with excessive readmissions.1 Recently, the focus on pediatric readmission rates has increased and the National Quality Forum (NQF) has endorsed at least two pediatric readmission-specific quality indicators which could be used by public and private payers in pay-for-performance programs aimed at institutions caring for children.2 While preventability of readmissions and their value as a marker of quality remains debated, their acceptance by the NQF and CMS has led public and private payers to propose readmission-related penalties for hospitals caring for children. 3-5
All-cause 30-day same-hospital readmission rates for pediatric conditions are half of the adult readmission rates, around 6% in most studies, compared to 12% in adults.6,7 The lower rates of pediatric readmissions makes it difficult to only use mean readmission rates to stratify hospitals into high- or low-performers and set target goals for improvement.8 While adult readmissions have been studied in depth, there are no consistent measures used to benchmark pediatric readmissions across hospital types.
Given the emphasis placed on readmissions, it is essential to understand patterns in pediatric readmission rates to determine optimal and achievable targets for improvement. Achievable Benchmarks of Care (ABCs) are one approach to understanding readmission rates and have an advantage over using mean or medians in performance improvement as they can stratify performance for conditions with low readmission rates and low volumes.9 When creating benchmarks, it is important that hospitals performance is evaluated among peer hospitals with similar patient populations, not just a cumulative average from all hospital types which may punish hospitals with a more complex patient case mix.10 The goal of this study was to calculate the readmission rates and the ABCs for common pediatric diagnoses by hospital type to identify priority conditions for quality improvement efforts using a previously published methodology.11-13
METHODS
Data Source
We conducted a retrospective analysis of patients less than 18 years of age in the Healthcare Utilization Project 2014 Nationwide Readmissions Database (NRD). The NRD includes public hospitals; academic medical centers; and specialty hospitals in obstetrics and gynecology, otolaryngology, orthopedics, and cancer; and pediatric, public, and academic medical hospitals. Excluded are long-term care facilities such as rehabilitation, long-term acute care, psychiatric, alcoholism, and chemical dependency hospitals. The readmissions data contains information from hospitals grouped by region, population census, and teaching status.14 Three hospital type classifications used in this study were metropolitan teaching hospitals, metropolitan nonteaching hospitals, and nonmetropolitan hospitals. These three hospital type classifications follow the reporting format in the NRD.
Study Population
Patients less than 18 years old were included if they were discharged from January 1, 2014 through November 30, 2014 and had a readmission to the index hospital within 30 days. We limited inclusion to discharges through November 30 so we could identify patients with a 30-day readmission as patient identifiers do not link across years in the NRD.
Exposure
We included 30-day, all-cause, same-hospital readmissions to the index acute care hospital, excluding labor and delivery, normal newborn care, chemotherapy, transfers, and mortalities. Intrahospital discharge and admissions within the same hospital system were not defined as a readmission, but rather as a “same-day event.”15 For example, institutions with inpatient mental health facilities, medical unit discharges and admission to the mental health unit were not identified as a readmission in this dataset.
Outcome
For each hospital type, we measured same-hospital, all-cause, 30-day readmission rates and achievable benchmark of care for the 17 most commonly readmitted pediatric discharge diagnoses. To identify the target readmission diagnoses and all-cause, 30-day readmissions based on their index hospitalizations, All-Patient Refined Diagnosis-Related Groups (APR-DRG), version 25 (3M Health Information Systems, Salt Lake City, Utah) were ordered by frequency for each hospital type. The 20 most common APR-DRGs were the same across all hospital types. The authors then evaluated these 20 APR-DRGs for clinical consistency of included diagnoses identified by the International Classification of Diseases, Ninth Revision, Clinical Modification (ICD-9-CM) codes within each APR-DRG. Three diagnosis-related groups were excluded from the analysis (major hematologic/immunologic disease except for sickle cell, other anemia and disorders of blood and blood forming organs, and other digestive system diagnoses) due to the heterogeneity of the diagnoses identified by the ICD-9-CM codes within each APR-DRG. We refer to each APR-DRG as a “diagnosis” throughout the article.
Analysis
The demographic characteristics of the patients seen at the three hospital types were summarized using frequencies and percentages. Reports were generated for patient age, gender, payer source, patient residence, median household income, patient complexity, and discharge disposition. Patient complexity was defined using complex chronic condition (CCC) and the number of chronic conditions (CCI).16,17 As previously defined in the literature, a complex chronic condition is “any medical condition that can be reasonably expected to last at least 12 months (unless death intervenes) and to involve either several different organ systems or one organ system severely enough to require specialty pediatric care and probably some period of hospitalization in a tertiary care center.”16 Whereas, the Agency for Healthcare Research and Quality’s Chronic Condition Indicator (CCI) defines single, non-CCCs (eg, allergic rhinitis).17
For each diagnosis, we calculated the mean readmission rate for hospitals in each hospital type category. We then calculated an ABC for each diagnosis in each hospital type using a four-step process.13,18 First, to control for hospitals with small sample sizes, we adjusted all readmission rates using an adjusted performance fraction ([numerator+1]/[denominator +2]), where the numerator is the number of all-cause 30-day readmissions and the denominator is the number of discharges for the selected diagnosis. Then the hospitals were ordered from lowest (best performing) to highest (worst performing) using the adjusted readmission rate. Third, the number of discharges from the best performing hospital to the worst performing hospital was summed until at least 10% of the total discharges had been accounted for. Finally, we computed the ABC as the average of these best performing hospitals. We only report ABCs for which at least three hospitals were included as best performers in the calculation.13
To evaluate hospital performance on ABCs for each diagnosis, we identified the percent of hospitals in each setting that were outliers. We defined an outlier as any hospital whose 95% confidence interval for their readmission rate for a given diagnosis did not contain the ABC for their hospital type. All the statistical analyses were performed using SAS version 9.3 (SAS Institute, Inc, Cary, North Carolina).
This project was reviewed by the Cincinnati Children’s Hospital Medical Center Institutional Review Board and determined to be nonhuman subjects research.
RESULTS
Hospital-Type Demographics
The 690,949 discharges from 1,664 hospitals were categorized into 525 metropolitan teaching (550,039 discharges, 79.6% of discharges), 552 metropolitan nonteaching (97,207 discharges, 14% of discharges), and 587 nonmetropolitan hospitals (43,703 discharges, 6.3% of discharges; Table 1). There were significant differences in the patient composition among the three hospital settings. Nonmetropolitan hospitals had a larger percentage of younger patients (aged 0-4 years, P < .001), prominence of first and second quartile median household income, and fewer medically complex patients (48.3% No CCC/No CCI versus 25.5% metropolitan teaching and 33.7% nonteaching, P < .001). Disposition home was over 96% in all three hospital types; however, the metropolitan teaching had a greater percentage of patients discharged to home health versus metropolitan nonteaching and nonmetropolitan hospitals (2.3% versus 0.5%; P < .001).
Readmission Rates
The 17 most common diagnoses based on the number of all-cause 30-day same-hospital readmissions, were categorized into two surgical, seven acute/infectious, four chronic, and four mental health diagnoses (Table 2). Readmission rates varied based on diagnosis and hospital type (Table 2). Overall, mean readmission rates were low, especially in acute respiratory tract related diseases. For chronic diseases, asthma readmissions were consistently low in all three hospital types, whereas sickle cell disease had the highest readmission rate in all three hospital types.
Achievable Benchmarks of Care by Hospital Type
The diagnoses for which ABC could be calculated across all three hospital types included appendectomy and four acute conditions (bronchiolitis, pneumonia, nonbacterial gastroenteritis, and kidney/urinary tract infections). For these conditions, metropolitan teaching hospitals had a more significant percentage of outlier hospitals compared to metropolitan nonteaching and nonmetropolitan hospitals. The percent of outlier hospitals varied by diagnosis and hospital type (Figure).
Metropolitan Teaching
The readmission ABC was calculated for all 17 diagnoses (Table 2). The ABC ranged from 0.4% in acute kidney and urinary tract infection to 7.0% in sickle cell anemia crisis. Bipolar disorder, major depressive disorders and other psychoses, and sickle cell disease (SCD) had the highest percent of outlier hospitals whose mean readmission rates confidence interval did not contain the ABC; tonsil and adenoid procedures and viral illness had the lowest.1
Metropolitan Nonteaching
The ABC was calculated for 13 of the 17 diagnoses because ABCs were not calculated when there were fewer than three best practicing hospitals. This was the case for tonsil and adenoid procedures, diabetes, seizures, and depression except for major depressive disorder (Table 2). Seven of the 13 diagnoses had an ABC of 0.0%: viral illness, infections of the upper respiratory tract, bronchiolitis, gastroenteritis, hypovolemia and electrolyte disorders, asthma, and childhood behavioral disorders. Like the findings at the metropolitan teaching hospitals, ABCs were lowest for surgical and acute conditions while bipolar disorder, major depressive disorders and other psychoses, and SCD had the highest percent of outlier hospitals with readmission rates beyond the 95% confidence interval of their hospital type’s ABC.
Nonmetropolitan
There was a sufficient number of best practicing hospitals to calculate the ABC for six of the 17 diagnoses (Table 2). For conditions where readmission ABCs could be calculated, they were low: 0.0% for appendectomy, bronchiolitis, gastroenteritis, and seizure; 0.3% for pneumonia; and 1.3% in kidney and urinary tract disorders. None of the conditions with the highest ABCs in other hospital settings (bipolar disease, sickle cell anemia crisis, and major depressive disorders and other psychoses) could be calculated in this setting. Seizure-related readmissions exhibited the most outlier hospitals yet were less than 5%.1
DISCUSSION
Among a nationally representative sample of different hospital types that deliver care to children, we report the mean readmission rates and ABCs for 30-day all-cause, same-hospital readmissions for the most commonly readmitted pediatric diagnoses based on hospital type. Previous studies have shown patient variables such as race, ethnicity, and insurance type influencing readmission rates.19,20 However, hospital type has also been associated with a higher risk of readmission due to the varying complexity of patients at different hospital types.21,22 Our analyses provide hospital-type specific national estimates of pediatric readmission ABCs for medical and surgical conditions, many less than 1%. While commonly encountered pediatric conditions like asthma and bronchiolitis had low mean readmission rates and ABCs across all hospital types, the mean rates and ABCs for SCD and mental health disorders were much higher with more hospitals performing far from the ABCs.
Diagnoses with a larger percentage of outlier hospitals may represent a national opportunity to improve care for children. Conditions such as SCD and mental illnesses have the highest percentage of hospitals whose readmission rates fall outside of the ABCs in both metropolitan teaching and metropolitan nonteaching hospitals. Hospital performance on SCD and mental health disorders may not reflect deficits in hospital quality or poor adherence to evidence-based best practices, but rather the complex interplay of factors on various levels from government policy and insurance plans, to patient and family resources, to access and availability of medical and mental health specific care. Most importantly, these diseases may represent a significant opportunity for quality improvementin hospitals across the United States.
Sickle cell disease is predominantly a disease among African-Americans, a demographic risk factor for decreased access to care and limited patient and family resources.23-26 In previous studies evaluating the disparity in readmission rates for Black children with asthma, socioeconomic variables explained 53% of the observed disparity and readmission rates were inversely related to the childhood opportunity index of the patient’s census tract and positively related with geographic social risk.27,28 Likewise, with SCD affecting a specific demographic and being a chronic disease, best practice policies need to account for the child’s medical needs and include the patient and family resources to ensure access to care and enhanced case management for chronic disease if we aim to improve performance among the outlier hospitals.
Similarly, barriers to care for children with mental illnesses in the United States need attention.29,30 While there is a paucity of data on the prevalence of mental health disorders in children, one national report estimates that one in 10 American adolescents have depression.29,31 The American Academy of Pediatrics has developed a policy statement on mental health competencies and a mental health tool-kit for primary care pediatricians; however, no such guidelines or policy statements exist for hospitalized patients with acute or chronic psychiatric conditions.32,33 Moreover, hospitals are increasingly facing “boarding” of children with acute psychiatric illness in inpatient units and emergency departments.34 The American Medical Association and the American College of Emergency Physicians have expressed concerns regarding the boarding of children with acute psychiatric illness because nonpsychiatric hospitals do not have adequate resources to evaluate, manage, and place these children who deserve appropriate facilities for further management. Coordinated case management and “bundled” discharge planning in other chronic illnesses have shown benefit in cost reduction and readmission.35-37 Evidence-based practices around pediatric readmissions in other diagnoses should be explored as possible interventions in these conditions.38
There are several limitations to this study. Our data is limited to one calendar year; therefore, admissions in January do not account for potential readmissions from December of the previous year, as patient identifiers do not link across years in the NRD. We also limited our evaluation to the conventional 30-day readmission window, but recent publications may indicate that readmission windows with different timelines could be a more accurate reflection of medically preventable readmissions versus a reflection of social determinants of health leading to readmissions.24 Newborn index admissions were not an allowable index admission; therefore, we may be underreporting readmissions in the neonatal age group. We also chose to include all-cause readmissions, a conventional method to evaluate readmission within an institution, but which may not reflect the quality of care delivered in the index admission. For example, an asthmatic discharged after an acute exacerbation readmitted for dehydration secondary to gastroenteritis may not reflect a lack of quality in asthma inpatient care. Readmissions were limited to the same hospital; therefore, this study cannot account for readmissions at other institutions, which may cause us to underestimate readmission rates. However, end-users of our findings most likely have access only to their own institution’s data. The inclusion of observation status admissions in the database varies from state to state; therefore, this percent of admissions in the database is unknown.
The use of the ABC methodology has some inherent limitations. One hospital with a significant volume diagnosis and low readmission rate within a hospital type may prohibit the reporting of an ABC if less than three hospitals composed the total of the ‘best performing’ hospitals. This was a significant limitation leading to the exclusion of many ABCs in nonmetropolitan institutions. The limitation of calculating and reporting an ABC then prohibits the calculation of outlier hospitals within a hospital type for a given diagnosis. However, when the ABCs are not available, we do provide the mean readmission rate for the diagnosis within the hospital type. While the hospital groupings by population and teaching status for ABCs provide meaningful comparisons for within each hospital setting, it should be noted that there may be vast differences among hospitals within each type (eg, tertiary children’s hospitals compared to teaching hospitals with a pediatric floor in the metropolitan teaching hospital category).39,40
As healthcare moves from a fee-for-service model to a population-health centered, value-based model, reduction in readmission rates will be more than a quality measure and will have potential financial implications.41 In the Medicare fee-for-service patients, the Hospital Readmission Reduction Program (HRRP) penalize hospitals with excess readmissions for acute myocardial infarction, heart failure, and pneumonia. The hospitals subject to penalties in the HRRP had greater reduction in readmission rates in the targeted, and even nontargeted conditions, compared with hospitals not subject to penalties.42 Similarly, we believe that our data on low readmission rates and ABCs for conditions such as asthma, bronchiolitis, and appendicitis could represent decades of quality improvement work for the most common pediatric conditions among hospitalized children. Sickle cell disease and mental health problems remain as outliers and merit further attention. To move to a true population-health model, hospitals will need to explore outlier conditions including evaluating patient-level readmission patterns across institutions. This moves readmission from a hospital quality measure to a patient-centric quality measure, and perhaps will provide value to the patient and the healthcare system alike.
CONCLUSIONS
The readmission ABCs for the most commonly readmitted pediatric diagnoses are low, regardless of the hospital setting. The highest pediatric readmission rates in SCD, bipolar disorders, and major depressive disorder were lower than the most common adult readmission diagnoses. However, mental health conditions and SCD remain as outliers for pediatric readmissions, burden hospital systems, and perhaps warrant national-level attention. The ABCs stratified by hospital type in this study facilitate comparisons and identify opportunities for population-level interventions to meaningfully improve patient care.
Disclosures
The authors have nothing to disclose.
1. Medicare. 30-day death and readmission measures data. https://www.medicare.gov/hospitalcompare/Data/30-day-measures.html. Accessed October 24, 2017.
2. National Quality Forum. Performance Measures; 2016 https://www.quality fourm.org/Measuring_Performance/Endorsed_Performance_Measures_Maintenance.aspx. Accessed October 24, 2017.
3. Auger KA, Simon TD, Cooperberg D, et al. Summary of STARNet: seamless transitions and (re)admissions network. Pediatrics. 2015;135(1):164-175. https://doi.org/10.1542/peds.2014-1887.
4. Toomey SL, Peltz A, Loren S, et al. Potentially preventable 30-day hospital readmissions at a children’s hospital. Pediatrics. 2016;138(2):e20154182-e20154182. https://doi.org/10.1542/peds.2015-4182.
5. Halfon P, Eggli Y, Prêtre-Rohrbach I, et al. Validation of the potentially avoidable hospital readmission rate as a routine indicator of the quality of hospital care. Med Care. 2006;44(11):972-981. https://doi.org/10.1097/01.mlr.0000228002.43688.c2.
6. Gay JC, Agrawal R, Auger KA, et al. Rates and impact of potentially preventable readmissions at children’s hospitals. J Pediatr. 2015;166(3):613-619. https://doi.org/10.1016/j.jpeds.2014.10.052.
7. Berry JG, Gay JC, Joynt Maddox KJ, et al. Age trends in 30 day hospital readmissions: US national retrospective analysis. BMJ. 2018;360:k497. https://doi.org/10.1136/bmj.k497.
8. Bardach NS, Vittinghoff E, Asteria-Penaloza R, et al. Measuring hospital quality using pediatric readmission and revisit rates. Pediatrics. 2013;132(3):429-436. https://doi.org/10.1542/peds.2012-3527d.
9. Berry JG, Toomey SL, Zaslavsky AM, et al. Pediatric readmission prevalence and variability across hospitals. JAMA. 2013;309(4):372-380. https://doi.org/10.1001/jama.2012.188351.
10. Gohil SK, Datta R, Cao C, et al. Impact of hospital population case-mix, including poverty, on hospital all-cause and infection-related 30-day readmission rates. Clin Infect Dis. 2015;61(8):1235-1243. https://doi.org/10.1093/cid/civ539.
11. Parikh K, Hall M, Mittal V, et al. Establishing benchmarks for the hospitalized care of children with asthma, bronchiolitis, and pneumonia. Pediatrics. 2014;134(3):555-562. https://doi.org/10.1542/peds.2014-1052.
12. Reyes M, Paulus E, Hronek C, et al. Choosing wisely campaign: report card and achievable benchmarks of care for children’s hospitals. Hosp Pediatr. 2017;7(11):633-641. https://doi.org/10.1542/hpeds.2017-0029.
13. Kiefe CI, Weissman NW, Allison JJ, et al. Identifying achievable benchmarks of care: concepts and methodology. Int J Qual Health Care. 1998;10(5):443-447. https://doi.org/10.1093/intqhc/10.5.443.
14. Agency for Healthcare Research and Quality. Nationwide Readmissions Database Availability of Data Elements. . https://www.hcup-us.ahrq.gov/partner/MOARef/HCUPdata_elements.pdf. Accessed 2018 Jun 6
15. Healthcare Cost and Utilization Project. HCUP NRD description of data elements. Agency Healthc Res Qual. https://www.hcup-us.ahrq.gov/db/vars/samedayevent/nrdnote.jsp. Accessed 2018 Jun 6; 2015.
16. Feudtner C, Feinstein JA, Zhong W, Hall M, Dai D. Pediatric complex chronic conditions classification system version 2: updated for ICD-10 and complex medical technology dependence and transplantation. BMC Pediatr. 2014;14:199. https://doi.org/10.1186/1471-2431-14-199.
17. Agency for Healthcare Research and Quality. HCUP chronic condition indicator. Healthc Cost Util Proj. https://www.hcup-us.ahrq.gov/toolssoftware/chronic/chronic.jsp. Accessed 2016 Apr 26; 2009.
18. Weissman NW, Allison JJ, Kiefe CI, et al. Achievable benchmarks of care: the ABCs of benchmarking. J Eval Clin Pract. 1999;5(3):269-281. https://doi.org/10.1046/j.1365-2753.1999.00203.x.
19. Joynt KE, Orav EJ, Jha AK. Thirty-day readmission rates for medicare beneficiaries by race and site of care. JAMA. 2011;305(7):675-681. https://doi.org/10.1001/jama.2011.123.
20. Kenyon CC, Melvin PR, Chiang VW, et al. Rehospitalization for childhood asthma: timing, variation, and opportunities for intervention. J Pediatr. 2014;164(2):300-305. https://doi.org/10.1016/j.jpeds.2013.10.003.
21. Sobota A, Graham DA, Neufeld EJ, Heeney MM. Thirty-day readmission rates following hospitalization for pediatric sickle cell crisis at freestanding children’s hospitals: risk factors and hospital variation. Pediatr Blood Cancer. 2012;58(1):61-65. https://doi.org/10.1002/pbc.23221.
22. Berry JG, Hall DE, Kuo DZ, et al. Hospital utilization and characteristics of patients experiencing recurrent readmissions within children’s hospitals. JAMA. 2011;305(7):682-690. https://doi.org/10.1001/jama.2011.122.
23. Ginde AA, Espinola JA, Camargo CA. Improved overall trends but persistent racial disparities in emergency department visits for acute asthma, 1993-2005. J Allergy Clin Immunol. 2008;122(2):313-318. https://doi.org/10.1016/j.jaci.2008.04.024.
24. Parikh K, Berry J, Hall M, et al. Racial and ethnic differences in pediatric readmissions for common chronic conditions. J Pediatr. 2017;186. https://doi.org/10.1016/j.jpeds.2017.03.046.
25. Chen BK, Hibbert J, Cheng X, Bennett K. Travel distance and sociodemographic correlates of potentially avoidable emergency department visits in California, 2006-2010: an observational study. Int J Equity Health. 2015;14(1):30. https://doi.org/10.1186/s12939-015-0158-y.
26. Ray KN, Chari AV, Engberg J, et al. Disparities in time spent seeking medical care in the United States. JAMA Intern Med. 2015;175(12):175(12):1983-1986. https://doi.org/10.1001/jamainternmed.2015.4468.
27. Beck AF, Huang B, Wheeler K, et al. The child opportunity index and disparities in pediatric asthma hospitalizations across one Ohio metropolitan area. J Pediatr. 2011-2013;190:200-206. https://doi.org/10.1016/j.jpeds.2017.08.007.
28. Beck AF, Simmons JM, Huang B, Kahn RS. Geomedicine: area-based socioeconomic measures for assessing the risk of hospital reutilization among children admitted for asthma. Am J Public Health. 2012;102(12):2308-2314. https://doi.org/10.2105/AJPH.2012.300806.
29. Avenevoli S, Swendsen J, He JP, Burstein M, Merikangas KR. Major depression in the national comorbidity survey-adolescent supplement: prevalence, correlates, and treatment. J Am Acad Child Adolesc Psychiatry. 2015;54(1):37-44.e2. https://doi.org/10.1016/j.jaac.2014.10.010.
30. Feng JY, Toomey SL, Zaslavsky AM, Nakamura MM, Schuster MA. Readmission after pediatric mental health admissions. Pediatrics. 2017;140(6):e20171571. https://doi.org/10.1542/peds.2017-1571.
31. Merikangas KR, He JP, Burstein M, et al. Lifetime prevalence of mental disorders in U.S. adolescents: results from the National comorbidity Survey Replication-Adolescent Supplement (NCS-A). J Am Acad Child Adolesc Psychiatry. 2010;49(10):980-989. https://doi.org/10.1016/j.jaac.2010.05.017.
32. Cheung AH, Zuckerbrot RA, Jensen PS, et al. Guidelines for adolescent depression in primary care (GLAD-PC): Part II. Treatment and ongoing management. Pediatrics. 2018;141(3):e20174082. https://doi.org/10.1542/peds.2017-4082.
33. Zuckerbrot RA, Cheung A, Jensen PS, et al. Guidelines for adolescent depression in primary care (GLAD-PC): Part I. Practice preparation, identification, assessment, and initial management. Pediatrics. 2018;141(3):e20174081. https://doi.org/10.1542/peds.2017-4081.
34. Dolan MA, Fein JA, Committee on Pediatric Emergency Medicine. Pediatric and adolescent mental health emergencies in the emergency Medical Services system. Pediatrics. 2011;127(5):e1356-e1366. https://doi.org/10.1542/peds.2011-0522.
35. Collaborative Healthcare Strategies. Hospital Guide to Reducing Medicaid Readmissions. Rockville, MD: 2014. https://www.ahrq.gov/sites/default/files/publications/files/medreadmissions.pdf. Accessed 2017 Oct 11.
36. Hilbert K, Payne R, Wooton S. Children’s Hospitals’ Solutions for Patient Safety. Readmissions Bundle Tools. Cincinnati, OH; 2014.
37. Nuckols TK, Keeler E, Morton S, et al. Economic evaluation of quality improvement interventions designed to prevent hospital readmission: a systematic review and meta-analysis. JAMA Intern Med. 2017;177(7):975-985. https://doi.org/10.1001/jamainternmed.2017.1136.
38. Berry JG, Blaine K, Rogers J, et al. A framework of pediatric hospital discharge care informed by legislation, research, and practice. JAMA Pediatr. 2014;168(10):955-962. https://doi.org/10.1001/jamapediatrics.2014.891.
39. Chen HF, Carlson E, Popoola T, Suzuki S. The impact of rurality on 30-day preventable readmission, illness severity, and risk of mortality for heart failure Medicare home health beneficiaries. J Rural Health. 2016;32(2):176-187. https://doi.org/10.1111/jrh.12142.
40. Khan A, Nakamura MM, Zaslavsky AM, et al. Same-hospital readmission rates as a measure of pediatric quality of care. JAMA Pediatr. 2015;169(10):905-912. https://doi.org/10.1001/jamapediatrics.2015.1129.
41. Share DA, Campbell DA, Birkmeyer N, et al. How a regional collaborative of hospitals and physicians in Michigan cut costs and improved the quality of care. Health Aff. 2011;30(4):636-645. https://doi.org/10.1377/hlthaff.2010.0526.
42. Desai NR, Ross JS, Kwon JY, et al. Association between hospital penalty status under the hospital readmission reduction program and readmission rates for target and nontarget conditions. JAMA. 2016;316(24):2647-2656. https://doi.org/10.1001/jama.2016.18533.
© 2019 Society of Hospital Medicine