User login
Do complementary agents lower HbA1c when used with standard type 2 diabetes therapy?
No, there is no high-quality evidence that supports using complementary or alternative agents to lower hemoglobin A1c (HbA1c) in patients with noninsulin-dependent type 2 diabetes. Oral chromium in widely varying doses reduces HbA1c a small amount (strength of recommendation [SOR]: C, meta-analysis of low-quality randomized, controlled trials [RCTs] of disease-oriented outcomes, with inconsistent results).
Oral cinnamon 1 to 3 g/d causes a small (<0.1%) drop in HbA1c (SOR: C, meta-analysis of low-quality RCTs of disease-oriented outcomes).
Fenugreek, milk thistle, safflower oil, and sweet potato extract may also reduce HbA1c (SOR: C, small, low-quality RCTs of disease-oriented outcomes).
EVIDENCE SUMMARY
Almost all complementary and alternative agents reviewed here were tested against placebo, and most were used in combination with standard therapy, usually identified as diet with or without oral hypoglycemic agents (TABLE).1-8
Meta-analyses evaluate effects of chromium and cinnamon
A meta-analysis of 13 RCTs evaluating the effect of oral chromium in patients with type 2 diabetes (age range not given) found a small improvement in HbA1c.1 Limitations of the meta-analysis included a wide range of chromium dosages and preparations. Ten studies showed no benefit, and of the 3 showing improvement, the researchers rated 2 as poor-quality.
A meta-analysis of 5 RCTs assessing the effect of oral cinnamon in patients with type 2 diabetes, 42 to 71 years of age, found that cinnamon produced a clinically irrelevant but statistically significant decrease in mean HbA1c.2 After analyzing the 2 RCTs with the largest effects, the researchers concluded that cinnamon might have a greater effect in patients with poorly controlled diabetes (baseline HbA1c>8.2%).
When they evaluated these RCTs for study homogeneity, they found significant differences among the studies in subject age, gender, ethnicity, body mass index, disease duration, concurrent medications, and baseline HbA1c levels, as well as variations in cinnamon dose, preparation, and therapy duration. Furthermore, only one of the studies reported randomization methods and whether allocation was concealed.
What about caiapo, fenugreek, milk thistle, and safflower oil?
Two small, moderate-quality RCTs of caiapo (sweet potato skin extract) in diet-controlled patients with diabetes demonstrated small but possibly clinically significant reductions in HbA1c between the intervention and control groups.3,4
TABLE
Effect of complementary or alternative agents on HbA1c in type 2 diabetes
CAA* | Dose/day | Concurrent diabetes therapy | Study type | Study size | Study duration | Difference in HbA1c (in HbA1c units) | 95% CI or P value |
Chromium1 | 1.28-1000 mcg | Not given | Meta-analysis of 13 RCTs | 381 | 3 wk-8 mo | -0.6† | -0.9 to -0.2 |
Cinnamon2 | 1-3 g | Various oral hypoglycemic agents‡ | Meta-analysis of 5 RCTs | 315 | 1.5-4 mo | -0.09 (WMD)† | -0.14 to -0.04 |
Caiapo3 | 4 g | Diet only | RCT | 61 | 5 mo | -0.21 (caiapo)§ +0.25 (placebo)§ | P=.08
P=.0001 |
Caiapo4 | 4 g | Diet only | RCT | 61 | 3 mo | -0.53 (caiapo)§ +0.06 (placebo)§ | P<.001
P=.23 |
Trigonella foenum-graecum (fenugreek)5 | 6.84 g | Sulfonylurea | RCT | 69 | 3 mo | -1.46 (fenugreek)§ -0.41 (placebo)§ | P<.05
P<.05 |
Silybum marianum (milk thistle)6 | 200 mg | Metformin and sulfonylurea | RCT | 51 | 4 mo | -1.0 (milk thistle)§ +1.2 (placebo)§ | P<.001
P<.0001 |
Silybum marianum (milk thistle)7 | 200 mg | Sulfonylurea | RCT | 38 | 4 mo | -1.5 (milk thistle)§ -0.5 (placebo)§ | P<.05
P=NS |
Safflower oil vs conjugated linoleic acid8 | 8 g | Various oral hypoglycemic agents‡ | DBRCD | 35 | 4 mo | -0.6 (safflower oil)§ +0.1 (conjugated linoleic acid)§ | P=.0007
P=NS |
CAA, complementary or alternative agents; CI, confidence interval; DBRCD, double-blind, randomized, crossover design; HbA1c, glycosylated hemoglobin A1c; NS, not significant; RCT, randomized controlled trial; WMD, weighted mean difference.
*All CAAs were compared against placebo, with the exception of safflower oil, which was compared against conjugated linoleic acid supplementation.
† Change in HbA1c means at study endpoint; the difference in HbA1c in intervention vs placebo groups.
‡ Oral hypoglycemic agents included a-glucosidase inhibitors, biguanides, glinides, glitazones, sulfonylureas, and thiazolidinediones.
§ Change in HbA1c means at study endpoint; the change in HbA1c from baseline.
Four small, placebo-controlled RCTs of fenugreek, milk thistle, and safflower oil found statistically and clinically significant reductions in HbA1c, but all these studies were of poor quality with unclear methods of randomization, threats to blinding, and a lack of baseline demographics.5-8
RECOMMENDATIONS
Both the American Diabetes Association (ADA) and the Diabetes UK Nutrition Working Group state that, “there is no clear evidence of benefit from vitamin or mineral supplementation in people with diabetes (compared with the general population), who do not have underlying deficiencies.”9,10 The ADA specifically states that chromium cannot be recommended because it lacks any clear benefit.9
1. Balk ME, Tatsioni A, Lichtenstein AH, et al. Effect of chromium supplementation on glucose metabolism and lipids: a systematic review of randomized controlled trials. Diabetes Care. 2007;30:2154-2163.
2. Akilen R, Tsiami A, Devendra D, et al. Cinnamon in glycaemic control: Systematic review and meta analysis. Clin Nutr. 2012;31:609-615.
3. Ludvik B, Hanefeld M, Pacini G. Improved metabolic control by Ipomoea batatas (Caiapo) is associated with increased adiponectin and decreased fibrinogen levels in type 2 diabetic subjects. Diabetes Obes Metab. 2008;10:586-592.
4. Ludvik, B, Neuffer, B, Pacini G. Efficacy of Ipomoea batatas (Caiapo) on diabetes control in type 2 diabetic subjects treated with diet. Diabetes Care. 2004;27:436-440.
5. Lu FR, Shen L, Qin Y, et al. Clinical observation on trigonella foenum-graecum L. total saponins in combination with sulfonylureas in the treatment of type 2 diabetes mellitus. Chin J Integr Med. 2008;14:56-60.
6. Huseini HF, Larijani B, Heshmat R, et al. The efficacy of Silybummarianum (L.) Gaertn. (silymarin) in the treatment of type II diabetes: a randomized, double-blind, placebo-controlled clinical trial. Phytother Res. 2006;20:1036-1039.
7. Hussain SA. Silymarin as an adjunct to glibenclamide therapy improves long-term and postprandial glycemic control and body mass index in type 2 diabetes. J Med Food. 2007;10:543-547.
8. Asp ML, Collene AL, Norris LE, et al. Time-dependent effects of safflower oil to improve glycemia, inflammation and blood lipids in obese, post-menopausal women with type 2 diabetes: a randomized,double-masked, crossover study. Clin Nutr. 2011;30:443-449.
9. American Diabetes Association; Bantle JP, Wylie-Rosett J, Albright AL, et al. Nutrition recommendations and interventions for diabetes: a position statement of the American Diabetes Association. Diabetes Care. 2008;31 suppl 1:S61-S78.
10. Diabetes UK Nutrition Working Group, Dyson PA, Kelly T, Deakin T, et al. Evidence-Based Nutrition Guidelines for the Prevention and Management of Diabetes. Diabetes UK Web site. Available at: www.diabetes.org.uk/Documents/Reports/nutritional-guidelines-2013-amendment-0413.pdf. Accessed October 2, 2013.
No, there is no high-quality evidence that supports using complementary or alternative agents to lower hemoglobin A1c (HbA1c) in patients with noninsulin-dependent type 2 diabetes. Oral chromium in widely varying doses reduces HbA1c a small amount (strength of recommendation [SOR]: C, meta-analysis of low-quality randomized, controlled trials [RCTs] of disease-oriented outcomes, with inconsistent results).
Oral cinnamon 1 to 3 g/d causes a small (<0.1%) drop in HbA1c (SOR: C, meta-analysis of low-quality RCTs of disease-oriented outcomes).
Fenugreek, milk thistle, safflower oil, and sweet potato extract may also reduce HbA1c (SOR: C, small, low-quality RCTs of disease-oriented outcomes).
EVIDENCE SUMMARY
Almost all complementary and alternative agents reviewed here were tested against placebo, and most were used in combination with standard therapy, usually identified as diet with or without oral hypoglycemic agents (TABLE).1-8
Meta-analyses evaluate effects of chromium and cinnamon
A meta-analysis of 13 RCTs evaluating the effect of oral chromium in patients with type 2 diabetes (age range not given) found a small improvement in HbA1c.1 Limitations of the meta-analysis included a wide range of chromium dosages and preparations. Ten studies showed no benefit, and of the 3 showing improvement, the researchers rated 2 as poor-quality.
A meta-analysis of 5 RCTs assessing the effect of oral cinnamon in patients with type 2 diabetes, 42 to 71 years of age, found that cinnamon produced a clinically irrelevant but statistically significant decrease in mean HbA1c.2 After analyzing the 2 RCTs with the largest effects, the researchers concluded that cinnamon might have a greater effect in patients with poorly controlled diabetes (baseline HbA1c>8.2%).
When they evaluated these RCTs for study homogeneity, they found significant differences among the studies in subject age, gender, ethnicity, body mass index, disease duration, concurrent medications, and baseline HbA1c levels, as well as variations in cinnamon dose, preparation, and therapy duration. Furthermore, only one of the studies reported randomization methods and whether allocation was concealed.
What about caiapo, fenugreek, milk thistle, and safflower oil?
Two small, moderate-quality RCTs of caiapo (sweet potato skin extract) in diet-controlled patients with diabetes demonstrated small but possibly clinically significant reductions in HbA1c between the intervention and control groups.3,4
TABLE
Effect of complementary or alternative agents on HbA1c in type 2 diabetes
CAA* | Dose/day | Concurrent diabetes therapy | Study type | Study size | Study duration | Difference in HbA1c (in HbA1c units) | 95% CI or P value |
Chromium1 | 1.28-1000 mcg | Not given | Meta-analysis of 13 RCTs | 381 | 3 wk-8 mo | -0.6† | -0.9 to -0.2 |
Cinnamon2 | 1-3 g | Various oral hypoglycemic agents‡ | Meta-analysis of 5 RCTs | 315 | 1.5-4 mo | -0.09 (WMD)† | -0.14 to -0.04 |
Caiapo3 | 4 g | Diet only | RCT | 61 | 5 mo | -0.21 (caiapo)§ +0.25 (placebo)§ | P=.08
P=.0001 |
Caiapo4 | 4 g | Diet only | RCT | 61 | 3 mo | -0.53 (caiapo)§ +0.06 (placebo)§ | P<.001
P=.23 |
Trigonella foenum-graecum (fenugreek)5 | 6.84 g | Sulfonylurea | RCT | 69 | 3 mo | -1.46 (fenugreek)§ -0.41 (placebo)§ | P<.05
P<.05 |
Silybum marianum (milk thistle)6 | 200 mg | Metformin and sulfonylurea | RCT | 51 | 4 mo | -1.0 (milk thistle)§ +1.2 (placebo)§ | P<.001
P<.0001 |
Silybum marianum (milk thistle)7 | 200 mg | Sulfonylurea | RCT | 38 | 4 mo | -1.5 (milk thistle)§ -0.5 (placebo)§ | P<.05
P=NS |
Safflower oil vs conjugated linoleic acid8 | 8 g | Various oral hypoglycemic agents‡ | DBRCD | 35 | 4 mo | -0.6 (safflower oil)§ +0.1 (conjugated linoleic acid)§ | P=.0007
P=NS |
CAA, complementary or alternative agents; CI, confidence interval; DBRCD, double-blind, randomized, crossover design; HbA1c, glycosylated hemoglobin A1c; NS, not significant; RCT, randomized controlled trial; WMD, weighted mean difference.
*All CAAs were compared against placebo, with the exception of safflower oil, which was compared against conjugated linoleic acid supplementation.
† Change in HbA1c means at study endpoint; the difference in HbA1c in intervention vs placebo groups.
‡ Oral hypoglycemic agents included a-glucosidase inhibitors, biguanides, glinides, glitazones, sulfonylureas, and thiazolidinediones.
§ Change in HbA1c means at study endpoint; the change in HbA1c from baseline.
Four small, placebo-controlled RCTs of fenugreek, milk thistle, and safflower oil found statistically and clinically significant reductions in HbA1c, but all these studies were of poor quality with unclear methods of randomization, threats to blinding, and a lack of baseline demographics.5-8
RECOMMENDATIONS
Both the American Diabetes Association (ADA) and the Diabetes UK Nutrition Working Group state that, “there is no clear evidence of benefit from vitamin or mineral supplementation in people with diabetes (compared with the general population), who do not have underlying deficiencies.”9,10 The ADA specifically states that chromium cannot be recommended because it lacks any clear benefit.9
1. Balk ME, Tatsioni A, Lichtenstein AH, et al. Effect of chromium supplementation on glucose metabolism and lipids: a systematic review of randomized controlled trials. Diabetes Care. 2007;30:2154-2163.
2. Akilen R, Tsiami A, Devendra D, et al. Cinnamon in glycaemic control: Systematic review and meta analysis. Clin Nutr. 2012;31:609-615.
3. Ludvik B, Hanefeld M, Pacini G. Improved metabolic control by Ipomoea batatas (Caiapo) is associated with increased adiponectin and decreased fibrinogen levels in type 2 diabetic subjects. Diabetes Obes Metab. 2008;10:586-592.
4. Ludvik, B, Neuffer, B, Pacini G. Efficacy of Ipomoea batatas (Caiapo) on diabetes control in type 2 diabetic subjects treated with diet. Diabetes Care. 2004;27:436-440.
5. Lu FR, Shen L, Qin Y, et al. Clinical observation on trigonella foenum-graecum L. total saponins in combination with sulfonylureas in the treatment of type 2 diabetes mellitus. Chin J Integr Med. 2008;14:56-60.
6. Huseini HF, Larijani B, Heshmat R, et al. The efficacy of Silybummarianum (L.) Gaertn. (silymarin) in the treatment of type II diabetes: a randomized, double-blind, placebo-controlled clinical trial. Phytother Res. 2006;20:1036-1039.
7. Hussain SA. Silymarin as an adjunct to glibenclamide therapy improves long-term and postprandial glycemic control and body mass index in type 2 diabetes. J Med Food. 2007;10:543-547.
8. Asp ML, Collene AL, Norris LE, et al. Time-dependent effects of safflower oil to improve glycemia, inflammation and blood lipids in obese, post-menopausal women with type 2 diabetes: a randomized,double-masked, crossover study. Clin Nutr. 2011;30:443-449.
9. American Diabetes Association; Bantle JP, Wylie-Rosett J, Albright AL, et al. Nutrition recommendations and interventions for diabetes: a position statement of the American Diabetes Association. Diabetes Care. 2008;31 suppl 1:S61-S78.
10. Diabetes UK Nutrition Working Group, Dyson PA, Kelly T, Deakin T, et al. Evidence-Based Nutrition Guidelines for the Prevention and Management of Diabetes. Diabetes UK Web site. Available at: www.diabetes.org.uk/Documents/Reports/nutritional-guidelines-2013-amendment-0413.pdf. Accessed October 2, 2013.
Evidence-based answers from the Family Physicians Inquiries Network
When You Suspect ACS, Which Serologic Marker Is Best?
Measurement of troponin levels provides the most sensitive and accurate serologic information in evaluating a patient with acute coronary syndrome (ACS); troponin elevations are more sensitive than elevations of creatine kinase-MB (CK-MB). Isolated elevation of troponin levels increases the likelihood of myocardial infarction (MI) or death, whereas isolated elevation of CK-MB levels doesn’t. (Strength of recommendation [SOR] for all statements: A, multiple, large prospective cohort studies.)
Repeated measurement of troponin levels at presentation and then 3 and 6 hours afterward increases the diagnostic sensitivity for acute myocardial infarction (AMI) (SOR: A, multiple, small prospective studies).
EVIDENCE SUMMARY
Troponin I and T proteins are specific to cardiac myocytes and, unlike CK-MB, aren’t elevated by damage to skeletal muscle.
Measuring troponin levels increased the number of patients diagnosed with AMI
A multinational prospective cohort study of patients with suspected ACS (N=10,719) found that measuring troponin levels in addition to CK-MB levels improved the diagnosis of AMI.1 Investigators used elevation of any biomarker (CK, CK-MB, or troponin I or T) above the upper limit of normal as their diagnostic criterion. They found that measuring troponin increased the number of patients diagnosed with AMI by 10.4% over patients diagnosed using CK and CK-MB levels. Elevated troponin levels were associated with an inpatient mortality rate 1.5 to 3 times higher, regardless of the patient’s CK-MB status.
Troponin levels are more sensitive and specific than CK-MB
A prospective cohort study of 718 patients with suspected AMI calculated the area under curve (AUC) of the receiver operator curve—a measure of diagnostic accuracy in which an AUC value of 1 indicates 100% sensitivity and specificity—for troponin and CK-MB levels at initial presentation.2 Two independent cardiologists reviewed all available medical records and made the final diagnosis. The AUCs for troponin levels ranged from 0.94 to 0.96 compared with 0.88 for CK-MB.
Troponin levels and odds of MI or death
A prospective study of 1852 patients with suspected ACS from 3 trial populations evaluated the prognostic value of increased troponin levels vs CK-MB levels at initial presentation, compared with a reference group with normal troponin and CK-MB levels.3 Patients with isolated troponin elevation had an increased odds of MI or death at 24 hours (odds ratio [OR]=5.2; 95% confidence interval [CI], 2.2-11.9) and 30 days (OR=2.1; 95% CI, 1.4-3.0), whereas patients with isolated CK-MB elevations didn't. At 30 days, patients with isolated CK-MB elevations equaled the reference group odds for MI and death (OR=1.0; 95% CI, 0.6-1.6).
Serial troponin assessment boosts diagnostic sensitivity
A prospective cohort study found that serial measurements of troponin increased the diagnostic sensitivity for AMI.4 Investigators evaluated 1818 consecutive patients with new onset chest pain in 3 German chest-pain units with troponin levels on admission and at 3 and 6 hours later. The gold standard was diagnosis of AMI by 2 independent cardiologists. Troponin measurement produced an AUC of 0.96 at admission, increasing to 0.98 and 0.99 at 3 and 6 hours after admission, respectively.
Recommendations
The American College of Cardiology and American Heart Association recommend measuring biomarkers of cardiac injury in all patients who present with chest discomfort consistent with ACS.5 A cardiac-specific troponin is the preferred marker and should be measured in all patients. If troponin is not available, CK-MB is the best alternative. Cardiac biomarkers should be repeated 6 to 9 hours after presentation and, in patients with a high clinical suspicion of AMI, at 12 to 24 hours.6,7
1. Goodman SG, Steg PG, Eagle KA, et al; GRACE Investigators. The diagnostic and prognostic impact of the redefinition of acute myocardial infarction: lessons from the global registry of acute coronary events (GRACE). Am Heart J. 2006;151:654-660.
2. Reichlin T, Hochholzer W, Bassetti S, et al. Early diagnosis of myocardial infarction with sensitive cardiac troponin assays. N Engl J Med. 2009;361:858-867.
3. Rao SV, Ohman EM, Granger CB, et al. Prognostic value of isolated troponin elevation across the spectrum of chest pain syndromes. Am J Cardiol. 2003;91:936-940.
4. Keller T, Zeller T, Peetz D, et al. Sensitive troponin I assay in early diagnosis of acute myocardial infarction. N Engl J Med. 2009;361:868-877.
5. Anderson JL, Adams CD, Antman EM, et al. American College of Cardiology, American Heart Association Task Force on Practice Guidelines (Writing Committee, American College of Emergency Physicians, Society for Cardiovascular Angiography and Interventions, Society of Thoracic Surgeons, American Association of Cardiovascular and Pulmonary Rehabilitation, Society for Academic Emergency Medicine). ACC/AHA 2007 guidelines for the management of patients with unstable angina/non-ST-elevation myocardial infarction: a report of the American College of Cardiology. J Am Coll Cardiol. 2007;50:e1-e157.
6. Morrow DA, Cannon CP, Jesse RL, et al; National Academy of Clinical Biochemistry. National Academy of Clinical Biochemistry Laboratory Medicine practice guidelines: clinical characteristics and utilization of biochemical markers in acute coronary syndromes. Clin Chem. 2007;53:552-574.
7. Thygesen K, Alpert JS, White HD, et al. Universal definition of myocardial infarction. Circulation. 2007;116:2634-2653.
Measurement of troponin levels provides the most sensitive and accurate serologic information in evaluating a patient with acute coronary syndrome (ACS); troponin elevations are more sensitive than elevations of creatine kinase-MB (CK-MB). Isolated elevation of troponin levels increases the likelihood of myocardial infarction (MI) or death, whereas isolated elevation of CK-MB levels doesn’t. (Strength of recommendation [SOR] for all statements: A, multiple, large prospective cohort studies.)
Repeated measurement of troponin levels at presentation and then 3 and 6 hours afterward increases the diagnostic sensitivity for acute myocardial infarction (AMI) (SOR: A, multiple, small prospective studies).
EVIDENCE SUMMARY
Troponin I and T proteins are specific to cardiac myocytes and, unlike CK-MB, aren’t elevated by damage to skeletal muscle.
Measuring troponin levels increased the number of patients diagnosed with AMI
A multinational prospective cohort study of patients with suspected ACS (N=10,719) found that measuring troponin levels in addition to CK-MB levels improved the diagnosis of AMI.1 Investigators used elevation of any biomarker (CK, CK-MB, or troponin I or T) above the upper limit of normal as their diagnostic criterion. They found that measuring troponin increased the number of patients diagnosed with AMI by 10.4% over patients diagnosed using CK and CK-MB levels. Elevated troponin levels were associated with an inpatient mortality rate 1.5 to 3 times higher, regardless of the patient’s CK-MB status.
Troponin levels are more sensitive and specific than CK-MB
A prospective cohort study of 718 patients with suspected AMI calculated the area under curve (AUC) of the receiver operator curve—a measure of diagnostic accuracy in which an AUC value of 1 indicates 100% sensitivity and specificity—for troponin and CK-MB levels at initial presentation.2 Two independent cardiologists reviewed all available medical records and made the final diagnosis. The AUCs for troponin levels ranged from 0.94 to 0.96 compared with 0.88 for CK-MB.
Troponin levels and odds of MI or death
A prospective study of 1852 patients with suspected ACS from 3 trial populations evaluated the prognostic value of increased troponin levels vs CK-MB levels at initial presentation, compared with a reference group with normal troponin and CK-MB levels.3 Patients with isolated troponin elevation had an increased odds of MI or death at 24 hours (odds ratio [OR]=5.2; 95% confidence interval [CI], 2.2-11.9) and 30 days (OR=2.1; 95% CI, 1.4-3.0), whereas patients with isolated CK-MB elevations didn't. At 30 days, patients with isolated CK-MB elevations equaled the reference group odds for MI and death (OR=1.0; 95% CI, 0.6-1.6).
Serial troponin assessment boosts diagnostic sensitivity
A prospective cohort study found that serial measurements of troponin increased the diagnostic sensitivity for AMI.4 Investigators evaluated 1818 consecutive patients with new onset chest pain in 3 German chest-pain units with troponin levels on admission and at 3 and 6 hours later. The gold standard was diagnosis of AMI by 2 independent cardiologists. Troponin measurement produced an AUC of 0.96 at admission, increasing to 0.98 and 0.99 at 3 and 6 hours after admission, respectively.
Recommendations
The American College of Cardiology and American Heart Association recommend measuring biomarkers of cardiac injury in all patients who present with chest discomfort consistent with ACS.5 A cardiac-specific troponin is the preferred marker and should be measured in all patients. If troponin is not available, CK-MB is the best alternative. Cardiac biomarkers should be repeated 6 to 9 hours after presentation and, in patients with a high clinical suspicion of AMI, at 12 to 24 hours.6,7
1. Goodman SG, Steg PG, Eagle KA, et al; GRACE Investigators. The diagnostic and prognostic impact of the redefinition of acute myocardial infarction: lessons from the global registry of acute coronary events (GRACE). Am Heart J. 2006;151:654-660.
2. Reichlin T, Hochholzer W, Bassetti S, et al. Early diagnosis of myocardial infarction with sensitive cardiac troponin assays. N Engl J Med. 2009;361:858-867.
3. Rao SV, Ohman EM, Granger CB, et al. Prognostic value of isolated troponin elevation across the spectrum of chest pain syndromes. Am J Cardiol. 2003;91:936-940.
4. Keller T, Zeller T, Peetz D, et al. Sensitive troponin I assay in early diagnosis of acute myocardial infarction. N Engl J Med. 2009;361:868-877.
5. Anderson JL, Adams CD, Antman EM, et al. American College of Cardiology, American Heart Association Task Force on Practice Guidelines (Writing Committee, American College of Emergency Physicians, Society for Cardiovascular Angiography and Interventions, Society of Thoracic Surgeons, American Association of Cardiovascular and Pulmonary Rehabilitation, Society for Academic Emergency Medicine). ACC/AHA 2007 guidelines for the management of patients with unstable angina/non-ST-elevation myocardial infarction: a report of the American College of Cardiology. J Am Coll Cardiol. 2007;50:e1-e157.
6. Morrow DA, Cannon CP, Jesse RL, et al; National Academy of Clinical Biochemistry. National Academy of Clinical Biochemistry Laboratory Medicine practice guidelines: clinical characteristics and utilization of biochemical markers in acute coronary syndromes. Clin Chem. 2007;53:552-574.
7. Thygesen K, Alpert JS, White HD, et al. Universal definition of myocardial infarction. Circulation. 2007;116:2634-2653.
When you suspect ACS, which serologic marker is best?
Measurement of troponin levels provides the most sensitive and accurate serologic information in evaluating a patient with acute coronary syndrome (ACS); troponin elevations are more sensitive than elevations of creatine kinase-MB (CK-MB). Isolated elevation of troponin levels increases the likelihood of myocardial infarction (MI) or death, whereas isolated elevation of CK-MB levels doesn’t. (Strength of recommendation [SOR] for all statements: A, multiple, large prospective cohort studies.)
Repeated measurement of troponin levels at presentation and then 3 and 6 hours afterward increases the diagnostic sensitivity for acute myocardial infarction (AMI) (SOR: A, multiple, small prospective studies).
EVIDENCE SUMMARY
Troponin I and T proteins are specific to cardiac myocytes and, unlike CK-MB, aren’t elevated by damage to skeletal muscle.
Measuring troponin levels increased the number of patients diagnosed with AMI
A multinational prospective cohort study of patients with suspected ACS (N=10,719) found that measuring troponin levels in addition to CK-MB levels improved the diagnosis of AMI.1 Investigators used elevation of any biomarker (CK, CK-MB, or troponin I or T) above the upper limit of normal as their diagnostic criterion. They found that measuring troponin increased the number of patients diagnosed with AMI by 10.4% over patients diagnosed using CK and CK-MB levels. Elevated troponin levels were associated with an inpatient mortality rate 1.5 to 3 times higher, regardless of the patient’s CK-MB status.
Troponin levels are more sensitive and specific than CK-MB
A prospective cohort study of 718 patients with suspected AMI calculated the area under curve (AUC) of the receiver operator curve—a measure of diagnostic accuracy in which an AUC value of 1 indicates 100% sensitivity and specificity—for troponin and CK-MB levels at initial presentation.2 Two independent cardiologists reviewed all available medical records and made the final diagnosis. The AUCs for troponin levels ranged from 0.94 to 0.96 compared with 0.88 for CK-MB.
Troponin levels and odds of MI or death
A prospective study of 1852 patients with suspected ACS from 3 trial populations evaluated the prognostic value of increased troponin levels vs CK-MB levels at initial presentation, compared with a reference group with normal troponin and CK-MB levels.3 Patients with isolated troponin elevation had an increased odds of MI or death at 24 hours (odds ratio [OR]=5.2; 95% confidence interval [CI], 2.2-11.9) and 30 days (OR=2.1; 95% CI, 1.4-3.0), whereas patients with isolated CK-MB elevations didn't. At 30 days, patients with isolated CK-MB elevations equaled the reference group odds for MI and death (OR=1.0; 95% CI, 0.6-1.6).
Serial troponin assessment boosts diagnostic sensitivity
A prospective cohort study found that serial measurements of troponin increased the diagnostic sensitivity for AMI.4 Investigators evaluated 1818 consecutive patients with new onset chest pain in 3 German chest-pain units with troponin levels on admission and at 3 and 6 hours later. The gold standard was diagnosis of AMI by 2 independent cardiologists. Troponin measurement produced an AUC of 0.96 at admission, increasing to 0.98 and 0.99 at 3 and 6 hours after admission, respectively.
RECOMMENDATIONS
The American College of Cardiology and American Heart Association recommend measuring biomarkers of cardiac injury in all patients who present with chest discomfort consistent with ACS.5 A cardiac-specific troponin is the preferred marker and should be measured in all patients. If troponin is not available, CK-MB is the best alternative. Cardiac biomarkers should be repeated 6 to 9 hours after presentation and, in patients with a high clinical suspicion of AMI, at 12 to 24 hours.6,7
1. Goodman SG, Steg PG, Eagle KA, et al; GRACE Investigators. The diagnostic and prognostic impact of the redefinition of acute myocardial infarction: lessons from the global registry of acute coronary events (GRACE). Am Heart J. 2006;151:654-660.
2. Reichlin T, Hochholzer W, Bassetti S, et al. Early diagnosis of myocardial infarction with sensitive cardiac troponin assays. N Engl J Med. 2009;361:858-867.
3. Rao SV, Ohman EM, Granger CB, et al. Prognostic value of isolated troponin elevation across the spectrum of chest pain syndromes. Am J Cardiol. 2003;91:936-940.
4. Keller T, Zeller T, Peetz D, et al. Sensitive troponin I assay in early diagnosis of acute myocardial infarction. N Engl J Med. 2009;361:868-877.
5. Anderson JL, Adams CD, Antman EM, et al. American College of Cardiology, American Heart Association Task Force on Practice Guidelines (Writing Committee, American College of Emergency Physicians, Society for Cardiovascular Angiography and Interventions, Society of Thoracic Surgeons, American Association of Cardiovascular and Pulmonary Rehabilitation, Society for Academic Emergency Medicine). ACC/AHA 2007 guidelines for the management of patients with unstable angina/non-ST-elevation myocardial infarction: a report of the American College of Cardiology. J Am Coll Cardiol. 2007;50:e1-e157.
6. Morrow DA, Cannon CP, Jesse RL, et al; National Academy of Clinical Biochemistry. National Academy of Clinical Biochemistry Laboratory Medicine practice guidelines: clinical characteristics and utilization of biochemical markers in acute coronary syndromes. Clin Chem. 2007;53:552-574.
7. Thygesen K, Alpert JS, White HD, et al. Universal definition of myocardial infarction. Circulation. 2007;116:2634-2653.
Measurement of troponin levels provides the most sensitive and accurate serologic information in evaluating a patient with acute coronary syndrome (ACS); troponin elevations are more sensitive than elevations of creatine kinase-MB (CK-MB). Isolated elevation of troponin levels increases the likelihood of myocardial infarction (MI) or death, whereas isolated elevation of CK-MB levels doesn’t. (Strength of recommendation [SOR] for all statements: A, multiple, large prospective cohort studies.)
Repeated measurement of troponin levels at presentation and then 3 and 6 hours afterward increases the diagnostic sensitivity for acute myocardial infarction (AMI) (SOR: A, multiple, small prospective studies).
EVIDENCE SUMMARY
Troponin I and T proteins are specific to cardiac myocytes and, unlike CK-MB, aren’t elevated by damage to skeletal muscle.
Measuring troponin levels increased the number of patients diagnosed with AMI
A multinational prospective cohort study of patients with suspected ACS (N=10,719) found that measuring troponin levels in addition to CK-MB levels improved the diagnosis of AMI.1 Investigators used elevation of any biomarker (CK, CK-MB, or troponin I or T) above the upper limit of normal as their diagnostic criterion. They found that measuring troponin increased the number of patients diagnosed with AMI by 10.4% over patients diagnosed using CK and CK-MB levels. Elevated troponin levels were associated with an inpatient mortality rate 1.5 to 3 times higher, regardless of the patient’s CK-MB status.
Troponin levels are more sensitive and specific than CK-MB
A prospective cohort study of 718 patients with suspected AMI calculated the area under curve (AUC) of the receiver operator curve—a measure of diagnostic accuracy in which an AUC value of 1 indicates 100% sensitivity and specificity—for troponin and CK-MB levels at initial presentation.2 Two independent cardiologists reviewed all available medical records and made the final diagnosis. The AUCs for troponin levels ranged from 0.94 to 0.96 compared with 0.88 for CK-MB.
Troponin levels and odds of MI or death
A prospective study of 1852 patients with suspected ACS from 3 trial populations evaluated the prognostic value of increased troponin levels vs CK-MB levels at initial presentation, compared with a reference group with normal troponin and CK-MB levels.3 Patients with isolated troponin elevation had an increased odds of MI or death at 24 hours (odds ratio [OR]=5.2; 95% confidence interval [CI], 2.2-11.9) and 30 days (OR=2.1; 95% CI, 1.4-3.0), whereas patients with isolated CK-MB elevations didn't. At 30 days, patients with isolated CK-MB elevations equaled the reference group odds for MI and death (OR=1.0; 95% CI, 0.6-1.6).
Serial troponin assessment boosts diagnostic sensitivity
A prospective cohort study found that serial measurements of troponin increased the diagnostic sensitivity for AMI.4 Investigators evaluated 1818 consecutive patients with new onset chest pain in 3 German chest-pain units with troponin levels on admission and at 3 and 6 hours later. The gold standard was diagnosis of AMI by 2 independent cardiologists. Troponin measurement produced an AUC of 0.96 at admission, increasing to 0.98 and 0.99 at 3 and 6 hours after admission, respectively.
RECOMMENDATIONS
The American College of Cardiology and American Heart Association recommend measuring biomarkers of cardiac injury in all patients who present with chest discomfort consistent with ACS.5 A cardiac-specific troponin is the preferred marker and should be measured in all patients. If troponin is not available, CK-MB is the best alternative. Cardiac biomarkers should be repeated 6 to 9 hours after presentation and, in patients with a high clinical suspicion of AMI, at 12 to 24 hours.6,7
1. Goodman SG, Steg PG, Eagle KA, et al; GRACE Investigators. The diagnostic and prognostic impact of the redefinition of acute myocardial infarction: lessons from the global registry of acute coronary events (GRACE). Am Heart J. 2006;151:654-660.
2. Reichlin T, Hochholzer W, Bassetti S, et al. Early diagnosis of myocardial infarction with sensitive cardiac troponin assays. N Engl J Med. 2009;361:858-867.
3. Rao SV, Ohman EM, Granger CB, et al. Prognostic value of isolated troponin elevation across the spectrum of chest pain syndromes. Am J Cardiol. 2003;91:936-940.
4. Keller T, Zeller T, Peetz D, et al. Sensitive troponin I assay in early diagnosis of acute myocardial infarction. N Engl J Med. 2009;361:868-877.
5. Anderson JL, Adams CD, Antman EM, et al. American College of Cardiology, American Heart Association Task Force on Practice Guidelines (Writing Committee, American College of Emergency Physicians, Society for Cardiovascular Angiography and Interventions, Society of Thoracic Surgeons, American Association of Cardiovascular and Pulmonary Rehabilitation, Society for Academic Emergency Medicine). ACC/AHA 2007 guidelines for the management of patients with unstable angina/non-ST-elevation myocardial infarction: a report of the American College of Cardiology. J Am Coll Cardiol. 2007;50:e1-e157.
6. Morrow DA, Cannon CP, Jesse RL, et al; National Academy of Clinical Biochemistry. National Academy of Clinical Biochemistry Laboratory Medicine practice guidelines: clinical characteristics and utilization of biochemical markers in acute coronary syndromes. Clin Chem. 2007;53:552-574.
7. Thygesen K, Alpert JS, White HD, et al. Universal definition of myocardial infarction. Circulation. 2007;116:2634-2653.
Evidence-based answers from the Family Physicians Inquiries Network
Do oral contraceptives carry a significant risk of stroke for women with migraines?
Perhaps. Estrogen-containing oral contraceptives may raise the risk of ischemic stroke in women with migraine, particularly migraine with aura (strength of recommendation [SOR]: C, small case-control studies with methodological flaws and conflicting results).
EVIDENCE SUMMARY
Women with probable migraine with visual aura (PMVA) have an increased risk for ischemic stroke (odds ratio [OR]=2.1) but not hemorrhagic stroke.1 Women with >12 PMVA episodes per year are at greatest risk (OR=2.2, compared with <12 PMVA episodes per year, OR=1.1).2 Women taking oral contraceptive pills (OCPs) also have an increased risk for stroke, depending on the estrogen dose (OR=4.8 for 50 mcg; OR=2.7 for 30-40 mcg; OR=1.7 for 20 mcg; and OR=1.0 for progestin-only pills).3
Women with migraines who smoke and take OCPs have the highest risk
Four case-control studies evaluated the risk of ischemic stroke in women with migraines who take OCPs. The first study compared the OR among 135 women 15 to 49 years of age with PMVA and a first ischemic stroke with 614 controls (no history of stroke, matched for age and ethnicity).2 Although women with PMVA overall had an increased risk of ischemic stroke (OR=1.5; 95% confidence interval [CI], 1.1-2.0), a subgroup of women with PMVA who also were taking OCPs didn’t have a significantly greater stroke risk than women with PMVA who were not taking OCPs (OR=1.6; 95% CI, not given but reported as not significant; P=.87). Investigators didn’t specify the type of OCPs.
Women with PMVA who smoked had a greater risk of ischemic stroke (OR=1.5; 95% CI, 1.1-2.3), and women with PMVA who both smoked and took OCPs had the highest risk of ischemic stroke (OR =7.0; 95% CI, 1.4-22.8).
In women younger than 45 years, OCPs are associated with higher stroke risk
The second study compared the odds ratio for ischemic stroke among 47 women younger than 45 years with PMVA who were taking combined OCPs with 63 controls.3 Most OCPs contained 30 to 40 mcg estrogen. Women with PMVA taking a combined OCP had a higher risk of ischemic stroke (OR=13.9; 95% CI, 5.5-35.1) than women with PMVA who didn’t take OCPs (OR=3.7; 95% CI, 1.5-9.1). Investigators didn’t report the number of PMVA episodes per year among the women.
The third study compared the odds ratio for ischemic stroke among 10 women 20 to 44 years of age with migraines who were taking combined OCPs with 23 controls.4 Investigators didn’t specify the type of migraine, although classic migraine was approximately twice as common as simple migraine among the women in the larger study population. Women with migraine taking OCPs were more likely to have an ischemic stroke overall (OR=16.9; 95% CI, 2.7-106), with the exception of those taking OCPs with <50 mcg estrogen (4 patients) (OR=0.59; 95 % CI, 0.79-54.8).
The fourth study compared the OR for ischemic stroke among 4 women 18 to 44 years old who had a history of migraine (type not specified) and used low-dose OCPs with 14 controls. Women with migraines taking OCPs had a higher risk of ischemic stroke (OR=2.08; 95% CI, 1.19-3.65).5
RECOMMENDATIONS
The American College of Obstetricians and Gynecologists says that combined OCPs are contraindicated for women with migraine with focal neurologic symptoms such as aura.6 Although strokes are rare in women with migraine taking OCPs, the impact of a stroke is so devastating that clinicians should consider progestin-only, intrauterine, or barrier contraceptives for these women. However, physicians may consider combined OCPs for women younger than 35 years with migraine if they don’t have focal neurologic signs, don’t smoke, and are otherwise healthy.
The World Health Organization and Centers for Disease Control and Prevention state that women with a history of migraine who use combined OCPs are 2 to 4 times more likely to have an ischemic stroke than nonusers and conclude that combined OCP use in women older than 35 years with migraine, or migraine with aura at any age, represents an unacceptable health risk. However, the advantages of using combined OCPs in women younger than 35 years with migraine generally outweigh the theoretical or proven risks.7,8
1. Schürks M, Rist PM, Bigal ME, et al. Migraine and cardiovascular disease: systemic review and meta-analysis. BMJ. 2009;339:b3914.
2. MacClellan LR, Giles W, Cole J, et al. Probable migraine with visual aura and risk of ischemic stroke: the stroke prevention in young women study. Stroke. 2007;38:2438-2445.
3. Tzourio C, Tehindrazanarivelo A, Iglésias S, et al. Case-control study of migraine and risk of ischaemic stroke in young women. BMJ. 1995;310:830-833.
4. Chang C, Donaghy M, Poulter N, et al. Migraine and stroke in young women: case-control study. The World Health Organization Collaborative Study of Cardiovascular Disease and Steroid Hormone Contraception. BMJ. 1999;318:13-18.
5. Schwartz SM, Petitti DB, Siscovick DS, et al. Stroke and use of low-dose oral contraceptives in young women: a pooled analysis of two US studies. Stroke. 1998;29:2277-2284.
6. ACOG Committee on Practice Bulletins-Gynecology. ACOG Practice Bulletin No. 73. Use of hormonal contraception in women with coexisting medical conditions. Obstet Gynecol. 2006;107:1453-1472.
7. US Medical Eligibility Criteria for Contraceptive Use, 2010. Adapted from the World Health Organization Medical Eligibility Criteria for Contraceptive Use, 4th edition. Centers for Disease Control and Prevention Web site. Available at: http://www.cdc.gov/mmwr/preview/mmwrhtml/rr5904a1.htm. Accessed July 15, 2012.
8. Appendix B: Classifications for combined hormonal contraceptives. Centers for Disease Control and Prevention Web site. Available at: http://www.cdc.gov/mmwr/preview/mmwrhtml/rr5904a3.htm. Accessed July 15, 2012.
Perhaps. Estrogen-containing oral contraceptives may raise the risk of ischemic stroke in women with migraine, particularly migraine with aura (strength of recommendation [SOR]: C, small case-control studies with methodological flaws and conflicting results).
EVIDENCE SUMMARY
Women with probable migraine with visual aura (PMVA) have an increased risk for ischemic stroke (odds ratio [OR]=2.1) but not hemorrhagic stroke.1 Women with >12 PMVA episodes per year are at greatest risk (OR=2.2, compared with <12 PMVA episodes per year, OR=1.1).2 Women taking oral contraceptive pills (OCPs) also have an increased risk for stroke, depending on the estrogen dose (OR=4.8 for 50 mcg; OR=2.7 for 30-40 mcg; OR=1.7 for 20 mcg; and OR=1.0 for progestin-only pills).3
Women with migraines who smoke and take OCPs have the highest risk
Four case-control studies evaluated the risk of ischemic stroke in women with migraines who take OCPs. The first study compared the OR among 135 women 15 to 49 years of age with PMVA and a first ischemic stroke with 614 controls (no history of stroke, matched for age and ethnicity).2 Although women with PMVA overall had an increased risk of ischemic stroke (OR=1.5; 95% confidence interval [CI], 1.1-2.0), a subgroup of women with PMVA who also were taking OCPs didn’t have a significantly greater stroke risk than women with PMVA who were not taking OCPs (OR=1.6; 95% CI, not given but reported as not significant; P=.87). Investigators didn’t specify the type of OCPs.
Women with PMVA who smoked had a greater risk of ischemic stroke (OR=1.5; 95% CI, 1.1-2.3), and women with PMVA who both smoked and took OCPs had the highest risk of ischemic stroke (OR =7.0; 95% CI, 1.4-22.8).
In women younger than 45 years, OCPs are associated with higher stroke risk
The second study compared the odds ratio for ischemic stroke among 47 women younger than 45 years with PMVA who were taking combined OCPs with 63 controls.3 Most OCPs contained 30 to 40 mcg estrogen. Women with PMVA taking a combined OCP had a higher risk of ischemic stroke (OR=13.9; 95% CI, 5.5-35.1) than women with PMVA who didn’t take OCPs (OR=3.7; 95% CI, 1.5-9.1). Investigators didn’t report the number of PMVA episodes per year among the women.
The third study compared the odds ratio for ischemic stroke among 10 women 20 to 44 years of age with migraines who were taking combined OCPs with 23 controls.4 Investigators didn’t specify the type of migraine, although classic migraine was approximately twice as common as simple migraine among the women in the larger study population. Women with migraine taking OCPs were more likely to have an ischemic stroke overall (OR=16.9; 95% CI, 2.7-106), with the exception of those taking OCPs with <50 mcg estrogen (4 patients) (OR=0.59; 95 % CI, 0.79-54.8).
The fourth study compared the OR for ischemic stroke among 4 women 18 to 44 years old who had a history of migraine (type not specified) and used low-dose OCPs with 14 controls. Women with migraines taking OCPs had a higher risk of ischemic stroke (OR=2.08; 95% CI, 1.19-3.65).5
RECOMMENDATIONS
The American College of Obstetricians and Gynecologists says that combined OCPs are contraindicated for women with migraine with focal neurologic symptoms such as aura.6 Although strokes are rare in women with migraine taking OCPs, the impact of a stroke is so devastating that clinicians should consider progestin-only, intrauterine, or barrier contraceptives for these women. However, physicians may consider combined OCPs for women younger than 35 years with migraine if they don’t have focal neurologic signs, don’t smoke, and are otherwise healthy.
The World Health Organization and Centers for Disease Control and Prevention state that women with a history of migraine who use combined OCPs are 2 to 4 times more likely to have an ischemic stroke than nonusers and conclude that combined OCP use in women older than 35 years with migraine, or migraine with aura at any age, represents an unacceptable health risk. However, the advantages of using combined OCPs in women younger than 35 years with migraine generally outweigh the theoretical or proven risks.7,8
1. Schürks M, Rist PM, Bigal ME, et al. Migraine and cardiovascular disease: systemic review and meta-analysis. BMJ. 2009;339:b3914.
2. MacClellan LR, Giles W, Cole J, et al. Probable migraine with visual aura and risk of ischemic stroke: the stroke prevention in young women study. Stroke. 2007;38:2438-2445.
3. Tzourio C, Tehindrazanarivelo A, Iglésias S, et al. Case-control study of migraine and risk of ischaemic stroke in young women. BMJ. 1995;310:830-833.
4. Chang C, Donaghy M, Poulter N, et al. Migraine and stroke in young women: case-control study. The World Health Organization Collaborative Study of Cardiovascular Disease and Steroid Hormone Contraception. BMJ. 1999;318:13-18.
5. Schwartz SM, Petitti DB, Siscovick DS, et al. Stroke and use of low-dose oral contraceptives in young women: a pooled analysis of two US studies. Stroke. 1998;29:2277-2284.
6. ACOG Committee on Practice Bulletins-Gynecology. ACOG Practice Bulletin No. 73. Use of hormonal contraception in women with coexisting medical conditions. Obstet Gynecol. 2006;107:1453-1472.
7. US Medical Eligibility Criteria for Contraceptive Use, 2010. Adapted from the World Health Organization Medical Eligibility Criteria for Contraceptive Use, 4th edition. Centers for Disease Control and Prevention Web site. Available at: http://www.cdc.gov/mmwr/preview/mmwrhtml/rr5904a1.htm. Accessed July 15, 2012.
8. Appendix B: Classifications for combined hormonal contraceptives. Centers for Disease Control and Prevention Web site. Available at: http://www.cdc.gov/mmwr/preview/mmwrhtml/rr5904a3.htm. Accessed July 15, 2012.
Evidence-based answers from the Family Physicians Inquiries Network
Elevated troponin but no CVD: What’s the prognosis?
Patients with elevated troponin levels and chronic renal disease, pulmonary hypertension, pulmonary embolism, chronic obstructive pulmonary disease, sepsis, or acute ischemic stroke have a 2- to 5-fold increased risk of death, even in the absence of known cardiovascular disease (TABLE)1-6 (strength of recommendation: B, meta-analysis, multiple prospective and retrospective observational studies.)
EVIDENCE SUMMARY
To investigate the prognostic value of troponin on overall mortality, a multicenter prospective study followed 847 patients 18 years and older (mean age 59 years) with end-stage renal disease whose troponin T levels were measured 3 months from the start of peritoneal dialysis or hemodialysis until transplantation or death.1 At enrollment, 566 patients had a troponin level of ≤0.04 ng/dL, 188 had a value between 0.05 and 0.10 ng/dL, and 93 had a level of more than 0.10 ng/dL.
Using Cox regression, patients whose troponin levels were more than 0.10 ng/dL had an increased hazard ratio (HR) for all-cause mortality of 2.2 (95% confidence interval [CI], 1.7-2.8) compared with patients who had levels ≤0.04 ng/dL. Cardiovascular mortality also was higher (HR=1.9; 95% CI, 0.9-3.7) with troponin elevations, but didn’t reach statistical significance. Investigators found no significant differences in mortality risk between patients on peritoneal or hemodialysis, patients with or without a history of acute myocardial infarction, or patients who suffered cerebrovascular accidents.
Elevated troponin raises risk of death 5-fold in pulmonary embolism patients
A meta-analysis of 20 trials with a total of 1985 patients assessed the prognostic value of troponin for short-term mortality in patients admitted with acute pulmonary embolism.2 Sixteen studies (1527 patients) were prospective trials and the remainder (458 patients) were retrospective trials. Investigators obtained troponin levels for all patients at admission. They used several different troponin assays (both I and T), but most of the studies used the assay manufacturers’ cutoff points (exceeding the 99th percentile).
High troponin levels were associated with a 5-fold increased risk of short-term death, defined as in-hospital death up to 30 days after discharge (19.7% with elevated troponin vs 3.7% with normal troponin; odds ratio [OR]=5.24; 95% CI, 3.3-8.4).
Increased risk of death among those with pulmonary hypertension, COPD A prospective single-center study of 56 patients with chronic pulmonary hypertension found that the 14% of those whose troponin T was elevated (≥0.01 ng/mL) had a lower survival rate than the other patients. Patients who either had a positive troponin on initial assessment or developed troponin elevation within the 2-year follow-up period had a cumulative 24-month survival rate of 29%, compared with 81% for their troponin T-negative counterparts (P=.001).3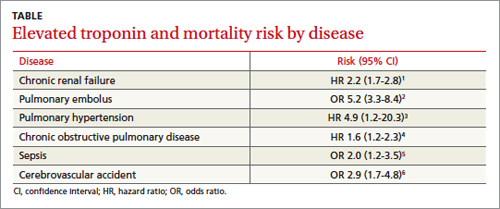
Patients with elevated troponin levels and certain conditions have a 2- to 5-fold increased risk of death, even without known cardiovascular disease.
Elevated troponin I is an independent predictor of mortality in severe sepsis
A double-blind, placebo-controlled, phase 3 trial evaluated the effect of drotrecogin alfa (activated)—withdrawn from the market in 2011—on survival of patients with severe sepsis.5 Investigators used positive troponin I levels (≥0.06 ng/mL) as a prognostic indicator of mortality. Patients who were troponin-positive had a 28-day mortality rate of 32%, compared with 14% in the troponin-negative group (P<.0001).
A bias of this study is that the patients with positive troponin levels tended to be older and more critically ill. However, in a multivariate model, troponin I still remained an independent predictor of mortality.
Elevated troponin predicts increased death risk in up to 20% of stroke patients
A systematic review of 15 trials with a total of 2901 patients evaluated the relationship between troponin levels and stroke.6 Investigators assessed the prevalence of elevated troponin in acute stroke patients, the association of elevated troponin levels with electrocardiographic changes, and the overall morbidity and mortality associated with troponin levels. Thirteen of the 15 studies used a troponin T or I level obtained within 72 hours of admission and a cut-off level of 0.1 ng/mL. The remaining 2 studies used troponin I cut-off levels >0.2 and 0.4 ng/mL.
Overall, 18% of acute stroke patients had elevated troponin levels. Studies that excluded patients with known cardiac disease had a lower prevalence of elevated levels (10% vs 22%). Patients with elevated troponin levels had an associated overall increased risk of death (OR=2.9; 95% CI, 1.7-4.8) and were 3 times more likely to have ischemic changes on electrocardiogram (OR=3.0; 95% CI, 1.5-6.2). Investigators concluded that elevated troponin levels occur in as many as one in 5 patients and are associated with an increased risk of death.
Troponin elevations may be observed in congestive heart failure, chest wall trauma, cardioversion/defibrillator shocks, rhabdomyolysis, and ultra-endurance activities.7 However, this analysis didn’t address prognostic implications of elevated troponins.
RECOMMENDATIONS
No recommendation exists for biochemical testing of troponins in various medical conditions except in the presence of signs and symptoms consistent with acute coronary syndrome. The American College of Cardiology and American Heart Association recommend routine testing of cardiac troponins in patients hospitalized for worsening congestive heart failure symptoms.8
The European Society of Cardiology recommends measuring troponin levels to further stratify risk in non-high-risk patients with confirmed pulmonary embolus.9
The National Academy of Clinical Biochemistry recommends using cardiac troponins to help define mortality risk in end-stage renal disease and critically ill patients.10
1. Havekes B, van Manen J, Krediet R, et al. Serum troponin T concentration as a predictor of mortality in hemodialysis and peritoneal dialysis patients. Am J Kidney Dis. 2006;47:823-829.
2. Becattini C, Vedovati MC, Agnelli G. Prognostic value of tropo- nins in acute pulmonary embolism. Circulation. 2007;116:427- 433.
3. Torbicki A, Kurzyna M, Kuca P, et al. Detectable serum cardiac troponin T as a marker of poor prognosis among patients with chronic precapillary pulmonary hypertension. Circulation. 2003;108:844-848.
4. Brekke PH, Omland T, Holmedal SH, et al. Troponin T eleva- tion and long-term mortality after chronic obstructive pulmo- nary disease exacerbation. Eur Respir J. 2008;31:563-570.
5. John J, Woodward DB, Wang Y, et al. Troponin I as a prog- nosticator of mortality in severe sepsis patients. J Crit Care. 2010;25:270-275.
6. Kerr G, Ray G, Wu O, et al. Elevated troponin after stroke: a sys- tematic review. Cerebrovasc Dis. 2009;28:220-226.
7. Korff S, Katus HA, Giannitsis E. Differential diagnosis of el- evated troponins. Heart. 2006;92:987-993.
8. Hunt SA, Abraham WT, Chin MH, et al. 2009 Focused update incorporated into the ACC/AHA 2005 guidelines for the diag- nosis and management of heart failure in adults. A report of the American College of Cardiology Foundation/American Heart Association Task Force on Practice Guidelines devel- oped in collaboration with the International Society for Heart and Lung Transplantation. J Am Coll Cardiol. 2009;53:e1-e90.
9. Torbicki A, Perrier A, Konstantinides S, et al. Guidelines on the diagnosis and management of acute pulmonary embolism: the Task Force for the Diagnosis and Management of Acute Pulmonary Embolism of the European Society of Cardiology. Eur Heart J. 2008;29:2276-2315.
10. Wu AH, Jaffe AS, Apple FS, et al. National Academy of Clinical Biochemistry laboratory medicine practice guidelines: use of cardiac troponin and B-type natriuretic peptide or N-terminal proB-type natriuretic peptide for etiologies other than acute coronary syndromes and heart failure. Clin Chem. 2007;53:2086-2096.
Patients with elevated troponin levels and chronic renal disease, pulmonary hypertension, pulmonary embolism, chronic obstructive pulmonary disease, sepsis, or acute ischemic stroke have a 2- to 5-fold increased risk of death, even in the absence of known cardiovascular disease (TABLE)1-6 (strength of recommendation: B, meta-analysis, multiple prospective and retrospective observational studies.)
EVIDENCE SUMMARY
To investigate the prognostic value of troponin on overall mortality, a multicenter prospective study followed 847 patients 18 years and older (mean age 59 years) with end-stage renal disease whose troponin T levels were measured 3 months from the start of peritoneal dialysis or hemodialysis until transplantation or death.1 At enrollment, 566 patients had a troponin level of ≤0.04 ng/dL, 188 had a value between 0.05 and 0.10 ng/dL, and 93 had a level of more than 0.10 ng/dL.
Using Cox regression, patients whose troponin levels were more than 0.10 ng/dL had an increased hazard ratio (HR) for all-cause mortality of 2.2 (95% confidence interval [CI], 1.7-2.8) compared with patients who had levels ≤0.04 ng/dL. Cardiovascular mortality also was higher (HR=1.9; 95% CI, 0.9-3.7) with troponin elevations, but didn’t reach statistical significance. Investigators found no significant differences in mortality risk between patients on peritoneal or hemodialysis, patients with or without a history of acute myocardial infarction, or patients who suffered cerebrovascular accidents.
Elevated troponin raises risk of death 5-fold in pulmonary embolism patients
A meta-analysis of 20 trials with a total of 1985 patients assessed the prognostic value of troponin for short-term mortality in patients admitted with acute pulmonary embolism.2 Sixteen studies (1527 patients) were prospective trials and the remainder (458 patients) were retrospective trials. Investigators obtained troponin levels for all patients at admission. They used several different troponin assays (both I and T), but most of the studies used the assay manufacturers’ cutoff points (exceeding the 99th percentile).
High troponin levels were associated with a 5-fold increased risk of short-term death, defined as in-hospital death up to 30 days after discharge (19.7% with elevated troponin vs 3.7% with normal troponin; odds ratio [OR]=5.24; 95% CI, 3.3-8.4).
Increased risk of death among those with pulmonary hypertension, COPD A prospective single-center study of 56 patients with chronic pulmonary hypertension found that the 14% of those whose troponin T was elevated (≥0.01 ng/mL) had a lower survival rate than the other patients. Patients who either had a positive troponin on initial assessment or developed troponin elevation within the 2-year follow-up period had a cumulative 24-month survival rate of 29%, compared with 81% for their troponin T-negative counterparts (P=.001).3
Patients with elevated troponin levels and certain conditions have a 2- to 5-fold increased risk of death, even without known cardiovascular disease.
Elevated troponin I is an independent predictor of mortality in severe sepsis
A double-blind, placebo-controlled, phase 3 trial evaluated the effect of drotrecogin alfa (activated)—withdrawn from the market in 2011—on survival of patients with severe sepsis.5 Investigators used positive troponin I levels (≥0.06 ng/mL) as a prognostic indicator of mortality. Patients who were troponin-positive had a 28-day mortality rate of 32%, compared with 14% in the troponin-negative group (P<.0001).
A bias of this study is that the patients with positive troponin levels tended to be older and more critically ill. However, in a multivariate model, troponin I still remained an independent predictor of mortality.
Elevated troponin predicts increased death risk in up to 20% of stroke patients
A systematic review of 15 trials with a total of 2901 patients evaluated the relationship between troponin levels and stroke.6 Investigators assessed the prevalence of elevated troponin in acute stroke patients, the association of elevated troponin levels with electrocardiographic changes, and the overall morbidity and mortality associated with troponin levels. Thirteen of the 15 studies used a troponin T or I level obtained within 72 hours of admission and a cut-off level of 0.1 ng/mL. The remaining 2 studies used troponin I cut-off levels >0.2 and 0.4 ng/mL.
Overall, 18% of acute stroke patients had elevated troponin levels. Studies that excluded patients with known cardiac disease had a lower prevalence of elevated levels (10% vs 22%). Patients with elevated troponin levels had an associated overall increased risk of death (OR=2.9; 95% CI, 1.7-4.8) and were 3 times more likely to have ischemic changes on electrocardiogram (OR=3.0; 95% CI, 1.5-6.2). Investigators concluded that elevated troponin levels occur in as many as one in 5 patients and are associated with an increased risk of death.
Troponin elevations may be observed in congestive heart failure, chest wall trauma, cardioversion/defibrillator shocks, rhabdomyolysis, and ultra-endurance activities.7 However, this analysis didn’t address prognostic implications of elevated troponins.
RECOMMENDATIONS
No recommendation exists for biochemical testing of troponins in various medical conditions except in the presence of signs and symptoms consistent with acute coronary syndrome. The American College of Cardiology and American Heart Association recommend routine testing of cardiac troponins in patients hospitalized for worsening congestive heart failure symptoms.8
The European Society of Cardiology recommends measuring troponin levels to further stratify risk in non-high-risk patients with confirmed pulmonary embolus.9
The National Academy of Clinical Biochemistry recommends using cardiac troponins to help define mortality risk in end-stage renal disease and critically ill patients.10
1. Havekes B, van Manen J, Krediet R, et al. Serum troponin T concentration as a predictor of mortality in hemodialysis and peritoneal dialysis patients. Am J Kidney Dis. 2006;47:823-829.
2. Becattini C, Vedovati MC, Agnelli G. Prognostic value of tropo- nins in acute pulmonary embolism. Circulation. 2007;116:427- 433.
3. Torbicki A, Kurzyna M, Kuca P, et al. Detectable serum cardiac troponin T as a marker of poor prognosis among patients with chronic precapillary pulmonary hypertension. Circulation. 2003;108:844-848.
4. Brekke PH, Omland T, Holmedal SH, et al. Troponin T eleva- tion and long-term mortality after chronic obstructive pulmo- nary disease exacerbation. Eur Respir J. 2008;31:563-570.
5. John J, Woodward DB, Wang Y, et al. Troponin I as a prog- nosticator of mortality in severe sepsis patients. J Crit Care. 2010;25:270-275.
6. Kerr G, Ray G, Wu O, et al. Elevated troponin after stroke: a sys- tematic review. Cerebrovasc Dis. 2009;28:220-226.
7. Korff S, Katus HA, Giannitsis E. Differential diagnosis of el- evated troponins. Heart. 2006;92:987-993.
8. Hunt SA, Abraham WT, Chin MH, et al. 2009 Focused update incorporated into the ACC/AHA 2005 guidelines for the diag- nosis and management of heart failure in adults. A report of the American College of Cardiology Foundation/American Heart Association Task Force on Practice Guidelines devel- oped in collaboration with the International Society for Heart and Lung Transplantation. J Am Coll Cardiol. 2009;53:e1-e90.
9. Torbicki A, Perrier A, Konstantinides S, et al. Guidelines on the diagnosis and management of acute pulmonary embolism: the Task Force for the Diagnosis and Management of Acute Pulmonary Embolism of the European Society of Cardiology. Eur Heart J. 2008;29:2276-2315.
10. Wu AH, Jaffe AS, Apple FS, et al. National Academy of Clinical Biochemistry laboratory medicine practice guidelines: use of cardiac troponin and B-type natriuretic peptide or N-terminal proB-type natriuretic peptide for etiologies other than acute coronary syndromes and heart failure. Clin Chem. 2007;53:2086-2096.
Evidence-based answers from the Family Physicians Inquiries Network
How should you treat a child with flat feet?
THAT DEPENDS on whether the pes planus (flatfoot) is flexible or rigid. Flexible flatfoot (FFF)—an arch that is flat only with weight bearing—usually doesn’t require treatment at all, unless it’s symptomatic. Rigid flatfoot (RFF)—a low-lying arch that persists with and without weight bearing—may require surgery.
FFF doesn’t increase the risk of injury or pain during exercise (strength of recommendation [SOR]: B, 2 small prospective cohort studies). Treating FFF with orthotics doesn’t change the course of arch development (SOR: B, 2 small randomized controlled trials [RCTs]). FFF is usually asymptomatic, but symptomatic FFF may respond to activity modification, orthoses, and stretching (SOR: C, expert opinion).
Rigid flatfoot results from trauma, neuromuscular disorders, or congenital bone malformations (SOR: C, expert opinion). Treatment may require surgery, including osteotomy and arthrodesis, depending on the underlying pathology (SOR: C, expert opinion). No long-term outcome studies of surgical treatment have been performed.
Evidence summary
Pes planus has no universal radiographic or clinical definition, although it can be classified as rigid or flexible based on the mobility of the longitudinal arch. In the absence of an accepted definition, prevalence estimates vary widely.
An Austrian survey of 835 kindergartners ages 3 to 6 years found the prevalence of FFF to be 44%; the prevalence of pathologic flatfoot was less that 1%. Flatfoot was defined by clinical inspection and laser scanning. The study also found that prevalence decreases with age (54% at 3 years, 24% at 6 years) and that boys had a higher rate of FFF (52%) than girls (36%).1
Flexible flatfoot doesn’t affect function
Ligament laxity is thought to be the primary cause of the abnormally low-lying longitudinal arch associated with weight bearing that characterizes FFF. A small (N=230) prospective cohort study showed that the foot shape of Australian military recruits was unrelated to pain, injury, and functioning during an 8-week basic training course.2
Another prospective cohort study of 246 male US Army recruits enrolled in a rigorous 12-week infantry training program found that trainees with low or flat arches actually had a lower risk of foot injury than trainees with high arches.3
Few studies evaluate FFF conservative treatment
Conservative therapies traditionally used to treat symptomatic FFF include physical therapy, orthotics, and corrective shoes. Few studies of their efficacy exist, however. Although we found no studies of adults or adolescents with symptomatic FFF, we did find a few studies of younger children with noticeably flat feet and concerned parents or physicians who referred them for therapy.
A prospective study followed 129 children with FFF (1-6 years old, mean age 29 months) who were referred by pediatricians to Texas Scottish Rite Hospital Flatfoot Clinic, which was set up entirely for the sake of the study, based on cosmetic appearance as well as functional symptoms. The children were randomized to 1 of 4 groups—controls, corrective orthopedic shoes, heel cups, and custom-molded inserts—and followed for 3 years.
The authors, who were blinded to group assignment, measured 14 outcomes related to foot shape and function. They quantified radiographic changes, not patients’ clinical or functional outcomes. All of the outcomes showed improvement in all 4 groups; no significant differences were noted between children who received active interventions and controls. Thirty-one patients were dropped from the study because of noncompliance and weren’t included in the final analysis.4
A small, randomized, single-blind controlled trial studied 160 Australian children between 7 and 11 years of age with bilateral flexible excess pronation (everted calcaneous and lowered medial transverse arch) associated with weight bearing. The investigators evaluated gross motor proficiency, self-perception, exercise efficiency, and pain over 12 months in 3 groups of children who received no treatment, noncustom orthoses, or custom-made orthoses. They found no significant difference in any outcomes measure among the groups after 3 and 12 months.5
Better results with heel cups than insoles
A small (N=30) retrospective study enrolled children (mean age 3.8 years) based on clinical and anatomical characteristics of FFF. The study found that a polyethylene “dynamic varus heel cup” worn for 14 months was superior to static insoles for treating severe pes planus, characterized by poor formation of the longitudinal arch and valgus deviation of the calcaneous. The study was not randomized or blinded, and the authors evaluated only physical examination features and radiographic findings, not patient symptoms or functional outcomes.6
Rigid flatfoot often causes symptoms
RFF is often symptomatic and is caused by underlying pathology.7 Tarsal coalition is the most common cause, but trauma, neoplasm, infection, and rheumatologic and neuromuscular disorders can all contribute. A very small retrospective study of 9 patients found that “children and adolescents with painful idiopathic rigid flatfeet…can have significant, persistent disability.”8
Surgical treatment depends on underlying pathology
No long-term studies similar to studies of FFF have compared surgery with conservative therapies for RFF. The type of surgical treatment used depends on the underlying pathology and which planes of the foot are affected.9 Surgery may include 1 or more of the following procedures, depending on clinical and radiographic evaluation:
- tendon transfers or lengthening
- tarsal arthrodeses or subtalar joint motion blockers
- calcaneal osteotomy.
Several small studies of different surgical treatments found varying degrees of radio-graphic and symptomatic improvement. None reported long-term outcome data, however.
Recommendations
A Cochrane review of interventions for pes planus is in process.
Recommendations from the Clinical Practice Guideline Pediatric Flatfoot Panel of the American College of Foot and Ankle Surgeons state that “most flexible flatfeet are physiologic, asymptomatic, and require no treatment. Physiologic flexible flatfoot follows a natural history of improvement over time. Periodic observation may be indicated to monitor for signs of progression. Treatment is generally not indicated.”9
If FFF is symptomatic, “initial treatment includes activity modifications (primarily avoiding painful activities), stretching, foot strengthening exercises, and orthoses. When all nonsurgical treatment options have been exhausted, surgical intervention can be considered.”9
Regarding RFF, the panel notes that the condition “can be symptomatic or asymptomatic. Most cases are associated with underlying primary pathology” and its treatment. “Surgical consideration should be given to those who fail to respond to nonsurgical treatment.”9 Tendon transfers and tendon lengthening are not recommended for children.
1. Pfeiffer M, Kotz R, Ledl T, et al. Prevalence of flat foot in preschool-aged children. Pediatrics. 2006;118:634-639.
2. Esterman A, Pilotto L. Foot shape and its effect on functioning in Royal Australian Air Force recruits. Part 1: prospective cohort study. Mil Med. 2005;170:623-628.
3. Cowan DN, Jones BH, Robinson JR. Foot morphologic characteristics and risk of exercise-related injury. Arch Fam Med. 1993;2:773-777.
4. Wenger DR, Mauldin D, Speck G, et al. Corrective shoes and inserts as treatment for flexible flatfoot in infants and children. J Bone Joint Surg Am. 1989;71:800-810.
5. Whitford D, Esterman A. A randomized controlled trial of two types of in-shoe orthoses in children with flexible excess pronation of the feet. Foot Ankle Int. 2007;28:715-723.
6. Capasso G. Dynamic varus heel cup: a new orthosis for treating pes planovalgus. Ital J Orthop Traumatol. 1993;19:113-123.
7. Mosier KM, Asher M. Tarsal coalitions and peroneal spastic flat foot. A review. J Bone Joint Surg Am. 1984;66:976-984.
8. Luhmann SJ, Rich MM, Schoenecker PL. Painful idiopathic rigid flatfoot in children and adolescents. Foot Ankle Int. 2000;21:59-66.
9. Harris EJ, Vanore JV, Thomas JL, et al. Diagnosis and treatment of pediatric flatfoot. J Foot Ankle Surg. 2004;43:341-373.
THAT DEPENDS on whether the pes planus (flatfoot) is flexible or rigid. Flexible flatfoot (FFF)—an arch that is flat only with weight bearing—usually doesn’t require treatment at all, unless it’s symptomatic. Rigid flatfoot (RFF)—a low-lying arch that persists with and without weight bearing—may require surgery.
FFF doesn’t increase the risk of injury or pain during exercise (strength of recommendation [SOR]: B, 2 small prospective cohort studies). Treating FFF with orthotics doesn’t change the course of arch development (SOR: B, 2 small randomized controlled trials [RCTs]). FFF is usually asymptomatic, but symptomatic FFF may respond to activity modification, orthoses, and stretching (SOR: C, expert opinion).
Rigid flatfoot results from trauma, neuromuscular disorders, or congenital bone malformations (SOR: C, expert opinion). Treatment may require surgery, including osteotomy and arthrodesis, depending on the underlying pathology (SOR: C, expert opinion). No long-term outcome studies of surgical treatment have been performed.
Evidence summary
Pes planus has no universal radiographic or clinical definition, although it can be classified as rigid or flexible based on the mobility of the longitudinal arch. In the absence of an accepted definition, prevalence estimates vary widely.
An Austrian survey of 835 kindergartners ages 3 to 6 years found the prevalence of FFF to be 44%; the prevalence of pathologic flatfoot was less that 1%. Flatfoot was defined by clinical inspection and laser scanning. The study also found that prevalence decreases with age (54% at 3 years, 24% at 6 years) and that boys had a higher rate of FFF (52%) than girls (36%).1
Flexible flatfoot doesn’t affect function
Ligament laxity is thought to be the primary cause of the abnormally low-lying longitudinal arch associated with weight bearing that characterizes FFF. A small (N=230) prospective cohort study showed that the foot shape of Australian military recruits was unrelated to pain, injury, and functioning during an 8-week basic training course.2
Another prospective cohort study of 246 male US Army recruits enrolled in a rigorous 12-week infantry training program found that trainees with low or flat arches actually had a lower risk of foot injury than trainees with high arches.3
Few studies evaluate FFF conservative treatment
Conservative therapies traditionally used to treat symptomatic FFF include physical therapy, orthotics, and corrective shoes. Few studies of their efficacy exist, however. Although we found no studies of adults or adolescents with symptomatic FFF, we did find a few studies of younger children with noticeably flat feet and concerned parents or physicians who referred them for therapy.
A prospective study followed 129 children with FFF (1-6 years old, mean age 29 months) who were referred by pediatricians to Texas Scottish Rite Hospital Flatfoot Clinic, which was set up entirely for the sake of the study, based on cosmetic appearance as well as functional symptoms. The children were randomized to 1 of 4 groups—controls, corrective orthopedic shoes, heel cups, and custom-molded inserts—and followed for 3 years.
The authors, who were blinded to group assignment, measured 14 outcomes related to foot shape and function. They quantified radiographic changes, not patients’ clinical or functional outcomes. All of the outcomes showed improvement in all 4 groups; no significant differences were noted between children who received active interventions and controls. Thirty-one patients were dropped from the study because of noncompliance and weren’t included in the final analysis.4
A small, randomized, single-blind controlled trial studied 160 Australian children between 7 and 11 years of age with bilateral flexible excess pronation (everted calcaneous and lowered medial transverse arch) associated with weight bearing. The investigators evaluated gross motor proficiency, self-perception, exercise efficiency, and pain over 12 months in 3 groups of children who received no treatment, noncustom orthoses, or custom-made orthoses. They found no significant difference in any outcomes measure among the groups after 3 and 12 months.5
Better results with heel cups than insoles
A small (N=30) retrospective study enrolled children (mean age 3.8 years) based on clinical and anatomical characteristics of FFF. The study found that a polyethylene “dynamic varus heel cup” worn for 14 months was superior to static insoles for treating severe pes planus, characterized by poor formation of the longitudinal arch and valgus deviation of the calcaneous. The study was not randomized or blinded, and the authors evaluated only physical examination features and radiographic findings, not patient symptoms or functional outcomes.6
Rigid flatfoot often causes symptoms
RFF is often symptomatic and is caused by underlying pathology.7 Tarsal coalition is the most common cause, but trauma, neoplasm, infection, and rheumatologic and neuromuscular disorders can all contribute. A very small retrospective study of 9 patients found that “children and adolescents with painful idiopathic rigid flatfeet…can have significant, persistent disability.”8
Surgical treatment depends on underlying pathology
No long-term studies similar to studies of FFF have compared surgery with conservative therapies for RFF. The type of surgical treatment used depends on the underlying pathology and which planes of the foot are affected.9 Surgery may include 1 or more of the following procedures, depending on clinical and radiographic evaluation:
- tendon transfers or lengthening
- tarsal arthrodeses or subtalar joint motion blockers
- calcaneal osteotomy.
Several small studies of different surgical treatments found varying degrees of radio-graphic and symptomatic improvement. None reported long-term outcome data, however.
Recommendations
A Cochrane review of interventions for pes planus is in process.
Recommendations from the Clinical Practice Guideline Pediatric Flatfoot Panel of the American College of Foot and Ankle Surgeons state that “most flexible flatfeet are physiologic, asymptomatic, and require no treatment. Physiologic flexible flatfoot follows a natural history of improvement over time. Periodic observation may be indicated to monitor for signs of progression. Treatment is generally not indicated.”9
If FFF is symptomatic, “initial treatment includes activity modifications (primarily avoiding painful activities), stretching, foot strengthening exercises, and orthoses. When all nonsurgical treatment options have been exhausted, surgical intervention can be considered.”9
Regarding RFF, the panel notes that the condition “can be symptomatic or asymptomatic. Most cases are associated with underlying primary pathology” and its treatment. “Surgical consideration should be given to those who fail to respond to nonsurgical treatment.”9 Tendon transfers and tendon lengthening are not recommended for children.
1. Pfeiffer M, Kotz R, Ledl T, et al. Prevalence of flat foot in preschool-aged children. Pediatrics. 2006;118:634-639.
2. Esterman A, Pilotto L. Foot shape and its effect on functioning in Royal Australian Air Force recruits. Part 1: prospective cohort study. Mil Med. 2005;170:623-628.
3. Cowan DN, Jones BH, Robinson JR. Foot morphologic characteristics and risk of exercise-related injury. Arch Fam Med. 1993;2:773-777.
4. Wenger DR, Mauldin D, Speck G, et al. Corrective shoes and inserts as treatment for flexible flatfoot in infants and children. J Bone Joint Surg Am. 1989;71:800-810.
5. Whitford D, Esterman A. A randomized controlled trial of two types of in-shoe orthoses in children with flexible excess pronation of the feet. Foot Ankle Int. 2007;28:715-723.
6. Capasso G. Dynamic varus heel cup: a new orthosis for treating pes planovalgus. Ital J Orthop Traumatol. 1993;19:113-123.
7. Mosier KM, Asher M. Tarsal coalitions and peroneal spastic flat foot. A review. J Bone Joint Surg Am. 1984;66:976-984.
8. Luhmann SJ, Rich MM, Schoenecker PL. Painful idiopathic rigid flatfoot in children and adolescents. Foot Ankle Int. 2000;21:59-66.
9. Harris EJ, Vanore JV, Thomas JL, et al. Diagnosis and treatment of pediatric flatfoot. J Foot Ankle Surg. 2004;43:341-373.
Evidence-based answers from the Family Physicians Inquiries Network
What’s the best test for renal artery stenosis in patients with refractory hypertension?
Magnetic resonance angiography (MRA) and computed tomography angiography (CTA) are the most consistently accurate, noninvasive screening methods. MRA is likely the preferred option because of its lack of radiation and reduced risk of contrast media (strength of recommendation [sor]: A, large meta-analyses).
Evidence summary
Significant renal artery stenosis (RAS) is defined anatomically as >50% stenosis of the lumen by renal angiography; stenosis is considered hemodynamically significant (potentially causing renovascular hypertension) if it exceeds 75%.1
The prevalence of renovascular hypertension among the general hypertensive population varies from 1% to 5%. The prevalence increases to 20% to 40% in the presence of certain clinical criteria:
- hypertension in patients <30 years
- worsening or sudden onset of hypertension in patients >50 years
- hypertension refractory to multiple medications
- malignant hypertension
- worsening renal function after starting an angiotensin-converting enzyme inhibitor (ACE-I).2,3 (Worsening renal function is defined as >30% decline in estimated glomerular filtration rate or >30% increase in serum creatinine during the first 2 months of ACE-I therapy.1)
Refractory hypertension associated with generalized atherosclerosis is the most predictive risk factor for RAS.
MRA is usually best, but don’t overlook ultrasound
Among the primary diagnostic tests for RAS (see TABLE W1 on page 216a), MRA is the most consistently accurate4 and least operator dependent—which makes it the best choice in most situations. One rare but serious concern with MRA is that contrast agents may cause nephrogenic systemic fibrosis (NSF), a debilitating and sometimes fatal diffuse disease affecting the skin, muscle, and internal organs. In 2006, 25 cases of NSF after exposure to gadolinium-based contrast agents were reported, prompting an FDA warning.5
Kidney duplex Doppler ultrasound can rival MRA and CTA in accuracy, but is highly operator dependent. If access to highly skilled, experienced technicians is available, this safe and less expensive option can be considered, especially for patients with chronic kidney disease.
TABLE W1
Diagnostic tests for renovascular hypertension
| TEST | COMPOSITE RATING | SENSITIVITY | SPECIFICITY | SPECIAL CONSIDERATIONS |
|---|---|---|---|---|
| MRA | 1 | 94%-97%4 | 85%-93%4 | No radiation; expensive; small risk of nephrogenic systemic fibrosis from gadolinium contrast agents |
| CTA | 2 | 88%-96%3 | 77%-98%3 | Similar accuracy to MrA; moderate radiation exposure; requires iodinated contrast media |
| US duplex Doppler | 3 | 0%-90%3 | 95%3 | Noninvasive; highly operator dependent |
| ACE-I renography/scintography | 4 | 58%-95%2 | 17%-100%2 | Noninvasive; can be used in renal insufficiency; high radiation exposure; literature is not uniform regarding techniques and interpretation criteria |
| Invasive arteriography | 5 | — | — | Gold standard; invasive; better used as confirmation than screening |
| Invasive renal vein renin assays | 6 | 65%-74%3 | 100%3 | Good confirmatory test; invasive; possibility of sampling error |
Recommendations
The American College of Radiology recommends stratifying patients into 3 groups:
- high index of suspicion with normal renal function
- high index of suspicion with diminished renal function
- low index of suspicion.
Recommendations include:
- MRA or CTA for high suspicion with normal renal function
- MRA or ultrasonography for high suspicion with impaired renal function
- All methods equally inappropriate if suspicion is low.3
Cost-effectiveness was not evaluated in the meta-analysis used to derive the guidelines.
The National Kidney Foundation recommends MRA and CTA as accurate, noninvasive, and consistent means of diagnosing RAS. The foundation also recommends duplex ultrasonography as a less invasive and less expensive alternative when local expertise is available. The guidelines include a moderately predictive rule for identifying patients who should be screened for renovascular hypertension—that is, patients with intermediate or high pretest probability (www.kidney.org/professionals/kdoqi/guidelines_bp/guide_4.htm).1
The American College of Cardiology and the American Heart Association list advantages and disadvantages of each diagnostic method and recommend choosing the one that is best suited to the patient.6
Acknowledgements
The opinions and assertions contained herein are the private view of the authors and are not to be construed as official, or as reflecting the view of the US Air Force Medical service or the US Air Force at large.
1. National Kidney Foundation KDOQI Clinical Practice Guidelines on Hypertension and Antihypertensive Agents in Chronic Kidney Disease. Guideline 4: evaluation for renal Artery Disease. 2004. Available at: www.kidney.org/professionals/Kdoqi/guidelines_bp/guide_4.htm. Accessed July 28, 2008.
2. Vasbinder GB, Nelemans PJ, Kessels AG, et al. Diagnostic tests for renal artery stenosis in patients suspected of having renovascular hypertension: a meta-analysis. Ann Intern Med. 2001;135:401-411.
3. Kawashima A, Francis Ir, Baumgarten DA, et al. for the expert panel on urologic Imaging Reno-vascular Hypertension. 2007. Available at: www.guideline.gov/summary/summary.aspx?view_id=1&doc_id=11590. Accessed July 28, 2008.
4. Tan KT, van Beek EJ, Brown PW, et al. Magnetic resonance angiography for the diagnosis or renal artery stenosis: a meta-analysis. Clin Radiol. 2002;57:617-624.
5. Us Food and Drug Administration Information for Healthcare Professionals. Gadolinium-Based Contrast Agents for Magnetic Resonance Imaging. Available at: www.fda.gov/cder/drug/Infosheets/HCp/gcca_200705.htm. Accessed July 28, 2008.
6. Hirsch AT, Haskal ZJ, Hertzer NR, et al. American College of Cardiology/American Heart Association 2005 Guidelines for the Management of Patients with Peripheral Arterial Disease (Lower Extremity, Renal, Mesenteric, and Abdominal Aortic): A Collaborative Report. 2005. Available at: www.guideline.gov/summary/summary.aspx?doc_id=8503&nbr=004740&string=Hirsch. Accessed July 28, 2008.
Magnetic resonance angiography (MRA) and computed tomography angiography (CTA) are the most consistently accurate, noninvasive screening methods. MRA is likely the preferred option because of its lack of radiation and reduced risk of contrast media (strength of recommendation [sor]: A, large meta-analyses).
Evidence summary
Significant renal artery stenosis (RAS) is defined anatomically as >50% stenosis of the lumen by renal angiography; stenosis is considered hemodynamically significant (potentially causing renovascular hypertension) if it exceeds 75%.1
The prevalence of renovascular hypertension among the general hypertensive population varies from 1% to 5%. The prevalence increases to 20% to 40% in the presence of certain clinical criteria:
- hypertension in patients <30 years
- worsening or sudden onset of hypertension in patients >50 years
- hypertension refractory to multiple medications
- malignant hypertension
- worsening renal function after starting an angiotensin-converting enzyme inhibitor (ACE-I).2,3 (Worsening renal function is defined as >30% decline in estimated glomerular filtration rate or >30% increase in serum creatinine during the first 2 months of ACE-I therapy.1)
Refractory hypertension associated with generalized atherosclerosis is the most predictive risk factor for RAS.
MRA is usually best, but don’t overlook ultrasound
Among the primary diagnostic tests for RAS (see TABLE W1 on page 216a), MRA is the most consistently accurate4 and least operator dependent—which makes it the best choice in most situations. One rare but serious concern with MRA is that contrast agents may cause nephrogenic systemic fibrosis (NSF), a debilitating and sometimes fatal diffuse disease affecting the skin, muscle, and internal organs. In 2006, 25 cases of NSF after exposure to gadolinium-based contrast agents were reported, prompting an FDA warning.5
Kidney duplex Doppler ultrasound can rival MRA and CTA in accuracy, but is highly operator dependent. If access to highly skilled, experienced technicians is available, this safe and less expensive option can be considered, especially for patients with chronic kidney disease.
TABLE W1
Diagnostic tests for renovascular hypertension
| TEST | COMPOSITE RATING | SENSITIVITY | SPECIFICITY | SPECIAL CONSIDERATIONS |
|---|---|---|---|---|
| MRA | 1 | 94%-97%4 | 85%-93%4 | No radiation; expensive; small risk of nephrogenic systemic fibrosis from gadolinium contrast agents |
| CTA | 2 | 88%-96%3 | 77%-98%3 | Similar accuracy to MrA; moderate radiation exposure; requires iodinated contrast media |
| US duplex Doppler | 3 | 0%-90%3 | 95%3 | Noninvasive; highly operator dependent |
| ACE-I renography/scintography | 4 | 58%-95%2 | 17%-100%2 | Noninvasive; can be used in renal insufficiency; high radiation exposure; literature is not uniform regarding techniques and interpretation criteria |
| Invasive arteriography | 5 | — | — | Gold standard; invasive; better used as confirmation than screening |
| Invasive renal vein renin assays | 6 | 65%-74%3 | 100%3 | Good confirmatory test; invasive; possibility of sampling error |
Recommendations
The American College of Radiology recommends stratifying patients into 3 groups:
- high index of suspicion with normal renal function
- high index of suspicion with diminished renal function
- low index of suspicion.
Recommendations include:
- MRA or CTA for high suspicion with normal renal function
- MRA or ultrasonography for high suspicion with impaired renal function
- All methods equally inappropriate if suspicion is low.3
Cost-effectiveness was not evaluated in the meta-analysis used to derive the guidelines.
The National Kidney Foundation recommends MRA and CTA as accurate, noninvasive, and consistent means of diagnosing RAS. The foundation also recommends duplex ultrasonography as a less invasive and less expensive alternative when local expertise is available. The guidelines include a moderately predictive rule for identifying patients who should be screened for renovascular hypertension—that is, patients with intermediate or high pretest probability (www.kidney.org/professionals/kdoqi/guidelines_bp/guide_4.htm).1
The American College of Cardiology and the American Heart Association list advantages and disadvantages of each diagnostic method and recommend choosing the one that is best suited to the patient.6
Acknowledgements
The opinions and assertions contained herein are the private view of the authors and are not to be construed as official, or as reflecting the view of the US Air Force Medical service or the US Air Force at large.
1. National Kidney Foundation KDOQI Clinical Practice Guidelines on Hypertension and Antihypertensive Agents in Chronic Kidney Disease. Guideline 4: evaluation for renal Artery Disease. 2004. Available at: www.kidney.org/professionals/Kdoqi/guidelines_bp/guide_4.htm. Accessed July 28, 2008.
2. Vasbinder GB, Nelemans PJ, Kessels AG, et al. Diagnostic tests for renal artery stenosis in patients suspected of having renovascular hypertension: a meta-analysis. Ann Intern Med. 2001;135:401-411.
3. Kawashima A, Francis Ir, Baumgarten DA, et al. for the expert panel on urologic Imaging Reno-vascular Hypertension. 2007. Available at: www.guideline.gov/summary/summary.aspx?view_id=1&doc_id=11590. Accessed July 28, 2008.
4. Tan KT, van Beek EJ, Brown PW, et al. Magnetic resonance angiography for the diagnosis or renal artery stenosis: a meta-analysis. Clin Radiol. 2002;57:617-624.
5. Us Food and Drug Administration Information for Healthcare Professionals. Gadolinium-Based Contrast Agents for Magnetic Resonance Imaging. Available at: www.fda.gov/cder/drug/Infosheets/HCp/gcca_200705.htm. Accessed July 28, 2008.
6. Hirsch AT, Haskal ZJ, Hertzer NR, et al. American College of Cardiology/American Heart Association 2005 Guidelines for the Management of Patients with Peripheral Arterial Disease (Lower Extremity, Renal, Mesenteric, and Abdominal Aortic): A Collaborative Report. 2005. Available at: www.guideline.gov/summary/summary.aspx?doc_id=8503&nbr=004740&string=Hirsch. Accessed July 28, 2008.
Evidence-based answers from the Family Physicians Inquiries Network
Does bed rest for preeclampsia improve neonatal outcomes?
No. strict bed rest in the hospital for pregnant women with preeclampsia does not appear to lower rates of perinatal mortality, neonatal mortality, or neonatal morbidity, including preterm birth, endotracheal intubations, or neonatal intensive care unit (NICU) admissions (strength of recommendation: B, based on 2 randomized controlled trials [RCT] and extrapolations from 2 RCTs of pregnant patients with nonproteinuric hypertension).
Ronald Januchowski, MD
Spartanburg Regional Medical Center, Spartanburg, SC
Changing long-standing practices is always a challenge We’ve said goodbye to magnesium for preterm labor, and now it looks like bed rest for preeclampsia is not far behind. Changing long-standing practices in response to stronger evidence-based information is always a challenge, especially when we’ve been relying on long-standing expert opinion or anecdotal evidence. Following these recommendations will be another challenge for us, even though we consider the relationship we have with our obstetrical nurses and physicians to be a good one.
Our plan to introduce these modifications will follow previous successful plans; the member of our group with the most “capital” in Obstetrics can bring others on board.
Evidence summary
Ten percent of preeclampsia occurs in pregnancies at less than 34 weeks of gestation. Traditionally, physicians often recommended bed rest to preterm, preeclamptic patients in the belief that it would improve neonatal outcomes.
RCTs find no difference between bed rest and ad lib movement
A single-center RCT investigated bed rest treatment for 105 patients with preeclampsia and gestational ages between 26 to 38 weeks. Patients were assigned to either strict bed rest with bathroom privileges in the hospital until delivery, or to bed rest with the ability to move freely around the hospital. Outcome assessors were not blinded to patient treatment allocation. There was no statistical difference between the 2 groups in perinatal or neonatal mortality, or in the neonatal morbidities of preterm births, endotracheal intubations, or NICU admissions.1
Similarly, a small, unblinded RCT of 40 preeclamptic patients treated in the hospital with strict bed confinement or without restrictions found no significant difference in fetal or perinatal mortality.2 No power calculations were reported for detecting differences in neonatal outcome rates in either of these studies.
Studies in nonproteinuric hypertension were no different
In addition to the studies in patients with preeclampsia, 2 RCTs measured neonatal outcomes with bed rest compared with normal activity in pregnancies complicated by nonproteinuric hypertension. These studies also found that bed rest did not improve neonatal outcomes.
The first trial was a multicenter RCT involving 218 patients between 28 to 38 weeks gestation with nonproteinuric hypertension (blood pressure >140/90 mm Hg). The patients were randomized to 2 groups: bed rest in the hospital but allowed to move around the ward, and normal activity at home without restrictions. The outcomes were measured by masked assessors. There were no statistical differences in perinatal or neonatal mortality, or in the neonatal morbidities of preterm birth, newborns small for their gestational age, or NICU admissions between the 2 groups.3
A second RCT of 135 nonproteinuric but hypertensive pregnant patients with diastolic blood pressures between 90 and 109 mm Hg also demonstrated no difference between patients treated with bed rest and sedation or normal activity in fetal or neonatal outcomes.4
Recommendations from others
An American College of Obstetrics and Gynecology practice bulletin on diagnosis and management of preeclampsia and eclampsia does not mention bed rest.5 The Canadian Hypertension Society Consensus Conference in 1997 stated that a “policy of hospital admission and strict bed rest is not advised for gestational hypertension with or without proteinuria.”6
1. Meher S, Abalos E, Carroli G. Bed rest with or without hospitalisation for hypertension during pregnancy. Cochrane Database Syst Rev 2005;CD(4):003-514.
2. Matthews DD, Agarwal V, Shuttleworth TP. A randomized controlled trial of complete bed rest versus ambulation in the management of proteinuric hypertension during pregnancy. Br J Obstet Gynecol 1982;89:128-131.
3. Crowther CA, Bouwmeester Am, Ashurst Hm. Does admission to hospital for bed rest prevent disease progression or improve fetal outcome in pregnancy complicated by non-proteinuric hyper-tension? Br J Obstet Gynecol 1992;99:13-17.
4. Matthews DD. A randomized controlled trial of bed rest and sedation or normal activity and non-sedation in the management of non-albuminuric hypertension in late pregnancy. Br J Obstet Gynecol 1977;84:108-114.
5. Diagnosis and management of preeclampsia and eclampsia. American College of obstetrics and Gynecology (ACoG) Practice bulletin, No. 33. Obstet Gynecol 2002;99:159-67.
6. Report of the Canadian Hypertension society Consensus Conference: Nonpharmacologic management and prevention of hypertensive disorders in pregnancy. Can Med Assoc J 1997;157:907-919.
No. strict bed rest in the hospital for pregnant women with preeclampsia does not appear to lower rates of perinatal mortality, neonatal mortality, or neonatal morbidity, including preterm birth, endotracheal intubations, or neonatal intensive care unit (NICU) admissions (strength of recommendation: B, based on 2 randomized controlled trials [RCT] and extrapolations from 2 RCTs of pregnant patients with nonproteinuric hypertension).
Ronald Januchowski, MD
Spartanburg Regional Medical Center, Spartanburg, SC
Changing long-standing practices is always a challenge We’ve said goodbye to magnesium for preterm labor, and now it looks like bed rest for preeclampsia is not far behind. Changing long-standing practices in response to stronger evidence-based information is always a challenge, especially when we’ve been relying on long-standing expert opinion or anecdotal evidence. Following these recommendations will be another challenge for us, even though we consider the relationship we have with our obstetrical nurses and physicians to be a good one.
Our plan to introduce these modifications will follow previous successful plans; the member of our group with the most “capital” in Obstetrics can bring others on board.
Evidence summary
Ten percent of preeclampsia occurs in pregnancies at less than 34 weeks of gestation. Traditionally, physicians often recommended bed rest to preterm, preeclamptic patients in the belief that it would improve neonatal outcomes.
RCTs find no difference between bed rest and ad lib movement
A single-center RCT investigated bed rest treatment for 105 patients with preeclampsia and gestational ages between 26 to 38 weeks. Patients were assigned to either strict bed rest with bathroom privileges in the hospital until delivery, or to bed rest with the ability to move freely around the hospital. Outcome assessors were not blinded to patient treatment allocation. There was no statistical difference between the 2 groups in perinatal or neonatal mortality, or in the neonatal morbidities of preterm births, endotracheal intubations, or NICU admissions.1
Similarly, a small, unblinded RCT of 40 preeclamptic patients treated in the hospital with strict bed confinement or without restrictions found no significant difference in fetal or perinatal mortality.2 No power calculations were reported for detecting differences in neonatal outcome rates in either of these studies.
Studies in nonproteinuric hypertension were no different
In addition to the studies in patients with preeclampsia, 2 RCTs measured neonatal outcomes with bed rest compared with normal activity in pregnancies complicated by nonproteinuric hypertension. These studies also found that bed rest did not improve neonatal outcomes.
The first trial was a multicenter RCT involving 218 patients between 28 to 38 weeks gestation with nonproteinuric hypertension (blood pressure >140/90 mm Hg). The patients were randomized to 2 groups: bed rest in the hospital but allowed to move around the ward, and normal activity at home without restrictions. The outcomes were measured by masked assessors. There were no statistical differences in perinatal or neonatal mortality, or in the neonatal morbidities of preterm birth, newborns small for their gestational age, or NICU admissions between the 2 groups.3
A second RCT of 135 nonproteinuric but hypertensive pregnant patients with diastolic blood pressures between 90 and 109 mm Hg also demonstrated no difference between patients treated with bed rest and sedation or normal activity in fetal or neonatal outcomes.4
Recommendations from others
An American College of Obstetrics and Gynecology practice bulletin on diagnosis and management of preeclampsia and eclampsia does not mention bed rest.5 The Canadian Hypertension Society Consensus Conference in 1997 stated that a “policy of hospital admission and strict bed rest is not advised for gestational hypertension with or without proteinuria.”6
1. Meher S, Abalos E, Carroli G. Bed rest with or without hospitalisation for hypertension during pregnancy. Cochrane Database Syst Rev 2005;CD(4):003-514.
2. Matthews DD, Agarwal V, Shuttleworth TP. A randomized controlled trial of complete bed rest versus ambulation in the management of proteinuric hypertension during pregnancy. Br J Obstet Gynecol 1982;89:128-131.
3. Crowther CA, Bouwmeester Am, Ashurst Hm. Does admission to hospital for bed rest prevent disease progression or improve fetal outcome in pregnancy complicated by non-proteinuric hyper-tension? Br J Obstet Gynecol 1992;99:13-17.
4. Matthews DD. A randomized controlled trial of bed rest and sedation or normal activity and non-sedation in the management of non-albuminuric hypertension in late pregnancy. Br J Obstet Gynecol 1977;84:108-114.
5. Diagnosis and management of preeclampsia and eclampsia. American College of obstetrics and Gynecology (ACoG) Practice bulletin, No. 33. Obstet Gynecol 2002;99:159-67.
6. Report of the Canadian Hypertension society Consensus Conference: Nonpharmacologic management and prevention of hypertensive disorders in pregnancy. Can Med Assoc J 1997;157:907-919.
Evidence-based answers from the Family Physicians Inquiries Network
Who should receive vertebroplasty?
Percutaneous vertebroplasty has been used to treat aggressive vertebral hemangiomas, osteoporotic vertebral compression fractures, and vertebral lesions from metastatic disease or myeloma. Consider it for patients with severe acute or chronic pain related to one of these lesions who have failed a reasonable course of medical therapy (strength of recommendation [SOR]: B, based on structured reviews of observational studies). Contraindications include an uncorrectable coagulation disorder, infection in the area, spinal cord compression, destruction of the posterior wall of the vertebral body, and severe degrees of vertebral body collapse (SOR: B, based on structured reviews of observational studies). Pain relief from vertebroplasty for osteoporotic vertebral fractures may be less for older fractures (SOR: C).
Long-term sequelae of this procedure are unknown, so proceed with caution
James T. Birch, Jr, MD
Department of Family and Community Medicine, University of Missouri–Columbia
Vertebroplasty appears to be becoming the standard of care for back pain due to compression fractures. It has become the next step, in the absence of contraindications, when conservative measures fail. The long-term sequelae of this relatively new procedure are unknown, so it is prudent to proceed with caution. I am following a few patients who have had this procedure due to osteoporotic vertebral fractures and back pain. All are living remarkably pain-free lives.
Future studies should probably be focused on the best types and the appropriate amount of bone cement to inject for relief of pain symptoms and minimize leakage. Another important study would involve comparing the clinical outcomes and long-term complications for patients who have had vertebroplasty vs kyphoplasty.
Evidence summary
No randomized controlled trials have been published regarding percutaneous vertebroplasty. A 2005 Technology Assessment by the Centers for Medicare and Medicaid Services (CMS) provides the best evidence about indications and efficacy of percutaneous vertebroplasty for vertebral fractures.1 The CMS report is based on a search of Medline and Current Contents through April 2005 for relevant studies, along with hand searches of retrieved articles’ references and of recent pertinent journals. Study inclusion criteria included English language, vertebral fractures due to osteoporosis or malignancy, consecutive patient enrollment, outcomes reported for pain, functional status, and quality of life, and study size ≥20 patients for studies of osteoporosis or ≥10 patients for studies of malignancy. There was no description of a formal study validity assessment or attempts to control bias by use of multiple reviewers.
Fifteen studies were included, representing 1056 patients. Fourteen of the studies were observational and 1 was a nonrandomized controlled trial. The common inclusion requirement was severe pain attributable to vertebral fracture. Nine of the studies further specified failure of analgesics or conservative treatments. The studies showed statistically significant decreases in comparative visual analog pain scale scores in the short term. Four studies showed pain reduction lasting up to 1 year. These results favor the conclusion that percutaneous vertebroplasty provides short- and long-term pain reduction for patients meeting the inclusion criteria. However, the lack of randomized trials cannot control for the placebo effect, the natural history of vertebral fractures, and regression to the mean as possible reasons for the apparent efficacy of percutaneous vertebroplasty.
Two structured, but not systematic, reviews of percutaneous vertebroplasty in vertebral fractures2,3 included 15 small observational studies, of which only 1 was included in the CMS report. These reviews examined outcomes of vertebroplasty performed from less than 1 month to a mean of 7 months after fracture, using similar inclusion criteria to those used in the CMS report. The studies’ common patient exclusion criteria were uncorrectable coagulation disorder, infection in the area, spinal cord compression, destruction of the posterior vertebral wall, and severe degrees of vertebral body collapse (defined as >67% collapse). The 2 reviews found between 67% and 100% of patients reported pain reduction after vertebroplasty in follow-up periods ranging from 24 hours to up to 10 years. Based on this limited evidence, 1 review suggested that the likelihood of alleviation of pain decreases over time and is low for fractures occurring more than 6 months in the past.3 In contradistinction, 3 subsequent observational studies, involving a total of 233 patients with 365 vertebral compression fractures failed to find an association between postprocedural pain and age of fracture (ranging from less than 2 weeks to more than 24 months from injury).4-6
Recommendations from others
In their guideline on rehabilitation of the patient with osteoporosis, the National Osteoporosis Foundation states an experienced practitioner may perform percutaneous vertebroplasty on a patient with unremitting pain for whom conservative medical therapy has not helped.7 They qualify this recommendation by further stating long-term clinical studies are required before vertebroplasty becomes standard of care. The Medicare Coverage Advisory Committee, in its review of the 2005 CMS report, suggested that percutaneous vertebroplasty produces a clinically important net health benefit for patients with vertebral compression fracture compared to conservative care for both acute and chronic fractures.8
1. Percutaneous vertebroplasty for vertebral fractures caused by osteoporosis and malignancy: Technology assessment. Baltimore, Md: Centers for Medicare and Medicaid Services; last updated 2005. Available at: www.cms.hhs.gov/mcd/viewtechassess.asp?where=index&tid=26. Accessed on June 8, 2006.
2. Levine SA, Perin LA, Hayes D, Hayes WS. An evidence-based evaluation of percutaneous vertebroplasty. Manag Care 2000;9:56-60, 63.
3. Watts NB, Harris ST, Genant HK. Treatment of painful osteoporotic vertebral fractures with percutaneous vertebroplasty or kyphoplasty. Osteoporos Int 2001;12:429-437.
4. Kaufmann TJ, Jensen ME, Schweickert PA, Marx WF, Kallmes DF. Age of fracture and clinical outcomes of percutaneous vertebroplasty. AJNR Am J Neuroradiol 2001;22:1860-1863.
5. Brown DB, Gilula LA, Sehgal M, Shimony JS. Treatment of chronic symptomatic vertebral compression fractures with percutaneous vertebroplasty. AJR Am J Roentgenol 2004;182:319-322.
6. Yu SW, Lee PC, Ma CH, Chuang TY, Chen YJ. Vertebroplasty for the treatment of osteoporotic compression spinal fracture: comparison of remedial action at different stages of injury. J Trauma 2004;56:629-632.
7. Bonner FJ, Sinaki M, Grabois M, et al. Health professional’s guide to rehabilitation of the patient with osteoporosis. Osteoporos Int 2003;14(Suppl 2):S1-S22.
8. Treatment for vertebral body compression fracture. Medicare Coverage Advisory Committee Meeting May 5, 2005. Baltimore, Md: Centers for Medicare and Medicaid Services;last updated 2005. Available at: www.cms.hhs.gov/mcd/viewmcac.asp?where=index&mid=29. Accessed on June 8, 2006.
Percutaneous vertebroplasty has been used to treat aggressive vertebral hemangiomas, osteoporotic vertebral compression fractures, and vertebral lesions from metastatic disease or myeloma. Consider it for patients with severe acute or chronic pain related to one of these lesions who have failed a reasonable course of medical therapy (strength of recommendation [SOR]: B, based on structured reviews of observational studies). Contraindications include an uncorrectable coagulation disorder, infection in the area, spinal cord compression, destruction of the posterior wall of the vertebral body, and severe degrees of vertebral body collapse (SOR: B, based on structured reviews of observational studies). Pain relief from vertebroplasty for osteoporotic vertebral fractures may be less for older fractures (SOR: C).
Long-term sequelae of this procedure are unknown, so proceed with caution
James T. Birch, Jr, MD
Department of Family and Community Medicine, University of Missouri–Columbia
Vertebroplasty appears to be becoming the standard of care for back pain due to compression fractures. It has become the next step, in the absence of contraindications, when conservative measures fail. The long-term sequelae of this relatively new procedure are unknown, so it is prudent to proceed with caution. I am following a few patients who have had this procedure due to osteoporotic vertebral fractures and back pain. All are living remarkably pain-free lives.
Future studies should probably be focused on the best types and the appropriate amount of bone cement to inject for relief of pain symptoms and minimize leakage. Another important study would involve comparing the clinical outcomes and long-term complications for patients who have had vertebroplasty vs kyphoplasty.
Evidence summary
No randomized controlled trials have been published regarding percutaneous vertebroplasty. A 2005 Technology Assessment by the Centers for Medicare and Medicaid Services (CMS) provides the best evidence about indications and efficacy of percutaneous vertebroplasty for vertebral fractures.1 The CMS report is based on a search of Medline and Current Contents through April 2005 for relevant studies, along with hand searches of retrieved articles’ references and of recent pertinent journals. Study inclusion criteria included English language, vertebral fractures due to osteoporosis or malignancy, consecutive patient enrollment, outcomes reported for pain, functional status, and quality of life, and study size ≥20 patients for studies of osteoporosis or ≥10 patients for studies of malignancy. There was no description of a formal study validity assessment or attempts to control bias by use of multiple reviewers.
Fifteen studies were included, representing 1056 patients. Fourteen of the studies were observational and 1 was a nonrandomized controlled trial. The common inclusion requirement was severe pain attributable to vertebral fracture. Nine of the studies further specified failure of analgesics or conservative treatments. The studies showed statistically significant decreases in comparative visual analog pain scale scores in the short term. Four studies showed pain reduction lasting up to 1 year. These results favor the conclusion that percutaneous vertebroplasty provides short- and long-term pain reduction for patients meeting the inclusion criteria. However, the lack of randomized trials cannot control for the placebo effect, the natural history of vertebral fractures, and regression to the mean as possible reasons for the apparent efficacy of percutaneous vertebroplasty.
Two structured, but not systematic, reviews of percutaneous vertebroplasty in vertebral fractures2,3 included 15 small observational studies, of which only 1 was included in the CMS report. These reviews examined outcomes of vertebroplasty performed from less than 1 month to a mean of 7 months after fracture, using similar inclusion criteria to those used in the CMS report. The studies’ common patient exclusion criteria were uncorrectable coagulation disorder, infection in the area, spinal cord compression, destruction of the posterior vertebral wall, and severe degrees of vertebral body collapse (defined as >67% collapse). The 2 reviews found between 67% and 100% of patients reported pain reduction after vertebroplasty in follow-up periods ranging from 24 hours to up to 10 years. Based on this limited evidence, 1 review suggested that the likelihood of alleviation of pain decreases over time and is low for fractures occurring more than 6 months in the past.3 In contradistinction, 3 subsequent observational studies, involving a total of 233 patients with 365 vertebral compression fractures failed to find an association between postprocedural pain and age of fracture (ranging from less than 2 weeks to more than 24 months from injury).4-6
Recommendations from others
In their guideline on rehabilitation of the patient with osteoporosis, the National Osteoporosis Foundation states an experienced practitioner may perform percutaneous vertebroplasty on a patient with unremitting pain for whom conservative medical therapy has not helped.7 They qualify this recommendation by further stating long-term clinical studies are required before vertebroplasty becomes standard of care. The Medicare Coverage Advisory Committee, in its review of the 2005 CMS report, suggested that percutaneous vertebroplasty produces a clinically important net health benefit for patients with vertebral compression fracture compared to conservative care for both acute and chronic fractures.8
1. Percutaneous vertebroplasty for vertebral fractures caused by osteoporosis and malignancy: Technology assessment. Baltimore, Md: Centers for Medicare and Medicaid Services; last updated 2005. Available at: www.cms.hhs.gov/mcd/viewtechassess.asp?where=index&tid=26. Accessed on June 8, 2006.
2. Levine SA, Perin LA, Hayes D, Hayes WS. An evidence-based evaluation of percutaneous vertebroplasty. Manag Care 2000;9:56-60, 63.
3. Watts NB, Harris ST, Genant HK. Treatment of painful osteoporotic vertebral fractures with percutaneous vertebroplasty or kyphoplasty. Osteoporos Int 2001;12:429-437.
4. Kaufmann TJ, Jensen ME, Schweickert PA, Marx WF, Kallmes DF. Age of fracture and clinical outcomes of percutaneous vertebroplasty. AJNR Am J Neuroradiol 2001;22:1860-1863.
5. Brown DB, Gilula LA, Sehgal M, Shimony JS. Treatment of chronic symptomatic vertebral compression fractures with percutaneous vertebroplasty. AJR Am J Roentgenol 2004;182:319-322.
6. Yu SW, Lee PC, Ma CH, Chuang TY, Chen YJ. Vertebroplasty for the treatment of osteoporotic compression spinal fracture: comparison of remedial action at different stages of injury. J Trauma 2004;56:629-632.
7. Bonner FJ, Sinaki M, Grabois M, et al. Health professional’s guide to rehabilitation of the patient with osteoporosis. Osteoporos Int 2003;14(Suppl 2):S1-S22.
8. Treatment for vertebral body compression fracture. Medicare Coverage Advisory Committee Meeting May 5, 2005. Baltimore, Md: Centers for Medicare and Medicaid Services;last updated 2005. Available at: www.cms.hhs.gov/mcd/viewmcac.asp?where=index&mid=29. Accessed on June 8, 2006.
Evidence-based answers from the Family Physicians Inquiries Network
What physical exam techniques are useful to detect malingering?
No examination technique objectively proves malingering (strength of recommendation [SOR]: C, expert opinion). Waddell’s signs are associated with poor treatment outcomes but cannot discriminate organic from nonorganic causes (SOR: B, systematic review of low-quality studies). Hoover’s and the Abductor sign indicate nonorganic paralysis (SOR: C, small, lower-quality case-control studies) (TABLE 1).
Meticulous examination and documentation will save time and trouble down the road
Tim Huber, MD
US Navy, Camp Pendleton, Calif
Warning flags for malingering include persistent noncompliance during prescribed evaluation or treatment, striking inconsistency between physical findings and stated symptoms, and an attorney or insurance company referring the patient to you. If monetary compensation is involved, malingering can potentially be prosecuted as fraud.
Meticulous examination and documentation will save you time and trouble down the road. If you find evidence of malingering, confronting the patient directly will likely result in animosity towards you from the patient and may result in litigation. The confrontation may escalate into violent behavior. Further complicating matters, specialist referral often reinforces the malingering behavior. A common option at approaching the potentially malingering patient is to allow him or her the opportunity to save face: “Well, Mr. Q, I am not finding the usual signs that go along with the complaints you are having….”
If you are in doubt of a diagnosis of malingering, it is generally safest to assume a person is not malingering until you specifically witness a contradictory event.
Evidence summary
The 4th edition of the Diagnostic and Statistical Manual of Mental Disorders (DSM-IV) defines malingering as “the intentional production of false or grossly exaggerated physical or psychological symptoms motivated by external incentives such as avoiding military duty, avoiding work, obtaining financial compensation, evading criminal prosecution, or obtaining drugs.”1 Malingering is not considered a mental disorder because symptoms are intentionally produced for external incentives.
No physical exam maneuver can determine a patient's external incentives. Traditionally, a physician uses certain exam techniques to determine if symptoms are of functional, or nonorganic, origin. Both terms denote the absence of a structural or physiological source for the phenomena, and include malingering and mental disorders such as factitious disorder, conversion disorder, and somatoform disorders. Our literature search only found studies concerning the detection of nonorganic causes of back pain, paralysis, and sensory loss.
Several exam tests are commonly thought to detect nonorganic causes of low back pain. Gordon Waddell described 8 signs in 5 categories (TABLE 2) used to “identify [back pain] patients who require more detailed psychological assessment.”2 A systematic review critiqued 60 studies of Waddell’s signs published between 1980 and 2000.3 The authors performed a thorough database search, including hand searches of key pain journals, meeting abstracts, and textbooks. The majority of the reviewed studies were small and of lower quality. The review found little evidence on test-retest or interrater reliability. There was consistent evidence that Waddell’s signs are associated with poorer treatment outcomes and generally consistent evidence that they are not associated with secondary gain and cannot discriminate organic from nonorganic problems.
A small, diagnostic case-control study of Mankopf’s test, which is based on the theory that pain increases heart rate, investigated 20 chronic low back pain patients considered nonorganic vs 20 pain-free controls using mechanical pain stimulus applied to subjects’ fingers.4 There was no significant difference in heart rate response between groups, and no significant effect of pain on heart rate in either group. The authors did not define their criteria for determining patients’ back pain as non-organic, nor did they include patients with low back pain caused by an identifiable pathology. There was no mention of blinding. This literature search found no published studies of McBride’s test, where the patient’s refusal to stand on the unaffected leg and flex the affected leg to the chest determines a feigned radiculopathy.
A few tests attempt to detect nonorganic causes of paralysis. In Hoover’s test, a patient is asked to alternately press down with the paralyzed leg and raise the unaffected leg to resistance, while the hand of the examiner cups the heel of the affected leg.5 A small, diagnostic case-control study using a computer-assisted strain gauge to measure movement effort during Hoover’s test involved 7 women with true paresis, 9 with nonorganic paresis, and 10 controls.6 The investigators diagnosed nonorganic paresis by history, neurological exam, and lack of positive neuroradiologic findings. The authors calculated a maximal involuntary to voluntary ratio for each patient’s extremities. The calculation discriminated between all 9 nonorganic patients and both the normal controls and patients with true paresis. The authors did not mention blinding in the study. No attempt was made to compare the strain gauge measurements with a clinician-performed Hoover’s test.
The Abductor sign, based on a similar theory that thigh abductors work in concert, was developed and studied by one individual.7 In this diagnostic case-control study, the single author tested 33 patients from his practice, 17 with organic paresis, and 16 with nonorganic paresis. The author differentiated organic from nonorganic paresis by history, physical exam, and various imaging studies with no independent assessment. He reported his test as 100% accurate. We did not find any published studies of the Arm Drop test, where feigned paralysis of an upper extremity is tested by holding the arm over the face of the supine patient and letting go.
The Midline Split test attempts to detect nonorganic causes of sensory loss. The fact that cutaneous nerves cross the midline is the basis for the idea that a sharp midline split denotes nonorganic sensory loss. In 1 diagnostic cohort study of 100 people presenting to a neurology department with complaints of decreased sensation on one side of the face, 80 patients were determined to have organic deficits such as multiple sclerosis or stroke. The author did not describe how these diseases were diagnosed. Of those with organic deficits, 7.5% showed midline splitting of sensory loss, falsely suggesting a nonorganic process. Only 20% of the patients with nonorganic sensory loss showed the expected midline split.8 The author apparently performed the sensory exam without blinding or independent confirmation.
TABLE 1
Summary of tests for the detection of malingering
| TEST | SYMPTOMS | DESCRIPTION | EVIDENCE/OUTCOMES | SOR |
|---|---|---|---|---|
| McBride’s | Back pain with radicular symptoms | Stand on one leg. Flex symptomatic leg and raise to chest. Refusal or pain = nonorganic | No published studies | C (expert opinion) |
| Mankopf’s | Back pain | 1700 g pressure applied to the middle phalanx of the second finger of the nondominant hand. True pain should increase heart rate. | Did not correlate with organic pain | C (small inconclusive diagnostic case-control study) |
| Waddell’s | Back pain | Positive signs from 3 or more categories (TABLE 2) | Cannot discriminate organic from nonorganic | C (from SR) |
| Associated with poorer treatment outcomes | C (from SR) | |||
| Not associated with secondary gain | B (from SR) | |||
| Hoover’s | Leg paresis | Cup heels and have patient press down with paretic limb. Then have patient raise opposite limb. True paresis if no difference in downward pressure at heels | Indicates nonorganic paresis | C (extrapolated from small diagnostic case-control study using strain gauge) |
| Abductor | Leg paresis | Ask patient to abduct paretic leg to resistance. In true paresis, opposite leg should abduct. | Indicates nonorganic causes | C (small, lower-quality case-control study) |
| Arm Drop | Arm paresis | Hold paretic hand above face and drop it. If hand misses face, paresis is nonorganic | No published studies | C (expert opinion) |
| Midline Split | Sensory loss | Test facial sensation to pinprick. Nonorganic loss of sensation is delineated by the midline. | Very weakly indicates nonorganic cause | C (small diagnostic case-control study) |
| SOR, strength of recommendation (see page 722); SR, systematic review. | ||||
TABLE 2
Waddell’s signs
| CATEGORY | SIGNS |
|---|---|
| Tenderness | Superficial: light pinching causing pain = positive Nonanatomic: deep tenderness over a wide area = positive |
| Simulation | Axial loading: downward pressure on the head causing low back pain = positive Rotation: Examiner holds shoulders and hips in same plane and rotates patient. Pain = positive |
| Distraction | Straight leg raise causes pain when formally tested, but straightening the leg with hip flexed ninety degrees to check Babinski does not |
| Regional | Weakness: multiple muscles not enervated by the same root Sensation: glove and stocking loss of sensation. |
| Overreaction | Excessive show of emotion |
Recommendations from others
The DSM-IV recommends suspicion of malingering for patients who present with 2 or more of the following: medicolegal issues, disagreement between objective and subjective stress or disability, noncompliance with evaluation or treatment, or antisocial personality disorder.1
The American Medical Association published the Guides to the Evaluation of Permanent Impairment, which states, “Confirmation of malingering is extremely difficult and generally depends on intentional or inadvertent surveillance.”9
1. American Psychiatric Association. Diagnostic and Statistical Manual of Mental Disorders: DSM-IV, 4th ed. Washington, DC: American Psychiatric Association; 1994.
2. Waddell G, McCulloch JA, Kummel E, Venner RM. Nonorganic physical signs in low-back pain. Spine 1980;5:117-125.
3. Fishbain DA, Cole B, Cutler RB, Lewis J, Rosomoff HL, Rosomoff RS. A structured evidence-based review on the meaning of nonorganic physical signs: Waddell signs. Pain Med 2003;4:141-181.
4. Peters ML, Schmidt AJM. Psychophysiological responses to repeated acute pain stimulation in chronic low back pain patients. J Psychosom Res 1991;35:59-74.
5. Hoover CF. A new sign for the detection of malingering and functional paresis of the lower extremities. J Am Med Assoc 1908;51:746-747.
6. Ziv I, Djaldetti R, Zoldan Y, Avraham M, Melamed E. Diagnosis of “nonorganic” limb paresis by a novel objective motor assessment: the quantitative Hoover’s test. J Neurol 1998;245:797-802.
7. Sonoo M. Abductor sign: a reliable new sign to detect non-organic paresis of the lower limb. J Neurol Neurosurg Psychiatry 2004;75:121-125.
8. Rolak LA. Psychogenic sensory loss. J Nerv Ment Dis 1988;176:686-687.
9. Cocchiarella L, Andersson G. Guides to the Evaluation of Permanent Impairment. 5th ed. Chicago: AMA Press, 2001.
No examination technique objectively proves malingering (strength of recommendation [SOR]: C, expert opinion). Waddell’s signs are associated with poor treatment outcomes but cannot discriminate organic from nonorganic causes (SOR: B, systematic review of low-quality studies). Hoover’s and the Abductor sign indicate nonorganic paralysis (SOR: C, small, lower-quality case-control studies) (TABLE 1).
Meticulous examination and documentation will save time and trouble down the road
Tim Huber, MD
US Navy, Camp Pendleton, Calif
Warning flags for malingering include persistent noncompliance during prescribed evaluation or treatment, striking inconsistency between physical findings and stated symptoms, and an attorney or insurance company referring the patient to you. If monetary compensation is involved, malingering can potentially be prosecuted as fraud.
Meticulous examination and documentation will save you time and trouble down the road. If you find evidence of malingering, confronting the patient directly will likely result in animosity towards you from the patient and may result in litigation. The confrontation may escalate into violent behavior. Further complicating matters, specialist referral often reinforces the malingering behavior. A common option at approaching the potentially malingering patient is to allow him or her the opportunity to save face: “Well, Mr. Q, I am not finding the usual signs that go along with the complaints you are having….”
If you are in doubt of a diagnosis of malingering, it is generally safest to assume a person is not malingering until you specifically witness a contradictory event.
Evidence summary
The 4th edition of the Diagnostic and Statistical Manual of Mental Disorders (DSM-IV) defines malingering as “the intentional production of false or grossly exaggerated physical or psychological symptoms motivated by external incentives such as avoiding military duty, avoiding work, obtaining financial compensation, evading criminal prosecution, or obtaining drugs.”1 Malingering is not considered a mental disorder because symptoms are intentionally produced for external incentives.
No physical exam maneuver can determine a patient's external incentives. Traditionally, a physician uses certain exam techniques to determine if symptoms are of functional, or nonorganic, origin. Both terms denote the absence of a structural or physiological source for the phenomena, and include malingering and mental disorders such as factitious disorder, conversion disorder, and somatoform disorders. Our literature search only found studies concerning the detection of nonorganic causes of back pain, paralysis, and sensory loss.
Several exam tests are commonly thought to detect nonorganic causes of low back pain. Gordon Waddell described 8 signs in 5 categories (TABLE 2) used to “identify [back pain] patients who require more detailed psychological assessment.”2 A systematic review critiqued 60 studies of Waddell’s signs published between 1980 and 2000.3 The authors performed a thorough database search, including hand searches of key pain journals, meeting abstracts, and textbooks. The majority of the reviewed studies were small and of lower quality. The review found little evidence on test-retest or interrater reliability. There was consistent evidence that Waddell’s signs are associated with poorer treatment outcomes and generally consistent evidence that they are not associated with secondary gain and cannot discriminate organic from nonorganic problems.
A small, diagnostic case-control study of Mankopf’s test, which is based on the theory that pain increases heart rate, investigated 20 chronic low back pain patients considered nonorganic vs 20 pain-free controls using mechanical pain stimulus applied to subjects’ fingers.4 There was no significant difference in heart rate response between groups, and no significant effect of pain on heart rate in either group. The authors did not define their criteria for determining patients’ back pain as non-organic, nor did they include patients with low back pain caused by an identifiable pathology. There was no mention of blinding. This literature search found no published studies of McBride’s test, where the patient’s refusal to stand on the unaffected leg and flex the affected leg to the chest determines a feigned radiculopathy.
A few tests attempt to detect nonorganic causes of paralysis. In Hoover’s test, a patient is asked to alternately press down with the paralyzed leg and raise the unaffected leg to resistance, while the hand of the examiner cups the heel of the affected leg.5 A small, diagnostic case-control study using a computer-assisted strain gauge to measure movement effort during Hoover’s test involved 7 women with true paresis, 9 with nonorganic paresis, and 10 controls.6 The investigators diagnosed nonorganic paresis by history, neurological exam, and lack of positive neuroradiologic findings. The authors calculated a maximal involuntary to voluntary ratio for each patient’s extremities. The calculation discriminated between all 9 nonorganic patients and both the normal controls and patients with true paresis. The authors did not mention blinding in the study. No attempt was made to compare the strain gauge measurements with a clinician-performed Hoover’s test.
The Abductor sign, based on a similar theory that thigh abductors work in concert, was developed and studied by one individual.7 In this diagnostic case-control study, the single author tested 33 patients from his practice, 17 with organic paresis, and 16 with nonorganic paresis. The author differentiated organic from nonorganic paresis by history, physical exam, and various imaging studies with no independent assessment. He reported his test as 100% accurate. We did not find any published studies of the Arm Drop test, where feigned paralysis of an upper extremity is tested by holding the arm over the face of the supine patient and letting go.
The Midline Split test attempts to detect nonorganic causes of sensory loss. The fact that cutaneous nerves cross the midline is the basis for the idea that a sharp midline split denotes nonorganic sensory loss. In 1 diagnostic cohort study of 100 people presenting to a neurology department with complaints of decreased sensation on one side of the face, 80 patients were determined to have organic deficits such as multiple sclerosis or stroke. The author did not describe how these diseases were diagnosed. Of those with organic deficits, 7.5% showed midline splitting of sensory loss, falsely suggesting a nonorganic process. Only 20% of the patients with nonorganic sensory loss showed the expected midline split.8 The author apparently performed the sensory exam without blinding or independent confirmation.
TABLE 1
Summary of tests for the detection of malingering
| TEST | SYMPTOMS | DESCRIPTION | EVIDENCE/OUTCOMES | SOR |
|---|---|---|---|---|
| McBride’s | Back pain with radicular symptoms | Stand on one leg. Flex symptomatic leg and raise to chest. Refusal or pain = nonorganic | No published studies | C (expert opinion) |
| Mankopf’s | Back pain | 1700 g pressure applied to the middle phalanx of the second finger of the nondominant hand. True pain should increase heart rate. | Did not correlate with organic pain | C (small inconclusive diagnostic case-control study) |
| Waddell’s | Back pain | Positive signs from 3 or more categories (TABLE 2) | Cannot discriminate organic from nonorganic | C (from SR) |
| Associated with poorer treatment outcomes | C (from SR) | |||
| Not associated with secondary gain | B (from SR) | |||
| Hoover’s | Leg paresis | Cup heels and have patient press down with paretic limb. Then have patient raise opposite limb. True paresis if no difference in downward pressure at heels | Indicates nonorganic paresis | C (extrapolated from small diagnostic case-control study using strain gauge) |
| Abductor | Leg paresis | Ask patient to abduct paretic leg to resistance. In true paresis, opposite leg should abduct. | Indicates nonorganic causes | C (small, lower-quality case-control study) |
| Arm Drop | Arm paresis | Hold paretic hand above face and drop it. If hand misses face, paresis is nonorganic | No published studies | C (expert opinion) |
| Midline Split | Sensory loss | Test facial sensation to pinprick. Nonorganic loss of sensation is delineated by the midline. | Very weakly indicates nonorganic cause | C (small diagnostic case-control study) |
| SOR, strength of recommendation (see page 722); SR, systematic review. | ||||
TABLE 2
Waddell’s signs
| CATEGORY | SIGNS |
|---|---|
| Tenderness | Superficial: light pinching causing pain = positive Nonanatomic: deep tenderness over a wide area = positive |
| Simulation | Axial loading: downward pressure on the head causing low back pain = positive Rotation: Examiner holds shoulders and hips in same plane and rotates patient. Pain = positive |
| Distraction | Straight leg raise causes pain when formally tested, but straightening the leg with hip flexed ninety degrees to check Babinski does not |
| Regional | Weakness: multiple muscles not enervated by the same root Sensation: glove and stocking loss of sensation. |
| Overreaction | Excessive show of emotion |
Recommendations from others
The DSM-IV recommends suspicion of malingering for patients who present with 2 or more of the following: medicolegal issues, disagreement between objective and subjective stress or disability, noncompliance with evaluation or treatment, or antisocial personality disorder.1
The American Medical Association published the Guides to the Evaluation of Permanent Impairment, which states, “Confirmation of malingering is extremely difficult and generally depends on intentional or inadvertent surveillance.”9
1. American Psychiatric Association. Diagnostic and Statistical Manual of Mental Disorders: DSM-IV, 4th ed. Washington, DC: American Psychiatric Association; 1994.
2. Waddell G, McCulloch JA, Kummel E, Venner RM. Nonorganic physical signs in low-back pain. Spine 1980;5:117-125.
3. Fishbain DA, Cole B, Cutler RB, Lewis J, Rosomoff HL, Rosomoff RS. A structured evidence-based review on the meaning of nonorganic physical signs: Waddell signs. Pain Med 2003;4:141-181.
4. Peters ML, Schmidt AJM. Psychophysiological responses to repeated acute pain stimulation in chronic low back pain patients. J Psychosom Res 1991;35:59-74.
5. Hoover CF. A new sign for the detection of malingering and functional paresis of the lower extremities. J Am Med Assoc 1908;51:746-747.
6. Ziv I, Djaldetti R, Zoldan Y, Avraham M, Melamed E. Diagnosis of “nonorganic” limb paresis by a novel objective motor assessment: the quantitative Hoover’s test. J Neurol 1998;245:797-802.
7. Sonoo M. Abductor sign: a reliable new sign to detect non-organic paresis of the lower limb. J Neurol Neurosurg Psychiatry 2004;75:121-125.
8. Rolak LA. Psychogenic sensory loss. J Nerv Ment Dis 1988;176:686-687.
9. Cocchiarella L, Andersson G. Guides to the Evaluation of Permanent Impairment. 5th ed. Chicago: AMA Press, 2001.
Evidence-based answers from the Family Physicians Inquiries Network